Article

Identification of Two New Hydrothermal Fields and Sulfide Deposits on the Mid-Atlantic Ridge as a Result of the Combined Use of Exploration Methods: Methane Detection, Water Column Chemistry, Ore Sample Analysis, and Camera Surveys

1
Department of Hydrogeology and Engineering Geology, St. Petersburg Mining University, 199106 St Petersburg, Russia
2
Department of Geology and Mineral Resources of the World Ocean, VNIIOkeangeologia Institute, 190121 St. Petersburg, Russia
3
Polar Marine Geosurvey Expedition, 198412 Lomonosov, Russia
*
Author to whom correspondence should be addressed.
Minerals 2021, 11(7), 726; https://doi.org/10.3390/min11070726
Submission received: 12 May 2021 / Revised: 30 June 2021 / Accepted: 1 July 2021 / Published: 5 July 2021

Abstract

:
In 2018–2020 the research vessel (R/V) Professor Logachev (cruises 39 and 41) carried out geological and geochemical studies in the bottom waters of the Mid-Atlantic Ridge hydrothermal fields at 14°45’ N, 13°07’ N, and 13°09’ N. Two new hydrothermal fields were discovered—the Molodezhnoye and Koralovoye. Standard conductivity, temperature, and depth (CTD) sounding with a methane sensor was accompanied by video surveillance and sampling of rocks and water. The rocks were characterized by a zonal composition with opal and sulfides of copper and zinc. An increase in methane concentration values was accompanied by CTD anomalies in the bottom waters. The methane anomaly was formed within the hydrothermal plume of both high-temperature and low-temperature systems. Methane was almost absent in the plume of neutral buoyancy and was associated in all the studied manifestations with the ascending flow of hot waters over the hydrothermal vents. The hydrothermal plumes were characterized by increased Cu, Zn, and Fe concentrations at background Mn concentrations. Signs of low-temperature hydrothermal activity were also observed. Different sources and mechanisms are required to explain the elevated concentrations of base metals and methane in the hydrothermal plumes.

1. Introduction

Since the end of the 1970s, numerous studies have been carried out on polymetallic sulfides and metalliferous sediments across the ocean floor. As a result, more than 500 hydrothermal fields have been discovered globally [1,2], and research has begun on the feasibility of developing ocean mineral resources [3].
The known manifestations of active hydrothermal discharge on the ocean floor belong to rift zones associated with mid-oceanic ridges and island arc systems, at divergent and convergent boundaries, respectively, and to a lesser extent, areas of intraplate volcanism. Hydrothermal systems, located at great depths (ranging from tens to thousands of meters), are challenging to detect. However, new opportunities for detecting deep-sea hydrothermal activity are emerging with the use of methane sensors in the process of sounding the water column.
In the 39th (2018) and 41st (2020) cruises of the R/V Professor Logachev, new data on the formation of methane anomalies in areas of submarine hydrothermal activity on the Mid-Atlantic Ridge were obtained. Instrumental CTD and geochemical observations were carried out in the bottom waters of the Logachev field at 14°45’ N (cruise 39 of the R/V Professor Logachev). The Koralovoe (~2800–2900 m) and Molodezhnoe (~3500 m) hydrothermal fields, at 13°07’ N and 13°09’ N, respectively, were discovered on the MAR (Mid-Atlantic Ridge) during the 41st cruise of the R/V Professor Logachev. Standard CTD sounding was accompanied by the measurement of methane concentrations with a Franatech METS methane sensor (with a methane calibration range of 1 nM–500 nM) to study in detail hydrothermal plumes near high-temperature sources. New data were obtained on the CTD structure of hydrothermal plumes and methane anomalies.

2. Methane in Submarine Hydrothermal Solutions

The elements of the hydrothermal plume can be divided into conservative and non-conservative. Conservative elements (for example, 3He) change their concentration in the plume exclusively due to dissolution. At the same time, non-conservative elements (including CH4) can also change their concentration in the plume due to precipitation or transformation during various chemical and biochemical reactions (for example, microbial oxidation, etc.) [4]. As a result, their residence time in the plume can vary significantly. For CH4, this period can range from several days to months [5]. The distance from the source within which methane anomalies can be detected can reach 10–15 km [6,7].
The background concentrations of methane in seawater average about 0.0003 mmol/kg [8]. However, within zones of modern hydrothermal activity, these values can increase by more than four orders of magnitude. Two main groups of hydrothermal fields (based on the composition of the host rocks) can be distinguished—those associated with basalts (often represented by axial-type systems) [9] and with widely serpentinized ultramafic rocks (edge type) [8,10,11].
For basalt hosted systems, the methane content range is over a wide interval. This is due to the confinement of fields to two different types of basalts. N-type MORBs are characterized by an insignificant methane content within hydrothermal fields—about 120 µmol/kg (from 62 to 147 µmol/kg) [8,12,13,14,15,16,17]. E-type MORBs are characterized by higher methane concentrations ranging from 0.5 to 1.35 mmol/kg [8,10,18,19,20].
High methane concentrations characterize hydrothermal fields associated with serpentinized ultramafic rocks. The content of dissolved methane within such systems can reach 2.6 mmol/kg [21]. This is due to mafic silicate minerals (especially olivine and orthopyroxene) which are subjected to serpentinization. The most widespread theory on the appearance of methane in hydrothermal solutions is based on the concept of the abiotic nature of methane anomalies. Thus, the appearance of methane is explained by the serpentinization of ultrabasic rocks by the hydrothermal fluid [22]. In this process, oxidation of ferrous Fe (FeII) from the reactant minerals to ferric Fe (FeIII) in the products is coupled with the reduction of water to produce H2 [23]. The reaction of the H2 with dissolved inorganic carbon can then lead to the formation of CH4.
Serpentinite-hosted hydrothermal systems are thought to be ideal places for abiotic organic synthesis, which consists of the catalytic hydrogenation of dissolved inorganic carbon species. The di-hydrogen necessary for the aforementioned synthesis in hydrothermal conditions is mostly related to the anaerobic oxidation of ferrous iron by the protons of water. In the case of serpentinization, the ferric iron is in the fayalite and ferrosilite end-members of the olivine and orthopyroxene, respectively, whereas the Mg-end members (forsterite and enstatite) give rise to serpentine minerals [24]. However, laboratory studies [23,25] have shown that, although such a system can exist, it does not yield methane concentrations comparable to those found in natural conditions.
According to the theory of abiotic methane synthesis, ocean water entering the upper mantle or lower oceanic crust is retained in the olivine as secondary fluid inclusions at temperatures above 400 °C. When temperatures drop below 340 °C, the serpentinization of the olivine lining the walls of the liquid inclusions leads to an almost quantitative consumption of the captured liquid H2O. The formation of molecular H2 through precipitation of daughter minerals rich in Fe (III) leads to the creation of conditions conducive to reducing inorganic carbon and the formation of CH4. Once formed, CH4(g) and H2 (g) can be stored for a geological period until extracted by dissolving or breaking up the olivine host [26]. Succinctly, such a hypothesis can be described as “crack and seal”. This hypothesis was put forward by several microscopic studies of deep rocks obtained within the Southeast Indian Ridge [27,28] and within the Mid-Cayman Rise [25,29].
However, under the conditions of the Guaymas Basin (Gulf of California), the concentration of methane reaches 16 mmol/kg [30], while within the hydrothermal fields of MOR, confined to basalts and ultrabasic rocks, concentrations are about 120 μmol/kg and 2.5 mmol/kg, respectively [17,19]. The conditions of this basin are characterized by the simultaneous presence of an active hydrothermal system and a thick layer of sediments overlying igneous and metamorphic rocks. As a result, high-temperature hydrothermal fluid circulates through the sediment column. Under such conditions, the thermal decomposition of organic matter occurs, resulting in thermogenic methane and other hydrocarbons. During the subsequent oxidation of hydrocarbons by various microorganisms in the upper layers of the sedimentary layer, the introduction of the biogenic component of methane is also possible [30].
On the other hand, it was shown that within the limits of low-temperature hydrothermal fields (up to 122 °C) [31], the formation of methane is possible through the activity of organisms [21,32,33,34]. These are representatives of methanogenic microorganisms that produce methane from CO2 and H2 [35,36,37,38].
None of the presented theories gives a complete picture of the processes taking place deep in the oceanic crust and leading to the appearance of methane in the bottom part of the ocean. Instead, we may discuss a set of processes leading to the appearance of methane under different initial conditions [17,39]. However, the combination of these processes can vary.

3. Materials and Methods

A variety of techniques were used to characterize the hydrothermal systems along the MAR: CTD sounding, the use of a methane sensor and nephelometry, bottom side-scan sonar use, electrical exploration works (the natural electrical field method), television profiling, and geological sampling with a box sampler and a rock dredge. The detection ranges of the sensors used in the cruise are shown in Table 1.
Previously, increased concentrations of methane were obtained by analyzing samples of fluids circulating through the hydrothermal system. At the same time, such studies were carried out in on-board or stationary laboratories [40,41,42].
In our work, an increased methane content (relative to background concentrations) was recorded directly in the hydrothermal plume as part of sounding at point stations using the methane sensor. Carrying out such complex observations in situ with the simultaneous measurement of several water column parameters allows us to obtain a more complete picture of the nature of the formation of both hydrothermal plumes and dissolved methane anomalies.
CTD sounding was carried out by the SBE 911 plus probe at point stations from the ocean surface to the bottom and back, with a discreteness of 24 measurements per second to identify anomalous structures of ocean waters associated with modern hydrothermal activity and geoecological monitoring [43]. The coordinates of the hydrological sounding complex were determined using the low-frequency ultra-deep water positioning system Kongsberg HiPAP 101. The Kongsberg CNode Mini transponder was attached to the frame of the sounding complex. In the process of sounding, water samples were taken for chemical analysis.
The analysis of geochemical samples was carried out in the laboratory of VNIIOkeangeologiya (St. Petersburg) using flame atomic absorption spectrophotometry (JSC "Aquilon", Podolsk, Russia) (for micro-components). The chemical analysis of macro components was carried out using the titrimetric method (for Ca, Mg, CO3, and HCO3), argentometric method (for Cl), potentiometric method (for pH), gravimetric method (for SO4), and flame emission spectrometry (for K and Na).
Correlation and regression analyses were used to determine the relationship between the obtained parameters based on hydrophysical sounding and chemical analysis.
The small amount of sampling resulted insufficient for the statistical analysis of the data. Therefore, for comparison with the results of previous studies, we used the data of the analysis of 180 samples taken during the mass sampling of bottom waters in other hydrothermal fields of the MAR [44,45,46]. Elevated, high, and anomalous concentrations of dissolved and suspended trace elements were determined by an excess by 1, 2, and 3 standard deviations, respectively (Table 2).
Calculation Formulas (1)–(3) (Me is the calculation element):
M ˜ e ·   ε 3     Anomalous   value
M ˜ e ·   ε 2   High   value   < M ˜ n ·   ε 3
M ˜ e ·   ε     Elevated   value   < M ˜ n ·   ε 2
where M ˜ e is the geometric mean and ε is the standard factor (the anti-logarithm of the standard deviation).

4. Results and Discussion

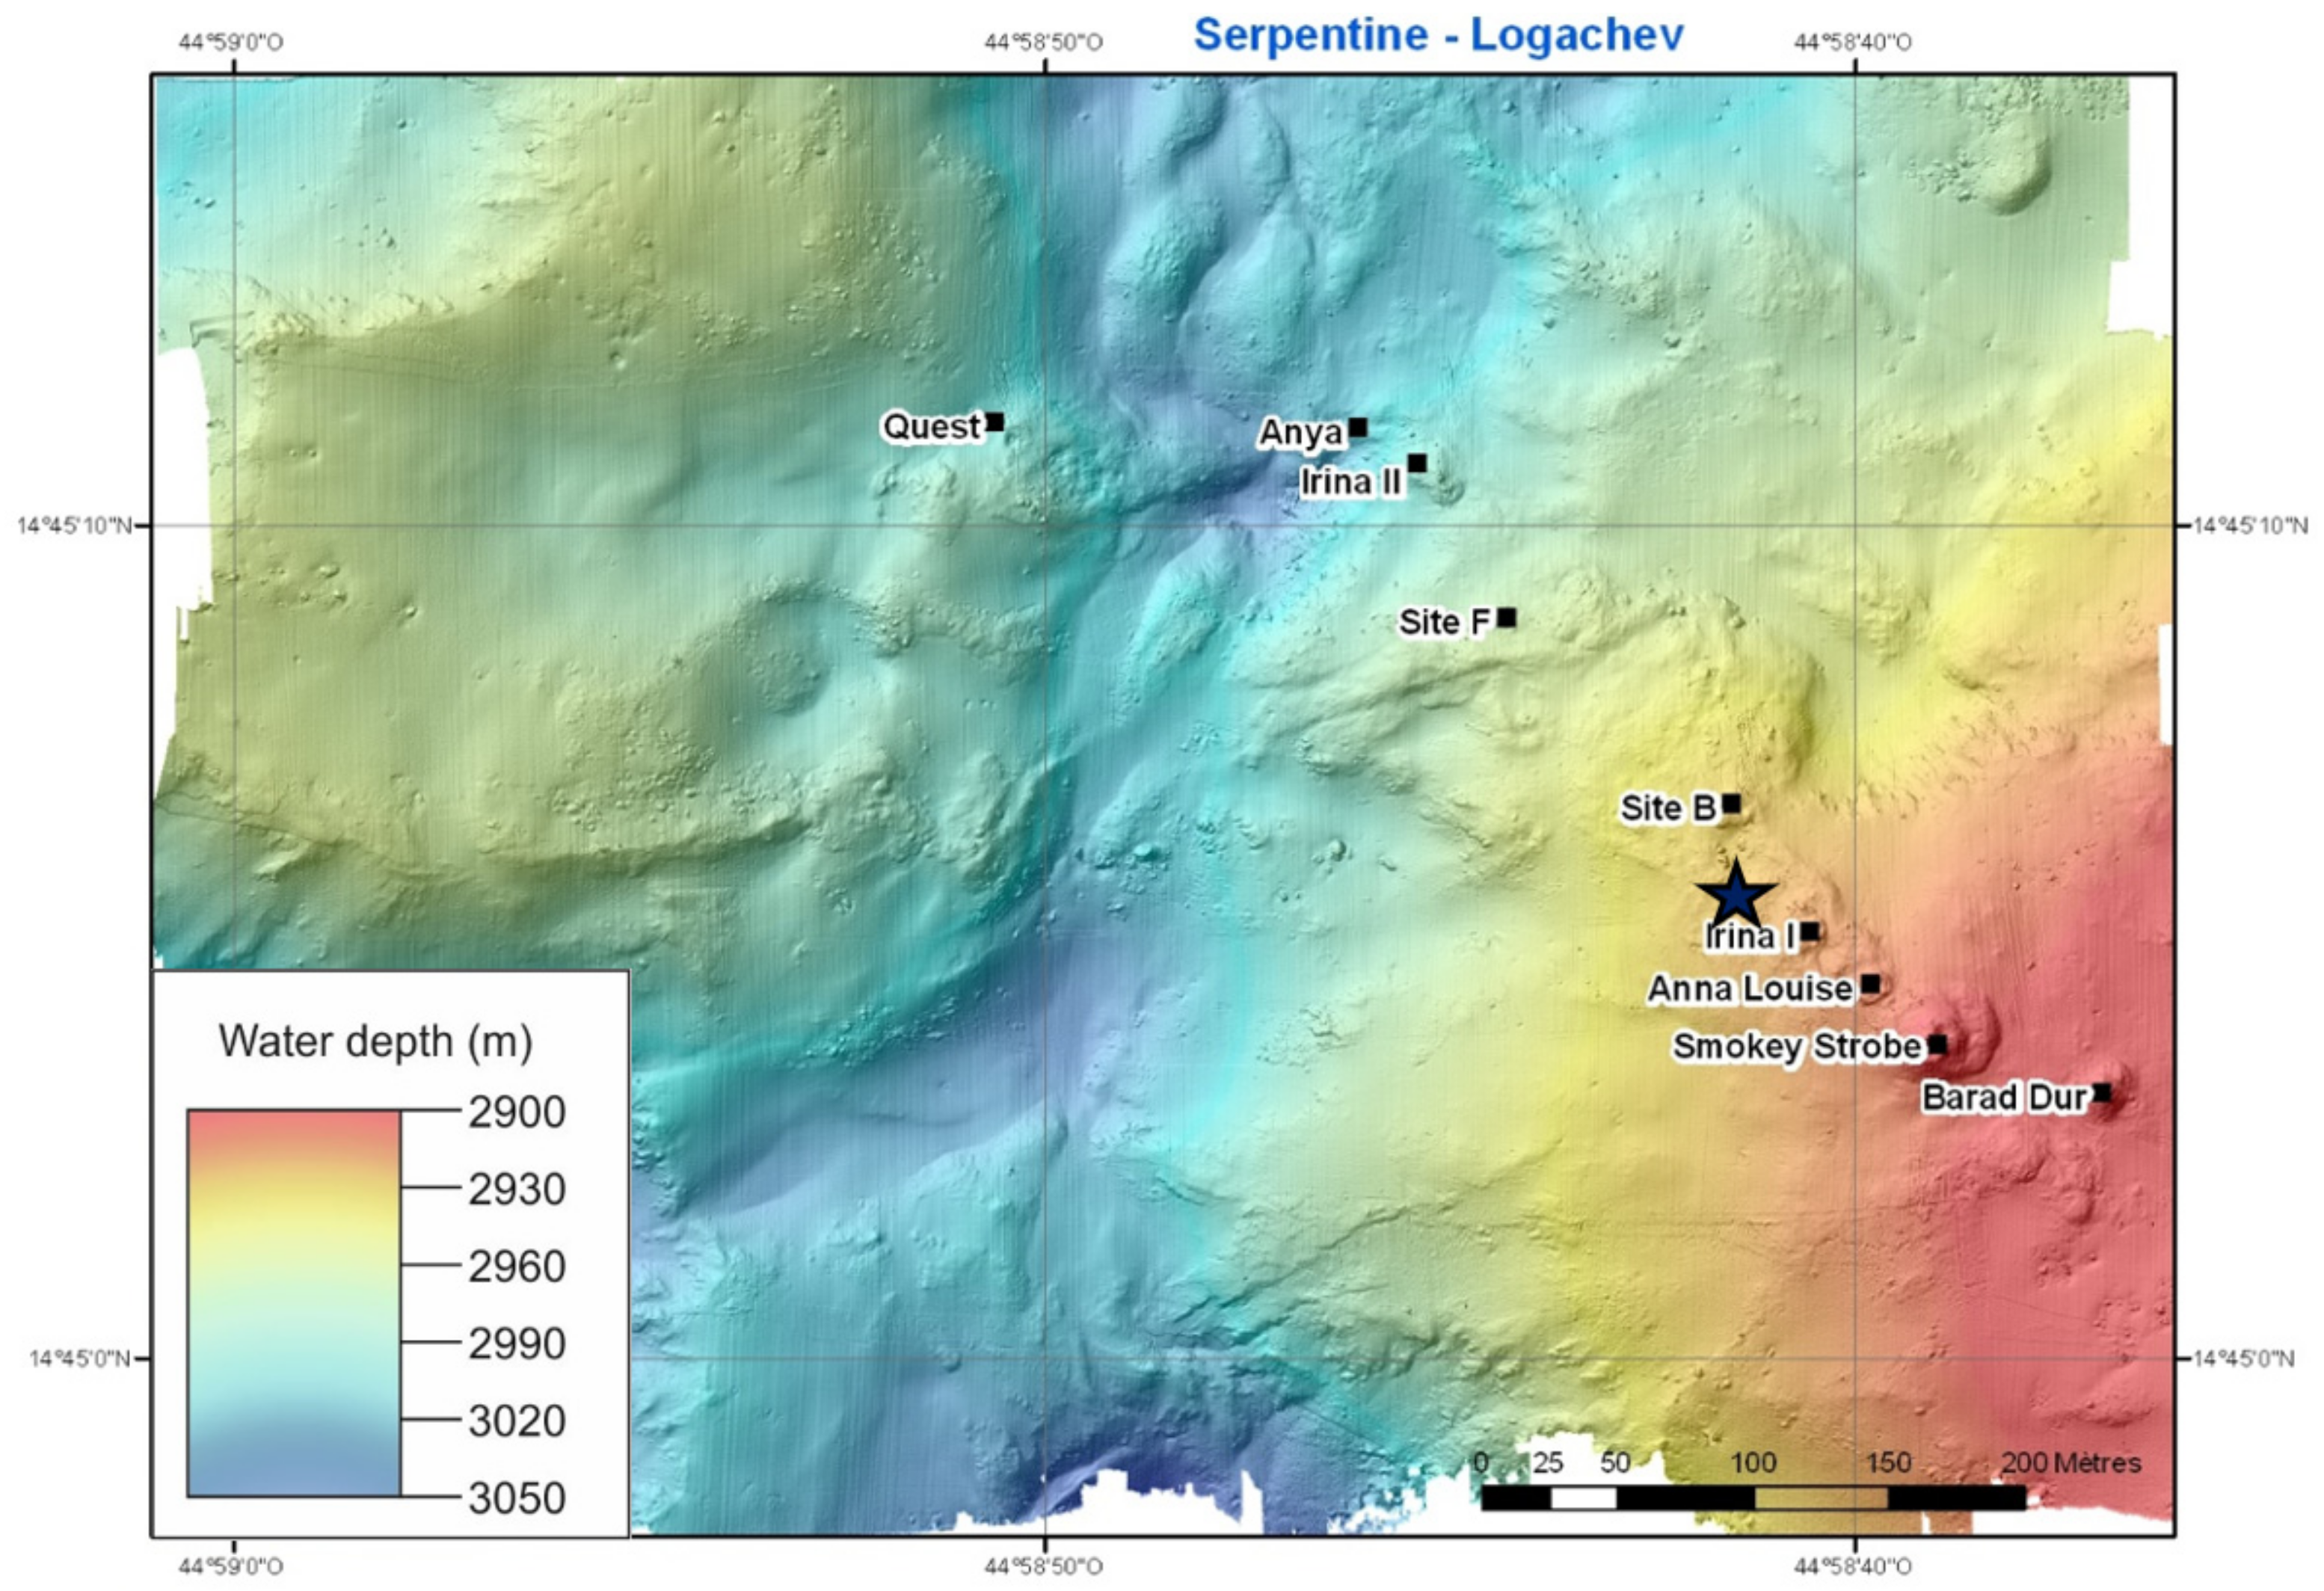
4.1. The Logachev Hydrothermal Field (14°45’ N)

During the 39th cruise of the R/V Professor Logachev, data were obtained on the formation of methane anomalies in the zone of discharge of hydrothermal solutions. The observations were carried out in the near-bottom waters near the Irina 1 spring located on the eastern side of the MAR rift valley (Figure 1).
The host rocks are of ultrabasic composition, and are overlain by foraminiferal sediments [44,47,48]. The methane sensor used made it possible to record methane anomalies not in solutions circulating through hydrothermal systems, but in hydrothermal plumes.
Earlier, detailed measurements as well as photo and video surveillance in the SERPENTINE expedition on the R/V Pourquoi pas? [8] from the remotely controlled multifunctional apparatus ROV Victor 6000 (Ifremer, Plouzané, France) showed that the Irina 1 source is a combination of a “smoking” crater and short pipes of black smokers that are 0.2–1.0 m high surrounding the crater (Figure 2). The temperature of the hydrothermal solution measured in situ in the vents of smokers was 190–350 °C.
The formation of a plume of neutral buoyancy is observed at a depth of 2700–2800 m. The plume is characterized by increased turbidity and a decrease in temperature and salinity. This combination is a standard version of the so-called “Atlantic” model of hydrothermal plume formation [49,50]. In the deep Atlantic, temperature and salinity decrease with depth. Through entrainment during plume rise, the neutrally buoyant plume acquires a lower temperature and salinity than the surrounding water. When density equilibrium is finally achieved in the Atlantic, the neutrally buoyant plume is stabilized at a lower temperature and salinity than in the surrounding water [50].
Increased methane concentrations were observed in the bottom strata at the depth interval of 2840–2930 m (Figure 3). There are sharp fluctuations in turbidity, temperature, salinity, and density on the CTD plots of sounding at this depth interval. This indicates the confinement of the methane anomaly to the ascending turbulent plume, with a distinctly uneven, pulsating character of the discharging fluid (due to phase differentiation) [51,52,53,54].
Almost no methane anomaly is observed in the neutral plume. Only a slight increase in concentration can be noted, confined to the lower part of the turbidity anomaly. Its maximum concentration (0.019 μmol/L) is confined to 2910–2900 m. With further ascent up the section, its concentration decreases from 2900 to 2774 m to 0.0022 μmol/L. This is due to the high scattering rate of methane as it rises from the source.
Detailed plots of the distribution of CTD parameters for an ascending hydrothermal plume show three separate layers of CTD anomalies, reflecting the discrete nature of the hydrothermal discharge (Figure 4).
Correlation and regression analyses were carried out to identify the nature of the relationship between CTD parameters. The results of the correlation analysis for the three selected layers are shown in Table 3.
For example, Figure 5 and Figure 6 show the regression plots of salinity/temperature and turbidity/salinity for the anomalous upper layer. The analysis performed indicates a pronounced positive relationship between turbidity and temperature for three anomalous horizons of the ascending hydrothermal plume. This reflects the high-temperature nature of the discharge. The negative relationship between temperature and turbidity, on the one hand, and salinity, on the other, indicates the possible involvement of the cold, relatively low salinity waters of the rift valley into the ascending flow [45,46,50].

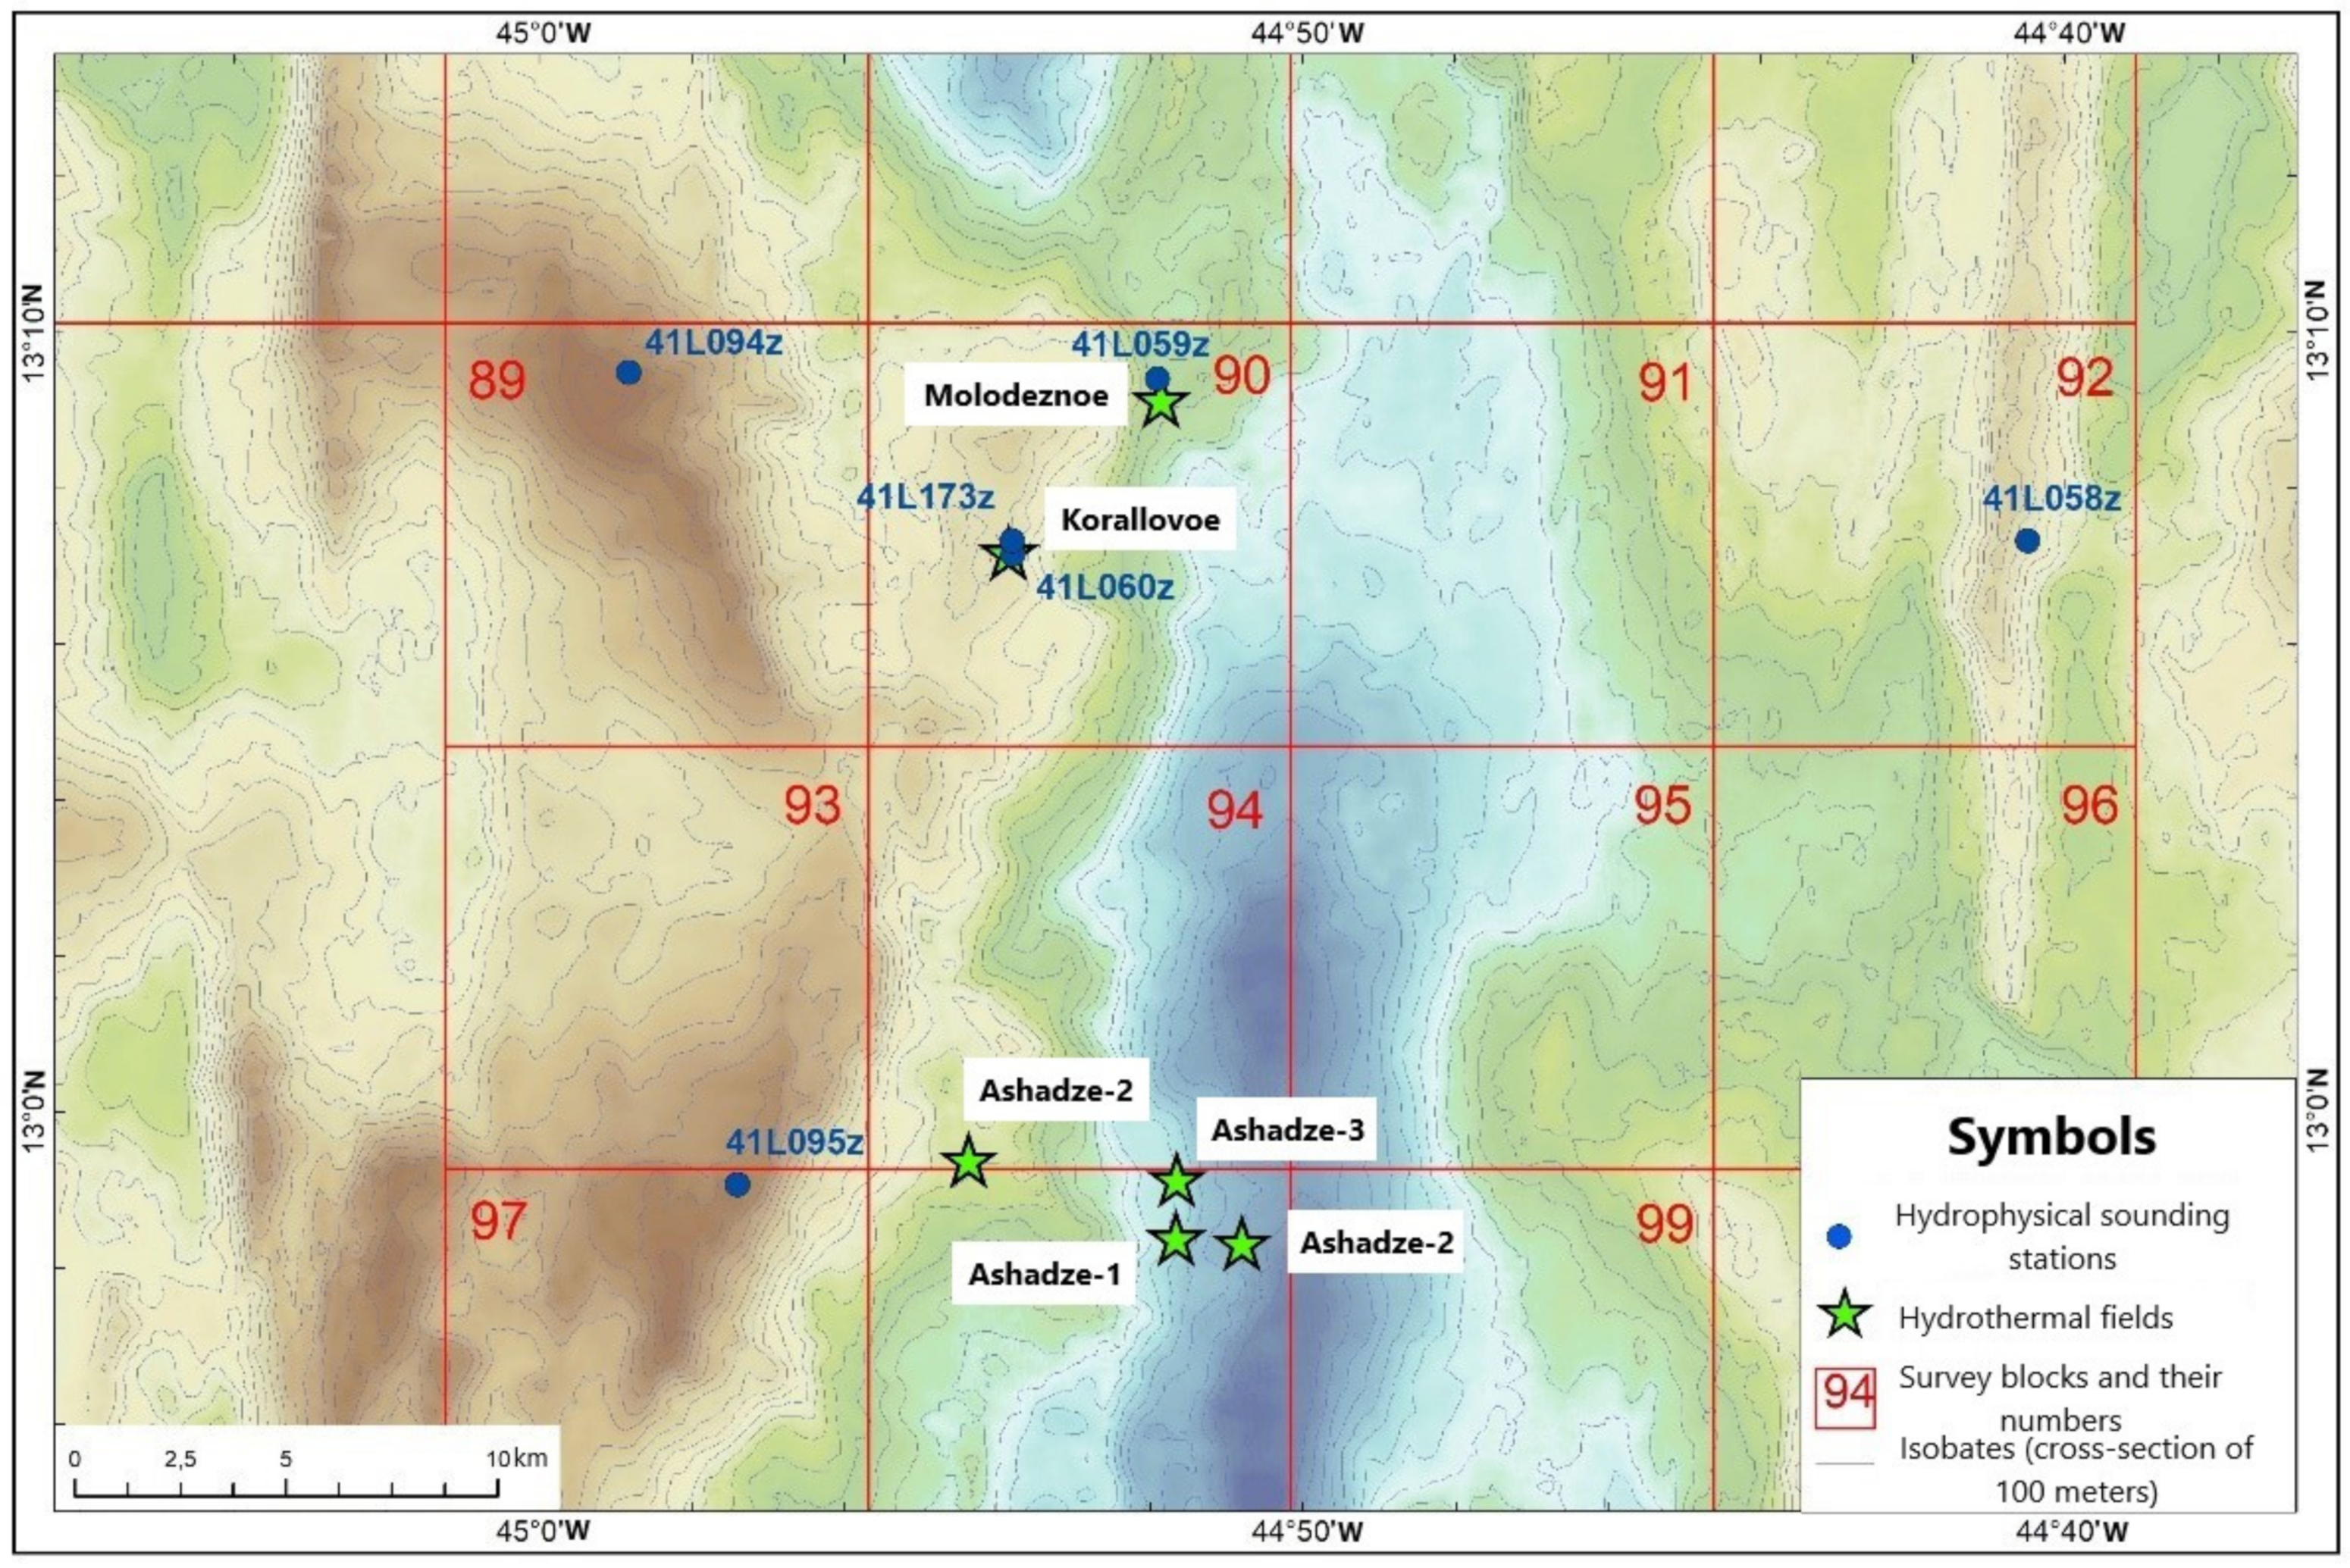
4.2. The Molodezhnoe (13°09’ N 44°52’ W) and Koralovoe (13°07’ N 44°54’ W) Hydrothermal Fields

During cruise 41 of the R/V Professor Logachev, two new hydrothermal fields were discovered and studied—the Koralovoe and Molodezhnoe. The hydrothermal fields are of a marginal (flank) type, located on the gentle western side of the rift valley (Figure 7).
The Ashadze-2 hydrothermal field is located to the south of the work area, within the same oceanic core complex [55,56,57]. The rocks that make up this complex were repeatedly studied earlier during the cruises of the R/V Professor Logachev. They are serpentinized peridotites and gabbros.
Video surveillance in the Molodezhnoe hydrothermal field revealed complexes of sulfide ores, represented mainly by inactive smokers (Figure 8).
The chimney structures of the Molodezhnoye field are distinctly zoned. These include an outer opal–sulfide zone and an inner chalcopyrite-bornite zone. The channels are often inlaid with opal and are usually not clogged (Figure 9). Chalcopyrite in the inner zones forms rather large crystals (up to 2 mm), and sometimes forms aggregates. Nests of fine-grained sphalerite are observed. The amount of bornite gradually increases towards the outer zone. The outer part is represented by opal-sulfide aggregates dominated by chalcopyrite and bornite. Opal overgrows crystals of sulfides. Vein-disseminated ores of the Molodezhnoye field are represented by nested and vein pyrite mineralization in calcified serpentinites.
Observations during video surveillance revealed transparent “flickering” solutions formed during diffuse diffusion unloading of hydrothermal solutions. When analyzing the obtained CTD section, it is noted that a decrease in temperature and salinity begins from a depth of about 3520 m, indicating the presence of the cold freshened waters of the rift valley here. According to the results of CTD sounding, a turbidity anomaly, weak negative temperatures, salinity anomalies, and a distinct positive density anomaly were observed in the bottom layer at the depth interval of ~3300–3450 m (Figure 10).
These observations suggest hydrothermal activity within the Molodezhnoe hydrothermal field and the formation of a plume of neutral buoyancy at this horizon. In addition, a weak but distinct methane anomaly was recorded. The maximum methane concentrations were observed below the turbidity anomaly, as in the Logachev field.
At the Korallovoe vent field, video surveillance revealed sulfide chimneys, black hydrothermal smoke, a hydrothermal fauna of crabs and mussels (Figure 11), and hydroxide–ferruginous crusts. Most of the collected samples of hydrothermal formations are vein-disseminated ores. Pipe fragments and hydrothermal crusts are rare.
A meridional fault was revealed within the field, with a depth of about 30 m with steeply dipping, almost vertical sides. Outcrops of hydrothermal formations and metalliferous sediments were observed in the walls of the fault.
Sedimentary rocks were sampled 300 m northwest of the field. They are represented by foraminiferal ooze among the clastic material of bedrocks. Sulfide minerals in sedimentary rocks are represented by pyrite (both oxidized and unoxidized) with minor marcasite and pyrrhotite. Quartz and opal can indirectly be considered relative indicators of the temperature of hydrothermal activity. However, their distribution over the area is different and has a zonal character. Opal is mainly found near the field, and quartz on the periphery. This may indicate that a later (low-temperature) stage of hydrothermal activity exists within the study area [58].
Hydrothermal crusts raised in the field are represented by ferromanganese and ferro-copper–hydrochloride compositions. The crusts are mostly flattened, with an average size of 15 × 10 cm and a maximum of 35 × 20 cm (Figure 12).
The chimneys of the Koralovoye vent field differ in their zonal structure (Figure 13). The inner zone (from 3 mm to 5 cm) is composed of loose copper sulfides, sometimes impregnated with tiny crystals of chalcopyrite and sphalerite. The chalcopyrite-bornite zone is usually about 0.5–1 cm. In places, there is a thin black coating on chalcopyrite crystals (probably tenorite). One of the most massive zones of the structure is bornite with a blue tempering. The width of the bornite zone is usually 1–3 cm. In this zone, nests of fine-medium-grained chalcopyrite and opal smears are often observed.
The outer zone of the chimney structure is very dense, represented by sulfides (chalcopyrite and bornite with a small number of copper sulfides) and opal. Sulfide crystals are covered with an opal shell. The opal content increases towards the surface. In the outer part of the opal zone (last 5 mm), many pores are observed. The concentration of sulfides is sharply reduced. Globular or filamentary opal is observed inside the pores and cavities. In some samples, this zone is thin and barely reaches 0.5 mm, while in others, it reaches 4 cm.
The mineral composition of the vein-disseminated ores of the Koralovoye field is diverse. The chalcopyrite–bornite type represents the richest disseminated ores, sometimes with pyrrhotite. Pyrite mineralization is rare. The presence of opal and opal-carbonate hydrothermal structures was noted, and may indicate low-temperature hydrothermal activity. In addition, a chalcopyrite-sphalerite veinlet with smears of talc-chlorite rocks was observed. This is considered evidence of lower-temperature hydrothermal activity during the late stages of ore formation.
CTD sounding was carried out near the alleged source. At the bottom, from 2756 to 2803 m, numerous micro-inversions of temperature, salinity, and density were observed, reflecting the influence of an ascending flow of warm solutions. Unlike observations at the Logachev field, the temperature and salinity jumps were not accompanied by turbidity anomalies, which usually indicates the unloading of high-temperature solutions. The CTD plots show no signs of cold rift water inflow. At a depth of about 2550 m, the beginning of forming a plume of neutral buoyancy can be assumed based on the presence of negative temperature and salinity anomalies, positive density anomalies, and a slight increase in turbidity (Figure 14).
An apparent methane anomaly is confined to the micro inversions of CTD parameters in a thin bottom layer. The maximum concentration is 0.0167 μmol/L, which exceeds the values of the overlying stratum (0.0026 μmol/L) by about 10 times. All these facts indicate weak hydrothermal activity at present.
The second CTD sounding station at the Koralovoe hydrothermal field is located 350 m southeast of the previous one. The CTD plots show negative temperature and salinity anomalies at the same depth (2550 m) as at the first sounding station (Figure 15). A slight turbidity anomaly was recorded at a depth of 2640–2790 m, accompanied by a slight increase in temperature and salinity. In the lower part of this interval, increased methane concentrations were observed. The maximum methane concentrations at this station were four times less than at the previous one, indicating the scattering of methane during lateral drift under the influence of bottom currents.
Based on the results of CTD sounding at anomalous horizons, water samples were taken and analyzed (3 samples at the 41L173 sounding station in the interval of 2785–2787 m and 2 samples at the 41LP station in the interval of 2728–2758 m).
The results of checking the concentrations of microelements for exceeding anomalous values (Table 2) are shown in Table 4. Increased concentrations of dissolved/suspended microelements are highlighted in italics, while high concentrations are in bold and abnormal italics and bold.
In all samples, elevated and abnormal concentrations of both dissolved and suspended iron are observed. This observation suggests that at this point the formation of iron oxides has already begun. However, not all dissolved iron has yet managed to pass into a suspended form. This indicates proximity to the source of the fluid.
The concentrations of both dissolved and suspended forms of manganese do not exceed the background values for seawater that are usual for this element. The absence of elevated values of the suspended form of manganese can be explained by the proximity to the hydrothermal source, since manganese often transforms into the suspended form in the form of hydroxides at a distance from the source in the lateral part of the hydrothermal plume, mainly under the influence of bacteria.
The presence of elevated concentrations of suspended forms of zinc and copper can also indicate the proximity of the sounding point to the source. These elements precipitate rapidly as sulfides when the hydrothermal fluid contacts seawater. The irregularity in the vertical distribution of zinc and copper concentrations may be associated with subsurface phase differentiation and the pulsating nature of the hydrothermal fluid. This is evidenced by fluctuations in salinity in the turbulent part of the plume.
The composition and concentration of macro components in the studied samples are typical for seawater. However, magnesium concentrations are of interest. This element is absent in the end member hydrothermal solutions. This is a typical geochemical feature for ocean hydrothermal fluids. In the studied samples, the magnesium concentration is lower than the values typical for seawater. This may be due to the inflow of hydrothermal solutions into the bottom waters.
To search for possible relationships between variations in the concentrations of ore elements, magnesium, and methane in the bottom waters, a correlation analysis was carried out (Table 5).
According to the results of the correlation analysis, there is no connection or a negative correlation between Mg and ore elements in solution and suspensions (Table 5). This indicates their different origins. Magnesium comes from seawater, and Cu, Zn, Mn, Fe from hydrothermal solutions.
Suspended and dissolved Mn has a solid mathematical connection with suspended and dissolved Fe. High correlation coefficients between Mn and Fe can explain the coprecipitation of Mn with Fe oxides at the initial stage of the formation of a hydrothermal plume near the source. As a result, there is a rapid decrease in the concentrations of both dissolved and suspended Mn even before forming a plume of neutral buoyancy.
There is no correlation between Cu, Zn, Mn, Fe, and CH4. This indicates different input sources and mechanisms for the formation of increased concentrations of ore elements and methane.

5. Conclusions

Our studies allowed us to obtain new data on the position, structure, and intensity of methane anomalies associated with hydrothermal activity in the Mid-Atlantic Ridge. Brief conclusions from the research results are as follows:
(1)
Two new hydrothermal fields with high-temperature and low-temperature activity were discovered along the MAR (Koralovoe, 13°07‘ N, and Molodezhnoe, 13°09’ N).
(2)
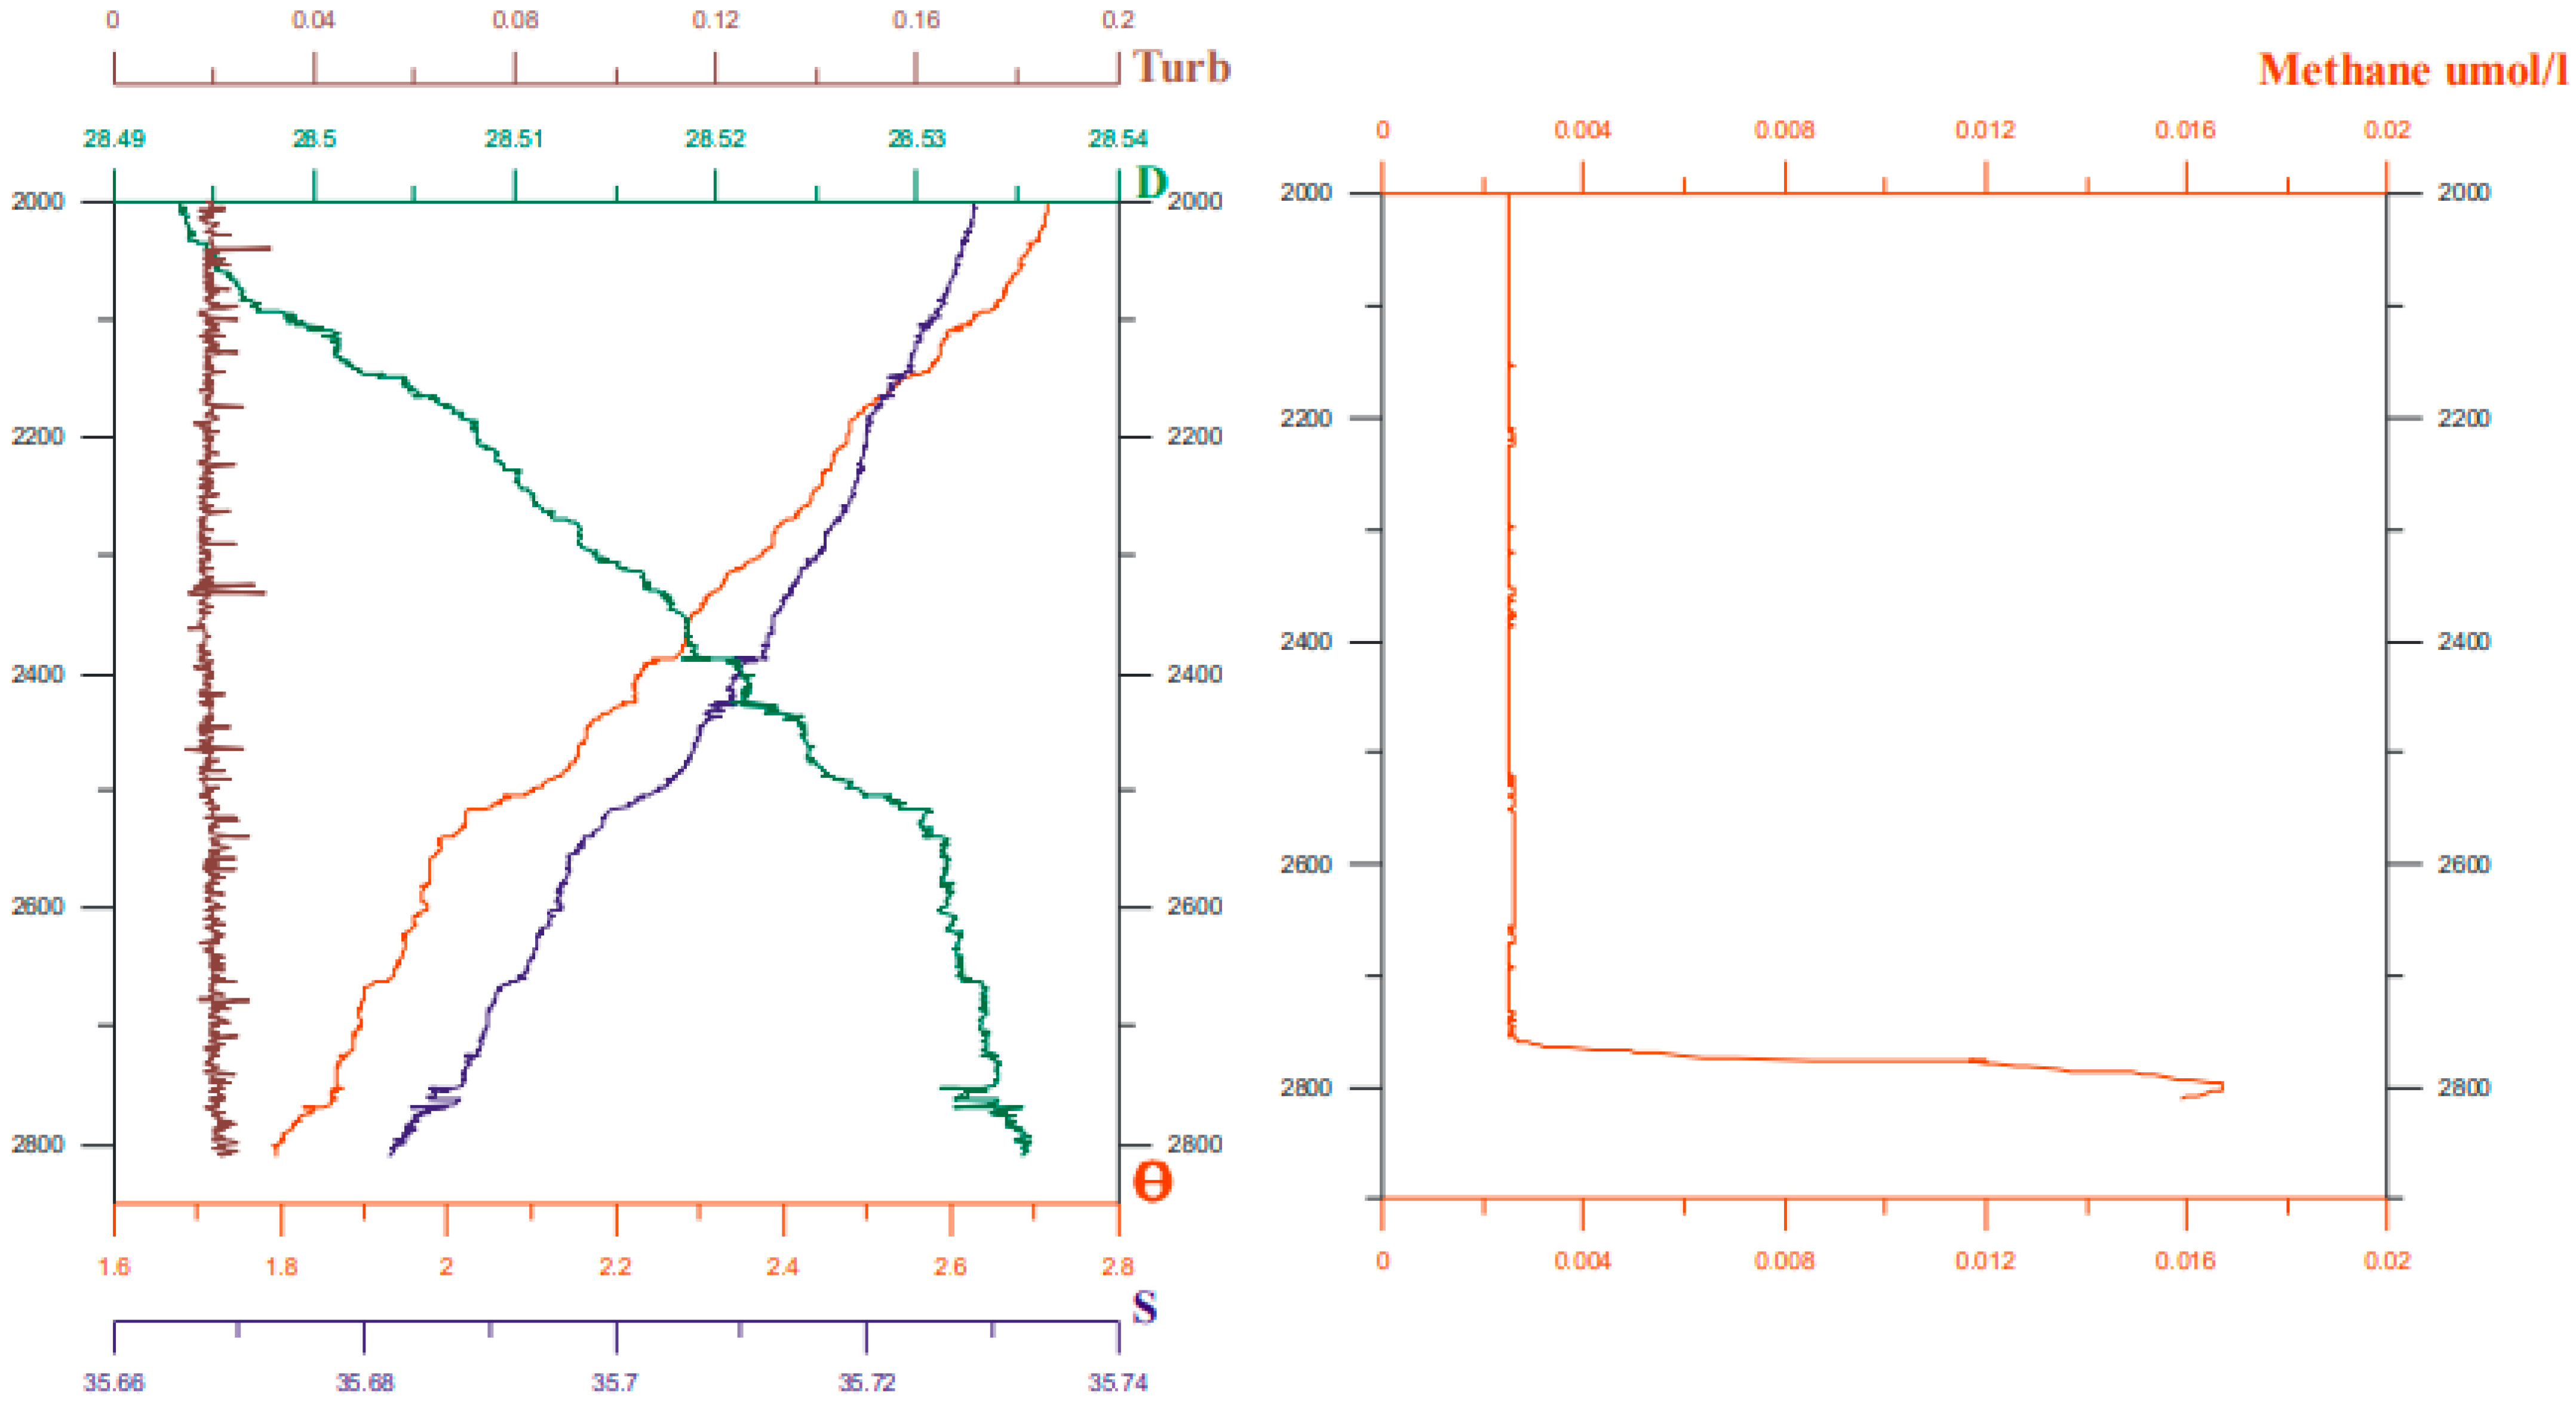
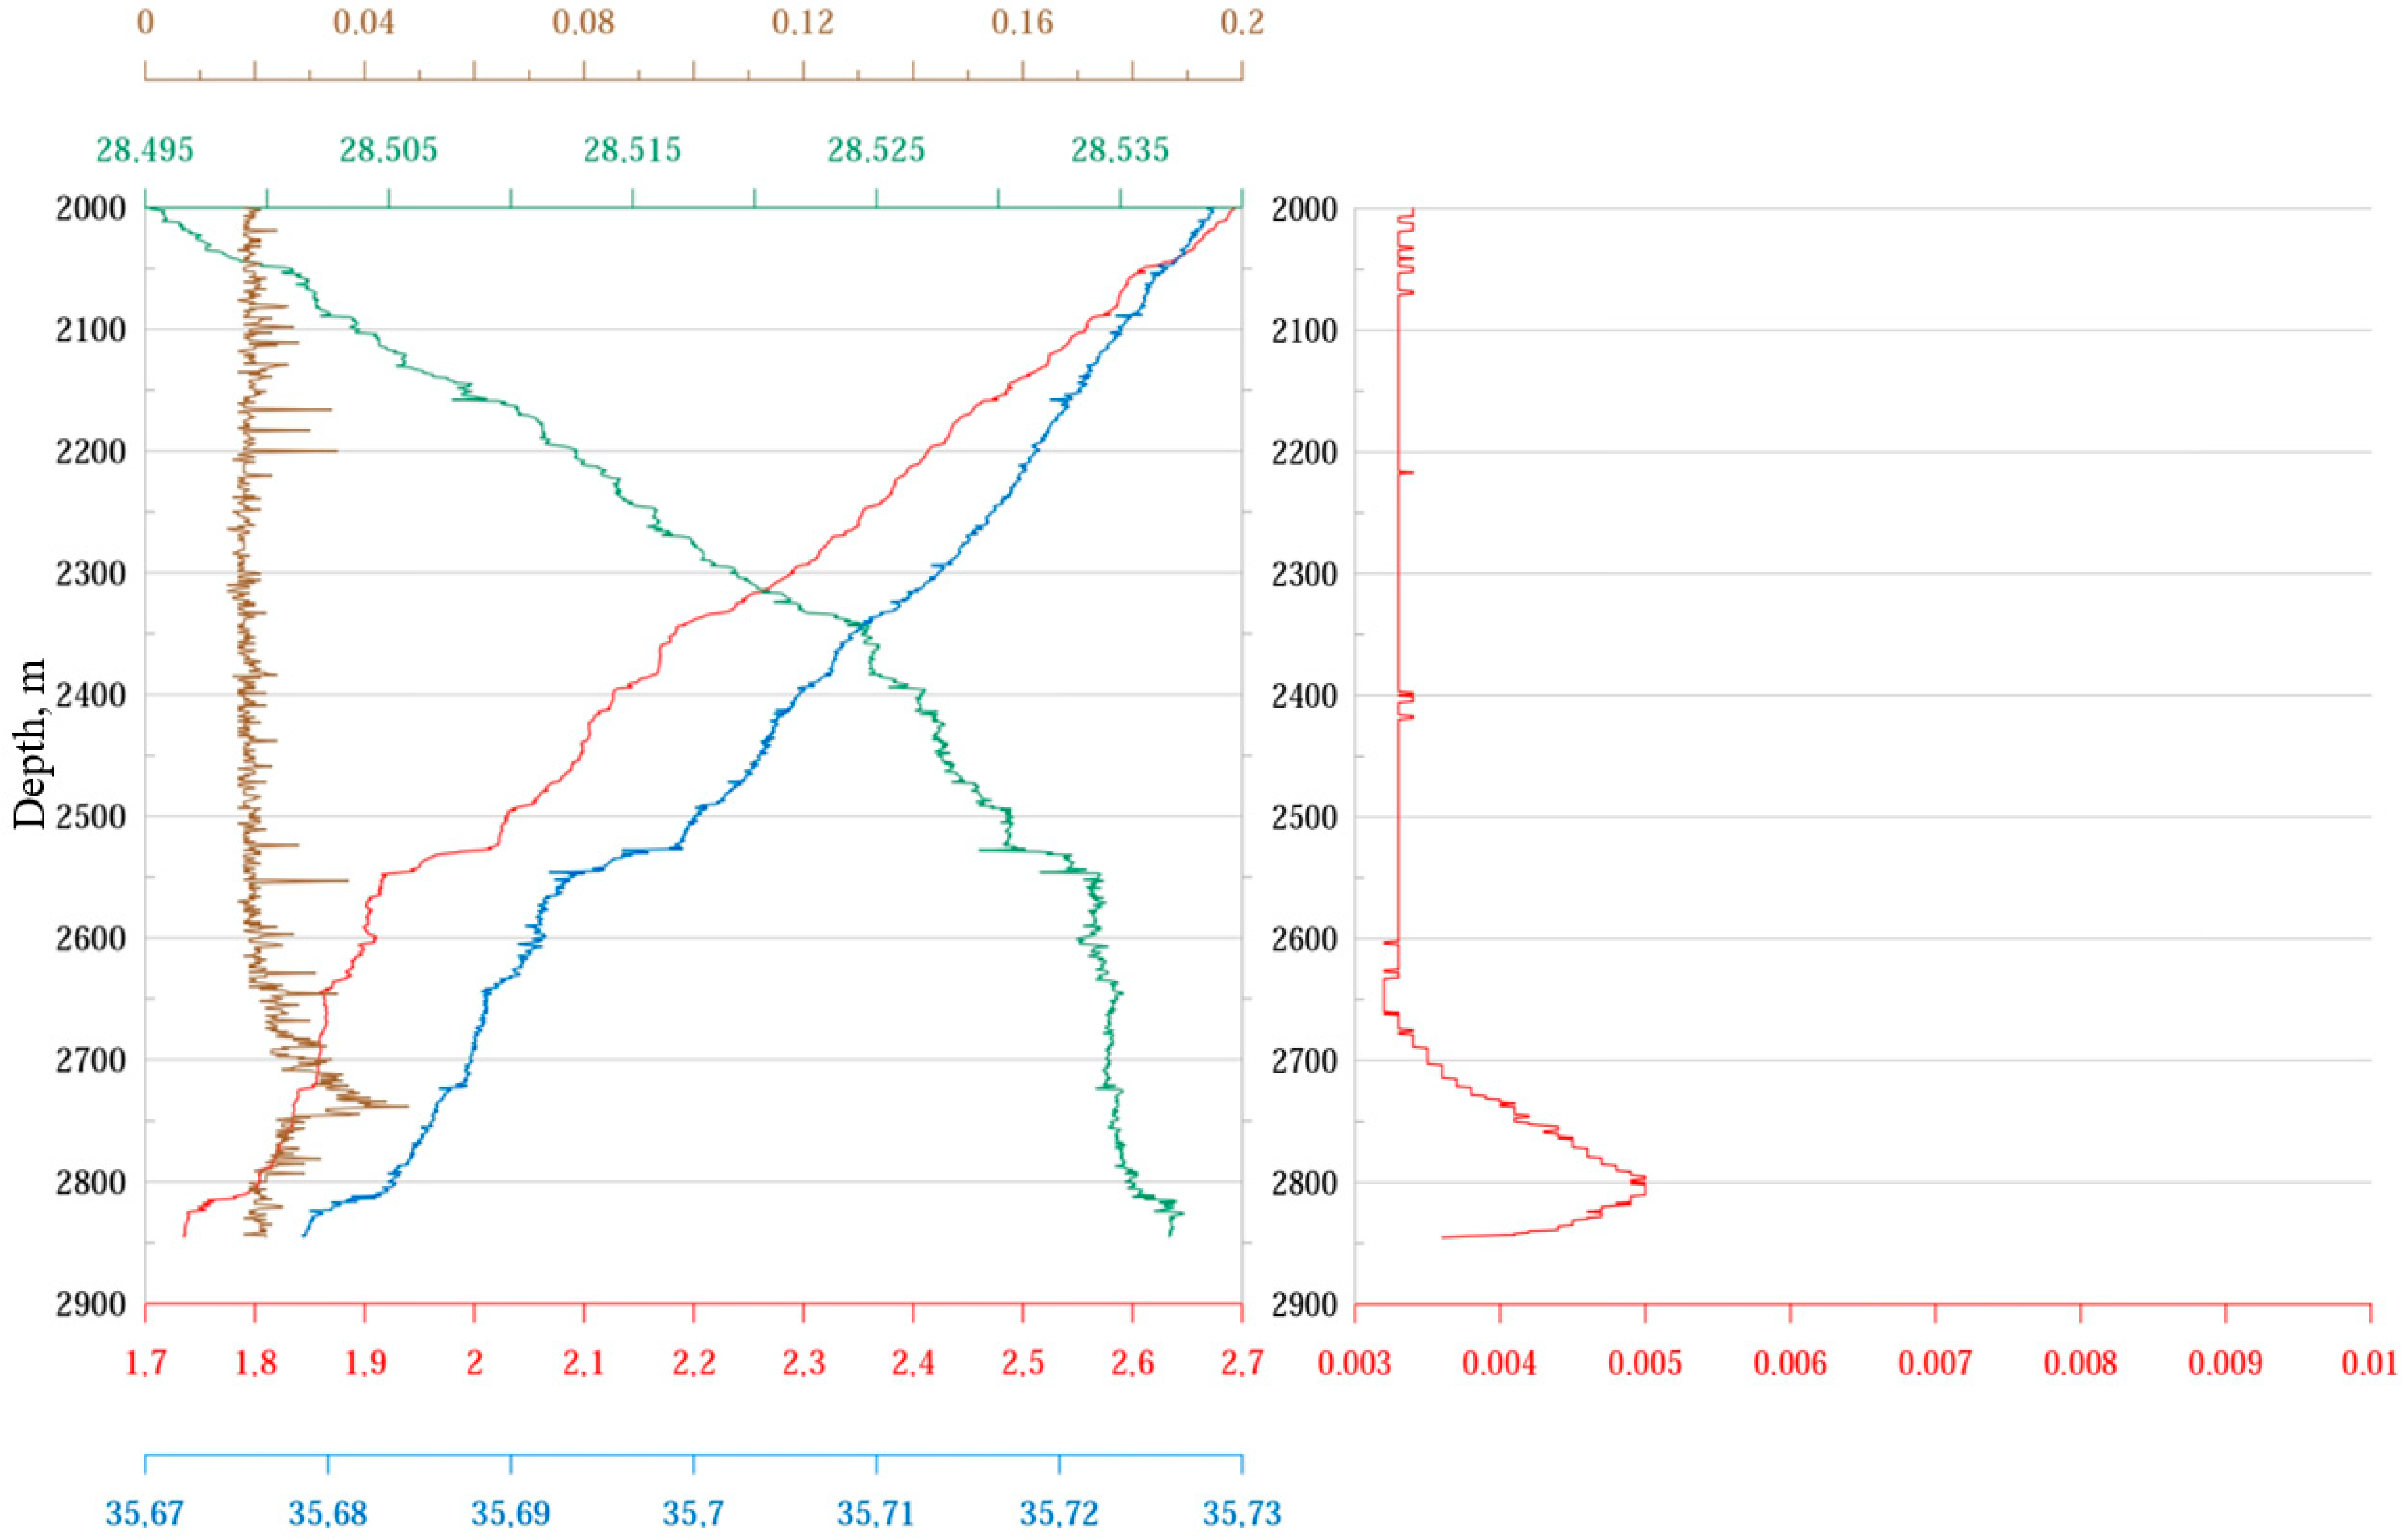
In the 39th and 41st cruises of the R/V Professor Logachev, the presence of methane anomalies in the bottom waters near the hydrothermal vents of the Koralovoe and Molodezhnoe fields, as well as the well-known Logachev field, was instrumentally established.
(3)
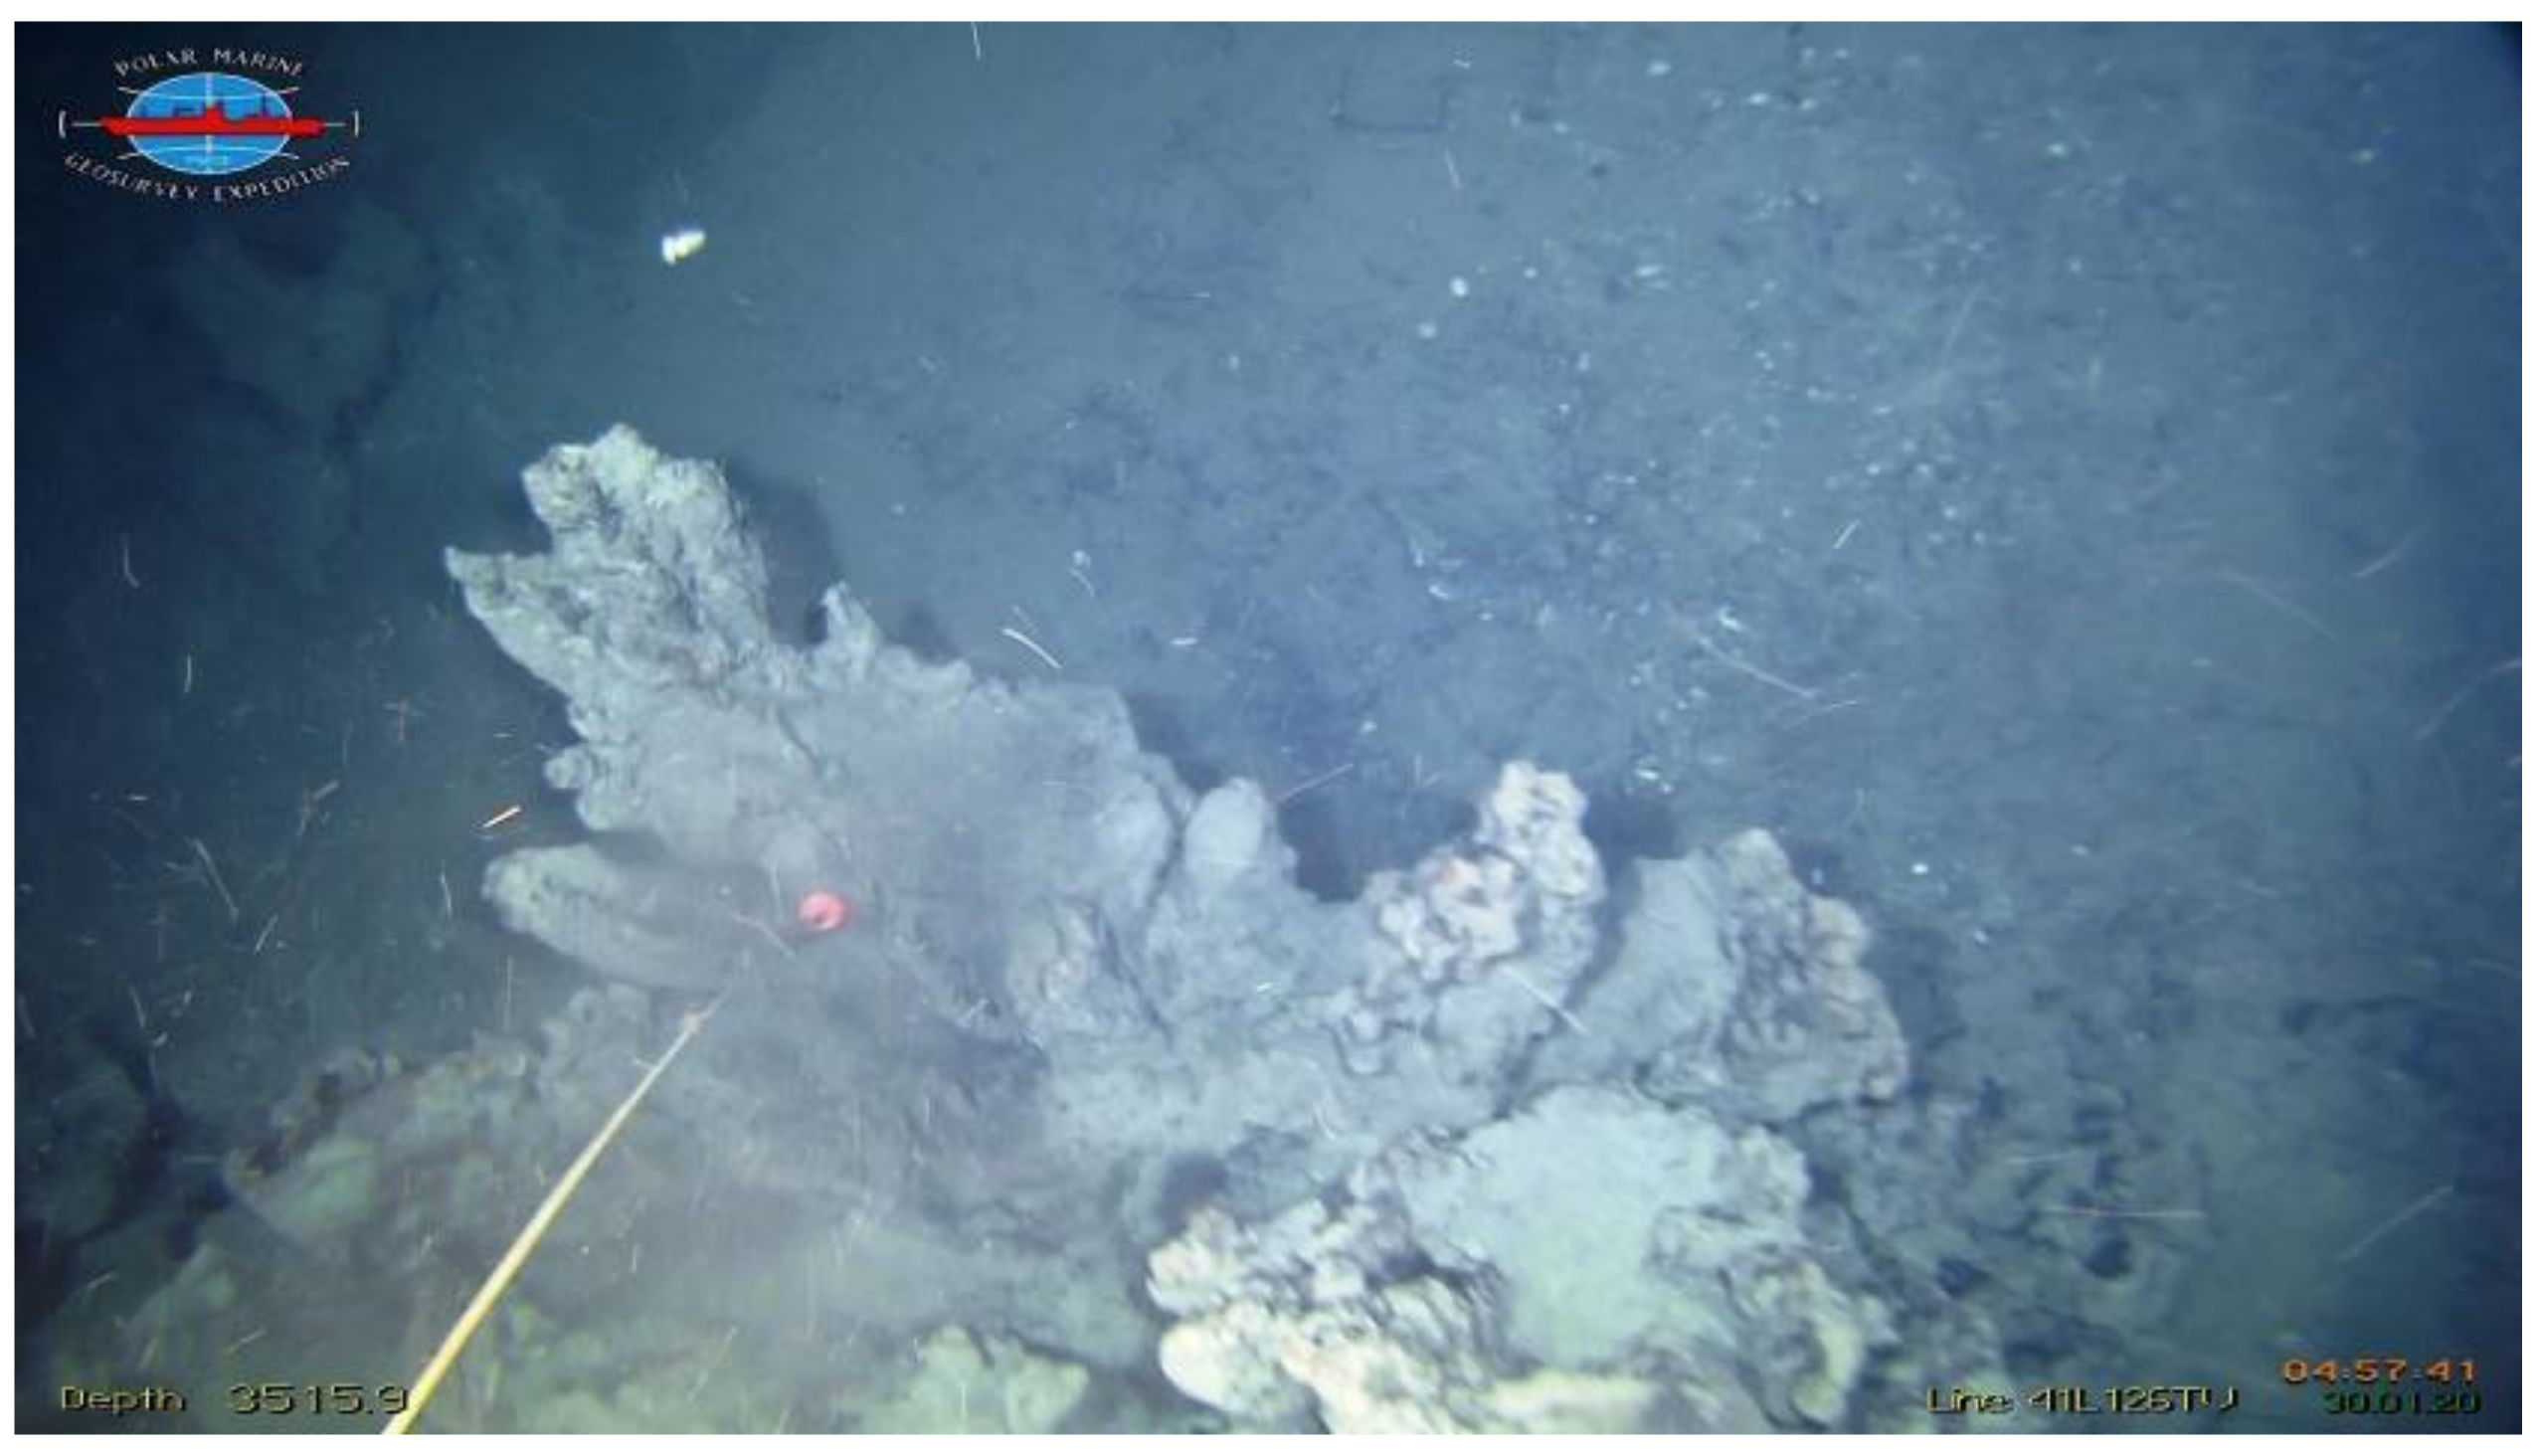
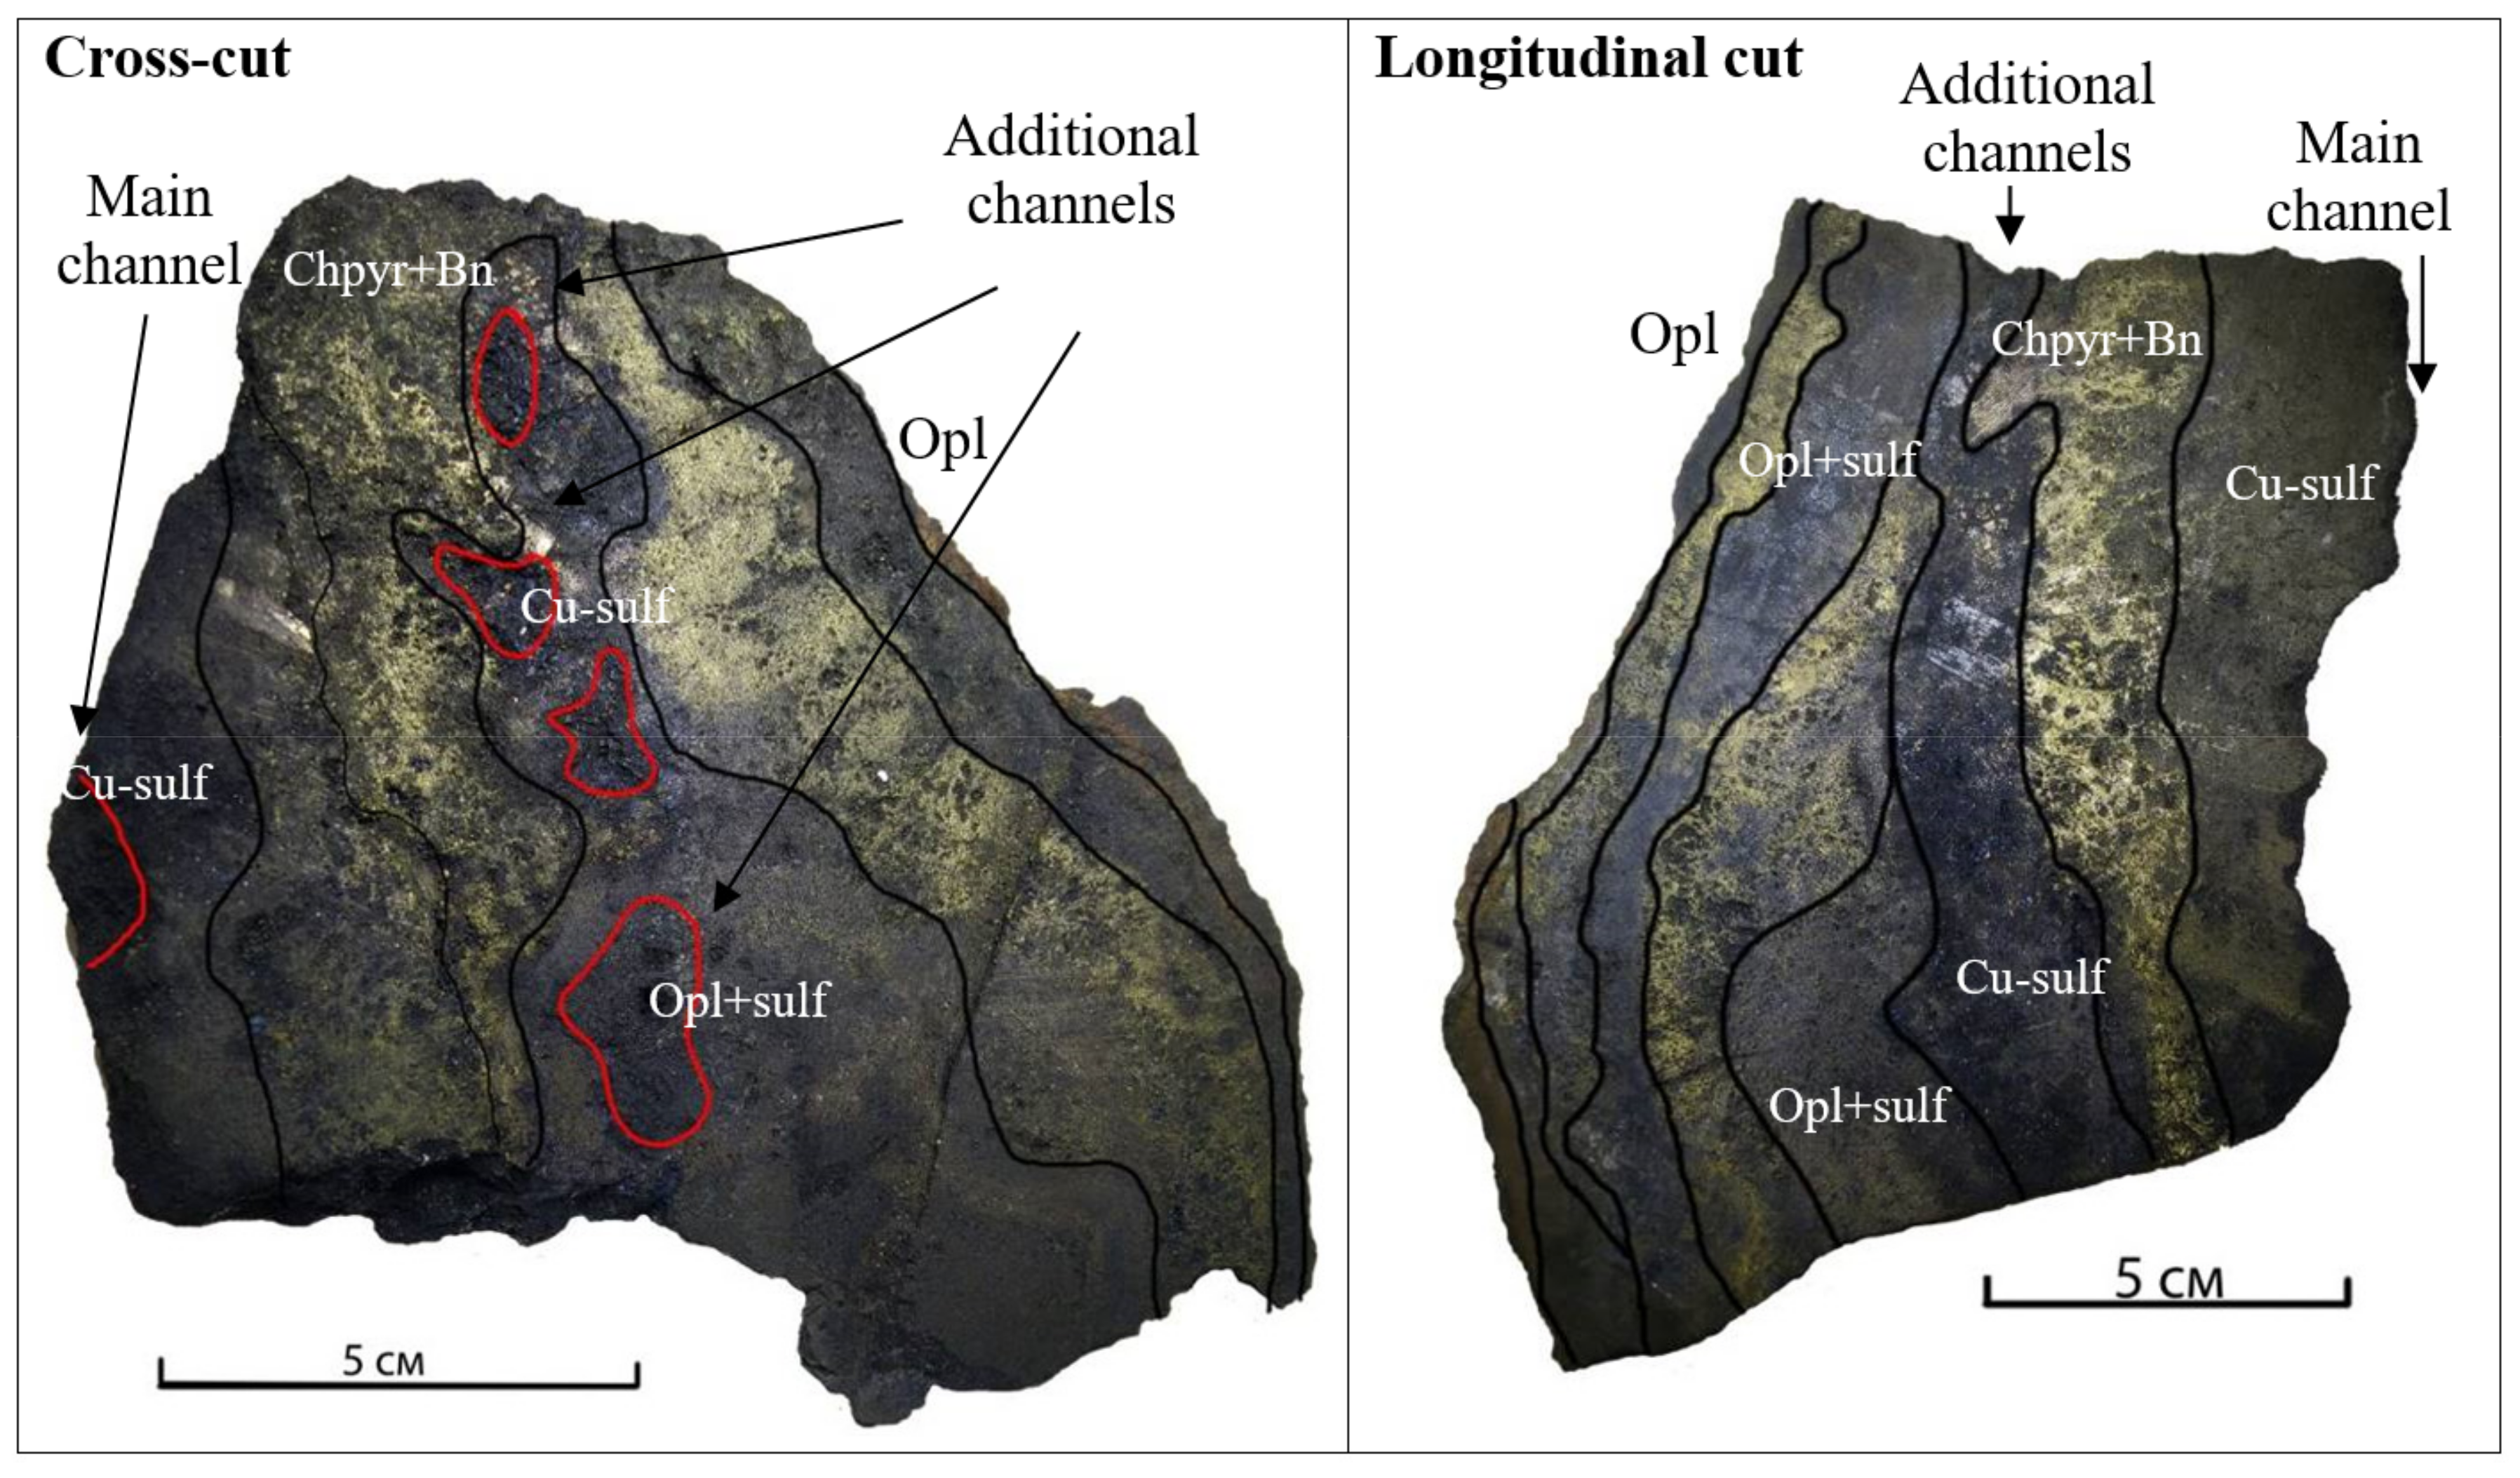
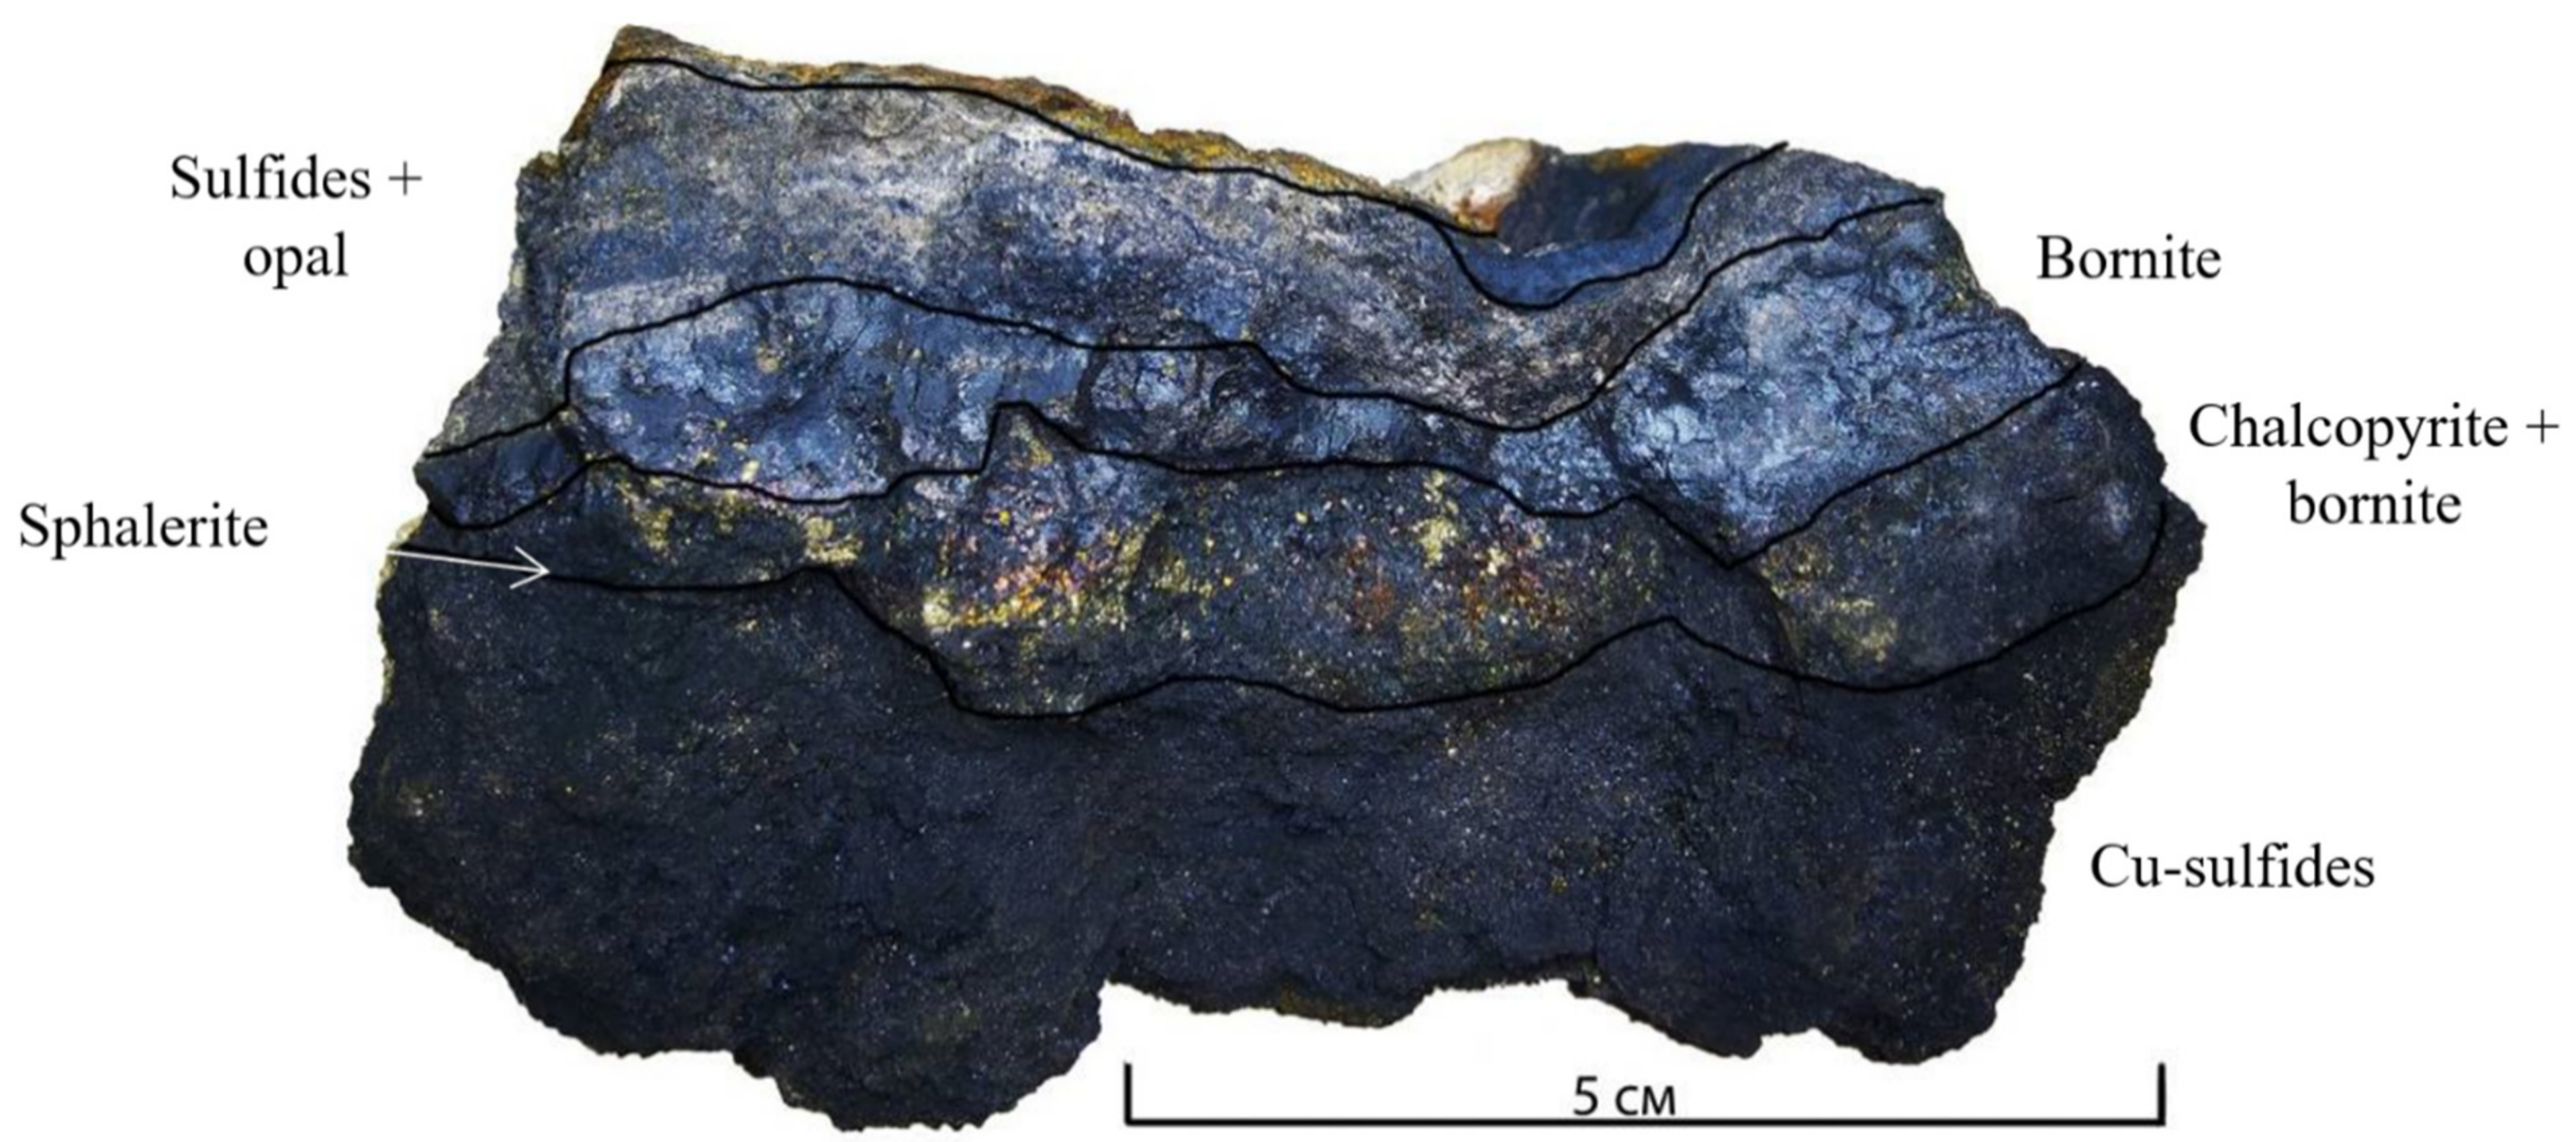
The composition of ores at new deposits is characterized by a zonal structure with the presence of an opal–sulfide zone and zones of Zn and Cu sulfides. This mineralogy indicates the possibility of both high- and low-temperature hydrothermal activity.
(4)
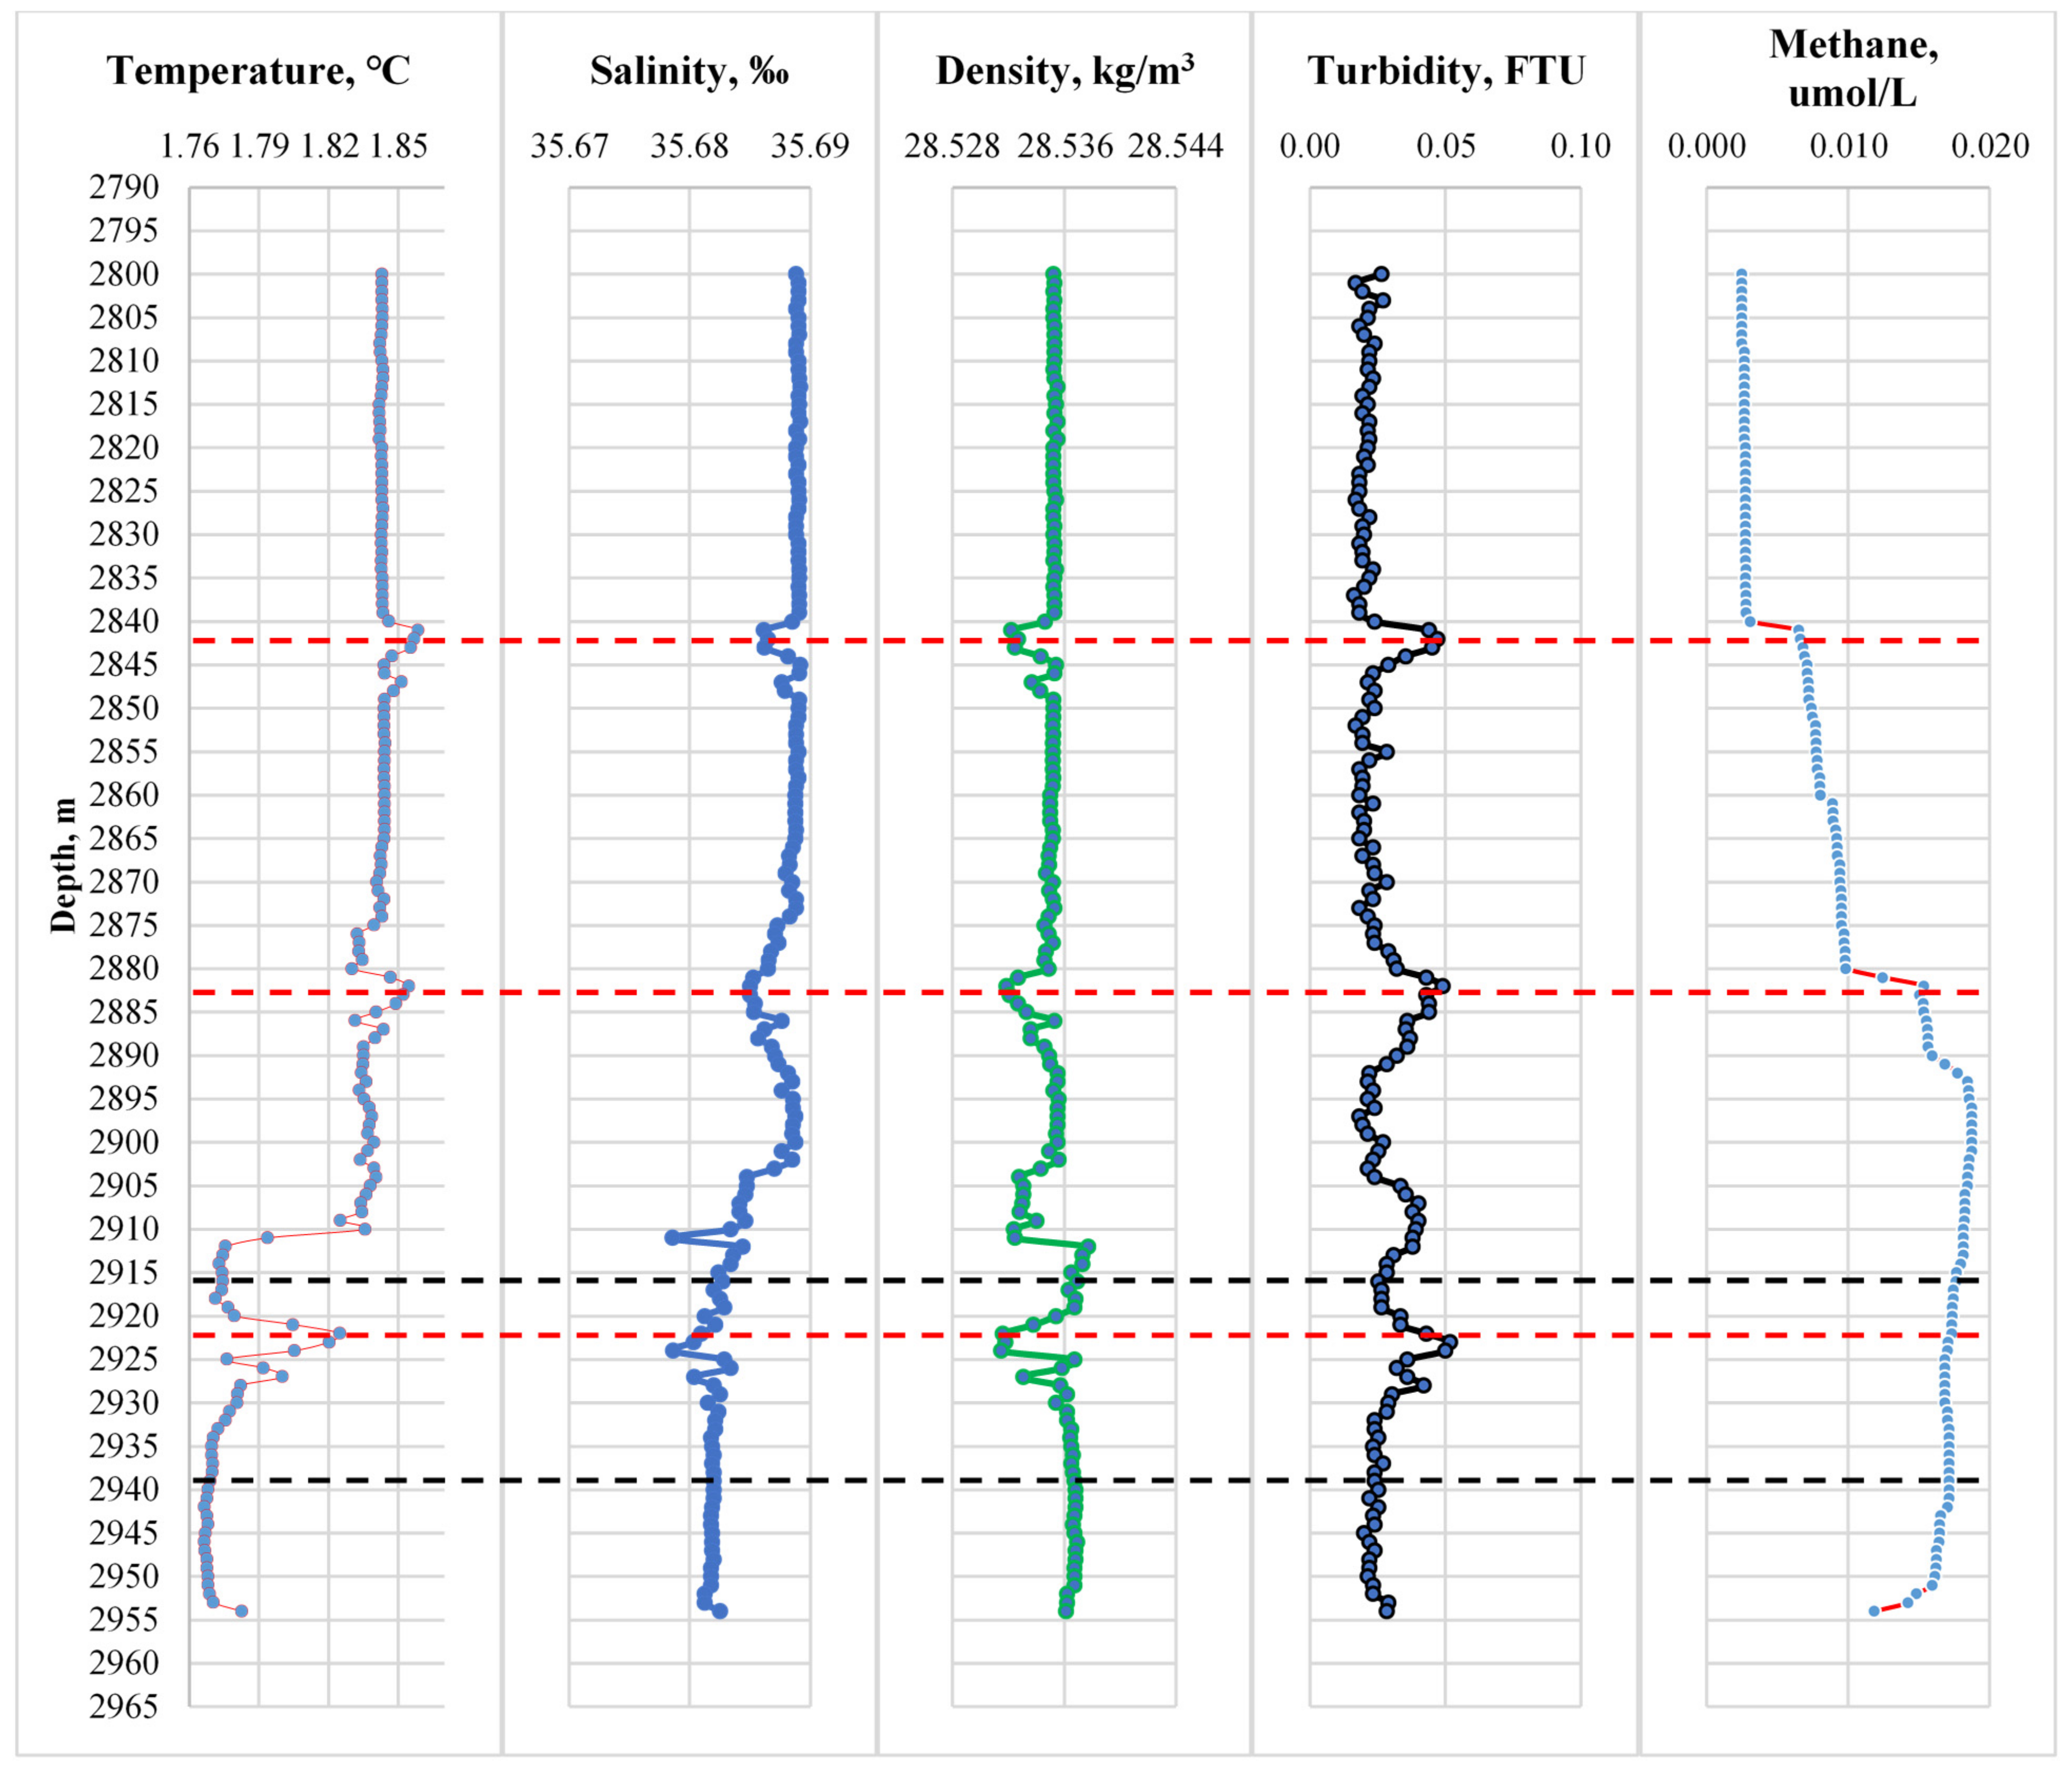
Methane anomalies were noted at the bottom in the upward flow of the plume near the sources. In a plume of neutral buoyancy, high concentrations of methane are absent.
(5)
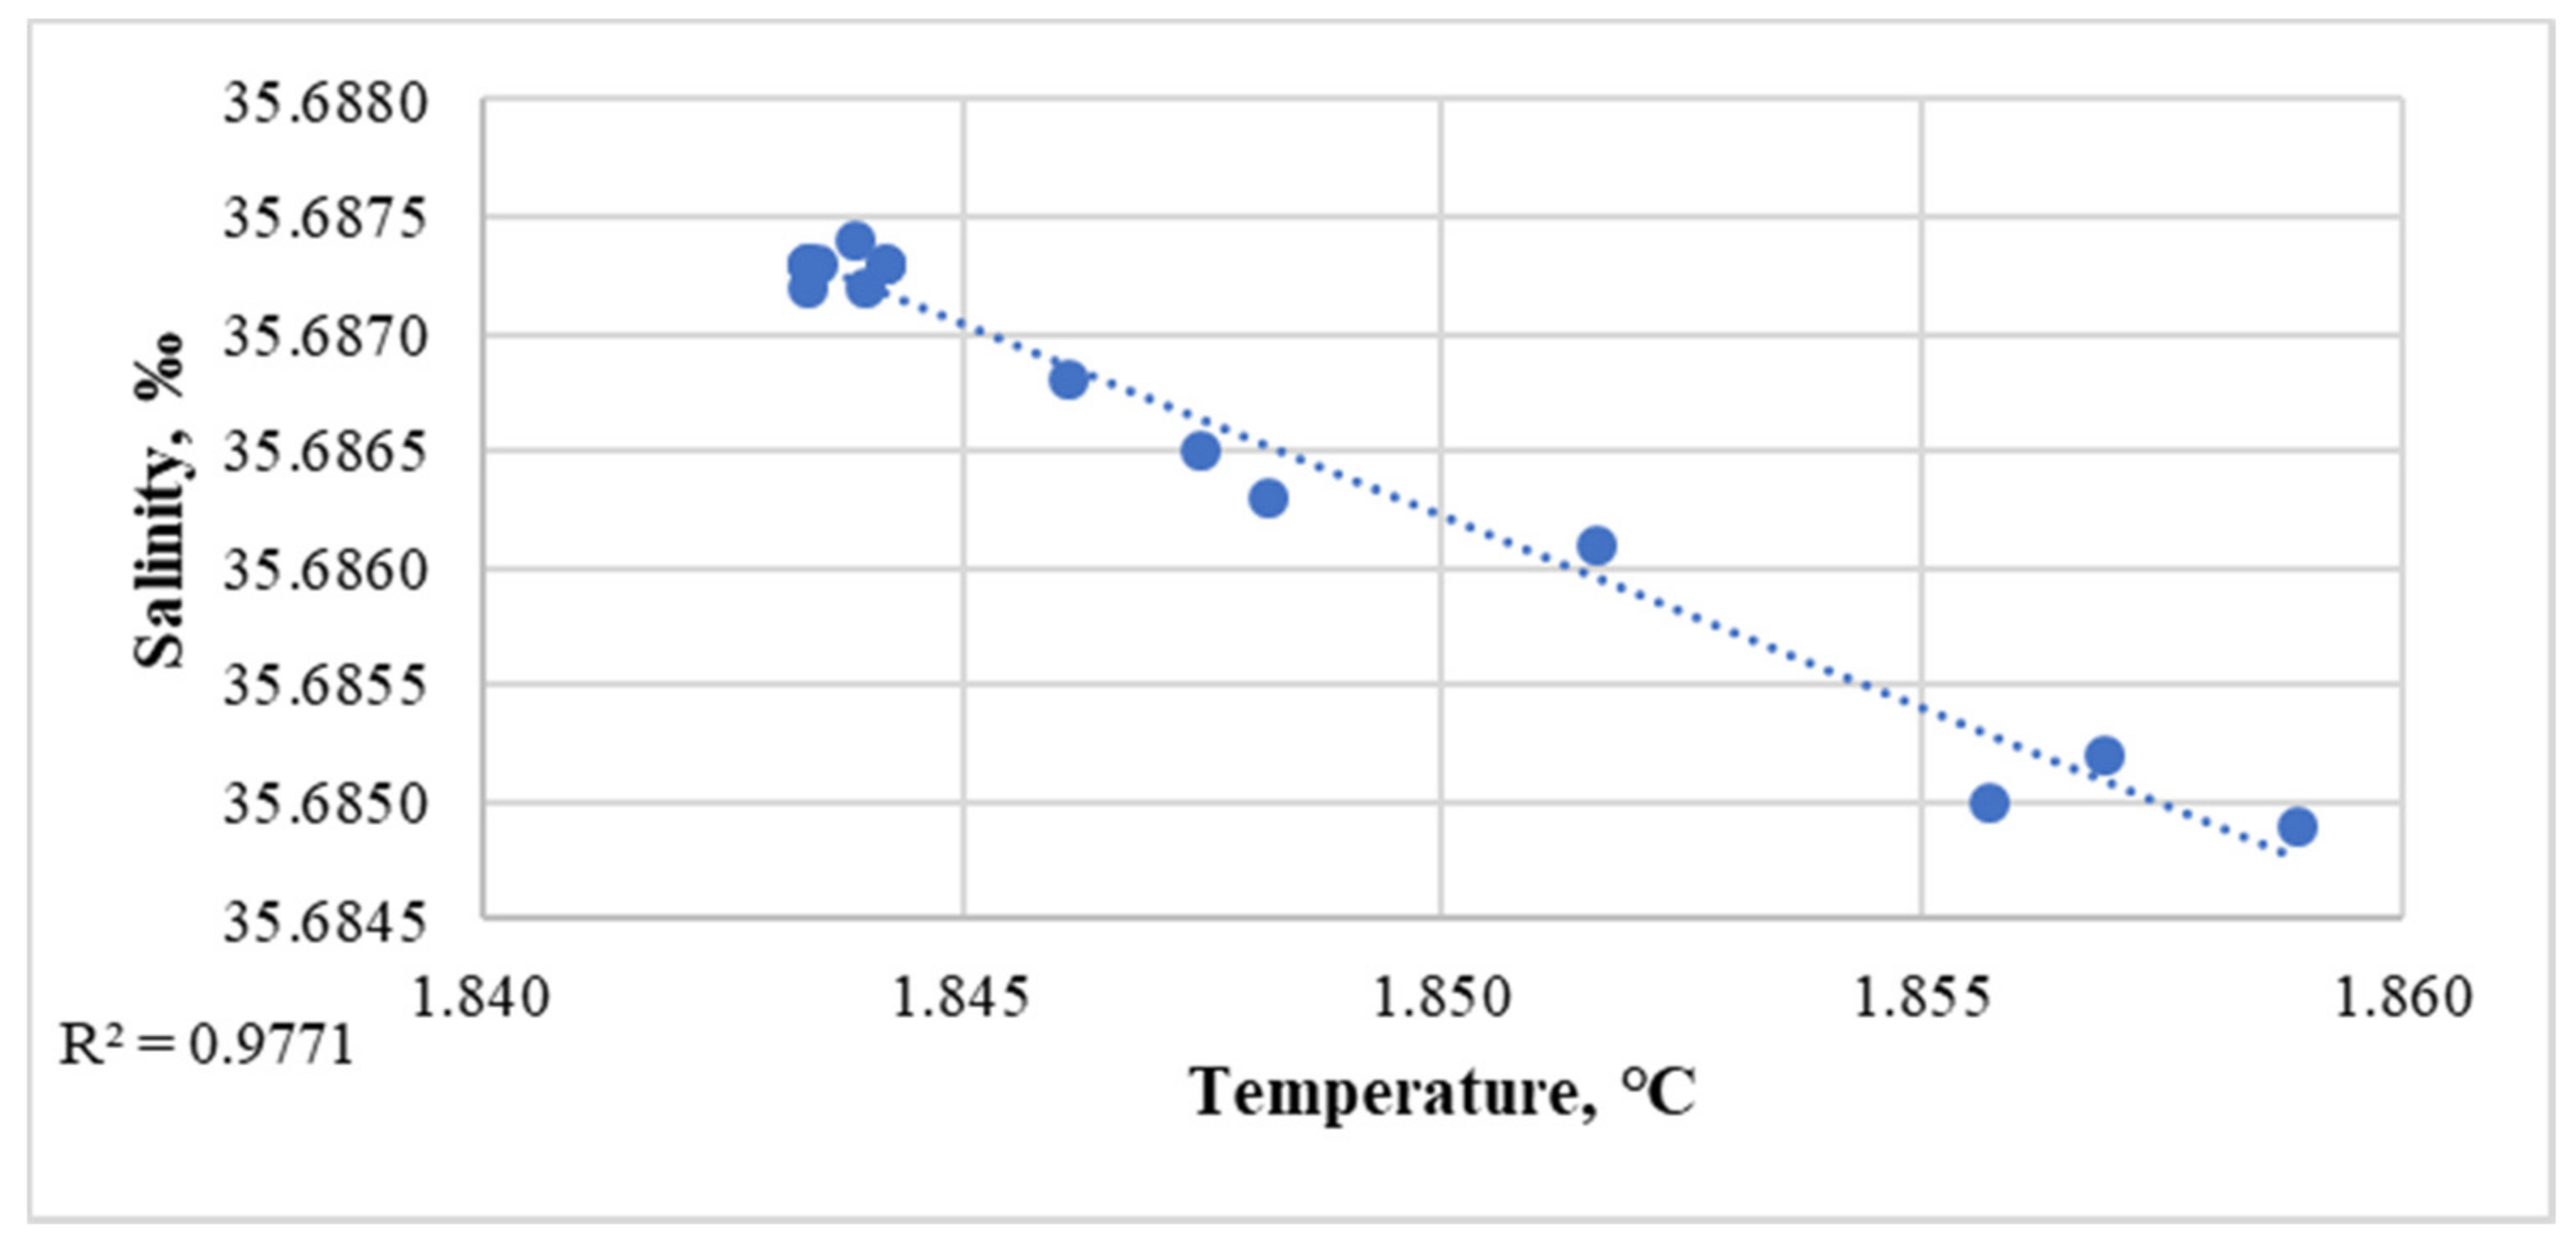
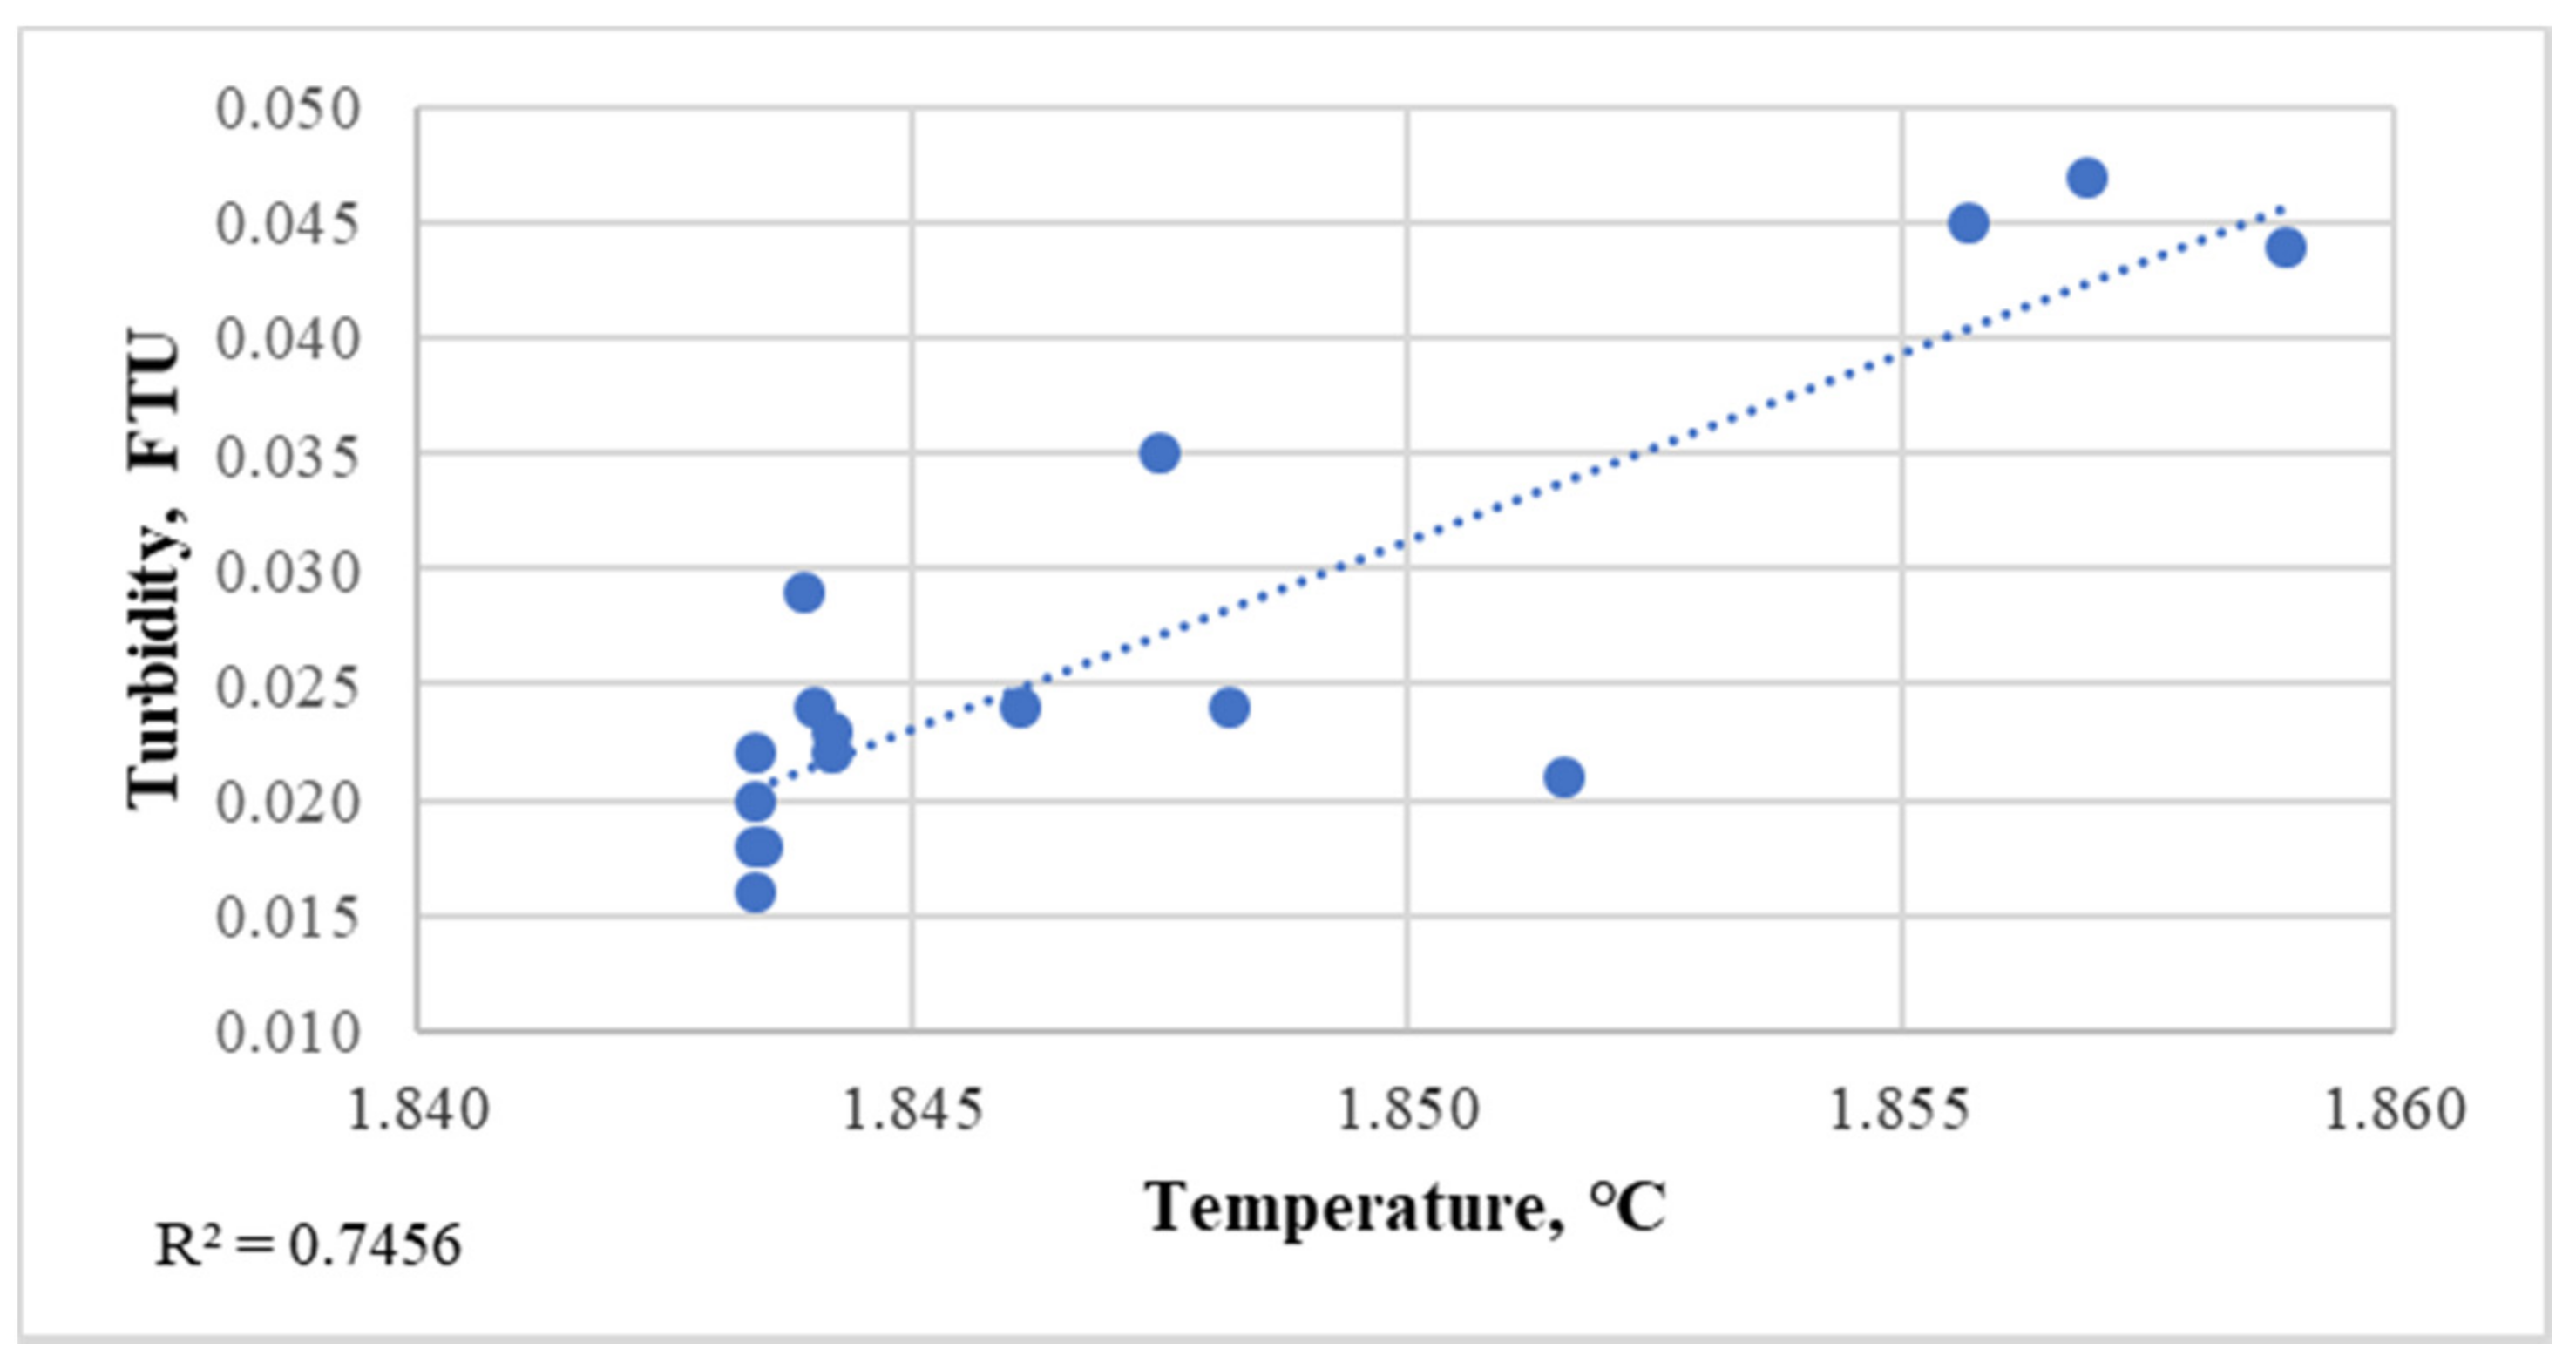
The results of the correlation analysis indicate the hydrothermal nature of the increased concentrations of suspended and dissolved Cu, Zn, Mn, and Fe in the plume.
(6)
The relationship between suspended Cu, Zn, Mn, and Fe in the hydrothermal plume and CH4 was not observed. This indicates different sources of input and mechanisms for the formation of increased concentrations of ore elements and methane in hydrothermal plumes.
(7)
The use of a methane sensor for CTD sounding increases the efficiency of detecting active hydrothermal vents in rift zones of mid-ocean ridges.

Author Contributions

Conceptualization, S.S.; field observations, E.N.; geochemistry, S.S., E.N. and V.P.; interpretation, S.S. and V.P.; writing—original draft preparation, S.S. and V.P.; writing—review and editing, S.S., E.N. and V.P.; figures, E.N. and V.P. All authors have read and agreed to the published version of the manuscript.

Funding

This research received no external funding.

Data Availability Statement

Data supporting the reported results can be found within the is available upon request from the first author.

Acknowledgments

We thank Natalia Luneva for help with the chemical analysis. Thanks are owed to the master, crew, and technical staff of the R/V Professor Logachev and to Legs 39 and 41 Scientific Party. We thank Irina Tene and the two anonymous reviewers for their constructive feedback, which has improved this contribution.

Conflicts of Interest

The authors declare no conflict of interest.

References

  1. Baker, E.T.; Resign, J.A.; Haymon, R.M.; Tunnicliffe, V.; Lavelle, J.W.; Martinez, F.; Ferrini, V.; Walker, S.L.; Nakamura, K. How many vent fields? New estimates of vent field populations on ocean ridges from precise mapping of hydrothermal discharge locations. Earth Planet. Sci. Lett. 2016, 449, 186–196. [Google Scholar] [CrossRef]
  2. Beaulieu, S.E.; Baker, E.T.; German, C.R. Where are the undiscovered hydrothermal vents on oceanic spreading ridges? Deep. Sea Res. Part II Top. Stud. Oceanogr. 2015, 121, 202–212. [Google Scholar] [CrossRef] [Green Version]
  3. Yungmeister, D.A.; Sudarikov, S.M.; Kireev, K.A. Feasibility of Type of Deep-water Technologies for the Extraction of Marine Ferro-manganese Nodules. J. Min. Inst. 2019, 235, 88–95. [Google Scholar] [CrossRef]
  4. De Angelis, M.A.; Lilley, M.D.; Baross, J.A. Methane oxidation in deep-sea hydrothermal plumes of the Endeavour Segment of the Juan de Fuca Ridge. Deep. Sea Res. Part I Oceanogr. Res. Pap. 1993, 40, 1169–1186. [Google Scholar] [CrossRef]
  5. Baker, E.T.; German, C.R.; Elderfield, H. Hydrothermal plumes over spreading-center axes: Global distributions and geological inferences. Geophys. Monogr. Am. Geophys. Union 1995, 91, 47–71. [Google Scholar]
  6. Baker, E.T. Hydrothermal plumes. In Encyclopedia of Marine Geosciences; Encyclopedia of Earth Sciences Series; Springer: Dordrecht, The Netherlands, 2016. [Google Scholar] [CrossRef]
  7. Cowen, J.P.; Wen, X.; Popp, B.N. Methane in aging hydrothermal plumes. Geochim. Cosmochim. Acta 2002, 66, 3563–3571. [Google Scholar] [CrossRef]
  8. Fouquet, Y.; Cherkashov, G.; Charlou, J.L.; Ondréas, H.; Birot, D.; Cannat, M.; Bortnikov, N.; Silantyev, S.; Sudarikov, S.; Cambon-Bonavita, M.A.; et al. Serpentine Cruise—Ultramafic hosted hydrothermal deposits on the Mid-Atlantic Ridge: First submersible studies on Ashadze 1 and 2, Logatchev 2 and Krasnov vent fields. InterRidge News 2008, 17, 15–20. [Google Scholar]
  9. Dosso, L.; Bougault, H.; Langmuir, C.; Bonnier, O.; Etoubleau, J. The age and distribution of mantle heterogeneity along the Mid-Atlantic Ridge (31–41°N). Earth Planet. Sci. Lett. 1999, 170, 269–286. [Google Scholar] [CrossRef]
  10. Douville, E.; Charlou, J.L.; Oelkers, E.H.; Bienvenu, P.; Colon, C.F.J.; Donval, J.P.; Fouquet, Y.; Prieur, D.; Appriou, P. The rainbow vent fluids (36°14′N, MAR): The influence of ultramafic rocks and phase separation on trace metal content in Mid-Atlantic Ridge hydrothermal fluids. Chem. Geol. 2002, 184, 37–48. [Google Scholar] [CrossRef]
  11. Fouquet, Y.; Cambon, P.; Etoubleau, J.; Charlou, J.L.; OndréAs, H.; Barriga, F.J.; Cherkashov, G.; Semkova, T.; Poroshina, I.; Bohn, M. Geodiversity of hydrothermal processes along the Mid-Atlantic Ridge and ultramafic-hosted mineralization: A new type of oceanic Cu-Zn-Co-Au volcanogenic massive sulfide deposit. In Diversity of Hydrothermal Systems on Slow Spreading Ocean Ridges; American Geophysical Union: Washington, DC, USA, 2013; Volume 188, pp. 321–367. [Google Scholar]
  12. Campbell, A.C.; Palmer, M.R.; Klinkhammer, G.P.; Bowers, T.S.; Edmond, J.M.; Lawrence, J.R.; Casey, J.F.; Thompson, G.; Humphris, S.; Rona, P.; et al. Chemistry of hot springs on the Mid-Atlantic Ridge. Nature 1988, 335, 514–519. [Google Scholar] [CrossRef]
  13. Charlou, J.L.; Donval, J.P.; Jean-Baptiste, P.; Dapoigny, A.; Rona, P.A. Gases and helium isotopes in high temperature solutions sampled before and after ODP Leg 158 drilling at TAG Hydrothermal Field (26°N, MAR). Geophys. Res. Lett. 1996, 23, 3491–3494. [Google Scholar] [CrossRef]
  14. Edmond, J.M.; Campbell, A.C.; Palmer, M.R.; Klinkhammer, G.P.; German, C.R.; Edmonds, H.N.; Elderfield, H.; Thompson, G.; Rona, P. Time series studies of vent fluids from the TAG and MARK sites (1986, 1990) Mid-Atlantic Ridge: A new solution chemistry model and a mechanism for Cu/Zn zonation in massive sulphide orebodies. Geol. Soc. 1995, 87, 77–86. [Google Scholar] [CrossRef]
  15. James, R.H.; Elderfield, H.; Palmer, M.R. The chemistry of hydrothermal fluids from the Broken Spur site, 29°N Mid-Atlantic ridge. Geochim. et Cosmochim. Acta 1995, 59, 651–659. [Google Scholar] [CrossRef]
  16. Jean-Baptiste, P.; Charlou, J.L.; Stievenard, M.; Donval, J.P.; Bougault, H.; Mevel, C. Helium and methane measurements in hydrothermal fluids from the mid-Atlantic ridge: The Snake Pit site at 23°N. Earth Planet. Sci. Lett. 1991, 106, 17–28. [Google Scholar] [CrossRef]
  17. McDermott, J.M.; Sylva, S.P.; Ono, S.; German, C.R.; Seewald, J.S. Geochemistry of fluids from Earth’s deepest ridge-crest hot-springs: Piccard hydrothermal field, Mid-Cayman Rise. Geochim. Cosmochim. Acta 2018, 228, 95–118. [Google Scholar] [CrossRef]
  18. Charlou, J.L.; Donval, J.P.; Douville, E.; Jean-Baptiste, P.; Radford-Knoery, J.; Fouquet, Y.; Dapoigny, A.; Stievenard, M. Compared geochemical signatures and the evolution of Menez Gwen (37°50′N) and Lucky Strike (37°17′N) hydrothermal fluids, south of the Azores Triple Junction on the Mid-Atlantic Ridge. Chem. Geol. 2000, 171, 49–75. [Google Scholar] [CrossRef]
  19. Charlou, J.L.; Donval, J.P.; Fouquet, Y.; Jean-Baptiste, P.; Holm, N. Geochemistry of high H2 and CH4 vent fluids issuing from ultramafic rocks at the Rainbow hydrothermal field (36°14′N, MAR). Chem. Geol. 2002, 191, 345–359. [Google Scholar] [CrossRef]
  20. Von Damm, K.L.; Bray, A.M.; Buttermore, L.G.; Oosting, S.E. The geochemical controls on vent fluids from the Lucky Strike vent field, Mid-Atlantic Ridge. Earth Planet. Sci. Lett. 1998, 160, 521–536. [Google Scholar] [CrossRef]
  21. Konn, C.; Charlou, J.L.; Holm, N.G.; Mousis, O. The Production of Methane, Hydrogen, and Organic Compounds in Ultramafic-Hosted Hydrothermal Vents of the Mid-Atlantic Ridge. Astrobiology 2015, 15, 381–399. [Google Scholar] [CrossRef]
  22. Kelley, D.S.; Karson, J.A.; Früh-Green, G.L.; Yoerger, D.R.; Shank, T.M.; Butterfield, D.A.; Hayes, J.M.; Schrenk, M.O.; Olson, E.J.; Proskurowski, G. A serpentinite-hosted ecosystem: The Lost City hydrothermal field. Science 2005, 307, 1428–1434. [Google Scholar] [CrossRef]
  23. McCollom, T.M. Abiotic methane formation during experimental serpentinization of olivine. Proc. Natl. Acad. Sci. USA 2016, 113, 13965–13970. [Google Scholar] [CrossRef] [Green Version]
  24. Klein, F.; Bach, W.; McCollom, T.M. Compositional controls on hydrogen generation during serpentinization of ultramafic rocks. Lithos 2013, 178, 55–69. [Google Scholar] [CrossRef]
  25. McDermott, J.M.; Seewald, J.S.; German, C.R.; Sylva, S.P. Pathways for abiotic organic synthesis at submarine hydrothermal fields. Proc. Natl. Acad. Sci. USA 2015, 112, 7668–7672. [Google Scholar] [CrossRef] [Green Version]
  26. Klein, F.; Grozeva, N.G.; Seewald, J.S. Abiotic methane synthesis and serpentinization in olivine-hosted fluid inclusions. Proc. Natl. Acad. Sci. USA 2019, 116, 17666–17672. [Google Scholar] [CrossRef] [Green Version]
  27. Kelley, D.S.; Früh-Green, G.L. Volatile lines of descent in submarine plutonic environments: Insights from stable isotope and fluid inclusion analyses. Geochim. Cosmochim. Acta 2001, 65, 3325–3346. [Google Scholar] [CrossRef]
  28. Vanko, D.A.; Stakes, D.S. Fluids in Oceanic Layer 3: Evidence from Veined Rocks, Hole 735B, Southwest Indian Ridge. Proc. Ocean. Drill. Program Sci. Results 1991, 118, 181–215. [Google Scholar]
  29. Grozeva, N.G. Carbon and Mineral Transformations in Seafloor Serpentinization Systems. Ph.D. Thesis, Massachusetts institute of Technology & Woods hole oceanographic institution, Cambridge, MA, USA, 2018; p. 198. [Google Scholar]
  30. Biddle, J.F.; Cardman, Z.; Mendlovitz, H.; Albert, D.B.; Lloyd, K.C.; Botius, A.; Teske, A. Anaerobic oxidation of methane at different temperature regimes in Guaymas Basin hydrothermal sediments. ISME J. 2012, 6, 1018–1031. [Google Scholar] [CrossRef] [PubMed] [Green Version]
  31. Takai, K.; Nakamura, K.; Toki, T.; Tsunogai, U.; Miyazaki, M.; Miyazaki, J.; Hirayama, H.; Nakagawa, S.; Nunoura, T.; Horikoshi, K. Cell proliferation at 122 °C and isotopically heavy CH4 production by a hyperthermophilic methanogen under high-pressure cultivation. Proc. Natl. Acad. Sci. USA 2008, 10, 10949–10954. [Google Scholar] [CrossRef] [Green Version]
  32. He, Y.; Feng, X.; Fang, J.; Zhang, Y.; Xiao, X. Metagenome and Metatranscriptome Revealed a Highly Active and Intensive Sulfur Cycle in an Oil-Immersed Hydrothermal Chimney in Guaymas Basin. Front. Microbiol. 2015, 6, 1236. [Google Scholar] [CrossRef] [Green Version]
  33. Li, Y.; Tang, K.; Zhang, L.; Zhao, Z.; Xie, X.; Chen, C.-T.A.; Wang, D.; Jiao, N.; Zhang, Y. Coupled carbon, Sulfur, and Nitrogen Cycles Mediated by Microorganisms in the Water Column of a Shallow-Water Hydrothermal Ecosystem. Front. Microbiol. 2018, 9, 2718. [Google Scholar] [CrossRef] [Green Version]
  34. Zhao, W.; Ma, X.; Liu, X.; Jian, H.; Zhang, Y.; Xiao, X. Cross-Stress Adaptation in a Piezophilic and Hyperthermophilic Archaeon from Deep Sea Hydrothermal Vent. Front. Microbiol. 2020, 11, 2081. [Google Scholar] [CrossRef] [PubMed]
  35. Brazelton, W.J.; Mehta, M.P.; Kelley, D.S.; Baross, J.A. Physiological differentiation within a Single-Species Biofilm Fueled by Serpentinization. mBio 2011, 2, 1–9. [Google Scholar] [CrossRef] [PubMed] [Green Version]
  36. Nishizawa, M.; Miyazaki, J.; Makabe, A.; Koba, K.; Takai, K. Physiological and isotopic characteristics of nitrogen fixation by hyperthermophilic methanogens: Key insights into nitrogen anabolism of the microbial communities in Archean hydrothermal systems. Geochim. Cosmochim. Acta 2014, 138, 117–135. [Google Scholar] [CrossRef]
  37. Schoell, M. Multiple origins of methane in the Earth. Chem. Geol. 1988, 71, 1–10. [Google Scholar] [CrossRef]
  38. Takai, K.; Nealson, K.H.; Horikoshi, K. Methanotorris formicicus sp. nov., a novel extremely thermophilic, methane-producing archaeon isolated from a black smoker chimney in the Central Indian Ridge. Int. J. Syst. Evol. Microbiol. 2004, 54, 1095–1100. [Google Scholar] [CrossRef] [Green Version]
  39. Bradley, A.S.; Summons, R.E. Multiple origins of methane at the Lost City Hydrothermal Field. Earth Planet. Sci. Lett. 2010, 297, 34–41. [Google Scholar] [CrossRef]
  40. Charlou, J.L.; Donval, J.P.; Konn, C.; Ondreas, H.; Fouquet, Y.; Jean-Baptiste, P.; Fourre, E. High Production and Fluxes of H2 and CH4 and Evidence of Abiotic Hydrocarbon Synthesis by Serpentinization in Ultramafic-Hosted Hydrothermal Systems on the Mid-Atlantic Ridge. In Diversity of Hydrothermal Systems on Slow Spreading Ocean Ridges; American Geophysical Union: Washington, DC, USA, 2010; Volume 188, pp. 265–295. [Google Scholar]
  41. McDermott, J.M.; Sylva, S.P.; Ono, S.; German, C.R.; Seewald, J.S. Abiotic redox reactions in hydrothermal mixing zones: Decreased energy availability for the subsurface biosphere. Proc. Natl. Acad. Sci. USA 2020, 117, 20453–20461. [Google Scholar] [CrossRef]
  42. Wang, D.T.; Reeves, E.P.; McDermott, J.M.; Seewald, J.S.; Shuhei, O. Clumped isotopologue constraints on the origin of methane at seafloor hot springs. Geochim. Cosmochim. Acta 2018, 223, 141–158. [Google Scholar] [CrossRef] [Green Version]
  43. Ray, D.; KameshRaju, K.A.; Rao, A.S.; SuryaPrakash, L.; Mudholkar, A.V.; Yatheesh, V.; Samudrala, K.; Kota, D. Elevated turbidity and dissolved manganese in deep water column near 10°47′S Central Indian Ridge: Studies on hydrothermal activities. Geo Mar. Lett. 2020, 40, 619–628. [Google Scholar] [CrossRef]
  44. Batuyev, N.; Krotov, A.G.; Markov, V.F.; Cherkashev, G.A.; Cherkashev, S.G.; Lisitsyn, E.D. Massive sulfide deposits discovered and sampled at 14°45′N, Mid-Atlantlic Ridge. BBRIDGE Newsl. 1994, 6, 6–10. [Google Scholar]
  45. Sudarikov, S.M. Modeling of Geochemical Processes in the Submarine Discharge Zone of Hydrothermal Solutions. Zap. Gorn. Inst. 2017, 225, 284–291. [Google Scholar] [CrossRef]
  46. Sudarikov, S.M.; Narkevsky, E.V.; Gustaitis, A.N.; Ermakova, L.A. Discovering a hydrothermal plume in the rift zone of the Mid-Atlantic Ridge at 11°26′N. Oceanology 2011, 51, 1078–1081. [Google Scholar] [CrossRef]
  47. Krasnov, S.G.; Cherkashev, G.A.; Stepanova, T.V.; Batuyev, B.N.; Krotov, A.G.; Malin, B.V.; Maslov, M.N.; Markov, V.F.; Poroshina, I.M.; Samovarov, M.S.; et al. Detailed geological studies of hydrothermal fields in the North Atlantic. Oceanogr. Lit. Rev. 1996, 43, 43–64. [Google Scholar] [CrossRef]
  48. Sagalevitch, A.; Bogdanov, Y. First dives of the “MIR” submersibles on new hydrothermal field in the Atlantic. In Challenges of Our Changing Global Environment, Proceedings of the OCEANS ‘95 MTS/IEEE, San Diego, CA, USA, 9–12 October 1995; IEEE Xplore: Piscataway, NJ, USA, 1995; pp. 1511–1515. [Google Scholar]
  49. Mottl, M.J. Metabasalts, axial hot springs and the structure of hydrothermal systems at mid-ocean ridges. Geol. Soc. Am. Bull. 1983, 94, 161–180. [Google Scholar] [CrossRef]
  50. Speer, K.G.; Rona, P.A. A model of an Atlantic and Pacific hydrothermal plume. J. Geophys. Res. Ocean 1989, 94, 6213–6220. [Google Scholar] [CrossRef]
  51. Pasquet, S.; Holbrook, W.S.; Carr, B.J.; Sims, K.W.W. Geophysical imaging of shallow degassing in a Yellowstone hydrothermal system. Geophys. Res. Lett. 2016, 43, 12027–12035. [Google Scholar] [CrossRef]
  52. Rosenberg, N.D.; Lupton, J.E.; Kadko, D.; Collier, R.; Lilley, M.D.; Pak, H. Estimation of heat and chemical fluxes from a seafloor hydrothermal vent field using radon measurements. Nature 1988, 334, 604–607. [Google Scholar] [CrossRef]
  53. Rudnicki, M.D.; Elderfield, H. Theory applied to the Mid-Atlantic ridge hydrothermal plumes: The finite-difference approach. J. Volcanol. Geotherm. Res. 1992, 50, 161–172. [Google Scholar] [CrossRef]
  54. Thurnherr, A.M.; Richards, K.J. Hydrography and high-temperature heat flux of the Rainbow hydrothermal site (36°14′N, Mid-Atlantic Ridge). J. Geophys. Res. 2001, 106, 9411–9426. [Google Scholar] [CrossRef]
  55. MacLeod, C.J.; Searle, R.C.; Murton, B.J.; Casey, J.F.; Mallows, C.; Unsworth, S.C.; Achenbach, K.L.; Harris, M. Life cycle of oceanic core complexes. Earth Planet. Sci. Lett. 2009, 287, 333–344. [Google Scholar] [CrossRef]
  56. Smith, D.; Escartin, J.; Schouten, H.; Cann, J. Fault rotation and core complex formation: Significant processes in seafloor formation at slow-spreading mid-ocean ridges (Mid-Atlantic Ridge, 13°–15°N). Geochem. Geophys. Geosystems 2008, 9, Q03003. [Google Scholar] [CrossRef]
  57. Smith, D.K.; Cann, J.; Escartín, J. Widespread active detachment faulting and core complex formation near 13°N on the Mid-Atlantic Ridge. Nature 2006, 442, 440–443. [Google Scholar] [CrossRef] [PubMed]
  58. Kelley, D.S.; Karson, J.A.; Blackman, D.K.; FruÈh-Green, G.L.; Butterfield, D.A.; Lilley, M.D.; Olson, E.J.; Schrenk, M.O.; Roe, K.K.; Lebon, G.T. An off-axis hydrothermal vent field near the Mid-Atlantic Ridge at 30°N. Nature 2001, 412, 145–149. [Google Scholar] [CrossRef] [PubMed]
Figure 1. Position of the CTD sounding station (star) at the Irina 1 crater, Logachev field. The bathymetric map was obtained by the ROV Victor 6000 near-bottom multibeam survey during the SERPENTINE cruise [8].
Minerals 11 00726 g001
Figure 2. Irina 1 hydrothermal crater. Logachev field (photo taken during the SERPENTINE expedition).
Minerals 11 00726 g002
Figure 3. Results of CTD sounding at the Irina 1 crater, Logachev field. Left: brown—turbidity, FTU; blue—salinity, ‰; red—temperature, °C; green—density, kg/m3); right graph: methane concentration, μmol/L.
Minerals 11 00726 g003
Figure 4. Horizons with anomalous CTD parameters in the ascending plume of the hydrothermal plume near the Irina 1 crater, Logachev field. Red dotted line: scattering horizons; black dotted line: layers of relatively cold waters.
Minerals 11 00726 g004
Figure 5. Salinity/temperature regression line for the bottom water layer at a depth of 2835–2850 m. Source: Irina 1, Logachev field.
Minerals 11 00726 g005
Figure 6. Turbidity/temperature regression line for the bottom water layer at a depth of 2835–2850 m. Source: Irina 1, Logachev field.
Minerals 11 00726 g006
Figure 7. Position of CTD sounding stations (star), Molodezhnoye and Koralovoye fields.
Minerals 11 00726 g007
Figure 8. Inactive sulfide-rich chimney structures. Field Molodezhnoye.
Minerals 11 00726 g008
Figure 9. A fragment of a chimney wall. On the left—a cross-cut, on the right—a longitudinal cut. Opl: opal; Chpyr: chalcopyrite; Bn: bornite; Cu-sulf: non-stoichiometric copper sulfides. Field Molodezhnoye.
Minerals 11 00726 g009
Figure 10. Results of CTD sounding at Molodezhnoye field. Left: brown—turbidity, FTU; blue—salinity, ‰; red—temperature, °C; green—density, kg/m3; right graph: methane concentration, μmol/L.
Minerals 11 00726 g010
Figure 11. Venting black smoker chimneys, sulfide ores, and hydrothermal fauna. Koralovoye field.
Minerals 11 00726 g011
Figure 12. Hydrothermal crusts of iron hydroxides and oxidized sulfide ores. Koralovoye field.
Minerals 11 00726 g012
Figure 13. Fragment of the wall from the chimney structure. Koralovoye field.
Minerals 11 00726 g013
Figure 14. Results of CTD sounding at the Koralovoye field, station 41L173. Left: brown—turbidity, FTU; blue—salinity, ‰; red—temperature, °C; green—density, kg/m3; right graph: methane concentration, μmol/L.
Minerals 11 00726 g014
Figure 15. Results of CTD sounding at the Koralovoye field, station 41LP. Left: brown—turbidity, FTU; blue—salinity, ‰; red—temperature, °C; green—density, kg/m3; right graph: methane concentration, μmol/L.
Minerals 11 00726 g015
Table 1. Detection ranges of the sensors.
TemperatureConductivityTurbidityMethane
−5 to 35 ℃0 to 7 S/m0–25 FTU1–500 nM
Table 2. Statistical characteristics of the concentrations of dissolved and suspended forms of trace elements in the search area (µg/L).
Dissolved FormSolid Form
MnFeCuZnMnFeCuZn
Wed. value0.112.670.261.670.093.370.050.19
Deviation0.212.290.281.290.041.590.020.13
Maximum2.2020.003.308.900.1914.800.171.00
Minimum0.040.500.080.090.031.100.030.05
Geometric mean0.052.220.211.340.083.080.050.16
Standard factor2.351.751.671.951.561.521.391.90
Anomalous0.7011.811.09.860.3210.810.131.08
High0.306.760.605.10.217.120.100.57
Elevated0.133.870.362.600.134.680.070.30
Detection limit0.040.20.040.050.040.20.040.05
Table 3. Correlation coefficients and approximation confidence coefficients (in italics). Top layer/middle layer/bottom layer. Logachev field.
TemperatureSalinityDensityTurbidity
Temperature1−0.99/−0.84/−0.64−0.99/−0.96/−0.940.86/0.77/0.78
Salinity0.98/0.72/0.4010.99/0.96/0.86−0.86/−0.85/−0.75
Density0.99/0.93/0.880.99/0.91/0.741−0.86/−0.84/−0.84
Turbidity0.75/0.59/0.610.75/0.72/0.560.74/0.70/0.701
Table 4. Elevated (in italics), high (in bold), and abnormal (in italics and bold) concentrations of dissolved/solid microelements.
StationSampling Depth (m)Cu, µgLMn, µg/LFe, µg/LZn, µg/L
41L17327850.48/0.060.06/0.15.9/14.47.6/0.24
41L17327870.27/0.050.04/0.075.6/11.14.2/0.15
41L17327860.28/0.060.09/0.0822.4/12.65.0/0.22
41LP27280.66/0.070.06/0.0712.2/10.18.0/0.35
41LP27580.18/0.050.08/0.055.9/8.12.2/0.27
Table 5. Correlation between Mg, CH4, and dissolved (d) and suspended (s) ore elements in the hydrothermal plume. Hydrothermal fields: Korallovoe and Molodezhnoe.
Cu (d)Mn (d)Fe (d)Zn (d)Cu (s)Mn (s)Fe (s)Zn (s)MgCH4
Cu(d)1−0.310.050.940.900.430.270.65−0.12−0.77
Mn(d)−0.3110.65−0.280.09−0.16−0.110.28−0.070.41
Fe(d)0.050.6510.140.460.140.210.12−0.75−0.33
Zn(d)0.94−0.280.1410.860.720.590.43−0.12−0.85
Cu(s)0.900.090.460.8610.390.270.72−0.35−0.73
Mn(s)0.43−0.160.140.720.3910.98−0.170.07−0.62
Fe(s)0.27−0.110.210.590.270.981−0.340.00−0.56
Zn(s)0.650.280.120.430.72−0.17−0.3410.06−0.11
Mg−0.12−0.07−0.75−0.12−0.350.070.000.0610.55
CH4−0.770.41−0.33−0.85−0.73−0.62−0.56−0.110.551
Publisher’s Note: MDPI stays neutral with regard to jurisdictional claims in published maps and institutional affiliations.

