
A Complex Soil Ecological Approach in a Sustainable Urban Environment: Soil Properties and Soil Biological Quality

 , , , and
Abstract
:1. Introduction
- The top priority of our research is to create a comprehensive database to complete the national system. Our national soil monitoring network does not examine the health conditions of human settlements.
- The long-term aim is to propose a modification of the existing soil limit system based on our results. Hungarian law only sets limits for total element content, e.g., for toxic trace metals. In our opinion, the limit values should also be completed with available toxic element limits to protect human health in urban areas.
- In addition, it is worth noting that in Hungary, the preparation of 4–6-year-long environmental programs for every settlement has been mandatory since 2006. Most of these programs are prepared with the involvement of a team of experts coordinated by the local government, but the prepared documents rely on unmeasured data. The lack of specific databases or municipal monitoring networks for cities is the reason for this. On the other hand, experts often rely on literature in their attempts to identify local problems affecting cities and offer suggestions from these literature-based findings. Most of these suggestions can only be called “symptom management” and do not attempt to uncover the “root problem”. Therefore, experts can only make modest suggestions and lack the information needed to take definite steps.
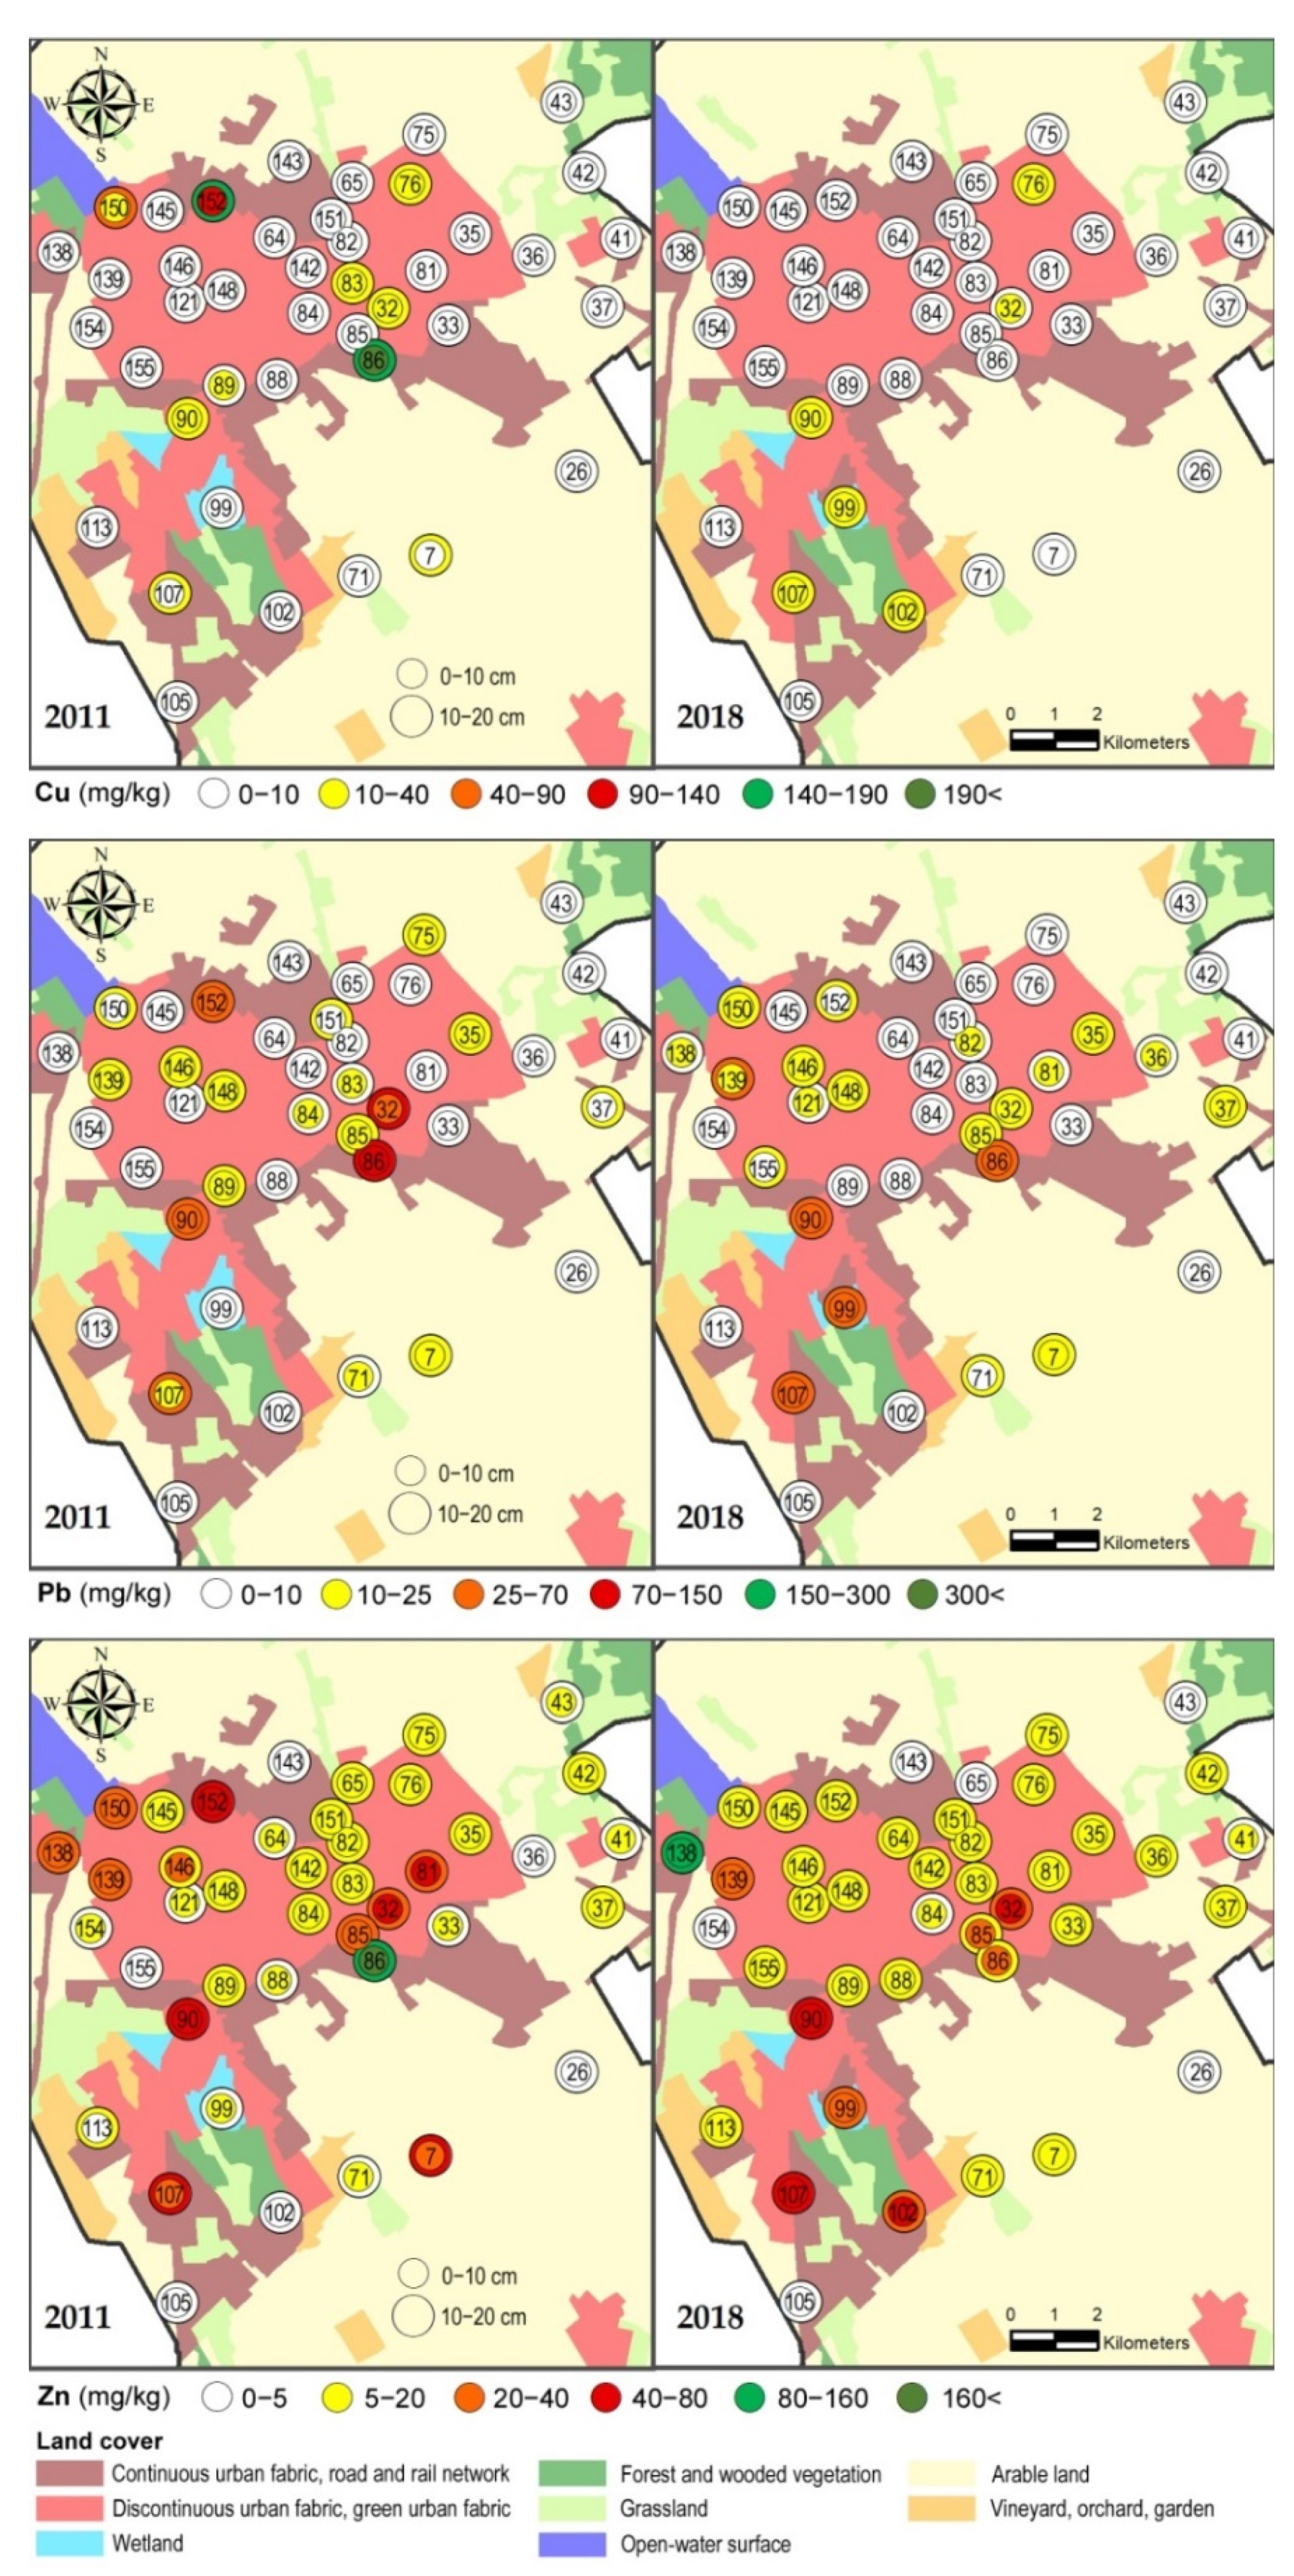
- to analyze the basic soil properties and available concentration of trace metals (Cd, Co, Cr, Cu, Ni, Pb, Zn) of the separate study years (2011 and 2018) and compare the results with suggested or legal limits;
- to compare and evaluate the results of 2011 to 2018 and estimate the changes in urban soils;
- to determine the degree of accumulation with enrichment factor (EF) calculations;
- to evaluate the quality and health of urban soil using the QBS approach;
- to clarify the directions of city development: Is Székesfehérvár still a livable city? Or do anthropogenic impacts have increasingly negative effects on soil and edaphon?
2. Materials and Methods
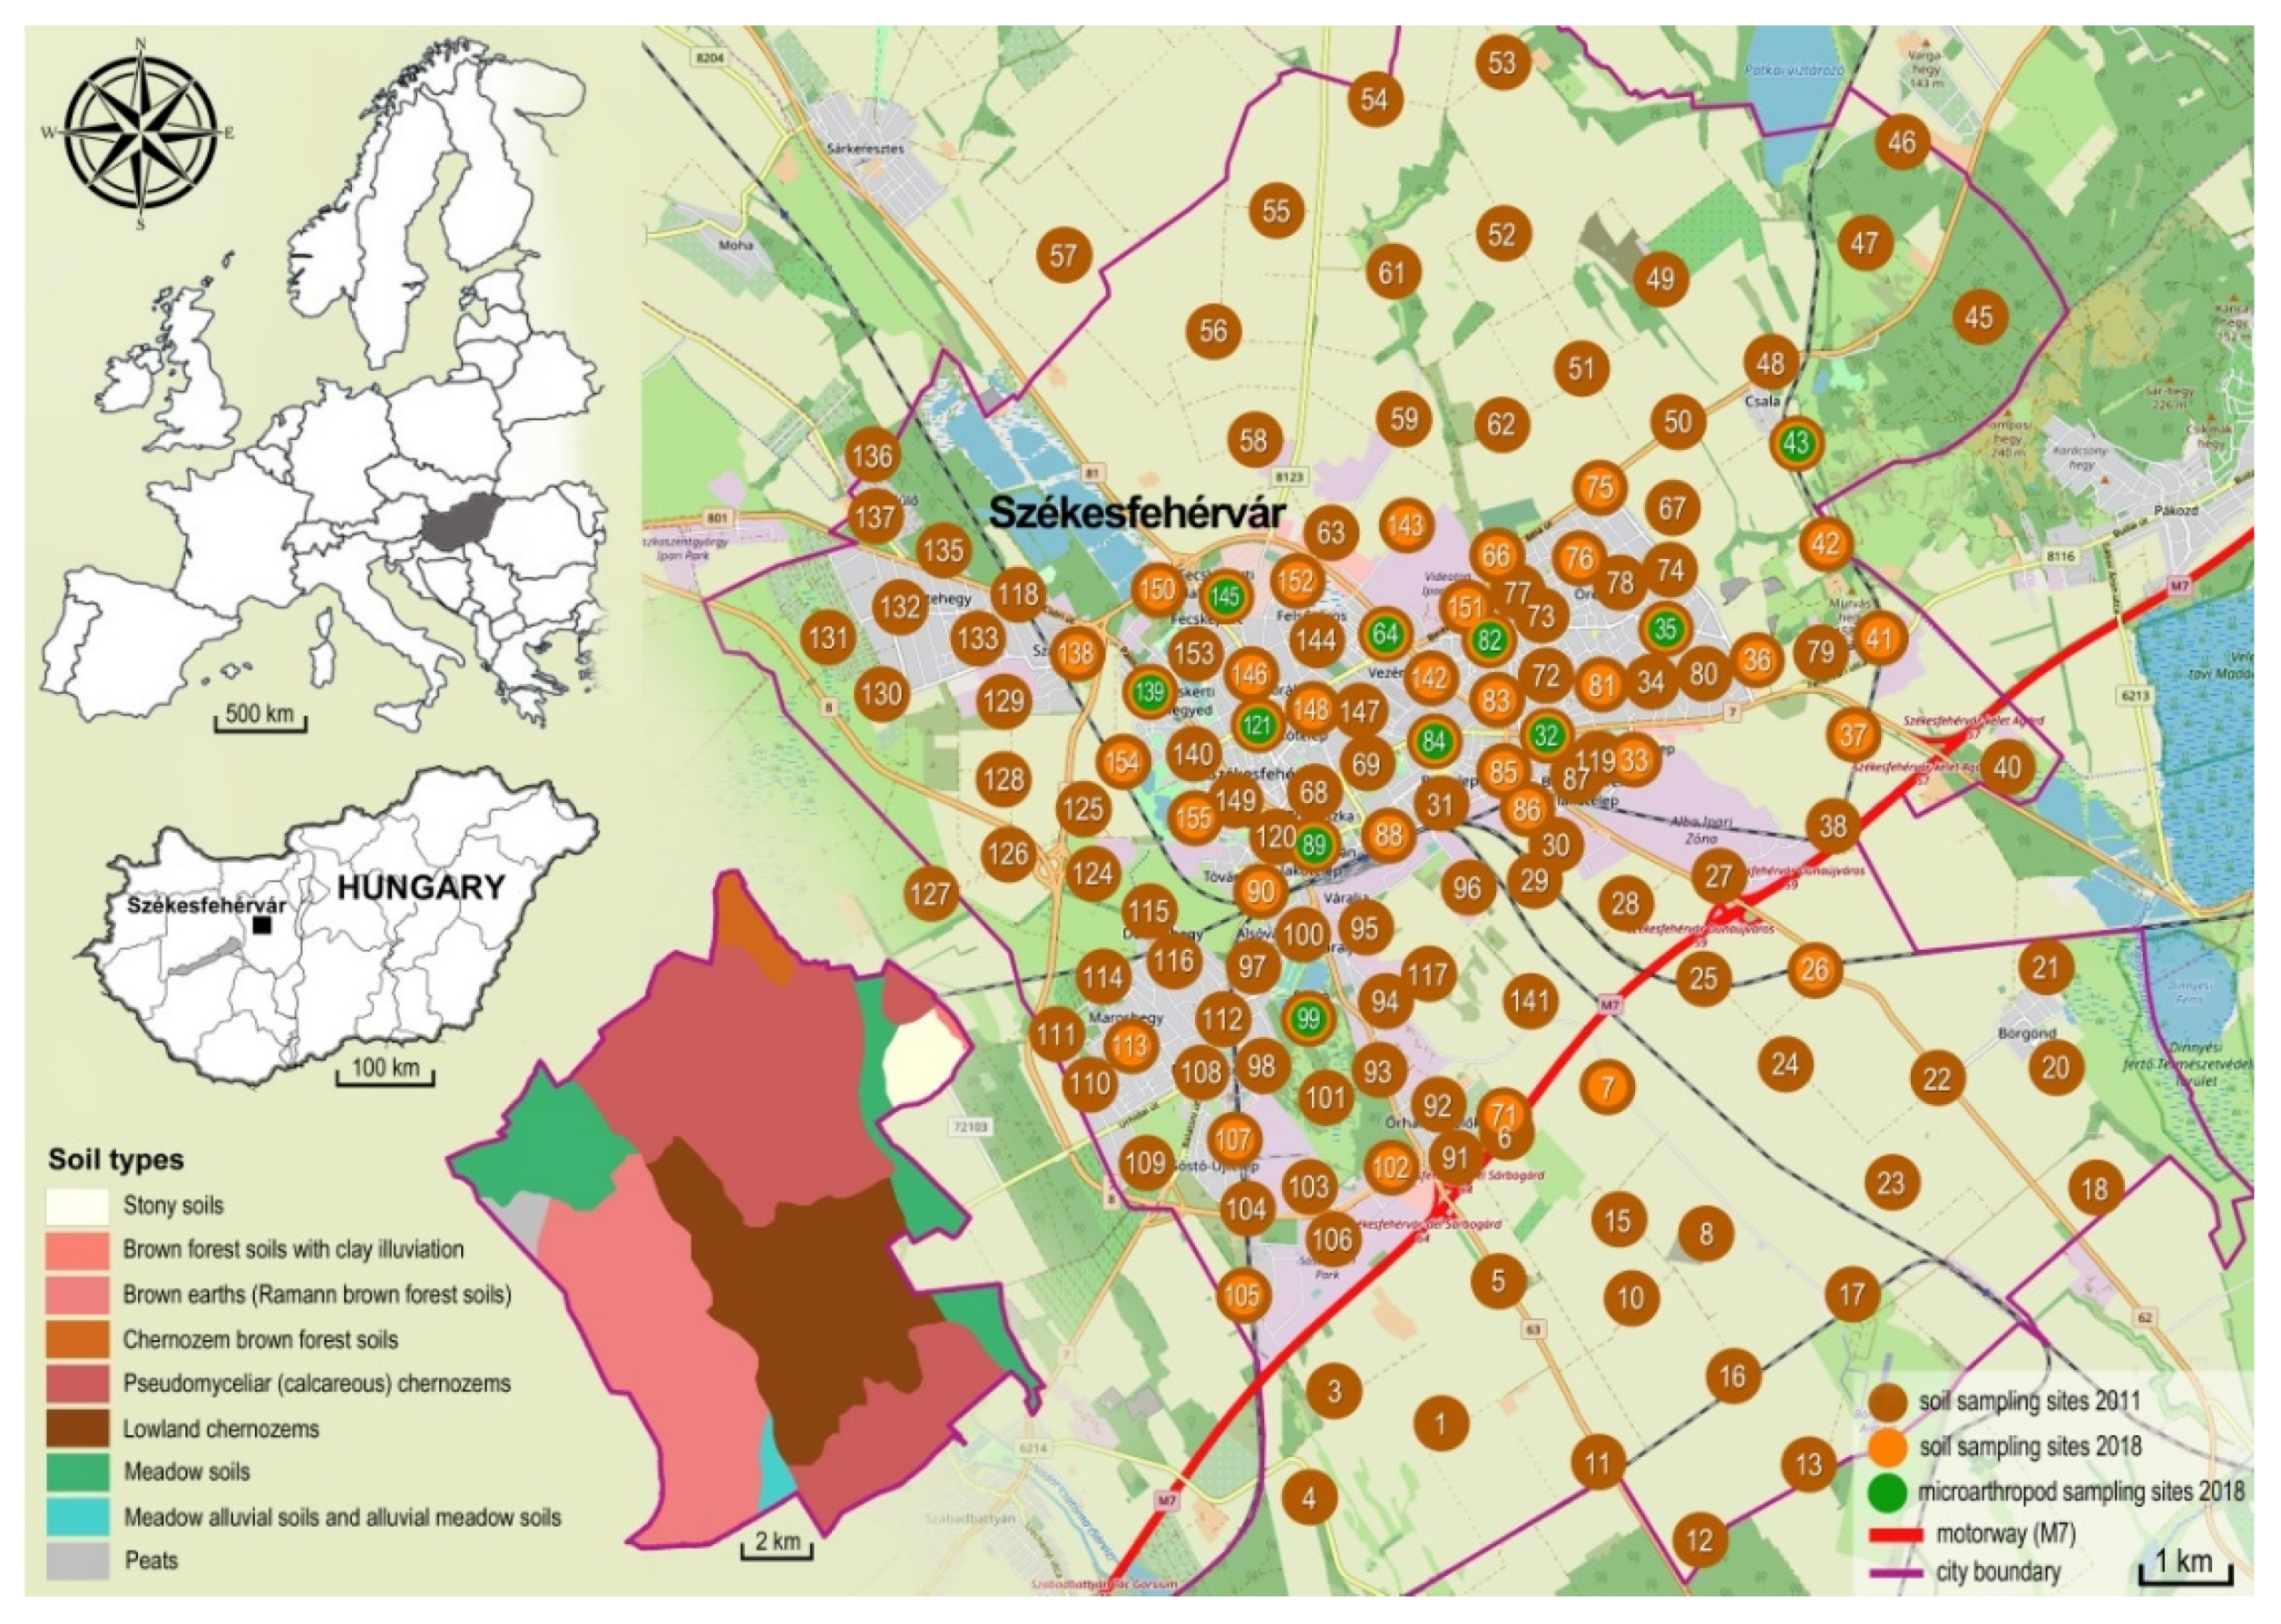
2.1. Study Area
2.2. Methods and Data Analysis
2.2.1. Soil Analysis
2.2.2. Enrichment Factor Calculation
2.2.3. Soil Microarthropod Sampling and Identification
3. Results
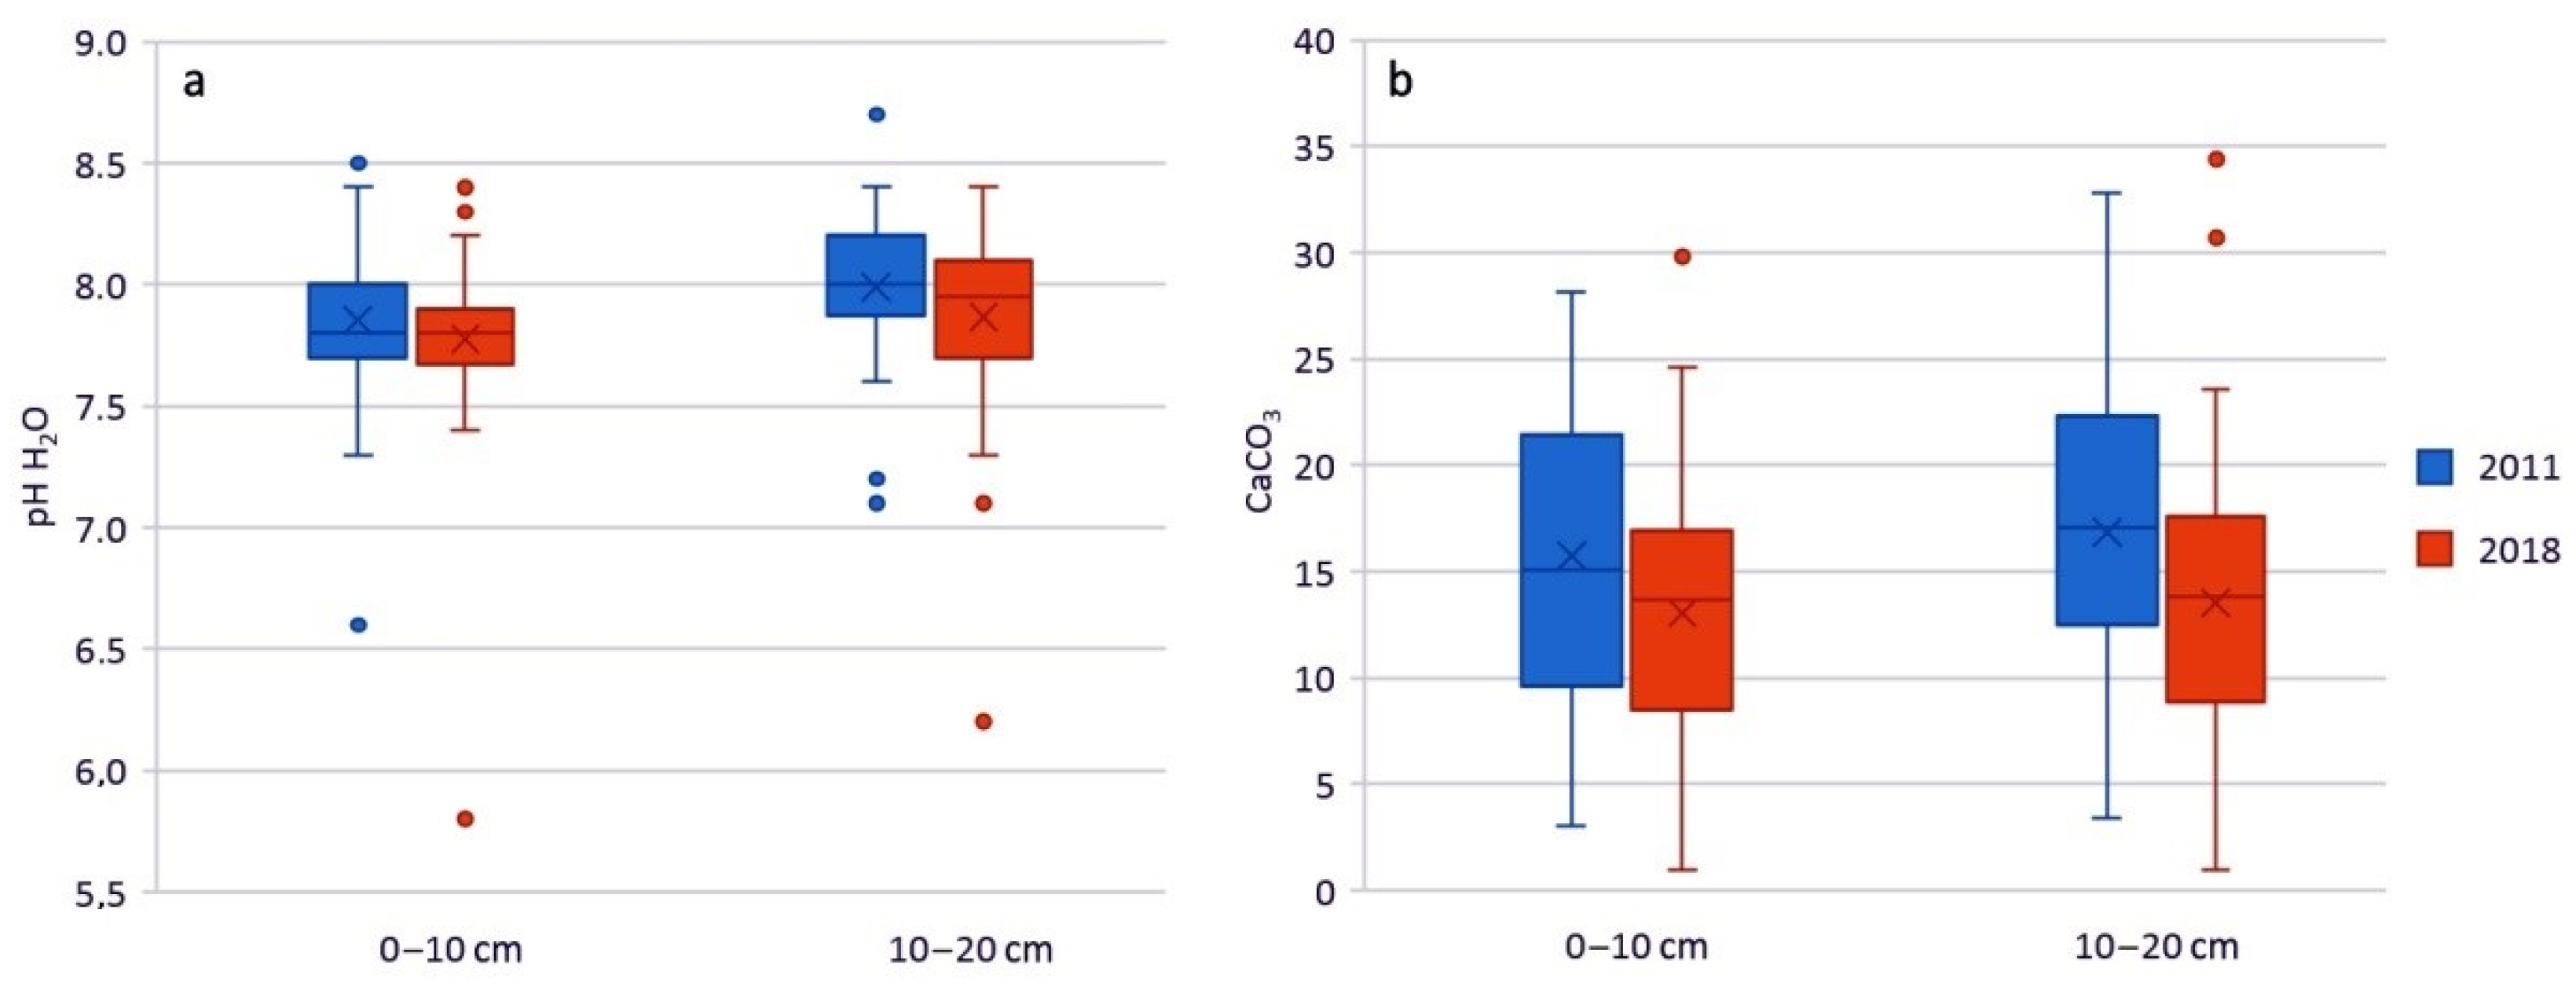
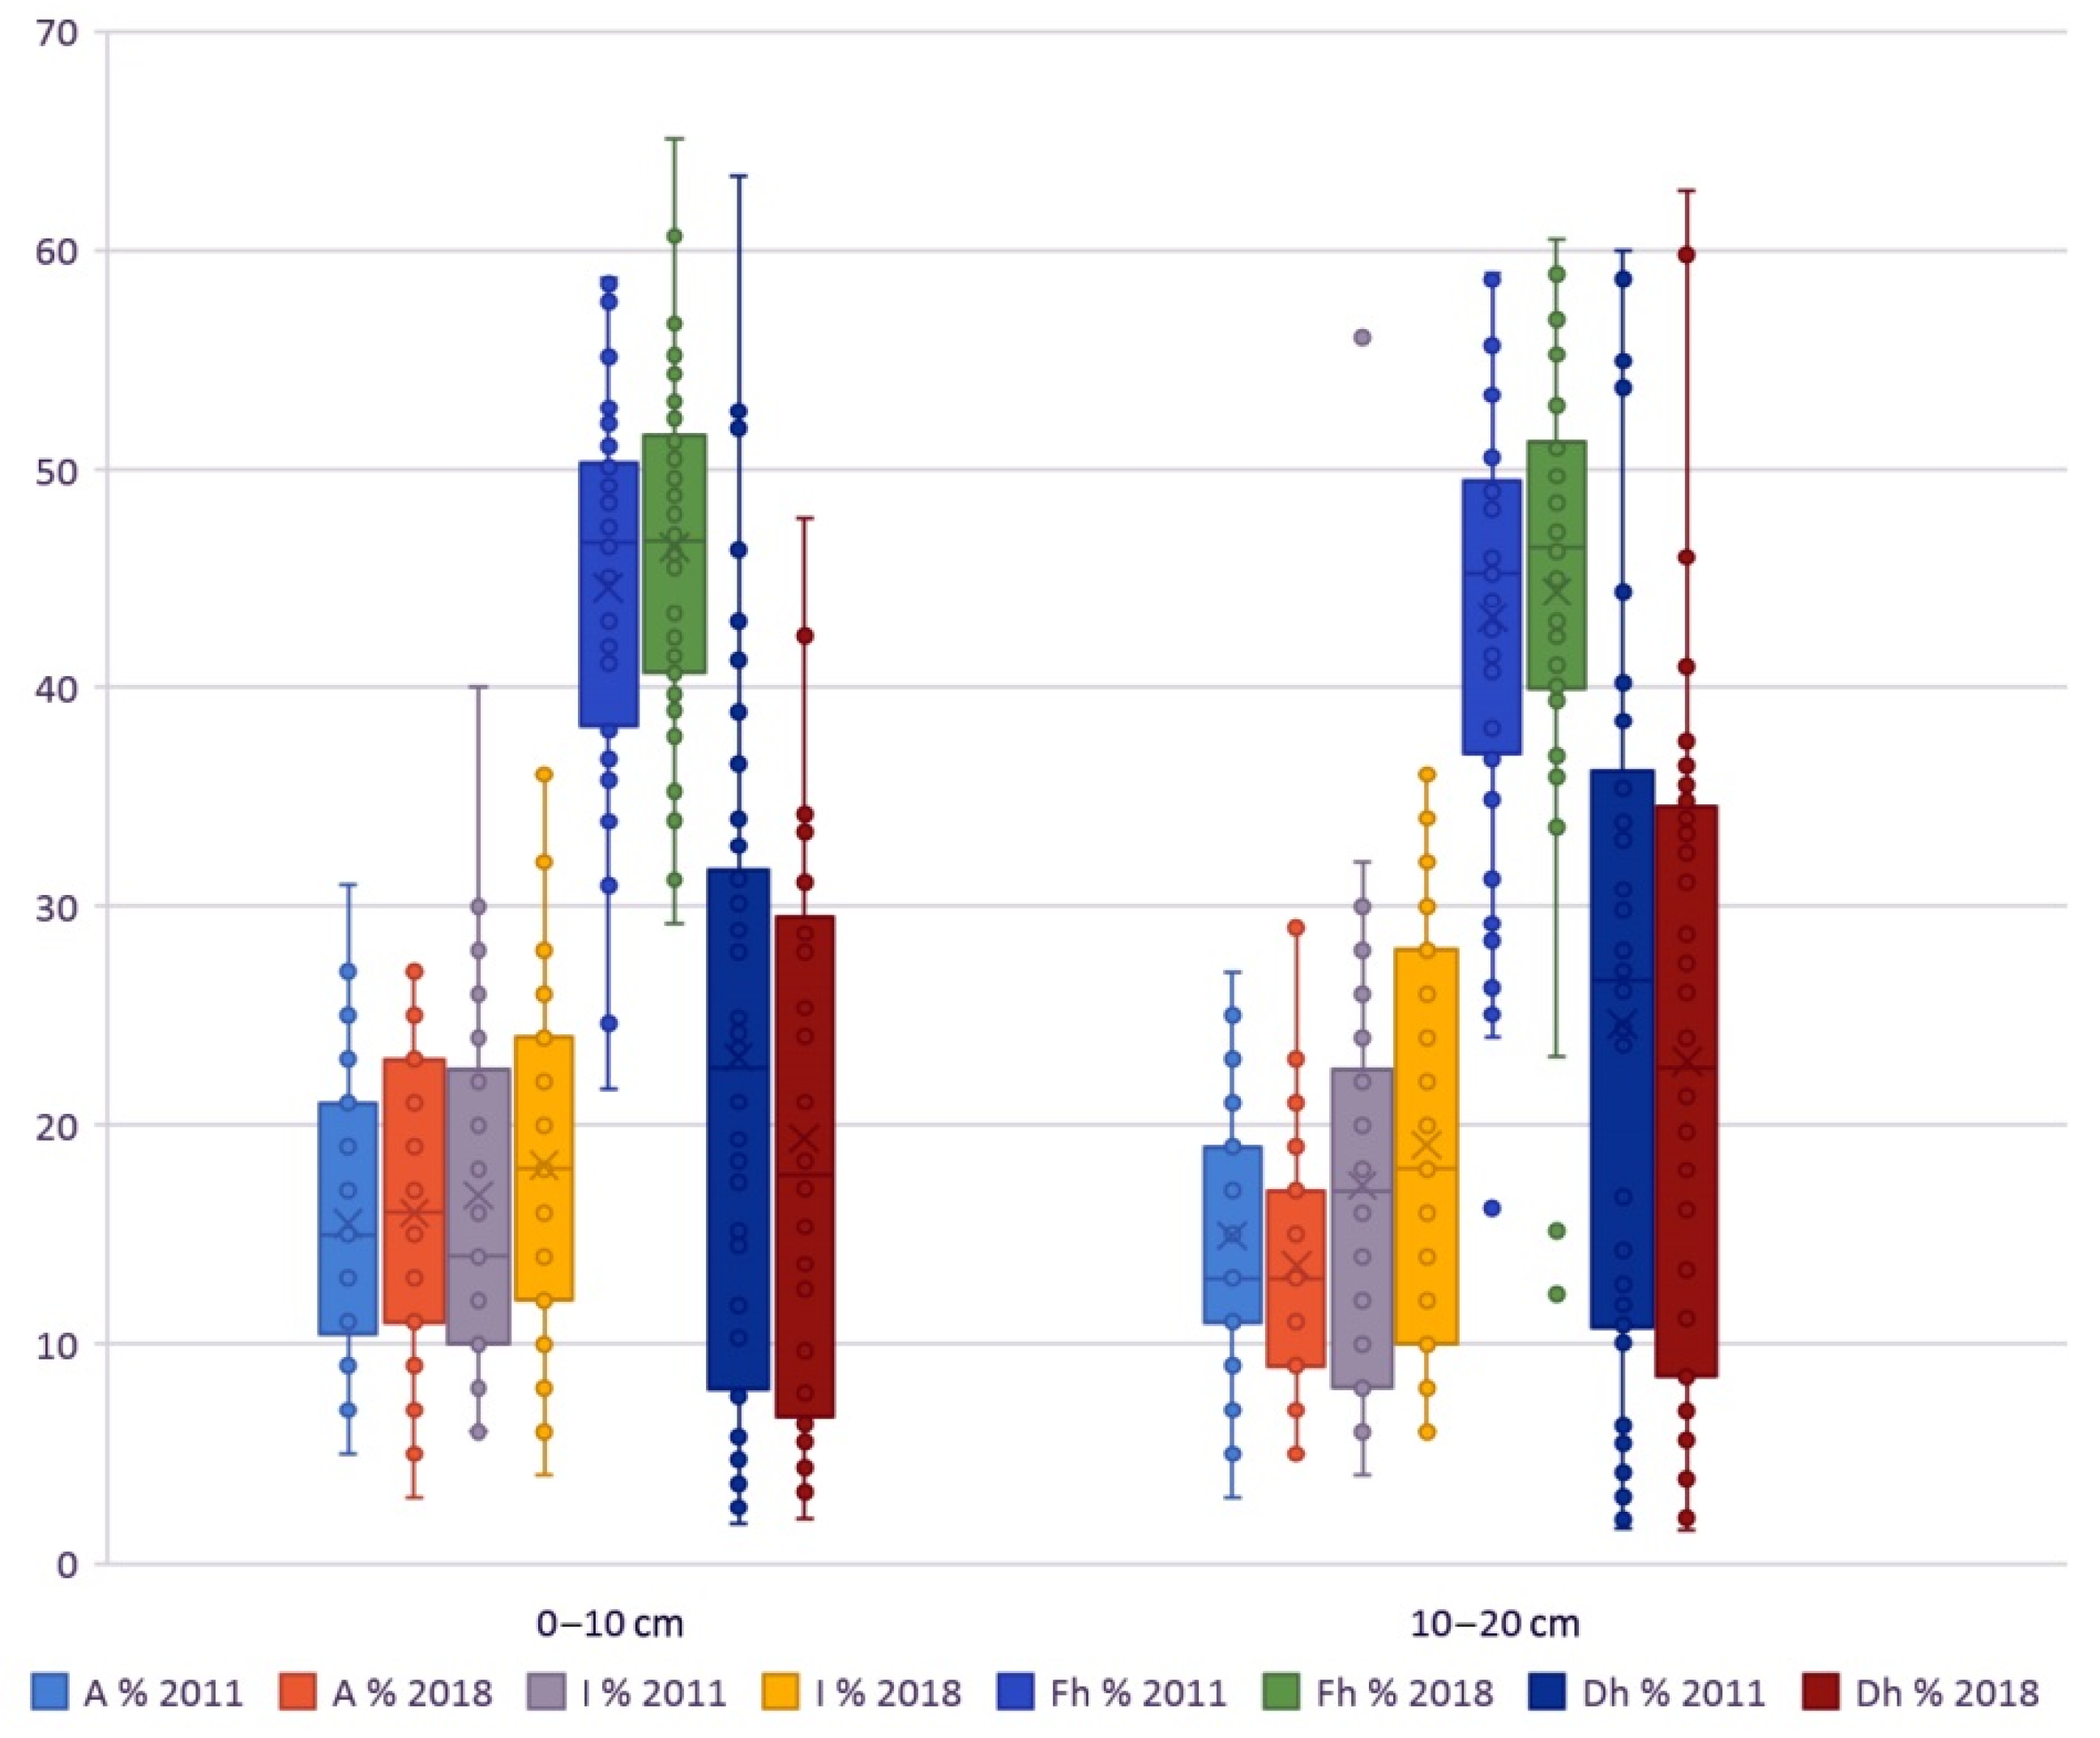
3.1. Soil Data
3.2. Enrichment Factor Calculation
3.3. Soil Microarthropods
4. Discussion
4.1. Evaluation of Soil Analysis
4.2. Soil Microarthropods and Soil Biological Quality
5. Conclusions
Author Contributions
Funding
Acknowledgments
Conflicts of Interest
References
- Zinicovscaia, I.; Aničić Urošević, M.; Vergel, K.; Vieru, E.; Frontasyeva, M.V.; Povar, I.; Duca, G. Active moss biomonitoring of trace elements air pollution in Chisinau, Republic of Moldova. Ecol. Chem. Eng. S 2018, 25, 361–372. [Google Scholar] [CrossRef] [Green Version]
- Cai, K.; Li, C. Street dust heavy metal pollution source apportionment and sustainable management in a typical city—Shijiazhuang, China. Int. J. Environ. Res. Public Health 2019, 16, 2625. [Google Scholar] [CrossRef] [Green Version]
- Liu, D.; Li, Y.; Ma, J.; Li, C.; Chen, X. Heavy metal pollution in urban soil from 1994 to 2012 in Kaifeng city, China. Water Air Soil Pollut. 2016, 227, 154. [Google Scholar] [CrossRef]
- Bezuglova, O.S.; Tagiverdiev, S.S.; Gorbov, S.N. Physical properties of urban soils in Rostov agglomeration. Eurasian Soil Sci. 2018, 51, 1105–1110. [Google Scholar] [CrossRef]
- Cipullo, S.; Snapir, B.; Tardif, S.; Campo, P.; Prpich, G.; Coulon, F. Insights into mixed contaminants interactions and its implication for heavy metals and metalloids mobility, bioavailability and risk assessment. Sci. Total Environ. 2018, 645, 662–673. [Google Scholar] [CrossRef] [Green Version]
- Eghbal, N.; Nasrabadi, T.; Karbassi, A.R.; Taghavi, L. Investigating the pattern of soil metallic pollution in urban areas (case study: A district in Tehran city). Int. J. Environ. Sci. Technol. 2019, 16, 6717–6726. [Google Scholar] [CrossRef]
- Tume, P.; González, E.; King, R.W.; Monsalve, V.; Roca, N.; Bech, J. Spatial distribution of potentially harmful elements in urban soils, city of Talcahuano, Chile. J. Geochem. Explor. 2018, 184, 333–344. [Google Scholar] [CrossRef]
- O’Riordan, R.; Davies, J.; Stevens, C.; Quinton, J.N.; Boyko, C. The ecosystem services of urban soils: A review. Geoderma 2021, 395, 115076. [Google Scholar] [CrossRef]
- Adimalla, N.; Qian, H.; Wang, H. Assessment of heavy metal (HM) contamination in agricultural soil lands in northern Telangana, India: An approach of spatial distribution and multivariate statistical analysis. Environ. Monit. Assess. 2019, 191, 246. [Google Scholar] [CrossRef]
- Ciupa, T.; Suligowski, R.; Kozłowski, R. Trace metals in surface soils under different land uses in Kielce city, south-central Poland. Environ. Earth Sci. 2020, 79, 14. [Google Scholar] [CrossRef]
- Novák, T.J.; Balla, D.; Kamp, J. Changes in anthropogenic influence on soils across Europe 1990–2018. Appl. Geogr. 2020, 124, 102294. [Google Scholar] [CrossRef]
- Tume, P.; Acevedo, V.; Roca, N.; Ferraro, F.X.; Bech, J. Potentially toxic elements concentrations in schoolyard soils in the city of Coronel, Chile. Environ. Geochem. Health 2021. [Google Scholar] [CrossRef]
- Konstantinova, E.; Minkina, T.; Sushkova, S.; Konstantinov, A.; Rajput, V.D.; Sherstnev, A. Urban soil geochemistry of an intensively developing Siberian city: A case study of Tyumen, Russia. J. Environ. Manag. 2019, 239, 366–375. [Google Scholar] [CrossRef]
- Wieczorek, K.; Turek, A.; Szczesio, M.; Wolf, W.M. Comprehensive Evaluation of Metal Pollution in Urban Soils of a Post-Industrial City—A Case of Łódź, Poland. Molecules 2020, 25, 4350. [Google Scholar] [CrossRef] [PubMed]
- Zhou, W.; Yang, K.; Bai, Z.; Cheng, H.; Liu, F. The development of topsoil properties under different reclaimed land uses in the Pingshuo opencast coalmine of Loess Plateau of China. Ecol. Eng. 2017, 100, 237–245. [Google Scholar] [CrossRef]
- Romzaykina, O.N.; Vasenev, V.I.; Khakimova, R.R.; Hajiaghayeva, R.; Stoorvogel, J.J.; Dovletyarova, E.A. Spatial variability of soil properties in the urban park before and after reconstruction. Soil Environ. 2017, 36, 155–165. [Google Scholar] [CrossRef]
- Gabarrón, M.; Zornoza, R.; Martínez-Martínez, S.; Muñoz, V.A.; Faz, Á.; Acosta, J.A. Effect of land use and soil properties in the feasibility of two sequential extraction procedures for metals fractionation. Chemosphere 2019, 216, 266–272. [Google Scholar] [CrossRef] [PubMed]
- McIntyre, N.E. Ecology of urban arthropods: A review and a call to action. Ann. Entomol. Soc. Am. 2000, 93, 825–835. [Google Scholar] [CrossRef]
- Santorufo, L.; Van Gestel, C.A.M.; Rocco, A.; Maisto, G. Soil invertebrates as bioindicators of urban soil quality. Environ. Pollut. 2012, 161, 57–63. [Google Scholar] [CrossRef] [PubMed]
- Jouquet, P.; Dauber, J.; Lagerlof, J.; Lavelle, J.P.; Lepage, M. Soil invertebrates as ecosystem engineers: Intended and accidental effects on soil and feedback loops. Appl. Soil Ecol. 2006, 32, 153–164. [Google Scholar] [CrossRef]
- Lavelle, P.; Decaens, T.; Aubert, M.; Barot, S.; Blouin, M.; Bureau, F.; Margerie, P.; Mora, P.; Rossi, J.P. Soil invertebrates and ecosystem services. Eur. J. Soil Biol. 2006, 42, 3–15. [Google Scholar] [CrossRef]
- Van Straalen, N.M. The Use of Soil Invertebrates in Ecological Surveys of Contaminated Soils. In Developments in Soil Science; Doelman, P., Eijsackers, H.J.P., Eds.; Elsevier: Amsterdam, The Netherlands, 2004; pp. 159–195. [Google Scholar] [CrossRef]
- Sterzyńska, M.; Nicia, P.; Zadrożny, P.; Fiera, C.; Shrubovych, J.; Ulrich, W. Urban springtail species richness decreases with increasing air pollution. Ecol. Indic. 2018, 94, 328–335. [Google Scholar] [CrossRef]
- Stamou, G.P.; Argyropoulou, M.D. A preliminary study on the effect of Cu, Pb and Zn contamination of soils on community structure and certain life-history traits of oribatids from urban areas. Exp. Appl. Acarol. 1995, 19, 381–390. [Google Scholar] [CrossRef]
- Eitminaviciute, I. Microarthropod communities in anthropogenic urban soils. 1. Structure of microarthropod complexes in soils of roadside lawns. Entomol. Rev. 2006, 86 (Suppl. S2), S128–S135. [Google Scholar] [CrossRef]
- Fiera, C. Preliminary data on the species diversity of Collembola (Hexapoda, Collembola) along an urban gradient in Bucharest. Trav. Mus. Natl. Hist. Nat. Grigore Antipa 2008, 51, 363–367. [Google Scholar]
- Santorufo, L.; Cortet, J.; Arena, C.; Goudon, R.; Rakoto, A.; Morel, J.-L.; Maisto, G. An assessment of the influence of the urban environment on collembolan communities in soils using taxonomy- and trait-based approaches. Appl. Soil Ecol. 2014, 78, 48–56. [Google Scholar] [CrossRef]
- Menta, C.; Remelli, S. Soil Health and Arthropods: From Complex System to Worthwhile Investigation. Insects 2020, 11, 54. [Google Scholar] [CrossRef] [Green Version]
- Zhang, W.; Han, J.; Molla, A.; Zuo, S.; Ren, Y. The Optimization Strategy of the Existing Urban Green Space Soil Monitoring System in Shanghai, China. Int. J. Environ. Res. Public Health 2021, 18, 4820. [Google Scholar] [CrossRef]
- Huot, H.; Joyner, J.; Córdoba, A.; Shaw, R.K.; Wilson, M.A.; Walker, R.; Muth, T.R.; Cheng, Z. Characterizing urban soils in New York City: Profile properties and bacterial communities. J. Soils Sediments 2017, 17, 393–407. [Google Scholar] [CrossRef]
- Da Silva Ferreira, M.; Fontes, M.P.F.; Pacheco, A.A.; Ker, J.C.; Lima, H.N. Health risks of potentially toxic trace elements in urban soils of Manaus city, Amazon, Brazil. Environ. Geochem. Health 2021. [Google Scholar] [CrossRef]
- Silva, M.M.V.G.; Carvalho, P.C.S.; António, A.; Luís, A.C.M. Geochemistry of leptosols and fluvisols in the fast growing city of Benguela (Angola) and assessment of potential risks. Geoderma Reg. 2020, 20, e00257. [Google Scholar] [CrossRef]
- Hindersmann, B.; Förster, A.; Achten, C. Novel and specific source identification of PAH in urban soils: Alk-PAH-BPCA index and “V”-shape distribution pattern. Environ. Pollut. 2020, 257. [Google Scholar] [CrossRef] [PubMed]
- Fazeli, G.; Karbassi, A.; Khoramnejadian, S.; Nasrabadi, T. Evaluation of Urban Soil Pollution: A Combined Approach of Toxic Metals and Polycyclic Aromatic Hydrocarbons (PAHs). Int. J. Environ. Res. 2019, 13, 801–811. [Google Scholar] [CrossRef]
- Zhang, Y.; Chen, Q. Contents of heavy metals in urban parks and university campuses. IOP Conf. Ser. Earth Environ. Sci. 2018, 108, 42060. [Google Scholar] [CrossRef]
- Cheng, H.; Li, L.; Zhao, C.; Li, K.; Peng, M.; Qin, A.; Cheng, X. Overview of trace metals in the urban soil of 31 metropolises in China. J. Geochem. Explor. 2014, 139, 31–52. [Google Scholar] [CrossRef] [Green Version]
- Horváth, A.; Kalicz, P.; Farsang, A.; Balázs, P.; Berki, I.; Bidló, A. Influence of human impacts on trace metal accumulation in soils of two Hungarian cities. Sci. Total Environ. 2018, 637–638, 1197–1208. [Google Scholar] [CrossRef]
- Szita, R.; Horváth, A.; Winkler, D.; Kalicz, P.; Gribovszki, Z.; Csáki, P. A complex urban ecological investigation in a mid-sized Hungarian city—SITE assessment and monitoring of a liveable urban area, PART 1: Water quality measurement. J. Environ. Manag. 2019, 247, 78–87. [Google Scholar] [CrossRef] [PubMed]
- Dövényi, Z. (Ed.) Microregions of Hungary; Hungarian Academy of Science: Budapest, Hungary, 2010. (In Hungarian) [Google Scholar]
- IUSS Working Group WRB. World Reference Base for Soil Resources 2006; First update 2007; World Soil Resources Reports No. 103; FAO: Rome, Italy, 2014. [Google Scholar]
- Novák, T.J. Soil Practicum; Meridián Alapítvány: Debrecen, Hungary, 2013. (In Hungarian) [Google Scholar]
- Farkas, G. (Ed.) Handbook of Fejér Country. Country Handbooks of Hungary; Ceba Publisher: Budapest, Hungary, 1997. (In Hungarian) [Google Scholar]
- Horváth, A.; Szűcs, P.; Bidló, A. Soil condition and pollution in urban soils: Evaluation of the soil quality in a Hungarian town. J. Soils Sediments 2015, 15, 1825–1835. [Google Scholar] [CrossRef] [Green Version]
- Horváth, A.; Szita, R.; Bidló, A.; Gribovszki, Z. Changes in soil and sediment properties due the impact of the urban environment. Environ. Earth Sci. 2016, 75, 1211. [Google Scholar] [CrossRef] [Green Version]
- Van Reeuwijk, L.P. (Ed.) Procedures for Soil Analysis, 6th ed.; Technical Paper 9; ISRIC: Wageningen, The Netherlands, 2002. [Google Scholar]
- Hungarian Standard MSZ-08-0205. Determination of soil pH, Total Salinity and CaCO3 Content; Hungarian Standard Association: Budapest, Hungary, 1978. (In Hungarian) [Google Scholar]
- Hungarian Standard MSZ-08-0206. Determination of Particle Size Distribution of Soils; Hungarian Standard Association: Budapest, Hungary, 1978. (In Hungarian) [Google Scholar]
- FAO. Guidelines for Soil Description, 3rd ed.; Soil Resources, Management and Conservation Service, Land and Water Development Division; FAO: Rome, Italy, 1990. [Google Scholar]
- Hungarian Standard MSZ-08-0452. Determination of Humus Content in Soils; Hungarian Standard Association: Budapest, Hungary, 1980. (In Hungarian) [Google Scholar]
- Hungarian Standard MSZ-EN-16169. Determination of Total Nitrogen Content in Soils; Hungarian Standard Association: Budapest, Hungary, 2013. (In Hungarian) [Google Scholar]
- Hungarian Standard MSZ-20135. Determination of the Soluble Nutrient Element Content of the Soil; Hungarian Standard Association: Budapest, Hungary, 1999. (In Hungarian) [Google Scholar]
- Hungarian Standard MSZ 21470-50. Environmental Testing of Soils. Determination of Total and Soluble Toxic Element, Heavy Metal and Chromium (VI) Content; Hungarian Standard Association: Budapest, Hungary, 2006. (In Hungarian) [Google Scholar]
- Menta, C.; Conti, F.D.; Pinto, S. Microarthropods biodiversity in natural, seminatural and cultivated soils—QBS-ar approach. Appl. Soil Ecol. 2018, 123, 740–743. [Google Scholar] [CrossRef]
- Lakanen, E.; Erviö, R. A comparison of eight extractants for the determination of plant available micronutrients in soil. Acta Agr. Fenn. 1971, 123, 223–232. [Google Scholar]
- Kádár, I. Remediation Handbook 2. Investigation of Contaminated Soils; Ministry of Environment: Budapest, Hungary, 1998. (In Hungarian)
- Joint Decree No. 10/2000. (VI. 2) KöM-EüM-FVM-KHVM of the Ministers of Environmental Protection, Public Health, Agriculture and Regional Development, and of Traffic, Communication and Water Management on the Limit Values Necessary to Protect the Quality of Groundwater and the Geological Medium; Hungarian Government: Budapest, Hungary, 2000. (In Hungarian)
- Joint Decree No. 6/2009. (IV. 14) KvVM-EüM-FVM of the Ministers of Environmental Protection and Water Management, Public Health, Agriculture and Regional Development on the Limit Values Necessary to Protect the Quality of Geological Medium and the Groundwater and on Measurement of Pollution; Hungarian Government: Budapest, Hungary, 2009. (In Hungarian)
- Sterckeman, T.; Douay, F.; Baize, D.; Fourrier, H.; Proix, N.; Schvartz, C. Trace elements in soils developed in sedimentary materials from Northern France. Geoderma 2006, 136, 912–929. [Google Scholar] [CrossRef]
- Kabata-Pendias, A.; Pendias, H. Trace Elements in Soils and Plants, 3rd ed.; CRC Press: Boca Raton, FL, USA, 2001. [Google Scholar]
- Taylor, S.R.; McLennan, S.M. The geochemical evolution of the continental crust. Rev. Geophys. 1995, 33, 241–265. [Google Scholar] [CrossRef]
- Facchinelli, A.; Sacchi, E.; Mallen, L. Multivariate statistical and GIS-based approach to identify heavy metal sources in soils. Environ. Pollut. 2001, 114, 313–324. [Google Scholar] [CrossRef]
- Shannon, C.E.; Weaver, W. The Mathematical Theory of Communication; University of Illionis Press: Urbana, IL, USA, 1949. [Google Scholar]
- Pielou, E.C. The measurement of diversity in different types of biological collections. J. Theor. Biol. 1966, 13, 131–144. [Google Scholar] [CrossRef]
- Parisi, V.; Menta, C.; Gardi, C.; Jacomini, C.; Mozzanica, E. Microarthropod communities as a tool to assess soil quality and biodiversity: A new approach in Italy. Agric. Ecosyst. Environ. 2005, 105, 323–333. [Google Scholar] [CrossRef]
- Ter Braak, C.J.F.; Šmilauer, P. CANOCO Reference Manual and Canodraw for Windows User’s Guide: Software for Canonical Community Ordination; Version 4.5; Microcomputer Power: Ithaca, NY, USA, 2002. [Google Scholar]
- Tume, P.; González, E.; King, R.W.; Cuitiño, L.; Roca, N.; Bech, J. Distinguishing between natural and anthropogenic sources for potentially toxic elements in urban soils of Talcahuano, Chile. J. Soils Sediments 2018, 18, 2335–2349. [Google Scholar] [CrossRef]
- Rékási, M.; Filep, T. Factors determining Cd, Co, Cr, Cu, Ni, Mn, Pb and Zn mobility in uncontaminated arable and forest surface soils in Hungary. Environ. Earth Sci. 2015, 74, 6805–6817. [Google Scholar] [CrossRef]
- Wang, H.; Marshall, C.W.; Cheng, M.; Xu, H.; Li, H.; Yang, X.; Zheng, T. Changes in land use driven by urbanization impact nitrogen cycling and the microbial community composition in soils. Sci. Rep. 2017, 7, 44049. [Google Scholar] [CrossRef] [PubMed]
- Li, H.F.; Gray, C.; Mico, C.; Zhao, F.J.; McGrath, S.P. Phytotoxicity and bioavailability of cobalt to plants in a range of soils. Chemosphere 2009, 75, 979–986. [Google Scholar] [CrossRef]
- González-Costa, J.J.; Reigosa, M.J.; Matías, J.M.; Fernández-Covelo, E. Analysis of the Importance of Oxides and Clays in Cd, Cr, Cu, Ni, Pb and Zn Adsorption and Retention with Regression Trees. PLoS ONE 2017, 12, e0168523. [Google Scholar] [CrossRef] [Green Version]
- Ódor, L.; Horváth, I. Element distribution and environmental conditions in geochemical mapping. In Material Flows and Their Impact on Nature; Pantó, G., Ed.; Hungarian Academy of Sciences: Budapest, Hungary, 2003; pp. 151–188. (In Hungarian) [Google Scholar]
- Napier, F.; D’Arcy, B.; Jefferies, C. A review of vehicle related metals and polycyclic aromatic hydrocarbons in the UK environment. Desalination 2008, 226, 143–150. [Google Scholar] [CrossRef]
- Meuser, H. Contaminated Urban Soils; Springer: Dordrecht, The Netherlands, 2010. [Google Scholar]
- Thorton, I. Metal contamination of soils in urban areas. In Soils in the Urban Environment; Bullock, P., Gregory, P.J., Eds.; Blackwell: Oxford, UK, 1991. [Google Scholar]
- Chaney, R.L.; Sterret, S.B.; Mielke, H.W. The potential for heavy metal exposure from urban gardens and soils. In Proceedings of the Symposium on Heavy Metal in Urban Gardens; Preer, J.R., Ed.; University of the District of Columbia Extension Service: Washington, DC, USA, 1984; pp. 37–84. [Google Scholar]
- Farsang, A.; Puskás, I. Characteristics of soils in urban ecosystems—A Complex analysis of soils in Szeged. Földr. Köz. 2009, 133, 397–409. (In Hungarian) [Google Scholar]
- Biasioli, M.; Barberis, R.; Ajmone-Marsan, F. The influence of a large city on some soil properties and metals content. Sci. Total Environ. 2006, 356, 154–164. [Google Scholar] [CrossRef]
- Guagliardi, I.; Cicchella, D.; De Rosa, R.; Buttafuoco, G. Assessment of lead pollution in topsoils of a southern Italy area: Analysis of urban and peri-urban environment. J. Environ. Sci. 2015, 33, 179–187. [Google Scholar] [CrossRef]
- Rusek, J.; Marshall, V.G. Impacts of airborne pollutants on soil fauna. Ann. Rev. Ecol. Syst. 2000, 31, 395–423. [Google Scholar] [CrossRef]
- Smit, C.E.; van Gestel, C.A.M. Effects of soil type, prepercolation, and ageing on bioaccumulation and toxicity of zinc for the springtail Folsomia candida. Environ. Toxicol. Chem. 1998, 17, 1132–1141. [Google Scholar] [CrossRef]
- Martikainen, E.A.T.; Krogh, P.H. Effects of soil organic matter content and temperature on toxicity of dimethoate to Folsomia fimetaria (Collembola: Isotomiidae). Environ. Toxicol. Chem. 1999, 18, 865–872. [Google Scholar] [CrossRef]
- Lock, K.; Janssens, F.; Janssen, C.R. Effects of metal contamination on the activity and diversity of springtails in an ancient Pb-Zn mining area at Plombières, Belgium. Eur. J. Soil Biol. 2003, 39, 25–29. [Google Scholar] [CrossRef]
- Domene, X.; Colón, J.; Uras, M.V.; Izquierdo, R.; Àvila, A.; Alcañiz, J.M. Role of soil properties in sewage sludge toxicity to soil collembolans. Soil Biol. Biochem. 2010, 42, 1982–1990. [Google Scholar] [CrossRef] [Green Version]
- Hopkin, S.P. Biology of the Springtails (Insecta: Collembola); Oxford University Press: Oxford, UK, 1997. [Google Scholar]
- Vijver, M.; Jager, T.; Posthuma, L.; Peijnenburg, W. Impact of metal pools and soil properties on metal accumulation in Folsomia candida (Collembola). Environ. Toxicol. Chem. 2001, 20, 712–720. [Google Scholar] [CrossRef]
- Eisenbeis, G. Physiological absorption of liquid water by Collembola: Absorption by the ventral tube at different salinities. J. Insect Physiol. 1982, 28, 11–20. [Google Scholar] [CrossRef]
- Filser, J. The effect of the systemic fungicide Aktuan on Collembola under field conditions. Acta Zool. Fenn. 1994, 195, 32–34. [Google Scholar]
- Cromack, K.; Sollins, P.; Todd, R.L.; Crossley, D.A.; Fender, W.M.; Fogel, R.; Todd, A.W. Soil Microorganism-Arthropod Interactions: Fungi as Major Calcium and Sodium Sources. In The Role of Arthropods in Forest Ecosystems; Proceedings in Life, Sciences; Mattson, W.J., Ed.; Springer: Berlin/Heidelberg, Germany, 1977; pp. 78–84. [Google Scholar] [CrossRef]
- Bååth, E. Tolerance of copper by entomogenous fungi and the use of copper-amended media for isolation of entomogenous fungi from soil. Mycol. Res. 1991, 95, 1140–1142. [Google Scholar] [CrossRef]
- Urík, M.; Bujdoš, M.; Milová-Žiaková, B.; Mikušová, P.; Slovák, M.; Matúš, P. Aluminium leaching from red mud by filamentous fungi. J. Inorg. Biochem. 2015, 152, 154–159. [Google Scholar] [CrossRef] [PubMed]
- Van Straalen, N.M.; Verhoef, H.A.; Joosse, E.N.G. Functionele classificatie van bodemdieren en de ecologische functie van de bodem. Vakbl. Biol. 1985, 65, 131–135. [Google Scholar]
- Bargagli, R. Trace Elements in Terrestrial Plants; Springer and Landes Company: Berlin, Germany, 1998. [Google Scholar]
- Migliorini, M.; Piginoa, G.; Carusob, T.; Fanciullia, P.P.; Leonzio, C.; Berninia, F. Soil communities (Acari Oribatida; Hexapoda Collembola) in a clay pigeon shooting range. Pedobiologia 2004, 49, 1–13. [Google Scholar] [CrossRef]
- Gillet, S.; Ponge, J.F. Changes in species assemblages and diets of Collembola along a gradient of metal pollution. Appl. Soil Ecol. 2003, 22, 127–138. [Google Scholar] [CrossRef] [Green Version]
- McIntyre, N.E.; Rango, J.; Fagan, W.F.; Faeth, S.H. Ground arthropod community structure in a heterogeneous urban environment. Landsc. Urban Plan. 2001, 52, 257–274. [Google Scholar] [CrossRef]
- Tarman, K. Oribatid fauna in polluted soil. Biol. Vestn. Ljubl. 1973, 21, 153–158. [Google Scholar]
- Bielska, I. Communities of moss mites (Acari, Oribatei) of grasslands under the impact of industrial pollution. III. Communities of moss mites of wastelands. Pol. Ecol. Stud. 1989, 15, 101–110. [Google Scholar]
- Mangová, B.; Krumpál, M. Oribatid mites (Acari) in urban environments—Bratislava city, West Slovakia. Entomofauna Carpathica 2017, 29, 27–50. [Google Scholar]
- Strojan, C.L. The impact of zinc smelter emissions on forest litter arthropods. Oikos 1978, 31, 41–46. [Google Scholar] [CrossRef]
- Visioli, G.; Menta, C.; Gardi, C.; Conti, F.D. Metal toxicity and biodiversity in serpentine soils: Application of bioassay tests and microarthropod index. Chemosphere 2013, 90, 1267–1273. [Google Scholar] [CrossRef]
- Hågvar, S.; Abrahamsen, G. Microarthropods and Enchytraeidae (Oligochaeta) in naturally lead-contaminated soil: A gradient study. Environ. Entomol. 1990, 19, 1263–1277. [Google Scholar] [CrossRef]
- Joosse, E.N.G.; Wulffraat, K.J.; Glas, H.P. Tolerance and acclimation to zinc of the isopod Porcellio scaber Latr. In Proceedings of the International Conference: Heavy Metals in the Environment, Amsterdam, The Netherlands, 15–18 September 1981; CEP Consultants Ltd.: Edinburgh, UK, 1981; pp. 425–428. [Google Scholar]
- Grelle, C.; Fabre, M.-C.; Leprêtre, A.; Descamps, M. Myriapod and isopod communities in soil contaminated by heavy metals in northern France. Eur. J. Soil Sci. 2000, 51, 425–433. [Google Scholar] [CrossRef]
- Hopkin, S.P.; Martin, M.H. The distribution of zinc, cadmium, lead and copper within the woodlouse Oniscus asellus (Crustacea, Isopoda). Oecologia 1982, 54, 227–232. [Google Scholar] [CrossRef]
- Cortet, J.; De Vaufleury, A.; Poinsotbalaguer, N.; Gomot, L.; Texier, C.; Cluzeau, D. The use of invertebrate soil fauna in monitoring pollutant effects. Eur. J. Soil Biol. 1999, 35, 115–134. [Google Scholar] [CrossRef]
- Bogyó, D.; Magura, T.; Simon, E.; Tóthmérész, B. Millipede (Diplopoda) assemblages alter drastically by urbanisation. Landsc. Urban Plan. 2015, 133, 118–126. [Google Scholar] [CrossRef] [Green Version]
- Eeva, T.; Sorvari, J.; Koivunen, V. Effects of heavy metal pollution on red wood ant (Formica s. str.) populations. Environ. Pollut. 2004, 132, 533–539. [Google Scholar] [CrossRef]
- Van Straalen, N. Community structure of soil arthropods as a bioindicator of soil health. In Biological Indicators of Soil Health; Pankhurst, C.E., Doube, B.M., Gupta, V.V.S.R., Eds.; CAB International: Wallingford, UK, 1997; pp. 235–264. [Google Scholar]
- Wahsha, M.; Bini, C.; Nadimi-Goki, M. The impact of olive mill wastewater on the physicochemical and biological properties of soils in Northwest Jordan. Int. J. Environ. Qual. 2014, 15, 25–31. [Google Scholar] [CrossRef]


| Type of Measurements (Units) | Standard | 2011/2018 |
|---|---|---|
| Skeletal percent (%) | MSZ-08-0205/2:1978 [46] | +/+ |
| pH (H2O, KCl)—potentiometrically | MSZ-08-0205/2:1978 [46] | +/+ |
| Total salinity (%) | MSZ-08-0205/2:1978 [46] | +/+ |
| CaCO3 (%)—Schleibler method | MSZ-08-0205/2:1978 [46] | +/+ |
| Humus (%)—(K2Cr2O7 + cc. H2SO4) | MSZ-08-0452:1980 [49] | +/+ |
| Texture (2–0.002 mm—%) | MSZ-08-0206:1978 [47] | +/+ |
| Total nitrogen (%) | MSZ-EN-16169:2013 [50] | +/− |
| Potassium (K2O, g/kg)—photometrically | MSZ-20135:1999 [51] | +/− |
| Phosphorus (P2O5, g/kg)—photometrically | MSZ-20135:1999 [51] | +/− |
| KCl-extractable calcium, magnesium (g/kg)—AAS | MSZ-20135:1999 [51] | +/− |
| EDTA/DTPA Fe, Mn, Cu, Zn (mg/kg)—AAS | MSZ-20135:1999 [51] | +/− |
| Available toxic element content (NH4-acetate + EDTA)—ICP | MSZ 21470-50:2006 [52] | +/+ |
| Mesofauna analysis (Soil Biological Quality—QBS) | Menta et al. [53] | −/+ |
| Land Use Category | Sampling Depth | n | Texture (%) | pH (H2O) | CaCO3 | SOM | |||
|---|---|---|---|---|---|---|---|---|---|
| qty | Clay% | Silt% | Fine Sand% | Coarse Sand% | % | % | |||
| Forested area | 0–10 cm | 7 | 13 | 9 | 37 | 41 | 7.3 | 12 | 5.88 |
| 10–20 cm | 7 | 11 | 11 | 35 | 43 | 7.4 | 12 | 4.33 | |
| Viticulture area | 0–10 cm | 2 | 14 | 16 | 34 | 36 | 7.9 | 8 | 2.97 |
| 10–20 cm | 2 | 13 | 12 | 36 | 39 | 7.9 | 8 | 3.19 | |
| Agricultural area | 0–10 cm | 37 | 22 | 21 | 47 | 10 | 8.0 | 13 | 4.26 |
| 10–20 cm | 37 | 22 | 20 | 47 | 11 | 8.1 | 15 | 3.70 | |
| Residential area | 0–10 cm | 40 | 13 | 13 | 44 | 30 | 7.9 | 25 | 3.99 |
| 10–20 cm | 40 | 13 | 14 | 44 | 29 | 7.9 | 17 | 3.94 | |
| Traffic zone | 0–10 cm | 19 | 15 | 13 | 46 | 26 | 7.9 | 15 | 3.67 |
| 10–20 cm | 19 | 14 | 13 | 46 | 27 | 8.0 | 19 | 3.08 | |
| Industrial area | 0–10 cm | 6 | 22 | 19 | 43 | 16 | 7.9 | 21 | 4.32 |
| 10–20 cm | 6 | 20 | 21 | 41 | 18 | 8.1 | 16 | 4.74 | |
| Creek and lake bank | 0–10 cm | 7 | 18 | 19 | 40 | 23 | 7.9 | 12 | 5.65 |
| 10–20 cm | 7 | 16 | 22 | 40 | 22 | 8.0 | 15 | 4.58 | |
| Park | 0–10 cm | 9 | 13 | 16 | 43 | 28 | 7.9 | 14 | 6.52 |
| 10–20 cm | 9 | 14 | 15 | 41 | 30 | 8.0 | 15 | 4.54 | |
| Miscellaneous | 0–10 cm | 17 | 16 | 20 | 46 | 18 | 7.8 | 21 | 3.36 |
| 10–20 cm | 17 | 18 | 18 | 44 | 20 | 7.9 | 19 | 2.92 | |
| 2011 | Site Nr. | 2018 | 2011 vs. 2018 | Land Use Category | ||||||||||||||||||
|---|---|---|---|---|---|---|---|---|---|---|---|---|---|---|---|---|---|---|---|---|---|---|
| Cd | Co | Cr | Cu | Ni | Pb | Zn | Cd | Co | Cr | Cu | Ni | Pb | Zn | Cd | Co | Cr | Cu | Ni | Pb | Zn | ||
| 0.23 | 0.77 | 0.01 | 3.92 | 1.50 | 13.79 | 29.41 | S7 | 0.24 | 2.30 | 0.20 | 6.31 | 3.94 | 18.62 | 12.36 | 0.01 | 1.53 | 0.20 | 2.39 | 2.43 | 4.83 | −17.05 | traffic zone |
| 0.53 | 1.15 | 0.47 | 10.99 | 2.71 | 21.95 | 44.05 | 0.20 | 2.18 | 0.17 | 6.08 | 3.82 | 13.64 | 11.49 | −0.32 | 1.02 | −0.30 | −4.90 | 1.11 | −8.31 | −33.01 | ||
| 0.28 | 1.30 | 0.03 | 14.92 | 1.51 | 66.34 | 53.81 | S32 | 0.18 | 0.47 | 0.32 | 17.85 | 0.90 | 20.90 | 54.66 | −0.09 | −0.83 | 0.32 | 2.93 | −0.60 | −45.44 | 0.85 | traffic zone |
| 0.23 | 1.31 | 0.06 | 13.40 | 1.42 | 70.51 | 23.65 | 0.10 | 0.29 | 0.41 | 8.30 | 0.84 | 14.64 | 22.31 | −0.13 | −1.02 | 0.41 | −5.09 | −0.57 | −55.87 | −1.34 | ||
| 0.19 | 1.08 | 0.21 | 8.09 | 1.72 | 9.10 | 42.13 | S81 | 0.24 | 1.86 | 0.11 | 6.71 | 3.53 | 10.97 | 12.22 | 0.043 | 0.78 | −0.09 | −1.38 | 1.81 | 1.86 | −29.91 | residential area |
| 0.17 | 1.06 | 0.20 | 7.21 | 1.78 | 7.68 | 31.82 | 0.17 | 1.50 | 0.10 | 5.02 | 2.72 | 9.32 | 8.95 | 0.01 | 0.44 | −0.09 | −2.19 | 0.93 | 1.63 | −22.86 | ||
| 0.18 | 0.63 | 0.21 | 7.14 | 0.86 | 17.06 | 24.95 | S85 | 0.14 | 0.77 | 0.14 | 7.42 | 0.99 | 11.12 | 22.71 | −0.04 | 0.13 | −0.06 | 0.25 | 0.13 | −5.94 | −2.24 | traffic zone |
| 0.20 | 0.69 | 0.24 | 5.90 | 0.87 | 16.29 | 23.55 | 0.12 | 0.71 | 0.14 | 4.88 | 1.24 | 13.52 | 13.34 | −0.07 | 0.01 | −0.09 | −1.01 | 0.36 | −2.77 | −10.21 | ||
| 2.36 | 1.20 | 1.25 | 408.4 | 2.51 | 97.45 | 247.5 | S86 | 0.31 | 1.10 | 0.30 | 9.54 | 1.55 | 47.95 | 25.96 | −2.05 | −0.09 | −0.94 | −398.85 | −0.95 | −49.5 | −221.54 | industrial area |
| 1.45 | 1.03 | 0.95 | 180.9 | 1.36 | 73.45 | 93.86 | 0.25 | 0.89 | 0.33 | 6.98 | 1.34 | 29.49 | 14.81 | −1.20 | −0.13 | −0.61 | −173.91 | −0.02 | −43.96 | −79.05 | ||
| 0.36 | 0.43 | 0.56 | 13.14 | 1.08 | 28.71 | 58.09 | S90 | 0.58 | 0.66 | 0.63 | 27.55 | 1.79 | 23.80 | 65.54 | 0.22 | 0.22 | 0.07 | 14.41 | 0.71 | 25.09 | 7.45 | park |
| 0.41 | 0.39 | 0.58 | 11.78 | 0.94 | 30.74 | 59.69 | 0.33 | 0.42 | 0.39 | 22.59 | 1.16 | 35.24 | 42.17 | −0.07 | 0.03 | −0.18 | 10.81 | 0.22 | 4.51 | −17.52 | ||
| 0.17 | 0.33 | 0.20 | 1.88 | 0.49 | 2.96 | 8.96 | S99 | 0.62 | 0.43 | 0.43 | 11.52 | 0.99 | 25.92 | 35.93 | 0.44 | 0.09 | 0.22 | 9.63 | 0.50 | 22.95 | 26.96 | creek and lake bank |
| 0.11 | 0.29 | 0.26 | 1.93 | 0.50 | 2.76 | 4.91 | 0.56 | 0.32 | 0.41 | 11.62 | 0.97 | 25.02 | 34.66 | 0.45 | 0.02 | 0.15 | 9.68 | 0.46 | 22.26 | 29.74 | ||
| 0.11 | 0.94 | 0.10 | 3.01 | 1.71 | 3.63 | 4.98 | S102 | 0.15 | 0.97 | 0.21 | 17.44 | 1.90 | 5.09 | 52.98 | 0.04 | 0.03 | 0.10 | 14.42 | 0.18 | 1.46 | 47.99 | traffic zone |
| 0.10 | 0.87 | 0.10 | 2.61 | 1.68 | 3.18 | 2.60 | 0.16 | 1.11 | 0.14 | 10.47 | 2.18 | 4.83 | 28.15 | 0.05 | 0.24 | 0.04 | 7.85 | 0.49 | 1.65 | 25.54 | ||
| 0.35 | 0.49 | 0.46 | 8.99 | 0.95 | 16.88 | 36.47 | S107 | 0.52 | 0.40 | 0.93 | 15.54 | 0.74 | 43.02 | 52.43 | 0.17 | −0.08 | 0.47 | 6.54 | −0.21 | 26.14 | 15.96 | traffic zone |
| 0.46 | 0.36 | 0.80 | 13.11 | 0.88 | 27.37 | 44.28 | 0.56 | 0.45 | 1.27 | 21.52 | 0.89 | 39.89 | 69.18 | 0.10 | 0.09 | 0.46 | 8.41 | 0.01 | 12.52 | 24.90 | ||
| 0.15 | 0.34 | 0.28 | 2.93 | 0.44 | 5.27 | 29.24 | S138 | 0.28 | 0.75 | 0.30 | 5.18 | 0.63 | 10.06 | 80.40 | 0.13 | 0.41 | 0.01 | 2.25 | 0.18 | 4.78 | 51.16 | traffic zone |
| 0.24 | 0.29 | 0.47 | 2.91 | 0.43 | 5.47 | 24.40 | 0.31 | 0.54 | 0.32 | 4.33 | 0.55 | 9.87 | 98.67 | 0.07 | 0.25 | −0.15 | 1.41 | 0.12 | 4.40 | 73.77 | ||
| 0.27 | 0.42 | 0.18 | 6.28 | 1.14 | 13.65 | 31.52 | S139 | 0.36 | 0.59 | 0.23 | 6.40 | 1.46 | 22.75 | 26.38 | 0.09 | 0.16 | 0.04 | 0.11 | 0.31 | 9.10 | −5.14 | park |
| 0.44 | 0.38 | 0.22 | 7.94 | 1.15 | 16.24 | 28.33 | 0.44 | 0.47 | 0.28 | 7.72 | 1.39 | 27.34 | 26.22 | −0.01 | 0.09 | 0.08 | −0.22 | 0.23 | 11.10 | −2.11 | ||
| 2.51 | 0.62 | 0.53 | 13.03 | 1.14 | 9.85 | 22.32 | S150 | 0.23 | 0.18 | 0.33 | 6.39 | 0.43 | 12.77 | 10.93 | −2.27 | −0.44 | −0.20 | −6.63 | −0.70 | 2.92 | −11.39 | forested area |
| 0.33 | 0.40 | 0.28 | 80.36 | 0.93 | 23.35 | 30.93 | 0.25 | 0.16 | 0.33 | 6.69 | 0.41 | 13.38 | 11.41 | −0.07 | −0.24 | 0.05 | −73.66 | −0.52 | −9.97 | −19.52 | ||
| 2.19 | 1.46 | 1.81 | 120.6 | 2.59 | 43708 | 53.40 | S152 | 0.17 | 0.54 | 1.02 | 3.83 | 1.02 | 8.51 | 8.88 | −2.02 | −0.92 | −0.79 | −116.76 | −1.57 | −22.56 | −44.51 | miscella neous |
| 2.52 | 0.90 | 1.19 | 163.10 | 2.12 | 38.15 | 63.32 | 0.25 | 0.48 | 0.36 | 5.75 | 1.19 | 11.73 | 17.02 | −2.27 | −0.42 | −0.82 | −157.34 | −0.93 | −26.42 | −46.3 | ||
| 0.11 | 0.32 | 0.25 | 2.77 | 0.55 | 3.10 | 4.01 | S155 | 0.50 | 0.34 | 0.47 | 5.26 | 0.49 | 8.05 | 16.39 | 0.39 | 0.02 | 0.22 | 2.48 | −0.05 | 4.94 | 12.37 | residential area |
| 0.11 | 0.37 | 0.30 | 3.27 | 0.73 | 2.56 | 2.32 | 0.58 | 0.36 | 0.52 | 5.65 | 0.50 | 10.43 | 16.54 | 0.46 | −0.01 | 0.22 | 2.38 | −0.23 | 7.86 | 14.21 | ||
| 0–0.5 | 0–5 | 0–0.5 | 0–10 | 0–10 | 0–10 | 0–5 | <A | 0–0.5 | 0–5 | 0–0.5 | 0–10 | 0–10 | 0–10 | 0–5 | ||||||||
| 0.5–1 | 5–10 | 0.5–3 | 10–40 | 10–20 | 10–25 | 5–20 | A < X < B | 0.5–1 | 5–10 | 0.5–3 | 10–40 | 10–20 | 10–25 | 5–20 | ||||||||
| 1–2 | 10–20 | 3–6 | 40–90 | 20–60 | 25–70 | 20–40 | B < X < C1 | 1–2 | 10–20 | 3–6 | 40–90 | 20–60 | 25–70 | 20–40 | increase | |||||||
| 20–30 | 6–18 | 90–140 | 60–90 | 70–150 | 40–80 | C1 < X < C2 | 20–30 | 6–18 | 90–140 | 60–90 | 70–150 | 40–80 | ||||||||||
| 30–40 | 18–36 | 140–190 | 90–120 | 150–300 | 80–160 | C2 < X < C3 | 30–40 | 18–36 | 140–190 | 90–120 | 150–300 | 80–160 | decrease | |||||||||
| 40< | 36< | 190< | 300< | 160< | C3 < X | 40< | 190< | 120< | 300< | 160< | ||||||||||||
| Site Nr. | Available | Total | Enrichment Factor | ||||||||||||||||||
|---|---|---|---|---|---|---|---|---|---|---|---|---|---|---|---|---|---|---|---|---|---|
| Cd | Co | Cr | Cu | Ni | Pb | Zn | Cd | Co | Cr | Cu | Ni | Pb | Zn | Cd | Co | Cr | Cu | Ni | Pb | Zn | |
| S32 | 0.18 | 0.47 | 0.32 | 17.85 | 0.90 | 20.90 | 54.66 | 0.25 | 4.25 | 25.10 | 42.22 | 12.95 | 33.65 | 119.81 | 2 | 0 | 0 | 1 | 0 | 4 | 2 |
| S35 | 0.44 | 0.91 | 0.20 | 3.46 | 1.01 | 17.56 | 11.79 | 0.49 | 7.66 | 28.65 | 15.58 | 14.05 | 44.25 | 102.24 | 2 | 0 | 0 | 0 | 0 | 2 | 1 |
| S43 | 0.13 | 1.45 | 0.36 | 4.55 | 1.85 | 4.84 | 2.73 | 0.15 | 6.22 | 28.94 | 15.65 | 17.33 | 9.87 | 41.30 | 1 | 0 | 0 | 0 | 0 | 1 | 0 |
| S64 | 0.22 | 1.12 | 0.31 | 6.42 | 2.05 | 6.56 | 11.64 | 0.28 | 7.92 | 38.18 | 24.70 | 21.36 | 15.44 | 62.82 | 1 | 0 | 0 | 0 | 0 | 1 | 1 |
| S82 | 0.27 | 1.11 | 0.26 | 8.17 | 2.16 | 11.31 | 9.70 | 0.33 | 8.16 | 35.79 | 27.99 | 22.13 | 21.32 | 68.03 | 1 | 0 | 0 | 0 | 0 | 1 | 1 |
| S84 | 0.16 | 0.91 | 0.53 | 3.48 | 0.93 | 8.02 | 6.17 | 0.19 | 5.70 | 25.15 | 15.64 | 14.35 | 15.12 | 45.25 | 1 | 0 | 0 | 0 | 0 | 1 | 1 |
| S89 | 0.18 | 0.34 | 0.32 | 6.42 | 0.36 | 9.15 | 12.67 | 0.18 | 3.86 | 18.13 | 23.79 | 9.94 | 17.47 | 47.55 | 1 | 0 | 0 | 1 | 0 | 2 | 1 |
| S99 | 0.62 | 0.43 | 0.43 | 11.52 | 0.99 | 25.92 | 35.93 | 0.67 | 3.99 | 19.06 | 27.97 | 12.35 | 33.49 | 94.44 | 4 | 0 | 0 | 1 | 0 | 3 | 2 |
| S121 | 0.13 | 0.56 | 0.23 | 5.63 | 1.06 | 12.37 | 7.97 | 0.16 | 5.55 | 25.19 | 19.45 | 15.27 | 20.89 | 47.28 | 1 | 0 | 0 | 0 | 0 | 2 | 1 |
| S139 | 0.36 | 0.59 | 0.23 | 6.40 | 1.46 | 22.75 | 26.38 | 0.57 | 4.67 | 22.93 | 19.57 | 11.97 | 33.21 | 81.87 | 3 | 0 | 0 | 0 | 0 | 3 | 1 |
| S145 | 0.25 | 1.08 | 0.42 | 4.13 | 1.49 | 9.91 | 9.3 | 0.29 | 7.21 | 34.54 | 22.10 | 22.84 | 16.23 | 64.41 | 1 | 0 | 0 | 0 | 0 | 1 | 1 |
| A> | 0–0.5 | 0–5 | 0–0.5 | 0–10 | 0–10 | 0–10 | 0–5 | 0–0.5 | 0–15 | 0–30 | 0–30 | 0–25 | 0–25 | 0–100 | ≤1 | no enrichment | |||||
| A< X < B | 0.5–1 | 5–10 | 0.5–3 | 10–40 | 10–20 | 10–25 | 5–20 | 0.5–1 | 15–30 | 30–75 | 30–75 | 25–40 | 25–100 | 100–200 | ≤3 | minor enrichment | |||||
| B < X < C1 | 1–2 | 10–20 | 3–6 | 40–90 | 20–60 | 25–70 | 20–40 | 1–2 | 30–100 | 75–150 | 75–200 | 40–150 | 100–150 | 200–500 | 3–5 | moderate enrichment | |||||
| C1 < X < C2 | 20–30 | 6–18 | 90–140 | 60–90 | 70–150 | 40–80 | 2–5 | 100–200 | 150–400 | 200–300 | 150–200 | 150–500 | 500–1000 | 5–10 | moderate enrichment | ||||||
| C2 < X < C3 | 30–40 | 18–36 | 140–190 | 90–120 | 150–300 | 80–160 | 5–10 | 200–300 | 400–800 | 300–400 | 200–250 | 500–600 | 1000–2000 | 10–25 | severe enrichment | ||||||
| >C3 | 40< | 36< | 190< | 120< | 300< | 160< | 10< | 300< | 800< | 400< | 250< | 600< | 2000< | 25–50 | very severe enrichment | ||||||
| Microarthropod Taxa (EMI Scores) | Site Nr. | ||||||||||
|---|---|---|---|---|---|---|---|---|---|---|---|
| S32 | S35 | S43 | S64 | S82 | S84 | S89 | S99 | S121 | S139 | S145 | |
| Acari (20) | 4415 (1103) | 9122 (2450) | 9392 (3212) | 7130 (1460) | 5141 (1419) | 8500 (2507) | 5519 (1219) | 6644 (1600) | 5563 (1844) | 6781 (2260) | 10,133 (2970) |
| Araneae (1–5) | 33 (19) | 67 (51) | 133 (69) | 0 (0) | 0 (0) | 189 (89) | 56 (40) | 0 (0) | 0 (0) | 0 (0) | 78 (48) |
| Chilopoda (10) | 0 (0) | 89 (73) | 56 (40) | 0 (0) | 22 (11) | 0 (0) | 33 (33) | 44 (29) | 0 (0) | 0 (0) | 89 (73) |
| Coleoptera (1–20) | 33 (19) | 56 (40) | 78 (29) | 56 (40) | 0 (0) | 0 (0) | 0 (0) | 56 (40) | 0 (0) | 0 (0) | 67 (40) |
| Collembola (1–20) | 822 (323) | 4085 (946) | 4481 (1084) | 3200 (869) | 1626 (454) | 2270 (679) | 3019 (940) | 1578 (551) | 2578 (1039) | 3544 (1126) | 4526 (930) |
| Diplopoda (10–20) | 0 (0) | 0 (0) | 0 (0) | 0 (0) | 0 (0) | 0 (0) | 0 (0) | 67 (33) | 0 (0) | 0 (0) | 78 (48) |
| Diplura (20) | 0 (0) | 222 (142) | 256 (78) | 78 (48) | 56 (40) | 67 (38) | 0 (0) | 156 (91) | 0 (0) | 89 (59) | 44 (29) |
| Hemiptera (1–10) | 122 (68) | 0 (0) | 0 (0) | 89 (72) | 0 (0) | 133 (58) | 0 (0) | 89 (40) | 0 (0) | 0 (0) | 111 (48) |
| Hymenoptera (1–5) | 644 (367) | 0 (0) | 111 (68) | 522 (185) | 944 (244) | 722 (193) | 211 (87) | 0 (0) | 467 (168) | 800 (150) | 1089 (330) |
| Isopoda (10) | 0 (0) | 56 (40) | 44 (29) | 0 (0) | 11 (11) | 44 (29) | 0 (0) | 0 (0) | 0 (0) | 0 (0) | 56 (40) |
| Pauropoda (20) | 0 (0) | 0 (0) | 89 (29) | 67 (19) | 0 (0) | 89 (56) | 78 (56) | 0 (0) | 0 (0) | 0 (0) | 56 (22) |
| Protura (20) | 0 (0) | 0 (0) | 56 (11) | 0 (0) | 0 (0) | 0 (0) | 0 (0) | 0 (0) | 0 (0) | 0 (0) | 122 (59) |
| Pseudoscorpionida (20) | 0 (0) | 56 (29) | 0 (0) | 0 (0) | 0 (0) | 0 (0) | 0 (0) | 0 (0) | 0 (0) | 0 (0) | 144 (87) |
| Psocoptera (1) | 0 (0) | 0 (0) | 0 (0) | 33 (33) | 0 (0) | 111 (62) | 0 (0) | 0 (0) | 67 (38) | 0 (0) | 0 (0) |
| Symphyla (10) | 0 (0) | 56 (40) | 189 (172) | 0 (0) | 78 (29) | 0 (0) | 78 (48) | 0 (0) | 56 (29) | 0 (0) | 89 (48) |
| Thysanoptera (1) | 0 (0) | 22 (11) | 0 (0) | 0 (0) | 0 (0) | 0 (0) | 0 (0) | 0 (0) | 0 (0) | 89 (89) | 0 (0) |
| Coleoptera larvae (10) | 33 (33) | 178 (40) | 111 (44) | 0 (0) | 0 (0) | 67 (67) | 0 (0) | 122 (59) | 0 (0) | 111 (44) | 133 (51) |
| Diptera larvae (10) | 167 (107) | 56 (22) | 356 (59) | 244 (91) | 89 (29) | 0 (0) | 56 (40) | 0 (0) | 111 (95) | 144 (80) | 22 (22) |
| Hymenoptera larvae (10) | 0 (0) | 56 (56) | 0 (0) | 0 (0) | 0 (0) | 0 (0) | 0 (0) | 0 (0) | 0 (0) | 0 (0) | 0 (0) |
| Taxa richness | 6.00 (1.15) | 10.0 (0.58) | 11.67 (0.88) | 7.33 (0.67) | 6.67 (0.67) | 8.67 (0.33) | 6.00 (0.58) | 7.00 (0.58) | 5.33 (0.88) | 6.00 (0.58) | 13.33 (0.33) |
| Shannon index | 0.64 (0.21) | 0.74 (0.11) | 0.80 (0.05) | 0.76 (0.09) | 0.78 (0.04) | 0.76 (0.13) | 0.73 (0.07) | 0.59 (0.15) | 0.68 (0.08) | 0.82 (0.05) | 0.86 (0.10) |
| Pielou’s index | 0.51 (0.12) | 0.40 (0.05) | 0.43 (0.02) | 0.49 (0.04) | 0.53 (0.03) | 0.47 (0.08) | 0.49 (0.05) | 0.38 (0.08) | 0.52 (0.06) | 0.57 (0.04) | 0.45 (0.05) |
| QBS-ar index | 61.0 (6.4) | 125.7 (7.5) | 153.3 (7.3) | 92.7 (8.3) | 88.3 (8.8) | 95.3 (6.7) | 77.0 (4.4) | 94.3 (9.3) | 59.0 (3.0) | 78.7 (6.8) | 162.7 (10.9) |
Publisher’s Note: MDPI stays neutral with regard to jurisdictional claims in published maps and institutional affiliations. |
© 2021 by the authors. Licensee MDPI, Basel, Switzerland. This article is an open access article distributed under the terms and conditions of the Creative Commons Attribution (CC BY) license (https://creativecommons.org/licenses/by/4.0/).
Share and Cite
Horváth, A.; Csáki, P.; Szita, R.; Kalicz, P.; Gribovszki, Z.; Bidló, A.; Bolodár-Varga, B.; Balázs, P.; Winkler, D. A Complex Soil Ecological Approach in a Sustainable Urban Environment: Soil Properties and Soil Biological Quality. Minerals 2021, 11, 704. https://doi.org/10.3390/min11070704
Horváth A, Csáki P, Szita R, Kalicz P, Gribovszki Z, Bidló A, Bolodár-Varga B, Balázs P, Winkler D. A Complex Soil Ecological Approach in a Sustainable Urban Environment: Soil Properties and Soil Biological Quality. Minerals. 2021; 11(7):704. https://doi.org/10.3390/min11070704
Chicago/Turabian StyleHorváth, Adrienn, Péter Csáki, Renáta Szita, Péter Kalicz, Zoltán Gribovszki, András Bidló, Bernadett Bolodár-Varga, Pál Balázs, and Dániel Winkler. 2021. "A Complex Soil Ecological Approach in a Sustainable Urban Environment: Soil Properties and Soil Biological Quality" Minerals 11, no. 7: 704. https://doi.org/10.3390/min11070704