Article

Microplastic in Drinking Water: A Pilot Study

1
National Centre for Water Safety, Italian National Institute of Health (ISS), 00161 Rome, Italy
2
Department of Environmental Biology, Sapienza University of Rome, 00185 Rome, Italy
3
Acea Infrastructure SpA, 00189 Rome, Italy
*
Author to whom correspondence should be addressed.
Microplastics 2024, 3(1), 31-45; https://doi.org/10.3390/microplastics3010003
Submission received: 29 September 2023 / Revised: 12 December 2023 / Accepted: 5 January 2024 / Published: 9 January 2024

Abstract

:
In recent years, microplastic pollution has been a hot topic as these compounds have been used in various production contexts such as health, food or technology due to their chemical and physical properties and “shelf-life,” making them almost indispensable products in daily life. On the other hand, they have a negative impact on the environment and, consequently, on biota and human health. It is therefore necessary to assess the actual presence of microplastics in drinking water by analysing real samples in order to estimate the possible exposure through drinking water consumption. In this pilot study, drinking water from different aqueous matrices was examined for the presence of microplastics and characterized in terms of shape, size, abundance and polymer type by Raman microspectroscopy analysis. Not all samples analysed were found to be contaminated with microplastics, indeed, some, as in the case of water kiosk samples, were found to be free of such contaminants. The results for the various matrices showed that the microplastics content ranged from less than 2 particles/L to a maximum of 5 + 1.5 particles/L, with sizes ranging from 30 to 100 μm and consisted of the most common polymers such as polyethylene, polypropylene or polyethylene terephthalate.

1. Introduction

Microplastic pollution has become a focus of public and research attention as microplastics are considered a contaminant of emerging concern (CEC) [1] due to their ubiquity in the natural and urban environment by identifying them in different environmental matrices. Confirming this, the presence of microplastics (MPs) has been documented in almost all terrestrial and marine environments studied, including urban areas, marine and freshwater ecosystems, coastlines of remote uninhabited islands, lakes and alpine mountains, rivers, the marine water column, deep seabed, and trenches [2,3,4,5]. In particular, water bodies may act as a reservoir of such contaminants as microplastics from different sources continuously flow into them; it is hypothesised that drinking water sources and treated drinking water are highly susceptible to MPs contamination, in fact representing an important risk factor [6,7].
The potential for drinking water contamination is very high considering the prevalence of MPs, their pervasiveness and inherent characteristics along with the vastness of products and activities that produce them. The presence of microplastics in freshwater, groundwater or wastewater has highlighted the possible contamination of drinking water [8,9]. Various researches have highlighted the need to study the various sources of microplastics reaching humans through water: microplastics of various sizes, shapes and types have been found in different sources of drinking water, such as raw water that reaches drinking water treatment plants (DWTPs) [10,11,12], groundwater [11], bottled water [13,14,15], tap water [16] and public drinking water fountains [17,18,19] and water kiosks [20,21]. In fact, in addition to contamination of the aquifer from which the water is drawn, components of pipes, filters used in drinking water plants, water supply systems, or packaging could also contribute to the contamination of this matrix [11,22]
This impact also represents a real water emergency since microplastics are ubiquitous, emerging contaminants with an as yet unclear toxicological profile, as, despite the media interest in the topic, there is still no complete and comprehensive picture of the toxicity of microplastics for humans [23]. In recent years, the routes of exposure to these contaminants and the effects possibly related to their intake were studied [24]. The main routes of exposure can be attributed to their inhalation or ingestion, which can result from different routes such as, food and water. In particular, their ingestion would result in their bioaccumulation in the gastro-intestinal tract if such particles are digested in tissues or organs by the process of phagocytosis by M cells of Peyer’s patches or dendritic cells [25,26] and could be a cause of inflammation of stomach cells [22] or intestinal barrier [27]. In fact, microplastics would be found to be resistant to gastric juices and, therefore, they do not decompose in the human gastrointestinal tract [28], going into long-term retention in the body or direct excretion depending on polymer characteristics such as size, type and surface properties. To confirm this, traces of microplastics have been observed in biological matrices such as faeces [29], blood [30], as well as in organs such as lungs [31] and placenta [32].
Therefore, as drinking water is consumed daily, long-term human exposure is considered inevitable, with negative consequences for human health based on the physicochemical properties of microplastics [19]. In addition, due to their hydrophobicity, MPs can act as carriers by adsorbing heavy metals, organic pollutants [33], virus, and bacteria [34,35,36].
The prospect of being able to develop a monitoring strategy for these contaminants is therefore important for reducing potential exposure and preventing possible adverse health effects.
In this perspective, the European Commission has set itself the goal of regulating the monitoring of these emerging contaminants by 2024 in drinking water, and identifying a method for their determination and characterisation, to enable their inclusion in the Watch List and reducing potential exposure to these substances through drinking water. According to the provisions of the Directive (EU) 2020/2184, it is fundamental to develop monitoring and prevention strategies based on site-specific risk analysis in accordance with the provisions of the Water Safety Plans, in order to guarantee the quality of water resources and, therefore, prevent this state of emergency caused by parameters that are not currently provided for by the law [37,38].
The prospect of being able to develop microplastic monitoring and perhaps also prevention strategies, perhaps, is important for assessing potential exposure and preventing and/or reducing any confirmed risk of potential exposure to this type of contaminant.
To this end, the Joint Research Center (JRC), on behalf of the European Commission, initiated a project with the Member States with the aim of identifying a harmonized analytical method for the analysis of microplastics in drinking water, soliciting the support of scientific representatives, industry experts and stakeholders through a survey and dedicated workshops [39].
Within this context, the purpose of this pilot study was to test the method developed for determining and characterising microplastics in water for human consumption by analysing of real samples of different aqueous matrices by Raman Microspectroscopy.

2. Materials and Methods

This study examined water samples from different sampling points along the drinking water chain. The sampling campaign took place in the summer of 2022 in an area of central Italy (the Lazio region), taking advantage of sunny days, without any atmospheric disturbance. The type of matrices under investigation was chosen in accordance with the provisions of Directive 2020/2184 in order to develop monitoring and prevention strategies based on site-specific risks by devising a method for analysing water samples for human consumption taken at different points in the drinking water supply chain. The purpose of this is to be able to evaluate the possible presence and quantity of microplastics within the supply chain, from collection to the tap, and observe whether there can be variations dependent upon environmental factors, anthropogenic pressures or the type of material and processes used along the supply network. More specifically, analyses were carried out on raw and treated water samples to study the level of contamination of the raw matrix and whether and how it was abated at the plant and, subsequently, on drinking water sampled from drinking fountains, household taps, water kiosks and glass and plastic bottles, in order to also assess actual consumer exposure to these contaminants from different supply points

2.1. Sample Pre-Treatment

The analysed drinking water samples were collected using 1 L dark glass bottles. The decision to use dark glass bottles was due to the fact that it preserves any microplastic particles present as a result of exposure to the sun or use of plastic materials during transportation and storage. In this context, in order to optimise the efficiency and time of analysis by micro-Raman spectroscopy (μ-Raman), the drinking water samples were pre-treated with hydrochloric acid (37%, manufactured by Carlo Erba) to reduce the high background noise due to inorganic substances and other solids and, consequently, facilitate μ-Raman analysis. More specifically, each sample was pre-treated at room temperature with HCl (pH = 3), digested for 15 min and then filtered through the vacuum filtration system. The filtration process was carried out using a special filtration system, supplied by Thermo Fisher Scientific, consisting of a porous septum into which the silicon filter is placed (pore size 1 μm and 10 × 10 mm laser cut) and closed by a black gasket to prevent sample leakage and a flushing apparatus; filtration volume varied between 250 and 500 mL.
Any microplastic attached to the sampler or glass filter holders was recovered using Milli-Q water. The filter was placed under a μ-Raman’s microscope for subsequent analysis.

2.2. Sample Quali-Quantitative Sample Characterization by Micro-Raman Spectroscopy

In order to assess the possible exposure of consumers to these contaminants, the quality of drinking water sampled at various points in the drinking water supply chain was monitored using Raman spectroscopy analysis.
The confocal Raman imaging technique combines Raman spectroscopy with a confocal microscope, capturing the information of a complete Raman spectrum in each pixel of the image. In this way, the spatial distribution of the particles of interest within the sample is detected and photographed.
For Raman imaging analysis, in particular, a confocal Raman microscope scans the sample point by point and line by line, capturing a complete Raman spectrum in each pixel of the image (hyperspectral imaging).
In this study, particle counting and identification was performed with a μ-Raman spectroscope (Thermo Fisher Scientific) fitted with three lenses, specifically 10×, 20× and 50×, and a 532 nm Raman laser (0.1–10 mW; spectral resolution of 2 cm−1) with adjustable laser power to investigate microplastic particle sizes greater than 20 μm.
In order to enhance and optimise the contrast between the substrate and the particles to facilitate their identification, it was decided to work in the dark field at 10-fold magnification to obtain an overall image of the sample under investigation. Using this approach, the particles under examination can be clearly distinguished from the dark background, i.e., the silicon filter, thus avoiding the loss of the particles of interest.
Therefore, once the filter under analysis has been placed under the μ-Raman microscope, a single microscope image is acquired to obtain a total mapping of the particles present over the entire filter area and to obtain the information of interest for the determination and characterisation of microplastics in drinking water samples.
The spectra, containing chemical information, are analysed using Omnic Spectra Atlus software (OMNIC Atlus 9.11.734) to generate an image visualizing the spatial distribution of the particles of interest. This makes it possible to locate, count and characterise morphologically (size, area, length, width) the particles present on the filter quickly and easily.
In this paper, in particular, the number, size and morphology of the particles in the size range of interest, i.e., greater than 20 μm, were evaluated.
After particle localisation and morphological characterisation, automated Raman analysis was performed: the spectrum was acquired at the centre of each particle using optimised parameters in order to obtain a good compromise between the quality of the spectra and the time required for analysis.
Chemical identification was performed by comparing the spectrum of each particle with reference libraries, appropriately chosen for the identification of microplastics including a wide range of the most common polymers and commercial materials (e.g., HR FT-Raman Polymer Library, Polymers&Additives_Packaging) and home libraries obtained from materials specifically used for this type of analysis or commonly available in the laboratory.
Matches above 70% were accepted, while library matches between 60% and 70% were analysed and interpreted individually by overlaying the spectra.

2.3. Contamination Control

In order to mitigate sample contamination, appropriate precautions were taken such as: (i) working in a clean working environment, (ii) only using plastic-free equipment, (iii) wearing pure cotton gowns and not using gloves during sample preparation, (iv) preparing the sample in laminar flow hoods regularly cleaned with 50% EtOH, and (v) developing an appropriate cleaning protocol for the materials. Reagent and procedural blanks were prepared: reagent blanks were performed for ultrapure water, hydrochloric acid and ethanol solution, used for cleaning materials, which, did not reveal the presence of microplastics. The procedural blanks were performed by simulating the optimised analytical protocol but using ultrapure water instead of drinking water. As suggested by Schymanski et al., a single process blank was prepared daily as fewer than ten real samples were processed in one day [40].
The microplastics identified in the blanks were characterised in order to subtract them from the MPs content found in the real samples: PET was the most common polymer identified in the size range between 50 and 200 µm. The mean abundance of microplastics in the blanks was 3 particles/L for Groundwater-Inlet (G-I); 1.5 particles/L for Groundwater-Outlet (G-O), 2 particles/L for public drinking fountains, 1 particles/L for tap water and 0 particles/L for water kiosks and bottled water. The final results were corrected to the blank samples.

3. Results

In this pilot study, 34 samples of water for human consumption collected at different points in the drinking water chain in central Italy (Lazio) were analysed. Five different drinking water matrices were investigated: 14 groundwater samples, sampled both before and after purifier treatment, 8 drinking water samples taken from water kiosks, 8 taken from public drinking fountains and domestic taps and a final batch of samples from glass and plastic bottles. All results were normalised to a sample volume of 1 L.

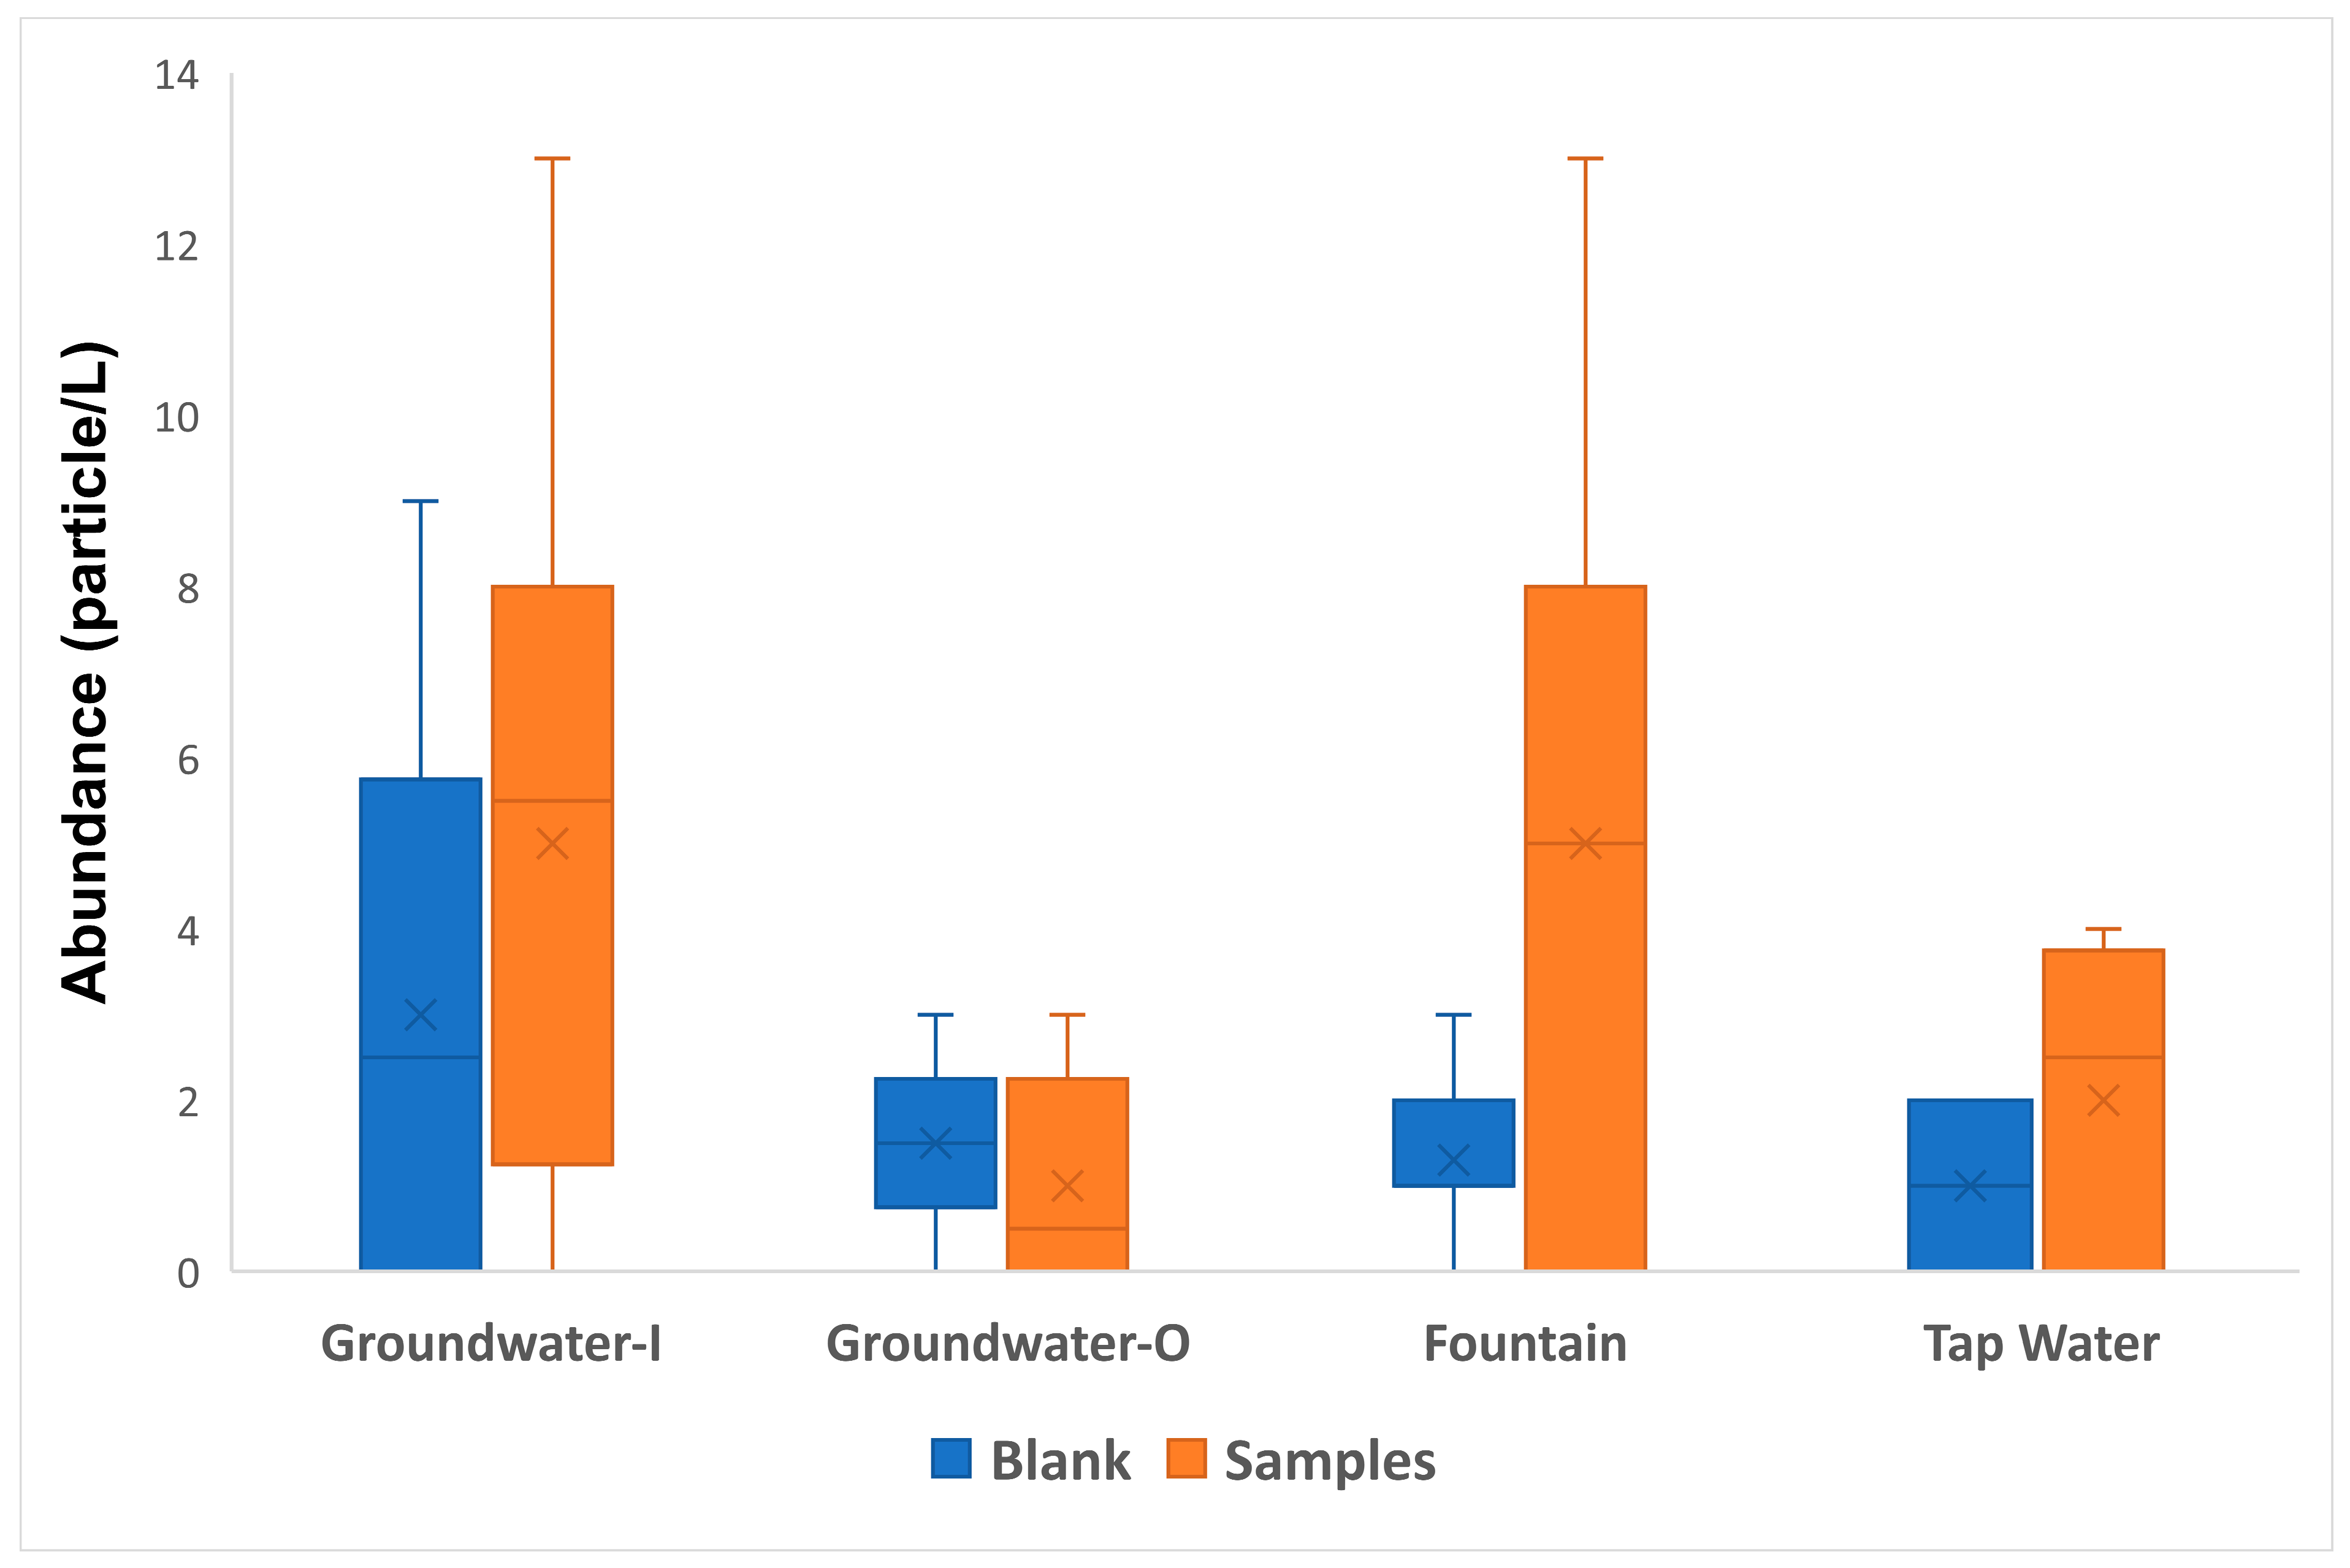
3.1. Abundance of MPs in Water Samples

The abundance of microplastics identified in the samples varied according to the type of aqueous matrix under investigation. The batch of groundwater samples consisted of 4 samples taken at the inlet of the drinking water treatment plant (Groundwater-I) and 10 post-treatment (Groundwater-O) samples: on average, the inlet water contained 5 ± 1.5 particles/L, subtracted of the blank value, as shown in Figure 1.
The situation is different for water samples taken at the drinking water outlet: on average, these samples contain less than 1 particle/L of these contaminants, as many samples were free of microplastics, i.e., no particles attributable to plastic materials were identified.
A similar situation to that of the samples taken at the inlet to the drinking water plant, however, was found in the fountain water samples: an average of 5 ± 1.5 particles/L were identified. It must be specified that not all the samples analysed contained particles of these contaminants, in fact, several aliquots were devoid of them.
The 12 kiosk and tap water samples showed very different concentrations of microplastics, presenting a lower content: more specifically, the water from the kiosk was completely free of these pollutants, showing, in terms of number of particles/L, a better filtering profile than the laboratory blank as reported in Section 2.3. On the contrary, the water taken from the domestic tap showed an average value of 2 ± 1 particles/L; as with the water samples from the drinking water outlet and public drinking fountain, not all the aliquots were found to be contaminated, indeed, some of them were free of these contaminants.
Finally, water in both plastic and glass bottles, was found to be free of these contaminants but contained particles of a different nature: after the reuse of these bottles and their exposure to the sun, there was an increase in the total number of particles identified but none of them were microplastic and all of them were completely microplastic-free as shown in Table 1.
All samples were acquired in triplicate and the final results were corrected to the blank samples, as indicated in paragraph Section 2.3.
If the classical definition of limit of identification and quantification (LOD and LOQ) was used for method validation, which is equal to 5 and 11 particle/L for Groundwater-I, 4 and 11 particle/L for groundwater-O, 6 and 16 particle/L for fountains, 3 and 8 particle/L for tap water and = particle/L for other matrices, the results, obtained from the real samples analysis, shows that the amount of MPs detected in several samples is lower than the LOQ; this is an indication that the samples analysed are devoid of significant MP content.

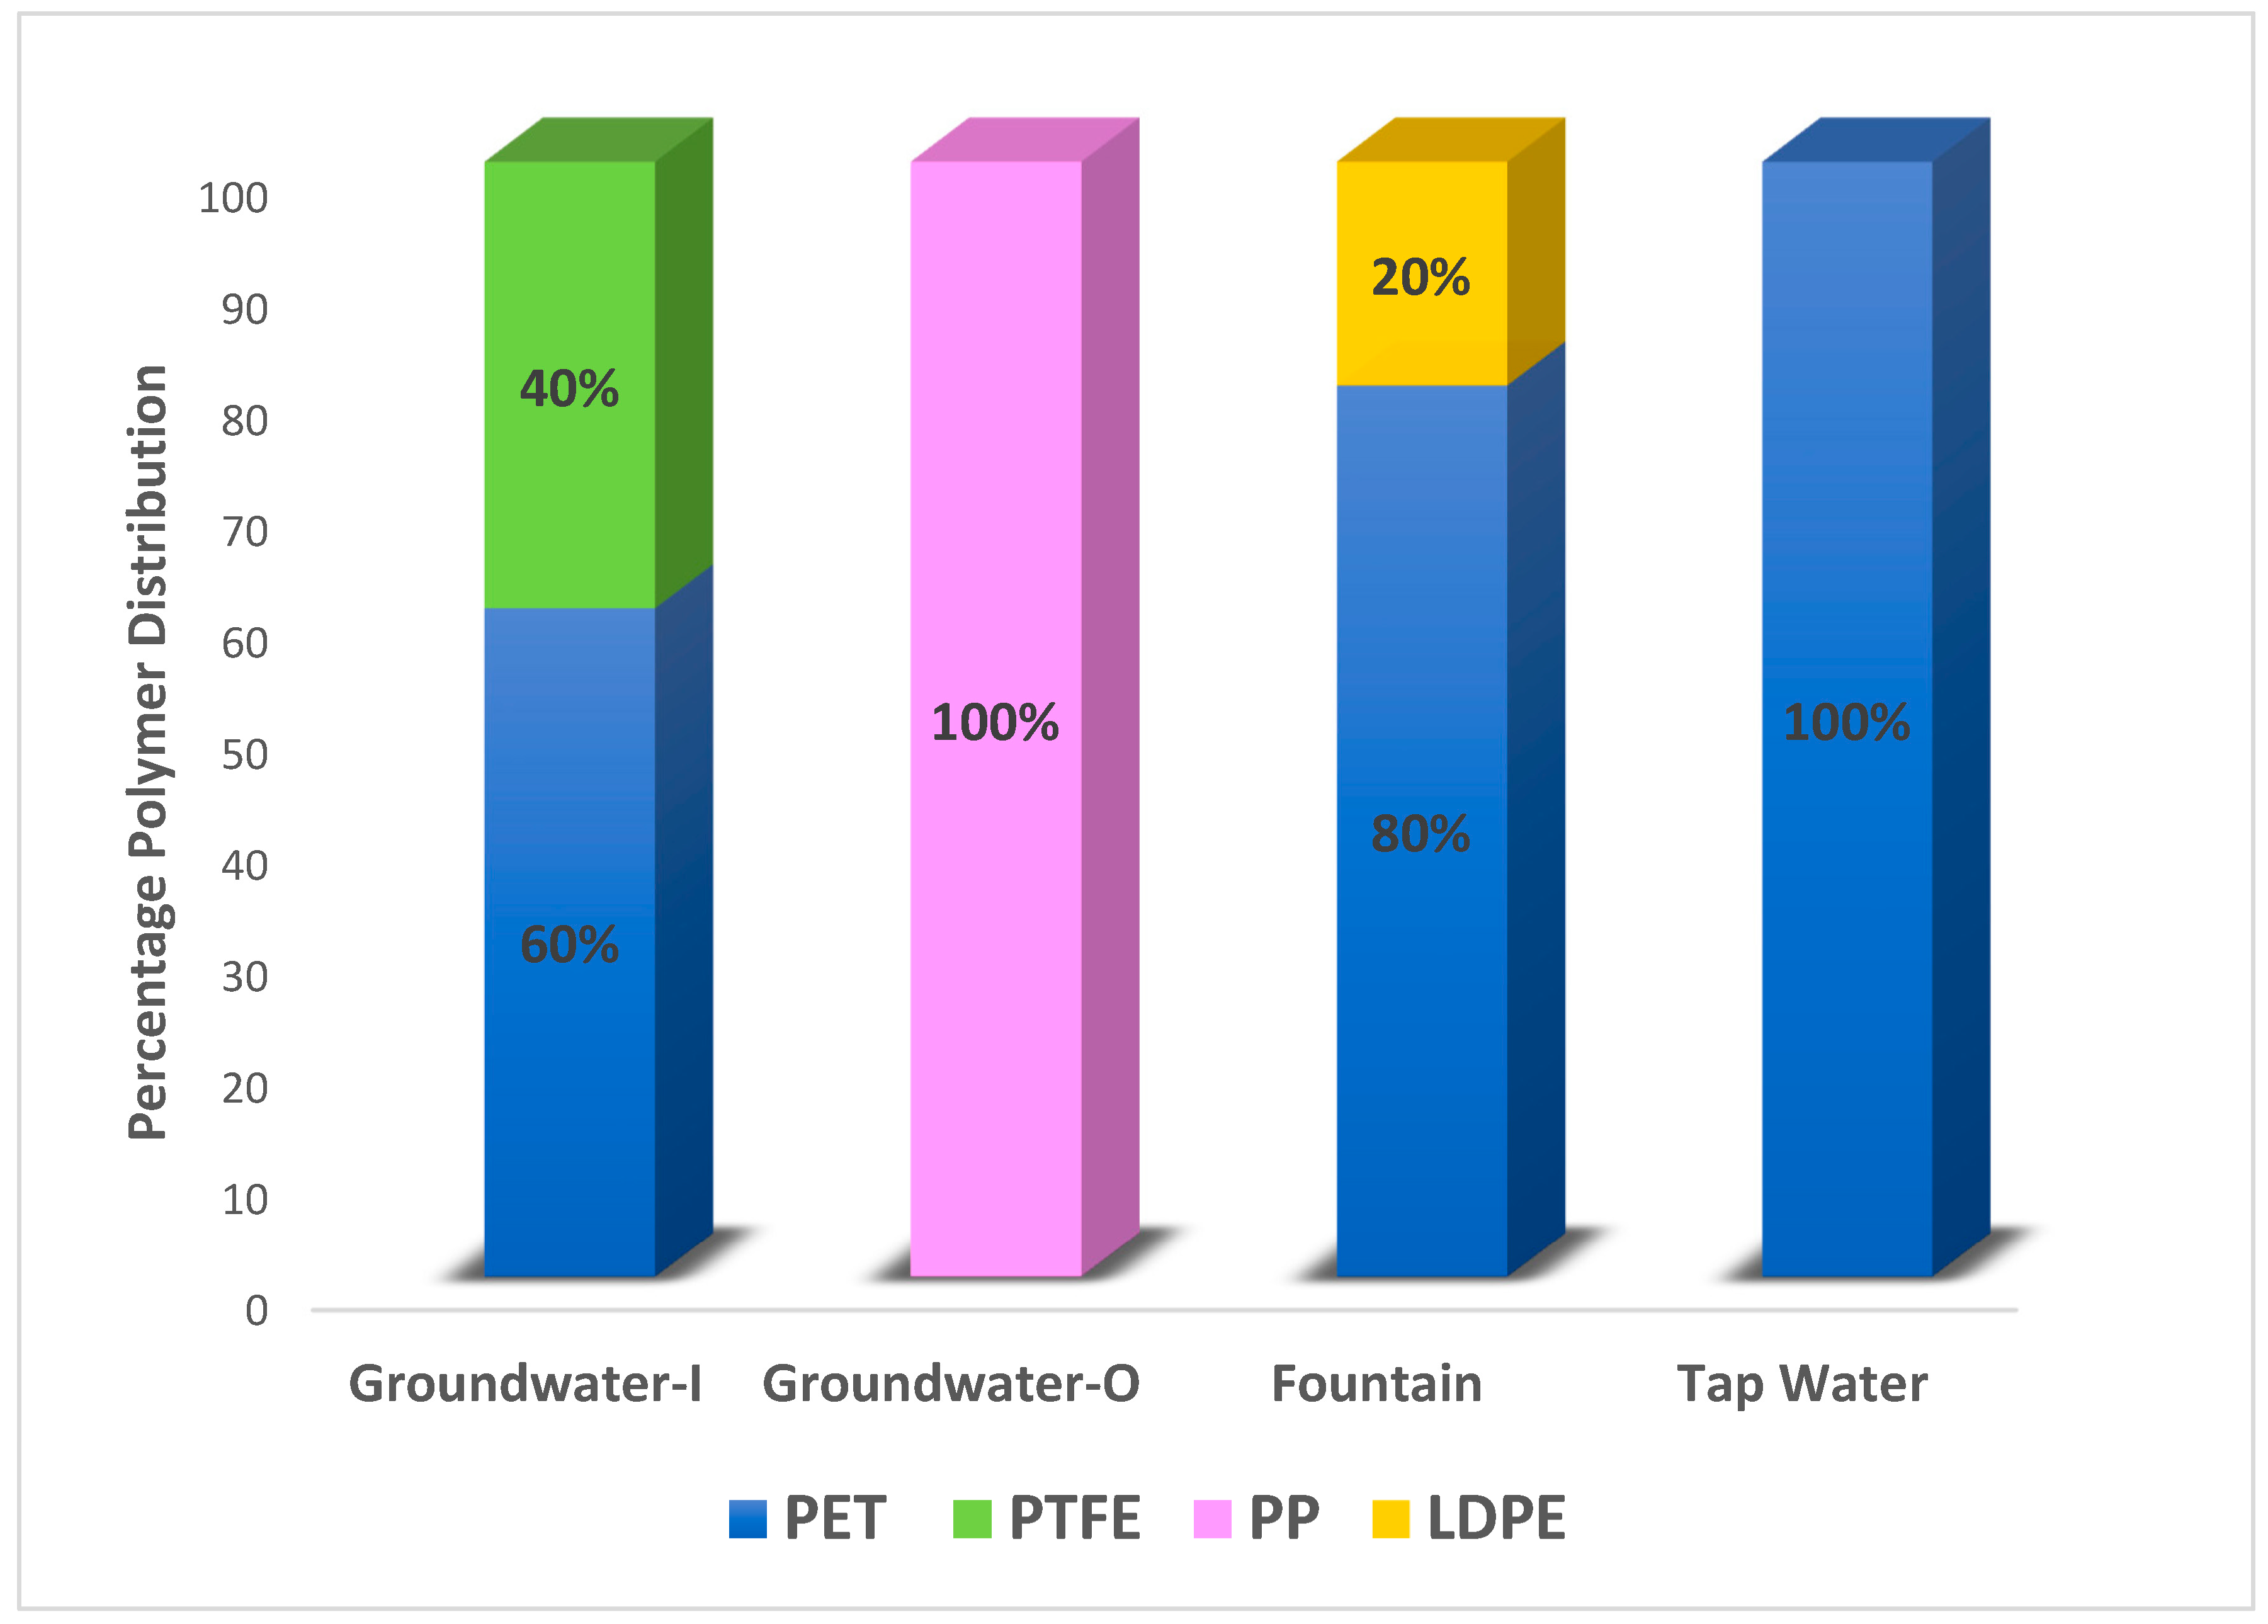
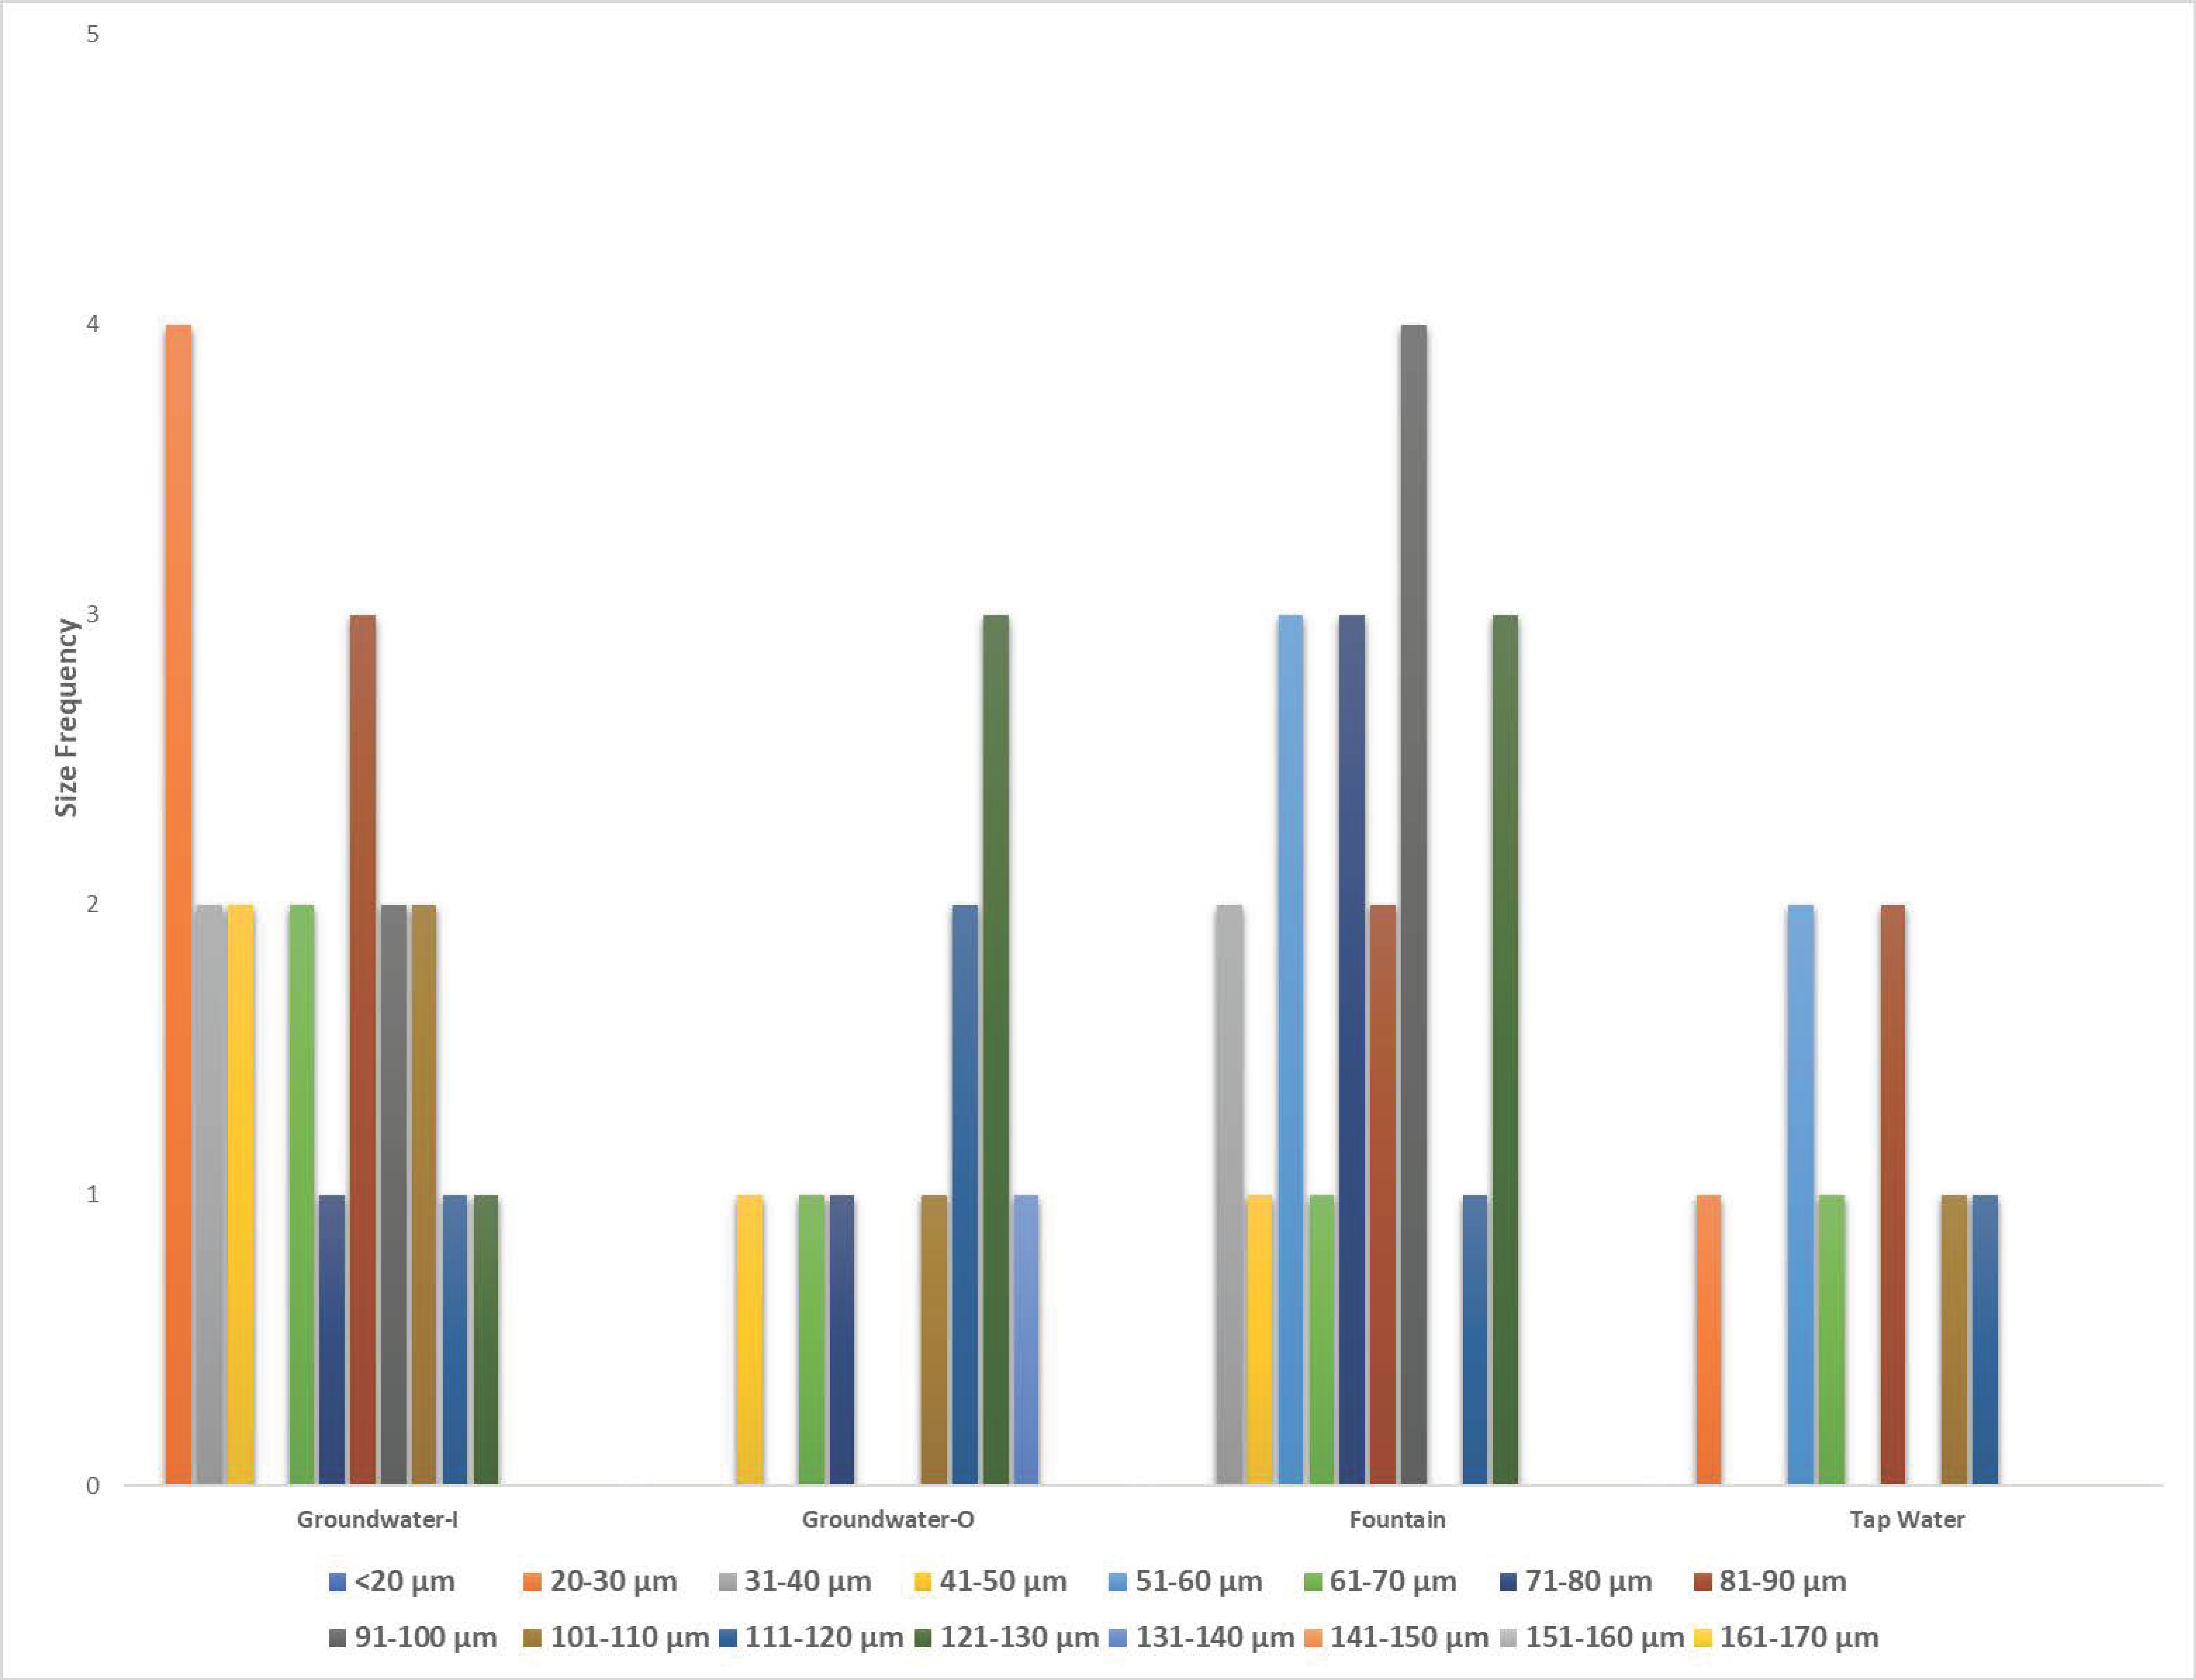
3.2. Polymer and Size Distribution

The variability of microplastics in the samples analysed is not only attributable to the type of matrix and number of particles detected, but also to the type of polymer and size range identified.
In the samples taken at the inlet of the drinking water treatment plant (Groundwater-I), which on average contained 5 ± 1.5 particles/L, chemical identification by Raman analysis revealed that 60% of these particles were Polyethylene Terephthalate (PET) and 40% were Polytetrafluoroethylene (PTFE), as shown in Figure 2. All samples consisted of suspended particles not identifiable as polymeric materials but due to materials such as inorganic or other solid compounds. The number of other particles present, on average, was within a range of between 100 and 745 particles depending on the aqueous matrix under investigation with size range between 20 and 200 μm. In particular, Groundwater-inlet samples have an average of 100 particles/L of which, on average, only 5 particles/L turn out to be MPs, in an average size of 68 μm, after μ-Raman analysis and the latter have a polymeric distribution as shown in Figure 2. Similarly, groundwater-outlet has an average of 271 particle/L of which less than 1 particle/L was MPs with average size of 102 μm. In contrast, for the drinking public fountain samples out of an average of 642 particles/L only 5 particles/L on average were MPs in an average size 80 μm; finally, for tap water of 390 particles/L on average only 2 particles/L are MPs with average size 74 μm.
A different trend was observed for the samples taken at the DWTP outlet, where the most commonly present polymer is Polypropylene (PP) (100%), while no PET and PTFE particles were identified: the percentage of these types of polymers is reduced by the plant compared to their input content.
Conversely, similar polymer type identification was observed for both drinking fountain water samples, where 80% of microplastics detected were PET, and tap water, where 100% of the particles identified consisted of this polymer. Furthermore, in the drinking fountain water samples, on average, the analysis showed that pure Low Density Polyethylene (LDPE) (20%) is present in this matrix, albeit with a low concentration.
In terms of shape, the microplastics investigated were found to be fragmented: in all matrices investigated, more than 93% were fragmented, 2% fibers, and the remaining 5% presents pseudo-spherical shape.
In these samples, it is also possible to observe a trend in terms of the size range of the identified microplastic particles present as shown in Figure 3. Particles sizes greater than 20 μm were found in several samples, which is the detection limit of the method, returning, in this way, an overall picture of potential microplastics taken up by consumers. This trend may be is due to the need to have fielded appropriate sampling protocols for small Microplastic MPs [38] and this allowed frequency observation of small particles, which could have more relevant health effects [41] as particles of increasingly smaller diameter (<30 μm) assume an important role in the body, the effects of which are still poorly understood [25,42]. Regardless of the type of matrices investigated, the largest proportion of microplastics identified was within the size range 30–90 μm.
A different distribution can be observed in the water samples collected at the outlet from the drinking water plant, where 75% of the plastic particles were larger than 100 μm and only 25% were smaller, unlike the other matrices, which had a higher percentage of microplastics in the 30 to 90 μm range and less than 20% were larger.
Finally, microplastics smaller than 30 μm were detected in 20% of samples collected at the inlet to the drinking water treatment plant and in 5% of the tap water samples; these particles were within the size range of 30–20 μm, which is currently the limit of detection of the optimised method.

4. Discussion

Great variability was observed in the number of microplastic particles identified in the different drinking water samples. This depended on (i) both the type of analytical protocol and instrumental analysis optimised for their analysis and (ii) different types of water and their origin, which played an important role in their presence in drinking water, together with factors such as seasonality and characteristics of the catchment point.
The analytical protocol and method used play an important role in the MPs determination in the samples examined representing a criticality for this type of analysis. The study conducted by Maurizi et al. [43] has observed how the amount of microplastics detected had varied depending on the protocol and instrumental analysis: from the analysis of the same set of water samples, taken at the inlet and outlet of the drinking water treatment plant, through μ-FTIR and μ-Raman, a different number of MPs can be observed. In particular, μ-FTIR obtained values of MPs lower (~150 times) than μ-Raman, which, instead, gave high values (input: 2500 ± 2000 N/m3, output: 1400 ± 1300 N/m3) [44]; this could be caused by the limit of quantification in dimensional terms that for μ-FTIR was 50 μm, making, below this value, the μ-Raman the method of choice for MPs analysis in drinking water. Conversely, the time of analysis with μ-Raman could be much longer than μ-FTIR (~332 times shorter) so it may be necessary to resort to semi-quantitative strategies. In addition, the final performance of the methods could also be affected by the protocol adopted for the samples prior to analysis and data processing step. This shows that this type of analysis is influenced not only by the nature of the contaminant, the type of matrix investigated, but also by the sampling, pre-treatment, analysis and data processing protocol optimised since it is necessary to reach a compromise between accuracy, time of analysis and requests from the state of the art [43].
For the second point, there are several papers in the literature showing how the level of microplastics in the samples is related to the type of matrix.
Treated drinking water is obtained from different raw water sources, e.g., from groundwater or surface water. The latter may be contaminated with varying amounts of microplastics (MPs): groundwater, due to the filtering action of the soil [7,45], may contain less MPs than groundwater. Conversely, raw water from surface water may have a higher MPs content because it is directly exposed to the environment. In addition, it is necessary to bear in mind that, before being supplied as tap water, groundwater undergoes different treatment stages, depending on its initial conditions, such as coagulation/flocculation, sedimentation, filtration, and disinfection, and that removal efficiency also depends on the size of the MPs analysed. In addition to decreasing the MPs content, drinking water treatment steps can also increase the number of MPs, as the polymeric membranes used in filtration processes may leach MPs and act as a source of contamination. Finally, in addition to treatment processes, it must be considered that drinking water is usually delivered through a pipe system consisting of different materials, including plastic, which could lead to (re)contamination [10].
As shown in Section 3.1, the water samples collected at the inlet to the drinking water treatment plant contained an average of 5 particles/L with a particle size >20 μm, while the samples collected at the outlet of the plant on average contained less than 1 particle/L as many of them were not found to be contaminated in the summer period. It is important to evaluate the period and weather conditions under which sampling was carried out, the source of the DWTP, the nature of the aquifer [7], in addition to the method of sampling and analysis developed, can also influence the levels of MPs present. Indeed, in a similar study conducted by Jung et al., in which the authors observed the variability of MPs in samples taken at the inlet and outlet of a treatment plant over the course of one year, it was observed that MPs present in raw water was less from June to August than in other months; notably, the highest abundance of MP in all raw water samples was observed in December. This shows how the seasonality of sampling affects the abundance of these contaminants. This variability depends on both weather conditions, which affect the status of water bodies, and water quality parameters; for example, stream flow could affect the MPs content related to different rainfall in different season that could affect the pollutants concentration in the original sources. In addition, the diffusion of pollutants in aquatic environments is correlated with their physicochemical properties, such as steric bulk, hydrophilicity and hydrophobicity, as well as the possible presence of inorganic or organic compounds for MPs due to their carrier function; therefore, parameters, such as Total Organic Carbon (TOC) or certain metals concentration, could act as indicators of MPs content in water [46].
The MPs content detected in these samples is similar to some works in the literature [47,48,49]; in particular, for type of polymers identified, of which the most frequent are polyethylene terephthalate, polyethylene and polypropylene [46,50], shape and size [46,50] and MPs content, in fact, e.g., the concentration in the DWTP influent was 4.23 ± 1.26 MPs/L in the Dronjak et al. paper [47].
However, unlike others [1], they appear to be less contaminated or completely free of such pollutants [12,45,48,50]: for example, these results are lower than the results published by Pivokonský et al. [50] whose concentration, for raw water, was 1296 MPs/L and 23 MPs/L or Shi et al., who observed the presence of microplastics in groundwater: microplastics were detected at all sampling sites with concentrations ranging from 4 n/L to 72 n/L, with a mean value of 29 n/L [48] and Wang et al. study where the concentrations of MPs in raw water were 6614 ± 1132 particle/L [12]. In addition, a decrease can be observed between the inlet and outlet DWTP of MPs content and this result is in agreement with the research data of Dronjak et al. [47], who observed that the level of MPs in the effluent (0.075 ± 0.019 MPs/L) was lowered compared to the plant inlet (4.23 ± 1.26 MPs/L) due to the different treatment processes carried out in the plant. The difference in the abundance of microplastics between various regions might be related to the source and usage of microplastics and the population density of each study area and, in addition, the different results are mainly caused by the different size ranges and detection methods.
Once the treated water enters the water supply, it reaches the consumer through various drinking water distribution systems, such as public drinking fountains, tap waters and water kiosks.
By analysing the water samples taken at the aforementioned supply points, a different situation, in terms of the presence of MPs, was observed compared to the MPs content in the samples collected at the outlet from the treatment plant.
The samples taken from the public drinking fountains had a content (5 ± 1.5 MPs/L) that was higher than that the outlet from the drinking water treatment plant assuming, on the other hand, a similar rate of MPs as the samples entering the plant itself.
This difference in the microplastics content detected could be related to other factors, such as the deterioration of fountain filters, drinking water pipes and water storage in a specific urban region. In the study by Shruti et al. [17], for example, which analysed forty-two samples from drinking water fountains in Mexico City, the concentration of microplastics varied significantly depending on the sampling point: the reported results indicate that the abundance of microplastics varied from 5 to 91 particles/L in drinking water, with an overall average of 18 particles/L. The authors hypothesised that this variation could be due to human activities, transportation routes, drinking water pipes and water storage in the urban region.
The results obtained in this paper are not in total agreement: the samples analysed are lower than the average value reported by Shruti et al. [17], although 17 out of 42 sites show a value of less than 10 particle/L and two of these sites show a value of 5 particle/L and, therefore, in line with the values found in this study. A substantial difference, however, was due to the type of polymers identified, in fact, as the authors themselves pointed out, unlike the polymers most commonly identified as PE, PET or PP in many papers in the literature, the polymers identified were poly (trimethylene terephthalate) and epoxy resin.
Therefore, the variability of the obtained data was affected by geographical area considered, particular environmental contexts, water storage conditions, defective filtration units and poor drinking fountain maintenance, as well as transportation and storage conditions [17].
A different situation was observed for tap water samples, which have an average MPs content of 2 ± 1 particles/L in accordance with other papers in the literature [49,51,52], unlike other current works [53,54].
In their research, for example, Lam et al. [49] analysed 110 tap waters in the Hong Kong area founding an average of 2.181 MP/L in the sampled tap water; similar studies were also conducted by Tse et al. [51] and Semmouri et al. [52].
Conversely, in the paper of Kosuth et al. [53], in which tap water samples from 14 different countries in Europe, America, Asia, and Africa were examined, MPs concentrations ranged from 0 to 61 MPs/L with an overall average of 5.45 MPs/L in a size range of 100 to 5000 μm. In contrast, a similar study, where tap water samples from several developed countries, including France, Germany, Japan, and the United States, were analysed; in these samples, MPs concentration was between 1.9 and 225 MPs/L and an overall average concentration of 39 ± 44 MPs/L in a size range between 19.2 μm and 4200 μm [54]. Polymeric distribution, instead, is different in this paper, for example polypropylene or polystyrene [52,54] have predominated while polyethylene was found but its individual quantities were negligible [54].
Additionally for this matrix, MPs contamination is related to the water distribution system: contamination from water treatment plants or the pipeline itself [16,49], fragmentation and abrasion of microplastics in the network [55], leaching of microplastics from pipelines [56] are not negligible factors which may occur along the supply chain and which may affect the contamination of tap water.
Water kiosk samples, on the other hand, were found to be free of MPs: this result was very different from the Shruti et al. research [17], where an overall average microplastic concentration was of 74.18 ± 48.76 microplastics/L for Mexico City water kiosks and the concentrations of microplastics differed among drinking water kiosks in central, northern, and southern Mexico City.
This difference could depend on the water source and the efficiency of the area-specific distribution system, as the water is delivered through different pipelines, and it is subject to pollution along its path. Thus, outdoor drinking water kiosks had lower levels of microplastics (0 particles/L) than bottled water from different countries of the world such as, for example, Thailand [57], Germany [58], and others [53,59]. To confirm this, also considering the data collected on water in both plastic and glass bottles, an increase in the total number of particles identified can be observed: after the reuse of these bottles and/or their exposure to the sun, the number of particles is higher than the total number identified at the initial exposure or use. As this increase was observed for both plastic and glass bottles, it did not depend solely on bottle material but also on other factors, such as cap material, time of use and exposure to the sun.
However, the samples analysed in this study were microplastic-free, a result that differs from the studies present in the literature [1,53,57,58,59].
This difference could be due to the different analytical tools used: as illustrated at the beginning of this paragraph thanks to Maurizi et al.’s paper [43], the MPs amount detected had varied depending on the protocol and instrumental analysis, in fact, results obtained could differ due to the different instrumental performance of μ-FTIR and μ-Raman in relation to their detection limit. In fact, the limit of quantification in dimensional terms that for μ-FTIR was 50 μm while μ-Raman is able to investigate particles of nanometre dimensions. Conversely, visual counting, which classifies MPs into several categories based on colour, size, and morphology, is a simple, convenient, low-cost approach with reduced chemical requirements but it can lead to an overestimation or underestimation of plastic content. Detection accuracy is relatively low as it has a detection limit of 100 μm and this is because light waves can only resolve details larger than half their wavelength, and this limits the ability to accurately distinguish particles smaller than the wavelength of light used for imaging. As particles get smaller than the wavelength of the light (typically 400–700 nm), they become more challenging to visualize [60,61].
In this study, the morphology, colour, size range and polymer identification of the MPs present in the different aqueous matrices were also studied and evaluated.
Fragment morphology was the most common type, unlike in other studies [12,62,63,64], whereas the fibre content was very low (<2%) and was in some cases, due to contamination by the use of face masks in the laboratory. The microplastics found in the samples of the five types of matrices investigated in this study presented a variety of colours, including colourless, green, orange and black. In the various batch samples, however, most of the microplastic particles observed were transparent (>90%), which was consistent with other studies [48,65]. This could be the result of the use and release of plastic bags, packaging materials, fishing gear, containers for food and detergents or clothing, plastic films for example [66,67,68] but also due to several factors due to the dispersion in the environment: UV radiation, temperature and oxidation could cause coloured microplastics to become colourless [69]. The variety of colours, therefore, suggests that the microplastics identified in the various samples originated from various sources of pollution [48].
The microplastics were classified according to three size ranges: 20–30 μm, 30–100 μm, >100 μm, the largest microplastic particle size observed did not exceed 200 μm. All the matrices investigated had an MP particle size within the range 30–100 μm and in three out of four contaminated matrices they represented the highest percentage similarly the study of Pivokonsky et al. [10]: with the exception of the samples from the DWTP outlet, for which only 25% of the particles present such dimensions, in other cases the percentage for this size range is between 60 and 80%. Particles greater than 100 μm are also present in all the matrices containing MPs but with a percentage of between 15 and 20% and excluding samples pre-washed at plant outlet. For this matrix, 75% of the identified MPs particles had dimensions greater than 100 μm. Finally, small microplastics were identified (range 20–30 μm) but only in two out of four of the matrices, i.e., in tap water (5%) and DWTP inlet water (20%).
Finally, the last trend analysed was the type of polymer material identified in the various samples and four different plastics have been identified as MPs. Overall, PET was the most common type of MP detected in three out of four matrices, namely DWTP inlet, drinking fountain and tap water samples (between 60 and 100%). In fact, only samples collected at DWTP outlet were found to be free of PET particles but instead contained PP particles (equal to 100%). Lastly, some matrices also contained PTFE and LDPE particles (40% for GW-I and 20% for tap water, respectively). This trend depends on the source of input of MPs into the water: PET is typically used for beverage bottles, PE is used, for example, for bags, packaging or household items, while PP is also used for packaging and all the polymers identified in the various samples are present in the materials used along the water system such as pipes, fittings, valves [10,12,16,48,50,70,71].
To conclude, despite this study presenting some limitations due to the small sample size, widening the dimensional range or type of shapes investigated, repeating the samples in different seasons, optimising the detection limit of the method in order to detect small microplastics whose exposure could have health effects could improve the study. This pilot study is an optimised analytical method for the analysis of microplastics in water intended for human consumption that is easy, quick, sensitive, efficient and applicable for future routine analysis by water suppliers.

5. Conclusions

The assessment of microplastics in drinking water is a multi-step process, from sampling through to the quantification of microplastics, with each step requiring time and attention to possible sources of contamination. The high variability of the chemical composition and morphology of microplastics is a crucial point for monitoring these contaminants in order to be able to assess consumer exposure through drinking water. This study offers a reproducible and effective method for determining and characterising microplastics in water for human consumption using μ-Raman Spectroscopy. This rapid sample analysis technique makes it possible to assess probable consumer intake by examining drinking water obtained from various points in the supply chain and, if necessary, to attempt to identify the possible source of contamination.
Therefore, μ-Raman Spectroscopy can be successfully used to detect and analyse microplastics (>20 μm) in water for human consumption, as the high resolution of μ-Raman Spectroscopy makes it possible to detect the presence of particles of interest below a certain size range.
In conclusion, the method proposed in this pilot study could be a suitable routine method for monitoring microplastics in drinking water and ensuring consumer health protection.

Author Contributions

Conceptualization, L.L.; formal analysis, E.B.; methodology, A.F., V.G. and M.L.; resources, D.M., V.F., G.F. and G.C. All authors have read and agreed to the published version of the manuscript.

Funding

Italian Ministry of University and Research, National Operational Program (NOP) Research and Innovation 2014–2020, Action IV.5 Doctorates on green topics (CUP B85F21005360001) for grant agreement DOT1326JZS n. 19.

Institutional Review Board Statement

Not applicable.

Informed Consent Statement

Not applicable.

Data Availability Statement

Data are contained within the article.

Acknowledgments

Our thanks to Acea Infrastructure (Grottarossa, Rome), the Italian Water Supplier on whose premises the analyses were carried out.

Conflicts of Interest

The authors declare no conflict of interest.

References

  1. Samandra, S.; Mescall, O.J.; Plaisted, K.; Symons, B.; Xie, S.; Ellis, A.V.; Clarke, B.O. Assessing exposure of the Australian population to microplastics through bottled water consumption. Sci. Total Environ. 2022, 837, 155329. [Google Scholar] [CrossRef]
  2. Li, C.; Busquets, R.; Campos, L.C. Assessment of microplastics in freshwater systems: A review. Sci. Total Environ. 2020, 707, 135578. [Google Scholar] [CrossRef]
  3. Strafella, P.; Lopez Correa, M.; Pyko, I.; Teichert, S.; Gomiero, A. Distribution of microplastics in the marine environment. Handb. Microplastics Environ. 2020, 1–35. [Google Scholar] [CrossRef]
  4. Peng, G.; Bellerby, R.; Zhang, F.; Sun, X.; Li, D. The ocean’s ultimate trashcan: Hadal trenches as major depositories for plastic pollution. Water Res. 2020, 168, 115121. [Google Scholar] [CrossRef] [PubMed]
  5. Parolini, M.; Antonioli, D.; Borgogno, F.; Gibellino, M.C.; Fresta, J.; Albonico, C.; De Felice, B.; Canuto, S.; Concedi, D.; Romani, A.; et al. Microplastic Contamination in Snow from Western Italian Alps. Int. J. Environ. Res. Public Health 2021, 18, 768. [Google Scholar] [CrossRef] [PubMed]
  6. Re, V. Shedding light on the invisible: Addressing the potential for groundwater contamination by plastic microfibers. Hydrogeol. J. 2019, 27, 2719–2727. [Google Scholar] [CrossRef]
  7. Oladoja, N.A.; Unuabona, I.E. The pathways of microplastics contamination in raw and drinking water. J. Water Process Eng. 2021, 41, 102073. [Google Scholar] [CrossRef]
  8. Sun, J.; Dai, X.; Wang, Q.; van Loosdrecht, M.C.; Ni, B.J. Microplastics in wastewater treatment plants: Detection, occur-rence and removal. Water Res. 2019, 152, 21–37. [Google Scholar] [CrossRef]
  9. Viaroli, S.; Lancia, M.; Re, V. Microplastics contamination of groundwater: Current evidence and future perspectives. A review. Sci. Total Environ. 2022, 824, 153851. [Google Scholar] [CrossRef]
  10. Pivokonsky, M.; Cermakova, L.; Novotna, K.; Peer, P.; Cajthaml, T.; Janda, V. Occurrence of microplastics in raw and treated drinking water. Sci. Total Environ. 2018, 643, 1644–1651. [Google Scholar] [CrossRef]
  11. Mintenig, S.M.; Löder, M.G.J.; Primpke, S.; Gerdts, G. Low numbers of microplastics detected in drinking water from groundwater sources. Sci. Total Environ. 2019, 648, 631–635. [Google Scholar] [CrossRef] [PubMed]
  12. Wang, Z.; Lin, T.; Chen, W. Occurrence and removal of microplastics in an advanced drinking water treatment plant (ADWTP). Sci. Total Environ. 2020, 700, 134520. [Google Scholar] [CrossRef] [PubMed]
  13. Schymanski, D.; Goldbeck, C.; Humpf, H.U.; Fürst, P. Analysis of microplastics in water by micro-Raman spectroscopy: Release of plastic particles from different packaging into mineral water. Water Res. 2018, 12, 154–162. [Google Scholar] [CrossRef] [PubMed]
  14. Oßmann, B.E.; Sarau, G.; Holtmannspötter, H.; Pischetsrieder, M.; Christiansen, S.H.; Dicke, W. Small-sized microplas-tics and pigmented particles in bottled mineral water. Water Res. 2018, 14, 307–316. [Google Scholar] [CrossRef] [PubMed]
  15. Winkler, A.; Santo, N.; Ortenzi, M.A.; Bolzoni, E.; Bacchetta, R.; Tremolada, P. Does mechanical stress cause microplastic release from plastic water bottles? Water Res. 2019, 166, 115082. [Google Scholar] [CrossRef] [PubMed]
  16. Tong, H.; Jiang, Q.; Hu, X.; Zhong, X. Occurrence and identification of microplastics in tap water from China. Chemosphere 2020, 252, 126493. [Google Scholar] [CrossRef]
  17. Shruti, V.C.; Pérez-Guevara, F.; Kutralam-Muniasamy, G. Metro station free drinking water fountain-a potential “mi-croplastics hotspot” for human consumption. Environ. Pollut. 2020, 261, 114227. [Google Scholar] [CrossRef]
  18. Danopoulos, E.; Twiddy, M.; Rotchell, J.M. Microplastic contamination of drinking water: A systematic review. PLoS ONE 2020, 15, e0236838. [Google Scholar] [CrossRef]
  19. Oßmann, B.E. Microplastics in drinking water? Present state of knowledge and open questions. Curr. Opin. Food Sci. 2021, 41, 44–51. [Google Scholar] [CrossRef]
  20. Shruti, V.C.; Kutralam-Muniasamy, G.; Pérez-Guevara, F.; Roy, P.D.; Elizalde-Martínez, I. Free, but not microplastic-free, drinking water from outdoor refill kiosks: A challenge and a wake-up call for urban management. Environ. Pollut. 2022, 309, 119800. [Google Scholar] [CrossRef]
  21. Pérez-Guevara, F.; Roy, P.D.; Elizalde-Martínez, I.; Kutralam-Muniasamy, G.; Shruti, V.C. Human exposure to micro-plastics from urban decentralized pay-to-fetch drinking-water refill kiosks. Sci. Total Environ. 2022, 848, 157722. [Google Scholar] [CrossRef] [PubMed]
  22. Eerkes-Medrano, D.; Leslie, H.A.; Quinn, B. Microplastics in drinking water: A review and assessment. Curr. Opin. Environ. Sci. Health 2019, 7, 69–75. [Google Scholar] [CrossRef]
  23. Vethaak, A.D.; Legler, J. Microplastics and human health. Science 2021, 371, 672. [Google Scholar] [CrossRef] [PubMed]
  24. Sangkham, S.; Faikhaw, O.; Munkong, N.; Sakunkoo, P.; Arunlertaree, C.; Chavali, M.; Mousazadeh, M.; Tiwari, A. A review on microplastics and nanoplastics in the environment: Their occurrence, exposure routes, toxic studies, and potential effects on human health. Mar. Pollut. Bull. 2022, 181, 113832. [Google Scholar] [CrossRef] [PubMed]
  25. Alimba, C.G.; Faggio, C.; Sivanesan, S.; Ogunkanmi, A.L.; Krishnamurthi, K. Micro (nano)-plastics in the environment and risk of carcinogenesis: Insight into possible mechanisms. J. Hazard. Mater. 2021, 416, 126143. [Google Scholar] [CrossRef]
  26. Turroni, S.; Wright, S.; Rampelli, S.; Brigidi, P.; Zinzani, P.L.; Candela, M. Microplastics shape the ecology of the human gastrointestinal intestinal tract. Curr. Opin. Toxicol. 2021, 28, 32–37. [Google Scholar] [CrossRef]
  27. Fournier, E.; Leveque, M.; Ruiz, P.; Ratel, J.; Durif, J.C.; Chalancon, S.; Amiard, F.; Edely, M.; Bezirard, V.; Gaultier, E.; et al. Microplastics: What happens in the human digestive tract? First evidences in adults using in vitro gut models. J. Hazard. Mater. 2023, 442, 130010. [Google Scholar] [CrossRef]
  28. Stock, V.; Fahrenson, C.; Thuenemann, A.; Dönmez, M.H.; Voss, L.; Bohmert, L.; Braeuning, A.; Lampen, A.; Sieg, H. Impact of artificial digestion on the sizes and shapes of microplastic particles. Food Chem. Toxicol. 2020, 135, 111010. [Google Scholar] [CrossRef]
  29. Zhang, J.; Wang, L.; Trasande, L.; Kannan, K. Occurrence of polyethylene terephthalate and polycarbonate microplastics in infant and adult feces. Environ. Sci. Technol. Lett. 2021, 8, 989–994. [Google Scholar] [CrossRef]
  30. Leslie, H.A.; Van Velzen, M.J.; Brandsma, S.H.; Vethaak, A.D.; Garcia-Vallejo, J.J.; Lamoree, M.H. Discovery and quanti-fication of plastic particle pollution in human blood. Environ. Int. 2022, 163, 107199. [Google Scholar] [CrossRef]
  31. Jenner, L.C.; Rotchell, J.M.; Bennett, R.T.; Cowen, M.; Tentzeris, V.; Sadofsky, L.R. Detection of microplastics in human lung tissue using μFTIR spectroscopy. Sci. Total Environ. 2022, 831, 154907. [Google Scholar] [CrossRef] [PubMed]
  32. Ragusa, A.; Svelato, A.; Santacroce, C.; Catalano, P.; Notarstefano, V.; Carnevali, O.; Papa, F.; Rongioletti, M.C.A.; Baiocco, F.; Draghi, S.; et al. Plasticenta: First evidence of microplastics in human placenta. Environ. Int. 2021, 146, 106274. [Google Scholar] [CrossRef] [PubMed]
  33. Torres, F.G.; Dioses—Salinas, D.C.; Pizarro-Ortega, C.I.; De-la-Torre, G.E. Sorption of chemical contaminants on de-gradable and non-degradable microplastics: Recent progress and research trends. Sci. Total Environ. 2021, 757, 143875. [Google Scholar] [CrossRef] [PubMed]
  34. Li, Y.; Li, W.; Jarvis, P.; Zhou, W.; Zhang, J.; Chen, J.; Tan, Q.; Tian, Y. Occurrence, removal and potential threats associated with microplastics in drinking water sources. J. Environ. Chem. Eng. 2020, 8, 104527. [Google Scholar] [CrossRef]
  35. Mughini-Gras, L.; van der Plaats, R.Q.J.; van der Wielen, P.W.J.J.; Bauerlein, P.S.; de Roda Husman, A.M. Riverine micro-plastic and microbial community compositions: A field study in the Netherlands. Water Res. 2021, 192, 116852. [Google Scholar] [CrossRef] [PubMed]
  36. Bäuerlein, P.S.; Hofman-Caris, R.C.H.M.; Pieke, E.N.; ter Laak, T.L. Fate of microplastics in the drinking water produc-tion. Water Res. 2022, 221, 118790. [Google Scholar] [CrossRef] [PubMed]
  37. Directive (EU) 2020/2184 of the European Parliament and of the Council of 16 December 2020 on the Quality of Water Intended for Human Consumption (Recast). Official Journal of the European Union L 435/1, 23 December 2020. Available online: https://www.acquadiqualita.it/img/news/direttiva-acque-potabili-2020-2184_420.pdf (accessed on 27 April 2023).
  38. Martellone, L.; Lucentini, L.; Mattei, D.; De Vincenzo, M.; Favero, G.; Bogialli, S.; Litti, L.; Meneghetti, M.; Corami, F.; Rosso, B. Strategie di Campionamento di Microplastiche Negli Ambienti Acquatici e Metodi di Pretrattamento (Rapporti ISTI-SAN 21/2); Istituto Superiore di Sanità: Rome, Italy, 2021. [Google Scholar]
  39. JRC. Analytical Methods to Measure Microplastics in Drinking Water; European Union: Brussels, Belgium, 2022. [Google Scholar]
  40. Schymanski, D.; Oßmann, B.E.; Benismail, N.; Boukerma, K.; Dallmann, G.; Von der Esch, E.; Fischer, D.; Fischer, F.; Gilliland, D.; Glas, K.; et al. Analysis of microplastics in drinking water and other clean water samples with micro-Raman and micro-infrared spectroscopy: Minimum requirements and best practice guidelines. Anal. Bioanal. Chem. 2021, 413, 5969–5994. [Google Scholar] [CrossRef]
  41. EFSA. Presence of microplastics and nanoplastics in food, with particular focus on seafood—EFSA Panel on Contaminants in the Food Chain (CONTAM). EFSA J. 2016, 14, e04501. [Google Scholar]
  42. Liu, Z.; You, X. Recent progress of microplastic toxicity on human exposure base on vitro and in vivo studies. Sci. Total Environ. 2023, 903, 166766. [Google Scholar] [CrossRef]
  43. Maurizi, L.; Iordachescu, L.; Kirstein, I.V.; Nielsen, A.H.; Vollertsen, J. It matters how we measure-Quantification of microplastics in drinking water by μFTIR and μRaman. Heliyon 2023, 9, e20119. [Google Scholar] [CrossRef]
  44. Maurizi, L.; Iordachescu, L.; Kirstein, I.V.; Nielsen, A.H.; Vollertsen, J. Do drinking water plants retain microplastics? An exploratory study using Raman microspectroscopy. Heliyon 2023, 9, e17113. [Google Scholar] [CrossRef] [PubMed]
  45. O’Connor, D.; Pan, S.; Shen, Z.; Song, Y.; Jin, Y.; Wu, W.; Hou, D. Microplastics undergo accelerated vertical migration in sand soil due to small size and wet-dry cycles. Environ. Pollut. 2019, 249, 527–534. [Google Scholar] [CrossRef] [PubMed]
  46. Jung, J.; Kim, S.; Kim, Y.; Jeong, S.; Lee, J. Tracing microplastics from raw water to drinking water treatment plants in Busan, South Korea. Sci. Total Environ. 2022, 825, 154015. [Google Scholar] [CrossRef]
  47. Dronjak, L.; Exposito, N.; Rovira, J.; Florencio, K.; Emiliano, P.; Corzo, B.; Schuhmacher, M.; Valero, F.; Sierra, J. Screening of microplastics in water and sludge lines of a drinking water treatment plant in Catalonia, Spain. Water Res. 2022, 225, 119185. [Google Scholar] [CrossRef] [PubMed]
  48. Shi, J.; Dong, Y.; Shi, Y.; Yin, T.; He, W.; An, T.; Tang, Y.; Hou, X.; Chong, S.; Chen, D.; et al. Groundwater antibi-otics and microplastics in a drinking-water source area, northern China: Occurrence, spatial distribution, risk assess-ment, and correlation. Environ. Res. 2022, 210, 112855. [Google Scholar] [CrossRef]
  49. Lam, T.W.L.; Ho, H.T.; Ma, A.T.H.; Fok, L. Microplastic contamination of surface watersourced tap water in Hong Kong—A preliminary study. Appl. Sci. 2020, 10, 3463. [Google Scholar] [CrossRef]
  50. Pivokonsky, M.; Pivokonska, L.; Novotna, K.; Cermakova, L.; Klimtova, M. Occurrence and fate of microplastics at two different drinking water treatment plants within a river catchment. Sci. Total Environ. 2020, 741, 140236. [Google Scholar] [CrossRef]
  51. Tse, Y.T.; Chan, S.M.N.; Sze, E.T.P. Quantitative assessment of full size microplastics in bottled and tap water samples in Hong Kong. Int. J. Environ. Res. Public Health 2022, 19, 13432. [Google Scholar] [CrossRef]
  52. Semmouri, I.; Vercauteren, M.; Van Acker, E.; Pequer, E.; Asselman, J.; Janssen, C. Presence of microplastics in drinking water from different freshwater sources in Flanders (Belgium), an urbanized region in Europe. Int. J. Food Contam. 2022, 9, 6. [Google Scholar] [CrossRef]
  53. Kosuth, M.; Mason, S.A.; Wattenberg, E.V. Anthropogenic contamination of tap water, beer, and sea salt. PLoS ONE 2018, 13, e0194970. [Google Scholar] [CrossRef]
  54. Mukotaka, A.; Kataoka, T.; Nihei, Y. Rapid analytical method for characterization and quantification of microplastics in tap water using a Fourier-transform infrared microscope. Sci. Total Environ. 2021, 790, 148231. [Google Scholar] [CrossRef] [PubMed]
  55. Shen, M.; Zeng, Z.; Wen, X.; Ren, X.; Zeng, G.; Zhang, Y.; Xiao, R. Presence of microplastics in drinking water from fresh-water sources: The investigation in Changsha. Environ. Sci. Pollut. Res. Int. 2021, 28, 42313–42324. [Google Scholar] [CrossRef]
  56. Chu, X.; Zheng, B.; Li, Z.; Cai, C.; Peng, Z.; Zhao, P.; Tian, Y. Occurrence and distribution of microplastics in water supply systems: In water and pipe scales. Sci. Total Environ. 2022, 803, 150004. [Google Scholar] [CrossRef]
  57. Kankanige, D.; Babel, S. Smaller-sized micro-plastics (MPs) contamination in single-use PET-bottled water in Thailand. Sci. Total Environ. 2020, 717, 137232. [Google Scholar] [CrossRef] [PubMed]
  58. Zhou, X.J.; Wang, J.; Li, H.Y.; Zhang, H.M.; Zhang, D.L. Microplastic pollution of bottled water in China. J. Water Process Eng. 2021, 40, 101884. [Google Scholar] [CrossRef]
  59. Makhdoumi, P.; Amin, A.A.; Karimi, H.; Pirsaheb, M.; Kim, H.; Hossini, H. Occurrence of microplastic particles in the most popular Iranian bottled mineral water brands and an assessment of human exposure. J. Water Process. Eng. 2021, 39, 101708. [Google Scholar] [CrossRef]
  60. Schwaferts, C.; Niessner, R.; Elsner, M.; Ivleva, N.P. Methods for the analysis of submicrometer-and nanoplastic particles in the environment. TrAC 2019, 112, 52–65. [Google Scholar] [CrossRef]
  61. Singh, B.; Kumar, A. Advances in microplastics detection: A comprehensive review of methodologies and their effectiveness. TrAC 2024, 170, 117440. [Google Scholar] [CrossRef]
  62. Dalmau-Soler, J.; Ballesteros-Cano, R.; Boleda, M.R.; Paraira, M.; Ferrer, N.; Lacorte, S. Microplastics from headwaters to tap water: Occurrence and removal in a drinking water treatment plant in Barcelona Metropolitan area (Catalonia, NE Spain). Environ. Sci. Pollut. Res. Int. 2021, 28, 59462–59472. [Google Scholar] [CrossRef]
  63. Cherniak, S.L.; Almuhtaram, H.; McKie, M.J.; Hermabessiere, L.; Yuan, C.; Rochman, C.M.; Andrews, R.C. Conventional and biological treatment for the removal of microplastics from drinking water. Chemosphere 2022, 288, 132587. [Google Scholar] [CrossRef]
  64. Sarkar, D.J.; Das Sarkar, S.; Das, B.K.; Praharaj, J.K.; Mahajan, D.K.; Purokait, B.; Mohanty, T.R.; Mohanty, D.; Gogoi, P.; Kumar, V.S.; et al. Microplastics removal efficiency of drinking water treatment plant with pulse clarifier. J. Hazard. Mater. 2021, 413, 125347. [Google Scholar] [CrossRef] [PubMed]
  65. Wang, T.; Li, B.; Yu, W.; Zou, X. Microplastic pollution and quantitative source apportionment in the Jiangsu coastal area, China. Mar. Pollut. Bull. 2021, 166, 112237. [Google Scholar] [CrossRef] [PubMed]
  66. Wang, G.; Lu, J.; Li, W.; Ning, J.; Zhou, L.; Tong, Y.; Liu, Z.; Zhou, H.; Xiayahazi, N. Seasonal variation and risk assess-ment of microplastics in surface water of the Manas River Basin, China. Ecotoxicol. Environ. Saf. 2021, 208, 111477. [Google Scholar] [CrossRef] [PubMed]
  67. Amrutha, K.; Warrier, A.K. The first report on the source-to-sink characterization of microplastic pollution from a riv-erine environment in tropical India. Sci. Total Environ. 2020, 739, 140377. [Google Scholar] [CrossRef] [PubMed]
  68. Narainrit, C.; Penjai, S.; Charoenpong, C.; Shi, H.; Yeemin, T.; Zhang, J. Abundance, Composition, and Fate of Microplas-tics in Water, Sediment, and Shellfish in the Tapi-Phumduang River System and Bandon Bay, Thailand. Sci. Total Environ. 2021, 781, 146700. [Google Scholar] [CrossRef]
  69. Li, C.; Wang, X.; Liu, K.; Zhu, L.; Wei, N.; Zong, C.; Li, D. Pelagic Microplastics in Surface Water of the Eastern Indian Ocean during Monsoon Transition Period: Abundance, Distribution, and Characteristics. Sci. Total Environ. 2021, 755, 142629. [Google Scholar] [CrossRef]
  70. Novotna, K.; Cermakova, L.; Pivokonska, L.; Cajthaml, T.; Pivokonsky, M. Microplastics in drinking water treatment—Current knowledge and research needs. Sci. Total Environ. 2019, 667, 730–740. [Google Scholar] [CrossRef]
  71. Sol, D.; Laca, A.; Laca, A.; Díaz, M. Approaching the environmental problem of microplastics: Importance of WWTP treatments. Sci. Total Environ. 2020, 740, 140016. [Google Scholar] [CrossRef]
Figure 1. Average microplastic content, subtracted of the blank value, in different aqueous matrices; blank value is reported for each matrix.
Microplastics 03 00003 g001
Figure 2. Polymer distribution of the microparticles found in water.
Microplastics 03 00003 g002
Figure 3. MP size distribution in water samples.
Microplastics 03 00003 g003
Table 1. MPs Abundance in various aqueous matrices.
MatricesSample NumberFiltered VolumeBlank ValueAbundance (Particle/L)
Drinking Water Treatment Plant Inlet
(Groundwater-I)
44 L3 particles/L5 ± 1.5 particles/L
Drinking Water Treatment Plant Outlet
(Groundwater-O)
1010 L1.5 particles/L<1 particle/L
Public Fountain44 L2 particles/L5 ± 1.5 particles/L
Tap Water44 L1 particles/L2 ± 1 particles/L
Water Kiosk1212 L//
Glass Bottles22 L//
Plastic Bottles22 L//
Disclaimer/Publisher’s Note: The statements, opinions and data contained in all publications are solely those of the individual author(s) and contributor(s) and not of MDPI and/or the editor(s). MDPI and/or the editor(s) disclaim responsibility for any injury to people or property resulting from any ideas, methods, instructions or products referred to in the content.

