Article

Comparative Analysis of the Global Transcriptomic Response to Oxidative Stress of Bacillus anthracis htrA-Disrupted and Parental Wild Type Strains

Department of Biochemistry and Molecular Genetics, Israel Institute for Biological Research, Ness-Ziona 74100, Israel
*
Author to whom correspondence should be addressed.
These authors contributed equally to this work.
Microorganisms 2020, 8(12), 1896; https://doi.org/10.3390/microorganisms8121896
Submission received: 3 November 2020 / Revised: 26 November 2020 / Accepted: 27 November 2020 / Published: 30 November 2020

Abstract

:
We previously demonstrated that the HtrA (High Temperature Requirement A) protease/chaperone active in the quality control of protein synthesis, represents an important virulence determinant of Bacillus anthracis. Virulence attenuation of htrA-disrupted Bacillus anthracis strains was attributed to susceptibility of ΔhtrA strains to stress insults, as evidenced by affected growth under various stress conditions. Here, we report a comparative RNA-seq transcriptomic study generating a database of differentially expressed genes in the B. anthracis htrA-disrupted and wild type parental strains under oxidative stress. The study demonstrates that, apart from protease and chaperone activities, HtrA exerts a regulatory role influencing expression of more than 1000 genes under stress. Functional analysis of groups or individual genes exhibiting strain-specific modulation, evidenced (i) massive downregulation in the ΔhtrA and upregulation in the WT strains of various transcriptional regulators, (ii) downregulation of translation processes in the WT strain, and (iii) downregulation of metal ion binding functions and upregulation of sporulation-associated functions in the ΔhtrA strain. These modulated functions are extensively discussed. Fifteen genes uniquely upregulated in the wild type strain were further interrogated for their modulation in response to other stress regimens. Overexpression of one of these genes, encoding for MazG (a nucleoside triphosphate pyrophosphohydrolase involved in various stress responses in other bacteria), in the ΔhtrA strain resulted in partial alleviation of the H2O2-sensitive phenotype.

1. Introduction

The Gram-positive spore-forming obligate pathogen Bacillus anthracis represents the etiological agent of anthrax, a currently rare disease in humans, yet potentially associated with intentional bioterror use [1,2]. In the most severe respiratory form, B. anthracis infection is initiated by inhalation of spores which germinate into fast dividing vegetative cells which secrete toxins and virulence factors during growth in the host (for review, see in [3,4,5]), resulting in massive bacteremia and consequently generalized systemic failure and death.
The lethality of anthrax has been attributed to two main aspects of B. anthracis pathogenesis: the activity of the bacterial exotoxins and the remarkable proliferous nature of the bacteria in the host. This latter aspect of B. anthracis pathogenicity suggests that the pathogen excels in exploiting nutritional resources available in the host and is highly adapted to cope with stress constraints encountered in the course of infection. The B. anthracis exotoxins, encoded by genes located on the virulence plasmid pXO1, are compose of a binary combination of three proteins (Lethal Toxin (LF), Edema Toxin (ET), and Protective antigen (PA)). PA, the common subunit of both toxins, is capable of eliciting a protective immune response, and thus its administration represents the basis for all preventive anthrax countermeasures [4,6]. A second virulence plasmid, pXO2, encodes for functions required for the biosynthesis of a poly-glutamate antiphagocytic capsule necessary for survival of the bacteria in the host [7,8].
Anthrax is acknowledged as a toxinogenic disease, owing to the lethality of pure toxin preparations. Yet, during infection, B. anthracis secretes a large number of proteins, many of which bear biological functions indicative of a role in the onset and progression of the disease [9,10,11,12,13,14,15,16,17]. As of today, very few proteins, other than the classic toxins, have been suggested to play an essential role during B. anthracis infection, based on the attenuated virulence of null mutants entailing targeted disruption of specific genes. Such are the Mn transporter MntA [18], the ClpX protease [19], proteins required for siderophore biosynthesis [20], nitric oxide synthase [21], the pXO1-encoded BslA adhesin [22], the product of the purH gene involved in the purine biosynthesis [23], and the extracellular protease and chaperone HtrA whose role in stress response is addressed in the current study [4] (see in [13] for a list and discussion of reported B. anthracis attenuating mutations).
The HtrA (High Temperature Requirement A) family of serine proteases are central players in the context of protein synthesis quality control. HtrA proteins are structurally and functionally conserved across a wide range of evolutionary distinct phylogenetic classes both in prokaryotes and eukaryotes [24]. They exhibit the dual biological activities of chaperones and proteases, are involved in manifestation of virulence of many pathogens, and consequently represent potential targets for therapy [25,26,27,28,29,30]. HtrA proteases exhibit a characteristic structure, composed of an N-terminal trypsin-like serine protease domain and at least one C-terminal PDZ domain that recognizes substrates and activates the protease function [31,32]. In E. coli and B. subtilis, the HtrA family of proteases are important for the survival of the bacteria under different stress regimens [26,28,33]. In Gram-positive bacteria, the HtrA chaperones/proteases are closely associated with the SecA membrane-translocation machinery suggesting that their targets are constituted by secreted proteins [34]. HtrA was invoked as being directly involved in the proteolytic processing or secretion of specific virulence-associated proteins such as SpeB and Hemolysin in Streptococcus pyogenes [35,36], Pertussis toxin S1 [37], and Adhesin P1 of Streptococcus mutans [38]. In Helicobacter pylori, HtrA was shown to facilitate virulence manifestation by direct proteolysis of host proteins E-cadherin [39,40], as well as by its central role in stress resilience [41].
High-throughput genomic/proteomic/serologic surveys of B. anthracis (reviewed in [4,16,42]) showed that HtrA belongs to a class of exposed immunogenic putative vaccine candidates. B. anthracis HtrA emerged as a potential early secreted anthrax biomarker [11,12,43], and its disruption in the toxinogenic B. anthracis Vollum or Sterne strains resulted in a dramatic attenuation in the guinea pig, murine, and rabbit models of anthrax [13,44]. As HtrA is essential for manifestation of B. anthracis pathogenesis, disruption of the htrA-gene in the non-capsular Sterne strain served for the development of an efficacious and safe next-generation live attenuated anthrax spore vaccine [13,45]. The phenotype associated with disruption of the htrA gene in either virulent or non-virulent (virulence plasmid-cured) strains established that HtrA is necessary for tolerance of various stress stimuli and for modulation of several bacterial proteins potentially involved in the stress response [31,44]. Most notably, htrA-disrupted bacteria exhibited significant sensitivity to hydrogen peroxide-induced oxidative stress correlating with a delayed multiplication of the bacteria in a macrophage infection assay. Of note, resilience to oxidative stress in the host macrophage in the course of infection is considered to represent an important feature of pathogenic bacteria, in general, and B. anthracis in particular [46,47,48,49,50].
In the current report, we address the role of HtrA in the response of B. anthracis to hydrogen peroxide-induced oxidative stress by conducting a comparative transcriptomic study which generated a database of differentially expressed genes (DEGs) in the B. anthracis htrA-disrupted and wild type parental strains. Selected genes emerging from this comparative study were further interrogated for their expression modulation under additional stress treatments, enabling identification of several genes induced specifically by oxidative stress in an HtrA-dependent manner. The study substantiates the important role HtrA plays in the adaptation of the bacteria to the hostile environment, and strengthens the notion that in addition to its direct role in post-translation processing and quality control of proteins associated with its chaperone and protease catalytic activities, B. anthracis HtrA exerts a pleotropic effect on gene expression under oxidative stress conditions.

2. Materials and Methods

2.1. Bacterial Strains, Media, Growth Conditions and Stress Treatment

B. anthracis parental strain ΔVollum (acapsular and nontoxinogenic, referred in this report as wild type (WT)) and the htrA-disrupted strain [44] were cultured in brain–heart infusion (BHI; DIFCO/Becton Dickinson, MD, USA) media at 37 °C to mid-log phase in triplicates. Cells were then split into twin cultures, washed, diluted into fresh media and grown in BHI in the presence or absence of 3mM or 5 mM H2O2, 4% NaCl, or at 41 °C. Optical density (OD at a wavelength of 660 nm) was recorded at several time points in order to determine the growth rate of the two strains under different stress conditions. In the case of H2O2 treatment, samples (4 mL) generated from each culture (WT or ΔhtrA) were collected from each culture before treatment and 10 min post-stress initiation (in the presence of absence of H2O2), centrifuged and pellets were transferred to −70 °C for further use. In the case of heat and salt stress, no samples were collected before stress treatment.

2.2. RNA Isolation, Reverse Transcription, and Real-Time PCR Analyses

Primers employed for the RT-PCR analyses are listed in Supplementary Table S1. Total RNA was extracted from bacteria samples using the RiboPure-Bacteria kit (Ambion, TX, USA) according to the manufacturer’s instructions. Genomic DNA was removed by adding DNase buffer (at a ratio of 1:9) and 4 µL of DNase I was added to the samples, followed by incubation at 37 °C for 30 min. DNase inactivation reagent was subsequently added at a 1:5 (v/v) ratio, followed by incubation at room temperature for 2 min. Samples were then centrifuged (1 min, 13,000× g) to pellet the DNase inactivation reagent and the supernatant (RNA) was transferred into a fresh collection tube and kept at −70 °C until use. Complementary DNA was generated using the Reverse Transcription System (Promega, WI, USA). Random hexamers (0.75 µL) with 0.25 µL of oligo dTs were added to 0.5 µg of RNA. The mix was heated (70 °C, 5 min); cooled to 4 °C and supplemented with 4µL MgCl2, 2 µL reverse transcription buffer, 2 µL dNTPs, 0.5 μL recombinant RNasin ribonuclease inhibitor, and 0.65 µL AMV reverse transcriptase. The reaction mixture was incubated at 37 °C for 10 min, heated to 40 °C for 10 min, 42 °C for 60 min, and cooled to 4 °C. The resulting cDNA was diluted 1:5 and amplified using the PerfeCTa SYBR Green Supermix kit (Quanta BioSciences, MA, USA) with 500 nM gene-specific primers. Experiments were performed using the 7500 ABI Real-Time PCR system (Applied Biosystems, MA, USA). The constitutively expressed gatB gene was used as internal control [51]. Plasmid DNA containing the analyzed gene served as a template for cDNA quantification. In all cases, mock reverse transcriptase reactions, served for determining possible chromosomal DNA contamination, resulted in <5% of the total copies measured.

2.3. RNA Sequencing, Transcriptome Assembly and Differential Expression Analysis

The RNA samples obtained from each of the duplicated or triplicated growth conditions were sequenced in-house (IIBR, Ness Ziona, Israel) using an Illumina Genome Analyzer IIe system (Illumina, CA, USA) with TruSeq sequencing-by-synthesis (SBS) kit version 2 reagents. Raw data for each sample were analyzed for QC using FastQC (https://www.bioinformatics.babraham.ac.uk/projects/fastqc). Raw sequence reads were mapped to the B. anthracis Ames Ancestor reference genome (GenBank accession number NC_007530) using Novoalign, version 3.02.07 (http://www.novocraft.com/). The raw count per gene was calculated using HTSeq [52], version 0.6. In each set of reads, at least 90% was mapped to the reference genome. Reads not mapped were excluded from further analysis. Differential expression analyses of the genes under various conditions were performed using the R package DESeq version 1.16.0 [53]. The reproducibility of the biological replicates for all the conditions examined was assessed by Principal Component Analysis (PCA) using the R package DESeq2 [54]. Similarity matrix and hierarchical clustering were generated using the R packages gplots and RColorBrewer. Default settings in all analytical software programs were used. The transcriptomic data have been deposited to the NCBI database [55]. GEO (Gene Expression Omnibus) accession of the entire transcriptome series: GSE151208. SRA Bioproject: PRJNA635127. GEO title of project: Transcriptome RNA Sequencing Data Sets of B. anthracis Vollum ΔhtrA and Parental Isogenic Wild type strains under Oxidative Stress Conditions. SRA and GEO accession numbers of individual RNA data sets (see Section 3.2): Sample 1a: SAMN15018196; GSM4568574. Sample 1b: SAMN15018194; GSM4568575. Sample 2a: SAMN15018192; GSM4568576. Sample 2b: SAMN15018191; GSM4568577. Sample 3a: SAMN15018189; GSM4568578. Sample 3b: SAMN15018187; GSM4568579. Sample 4a: SAMN15018185; GSM4568580. Sample 4b: SAMN15018181; GSM4568581. Sample 4c: SAMN15018200; GSM4568582. Sample 5a: SAMN15018198; GSM4568583. Sample 5b: SAMN150181203; GSM4568584. Sample 6a: SAMN15018205; GSM4568585. Sample 6b: SAMN15018202; GSM4568586. Sample 4c: SAMN15018201; GSM4568587. The expression levels used for classification of DEGs were obtained by averaging those measured in duplicates or triplicates representing same strain and same growth condition. DEGs (adjusted p value < 0.01) that exhibited a modified pattern of expression in both strains, those that were uniquely modulated in the WT, and those that were uniquely modulated in the ΔhtrA strains are documented in Supplementary Tables S2–S4, respectively. Supplementary Tables S3 and S4 are each divided into separate sheets for upregulated and downregulated genes.

2.4. Genome Annotations and Gene Ontology Analysis

The B. anthracis Ames ancestor genome sequence (GCA_000008445.1) was obtained from the NCBI database. The genome was annotated based on protein homology to the “Bacteria” phylogenetic domain using the OmicsBox software BlastX tool (https://www.biobam.com/omicsbox) with default parameters. Functional classification of DEGs with adjusted p value < 0.05 that were uniquely modulated in either the WT or the ΔhtrA strains was carried out using the OmicsBox mapping tool [56], providing a global view of GO terms for the genes. Fisher’s exact test for these DEGs was performed using the OmicsBox software to estimate the association between the DEG and specific GO categories when compared with the background genes. Throughout the article, individual genes are referred by their GBAA NCBI locus tag numbers for the B. anthracis Ames chromosome.

2.5. Overexpression of MazG in the ΔVollum ΔhtrA Strain and Evaluation of Its Involvement in Oxidative Stress Response

The gene encoding MazG was amplified by PCR from the B. anthracis ΔVollum strain using the MazG forward (AGACCTAGATCTTATACAAAAAGGAGTACGTATATGAATC-AAAATACAATAAA) and the MazG reverse (AGATAGACCTGGATCCCTATAGT-TCGTTATATTTTTTAT) primers. The product (as a SnaBI-BamHI fragment) was ligated into the linearized pASC-α Bacillus expression vector (ApRCmR, pC194 ori [14,44]), removing the pagA gene resulting in the MazG expression vector pASC-MazG. Thus, the MazG coding sequence replaced the pagA gene downstream of the pagA ribosome binding site and the α-amylase promoter. The plasmid pASC-MazG was used to transform the methylation-deficient E. coli strain GM2929 as previously described [44], after which it was introduced into a competent ΔVollum ΔhtrA strain. Recombinant colonies were plated on LB medium containing 7.5 µg/mL chloramphenicol. The B. anthracis strains ΔhtrA or ΔhtrA/MazG (overexpressing the gene encoding for MazG) were cultured in BHI media at 37 °C for 2.5–3 h. Cells were then split into BHI cultures containing 0, 1, 3, 5, or 10 mM H2O2 and allowed to grow for 150 min. OD was determined at several time points as described.

3. Results and Discussion

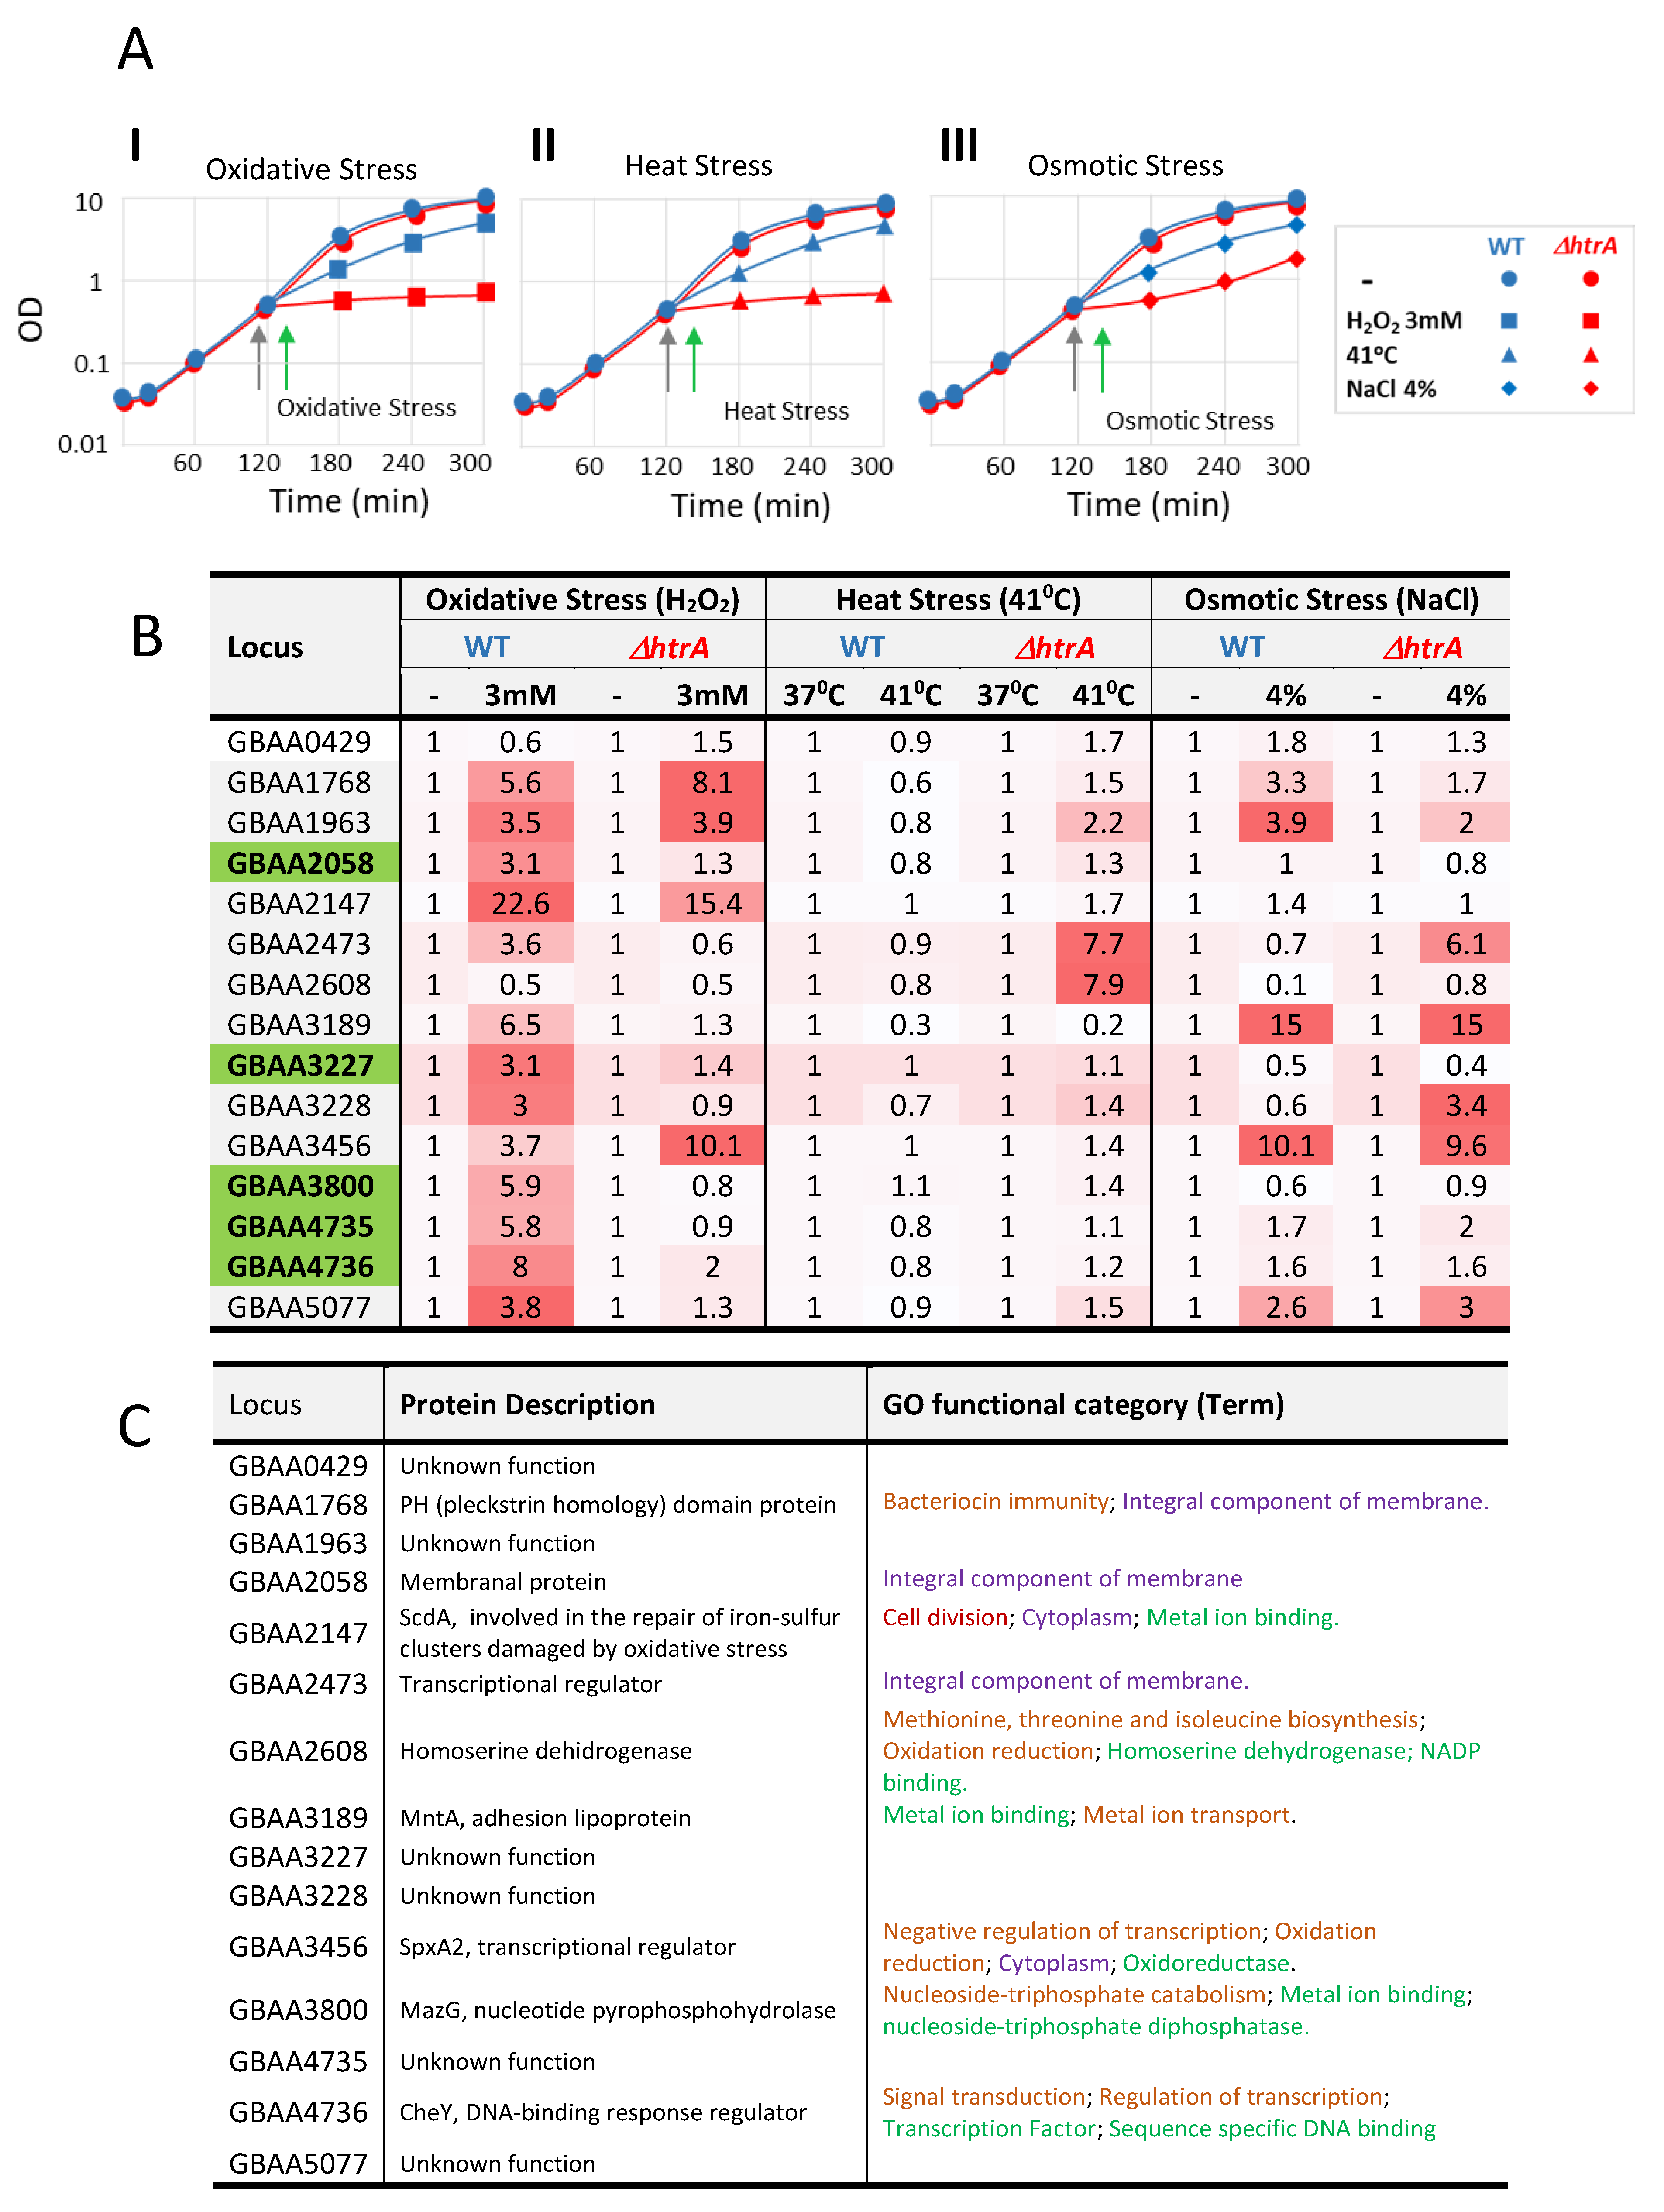
3.1. Expression of Selected Oxidative Stress Response Genes in Response to H2O2

We have previously shown that B. anthracis tolerance to hydrogen peroxide (as well as to other stress regimens) is significantly affected by htrA gene disruption [13,31,44]. Based on this observation, it was postulated that the significant virulence attenuation exhibited by the fully virulent Vollum or the acapsular Sterne strains upon abrogation of HtrA expression, may be attributed to inability to respond optimally to oxidative stress. The data depicted in Figure 1 confirmed that htrA disruption in the non-toxinogenic non-encapsulated (devoid of the pXO1 and pXO2 virulence plasmids) B. anthracis Vollum strain impacted its ability to tolerate oxidative stress induced by increasing concentrations of H2O2. The growth rate of both the WT and the ΔhtrA strain under stress-free conditions was identical; however, addition of H2O2 resulted in an immediate growth arrest in both strains. However, while the growth of the WT cells exhibited a short lag period after which it restored its initial rate, the growth of the ΔhtrA strain was irreversibly blocked in the presence of H2O2. These results are in line with our previously published results [13,44,57].
Previous studies of the response of Bacillus subtilis and B. anthracis to stress have shown that H2O2 treatment induces the expression of several genes attributed with a major role in mediating the resilience of the cells to oxidative stress [58,59,60]. Therefore, we verified whether the susceptibility of the ΔhtrA strain to hydrogen peroxide may involve low expression levels of such genes. The expression pattern following H2O2 treatment of the following three selected genes, known to play a major role in the resilience to oxidative stress, was therefore determined by RT-PCR analysis: katB (encoding the major catalase of the bacteria, involved in the peroxide neutralization [60]), dps2 (whose product contributes to peroxide stress resistance by protecting DNA from oxidative damage and sequestering cellular free iron to prevent the production of hydroxyl radicals [61,62]), and ahpC (encoding for the active subunit of the enzyme alkyl hydroperoxide reductase, known to be essential under oxidative stress conditions [63]). We observed that the transcription of all three genes was induced rapidly upon treatment with hydrogen peroxide in both strains, exhibiting similar induction indexes (Figure 1B). For example, expression of katB gene, the main catalase protecting B. anthracis against peroxide stress, increased >20 fold in WT and >30 fold in the ΔhtrA strain. These results suggested that the enhanced sensitivity of the ΔhtrA mutant to H2O2 does not involve the activity of the major players in the response to hydrogen peroxide. Furthermore, the expression level of htrA itself remained unaffected in the WT strain upon peroxide treatment (Figure 1B). Consequently, it may be hypothesized that the increased sensitivity of the mutated strain to peroxide involves a more pleiotropic role of HtrA. Such an effect may indicate that HtrA acts directly or indirectly also as a regulatory factor necessary for the stress response, in addition to its major catalytic activity—proteolysis of misfolded proteins accumulating under stress conditions. Indeed, a study of the phenotype of B. anthracis cells expressing various mutated forms of HtrA showed that engineered forms of HtrA, deprived of the proteolytic catalytic activity, were efficient in promoting upregulation of the starvation-induced NprA extracellular protease [31]. NprA is one of the most abundant proteins secreted by the WT strain under low-nutrient conditions, yet undetected in the secretome of B. anthracis ΔhtrA strains [31,44,64]. We therefore concluded that understanding the virulence-related role of HtrA in general and its activity in the stress response in particular, may benefit from a comparative global examination of the pattern of expression of additional genes under oxidative stress in the HtrA-disrupted and WT strains.

3.2. Overview of the Transcriptome Analysis in Response to Oxidative Stress

For the RNA-seq comparative transcriptome analysis, the ΔhtrA and WT strains were grown in biological triplicates or duplicates and RNA was prepared from the following samples (as schematically described in Figure 2A): samples 1 and 2, collected from the initial cultures before treatment, representing the WT and ΔhtrA strains, respectively, in duplicates. Samples 4 and 6, in triplicates, collected 10 min post-treatment with H2O2, from the WT and ΔhtrA strain, respectively. Samples 3 (WT) and 5 (ΔhtrA), control untreated (without H2O2) groups in duplicates, handled similarly to samples 4 and 6. Transcriptomic quantification of RNA representing duplicates generated highly similar gene expression data, as demonstrated by the principal component analysis (PCA, Figure 2B), heat map of Euclidean sample distances (R2 value correlation between samples, Figure 2C), and heat map of the 100 genes with the highest variance across samples (Figure 2D). These evaluations established the high reproducibility of the transcriptome RNA-seq analysis and consistency of the results in the independent duplicated or triplicated experimental groups. The expression data of each particular gene from duplicated or triplicated experimental groups were averaged prior to the analysis. The transcriptomic data have been deposited to the NCBI database [55]. The transcriptomes determined in the absence of H2O2 (i.e., samples 1 and 3 for the WT strain, and 2 and 5 for the ΔhtrA strain, see Figure 2A) were highly similar. Accordingly, the subsequent analysis of the differentially expressed genes (DEGs) was based on comparison of the H2O2 regulon of the WT strain (determined by comparing sample 3 to 4) to that of the ΔhtrA strain (determined by comparing sample 5 to 6).
Quantification of the number of DEGs exhibiting transcription affected by the H2O2 treatment (Figure 3) indicated that oxidative stress significantly modulated the expression of 2449 genes which could be further categorized into 5 major classes: Class I genes that were induced or repressed upon treatment in both strains (1352 genes, listed in Supplementary Table S2), Class II genes that were uniquely upregulated in the WT strain (233 genes, Supplementary Table S3 sheet 1), Class III genes that were uniquely downregulated in the WT strain (145 genes, Supplementary Table S3 sheet 2), Class IV genes that were uniquely upregulated in the ΔhtrA strain (262 genes, Supplementary Table S4 sheet 1), and Class V genes that were uniquely downregulated in the ΔhtrA strain (457 genes, Supplementary Table S4 sheet 2).
The vast majority of the 1352 genes that were significantly modulated in both strains (Class I) exhibited a similar expression trend (i.e., were upregulated or downregulated in both the WT and the ΔhtrA strains, Figure 3B,C). This result suggested that these genes were differentially expressed in response to H2O2 in an HtrA-independent manner. Only a minority (11 out of the 1352 Class I genes) exhibited an opposite expression trend. Four out of these 11 genes were upregulated in the ΔhtrA strain and downregulated in the WT strain. These genes may be involved in “compensation” processes occurring in the ΔhtrA strain for surviving the stress in the absence of HtrA. Seven genes exhibited opposite modulation, i.e., upregulated in the WT and downregulated in the ΔhtrA strain. For example, the GBA3848 gene, encoding a DeoR family transcription regulator, was upregulated in the WT while downregulated 3-fold in the htrA-disrupted strains (see expression levels in Supplementary Table S2). Proteins belonging the DeoR family act as repressors of the deo operon which encodes enzymes that are involved in nucleoside catabolism [65]. Upregulation of DeoR is therefore consistent with a lower level of DNA replication associated with the stress-induced transient growth stagnation possibly necessary for the response to oxidative stress in the in the WT strain. Of note, other DeoR regulatory proteins also exhibited downregulation specifically in the htrA-disrupted (while their transcription level was not modified in the WT strain) and belong consequently to the Class V genes (Figure 3C, see GO-enrichment analysis below). Since the current transcriptomic analysis focused on the HtrA-related stress response (i.e., inspection of genes specifically up or down regulated in one of the strains only), the Class I DEGs (modulated in both strains) was not further inspected.
Notably, a significantly larger number of genes were modulated in the htrA-disrupted strain compared to the WT strain following H2O2 treatment (719 genes compared to 378 genes, Figure 3A,C,D), in line with the concept that the ΔhtrA strain was much more affected by oxidative stress than the parental strain. Furthermore, while in the WT strain there were more upregulated than downregulated genes (233 class II DEGs compared to 145 Class III DEGs), in the case of the ΔhtrA strain, a considerable higher proportion of genes were downregulated (compare Class V to Class IV, Figure 3C,D). Conceivably, this observation reflects the fact that a large number of genes, not essential for growth, were silenced in the htrA disrupted strain, which is more severely affected by the H2O2 treatment. The observation that a high number of genes were modulated, and in particular downregulated, only in the ΔhtrA strain, was confirmed also by the subsequent functional analysis (see below).

3.3. Determination of Functional Categories of DEGs by Gene Ontology (GO) Analysis

The standardized gene function classification system Gene Ontology (GO) was implemented for exploring the physiological significance of the DEGs [66,67,68]. Accordingly, GO assignments were used to classify B. anthracis genes that were differentially expressed upon oxidative stress into functional groups based on the common biological roles of their products. For an updated version of the B. anthracis ORF functional annotation, the genome sequence data of the reference B. anthracis Ames ancestor strain (NCBI accession GCA_000008445.1) was subjected to BLAST analysis using the OmicsBox package. The resulting updated gene functional annotations were subsequently subjected to GO analysis which enabled classification of genes that were uniquely modulated in either the WT or the ΔhtrA strain, based on their putative biological and/or catalytic role. This analysis (referred to as “GO enrichment analysis”, summarized in Figure 4) resulted in assignment of a particular gene to one or more functional categories (referred as GO terms, according to the GO classification), which belong to one of the relevant GO functional divisions (or roots): biological processes, molecular functions, or cellular components. DEGs exhibiting a statistically significant change in their transcriptional level (adjusted p value < 0.05) from each of the 4 classes of genes specifically modulated only in one of the strains (Classes II–V, see Figure 3A,C) were subjected to GO enrichment analysis (see Figure 4A,B, which summarizes the GO analysis of the downregulated and upregulated DEGs, respectively).
Several general conclusions could be drawn from inspection of the number of genes in each GO category (Figure 4): (i) a significantly higher number of genes were modulated upon H2O2 treatment in the ΔhtrA strain. This was true both for down- and upregulated genes, but was most pronounced in the case of downregulated genes (Figure 4A), in which almost all categories included more genes uniquely modulated in the ΔhtrA strain (see detailed reference to individual groups and genes, below). (ii) The majority of categories of upregulated DEGs were more enriched in the ΔhtrA than in WT the strain, in terms of the respective number of genes (Figure 4B). It is important to point out that DEGs which were upregulated solely in the WT strain (compiled in Supplementary Table S3, sheet 1) represented a category of choice for identification of genes potentially contributing to the failure of the ΔhtrA strain to properly respond to stress; therefore, this category was further addressed in the detailed analysis below. (iii) A large number of WT downregulated genes are involved in translation and ribosome structure (Figure 4A, and see discussion below). (iv) Strikingly, the term “intrinsic component of membrane” was overrepresented among the enriched terms of the ΔhtrA upregulated genes (Figure 4B). This phenomenon may be a mere manifestation of the fact that in bacteria many metabolic activities are carried out by proteins localized in membranes. Yet, it is tempting to assume that in the context of the response to stress (which is impaired in the ΔhtrA strain), many membrane-localized proteins were more rapidly upregulated than those residing in other components of the cell, since the membrane represents the interphase between the bacteria and the surroundings. As we attempted to concentrate only on the function of the DEGs, their attribution to GO terms belonging to the “cellular component” division (which solely indicated the localization of the gene products), was beyond the scope of the current study and therefore not further datamined. We note also that all the genes belonging to the “intrinsic component of membrane” GO category were also attributed to other GO terms; therefore, their exclusion from the current analysis did not result in substantial misrepresentation of the functions impacted by oxidative stress.

3.4. Downregulation of Transcriptional Regulators in the ΔhtrA Strain Under Oxidative Stress

Inspection of individual DEGs in the various functional groups (Figure 4A) revealed a significant difference between the WT and the ΔhtrA strains with respect to the downregulation of genes involved in transcription regulation. Thus, 71 unique genes involved in transcription regulation activities (included in “regulation of transcription, DNA-templated” and “DNA binding” GO terms) were downregulated in the ΔhtrA strain, while only 10 unique genes belonging to the same groups were downregulated in the WT strain. The MarR, DeoR, RocR, TetR, and PadR families of transcription regulators were amongst the genes exhibiting a transcriptional level downregulated by a factor of over 5-fold in the ΔhtrA strain. These regulators are involved in the adaptive response to various stress conditions as well as virulence in many bacterial strains including B. anthracis. More specifically, five members of the MarR family transcription regulators were downregulated uniquely in the ΔhtrA strain. Two out of the five genes (GBAA0662 and GBAA5284) were downregulated 10- and 9-fold, respectively. MarR transcriptional regulators are known to play roles in ligand-mediated regulation of virulence factor production and bacterial responses to environment stress [69]. Members of this family are reportedly critical to the virulence of a variety of bacterial pathogens, including Salmonella typhimurium, Yersinia enterocolitica, Vibrio cholera, and Staphylococcus aureus [70]. The putative B. anthracis MarR family transcriptional regulator GBAA1941 was downregulated by a factor of 3 in the ΔhtrA strain. Most notably, this observation confirms an early global transcriptomic study of B. anthracis addressing genes essential for the survival of the bacteria in the host macrophages [71]. This study established that the regulator encoded by the GBAA1941 gene was upregulated upon infection of macrophages, and consequently its disruption influenced manifestation of virulence in a mouse model of inhalational anthrax. Furthermore, taken together, the data were in agreement with our previous observation that ΔhtrA bacteria are affected in their ability to propagate in macrophage cultures [44,45]. Another group of transcriptional regulators exhibiting low transcriptional levels in the ΔhtrA strain belongs to the DeoR family. These proteins act as repressors of the deo operon which encodes enzymes that are involved in nucleoside catabolism [65]. In B. subtilis, a DeoR regulatory protein acts as a repressor of the dra-nupC-pdo operon, encoding three enzymes required for deoxyribonucleoside and deoxyribose utilization [72]. The gene encoding the arginine utilization regulatory protein RocR (GBAA0489) exhibited 11-fold downregulation upon exposure to H2O2 in the ΔhtrA strain. In B. subtilis, RocR acts as a transcriptional activator of the two operons, rocABC and rocDEF, that are involved in arginine and ornithine utilization, respectively [73]. Downregulation of these operons in the htrA-disrupted strain was therefore compatible with the general slowdown of catabolic non-essential processes under oxidative stress conditions. The TetR family transcription regulators acts as repressors of genes and operons relating to osmotic stress, biosynthesis of antibiotic and efflux pumps [74,75,76]. In addition, this family of proteins were also shown to regulate transcription of genes involved in virulence in Vibrio cholera [77,78,79,80], Enterococcus faecalis [81], and Bacillus cereus [82]. Accordingly, it is conceivable that genes relieved from TetR repression are necessary for survival of the htrA-disrupted strain under stress conditions, but not the WT strain which is more resilient to stress. The PadR family consists of a large group of transcription factors that play key roles in the regulation of biological processes underlying survival strategies such as drug resistance, antibiotic synthesis, and detoxification. For example, in Bacillus subtilis PadR regulates transcription in response to toxic coumaric acid [83]. Corynebacterium glutamicum expresses VanR (a member of the PadR family of regulators) to utilize vanillate when other carbon sources are scarce [84]. Altogether, the large number of transcriptional factors downregulated in the ΔhtrA strain upon oxidative stress was consistent with the impaired adaptation to the stress conditions in the absence of HtrA. Future studies will determine if this phenomenon is a cause or a consequence of the hypersensitivity of this strain to stress.
Apart from the modulation of transcriptional factors, as described above, we noted that the group of DEGs specifically downregulated upon H2O2 treatment only in the ΔhtrA strain (p < 0.05) included seven genes (GBAA0831, GBAA4879, GBAA4880, GBAA4374, GBAA4375, GBAA4376, and GBAA5261) that were previously reported to be highly upregulated in B. anthracis grown in blood [85]. These genes encode functions involved in the consumption of amino acids, possibly essential for the survival of the bacteria in the host circulation. Therefore, the observation that these genes were not active in the htrA-disrupted strain was in line with the notion that this strain was significantly affected in its ability to adapt to stressful conditions encountered in the host.

3.5. Downregulation of Translation Processes Exhibited by the WT Strain

A notable phenomenon emerging from the comparative analysis of the response to oxidative stress is the relatively large number of downregulated genes encoding for ribosomal proteins, in the WT strain, as indicated by the pattern of expression of genes belonging to the GO categories “translation”, “rRNA binding”, “structural constituent of ribosome”, “ribosomal subunit”, and “cytosolic ribosome” (Figure 4A). While the WT strain exhibited significant downregulation of 23 individual genes (which constitute these 5 GO categories, note that a gene may belong to more than one GO functional category), in the htrA-disrupted strain expression of only eight genes belonging to these GO categories were observed (Figure 4A). Downregulation of genes encoding ribosomal components may be necessary for limiting toxic translation errors and thereby provide a rationale for active reduction of the level of translation. This concept is supported by the reduction in the abundance of ribosomes in response to stress in B. subtilis [86].

3.6. Downregulation of Genes Encoding Metal Ion Binding Proteins

Thirty-five unique genes downregulated in the ΔhtrA strain were attributed to three categories related to metal ion binding (metal ion binding, zinc ion binding, and magnesium ion binding), while only 10 genes classified to the same categories were downregulated in the WT strain. Yet, only the gene alsS (GBAA0866) encoding acetolactate synthase (AlsS) was downregulated over 5-fold, while the remaining genes exhibited only a moderate lowered transcriptional level. Of note, AlsS was shown to be associated with induction of stress response in E. coli [87] and to be upregulated under stress conditions in Staphylococcus aureus [88]. Therefore, its downregulation in the absence of HtrA may represent a manifestation of the failure of the ΔhtrA strain to respond to oxidative stress. Interestingly, the two genes—GBAA2633 and GBAA4478 (belonging to the “metal ion binding” GO category)—downregulated in the WT strain, encode a cysteine dioxygenase and a 5-methyltetrahydrofolate-homocysteine methyltransferase, respectively (Figure 4A). Cysteine dioxygenase (GBAA2633), which is responsible for the first major step in the metabolism of cysteine, is downregulated 26-fold upon induction of oxidative stress. The second gene, homocysteine methyl transferase (GBAA4478), downregulated more than 3-fold, participates in the process of converting homocysteine to methionine. The downregulation of these two genes that are part of the biosynthesis of cysteine and methionine may imply a metabolic shift that takes place as a countermeasure against oxidative stress in the WT strain. A similar phenomenon was also described in Caulobacter crescentus, in which the main physiological response to oxidative stress was suggested to be represented by a shift in amino acid metabolism resulting in enhancement of the synthesis of histidine at the expense of a reduction of the cysteine and methionine synthesis [89]. Another metal ion binding protein and oxidoreductase, specifically downregulated in the ΔhtrA strain, is Precorrin dehydrogenase, encoded by the GBAA2142 gene, a paralog of the sirC gene in other bacilli [90]. Oxidoreductases similar to GBAA2142 were shown to be beneficial to resilience to oxidative stress in the pathogen Mycobacterium tuberculosis [91,92].

3.7. Genes Transcriptionally Upregulated upon H2O2 Treatment

The GO enrichment gene analysis did not reveal significant differences between the WT and the ΔhtrA strain in the number of upregulated DEGs comprised in the major GO categories. Yet, 25 DEGs belonging to the “oxidation reduction process” GO functional term were specifically upregulated in the ΔhtrA strain, 10 of which exhibiting over 5-fold increase upon H2O2 treatment. On the other hand, this functional GO category includes only seven DEGs in the WT strain, among which only one exhibiting an increase greater than five-fold (Figure 4B and Supplementary Table S3). Two WT genes included in this category are encoding for the Spx transcription regulators, spxA1 (GBAA1200) and spxA2 (GBAA3456). These genes were upregulated 4- and 8-fold, respectively. Spx controls a regulon of more than 100 genes and has a key role in enabling the microorganism to cope with disulfide stress. The Spx regulators of Bacillus subtilis affect the expression of a large regulon in response to proteotoxic conditions, such as heat and disulfide, as well as cell wall stress [93]. Most notably, the observation that these genes fail to be upregulated in the ΔhtrA strain under oxidative stress, are in excellent agreement with a previous report demonstrating that B. anthracis cells in which the expression of spxA1 was abrogated, were sensitive to diamide and hydrogen peroxide, and the spxA1 and spxA2 double mutant cells were hypersensitive to the thiol-specific oxidant, diamide [94].
The GO functional term “DNA binding” includes 23 genes that are upregulated in the WT (Figure 4B and Supplementary Table S3). The majority of the WT upregulated genes that belong to this GO “functional term” encode various regulatory factors, among which are the redox-sensing transcriptional regulator RexR (GBAA0263) [95]; the NrdR repressor (GBAA4824), which negatively regulates the transcription of the nrdEF operon, responsible for the synthesis of dNDPs necessary for DNA replication and repair [96], ArsR (GBAA3103); a metal-resistant protein [97]; the molybdopterin biosynthesis proteins (GBAA4973 and GBAA4976) involved in catalysis of a wide range of oxidation–reduction processes [98]; and TetR paralogs (GBAA4721, GBAA0955, GBAA2543, and GBAA3487). TetR proteins are involved in homeostasis, in the response to osmotic stress [74,75,76]. It is interesting to note that other members of the TetR family were found to be downregulated specifically in the ΔhtrA strain.
Within the category of upregulated DEGs in the ΔhtrA strain, two genes encode flavodoxin proteins (GBAA3596 and GBAA1394, belonging to the oxidation-reduction processes category, Figure 4B), whose expression increased 106- and 26-fold, respectively. Flavodoxins (Flds) are small antioxidant soluble electron transfer flavoproteins found in a wide range of bacteria [99,100,101]. Flavodoxin is typically induced as an adaptive resource under environmental or nutritional hardships allowing survival and reproduction of many organisms under deleterious conditions [101]. GBAA3596 was also reported to be significantly upregulated in B. anthracis grown in mammalian blood. It is conceivable that in the case of growth under oxidative stress, as described in the current study, expression of this gene represents a compensation mechanism activated only in the ΔhtrA strain which is severely affected by the H2O2 treatment [85].
Most notably, the GO functional term “sporulation” included 25 genes uniquely upregulated in the ΔhtrA strain and no genes in the WT strain (Figure 4B). The adjacent genes spoVFA (GBAA3939) and spoVFB (GBAA3938) belonging to this term, encoding dipicolinate synthase subunit A and B [102], were upregulated 6- and 8-fold, respectively, in the ΔhtrA strain. These genes were reported to be expressed in B. subtilis during sporulation [103,104]. Three additional sporulation-related genes (GBAA4042, GBAA4043, and GBAA0053) belonging to this GO functional term encode the sigma factors SigG and SigE, and the stage V sporulation protein T, respectively. The upregulation of sporulation-related genes may suggest that the ΔhtrA strain-initiated sporulation process in response to its inability to cope with the oxidative stress.

3.8. Specificity of Selected Genes to the Response to Oxidative Stress

We have previously shown that the ΔhtrA strain exhibited increased sensitivity not only to oxidative stress, but also to heat and osmotic stress [44]. Genes whose pattern of expression are modified in response to oxidative stress may belong to regulons which are affected by other stress regimens as well (and thus represent a general stress response). As the present study aimed at identification of genes specifically involved in the response to oxidative stress in an HtrA-dependent manner, a group of selected genes (see below) was further interrogated by RT-PCR for their modulation following heat and osmotic stress. We hypothesized that the group of DEGs that in response to H2O2 are specifically modulated in the WT while exhibiting unaffected transcriptional levels in the ΔhtrA strain (378 genes in Classes II and III, see Figure 3A,C,D; listed in Supplementary Table S3) represented the most relevant categories that may encode functions related to the HtrA-dependent susceptibility to oxidative stress. Increasing the induction or repression index to 5-fold, reduced the number of DEGs to 15 genes in each one of the two classes (Figure 3D). Fifteen genes (Tabulated in Figure 5B,C) that were uniquely upregulated in the WT strain (Class II) by at least 5-fold (upon induction of oxidative stress, Padj < 0.01) were selected for further analysis.
These genes encode for a variety of functions and therefore, belong to various GO categories (Figure 5C). The products of six of the selected genes (GBAA0429, GBAA1963, GBAA3227, GBAA3228, GBAA4735, and GBAA5077) did not exhibit any recognizable function, based on the BLAST analysis carried out for functional assignment of the ORFs of the B. anthracis genome, against all bacterial genomes available in the NCBI or the EMBL databases. Upregulation of the transcription of these genes under stress conditions, as evidenced in the present study, may be beneficial for future elucidation of their biological function. Of note, the loci GBAA1963 and GBAA4735 were annotated (in the Ensemble website of the European Bioinformatic Institute-EMI of EMBL, http://www.ensemble.org) as pseudogenes, based on the alleged presence of signals for premature translation termination. Yet, our present observations demonstrating their expression (at least at the transcriptional level) clearly imply that these ORFs represent bona fide genes.
The analysis of the 15 selected class II genes included evaluation (using RT-PCR) of their expression level upon induction of heat, osmotic, and oxidative stress (Figure 5). The results of the real-time PCR analysis following H2O2 treatment (Figure 5B) were comparable to those of the RNA-seq, based on the observation that 13 out of the 15 genes exhibited upregulation of more than 3-fold in the WT strain. Nine genes demonstrated over 3-fold differential induction only in the WT strain following induction of oxidative stress. Interestingly, none of the genes that were induced in the WT upon H2O2 treatment were induced upon induction of heat stress (Figure 5B). These results suggested that the two stress regimens activate different regulons. Two genes (GBAA2473 and GBAA2608) exhibited transcriptional increase in the mutant strain only upon heat stress, implying that they may encode HtrA compensatory functions not specific to oxidative stress. Of note, one of these genes (GBAA2473) was induced in the mutant strain upon salt stress as well.
Seven genes (GBAA1768, GBAA1963, GBAA2473, GBAA3189, GBAA3228, GBAA3456, and GBAA5077) exhibited induction also upon salt stress and therefore are not oxidative stress-specific. Interestingly, one of these genes, GBAA3189, encodes for the MntA protein, an Mn2+ ABC transporter which was extensively studied in the past in our laboratory by mutagenesis studies [18]. MntA was demonstrated to represent a novel B. anthracis virulence determinant, and its role in B. anthracis pathogenesis was attributed to involvement in response to oxidative stress. Yet, the current study suggests that MntA may be involved also in the response to other environmental insults such as osmotic stress. In summary, 5 out of the 15 inspected upregulated genes (GBAA2058, GBAA3227, GBAA3800, GBAA4735, and GBAA4736) exhibited H2O2 specific induction in the WT.

3.9. Preliminary Evaluation of the Involvement of the Gene Encoding for MazG (GBAA3800) in Oxidative Stress Response

To further confirm that the functional screening distinguished genes potentially involved in the response to oxidative stress, one of the genes, mazG (GBAA3800), was selected as a first target for individual inspection. The data in Figure 5 clearly demonstrated that the expression of mazG was significantly upregulated (over 5-fold) upon peroxide treatment only in the parental WT strain. Furthermore, its expression appeared to be upregulated only in response to peroxide but not to other stress regimens. The gene GBAA3800 encodes for MazG, an NTP pyrophophyhdyrolase belonging to a toxin–antitoxin bacterial system [105,106], which has been shown to play a role in the oxidative stress response in Mycobacterium smegmatis [107].
The gene mazG was cloned and overexpressed in ΔhtrA strains derived from both the non-toxinogenic ΔVollum and the toxinogenic Sterne strains. The data in Figure 6A–D showed that the ΔhtrA strain, as anticipated, is unable to withstand oxidative stress, revealing a growth arrest in the presence of H2O2 at a concentration as low as 1 mM H2O2. In contrast, MazG overexpression in the ΔhtrA strain resulted in full resistance to 1 and 3 mM H2O2 and partial resistance to 5 mM H2O2. Increasing the oxidative stress to 10 mM H2O2 resulted in complete growth arrest. Of note, we did not detect any change in the virulence of a SterneΔhtrA strain overexpressing MazG in a murine model of anthrax infection (data not shown), which is consistent with the observation that abrogation of HtrA resulted in the modification of expression of hundreds of genes. Yet, the observation that MazG overexpression enhanced the resilience to H2O2 treatment confirmed that the reductional screen documented in the current report enabled identification of factors involved in the response to oxidative stress.
In conclusion, the study suggests that in B. anthracis, HtrA acts as a pleiotropic master factor of the response to stress, influencing the expression modulation of over 1000 genes (almost one-fifth of B. anthracis ORFs) under stress conditions. Future studies based on co-expression of several genes selected from the current screen may enable further elucidation of the role of HtrA-dependent novel functions (other than the classic toxins) in manifestation of B. anthracis virulence.

Supplementary Materials

The following are available online at https://www.mdpi.com/2076-2607/8/12/1896/s1, Table S1: Oligo-DNA primers employed for RT-PCR analysis, Table S2: Differentially expressed genes following H2O2 treatment in both strains, Table S3: Differentially expressed genes following H2O2 treatment in the WT strain. Sheet 1-Upregulated genes; Sheet 2-Downregulated genes, Table S4: Differentially expressed genes following H2O2 treatment in the ΔhtrA strain strain. Sheet 1-Upregulated genes; Sheet 2-Downregulated genes.

Author Contributions

Conceptualization, T.C. and A.S.; Methodology and Investigation, G.Z., U.E., I.C.-G., M.I., S.R., O.I., S.E., H.C., S.L. and T.C.; Software, G.Z., I.C.-G., A.Z., O.I., and A.B.-D.; Data Curation, T.C., A.S., G.Z., U.E., I.C.-G., and O.I.; Writing—Original Draft Preparation, G.Z., U.E., and T.C.; Writing—Review and Editing, O.C., A.Z., O.I., G.Z., U.E., and T.C.; Supervision, T.C.; Project Administration, T.C. and O.C.; Funding Acquisition, T.C., O.C., A.Z., and A.B.-D. Each author has approved the submitted version. All authors have read and agreed to the published version of the manuscript.

Funding

The study was supported by the IIBR Biology Division intramural grants 5110, 5115, 5124.

Conflicts of Interest

The authors declare no conflict of interest.

References

  1. Ehling-Schulz, M.; Lereclus, D.; Koehler, T.M. The Bacillus cereus Group: Bacillus Species with Pathogenic Potential. Microbiol. Spectr. 2019, 7. [Google Scholar] [CrossRef] [PubMed]
  2. Franz, D.R. Preparedness for an anthrax attack. Mol. Asp. Med. 2009, 30, 503–510. [Google Scholar] [CrossRef] [PubMed]
  3. Blendon, R.J.; Benson, J.M.; DesRoches, C.M.; Pollard, W.E.; Parvanta, C.; Herrmann, M.J. The impact of anthrax attacks on the American public. Med. Gen. Med. 2002, 4, 1. [Google Scholar]
  4. Chitlaru, T.; Altboum, Z.; Reuveny, S.; Shafferman, A. Progress and novel strategies in vaccine development and treatment of anthrax. Immunol. Rev. 2011, 239, 221–236. [Google Scholar] [CrossRef]
  5. Koehler, T.M. Bacillus anthracis physiology and genetics. Mol. Asp. Med. 2009, 30, 386–396. [Google Scholar] [CrossRef] [PubMed] [Green Version]
  6. Friedlander, A.M.; Welkos, S.L.; Ivins, B.E. Anthrax Vaccines. In Anthrax; Koehler, T.M., Ed.; Springer: Berlin/Heidelberg, Germany, 2002; pp. 33–60. [Google Scholar] [CrossRef]
  7. Jelacic, T.M.; Chabot, D.J.; Bozue, J.A.; Tobery, S.A.; West, M.W.; Moody, K.; Yang, D.; Oppenheim, J.J.; Friedlander, A.M. Exposure to Bacillus anthracis capsule results in suppression of human monocyte-derived dendritic cells. Infect. Immun. 2014, 82, 3405–3416. [Google Scholar] [CrossRef] [PubMed] [Green Version]
  8. Jelacic, T.M.; Ribot, W.J.; Chua, J.; Boyer, A.E.; Woolfitt, A.R.; Barr, J.R.; Friedlander, A.M. Human Innate Immune Cells Respond Differentially to Poly-gamma-Glutamic Acid Polymers from Bacillus anthracis and Nonpathogenic Bacillus Species. J. Immunol. 2020, 204, 1263–1273. [Google Scholar] [CrossRef]
  9. Ariel, N.; Zvi, A.; Grosfeld, H.; Gat, O.; Inbar, Y.; Velan, B.; Cohen, S.; Shafferman, A. Search for potential vaccine candidate open reading frames in the Bacillus anthracis virulence plasmid pXO1: In silico and in vitro screening. Infect. Immun. 2002, 70, 6817–6827. [Google Scholar] [CrossRef] [Green Version]
  10. Ariel, N.; Zvi, A.; Makarova, K.S.; Chitlaru, T.; Elhanany, E.; Velan, B.; Cohen, S.; Friedlander, A.M.; Shafferman, A. Genome-based bioinformatic selection of chromosomal Bacillus anthracis putative vaccine candidates coupled with proteomic identification of surface-associated antigens. Infect. Immun. 2003, 71, 4563–4579. [Google Scholar] [CrossRef] [Green Version]
  11. Chitlaru, T.; Gat, O.; Gozlan, Y.; Ariel, N.; Shafferman, A. Differential proteomic analysis of the Bacillus anthracis secretome: Distinct plasmid and chromosome CO2-dependent cross talk mechanisms modulate extracellular proteolytic activities. J. Bacteriol. 2006, 188, 3551–3571. [Google Scholar] [CrossRef] [Green Version]
  12. Chitlaru, T.; Gat, O.; Gozlan, Y.; Grosfeld, H.; Inbar, I.; Shafferman, A. Identification of in vivo expressed immunogenic proteins by serological proteome analysis of Bacillus anthracis secretome. Infect. Immun. 2007, 75, 2841–2852. [Google Scholar] [CrossRef] [PubMed] [Green Version]
  13. Chitlaru, T.; Israeli, M.; Bar-Haim, E.; Elia, U.; Rotem, S.; Ehrlich, S.; Cohen, O.; Shafferman, A. Next-Generation Bacillus anthracis Live Attenuated Spore Vaccine Based on the htrA(-) (High Temperature Requirement A) Sterne Strain. Sci. Rep. 2016, 6, 18908. [Google Scholar] [CrossRef] [PubMed] [Green Version]
  14. Cohen, S.; Mendelson, I.; Altboum, Z.; Kobiler, D.; Elhanany, E.; Bino, T.; Leitner, M.; Inbar, I.; Rosenberg, H.; Gozes, Y.; et al. Attenuated nontoxinogenic and nonencapsulated recombinant Bacillus anthracis spore vaccines protect against anthrax. Infect. Immun. 2000, 68, 4549–4558. [Google Scholar] [CrossRef] [PubMed] [Green Version]
  15. Pezard, C.; Weber, M.; Sirard, J.C.; Berche, P.; Mock, M. Protective immunity induced by Bacillus anthracis toxin-deficient strains. Infect. Immun. 1995, 63, 1369–1372. [Google Scholar] [CrossRef] [PubMed] [Green Version]
  16. Shafferman, A.; Gat, O.; Ariel, N.; Chitlaru, T.; Grosfeld, H.; Zvi, A.; Inbar, I.; Zaide, G.; Aloni-Grinstein, R.; Cohen, S. Reverse Vaccinology in Bacillus anthracis Bacillus anthracis. In The Challenge of Highly Pathogenic Microorganisms; Springer: Dordrecht, The Netherlands, 2010; pp. 295–306. [Google Scholar]
  17. Jelinski, J.; Terwilliger, A.; Green, S.; Maresso, A. Progress towards the Development of a NEAT Vaccine for Anthrax II: Immunogen Specificity and Alum Effectiveness in an Inhalational Model. Infect. Immun. 2020, 88. [Google Scholar] [CrossRef]
  18. Gat, O.; Mendelson, I.; Chitlaru, T.; Ariel, N.; Altboum, Z.; Levy, H.; Weiss, S.; Grosfeld, H.; Cohen, S.; Shafferman, A. The solute-binding component of a putative Mn(II) ABC transporter (MntA) is a novel Bacillus anthracis virulence determinant. Mol. Microbiol. 2005, 58, 533–551. [Google Scholar] [CrossRef]
  19. McGillivray, S.M.; Ebrahimi, C.M.; Fisher, N.; Sabet, M.; Zhang, D.X.; Chen, Y.; Haste, N.M.; Aroian, R.V.; Gallo, R.L.; Guiney, D.G.; et al. ClpX contributes to innate defense peptide resistance and virulence phenotypes of Bacillus anthracis. J. Innate Immun. 2009, 1, 494–506. [Google Scholar] [CrossRef] [Green Version]
  20. Cendrowski, S.; MacArthur, W.; Hanna, P. Bacillus anthracis requires siderophore biosynthesis for growth in macrophages and mouse virulence. Mol. Microbiol. 2004, 51, 407–417. [Google Scholar] [CrossRef] [Green Version]
  21. Shatalin, K.; Gusarov, I.; Avetissova, E.; Shatalina, Y.; McQuade, L.E.; Lippard, S.J.; Nudler, E. Bacillus anthracis-derived nitric oxide is essential for pathogen virulence and survival in macrophages. Proc. Natl. Acad. Sci. USA 2008, 105, 1009–1013. [Google Scholar] [CrossRef] [Green Version]
  22. Kern, J.; Schneewind, O. BslA, the S-layer adhesin of B. anthracis, is a virulence factor for anthrax pathogenesis. Mol. Microbiol. 2010, 75, 324–332. [Google Scholar] [CrossRef] [Green Version]
  23. Jenkins, A.; Cote, C.; Twenhafel, N.; Merkel, T.; Bozue, J.; Welkos, S. Role of purine biosynthesis in Bacillus anthracis pathogenesis and virulence. Infect. Immun. 2011, 79, 153–166. [Google Scholar] [CrossRef] [PubMed] [Green Version]
  24. Clausen, T.; Kaiser, M.; Huber, R.; Ehrmann, M. HTRA proteases: Regulated proteolysis in protein quality control. Nat. Rev. Mol. Cell Biol. 2011, 12, 152–162. [Google Scholar] [CrossRef] [PubMed]
  25. Backert, S.; Bernegger, S.; Skorko-Glonek, J.; Wessler, S. Extracellular HtrA serine proteases: An emerging new strategy in bacterial pathogenesis. Cell. Microbiol. 2018, 20, e12845. [Google Scholar] [CrossRef] [PubMed] [Green Version]
  26. Clausen, T.; Southan, C.; Ehrmann, M. The HtrA family of proteases: Implications for protein composition and cell fate. Mol. Cell 2002, 10, 443–455. [Google Scholar] [CrossRef]
  27. Danese, P.N.; Silhavy, T.J. The sigma(E) and the Cpx signal transduction systems control the synthesis of periplasmic protein-folding enzymes in Escherichia coli. Genes Dev. 1997, 11, 1183–1193. [Google Scholar] [CrossRef] [Green Version]
  28. Pallen, M.J.; Wren, B.W. The HtrA family of serine proteases. Mol. Microbiol. 1997, 26, 209–221. [Google Scholar] [CrossRef] [Green Version]
  29. Spiess, C.; Beil, A.; Ehrmann, M. A temperature-dependent switch from chaperone to protease in a widely conserved heat shock protein. Cell 1999, 97, 339–347. [Google Scholar] [CrossRef] [Green Version]
  30. Wessler, S.; Schneider, G.; Backert, S. Bacterial serine protease HtrA as a promising new target for antimicrobial therapy? Cell Commun. Signal. 2017, 15, 4. [Google Scholar] [CrossRef] [Green Version]
  31. Israeli, M.; Elia, U.; Rotem, S.; Cohen, H.; Tidhar, A.; Bercovich-Kinori, A.; Cohen, O.; Chitlaru, T. Distinct Contribution of the HtrA Protease and PDZ Domains to Its Function in Stress Resilience and Virulence of Bacillus anthracis. Front. Microbiol. 2019, 10, 255. [Google Scholar] [CrossRef]
  32. Wilken, C.; Kitzing, K.; Kurzbauer, R.; Ehrmann, M.; Clausen, T. Crystal structure of the DegS stress sensor: How a PDZ domain recognizes misfolded protein and activates a protease. Cell 2004, 117, 483–494. [Google Scholar] [CrossRef] [Green Version]
  33. Antelmann, H.; Darmon, E.; Noone, D.; Veening, J.W.; Westers, H.; Bron, S.; Kuipers, O.P.; Devine, K.M.; Hecker, M.; van Dijl, J.M. The extracellular proteome of Bacillus subtilis under secretion stress conditions. Mol. Microbiol. 2003, 49, 143–156. [Google Scholar] [CrossRef] [PubMed] [Green Version]
  34. Tjalsma, H.; Antelmann, H.; Jongbloed, J.D.; Braun, P.G.; Darmon, E.; Dorenbos, R.; Dubois, J.Y.; Westers, H.; Zanen, G.; Quax, W.J.; et al. Proteomics of protein secretion by Bacillus subtilis: Separating the “secrets” of the secretome. Microbiol. Mol. Biol. Rev. 2004, 68, 207–233. [Google Scholar] [CrossRef] [PubMed] [Green Version]
  35. Cole, J.N.; Aquilina, J.A.; Hains, P.G.; Henningham, A.; Sriprakash, K.S.; Caparon, M.G.; Nizet, V.; Kotb, M.; Cordwell, S.J.; Djordjevic, S.P.; et al. Role of group A Streptococcus HtrA in the maturation of SpeB protease. Proteomics 2007, 7, 4488–4498. [Google Scholar] [CrossRef] [PubMed]
  36. Lyon, W.R.; Caparon, M.G. Role for serine protease HtrA (DegP) of Streptococcus pyogenes in the biogenesis of virulence factors SpeB and the hemolysin streptolysin S. Infect. Immun. 2004, 72, 1618–1625. [Google Scholar] [CrossRef] [Green Version]
  37. Vitikainen, M.; Hyyrylainen, H.L.; Kivimaki, A.; Kontinen, V.P.; Sarvas, M. Secretion of heterologous proteins in Bacillus subtilis can be improved by engineering cell components affecting post-translocational protein folding and degradation. J. Appl. Microbiol. 2005, 99, 363–375. [Google Scholar] [CrossRef]
  38. Crowley, P.J.; Seifert, T.B.; Isoda, R.; van Tilburg, M.; Oli, M.W.; Robinette, R.A.; McArthur, W.P.; Bleiweis, A.S.; Brady, L.J. Requirements for surface expression and function of adhesin P1 from Streptococcus mutans. Infect. Immun. 2008, 76, 2456–2468. [Google Scholar] [CrossRef] [Green Version]
  39. Hoy, B.; Lower, M.; Weydig, C.; Carra, G.; Tegtmeyer, N.; Geppert, T.; Schroder, P.; Sewald, N.; Backert, S.; Schneider, G.; et al. Helicobacter pylori HtrA is a new secreted virulence factor that cleaves E-cadherin to disrupt intercellular adhesion. EMBO Rep. 2010, 11, 798–804. [Google Scholar] [CrossRef] [Green Version]
  40. Tegtmeyer, N.; Moodley, Y.; Yamaoka, Y.; Pernitzsch, S.R.; Schmidt, V.; Traverso, F.R.; Schmidt, T.P.; Rad, R.; Yeoh, K.G.; Bow, H.; et al. Characterisation of worldwide Helicobacter pylori strains reveals genetic conservation and essentiality of serine protease HtrA. Mol. Microbiol. 2016, 99, 925–944. [Google Scholar] [CrossRef]
  41. Zarzecka, U.; Modrak-Wojcik, A.; Figaj, D.; Apanowicz, M.; Lesner, A.; Bzowska, A.; Lipinska, B.; Zawilak-Pawlik, A.; Backert, S.; Skorko-Glonek, J. Properties of the HtrA Protease From Bacterium Helicobacter pylori Whose Activity Is Indispensable for Growth Under Stress Conditions. Front. Microbiol. 2019, 10, 961. [Google Scholar] [CrossRef]
  42. Chitlaru, T.; Shafferman, A. Proteomic studies of Bacillus anthracis. Future Microbiol. 2009, 4, 983–998. [Google Scholar] [CrossRef]
  43. Sela-Abramovich, S.; Chitlaru, T.; Gat, O.; Grosfeld, H.; Cohen, O.; Shafferman, A. Novel and unique diagnostic biomarkers for Bacillus anthracis infection. Appl. Environ. Microbiol. 2009, 75, 6157–6167. [Google Scholar] [CrossRef] [PubMed] [Green Version]
  44. Chitlaru, T.; Zaide, G.; Ehrlich, S.; Inbar, I.; Cohen, O.; Shafferman, A. HtrA is a major virulence determinant of Bacillus anthracis. Mol. Microbiol. 2011, 81, 1542–1559. [Google Scholar] [CrossRef] [PubMed]
  45. Chitlaru, T.; Israeli, M.; Rotem, S.; Elia, U.; Bar-Haim, E.; Ehrlich, S.; Cohen, O.; Shafferman, A. A novel live attenuated anthrax spore vaccine based on an acapsular Bacillus anthracis Sterne strain with mutations in the htrA, lef and cya genes. Vaccine 2017, 35, 6030–6040. [Google Scholar] [CrossRef] [PubMed]
  46. Gupta, V.; Jain, K.; Garg, R.; Malik, A.; Gulati, P.; Bhatnagar, R. Characterization of a two component system, Bas1213-1214, important for oxidative stress in Bacillus anthracis. J. Cell. Biochem. 2018, 119, 5761–5774. [Google Scholar] [CrossRef] [PubMed]
  47. Imlay, J.A. Cellular defenses against superoxide and hydrogen peroxide. Annu. Rev. Biochem. 2008, 77, 755–776. [Google Scholar] [CrossRef] [Green Version]
  48. Moayeri, M.; Sastalla, I.; Leppla, S.H. Anthrax and the inflammasome. Microbes Infect. 2012, 14, 392–400. [Google Scholar] [CrossRef] [Green Version]
  49. Popova, T.G.; Teunis, A.; Vaseghi, H.; Zhou, W.; Espina, V.; Liotta, L.A.; Popov, S.G. Nitric oxide as a regulator of B. anthracis pathogenicity. Front. Microbiol. 2015, 6. [Google Scholar] [CrossRef]
  50. Welkos, S.; Bozue, J.; Cote, C. The Interactions between Bacillus anthracis and Macrophages. In Bacillus Anthracis and Anthrax; Wiley: Hoboken, NJ, USA, 2010; pp. 179–208. [Google Scholar] [CrossRef]
  51. Reiter, L.; Kolsto, A.B.; Piehler, A.P. Reference genes for quantitative, reverse-transcription PCR in Bacillus cereus group strains throughout the bacterial life cycle. J. Microbiol. Methods 2011, 86, 210–217. [Google Scholar] [CrossRef]
  52. Anders, S.; Pyl, P.T.; Huber, W. HTSeq—A Python framework to work with high-throughput sequencing data. Bioinformatics 2015, 31, 166–169. [Google Scholar] [CrossRef]
  53. Anders, S.; Huber, W. Differential expression analysis for sequence count data. Genome Biol. 2010, 11, R106. [Google Scholar] [CrossRef] [Green Version]
  54. Love, M.I.; Huber, W.; Anders, S. Moderated estimation of fold change and dispersion for RNA-seq data with DESeq2. Genome Biol. 2014, 15, 550. [Google Scholar] [CrossRef] [PubMed] [Green Version]
  55. Chitlaru, T.; Cohen-Gihon, I.; Israeli, O.; Elia, U.; Zaide, G.; Israeli, M.; Beth-Din, A.; Lazar, S.; Ehrlich, S.; Zvi, A.; et al. Transcriptome Sequencing Data of Bacillus anthracis Vollum DeltahtrA and Its Parental Strain, Isolated under Oxidative Stress. Microbiol. Resour. Announc. 2020, 9. [Google Scholar] [CrossRef] [PubMed]
  56. Gotz, S.; Garcia-Gomez, J.M.; Terol, J.; Williams, T.D.; Nagaraj, S.H.; Nueda, M.J.; Robles, M.; Talon, M.; Dopazo, J.; Conesa, A. High-throughput functional annotation and data mining with the Blast2GO suite. Nucleic Acids Res. 2008, 36, 3420–3435. [Google Scholar] [CrossRef] [PubMed]
  57. Chitlaru, T.; Gat, O.; Zaide, G.; Grosfeld, H.; Inbar, I.; Ehrlich, S.; Leitner, M.; Cohen, O.; Shafferman, A. Proteomic Studies of Bacillus anthracis Reveal In Vitro CO2-Modulation and Expression During Infection of Extracellular Proteases. In The Challenge of Highly Pathogenic Microorganisms; Springer: Dordrecht, The Netherlands, 2010; pp. 11–22. [Google Scholar]
  58. Kim, S.H.; Kim, S.K.; Jung, K.H.; Kim, Y.K.; Hwang, H.C.; Ryu, S.G.; Chai, Y.G. Proteomic analysis of the oxidative stress response induced by low-dose hydrogen peroxide in Bacillus anthracis. J. Microbiol. Biotechnol. 2013, 23, 750–758. [Google Scholar] [CrossRef] [PubMed] [Green Version]
  59. Pohl, S.; Tu, W.Y.; Aldridge, P.D.; Gillespie, C.; Hahne, H.; Mader, U.; Read, T.D.; Harwood, C.R. Combined proteomic and transcriptomic analysis of the response of Bacillus anthracis to oxidative stress. Proteomics 2011, 11, 3036–3055. [Google Scholar] [CrossRef]
  60. Tu, W.Y.; Pohl, S.; Summpunn, P.; Hering, S.; Kerstan, S.; Harwood, C.R. Comparative analysis of the responses of related pathogenic and environmental bacteria to oxidative stress. Microbiology 2012, 158, 636–647. [Google Scholar] [CrossRef] [PubMed] [Green Version]
  61. Tu, W.Y.; Pohl, S.; Gizynski, K.; Harwood, C.R. The iron-binding protein Dps2 confers peroxide stress resistance on Bacillus anthracis. J. Bacteriol. 2012, 194, 925–931. [Google Scholar] [CrossRef]
  62. Xiao, M.; Xu, P.; Zhao, J.; Wang, Z.; Zuo, F.; Zhang, J.; Ren, F.; Li, P.; Chen, S.; Ma, H. Oxidative stress-related responses of Bifidobacterium longum subsp. longum BBMN68 at the proteomic level after exposure to oxygen. Microbiology 2011, 157, 1573–1588. [Google Scholar] [CrossRef]
  63. Antelmann, H.; Engelmann, S.; Schmid, R.; Hecker, M. General and oxidative stress responses in Bacillus subtilis: Cloning, expression, and mutation of the alkyl hydroperoxide reductase operon. J. Bacteriol. 1996, 178, 6571–6578. [Google Scholar] [CrossRef] [Green Version]
  64. Cohen-Gihon, I.; Israeli, O.; Beth-Din, A.; Levy, H.; Cohen, O.; Shafferman, A.; Zvi, A.; Chitlaru, T. Whole-Genome Sequencing of the Nonproteolytic Bacillus anthracis V770-NP1-R Strain Reveals Multiple Mutations in Peptidase Loci. Genome Announc. 2014, 2. [Google Scholar] [CrossRef] [Green Version]
  65. Dandanell, G.; Norris, K.; Hammer, K. Long-distance deoR regulation of gene expression in Escherichia coli. Ann. N. Y. Acad. Sci. 1991, 646, 19–30. [Google Scholar] [CrossRef] [PubMed]
  66. Ashburner, M.; Ball, C.A.; Blake, J.A.; Botstein, D.; Butler, H.; Cherry, J.M.; Davis, A.P.; Dolinski, K.; Dwight, S.S.; Eppig, J.T.; et al. Gene ontology: Tool for the unification of biology. The Gene Ontology Consortium. Nat. Genet. 2000, 25, 25–29. [Google Scholar] [CrossRef] [PubMed] [Green Version]
  67. Mi, H.; Muruganujan, A.; Ebert, D.; Huang, X.; Thomas, P.D. PANTHER version 14: More genomes, a new PANTHER GO-slim and improvements in enrichment analysis tools. Nucleic Acids Res. 2019, 47, D419–D426. [Google Scholar] [CrossRef] [PubMed]
  68. The Gene Ontology Consortium. The Gene Ontology Resource: 20 years and still GOing strong. Nucleic Acids Res. 2019, 47, D330–D338. [Google Scholar] [CrossRef] [Green Version]
  69. Wilkinson, S.P.; Grove, A. Ligand-responsive transcriptional regulation by members of the MarR family of winged helix proteins. Curr. Issues Mol. Biol. 2006, 8, 51–62. [Google Scholar]
  70. Ellison, D.W.; Miller, V.L. Regulation of virulence by members of the MarR/SlyA family. Curr. Opin. Microbiol. 2006, 9, 153–159. [Google Scholar] [CrossRef]
  71. Bergman, N.H.; Anderson, E.C.; Swenson, E.E.; Janes, B.K.; Fisher, N.; Niemeyer, M.M.; Miyoshi, A.D.; Hanna, P.C. Transcriptional profiling of Bacillus anthracis during infection of host macrophages. Infect. Immun. 2007, 75, 3434–3444. [Google Scholar] [CrossRef] [Green Version]
  72. Saxild, H.H.; Andersen, L.N.; Hammer, K. Dra-nupC-pdp operon of Bacillus subtilis: Nucleotide sequence, induction by deoxyribonucleosides, and transcriptional regulation by the deoR-encoded DeoR repressor protein. J. Bacteriol. 1996, 178, 424–434. [Google Scholar] [CrossRef] [Green Version]
  73. Gardan, R.; Rapoport, G.; Debarbouille, M. Expression of the rocDEF operon involved in arginine catabolism in Bacillus subtilis. J. Mol. Biol. 1995, 249, 843–856. [Google Scholar] [CrossRef]
  74. Aramaki, H.; Sagara, Y.; Hosoi, M.; Horiuchi, T. Evidence for autoregulation of camR, which encodes a repressor for the cytochrome P-450cam hydroxylase operon on the Pseudomonas putida CAM plasmid. J. Bacteriol. 1993, 175, 7828–7833. [Google Scholar] [CrossRef] [Green Version]
  75. Aramaki, H.; Sagara, Y.; Kabata, H.; Shimamoto, N.; Horiuchi, T. Purification and characterization of a cam repressor (CamR) for the cytochrome P-450cam hydroxylase operon on the Pseudomonas putida CAM plasmid. J. Bacteriol. 1995, 177, 3120–3127. [Google Scholar] [CrossRef] [PubMed] [Green Version]
  76. Aramaki, H.; Yagi, N.; Suzuki, M. Residues important for the function of a multihelical DNA binding domain in the new transcription factor family of Cam and Tet repressors. Protein Eng. 1995, 8, 1259–1266. [Google Scholar] [CrossRef] [PubMed]
  77. Jobling, M.G.; Holmes, R.K. Characterization of hapR, a positive regulator of the Vibrio cholerae HA/protease gene hap, and its identification as a functional homologue of the Vibrio harveyi luxR gene. Mol. Microbiol. 1997, 26, 1023–1034. [Google Scholar] [CrossRef] [PubMed]
  78. Kovacikova, G.; Skorupski, K. Regulation of virulence gene expression in Vibrio cholerae by quorum sensing: HapR functions at the aphA promoter. Mol. Microbiol. 2002, 46, 1135–1147. [Google Scholar] [CrossRef] [PubMed]
  79. McCarter, L.L. OpaR, a homolog of Vibrio harveyi LuxR, controls opacity of Vibrio parahaemolyticus. J. Bacteriol. 1998, 180, 3166–3173. [Google Scholar] [CrossRef] [PubMed] [Green Version]
  80. Yu, E.W.; Aires, J.R.; Nikaido, H. AcrB multidrug efflux pump of Escherichia coli: Composite substrate-binding cavity of exceptional flexibility generates its extremely wide substrate specificity. J. Bacteriol. 2003, 185, 5657–5664. [Google Scholar] [CrossRef] [PubMed] [Green Version]
  81. Shankar, N.; Baghdayan, A.S.; Gilmore, M.S. Modulation of virulence within a pathogenicity island in vancomycin-resistant Enterococcus faecalis. Nature 2002, 417, 746–750. [Google Scholar] [CrossRef]
  82. Budarina, Z.I.; Nikitin, D.V.; Zenkin, N.; Zakharova, M.; Semenova, E.; Shlyapnikov, M.G.; Rodikova, E.A.; Masyukova, S.; Ogarkov, O.; Baida, G.E.; et al. A new Bacillus cereus DNA-binding protein, HlyIIR, negatively regulates expression of B. cereus haemolysin II. Microbiology 2004, 150, 3691–3701. [Google Scholar] [CrossRef] [Green Version]
  83. Nguyen, T.K.; Tran, N.P.; Cavin, J.F. Genetic and biochemical analysis of PadR-padC promoter interactions during the phenolic acid stress response in Bacillus subtilis 168. J. Bacteriol. 2011, 193, 4180–4191. [Google Scholar] [CrossRef] [Green Version]
  84. Morabbi Heravi, K.; Lange, J.; Watzlawick, H.; Kalinowski, J.; Altenbuchner, J. Transcriptional regulation of the vanillate utilization genes (vanABK Operon) of Corynebacterium glutamicum by VanR, a PadR-like repressor. J. Bacteriol. 2015, 197, 959–972. [Google Scholar] [CrossRef] [Green Version]
  85. Carlson, P.E., Jr.; Bourgis, A.E.; Hagan, A.K.; Hanna, P.C. Global gene expression by Bacillus anthracis during growth in mammalian blood. Pathog. Dis. 2015, 73, ftv061. [Google Scholar] [CrossRef] [PubMed] [Green Version]
  86. Mars, R.A.; Mendonca, K.; Denham, E.L.; van Dijl, J.M. The reduction in small ribosomal subunit abundance in ethanol-stressed cells of Bacillus subtilis is mediated by a SigB-dependent antisense RNA. Biochim. Biophys. Acta 2015, 1853, 2553–2559. [Google Scholar] [CrossRef] [PubMed] [Green Version]
  87. Van Dyk, T.K.; Ayers, B.L.; Morgan, R.W.; Larossa, R.A. Constricted flux through the branched-chain amino acid biosynthetic enzyme acetolactate synthase triggers elevated expression of genes regulated by rpoS and internal acidification. J. Bacteriol. 1998, 180, 785–792. [Google Scholar] [CrossRef] [PubMed] [Green Version]
  88. Augagneur, Y.; King, A.N.; Germain-Amiot, N.; Sassi, M.; Fitzgerald, J.W.; Sahukhal, G.S.; Elasri, M.O.; Felden, B.; Brinsmade, S.R. Analysis of the CodY RNome reveals RsaD as a stress-responsive riboregulator of overflow metabolism in Staphylococcus aureus. Mol. Microbiol. 2020, 113, 309–325. [Google Scholar] [CrossRef]
  89. Silva, L.G.; Lorenzetti, A.P.R.; Ribeiro, R.A.; Alves, I.R.; Leaden, L.; Galhardo, R.S.; Koide, T.; Marques, M.V. OxyR and the hydrogen peroxide stress response in Caulobacter crescentus. Gene 2019, 700, 70–84. [Google Scholar] [CrossRef]
  90. Schubert, H.L.; Rose, R.S.; Leech, H.K.; Brindley, A.A.; Hill, C.P.; Rigby, S.E.; Warren, M.J. Structure and function of SirC from Bacillus megaterium: A metal-binding precorrin-2 dehydrogenase. Biochem. J. 2008, 415, 257–263. [Google Scholar] [CrossRef] [Green Version]
  91. Hatzios, S.K.; Bertozzi, C.R. The regulation of sulfur metabolism in Mycobacterium tuberculosis. PLoS Pathog. 2011, 7, e1002036. [Google Scholar] [CrossRef]
  92. Rohde, K.; Yates, R.M.; Purdy, G.E.; Russell, D.G. Mycobacterium tuberculosis and the environment within the phagosome. Immunol. Rev. 2007, 219, 37–54. [Google Scholar] [CrossRef] [PubMed]
  93. Rojas-Tapias, D.F.; Helmann, J.D. Roles and regulation of Spx family transcription factors in Bacillus subtilis and related species. Adv. Microb. Physiol. 2019, 75, 279–323. [Google Scholar] [CrossRef] [PubMed]
  94. Barendt, S.; Lee, H.; Birch, C.; Nakano, M.M.; Jones, M.; Zuber, P. Transcriptomic and phenotypic analysis of paralogous spx gene function in Bacillus anthracis Sterne. Microbiologyopen 2013, 2, 695–714. [Google Scholar] [CrossRef] [PubMed]
  95. Ravcheev, D.A.; Li, X.; Latif, H.; Zengler, K.; Leyn, S.A.; Korostelev, Y.D.; Kazakov, A.E.; Novichkov, P.S.; Osterman, A.L.; Rodionov, D.A. Transcriptional regulation of central carbon and energy metabolism in bacteria by redox-responsive repressor Rex. J. Bacteriol. 2012, 194, 1145–1157. [Google Scholar] [CrossRef] [PubMed]
  96. Grinberg, I.; Shteinberg, T.; Gorovitz, B.; Aharonowitz, Y.; Cohen, G.; Borovok, I. The Streptomyces NrdR transcriptional regulator is a Zn ribbon/ATP cone protein that binds to the promoter regions of class Ia and class II ribonucleotide reductase operons. J. Bacteriol. 2006, 188, 7635–7644. [Google Scholar] [CrossRef] [PubMed] [Green Version]
  97. Busenlehner, L.S.; Pennella, M.A.; Giedroc, D.P. The SmtB/ArsR family of metalloregulatory transcriptional repressors: Structural insights into prokaryotic metal resistance. FEMS Microbiol. Rev. 2003, 27, 131–143. [Google Scholar] [CrossRef] [Green Version]
  98. Iobbi-Nivol, C.; Leimkuhler, S. Molybdenum enzymes, their maturation and molybdenum cofactor biosynthesis in Escherichia coli. Biochim. Biophys. Acta 2013, 1827, 1086–1101. [Google Scholar] [CrossRef] [Green Version]
  99. Sancho, J. Flavodoxins: Sequence, folding, binding, function and beyond. Cell. Mol. Life Sci. 2006, 63, 855–864. [Google Scholar] [CrossRef]
  100. Lodeyro, A.F.; Ceccoli, R.D.; Pierella Karlusich, J.J.; Carrillo, N. The importance of flavodoxin for environmental stress tolerance in photosynthetic microorganisms and transgenic plants. Mechanism, evolution and biotechnological potential. FEBS Lett. 2012, 586, 2917–2924. [Google Scholar] [CrossRef] [Green Version]
  101. Zurbriggen, M.D.; Tognetti, V.B.; Carrillo, N. Stress-inducible flavodoxin from photosynthetic microorganisms. The mystery of flavodoxin loss from the plant genome. IUBMB Life 2007, 59, 355–360. [Google Scholar] [CrossRef]
  102. Chen, N.Y.; Jiang, S.Q.; Klein, D.A.; Paulus, H. Organization and nucleotide sequence of the Bacillus subtilis diaminopimelate operon, a cluster of genes encoding the first three enzymes of diaminopimelate synthesis and dipicolinate synthase. J. Biol. Chem. 1993, 268, 9448–9465. [Google Scholar]
  103. Balassa, G.; Milhaud, P.; Raulet, E.; Silva, M.T.; Sousa, J.C. A Bacillus subtilis mutant requiring dipicolinic acid for the development of heat-resistant spores. J. Gen. Microbiol. 1979, 110, 365–379. [Google Scholar] [CrossRef] [Green Version]
  104. Daniel, R.A.; Errington, J. Cloning, DNA sequence, functional analysis and transcriptional regulation of the genes encoding dipicolinic acid synthetase required for sporulation in Bacillus subtilis. J. Mol. Biol. 1993, 232, 468–483. [Google Scholar] [CrossRef] [PubMed]
  105. Drobnak, I.; Korencic, A.; Loris, R.; Marianovsky, I.; Glaser, G.; Jamnik, A.; Vesnaver, G.; Lah, J. Energetics of MazG unfolding in correlation with its structural features. J. Mol. Biol. 2009, 392, 63–74. [Google Scholar] [CrossRef] [PubMed]
  106. Gross, M.; Marianovsky, I.; Glaser, G. MazG—A regulator of programmed cell death in Escherichia coli. Mol. Microbiol. 2006, 59, 590–601. [Google Scholar] [CrossRef] [PubMed]
  107. Lu, L.D.; Sun, Q.; Fan, X.Y.; Zhong, Y.; Yao, Y.F.; Zhao, G.P. Mycobacterial MazG is a novel NTP pyrophosphohydrolase involved in oxidative stress response. J. Biol. Chem. 2010, 285, 28076–28085. [Google Scholar] [CrossRef] [PubMed] [Green Version]
Figure 1. Hydrogen peroxide effect on the growth profiles and expression of selected genes of B. anthracis WT and ΔhtrA strains. (A) Hydrogen peroxide effect on the growth profiles of B. anthracis WT and ΔhtrA strains. The two strains were grown in BHI media for 3 h, then split into twin cultures and treated with 3 mM or 5 mM H2O2, as indicated (see inset legend). The gray arrow indicates the time point after addition of H2O2 at cell densities of OD600 = 1. Full growth curves of various strains of B. anthracis were previously extensively documented [13,44,45,57]. (B) Hydrogen peroxide effect on expression of selected genes belonging to the oxidative stress regulon. RNA was prepared from samples collected 10 min after onset of H2O2 treatment (see green arrow in panel A). Transcription levels of the genes htrA (GBAA3660), dps2 (GBAA5290), katB (GBAA1159), and ahpC (GBAA0345) were determined by qRT-PCR. The measured values (expressed as copies/100 ngRNA) are indicated within the histograms. The fold increase in the abundance of each transcript upon H2O2 treatment is indicated between the histograms. The data depicted were obtained in one representative experiment, of three independent iterations, which yielded similar results (<10% variability).
Microorganisms 08 01896 g001
Figure 2. (A) Schematic representation of the cultures which served for collecting the WT and ΔhtrA samples for transcriptomic analysis. All WT samples (samples 1, 3, and 4) as well as the growth curve are in blue while those of the ΔhtrA strain (samples 2, 5, and 6) are in red. Samples 1 and 2 were collected before dividing each culture into tween flasks and continuing growth in the presence (samples 4 and 6) or absence (samples 3 and 5) of 3 mM H2O2. Samples 3–6 were collected 10 min after the onset of H2O2 treatment. Samples 1, 2, 3, and 5 were done in duplicates (marked a and b, see below), and samples 4 and 6 were done in triplicates (marked a, b, and c, see below). The RNA seq transcriptomic data of all samples were deposited to the NCBI database (as detailed in [55]). (B) Principal component analysis (PCA; after regularized log transformation) of gene expression of the various transcriptomes indicated in panel A. The dots represent distinct replicates (duplicates for samples 1, 2, 3, and 5, and triplicates for samples 4 and 6); their clustering indicating high similarity, underlines the reproducibility of the transcriptomic data. (C) Correlation heatmap of Euclidean sample distances after regularized log transformation. The dendrograms on the left and upper sides indicate hierarchical clustering of the duplicate and triplicate samples. Note also the similarity between transcriptomes 1 and 3 and between transcriptomes 2 and 5, which represent cultures grown in the absence of H2O2, as indicated in panel 1. (D) Heatmap diagram of the relative expression level of the 100 genes with the highest variance across samples. Similar to panel C, the dendrogram at the top indicate hierarchical clustering of the duplicate and triplicate samples as well as the similarity between the H2O2 treated and untreated-culture transcriptomes in each of the 2 strains.
Microorganisms 08 01896 g002
Figure 3. (A) Venn diagram of the three major categories of DEGs. Number of genes whose pattern of expression is modified by the H2O2 treatment in both strains (Class I), in the WT strain (classes II and III), or in the ΔhtrA strain (Classes IV and V) is indicated. (B) All genes expression pattern scatterplot of log2 fold change. Each dot represents an individual gene; its x value is the log2 fold-change in the WT, and its y values is the log2 fold-change in the ΔhtrA strains, before and after H2O2 treatment. Dot color significance: gray dots represent genes exhibiting a pattern of expression not modified by stress; blue dots represent genes modulated in the WT strain only; red dots represent genes modulated in the ΔhtrA strain only; light blue dots represent genes modulated in both strains. Note the diagonal trend of the scattered dots in the latter category (light blue) indicating that these genes exhibited a similar pattern of modulation in both strains. (C) Number of genes in each of the 5 Classes of DEGs. Upregulation and downregulation of genes are indicated by green ascending arrows or red descending arrows, respectively. Note that Class I genes comprise all the genes which exhibited a modified pattern of expression in both strains, both upregulated and downregulated; the vast majority of the genes in this class exhibited either upregulation or downregulation in both strains, and only a minority exhibited an inverted pattern. A green color gradient was applied to the table-cells in the right column according to the number of genes in each class. (D) Histograms representing the number of Class II and III (left panel, WT-specific modulated genes) and classes IV and V (right panel, ΔhtrA-specific modulated genes), as calculated by considering all the significantly modulated (indicated as “all”) or by a more stringent 5-fold modulation index (indicated as “×5”). An adjusted p value of < 0.01 was applied. Histograms of upregulated genes are green, those representing downregulated genes are red.
Microorganisms 08 01896 g003
Figure 4. Gene Ontology (GO) analysis of downregulated (A) and upregulated (B) DEGs upon H2O2. (A). Inherent to the GO enrichment analysis, one particular gene may belong to more than one GO category. For the GO analysis, an adjusted p value of < 0.05 was applied.
Microorganisms 08 01896 g004
Figure 5. RT-PCR analysis of the transcription level of 15 Class II genes following oxidative, heat, and osmotic stress. (A) Growth profile of the WT (blue curves) and ΔhtrA (red curves) strains in the presence or absence of 3 mM H2O2 (graph I), 41 °C (graph II), or 4%NaCl (graph III). Growth curves in the absence of stress at 37 °C are indicated by circles, in the presence of H2O2 by squares, at 41 °C by triangles, and in the presence of NaCl by diamonds. Gray arrows indicate the time of culture splitting into treated and untreated groups. Green arrows indicate the time of cell collection for RNA preparation. (B) Fold-change of 15 individual genes (indicated by their NCBI locus tag, on the left column) following the 3 stress regimens in either one of the strains. The transcription level in the absence of stress regimen was considered as 1 and that following stress treatment indicate the fold-change. Red gradient backgrounds indicate the extent of upregulation. Green background of locus tags indicates genes upregulated only upon H2O2 treatment and only in the WT strain. (C) Functional annotations of the proteins encoded by the 15 selected genes. The colors of the GO functional categories indicate the GO division (root) to which they belong: biological processes (in brown), molecular function (green), and cellular component (violet).
Microorganisms 08 01896 g005
Figure 6. Growth of a MazG overexpressing ΔhtrA-strain under oxidative stress. B. anthracis cells of the ΔhtrA strain or ΔhtrA overexpressing MazG (referred as ΔhtrA/MazG) were grown in the absence (red circles: ΔhtrA; blue circles: ΔhtrA/MazG) or presence (yellow circles: ΔhtrA; green circles: ΔhtrA/MazG) of H2O2, as indicated in the legend on the right side. Panels (AD) represent increasing concentrations of H2O2, as indicated above the curves. The growth curves in the absence of stress regimen are included in each panel for clarity. The curves describe the growth after initiation of the H2O2 treatment (considered time 0) of a representative experiment. Two additional experiments were carried out yielding similar results.
Microorganisms 08 01896 g006
Publisher’s Note: MDPI stays neutral with regard to jurisdictional claims in published maps and institutional affiliations.

