Article

Epstein-Barr Virus miR-BART17-5p Promotes Migration and Anchorage-Independent Growth by Targeting Kruppel-Like Factor 2 in Gastric Cancer

Department of Medical Life Sciences, Department of Biomedicine & Health Sciences, College of Medicine, The Catholic University of Korea, Seoul 06591, Korea
*
Author to whom correspondence should be addressed.
Microorganisms 2020, 8(2), 258; https://doi.org/10.3390/microorganisms8020258
Submission received: 15 January 2020 / Revised: 12 February 2020 / Accepted: 13 February 2020 / Published: 15 February 2020
(This article belongs to the Special Issue Epstein–Barr Virus Infection and Associated Diseases)

Abstract

:
Epstein-Barr virus (EBV) infects more than 90% of the global population and is associated with a variety of tumors including nasopharyngeal carcinoma, Hodgkin lymphoma, natural killer/T lymphoma, and gastric carcinoma. In EBV-associated gastric cancer (EBVaGC), highly expressed EBV BamHI A rightward transcripts (BART) miRNAs may contribute to tumorigenesis with limited viral antigens. Despite previous studies on the targets of BART miRNAs, the functions of all 44 BART miRNAs have not been fully clarified. Here, we used RNA sequencing data from the Cancer Genome Atlas to find genes with decreased expression in EBVaGC. Furthermore, we used AGS cells infected with EBV to determine whether expression was reduced by BART miRNA. We showed that the expression of Kruppel-like factor 2 (KLF2) is lower in AGS-EBV cells than in the AGS control. Using bioinformatics analysis, four BART miRNAs were selected to check whether they suppress KLF2 expression. We found that only miR-BART17-5p directly down-regulated KLF2 and promoted gastric carcinoma cell migration and anchorage-independent growth. Our data suggest that KLF2 functions as a tumor suppressor in EBVaGC and that miR-BART17-5p may be a valuable target for effective EBVaGC treatment.

1. Introduction

Gastric cancer (GC) is the fifth most common cancer worldwide with a high incidence in East Asia. In South Korea, GC has a higher incidence rate than in other countries [1]. Despite efforts to treat advanced GC, therapies remain an active area of investigation because the causes and pathology of GC are diverse [2]. Therefore, GC needs to be studied at the molecular level.
The Cancer Genome Atlas (TCGA) has classified GC into four subtypes: Epstein-Barr virus (EBV), microsatellite instability (MSI), chromosomal instability (CIN), and genomically stable (GS). EBV GC accounts for 9% of all GC [3]. EBV infects epithelial cells through various mechanisms [4,5]. EBV GC is characterized by the hypermethylation of CpG islands in the promoter and the downregulation of tumor suppressor genes [6]. EBV has a modified latency 1 infection expressing EBV-encoded small RNAs (EBERs), Epstein-Barr nuclear antigen 1 (EBNA1), latent membrane protein 2A (LMP2A), and BamHI A rightward transcripts (BART) microRNAs (miRNAs) in EBV-associated GC (EBVaGC) [7]. As a limited number of viral proteins are expressed, it would be of interest to identify the role of BART miRNAs expressed at a high level in EBVaGC.
MicroRNA consists of 19–23 nucleotides single-stranded noncoding RNA that binds to the 3′UTR of mRNA and inhibits the translation of the target protein. EBV BART miRNAs have been reported to regulate the expression of viral genes BZLF1, BRLF1, and LMP1, thereby modulating the life cycle of EBV [8,9]. Microarray analysis showed that the expression of cellular genes was dramatically different between EBV infected and uninfected GC cells [10]. Gottwein et al. [11] reported that EBV BART miRNAs are likely to target multiple cellular genes. For this reason, BART miRNAs regulate cellular gene expression [12,13,14,15]. Furthermore, tumorigenesis is promoted when BART miRNAs target tumor suppressor genes [16]. Despite some studies on the targets of BART miRNAs, the functions of all 44 BART miRNAs have not been clarified and further studies are required.
Among the BART miRNAs, miR-BART17-5p is known to be highly expressed and associated with poor prognosis in nasopharyngeal carcinoma (NPC) [17,18]. In diffuse large B-cell lympoma, miR-BART17-5p is associated with poor prognosis, reduces sensitivity to cisplatin [9], and targets BCL6 to promote NF-κB [19]. miR-BART17-5p is also expressed in EBVaGC at substantial levels [20,21], but the function of miR-BART17-5p in EBVaGC is still unclear.
The Kruppel-like factor (KLF) family consists of 17 members and belongs to DNA-binding transcriptional regulators. KLFs function as suppressors or oncogenes in tumorigenesis [22]. KLFs are also associated with EBV. The expression of KLF5 is increased by the ED-L2 promoter of the EBV, leading to increased proliferation in esophageal epithelia [23]. In epithelial cells, KLF4 binds to the promoters of EBV immediate-early genes (BZLF1 and BRLF1) to increase lytic replication [24]. However, there are insufficient studies on the function of the KLF family as a tumor suppressor in EBVaGC. Therefore, we analyzed RNA sequencing data from TCGA to select KLFs that act as tumor suppressors in EBVaGC. To investigate tumor suppressors, we focused on five KLFs which are suppressed in GC tissues compared to normal tissues. In fact, previous reports show that most of them act as tumor suppressors in GC [25,26]. We found that the expression of KLF2 was most reduced in EBVaGC.
KLF2, a member of the KLF family, acts as a tumor suppressor in many cancers [27]. KLF2 is expressed at a low level in non-small cell lung cancer and pancreatic cancer [28,29]. Likewise, KLF2 is suppressed in GC [30,31,32]. The expression of KLF2 was reduced by miR-32-5p in GC [33]. Furthermore, KLF2 expression in GC was down-regulated by several lncRNAs, resulting in increased tumorigenesis [34,35,36,37]. However, there are few reports that investigate the association between EBVaGC and KLF2. As KLF2 is known to be regulated by noncoding RNAs, we investigated whether KLF2 is regulated by EBV BART miRNAs. We also have investigated whether KLF2 acts as a tumor suppressor in EBVaGC and affects tumorigenesis.
In this study, we demonstrated that miR-BART17-5p directly down-regulated KLF2, promoting cell migration and anchorage-independent growth. Our data suggest that BART miRNAs may contribute to the tumorigenesis of EBVaGC.

2. Materials and Methods

2.1. Cell Lines and Culture Conditions

AGS, SNU-719, MKN-1, MKN-28, NCI-N87, SNU484, and NCC24 cells were purchased from Korean Cell Line Bank (Seoul, Korea). YCCEL1 cells were given by professor Sun Young Rha (Yonsei University College of Medicine, Republic of Korea). AGS-EBV cells were given by Takada K (Institute for Genetic Medicine, Hokkaido University, Japan). The GC cell lines were cultured in RPMI 1640 (Gibco, Grand Island, NY, USA) containing 10% fetal bovine serum (FBS, Corning, NY, USA), 100 U/mL penicillin, and 100 μg/mL streptomycin (Gibco) except for YCCEL1 which was cultured in Eagle’s minimal essential medium (Lonza Benelux BV, Breda, the Netherlands). AGS-EBV is an AGS cell line infected with a recombinant Akata strain of EBV [38]. To culture AGS-EBV cells, 400 μg/mL of G418 (Gibco) was added to the medium. SNU-719 [39], YCCEL1 [40], and NCC-24 [41] are gastric carcinoma cell lines naturally infected with EBV. The human embryonic kidney cell line HEK293T was cultured in Dulbecco’s modified Eagle’s medium (DMEM, Gibco), supplemented with 10% FBS, 100 U/mL penicillin, and 100 μg/mL streptomycin (Gibco). All cells were incubated at 37 °C and supplemented with 5% CO2.

2.2. Target Prediction

The KLF2 sequence was obtained from the National Center for Biotechnology Information (NM_016270.3). To examine whether the 3′UTR of KLF2 can be targeted by BART miRNAs, we used the publicly available RNA hybrid program (http://bibiserv.techfak.uni-bielefeld.de/rnahybrid/).

2.3. Transfection of BART miRNA Mimics and Inhibitors

All BART miRNA mimics were purchased from Genolution Pharmaceuticals (Seoul, South Korea). A control inhibitor and a miR-BART17-5p inhibitor were purchased from Invitrogen (Carlsbad, CA, USA). All transfection experiments were performed using Lipofectamine 2000 (Invitrogen) according to the manufacturer’s protocol. Protein and RNA were extracted 48 h after transfection.

2.4. Quantitative Reverse Transcription-PCR (qRT-PCR)

Cells were harvested and total RNA was extracted using RNAisoplus (TaKaRa, Tokyo, Japan) reagent according to the manufacturer’s instruction. cDNA was synthesized using 1.5 µg total RNA, oligo(dT) primers (Macrogen, Seoul, South Korea) and Moloney murine leukemia virus (M-MLV) reverse transcriptase (Invitrogen). Real-time PCR was carried out using a SYBR Green qPCR kit (TaKaRa) with an Mx3000p real-time PCR system (Stratagene, La Jolla, CA, USA). The sequences of the primers used for each gene were as follows: KLF2, 5′-GCAAGACCTACACCAAGAGTTCG-3′ and 5′-CATGTGCCGTTTCATGTGC-3′; GAPDH, 5′-ATGGGGAAGGTGAAGGTCG-3′ and 5′-GGGGTCATTGATGGCAACAATA-3′. PCR conditions were 95 °C for 5 min, followed by 40 cycles at 95 °C for 30 s, 60 °C for 30 s, and 72 °C for 30 s. Relative gene expression was calculated by the comparative Ct method using GAPDH as an internal loading control.

2.5. Western Blot Analysis

Cell lysate was subjected to 12% sodium dodecyl sulfate (SDS) polyacrylamide gel electrophoresis, and the separated proteins were transferred to a polyvinylidene fluoride (PVDF) membrane. Rabbit polyclonal antibody against KLF2 (ab139699, Abcam, Cambridge, MA, USA) and p21 (C-19, Santa Cruz Biotechnology, Santa Cruz, CA, USA) were used as primary antibodies. Secondary antibody was purchased from Cell Signaling (Beverly, MA, USA). Protein bands were visualized using an enhanced chemiluminescence detection system.

2.6. Plasmid Constructs

The full-length 3′UTR of KLF2 mRNA was amplified from the gDNA of AGS cells. The amplified PCR product containing XhoI and NotI sites at each end was inserted between the Renilla luciferase coding sequence and the poly(A) site of the psiCHECK-2 plasmid (Promega, Madison, WI, USA) to produce psiC-KLF2. The primers for the 3′UTR of KLF2 containing XhoI and NotI sites are as follows: 5′-TCTAGGCGATCGCTCGAGCCGGGACGCCCCCGCCCA-3′ and 5′-TTATTGCGGCCAGCGGCCGCCTCGGAAAATGAATCAGATTGTCA-3′. Mutations were introduced into the two seed match sequences of psiC_KLF2 to produce psiC_KLF2_M1, psiC_KLF2_M2, and psiC_KLF2_M1M2 using an EZ change site-directed mutagenesis kit (Enzynomics, Daejeon, South Korea).

2.7. Luciferase Reporter Assay

To investigate the direct effects of BART miRNAs on the expression of KLF2, HEK293T and AGS cells were seeded in a 96-well plate at 5.5 × 10³ cells/well. After 24 h, cells were co-transfected with psiC-KLF2 and the BART miRNA mimic using Lipofectamine 2000 (Invitrogen). Luciferase activity was measured 48 h post-transfection using the Dual-Glo luciferase reporter assay system (Promega). For each sample, Renilla luciferase activity was normalized using the internal control firefly luciferase activity.

2.8. Wound Healing Assay

To evaluate the effect of miR-BART17-5p on cell migration, AGS (1 × 10⁶ cells/well) and AGS-EBV (1.5 × 10⁶) cells were each seeded into six-well plates and allowed to reach 90–95% confluence. A monolayer of cells covering the plate was scratched with a sterile 200 µL pipette tip and subsequently washed with phosphate-buffered saline to remove cell debris. The cells were transfected with miR-BART17-5p, miR-BART17-5p inhibitor, or siKLF2. The cells were then cultured in RPMI-1640 medium containing 0.1% FBS at 37 °C in an incubator with 5% CO2. The scratched wounds were observed by an Axiovert 200 (Carl Zeiss, Thornwood, NY, USA) microscope just after transfection (time 0) and 48 h after transfection. Photographs were taken to assess the level of migration in each group of transfected cells, and wound areas were measured by Image J 1.37v software (National Institutes of Health, Bethesda, MD, USA). Three independent experiments were performed.

2.9. Soft Agar Colony Formation Assay

To confirm if KLF2 was involved in anchorage-independent growth, a soft agar colony formation assay was performed. AGS and AGS-EBV were each transfected with 30 nM miR-BART17-5p mimic or inhibitor. After 24 h, the cells were harvested and seeded (3000 cells/well) in 0.6% Bacto Agar (214010; BD, Franklin Lakes, NJ, USA) mixed with culture medium (on top of 1% agar with medium) in six-well plates. Cells were cultured at 37 °C for 4–6 weeks. The images of the plates were captured under a microscope and camera. Then, the pictures were analyzed using Image J software. Three independent experiments were performed.

2.10. MTT Assay (Cell Viability Assay)

Cell proliferation was analyzed by using a 3-(4,5-dimethylthiazol-2-yl)-2,5-diphenyltetrazolium bromide (MTT) assay (Amresco, Shanghai, China). AGS cells (3 x10³) were seeded in 96-well plates. At a set time following transfection, 20 µl of MTT solution (5 mg/mL) was added to each well. After 4 h, the medium and MTT solution were removed. Then, 100 µl DMSO (Sigma-Aldrich, St. Louis, MO, USA) was added to each well. The absorbance at 595 nm was measured with SoftMax apparatus (Molecular Devices, Sunnyvale, CA, USA) 24 h after adding the DMSO.

2.11. KLF2 Knockdown by Small Interfering RNA (siRNA)

AGS cells were transfected with 30 nM KLF2-specific siRNA (siKLF2; Bioneer, Daejon, South Korea) to knockdown KLF2. The sequence of the siKLF2 was 5′-GAGACAGGUGGGCAUUUUU-3′ and the sequence of the control siRNA was 5′-CCUCGUGCCGUUCCAUCAGGUAGUU-3′. Protein and RNA were extracted 48 h after transfection.

2.12. KLF2 Overexpression Vector

A human KLF2 expression vector (#60441, Addgene, Cambridge, MA, USA) was used for migration and soft agar colony formation assays.

2.13. Propidium Iodide (PI) Staining

AGS cells were trypsinized, washed twice with cold PBS and fixed in 70% ethanol at −20 °C overnight. The fixed cells were resuspended in PBS containing 20 µg/mL RNase A (Invitrogen) and 2.5 µg/mL PI (Sigma-Aldrich). The distribution of cells in each phase of the cell cycle was analyzed using FACSCalibur apparatus (BD Biosciences, San Diego, CA, USA) as described previously [42].

2.14. Statistical Analyses

The MTT assay data were analyzed using two-way analysis of variance (ANOVA) and the Student’s t-test was used for other experiments. GraphPad Prism version 5.03 (GraphPad Software, San Diego, CA, USA) was used to analyze and draw graphs. p-values less than 0.05 were considered statistically significant. All results were expressed as the mean ± standard deviation (SD).

3. Results

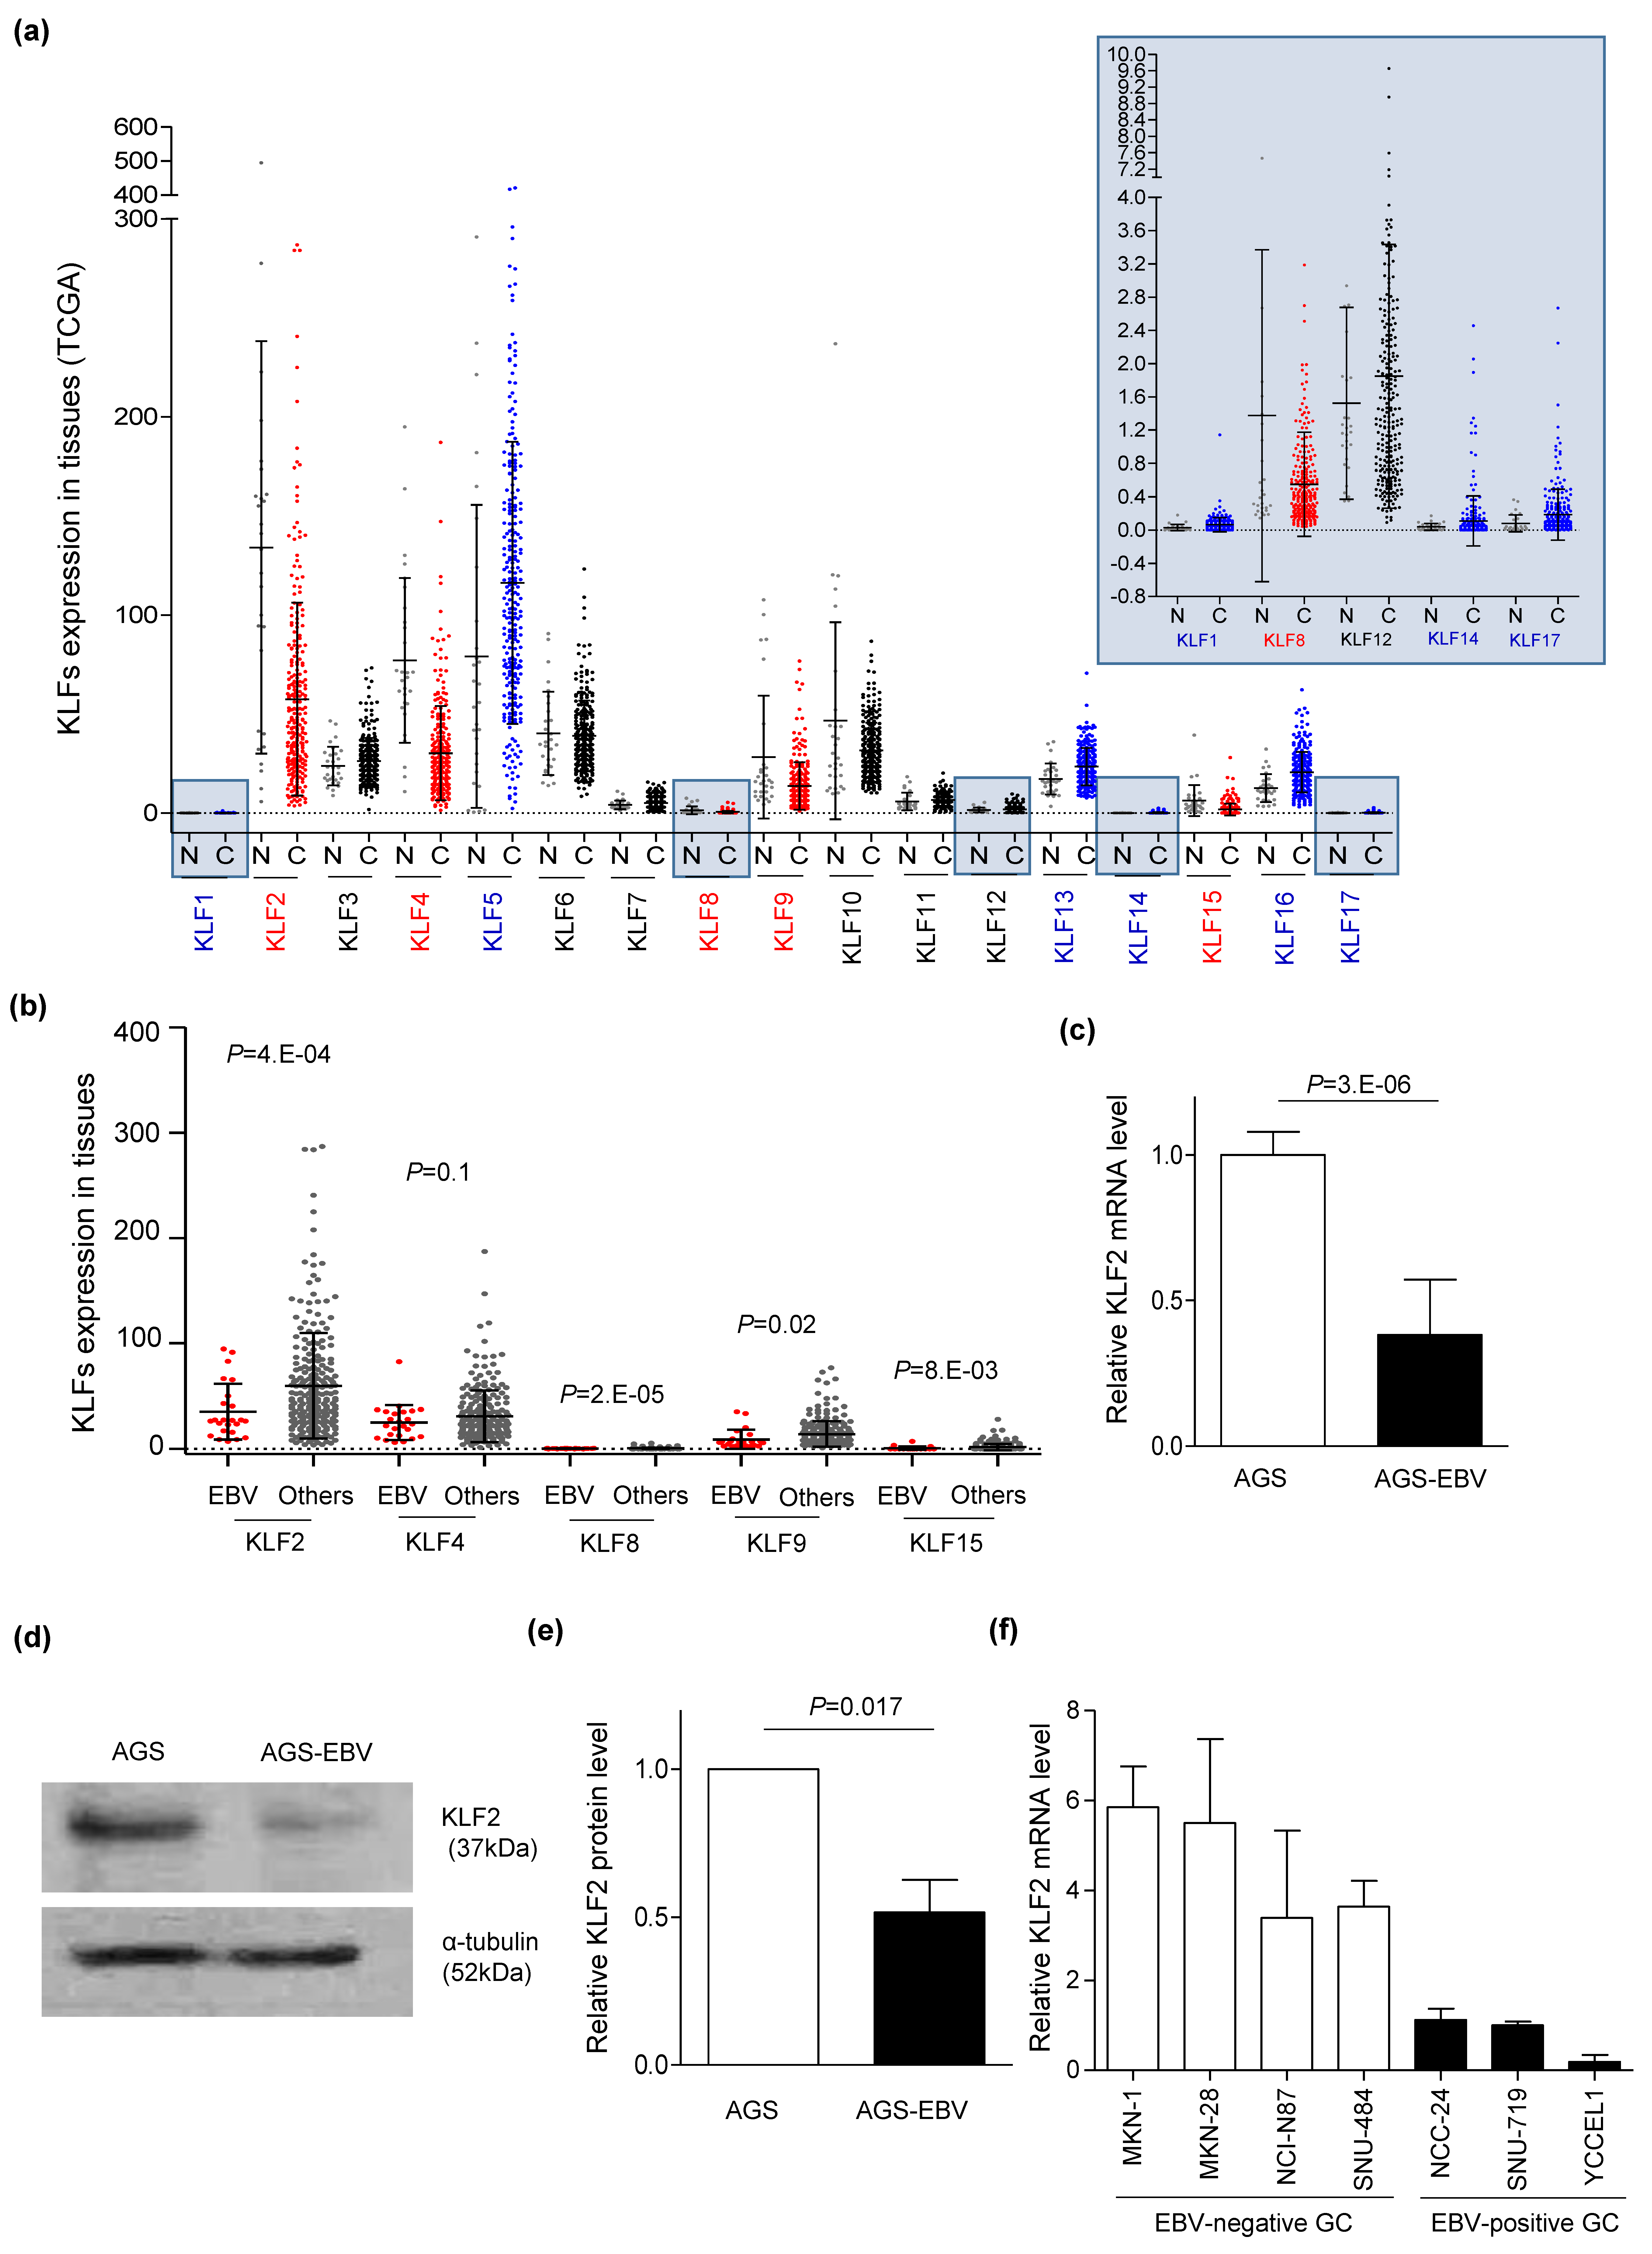
3.1. KLF2 Expression is Suppressed by EBV Infection in Gastric Carcinoma

To investigate the effect of EBV infection on Kruppel-like factor 2 (KLF2) expression in gastric cancer (GC) tissues, RNA sequencing data from TCGA were analyzed. The expression of five KLFs (KLF2, 4, 8, 9, and 15) was decreased more in GC tissues than in normal tissues (Figure 1a). We next examined whether the expression of these five KLFs was reduced in EBVaGC compared to other subtypes of GC (Figure 1b). In all four subtypes of GC, KLF8 and KLF15 had the least expression in GC tissues, while the expression of KLF4 showed no significant differences between EBVaGC and the other GC subtypes. The expression of KLF2 was the most reduced in EBVaGC compared to other subtypes of GC.
To identify whether the expression of KLF2 was affected by EBV infection in GC cell lines, qRT-PCR was performed for KLF2 using AGS and AGS-EBV cells, which differed only in EBV infection status. We found that the mRNA level of KLF2 was 67% lower (Figure 1c) and the protein level of KLF2 was 48.3% lower in AGS-EBV than in AGS (Figure 1d,e). In addition, qRT-PCR of KLF2 was performed for EBV-negative (MNK1, MKN28, NCI-N87, and SNU-484) and EBV-positive (NCC24, SNU-719, and YCCEL1) cell lines. The results showed that the expression of KLF2 was generally lower in the EBV-positive cell lines than in the EBV-negative cell lines (Figure 1f).

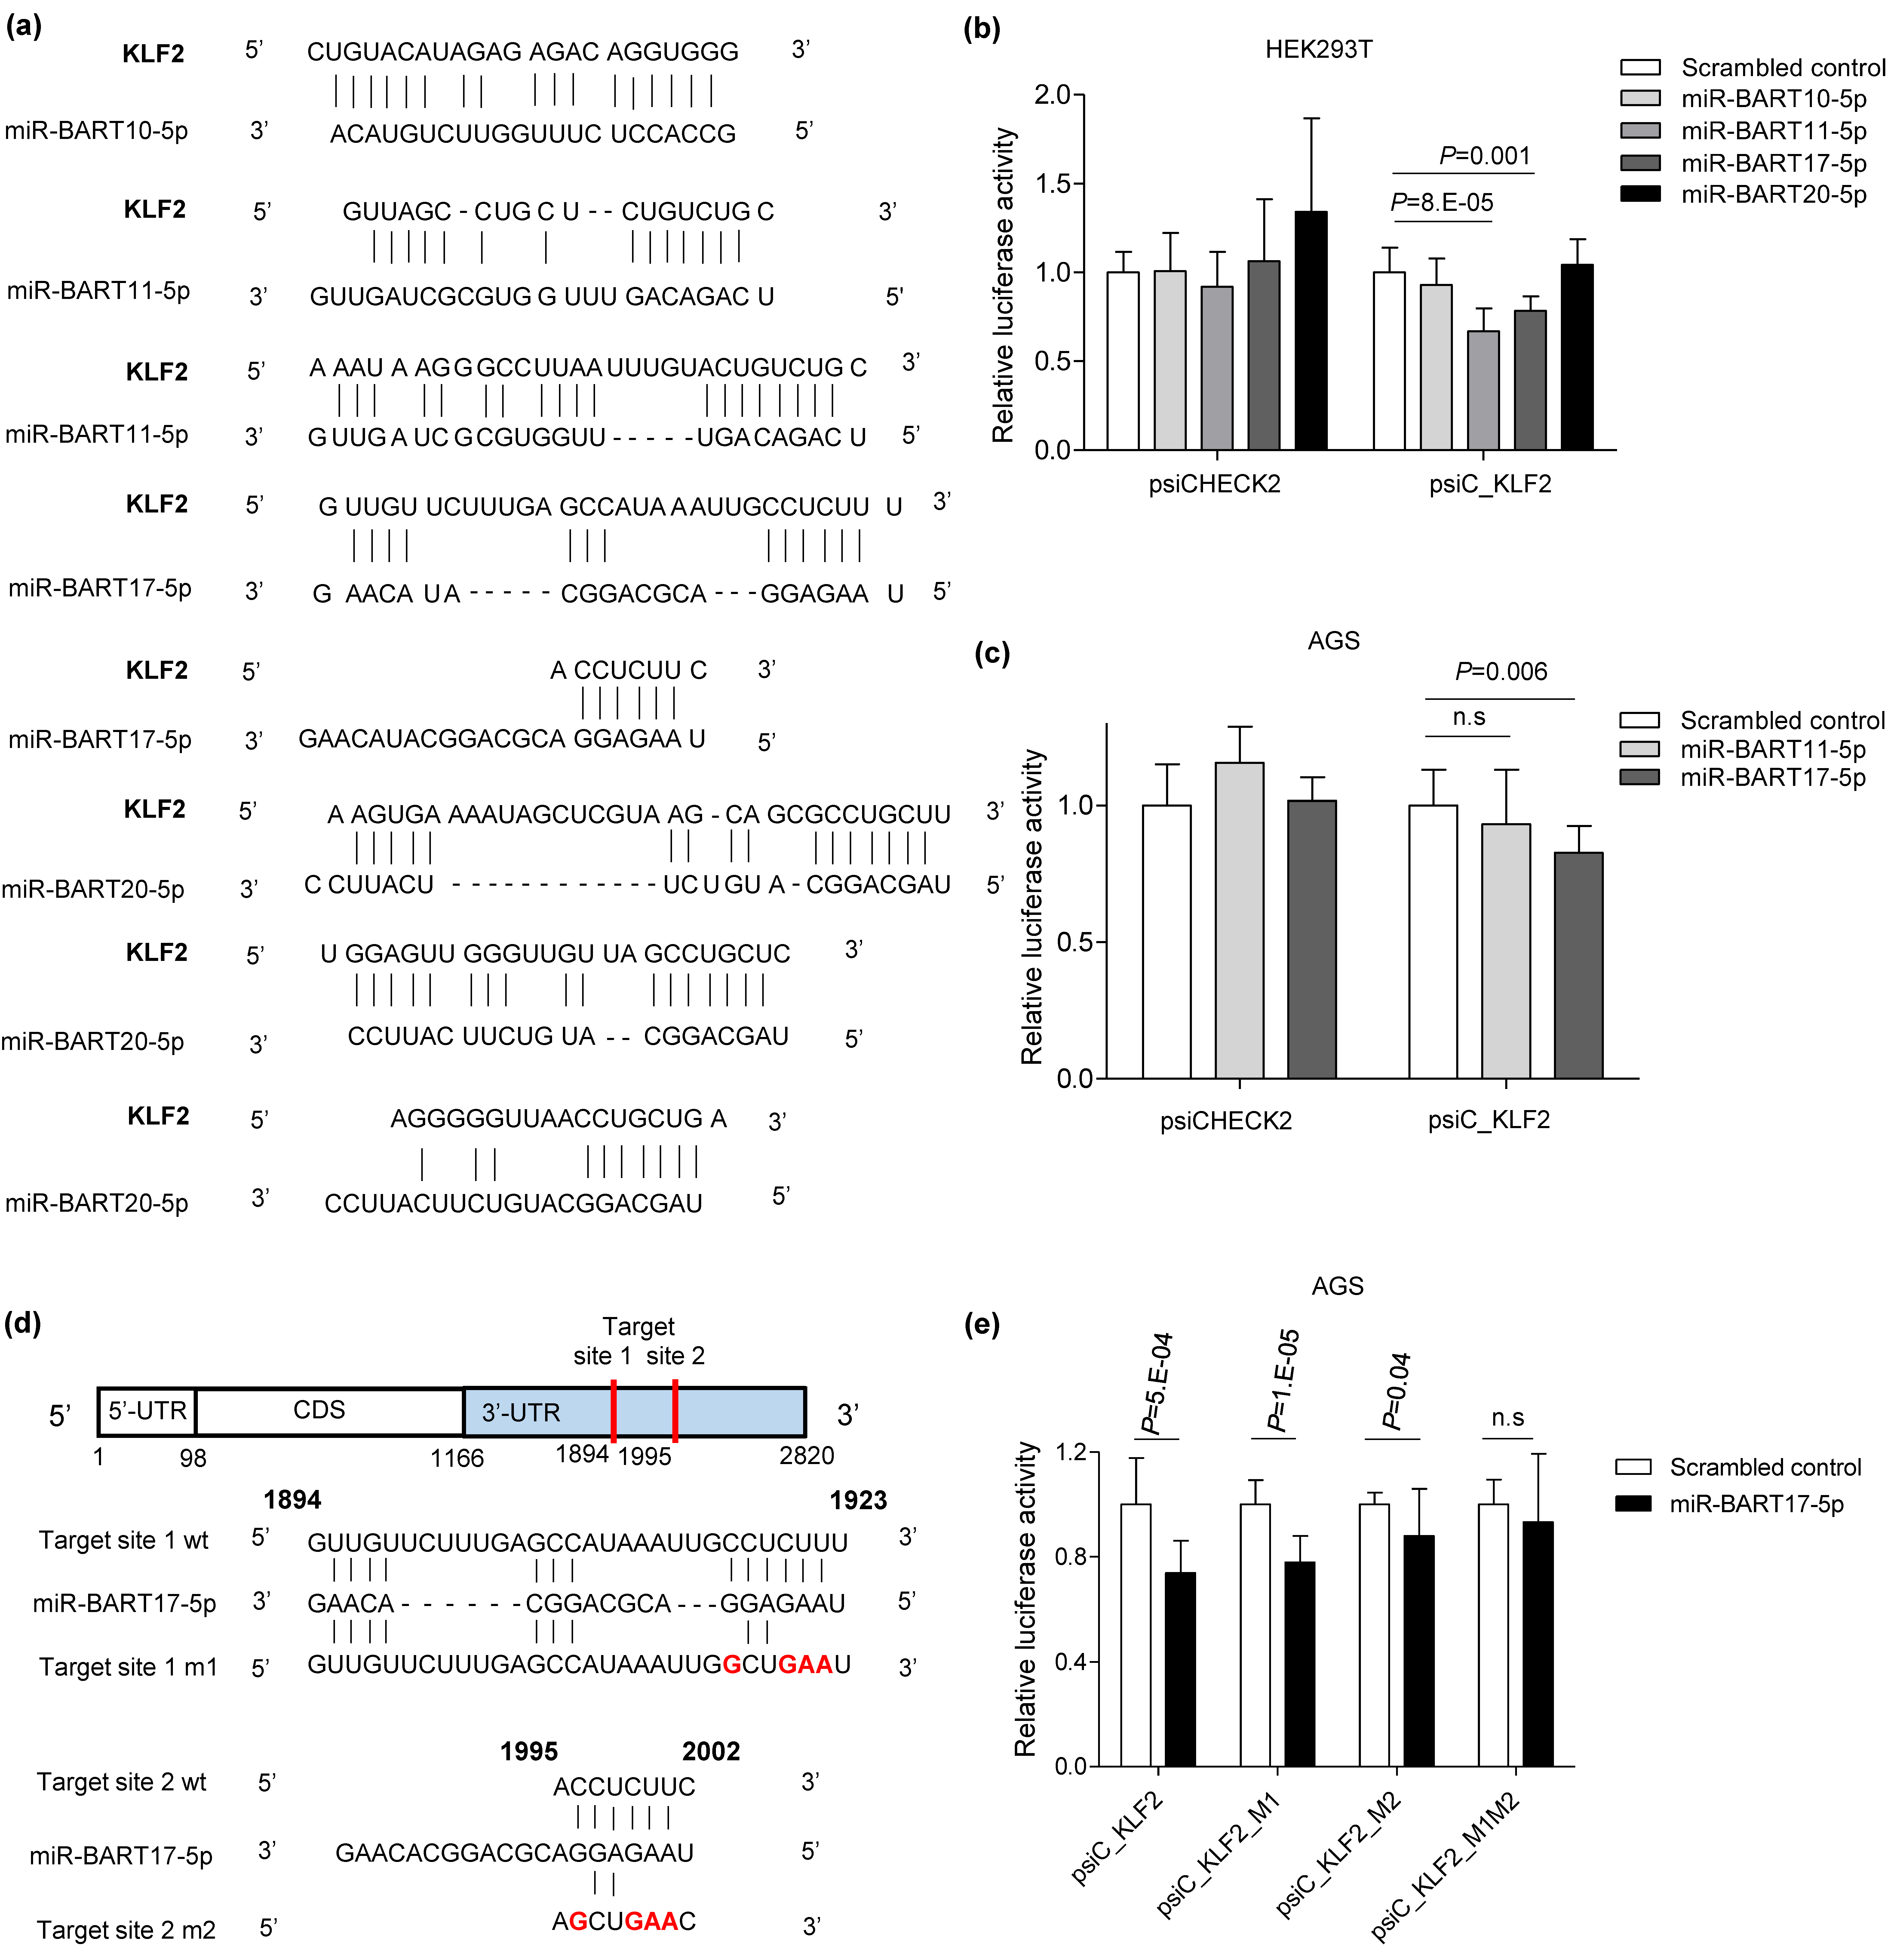
3.2. Screening EBV BART miRNAs that May Target KLF2

We confirmed that KLF2 expression was reduced in EBVaGC (Figure 1). In addition, previous studies have reported that BART miRNAs are significantly expressed in EBV latency type 1 [43]. To check if KLF2 expression was suppressed by BART miRNAs in EBV-positive cells, an RNA hybrid program was used to predict BART miRNAs with the potential to target KLF2. Four BART miRNAs have seed match sequences for the 3’UTR of KLF2, and three BART miRNAs were expected to target more than two sites on the 3’UTR of KLF2 (Figure 2a). To check whether these miRNAs directly target the KLF2 3’UTR, a luciferase reporter vector containing the 3′UTR of KLF2 (psiC_KLF2) was constructed. psiC_KLF2 and each BART miRNA mimic were co-transfected and a luciferase assay was conducted. The results showed that luciferase activities were reduced when miR-BART11-5p (33%) or miR-BART17-5p (22%) was transfected (Figure 2b) into HEK293T cells. When AGS cells were co-transfected with psiC_KLF2 vector and either miR-BART11-5p or miR-BART17-5p mimics, luciferase activity was suppressed by miR-BART17-5p but not by miR-BART11-5p (Figure 2c). There were two miR-BART17-5p seed match sites in the 3′UTR of KLF2 (Figure 2a). To determine whether they play important roles in reducing KLF2 expression, one or both of the two seed match sites were mutated (Figure 2d). The psiC_KLF2 luciferase reporter vector with mutated site 1 (1894–1923) seed sequence was named psiC_KLF2_M1 and the vector with mutated site 2 (1995-2002) was named psiC_KLF2_M2. The vector containing both mutated 1 and 2 sites was named psiC_KLF2_M1M2. AGS cells were co-transfected with miR-BART17-5p and each of the vectors for a luciferase assay. While luciferase activity was reduced by 26.2% when the wild-type psiC_KLF2 was co-transfected with miR-BART17-5p; luciferase activity was less suppressed when psiC_KLF2_M1 (22.1%) or psiC_KLF2_M2 (12%) was co-transfected with miR-BART17-5p (Figure 2e). When psiC_KLF2_M1M2 was co-transfected, luciferase activity was not affected by miR-BART17-5p (Figure 2e). These results indicate that miR-BART17-5p binds to both of the sites and M2 is the major site to which miR-BART17-5p binds.

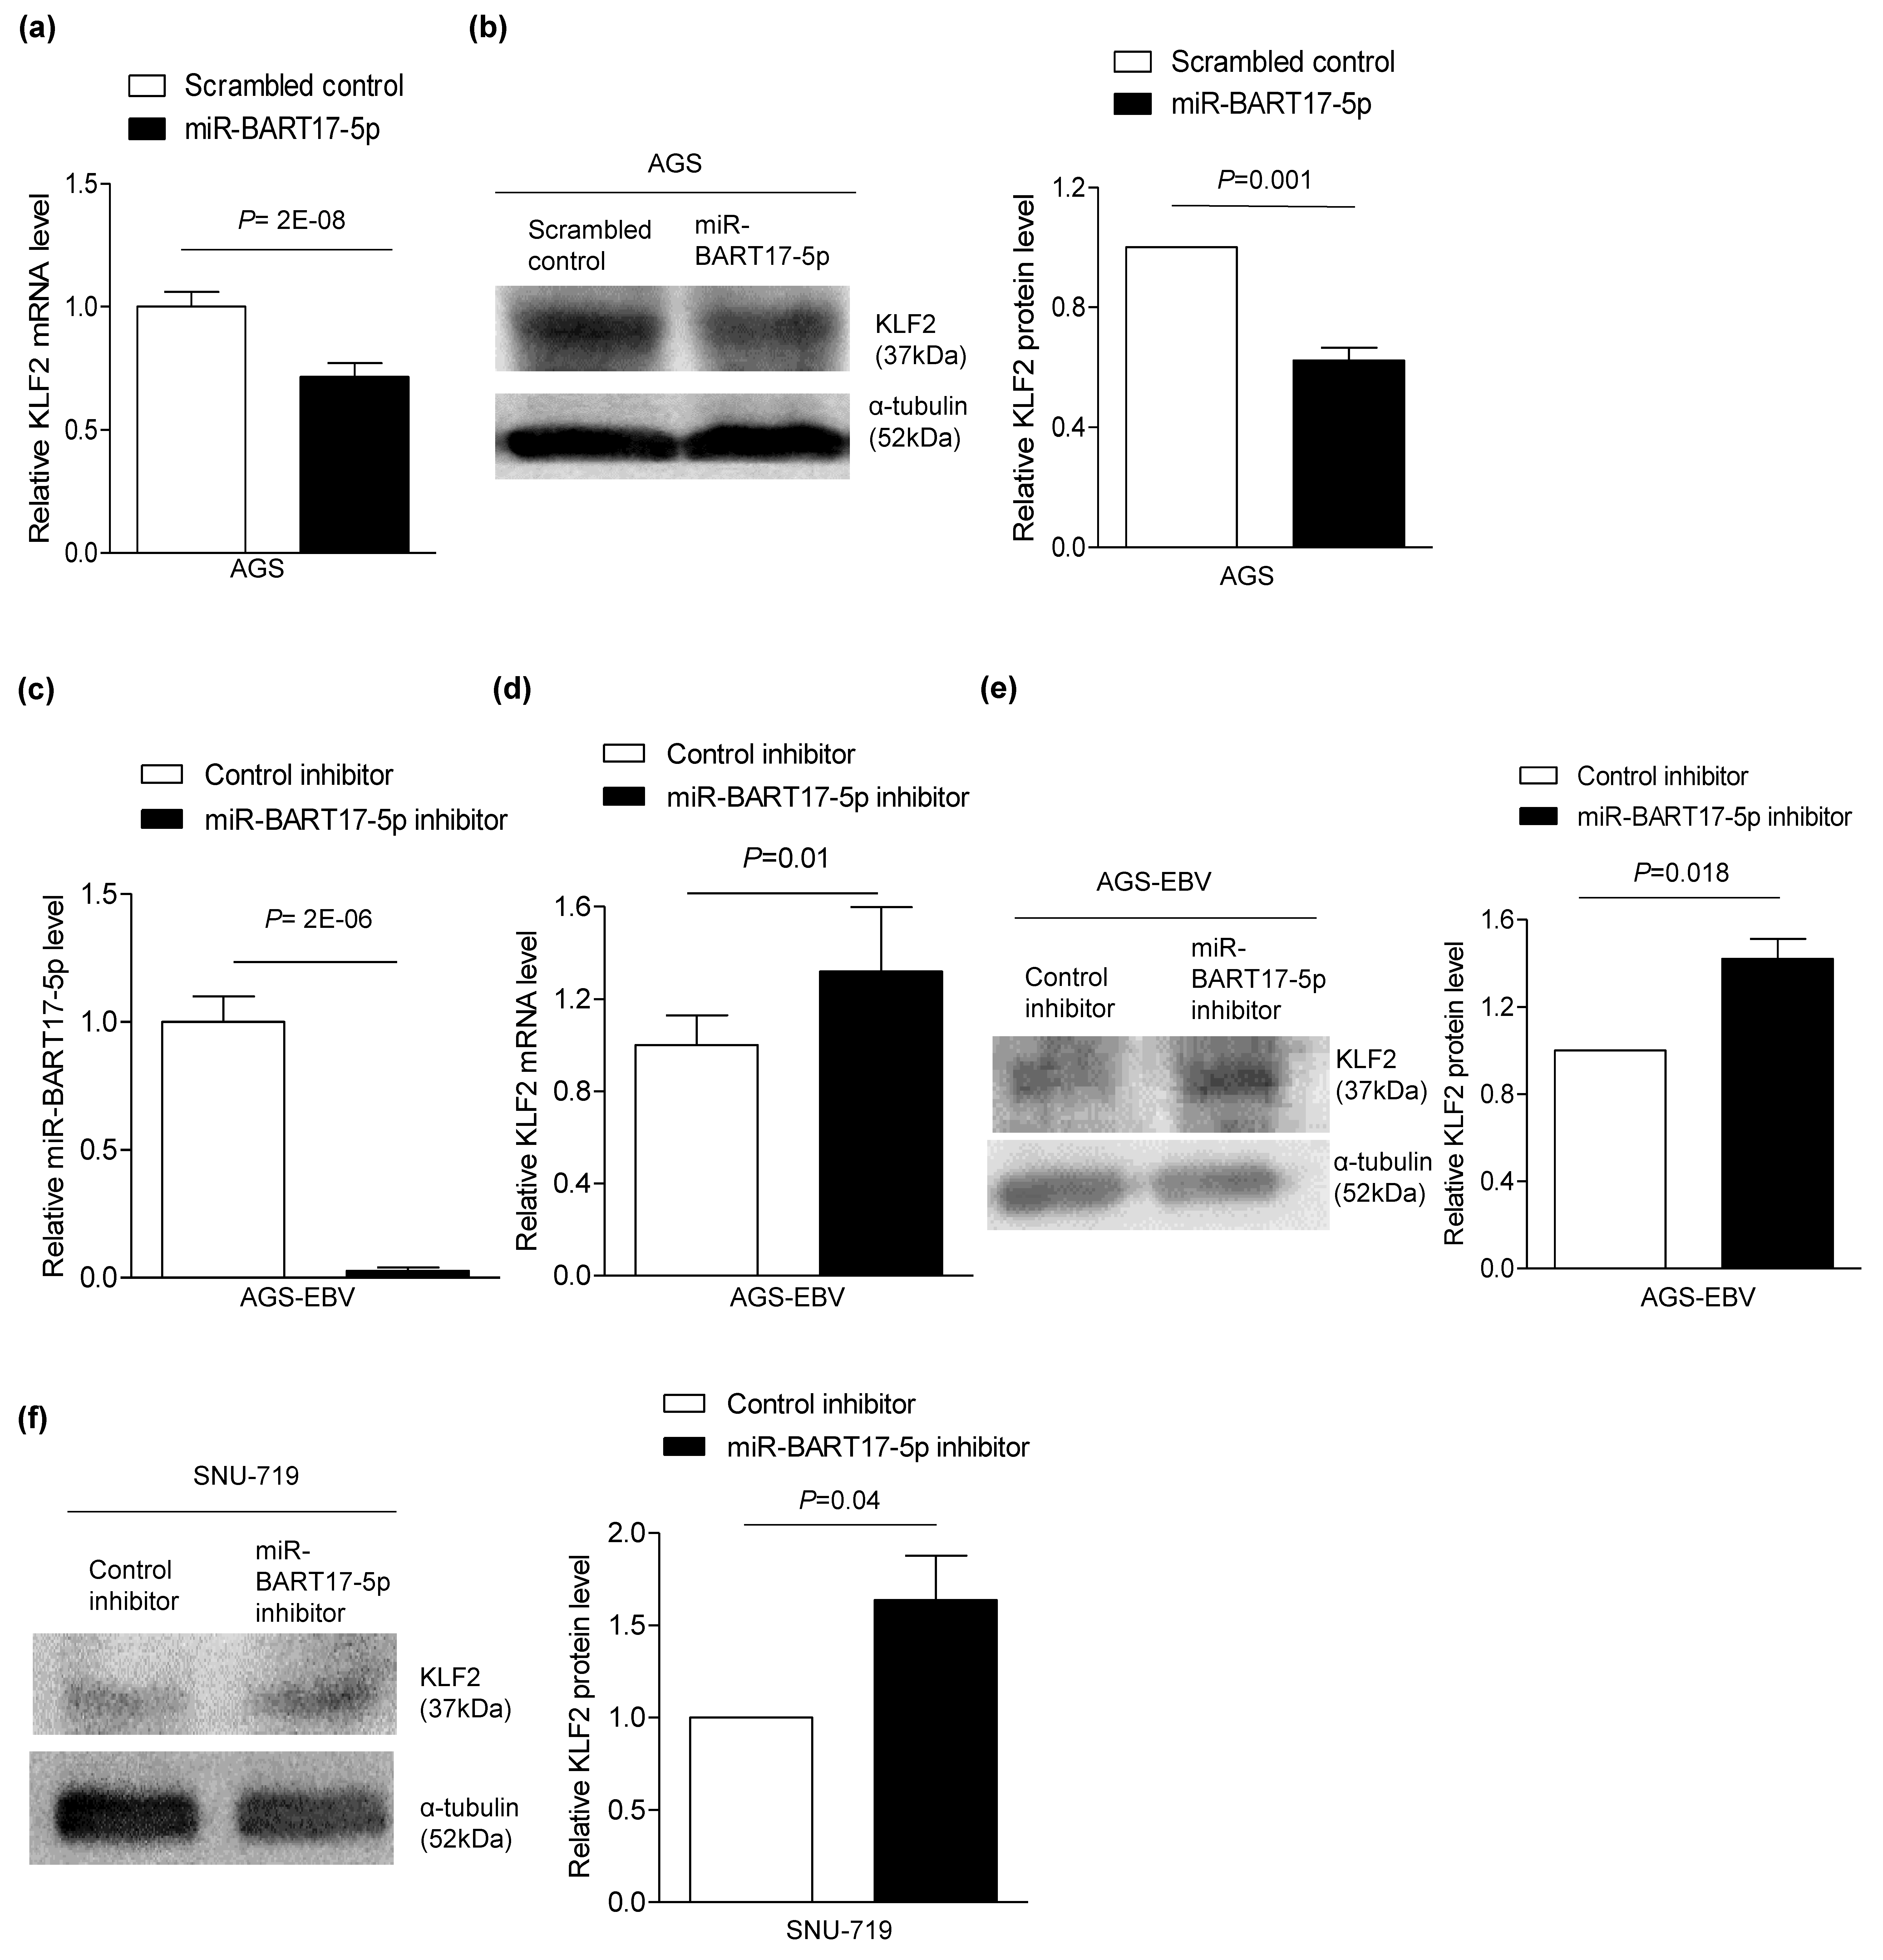
3.3. miR-BART17-5p Suppresses Expression of KLF2.

To confirm that miR-BART17-5p suppresses KLF2 expression, miR-BART17-5p was transfected into AGS cells. In AGS cells, the KLF2 mRNA level was reduced by 29% (Figure 3a) and the protein level was reduced by 37% (Figure 3b), whereas the miR-BART17-5p inhibitor transfection in AGS-EBV cells not only suppressed the endogenous level of miR-BART17-5p (Figure 3c) but also increased mRNA (1.3-fold) (Figure 3d) and protein (1.4-fold) levels of KLF2 (Figure 3e). Furthermore, the miR-BART17-5p inhibitor increased the KLF2 protein level by 1.6-fold in naturally EBV infected GC cell line, SNU-719 (Figure 3f). Therefore, miR-BART17-5p directly regulates KLF2 expression and disrupts the expression of KLF2 in EBVaGC cells.

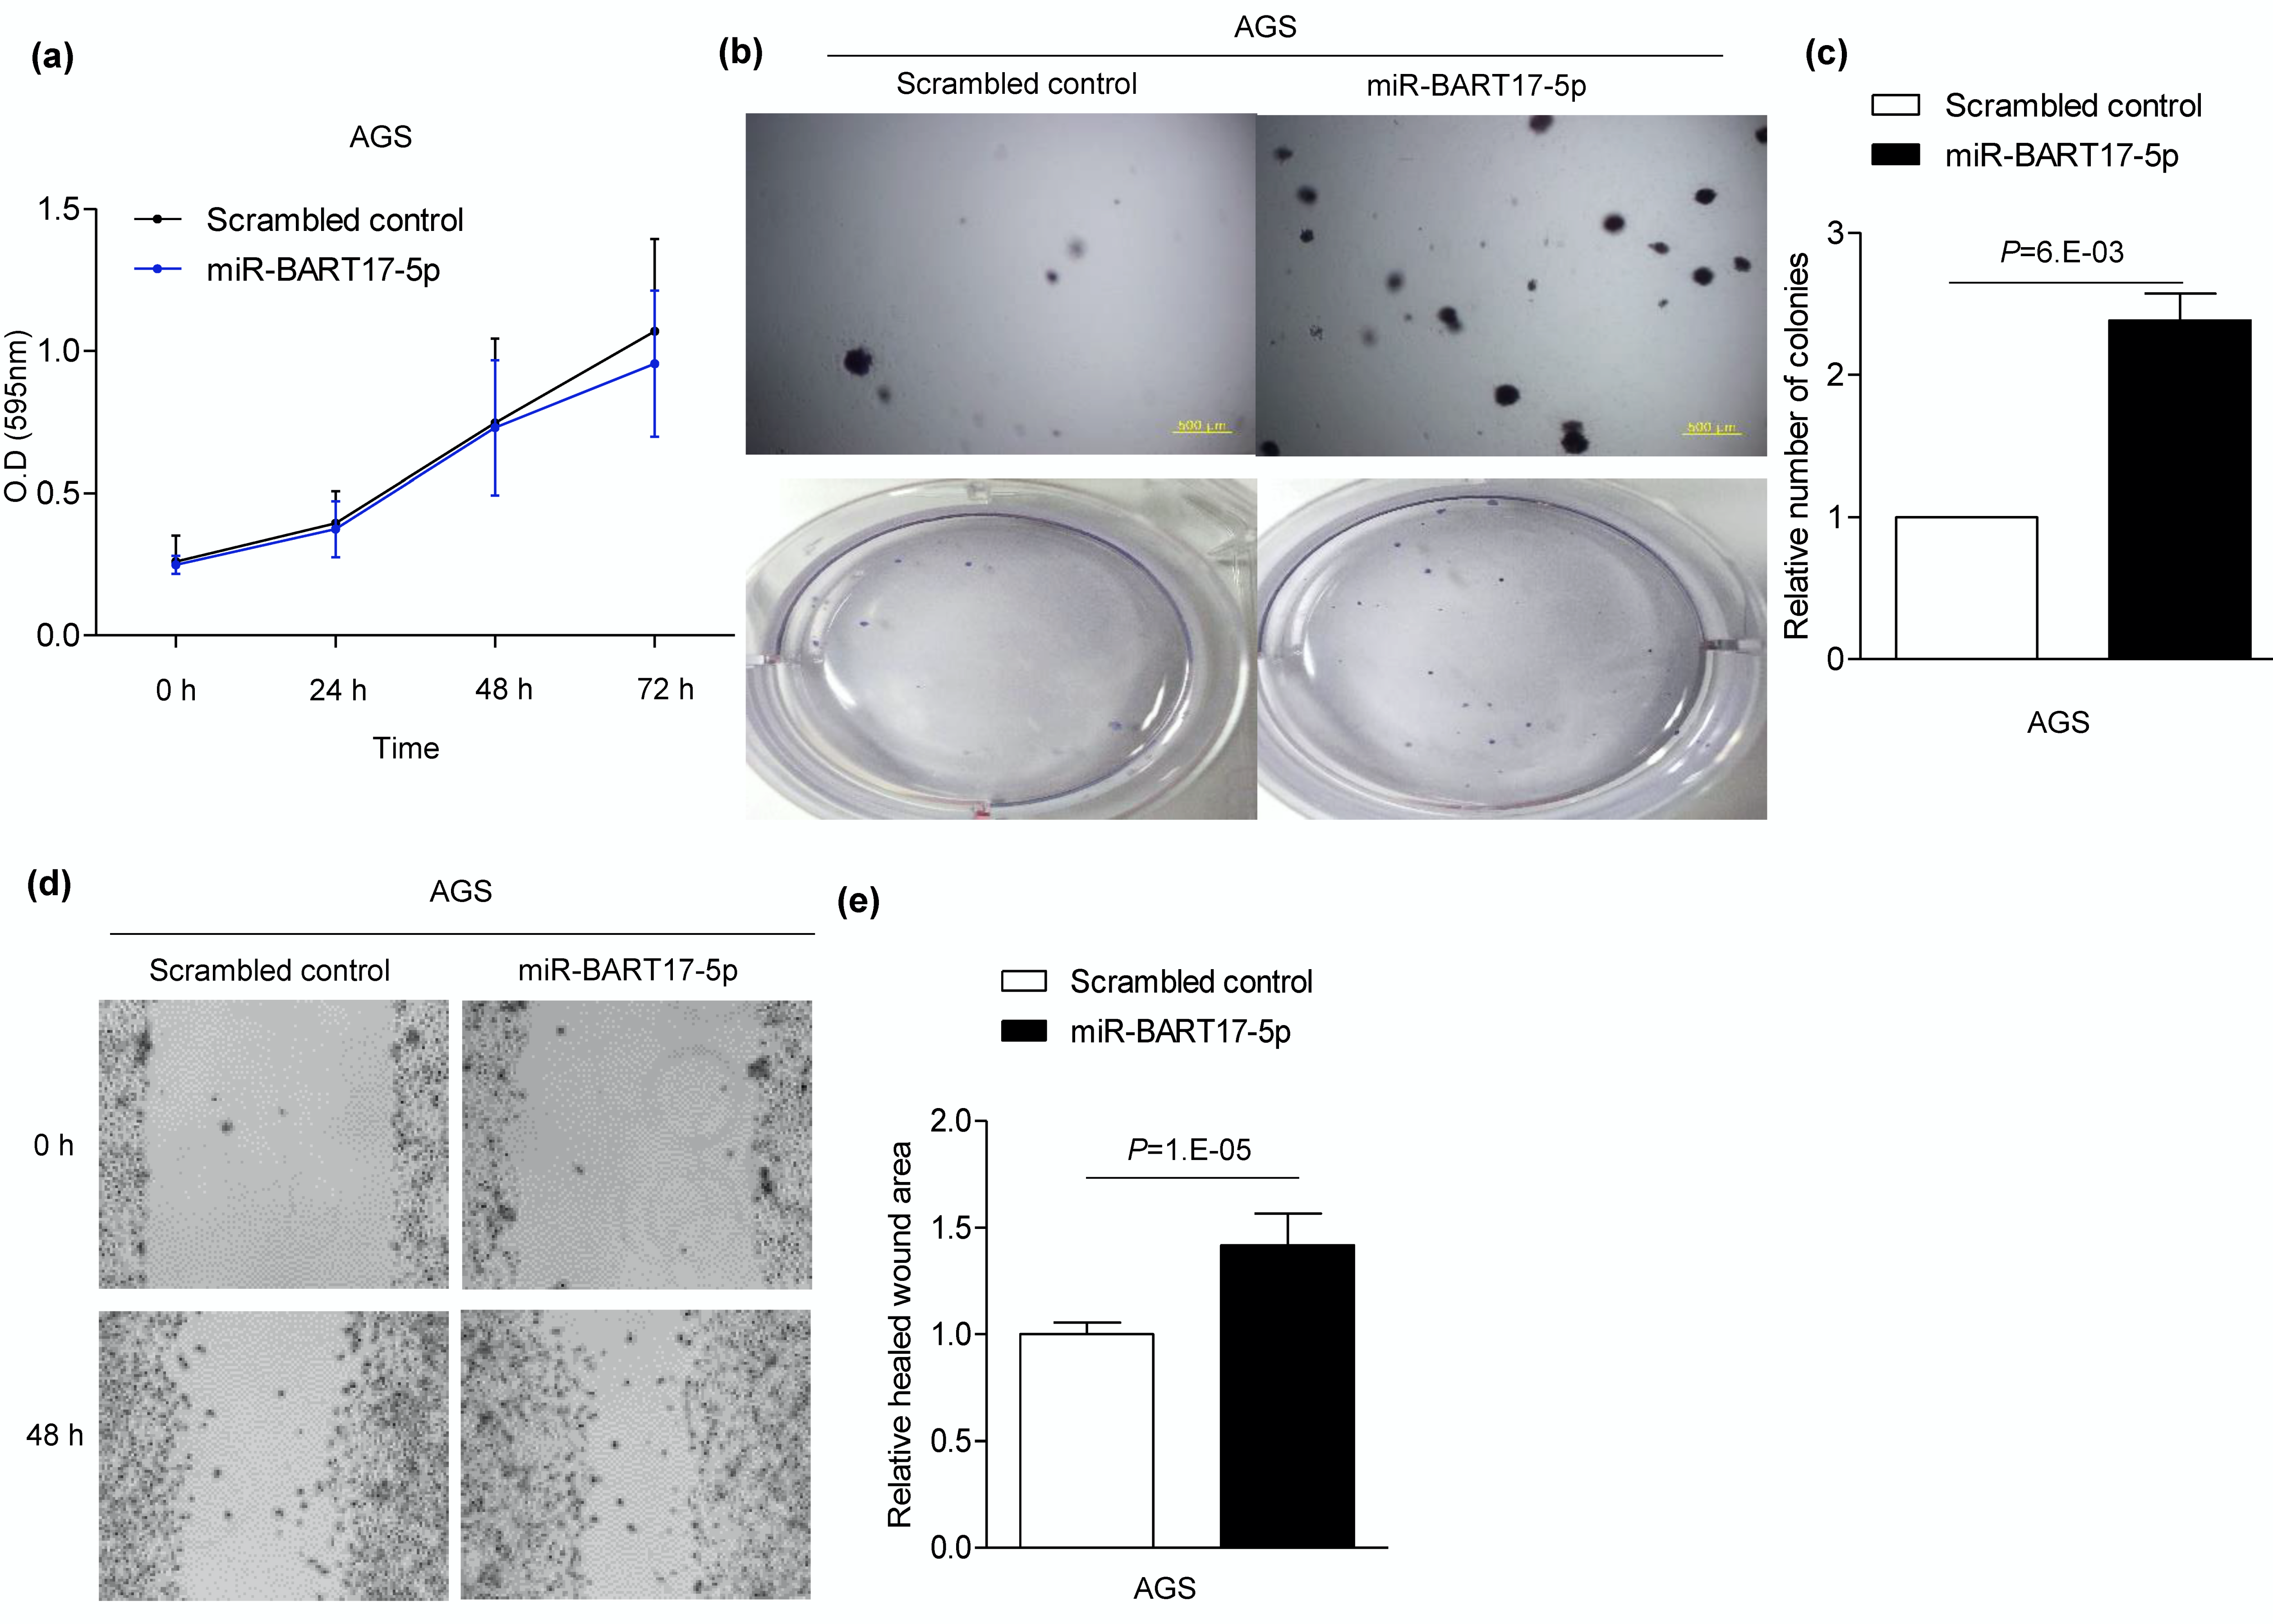
3.4. miR-BART17-5p Promotes Migration and Anchorage-Independent Growth in AGS Cells

In previous results, miR-BART17-5p negatively regulated the expression of KLF2, therefore we tried to confirm the role of miR-BART17-5p in EBVaGC. To analyze the effect of miR-BART17-5p on cell proliferation, migration, and anchorage-independent growth, miR-BART17-5p was artificially delivered to EBV-negative AGS cells. Cell proliferation was not affected by miR-BART17-5p (Figure 4a). A soft agar colony formation assay showed that miR-BART17-5p promoted anchorage-independent growth by 2.1-fold compared to the scrambled control (Figure 4b,c). A wound-healing assay also showed that migration increased 1.3-fold when miR-BART17-5p was delivered to AGS cells compared with the scrambled control (Figure 4d,e).

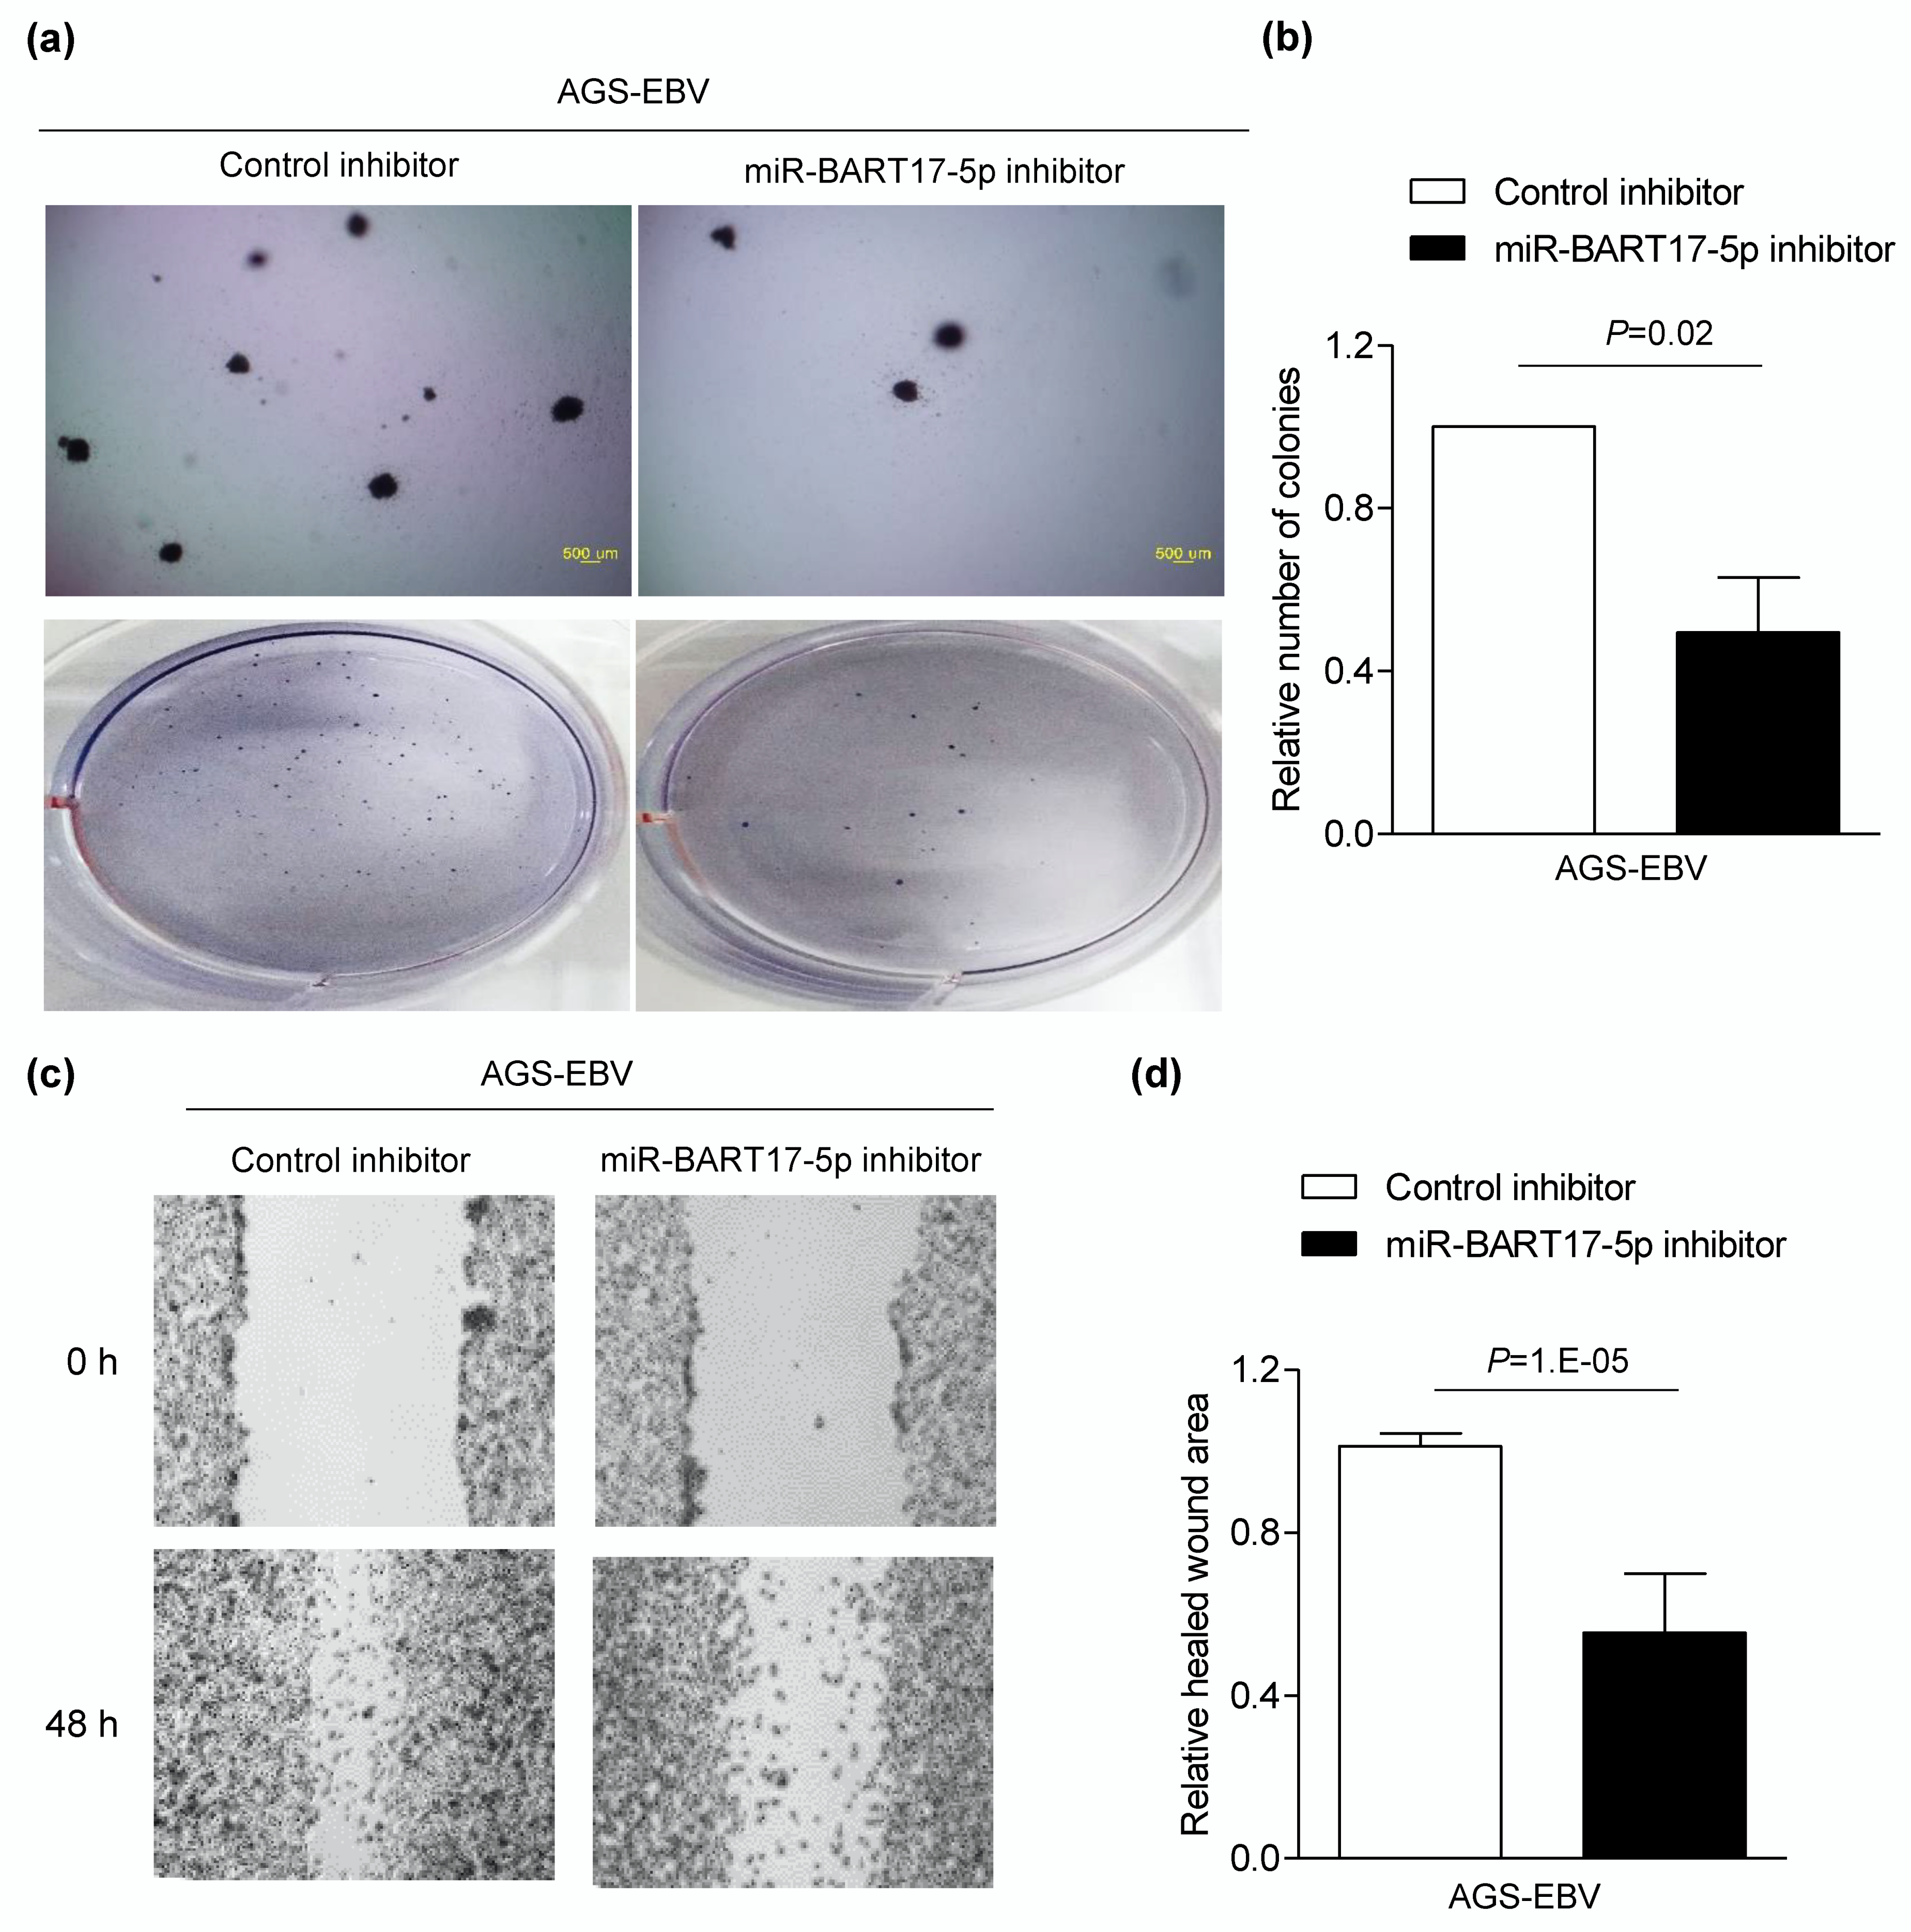
3.5. miR-BART17-5p Inhibitor Suppresses Migration and Anchorage-Independent Growth in AGS-EBV Cells

We then investigated the effect of endogenously expressed miR-BART17-5p on the tumorigenesis of AGS-EBV by delivering a miR-BART17-5p inhibitor into cells. A soft agar colony formation assay revealed that anchorage-independent growth was reduced by 50% following miR-BART17-5p inhibition (Figure 5a,b). In addition, wound-healing of AGS-EBV cells was hindered by 44.6% following transfection with the miR-BART17-5p inhibitor in comparison with the control inhibitor (Figure 5c,d).

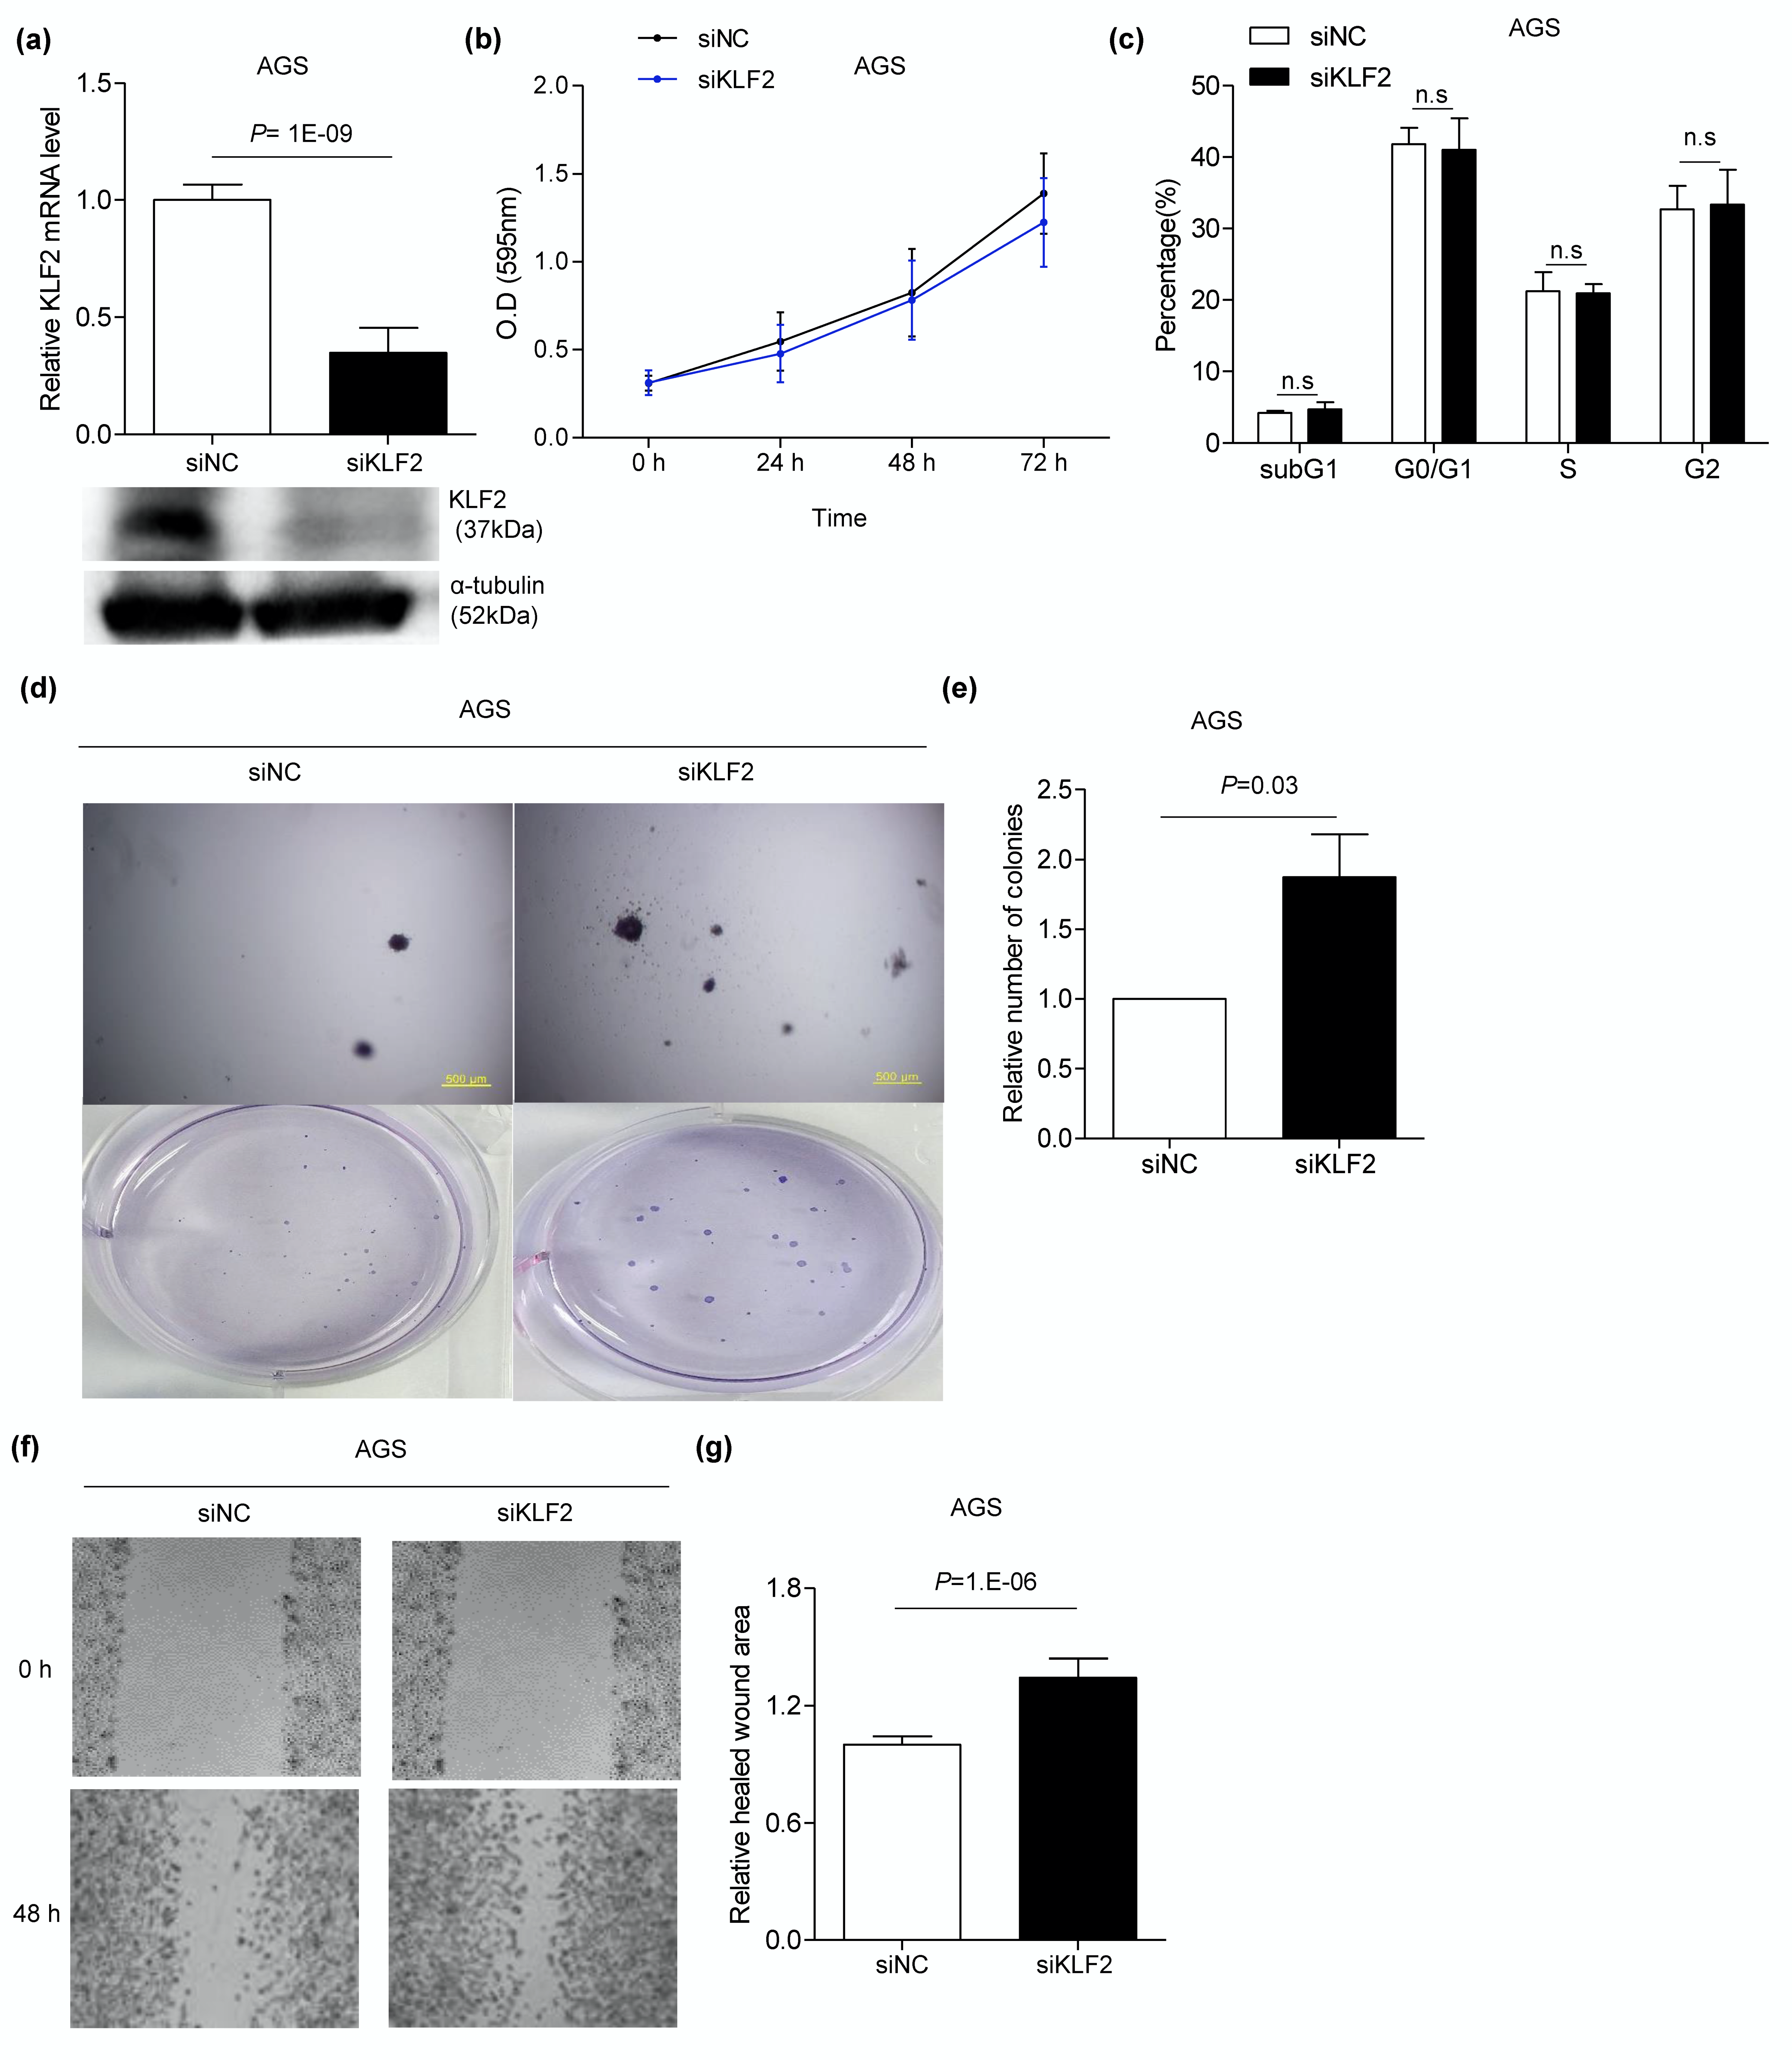
3.6. Knocking Down KLF2 Using siRNA Induces Migration and Anchorage-Independent Growth in AGS Cells

KLF2 siRNA was transfected to confirm that the phenotype changes following miR-BART17-5p transfection were manifested by the downregulation of KLF2. KLF2 expression in AGS was sharply decreased by siKLF2 transfection (Figure 6a) compared with control siRNA (siNC) transfection. After delivering the siKLF2, anchorage-independent growth of AGS on soft agar was increased 1.8-fold compared to cells transfected with the siNC (Figure 6d,e). Cell migration was also increased 1.3-fold by the siKLF2 compared with the siNC (Figure 6f,g). In contrast, cell proliferation and cell cycle were not affected following KLF2 knockdown using the siKLF2 (Figure 6b,c).

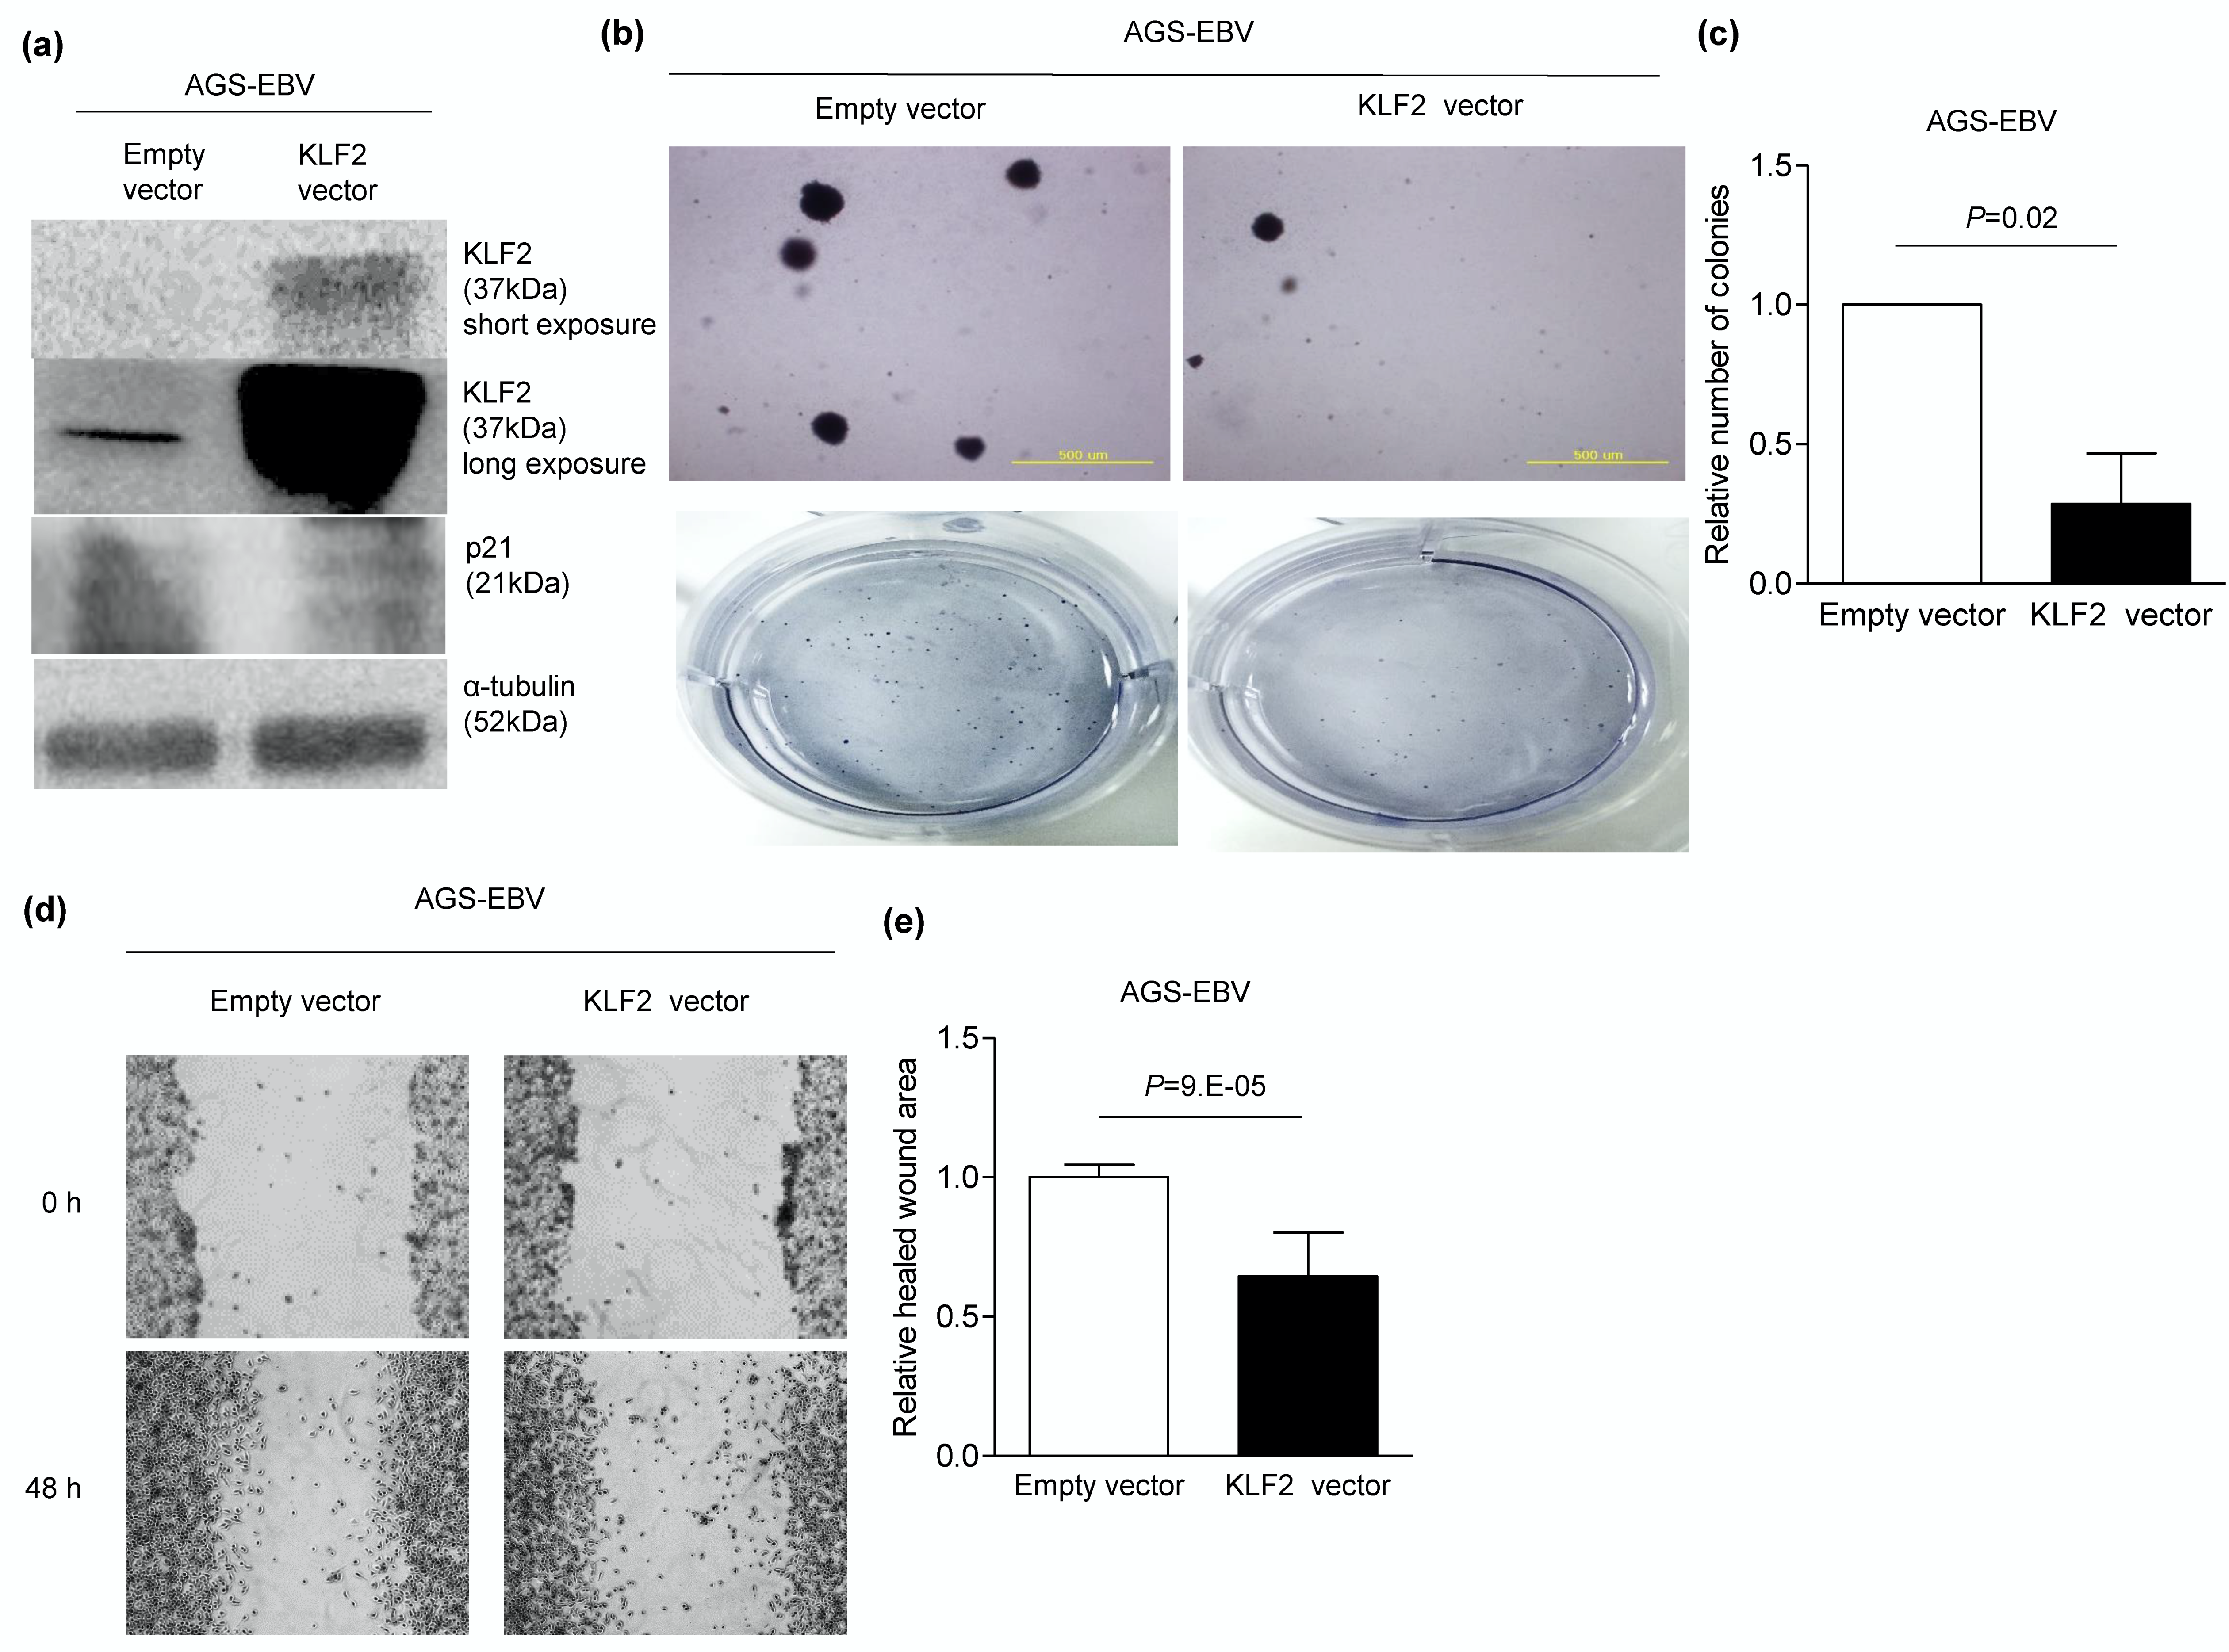
3.7. KLF2 Overexpression Inhibits Migration and Anchorage-Independent Growth in AGS-EBV Cells

To confirm KLF2 function, a KLF2 overexpression vector was delivered to AGS-EBV, in which KLF2 expression was lower than in AGS. Following KLF2 overexpression (Figure 7a), anchorage-independent growth was reduced by 71% in AGS-EBV cells (Figure 7b,c). In addition, migration of AGS-EBV cells was suppressed by 36% compared to the control vector transfection (Figure 7d,e).

4. Discussion

We found that KLF2 expression was lower in EBVaGC than in EBV-negative GC. In the process of testing the hypothesis that EBV miRNAs inhibit KLF2 expression, we found that miR-BART17-5p directly targeted the KLF2 3′UTR to reduce mRNA and protein expression. We also found that miR-BART17-5p promoted cell migration and anchorage-independent growth by reducing the expression of KLF2.
The expression of miR-BART17-5p increases in plasma with the progression of NPC tumors [44]. miR-BART17-5p is also a biomarker that is associated with poor prognosis, since it is only detected in the serum of patients with recurrent NPCs [17]. Although there is a considerable expression of miR-BART17-5p in EBVaGC [20,21], little is known about the role of miR-BART17-5p in EBVaGC. In NPC, LMP1 has been reported to be a target of miR-BART17-5p [9]. As LMP1 is rarely detected in EBVaGC [45,46,47], miR-BART17-5p may target LMP1 and almost abrogate LMP1 expression in EBVaGC. Even when miR-BART17-5p is bound to the 3′UTR of cellular N-myc downstream-regulated gene 1 (NDRG1) [11], miR-BART17-5p did not affect NDRG1 expression, curiously [48]. Our study shows that highly expressed miR-BART17-5p targets KLF2 in EBVaGC, revealing the role of this BART miRNA.
Although KLF2 acts as a tumor suppressor in several cancers, including GC [49,50], reports show that KLF2 acts as an oncogene in liver cancer [51]. Our results support that KLF2 is a target of miR-BART17-5p and acts as a tumor suppressor in EBVaGC. Even though KLF2 expression in GC tissues including EBVaGC were not tested in this study, we analyzed EBVaGC patient data from TCGA [3]. We found that KLF2 expression was lower in GC than in normal tissues, and that KLF2 expression was lower in EBVaGC than in other GCs (Figure 1a,b). In addition, all three naturally EBV infected GC cell lines as well as AGS-EBV cells showed low-level KLF2 expression (Figure 1f). This is consistent with microarray data showing a greater reduction in the expression of KLF2 in EBV-infected cell lines than in EBV-uninfected cell lines [10]. Thus, KLF2 may be expressed at low levels in EBVaGC.
In previous studies, EBV infection in gastric epithelial and gastric carcinoma cell lines increased anchorage-independent growth despite the restricted viral protein expression [10,52]. It was speculated that this phenotype is due to BART miRNAs. Wang et al. [53]. showed that miR-BART7 promoted anchorage-independent growth. Additionally, several studies showed that BART miRNAs promoted cell migration [54,55]. Based on our KLF2 knockdown and overexpression data, the phenotype induced by miR-BART17-5p may be due to the decreased expression of KLF2. Previous reports showed that KLF2 suppressed anchorage-independent growth by inhibiting the expression of Gli1 in liver cancer [56] as well as migration by inhibiting MMP2, N-cadherin, and vimentin in several cancers [48,49]. In our study, reducing KLF2 expression may have caused anchorage-independent growth and cell motility through the mechanisms described above.
In the present study, the expression level of KLF2 in AGS-EBV was lower than the level of KLF2 following miR-BART17-5p transfection to AGS. This suggests that not only miR-BART17-5p but also other EBV genes may down-regulate KLF2 expression. The expression of EZH2, a histone methyltransferase, is increased in NPC [57]. EBV infection in primary B cells induced EZH2 expression [58]. In addition, RNA sequencing data from TCGA showed that the expression of EZH2 in EBVaGC was higher than in normal tissues and other subtypes of GC [3]. Since KLF2 is silenced by EZH2 in GC [27], increased expression of EZH2 in EBVaGC may have silenced KLF2. Li et al. [59] reported that Helicobacter pylori (H. pylori) induced miR-25 to reduce the expression of KLF2. As GC can be co-infected with EBV and H. pylori, both miR-25 and miR-BART17-5p may exert a simultaneous effect on the expression of KLF2. It is not clear which pathway would be more important for the development of GC based on our data, as we did not test the effect of H. pylori infection. Further studies would be required to clarify this point.
Although in a previous study KLF2 was reported to be a tumor suppressor that affected cell proliferation in GC [34], cell proliferation was not affected by either siKLF2 or miR-BART17-5p in the present study. KLF2 was shown to inhibit cell proliferation by increasing the expression of p21, a cell cycle blocker [60]. However, siKLF2 transfection did not affect the cell cycle and the KLF2 overexpression vector transfection did not affect the expression of p21 in our experiments. Recently, a study reported that FOXO4 binds to the activation domain of KLF2 and co-operates to induce p21 expression [61]. RNA sequencing data from TCGA showed that FOXO4 is decreased in EBVaGC [3]. This is consistent with a previous study where the expression of FOXO4 was reduced by LMP1 and LMP2A in AGS-EBV [62]. Therefore, even when KLF2 was overexpressed in AGS-EBV cells, p21 may not be induced due to low FOXO4 expression in the cells. In addition, we previously reported that miR-BART17-5p did not affect cell proliferation, which is consistent with this study [63]. Many studies suggest that the growth rate of cancer cells does not necessarily correlate with cell migration and invasion abilities [64,65]. Thus, we propose that miR-BART17-5p may play a role in the metastatic process rather than in tumor growth of EBVaGC.

5. Conclusions

Our data suggest that miR-BART17-5p, which is highly expressed in EBVaGC, plays an oncogenic role by inhibiting a tumor suppressor KLF2 expression. miR-BART17-5p increased cell motility and anchorage-independent growth, features associated tumor metastasis. Therefore, miR-BART17-5p may serve as a potential therapeutic target of EBVaGC. Inhibitors of miR-BART17-5p may be useful alone or in combination with other therapeutic agents to treat EBVaGC.

Author Contributions

Conceptualization, S.K.L. and J.H.Y.; Investigation, J.H.Y.; Resources, J.H.Y. and K.M.; Methodology, K.M.; Writing and Editing, J.H.Y. and S.K.L.; Supervision, S.K.L.; Funding acquisition, S.K.L. All authors have read and agreed to the published version of the manuscript.

Funding

This research was supported by the Basic Science Research Program through the National Research Foundation of Korea (NRF), funded by the Ministry of Education, Science and Technology (2018R1D1A1B07041763).

Conflicts of Interest

The authors declare no conflict of interest.

References

  1. Bray, F.; Ferlay, J.; Soerjomataram, I.; Siegel, R.L.; Torre, L.A.; Jemal, A. Global cancer statistics 2018: GLOBOCAN estimates of incidence and mortality worldwide for 36 cancers in 185 countries. CA A Cancer J. Clin. 2018, 68, 394–424. [Google Scholar] [CrossRef] [PubMed] [Green Version]
  2. Van Cutsem, E.; Sagaert, X.; Topal, B.; Haustermans, K.; Prenen, H. Gastric cancer. Lancet Lond. Engl. 2016, 388, 2654–2664. [Google Scholar] [CrossRef]
  3. Network, C.G.A.R. Comprehensive molecular characterization of gastric adenocarcinoma. Nature 2014, 513, 202–209. [Google Scholar]
  4. Chen, J.; Sathiyamoorthy, K.; Zhang, X.; Schaller, S.; Perez White, B.E.; Jardetzky, T.S.; Longnecker, R. Ephrin receptor A2 is a functional entry receptor for Epstein-Barr virus. Nat. Microbiol. 2018, 3, 172–180. [Google Scholar] [CrossRef] [PubMed]
  5. Hutt-Fletcher, L.M.; Chesnokova, L.S. Integrins as triggers of Epstein-Barr virus fusion and epithelial cell infection. Virulence 2010, 1, 395–398. [Google Scholar] [CrossRef] [PubMed] [Green Version]
  6. Nishikawa, J.; Iizasa, H.; Yoshiyama, H.; Nakamura, M.; Saito, M.; Sasaki, S.; Shimokuri, K.; Yanagihara, M.; Sakai, K.; Suehiro, Y.; et al. The Role of Epigenetic Regulation in Epstein-Barr Virus-Associated Gastric Cancer. Int. J. Mol. Sci. 2017, 18, 1606. [Google Scholar] [CrossRef] [Green Version]
  7. Imai, S.; Koizumi, S.; Sugiura, M.; Tokunaga, M.; Uemura, Y.; Yamamoto, N.; Tanaka, S.; Sato, E.; Osato, T. Gastric carcinoma: Monoclonal epithelial malignant cells expressing Epstein-Barr virus latent infection protein. Proc. Natl. Acad. Sci. USA 1994, 91, 9131–9135. [Google Scholar] [CrossRef] [Green Version]
  8. Jung, Y.J.; Choi, H.; Kim, H.; Lee, S.K. MicroRNA miR-BART20-5p stabilizes Epstein-Barr virus latency by directly targeting BZLF1 and BRLF1. J. Virol. 2014, 88, 9027–9037. [Google Scholar] [CrossRef] [Green Version]
  9. Lo, A.K.; To, K.F.; Lo, K.W.; Lung, R.W.; Hui, J.W.; Liao, G.; Hayward, S.D. Modulation of LMP1 protein expression by EBV-encoded microRNAs. Proc. Natl. Acad. Sci. USA 2007, 104, 16164–16169. [Google Scholar] [CrossRef] [Green Version]
  10. Marquitz, A.R.; Mathur, A.; Shair, K.H.; Raab-Traub, N. Infection of Epstein-Barr virus in a gastric carcinoma cell line induces anchorage independence and global changes in gene expression. Proc. Natl. Acad. Sci. USA 2012, 109, 9593–9598. [Google Scholar] [CrossRef] [Green Version]
  11. Gottwein, E.; Corcoran, D.L.; Mukherjee, N.; Skalsky, R.L.; Hafner, M.; Nusbaum, J.D.; Shamulailatpam, P.; Love, C.L.; Dave, S.S.; Tuschl, T.; et al. Viral microRNA targetome of KSHV-infected primary effusion lymphoma cell lines. Cell Host Microbe 2011, 10, 515–526. [Google Scholar] [CrossRef] [PubMed] [Green Version]
  12. Marquitz, A.R.; Mathur, A.; Nam, C.S.; Raab-Traub, N. The Epstein-Barr Virus BART microRNAs target the pro-apoptotic protein Bim. Virology 2011, 412, 392–400. [Google Scholar] [CrossRef] [PubMed]
  13. Kim, H.; Choi, H.; Lee, S.K. Epstein-Barr virus miR-BART20-5p regulates cell proliferation and apoptosis by targeting BAD. Cancer Lett. 2015, 356, 733–742. [Google Scholar] [CrossRef] [PubMed]
  14. Cai, L.; Ye, Y.; Jiang, Q.; Chen, Y.; Lyu, X.; Li, J.; Wang, S.; Liu, T.; Cai, H.; Yao, K.; et al. Epstein-Barr virus-encoded microRNA BART1 induces tumour metastasis by regulating PTEN-dependent pathways in nasopharyngeal carcinoma. Nat. Commun. 2015, 6, 7353. [Google Scholar] [CrossRef] [PubMed] [Green Version]
  15. Zheng, X.; Wang, J.; Wei, L.; Peng, Q.; Gao, Y.; Fu, Y.; Lu, Y.; Qin, Z.; Zhang, X.; Lu, J.; et al. Epstein-Barr Virus MicroRNA miR-BART5-3p Inhibits p53 Expression. J. Virol. 2018, 92. [Google Scholar] [CrossRef] [PubMed] [Green Version]
  16. Shinozaki-Ushiku, A.; Kunita, A.; Isogai, M.; Hibiya, T.; Ushiku, T.; Takada, K.; Fukayama, M. Profiling of Virus-Encoded MicroRNAs in Epstein-Barr Virus-Associated Gastric Carcinoma and Their Roles in Gastric Carcinogenesis. J. Virol. 2015, 89, 5581–5591. [Google Scholar] [CrossRef] [PubMed] [Green Version]
  17. Hirai, N.; Wakisaka, N.; Kondo, S.; Aga, M.; Moriyama-Kita, M.; Ueno, T.; Nakanishi, Y.; Endo, K.; Sugimoto, H.; Murono, S.; et al. Potential Interest in Circulating miR-BART17-5p As a Post-Treatment Biomarker for Prediction of Recurrence in Epstein-Barr Virus-Related Nasopharyngeal Carcinoma. PLoS ONE 2016, 11, e0163609. [Google Scholar] [CrossRef] [PubMed]
  18. Wong, A.M.; Kong, K.L.; Tsang, J.W.; Kwong, D.L.; Guan, X.Y. Profiling of Epstein-Barr virus-encoded microRNAs in nasopharyngeal carcinoma reveals potential biomarkers and oncomirs. Cancer 2012, 118, 698–710. [Google Scholar] [CrossRef]
  19. Martin-Perez, D.; Vargiu, P.; Montes-Moreno, S.; Leon, E.A.; Rodriguez-Pinilla, S.M.; Lisio, L.D.; Martinez, N.; Rodriguez, R.; Mollejo, M.; Castellvi, J.; et al. Epstein-Barr virus microRNAs repress BCL6 expression in diffuse large B-cell lymphoma. Leukemia 2012, 26, 180–183. [Google Scholar] [CrossRef]
  20. Marquitz, A.R.; Mathur, A.; Chugh, P.E.; Dittmer, D.P.; Raab-Traub, N. Expression profile of microRNAs in Epstein-Barr virus-infected AGS gastric carcinoma cells. J. Virol. 2014, 88, 1389–1393. [Google Scholar] [CrossRef] [Green Version]
  21. Shinozaki-Ushiku, A.; Kunita, A.; Fukayama, M. Update on Epstein-Barr virus and gastric cancer (review). Int. J. Oncol. 2015, 46, 1421–1434. [Google Scholar] [CrossRef] [PubMed] [Green Version]
  22. Tetreault, M.P.; Yang, Y.; Katz, J.P. Kruppel-like factors in cancer. Nat. Rev. Cancer 2013, 13, 701–713. [Google Scholar] [CrossRef] [PubMed]
  23. Goldstein, B.G.; Chao, H.H.; Yang, Y.; Yermolina, Y.A.; Tobias, J.W.; Katz, J.P. Overexpression of Kruppel-like factor 5 in esophageal epithelia in vivo leads to increased proliferation in basal but not suprabasal cells. Am. J. Physiol. Gastrointest. Liver Physiol. 2007, 292, G1784–G1792. [Google Scholar] [CrossRef] [PubMed] [Green Version]
  24. Nawandar, D.M.; Wang, A.; Makielski, K.; Lee, D.; Ma, S.; Barlow, E.; Reusch, J.; Jiang, R.; Wille, C.K.; Greenspan, D.; et al. Differentiation-Dependent KLF4 Expression Promotes Lytic Epstein-Barr Virus Infection in Epithelial Cells. PLoS Pathog. 2015, 11, e1005195. [Google Scholar] [CrossRef] [PubMed]
  25. Li, Y.; Sun, Q.; Jiang, M.; Li, S.; Zhang, J.; Xu, Z.; Guo, D.; Gu, T.; Wang, B.; Xiao, L.; et al. KLF9 suppresses gastric cancer cell invasion and metastasis through transcriptional inhibition of MMP28. Faseb J. Off. Publ. Fed. Am. Soc. Exp. Biol. 2019, 33, 7915–7928. [Google Scholar] [CrossRef] [PubMed]
  26. Yan, C.; Yu, J.; Liu, Y.; Kang, W.; Ma, Z.; Zhou, L. MiR-32 promotes gastric carcinoma tumorigenesis by targeting Kruppel-like factor 4. Biochem. Biophys. Res. Commun. 2015, 467, 913–920. [Google Scholar] [CrossRef] [PubMed]
  27. Taniguchi, H.; Jacinto, F.V.; Villanueva, A.; Fernandez, A.F.; Yamamoto, H.; Carmona, F.J.; Puertas, S.; Marquez, V.E.; Shinomura, Y.; Imai, K.; et al. Silencing of Kruppel-like factor 2 by the histone methyltransferase EZH2 in human cancer. Oncogene 2012, 31, 1988–1994. [Google Scholar] [CrossRef]
  28. Yin, L.; Wang, J.P.; Xu, T.P.; Chen, W.M.; Huang, M.D.; Xia, R.; Liu, X.X.; Kong, R.; Sun, M.; Zhang, E.B.; et al. Downregulation of Kruppel-like factor 2 is associated with poor prognosis for nonsmall-cell lung cancer. Tumour Biol. 2015, 36, 3075–3084. [Google Scholar] [CrossRef]
  29. Zhang, D.; Dai, Y.; Cai, Y.; Suo, T.; Liu, H.; Wang, Y.; Cheng, Z.; Liu, H. KLF2 is downregulated in pancreatic ductal adenocarcinoma and inhibits the growth and migration of cancer cells. Tumour Biol. 2016, 37, 3425–3431. [Google Scholar] [CrossRef]
  30. Wang, C.; Li, L.; Duan, Q.; Wang, Q.; Chen, J. Kruppel-like factor 2 suppresses human gastric tumorigenesis through inhibiting PTEN/AKT signaling. Oncotarget 2017, 8, 100358–100370. [Google Scholar]
  31. Fang, R.; Xu, J.; Lin, H.; Xu, X.; Tian, F. The histone demethylase lysine-specific demethylase-1-mediated epigenetic silence of KLF2 contributes to gastric cancer cell proliferation, migration, and invasion. Tumour Biol. 2017, 39, 1010428317698356. [Google Scholar] [CrossRef] [PubMed] [Green Version]
  32. Xia, R.; Jin, F.Y.; Lu, K.; Wan, L.; Xie, M.; Xu, T.P.; De, W.; Wang, Z.X. SUZ12 promotes gastric cancer cell proliferation and metastasis by regulating KLF2 and E-cadherin. Tumour Biol. 2015, 36, 5341–5351. [Google Scholar] [CrossRef] [PubMed]
  33. Wang, Q.; He, Y.; Kan, W.; Li, F.; Ji, X.; Wu, X.; Wang, X.; Zhang, Y.; Chen, J. microRNA-32-5p targets KLF2 to promote gastric cancer by activating PI3K/AKT signaling pathway. Am. J. Transl. Res. 2019, 11, 4895–4908. [Google Scholar] [PubMed]
  34. Li, X.; Li, Z.; Liu, Z.; Xiao, J.; Yu, S.; Song, Y. Long non-coding RNA DLEU1 predicts poor prognosis of gastric cancer and contributes to cell proliferation by epigenetically suppressing KLF2. Cancer Gene Ther. 2018, 25, 58–67. [Google Scholar] [CrossRef]
  35. Huang, M.; Hou, J.; Wang, Y.; Xie, M.; Wei, C.; Nie, F.; Wang, Z.; Sun, M. Long Noncoding RNA LINC00673 Is Activated by SP1 and Exerts Oncogenic Properties by Interacting with LSD1 and EZH2 in Gastric Cancer. Mol. Ther. J. Am. Soc. Gene Ther. 2017, 25, 1014–1026. [Google Scholar] [CrossRef] [Green Version]
  36. Sun, M.; Nie, F.; Wang, Y.; Zhang, Z.; Hou, J.; He, D.; Xie, M.; Xu, L.; De, W.; Wang, Z.; et al. LncRNA HOXA11-AS Promotes Proliferation and Invasion of Gastric Cancer by Scaffolding the Chromatin Modification Factors PRC2, LSD1, and DNMT1. Cancer Res. 2016, 76, 6299–6310. [Google Scholar] [CrossRef] [Green Version]
  37. Xu, T.P.; Liu, X.X.; Xia, R.; Yin, L.; Kong, R.; Chen, W.M.; Huang, M.D.; Shu, Y.Q. SP1-induced upregulation of the long noncoding RNA TINCR regulates cell proliferation and apoptosis by affecting KLF2 mRNA stability in gastric cancer. Oncogene 2015, 34, 5648–5661. [Google Scholar] [CrossRef]
  38. Shimizu, N.; Yoshiyama, H.; Takada, K. Clonal propagation of Epstein-Barr virus (EBV) recombinants in EBV-negative Akata cells. J. Virol. 1996, 70, 7260–7263. [Google Scholar] [CrossRef] [Green Version]
  39. Oh, S.T.; Seo, J.S.; Moon, U.Y.; Kang, K.H.; Shin, D.J.; Yoon, S.K.; Kim, W.H.; Park, J.G.; Lee, S.K. A naturally derived gastric cancer cell line shows latency I Epstein-Barr virus infection closely resembling EBV-associated gastric cancer. Virology 2004, 320, 330–336. [Google Scholar] [CrossRef]
  40. Kim, D.N.; Seo, M.K.; Choi, H.; Kim, S.Y.; Shin, H.J.; Yoon, A.R.; Tao, Q.; Rha, S.Y.; Lee, S.K. Characterization of naturally Epstein-Barr virus-infected gastric carcinoma cell line YCCEL1. J. Gen. Virol. 2013, 94, 497–506. [Google Scholar] [CrossRef]
  41. Ku, J.L.; Kim, K.H.; Choi, J.S.; Kim, S.H.; Shin, Y.K.; Chang, H.J.; Bae, J.M.; Kim, Y.W.; Lee, J.H.; Yang, H.K.; et al. Establishment and characterization of six human gastric carcinoma cell lines, including one naturally infected with Epstein-Barr virus. Cell Oncol (Dordr). 2012, 35, 127–136. [Google Scholar] [CrossRef] [PubMed]
  42. Shin, H.J.; Kim, D.N.; Lee, S.K. Association between Epstein-Barr virus infection and chemoresistance to docetaxel in gastric carcinoma. Mol. Cells 2011, 32, 173–179. [Google Scholar] [CrossRef] [PubMed] [Green Version]
  43. Cai, X.; Schafer, A.; Lu, S.; Bilello, J.P.; Desrosiers, R.C.; Edwards, R.; Raab-Traub, N.; Cullen, B.R. Epstein-Barr virus microRNAs are evolutionarily conserved and differentially expressed. PLoS Pathog. 2006, 2, e23. [Google Scholar] [CrossRef] [PubMed] [Green Version]
  44. Gourzones, C.; Ferrand, F.R.; Amiel, C.; Verillaud, B.; Barat, A.; Guerin, M.; Gattolliat, C.H.; Gelin, A.; Klibi, J.; Chaaben, A.B.; et al. Consistent high concentration of the viral microRNA BART17 in plasma samples from nasopharyngeal carcinoma patients--evidence of non-exosomal transport. Virol. J. 2013, 10, 119. [Google Scholar] [CrossRef] [PubMed] [Green Version]
  45. Luo, B.; Wang, Y.; Wang, X.F.; Liang, H.; Yan, L.P.; Huang, B.H.; Zhao, P. Expression of Epstein-Barr virus genes in EBV-associated gastric carcinomas. World J. Gastroenterol. 2005, 11, 629–633. [Google Scholar] [CrossRef]
  46. zur Hausen, A.; Brink, A.A.; Craanen, M.E.; Middeldorp, J.M.; Meijer, C.J.; van den Brule, A.J. Unique transcription pattern of Epstein-Barr virus (EBV) in EBV-carrying gastric adenocarcinomas: Expression of the transforming BARF1 gene. Cancer Res. 2000, 60, 2745–2748. [Google Scholar]
  47. Osato, T.; Imai, S. Epstein-Barr virus and gastric carcinoma. Semin. Cancer Biol. 1996, 7, 175–182. [Google Scholar] [CrossRef]
  48. Kanda, T.; Miyata, M.; Kano, M.; Kondo, S.; Yoshizaki, T.; Iizasa, H. Clustered microRNAs of the Epstein-Barr virus cooperatively downregulate an epithelial cell-specific metastasis suppressor. J. Virol. 2015, 89, 2684–2697. [Google Scholar] [CrossRef] [Green Version]
  49. Wang, B.; Liu, M.; Song, Y.; Li, C.; Zhang, S.; Ma, L. KLF2 Inhibits the Migration and Invasion of Prostate Cancer Cells by Downregulating MMP2. Am. J. Men’s Health 2019, 13, 1557988318816907. [Google Scholar] [CrossRef] [Green Version]
  50. Xia, E.; Bhandari, A.; Shen, Y.; Zhou, X.; Wang, O. lncRNA LINC00673 induces proliferation, metastasis and epithelial-mesenchymal transition in thyroid carcinoma via Kruppel-like factor 2. Int. J. Oncol. 2018, 53, 1927–1938. [Google Scholar] [CrossRef] [Green Version]
  51. Zou, K.; Lu, X.; Ye, K.; Wang, C.; You, T.; Chen, J. Kruppel-like factor 2 promotes cell proliferation in hepatocellular carcinoma through up-regulation of c-myc. Cancer Biol. Ther. 2016, 17, 20–26. [Google Scholar] [CrossRef] [PubMed] [Green Version]
  52. Nishikawa, J.; Imai, S.; Oda, T.; Kojima, T.; Okita, K.; Takada, K. Epstein-Barr virus promotes epithelial cell growth in the absence of EBNA2 and LMP1 expression. J. Virol. 1999, 73, 1286–1292. [Google Scholar] [CrossRef] [PubMed] [Green Version]
  53. Wang, L.; Liu, L.F.; Zhou, L.; Liao, F.; Wang, J. Effects of ebv-miR-BART7 on tumorigenicity, metastasis, and TRAIL sensitivity of non-small cell lung cancer. J. Cell. Biochem. 2019, 120, 10057–10068. [Google Scholar] [CrossRef] [PubMed]
  54. Lin, C.; Zong, J.; Lin, W.; Wang, M.; Xu, Y.; Zhou, R.; Lin, S.; Guo, Q.; Chen, H.; Ye, Y.; et al. EBV-miR-BART8-3p induces epithelial-mesenchymal transition and promotes metastasis of nasopharyngeal carcinoma cells through activating NF-kappaB and Erk1/2 pathways. J. Exp. Clin. Cancer Res. CR 2018, 37, 283. [Google Scholar] [CrossRef] [PubMed]
  55. Min, K.; Lee, S.K. EBV miR-BART10-3p Promotes Cell Proliferation and Migration by Targeting DKK1. Int. J. Biol. Sci. 2019, 15, 657–667. [Google Scholar] [CrossRef] [PubMed]
  56. Lin, J.; Tan, H.; Nie, Y.; Wu, D.; Zheng, W.; Lin, W.; Zhu, Z.; Yang, B.; Chen, X.; Chen, T. Kruppel-like factor 2 inhibits hepatocarcinogenesis through negative regulation of the Hedgehog pathway. Cancer Sci. 2019, 110, 1220–1231. [Google Scholar] [CrossRef]
  57. Tong, Z.T.; Cai, M.Y.; Wang, X.G.; Kong, L.L.; Mai, S.J.; Liu, Y.H.; Zhang, H.B.; Liao, Y.J.; Zheng, F.; Zhu, W.; et al. EZH2 supports nasopharyngeal carcinoma cell aggressiveness by forming a co-repressor complex with HDAC1/HDAC2 and Snail to inhibit E-cadherin. Oncogene 2012, 31, 583–594. [Google Scholar] [CrossRef] [Green Version]
  58. Ichikawa, T.; Okuno, Y.; Sato, Y.; Goshima, F.; Yoshiyama, H.; Kanda, T.; Kimura, H.; Murata, T. Regulation of Epstein-Barr Virus Life Cycle and Cell Proliferation by Histone H3K27 Methyltransferase EZH2 in Akata Cells. mSphere 2018, 3, e00478-18. [Google Scholar] [CrossRef] [Green Version]
  59. Li, N.; Liu, S.F.; Dong, K.; Zhang, G.C.; Huang, J.; Wang, Z.H.; Wang, T.J. Exosome-Transmitted miR-25 Induced by H. pylori Promotes Vascular Endothelial Cell Injury by Targeting KLF2. Front. Cell. Infect. Microbiol. 2019, 9, 366. [Google Scholar] [CrossRef]
  60. Wu, J.; Lingrel, J.B. KLF2 inhibits Jurkat T leukemia cell growth via upregulation of cyclin-dependent kinase inhibitor p21WAF1/CIP1. Oncogene 2004, 23, 8088–8096. [Google Scholar] [CrossRef] [Green Version]
  61. Yuedi, D.; Houbao, L.; Pinxiang, L.; Hui, W.; Min, T.; Dexiang, Z. KLF2 induces the senescence of pancreatic cancer cells by cooperating with FOXO4 to upregulate p21. Exp. Cell Res. 2019, 111784. [Google Scholar] [CrossRef] [PubMed]
  62. Liu, W.; Song, Y.Y.; Wang, J.Y.; Xiao, H.; Zhang, Y.; Luo, B. Dysregulation of FOXO transcription factors in Epstein-Barr virus-associated gastric carcinoma. Virus Res. 2019, 276, 197808. [Google Scholar] [CrossRef] [PubMed]
  63. Choi, H.; Lee, H.; Kim, S.R.; Gho, Y.S.; Lee, S.K. Epstein-Barr virus-encoded microRNA BART15-3p promotes cell apoptosis partially by targeting BRUCE. J. Virol. 2013, 87, 8135–8144. [Google Scholar] [CrossRef] [Green Version]
  64. Savita, U.; Karunagaran, D. MicroRNA-106b-25 cluster targets beta-TRCP2, increases the expression of Snail and enhances cell migration and invasion in H1299 (non small cell lung cancer) cells. Biochem. Biophys. Res. Commun. 2013, 434, 841–847. [Google Scholar] [CrossRef] [PubMed]
  65. Wang, H.J.; Ruan, H.J.; He, X.J.; Ma, Y.Y.; Jiang, X.T.; Xia, Y.J.; Ye, Z.Y.; Tao, H.Q. MicroRNA-101 is down-regulated in gastric cancer and involved in cell migration and invasion. Eur. J. Cancer 2010, 46, 2295–2303. [Google Scholar] [CrossRef] [PubMed]
Figure 1. Suppressed Kruppel-like factor 2 (KLF2) expression by Epstein-Barr Virus (EBV) infection in gastric carcinoma. (a) RNA sequencing data from The Cancer Genome Atlas (TCGA) were used to analyze the expression of each KLF in normal tissues (N) and four subtypes of gastric cancer tissues (C). Significantly decreased (red) and increased (blue) KLF expression in C compared to N are indicated. Five KLFs with very low expression are shown at a larger scale at the upper right corner. (b) TCGA RNA sequencing data were used to select KLFs which showed reduced expression in gastric cancer tissues compared to normal tissues. KLF expression in EBV gastric cancer and in all the other three subtypes of gastric cancer (others) are shown for comparison. (c) mRNA level of KLF2 was analyzed by qRT-PCR using a SYBR Green qPCR kit. (d) Western blot analysis was carried out to analyze the expression of KLF2 using anti-KLF2 (1:500) antibody in three independent experiments. A representative result is shown. (e) Results of KLF2 Western blot analysis for AGS-EBV cells conducted from three independent experiments were normalized using α-tubulin and expressed as ratios relative to the values obtained from AGS cells. Each value represents the mean ± standard deviation (SD) of three independent experiments. (f) KLF2 mRNA levels in EBV-positive and EBV-negative cell lines were analyzed by qRT-PCR and shown as relative values to that of SNU-719. Each value represents the mean ± SD in three independent experiments.
Microorganisms 08 00258 g001
Figure 2. Screening of EBV microRNA that targets KLF2. (a) Seed matches between four BART miRNAs and the 3′UTR of KLF2. (b,c) psiC_KLF2 and each BART miRNA were co-transfected into HEK293T cells (b) and AGS cells (c). Luciferase reporter assays were measured 48 h after transfection. Three independent experiments were conducted to confirm reproducibility. Luciferase activity was normalized using internal firefly luciferase activity. The luciferase activity of the cells transfected with each BART miRNA is expressed as a ratio to the luciferase activity obtained from the scrambled control transfected cells. Error bars indicate SDs. (d) Schematic drawing shows the location of the predicted target sites 1 and 2 for miR-BART17-5p on the 3′UTR of KLF2 mRNA (upper panel). Two sites in the 3′UTR of KLF2 that seed match with miR-BART17-5p were mutated individually or together, and the mutated sequences are shown in red (lower panel). (e) Luciferase assay was carried out using AGS cells co-transfected with psiC_KLF2 (wildtype or mutants) and 30 nM miR-BART17-5p. Each value represents the mean ± SD in four independent experiments. Abbreviation: n.s, not significant.
Microorganisms 08 00258 g002
Figure 3. Expression of KLF2 affected by transfection and inhibition of miR-BART17-5p. miR-BART17-5p mimic (30 nM) was transfected into AGS cells (a,b). (a) mRNA level of KLF2 was analyzed by qRT-PCR using a SYBR Green qPCR kit. (b) Western blot analysis of KLF2 expression using anti-KLF2 (1:500) antibody. Anti-α-tubulin antibody was used to confirm comparable loading (left panel). Western blot results have been normalized to α-tubulin and are expressed as ratios to the values obtained from the scrambled control. Error bars indicate SD (n = 3) (Right panel). AGS-EBV and SNU-719 were transfected with 30 nM miR-BART17-5p inhibitor (c-f). (c) miR-BART17-5p was analyzed by qRT-PCR in three independent experiments. Expression of miR-BART17-5p was normalized with U6 snRNA. (d) mRNA level of KLF2 was analyzed by qRT-PCR using a SYBR Green qPCR kit. (e) Western blot analysis was performed in three independent experiments to measure KLF2 protein level in AGS-EBV cells. Anti-α-tubulin antibody was used to confirm comparable loading (left panel). (f) Western blots were performed in three independent experiments to measure KLF2 protein level in SNU-719 (left panel). Western blot results have been normalized to α-tubulin and are expressed as ratios to the values obtained from the control inhibitor. Error bars indicate SD (n = 3) (right panel).
Microorganisms 08 00258 g003
Figure 4. Enhanced AGS cell migration and anchorage-independent growth by miR-BART17-5p. AGS cells were transfected with 30 nM miR-BART17-5p mimic (ae). (a) Before and every 24 h after miR-BART17-5p mimic transfection, 20 µl of MTT solution was added to each well to assess AGS cell proliferation. Experiments were conducted four times independently. (b) For conducting soft agar colony formation assay, transfected AGS cell was harvested after 24 h and seeded in agar. Cells placed in agar were observed after 4-6 weeks in three independent experiments. Upper panels were observed with microscope IX70 (Olympus, Tokyo, Japan) through a × 40 objective. Lower panels show the pictures taken with a camera. (c) Colonies were quantified using Image J software. Error bars indicate SD (n = 3). (d) Wound-healing assay was performed using AGS cells transfected with either miR-BART17-5p or the scrambled control. (e) Healed wound area was measured by Image J software. Error bars indicate SD (n = 3).
Microorganisms 08 00258 g004
Figure 5. Suppressed AGS-EBV cell migration and anchorage-independent growth by the miR-BART17-5p inhibitor. AGS-EBV cells were transfected with the miR-BART17-5p inhibitor and all experiments were conducted three times independently (ad). (a) To conduct soft agar colony formation assay, the transfected AGS-EBV cell was harvested after 24 h and seeded in agar. Cells placed in agar were observed after 4-6 weeks. All experiments were conducted three times. Upper panels were observed with microscope IX70 through a ×40 objective. Lower panels show the pictures taken with a camera. (b) Colonies were quantified using Image J software. Error bars indicate SD (n = 3). (c) Wound-healing assay was performed using AGS-EBV cells transfected with either the miR-BART17-5p inhibitor or the control inhibitor in three independent experiments. (d) Healed wound area was measured by Image J software. Error bars indicate SD (n = 3).
Microorganisms 08 00258 g005
Figure 6. Promoted tumorigenesis of AGS cells through siKLF2. AGS cells were transfected with 30 nM siKLF2 (ag). (a) KLF2 mRNA level was analyzed by qRT-PCR using a SYBR Green qPCR kit (Upper panel). Western blotting using anti-KLF2 (1:500) antibody showed expression of KLF2. Anti-α-tubulin antibody was used for loading control (lower panel). All experiments were conducted three times independently. (b) Before and every 24 h after siKLF2 transfection, 20 µl of MTT solution was added to each well to assess AGS cell proliferation in four independent experiments. (c) AGS cells were transfected with the negative control (siNC) or siKLF2. The proportion of the cells in each cell cycle phase was evaluated 48 h later by propidium iodide staining. All experiments were conducted four times independently. (d) To conduct soft agar colony formation assay, a transfected AGS cell was harvested after 24 h and seeded in agar. Cells placed in agar were observed after 4–6 weeks in three independent experiments. Upper panels were observed with microscope IX70 through a ×40 objective. Lower panels show the images taken with a camera. (e) Colonies were quantified using Image J software. Error bars indicate SD (n = 3). (f) Wound-healing assay was performed on AGS cells transfected with 30 nM siKLF2 to assess KLF2 function in three independent experiments. (g) Healed wound area was measured by Image J software. Error bars indicate SD (n = 3). Abbreviation: n.s, not significant.
Microorganisms 08 00258 g006
Figure 7. Inhibited tumorigenesis of AGS-EBV cells through KLF2 overexpression. AGS-EBV cells were transfected with either the KLF2 vector or the empty vector, and all experiments were conducted three times independently (ae). (a) Western blot analysis was carried out using anti-KLF2 (1:500) antibody. Anti-p21 (1:500) detected the expression of p21, which is downstream of KLF2. Anti-α-tubulin antibody was used as a loading control. Long exposure was performed to show that KLF2 was expressed even when the empty vector was delivered. (b) To conduct the soft agar colony formation assay, transfected AGS-EBV cells were harvested after 24 h and seeded in agar. Cells placed in agar were observed after 4-6 weeks in three independent experiments. Upper panels were observed with microscope IX70 through a ×40 objective. Lower panels show the images taken with a camera. (c) Colonies were quantified using the Image J software. Error bars indicate SD (n = 3). (d) Wound-healing assay was performed three times independently in AGS-EBV cells transfected with 500 ng of the KLF2 expression vector or the empty vector. (e) Healed wound area was measured by Image J software. Error bars indicate SD (n = 3).
Microorganisms 08 00258 g007

