
Blue and Yellow Light Induce Changes in Biochemical Composition and Ultrastructure of Limnospira fusiformis (Cyanoprokaryota)
 , and
, and 
Abstract
:1. Introduction
2. Materials and Methods
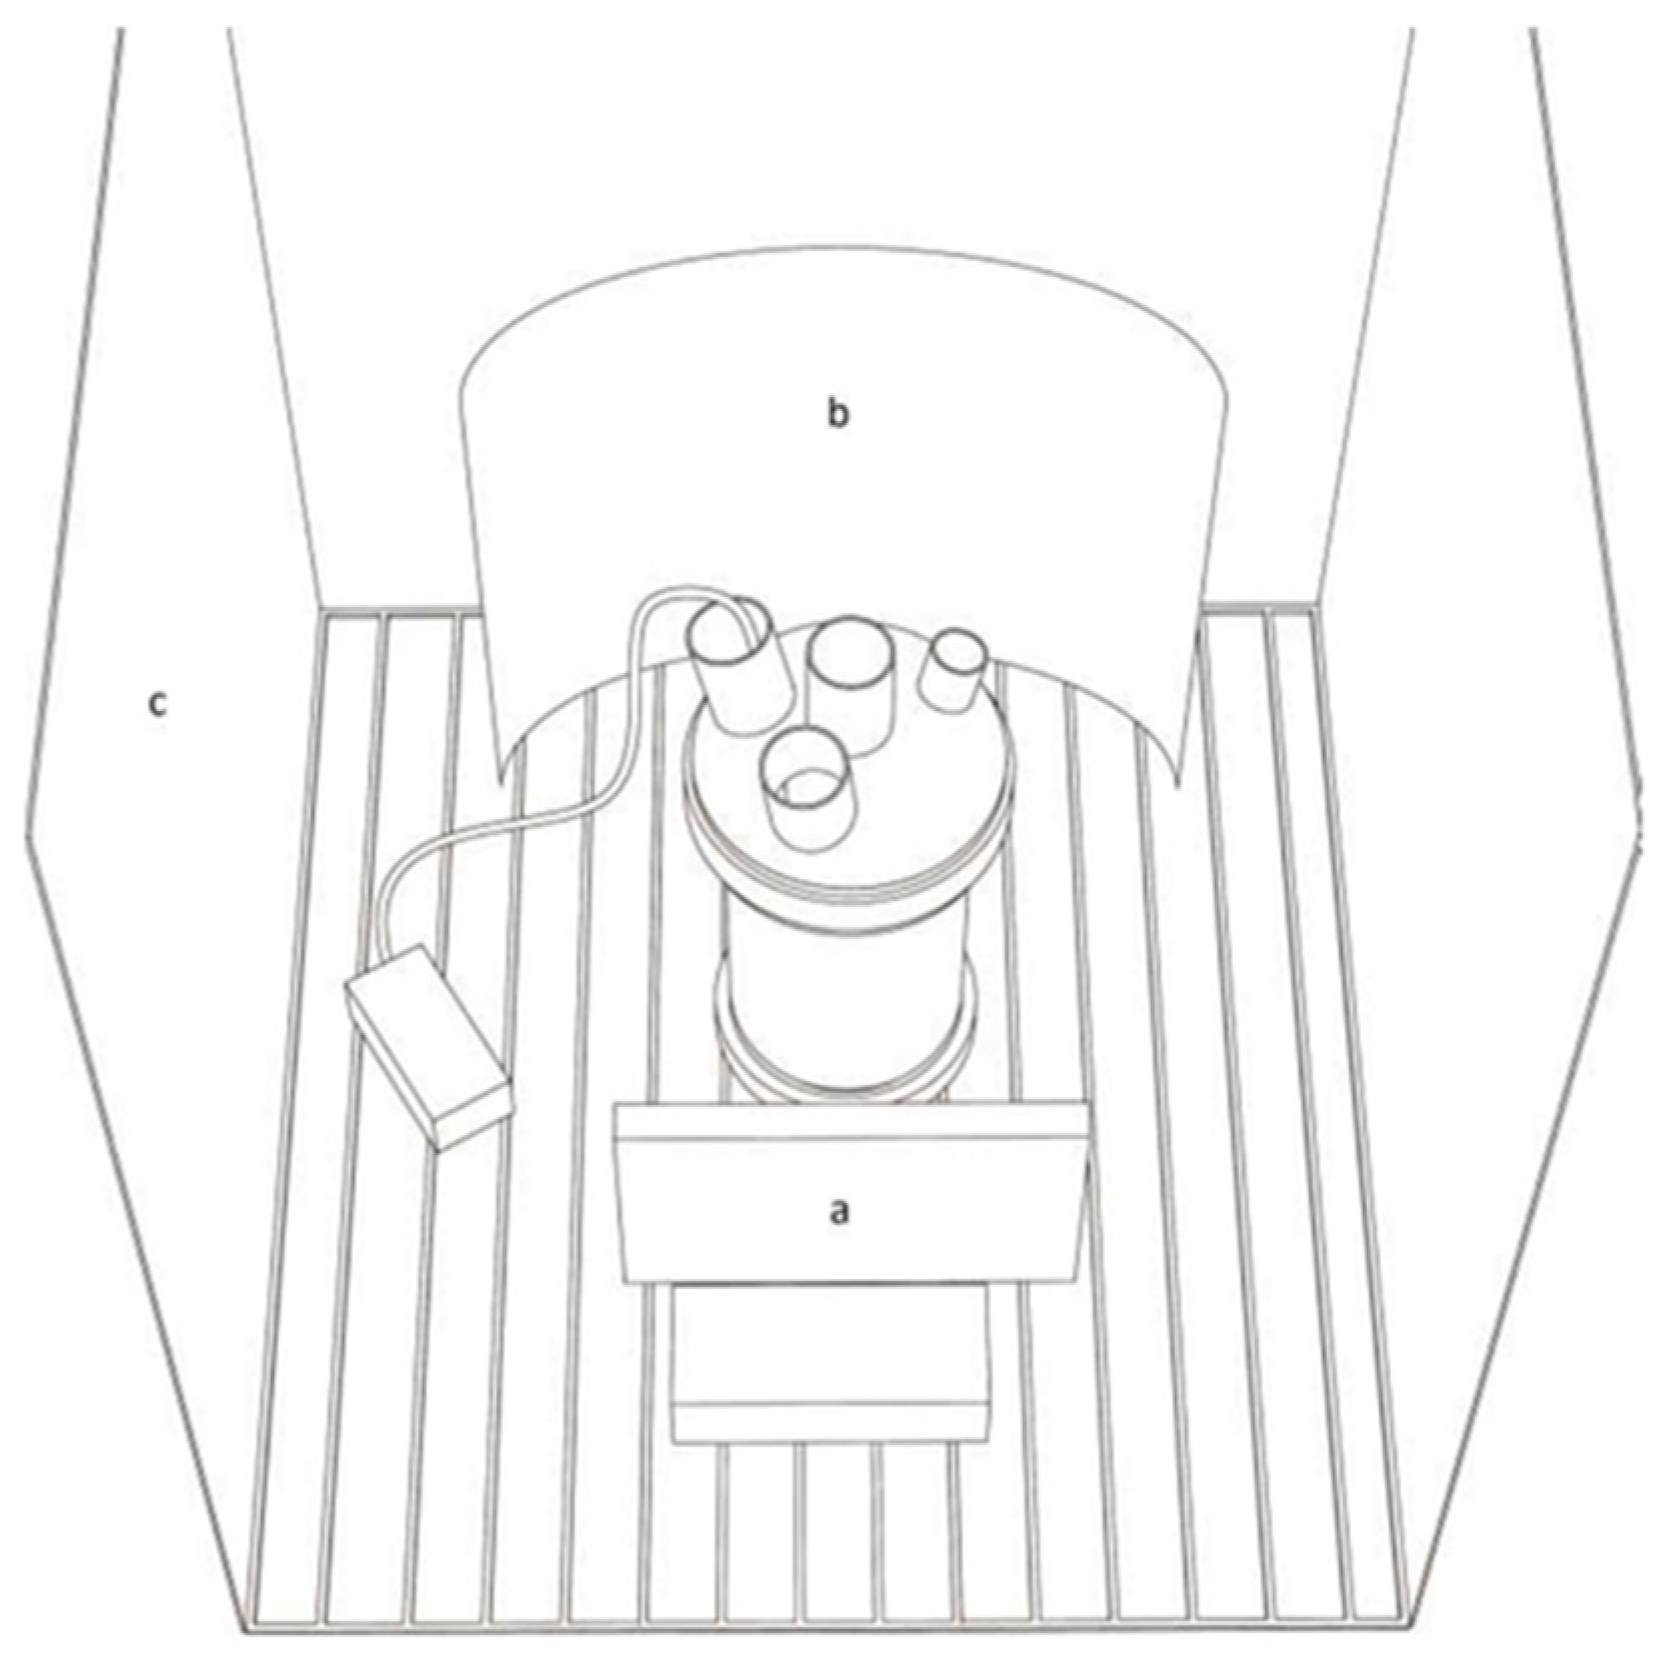
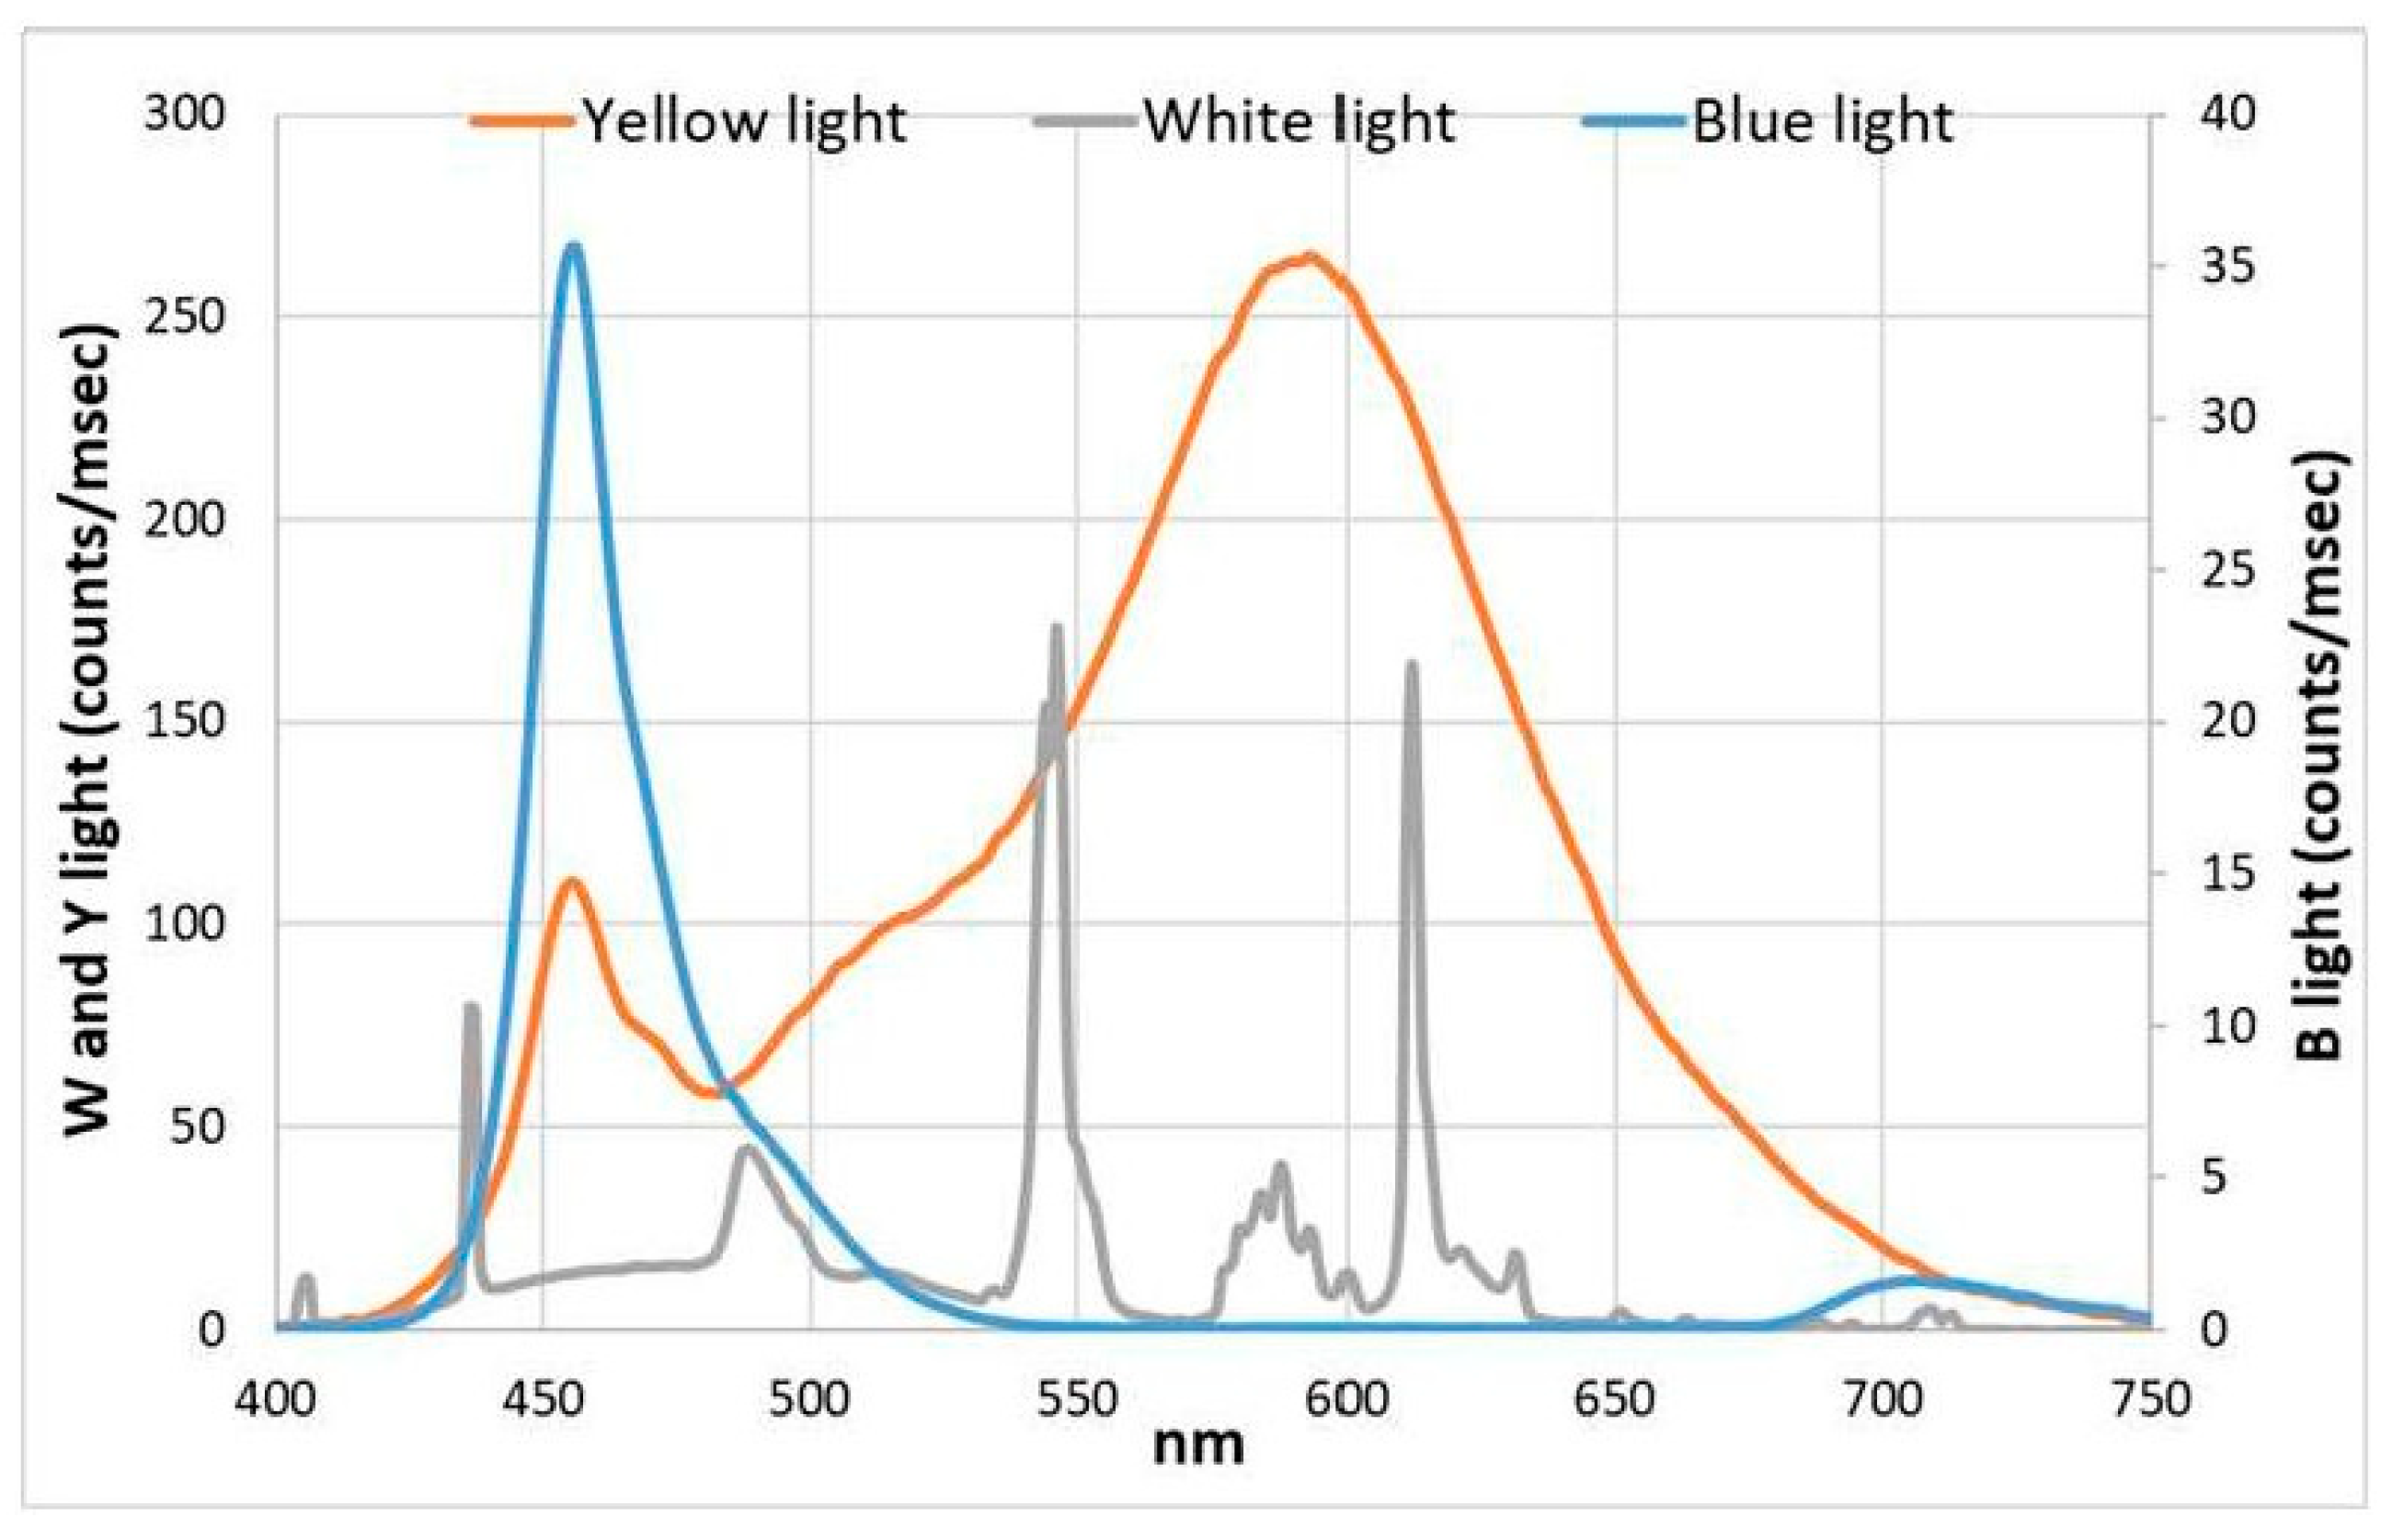
2.1. Limnospira Fusiformis Growth and Experimental Set-Up
2.2. Physical Measurements
2.2.1. In Vivo Absorption and Growth Measurements
- X = the absorption measure of one day;
- X0 = the absorption measure of the previous day.
2.2.2. Chemicophysical Conditions
2.3. Biochemical Analysis
2.3.1. Extraction and Analysis of Liposoluble Pigments
2.3.2. Phycocyanin Extraction and Analysis
2.3.3. Protein Extraction and Analysis
2.3.4. Determination of Suspended Solids and Ashes
2.3.5. Statistical Analysis
2.4. Microscopic Analysis
2.4.1. Microscope Observation and Filaments Count
2.4.2. Fixation and Inclusion by Electron Microscope
3. Results
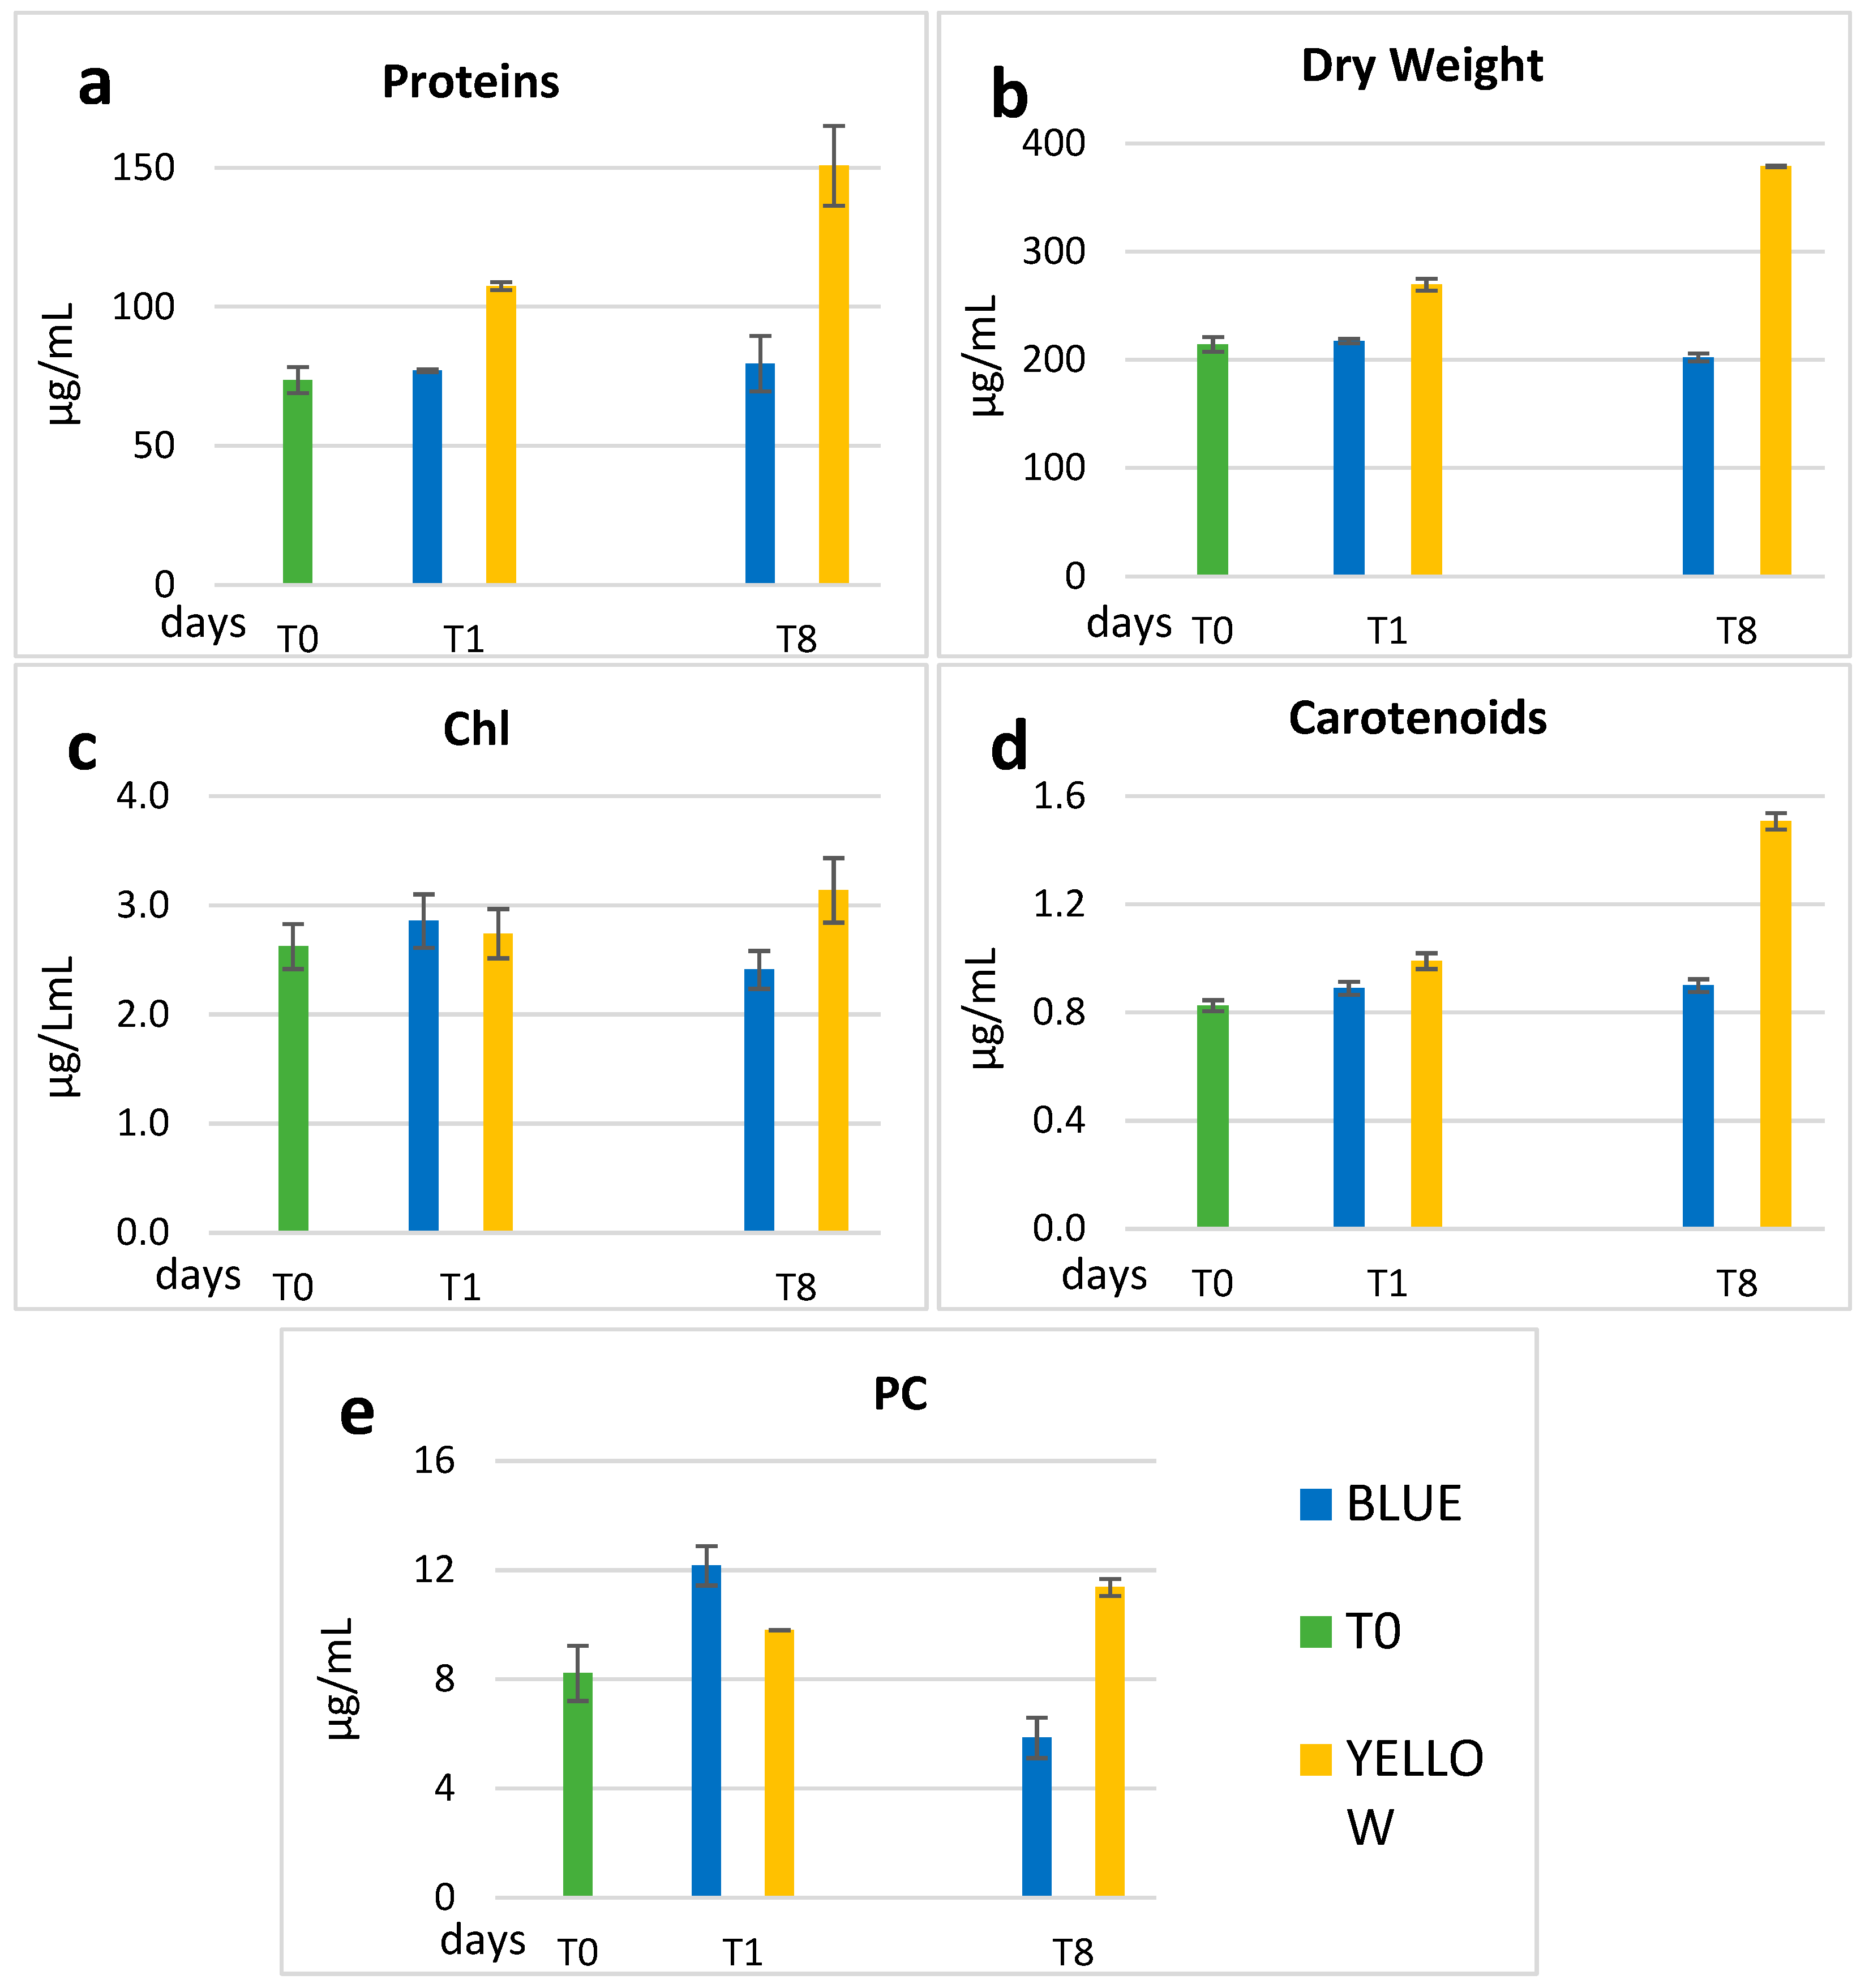
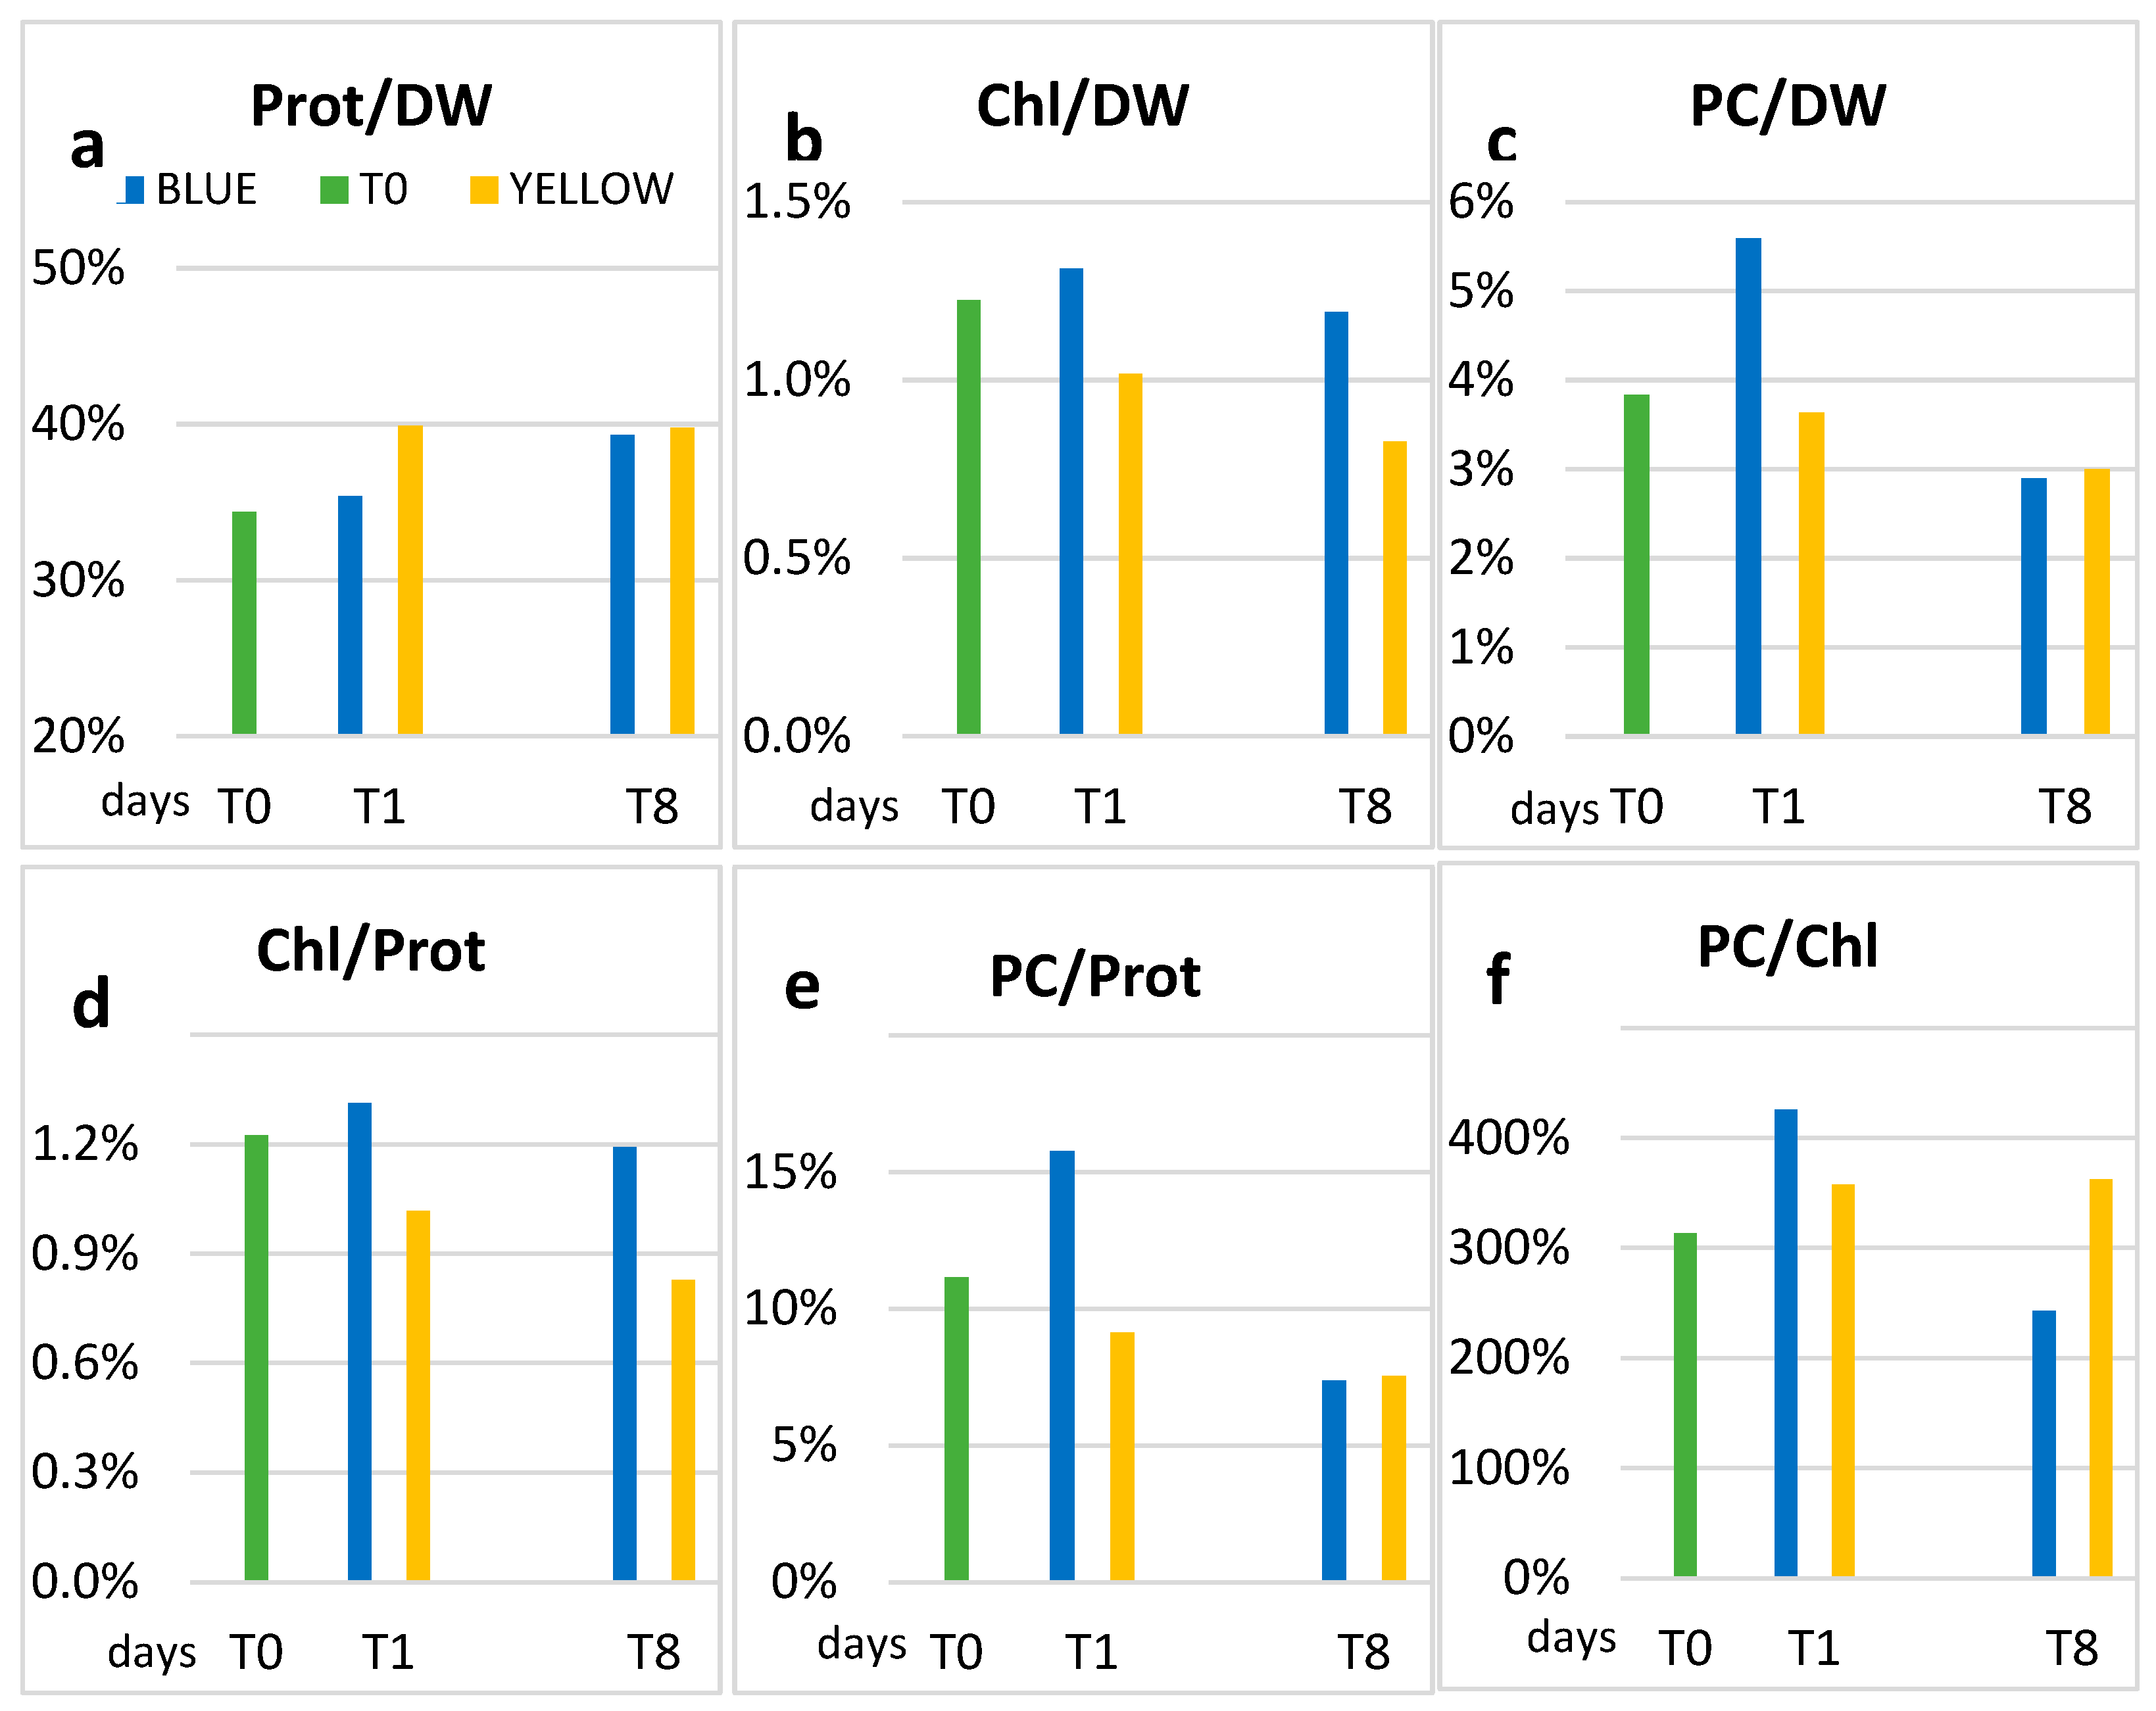
3.1. Biochemical Data
3.2. Filaments Counts
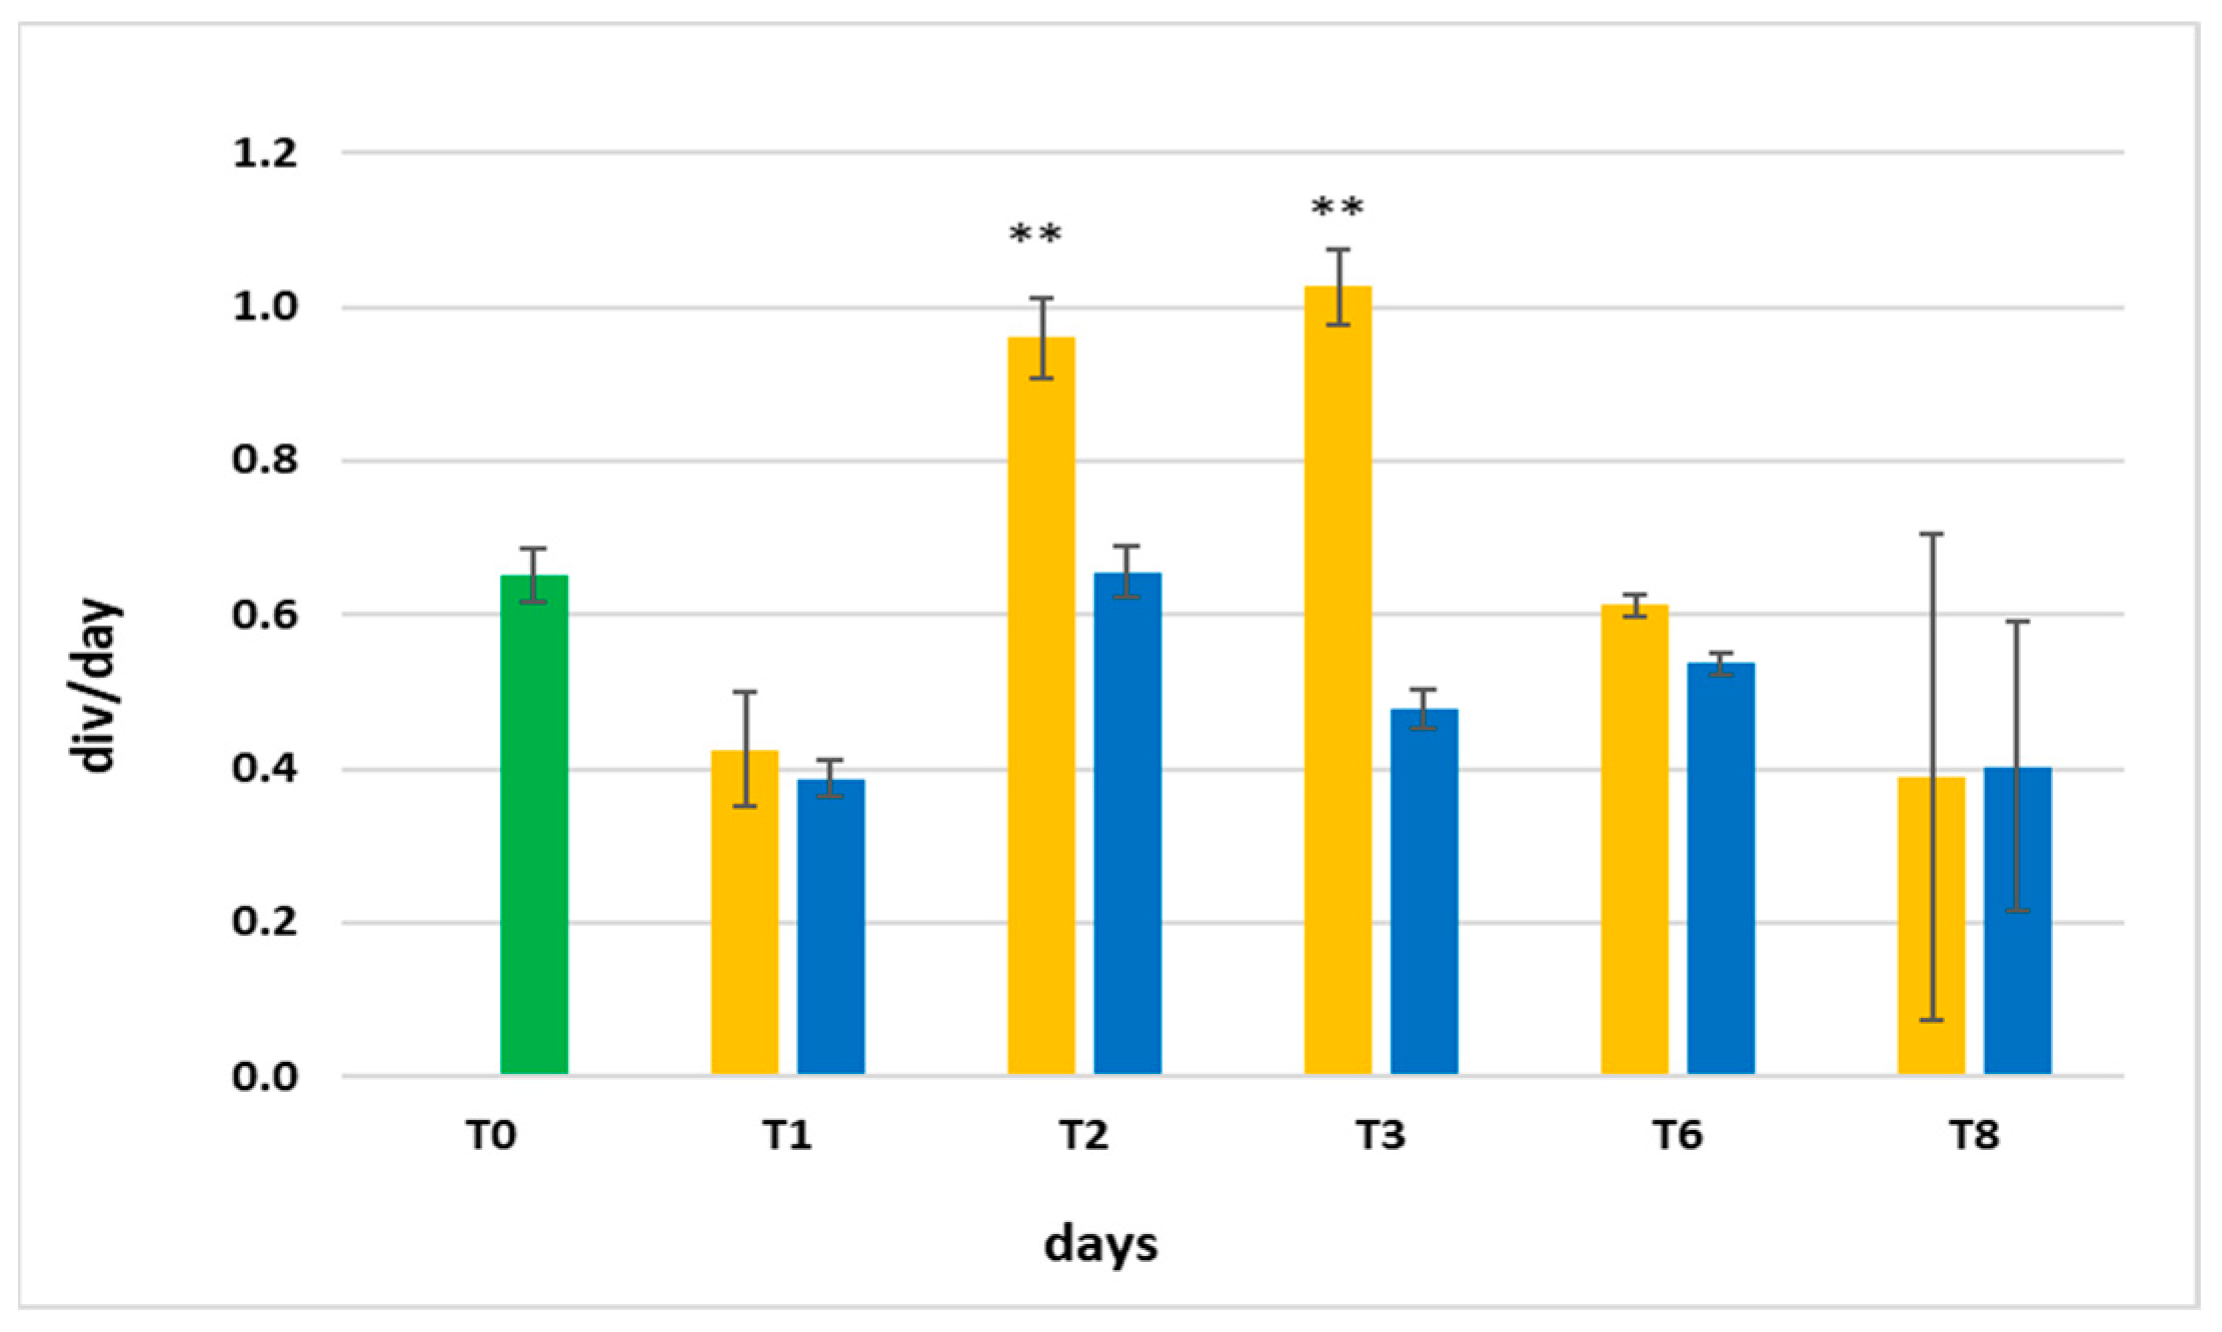
3.3. Growth
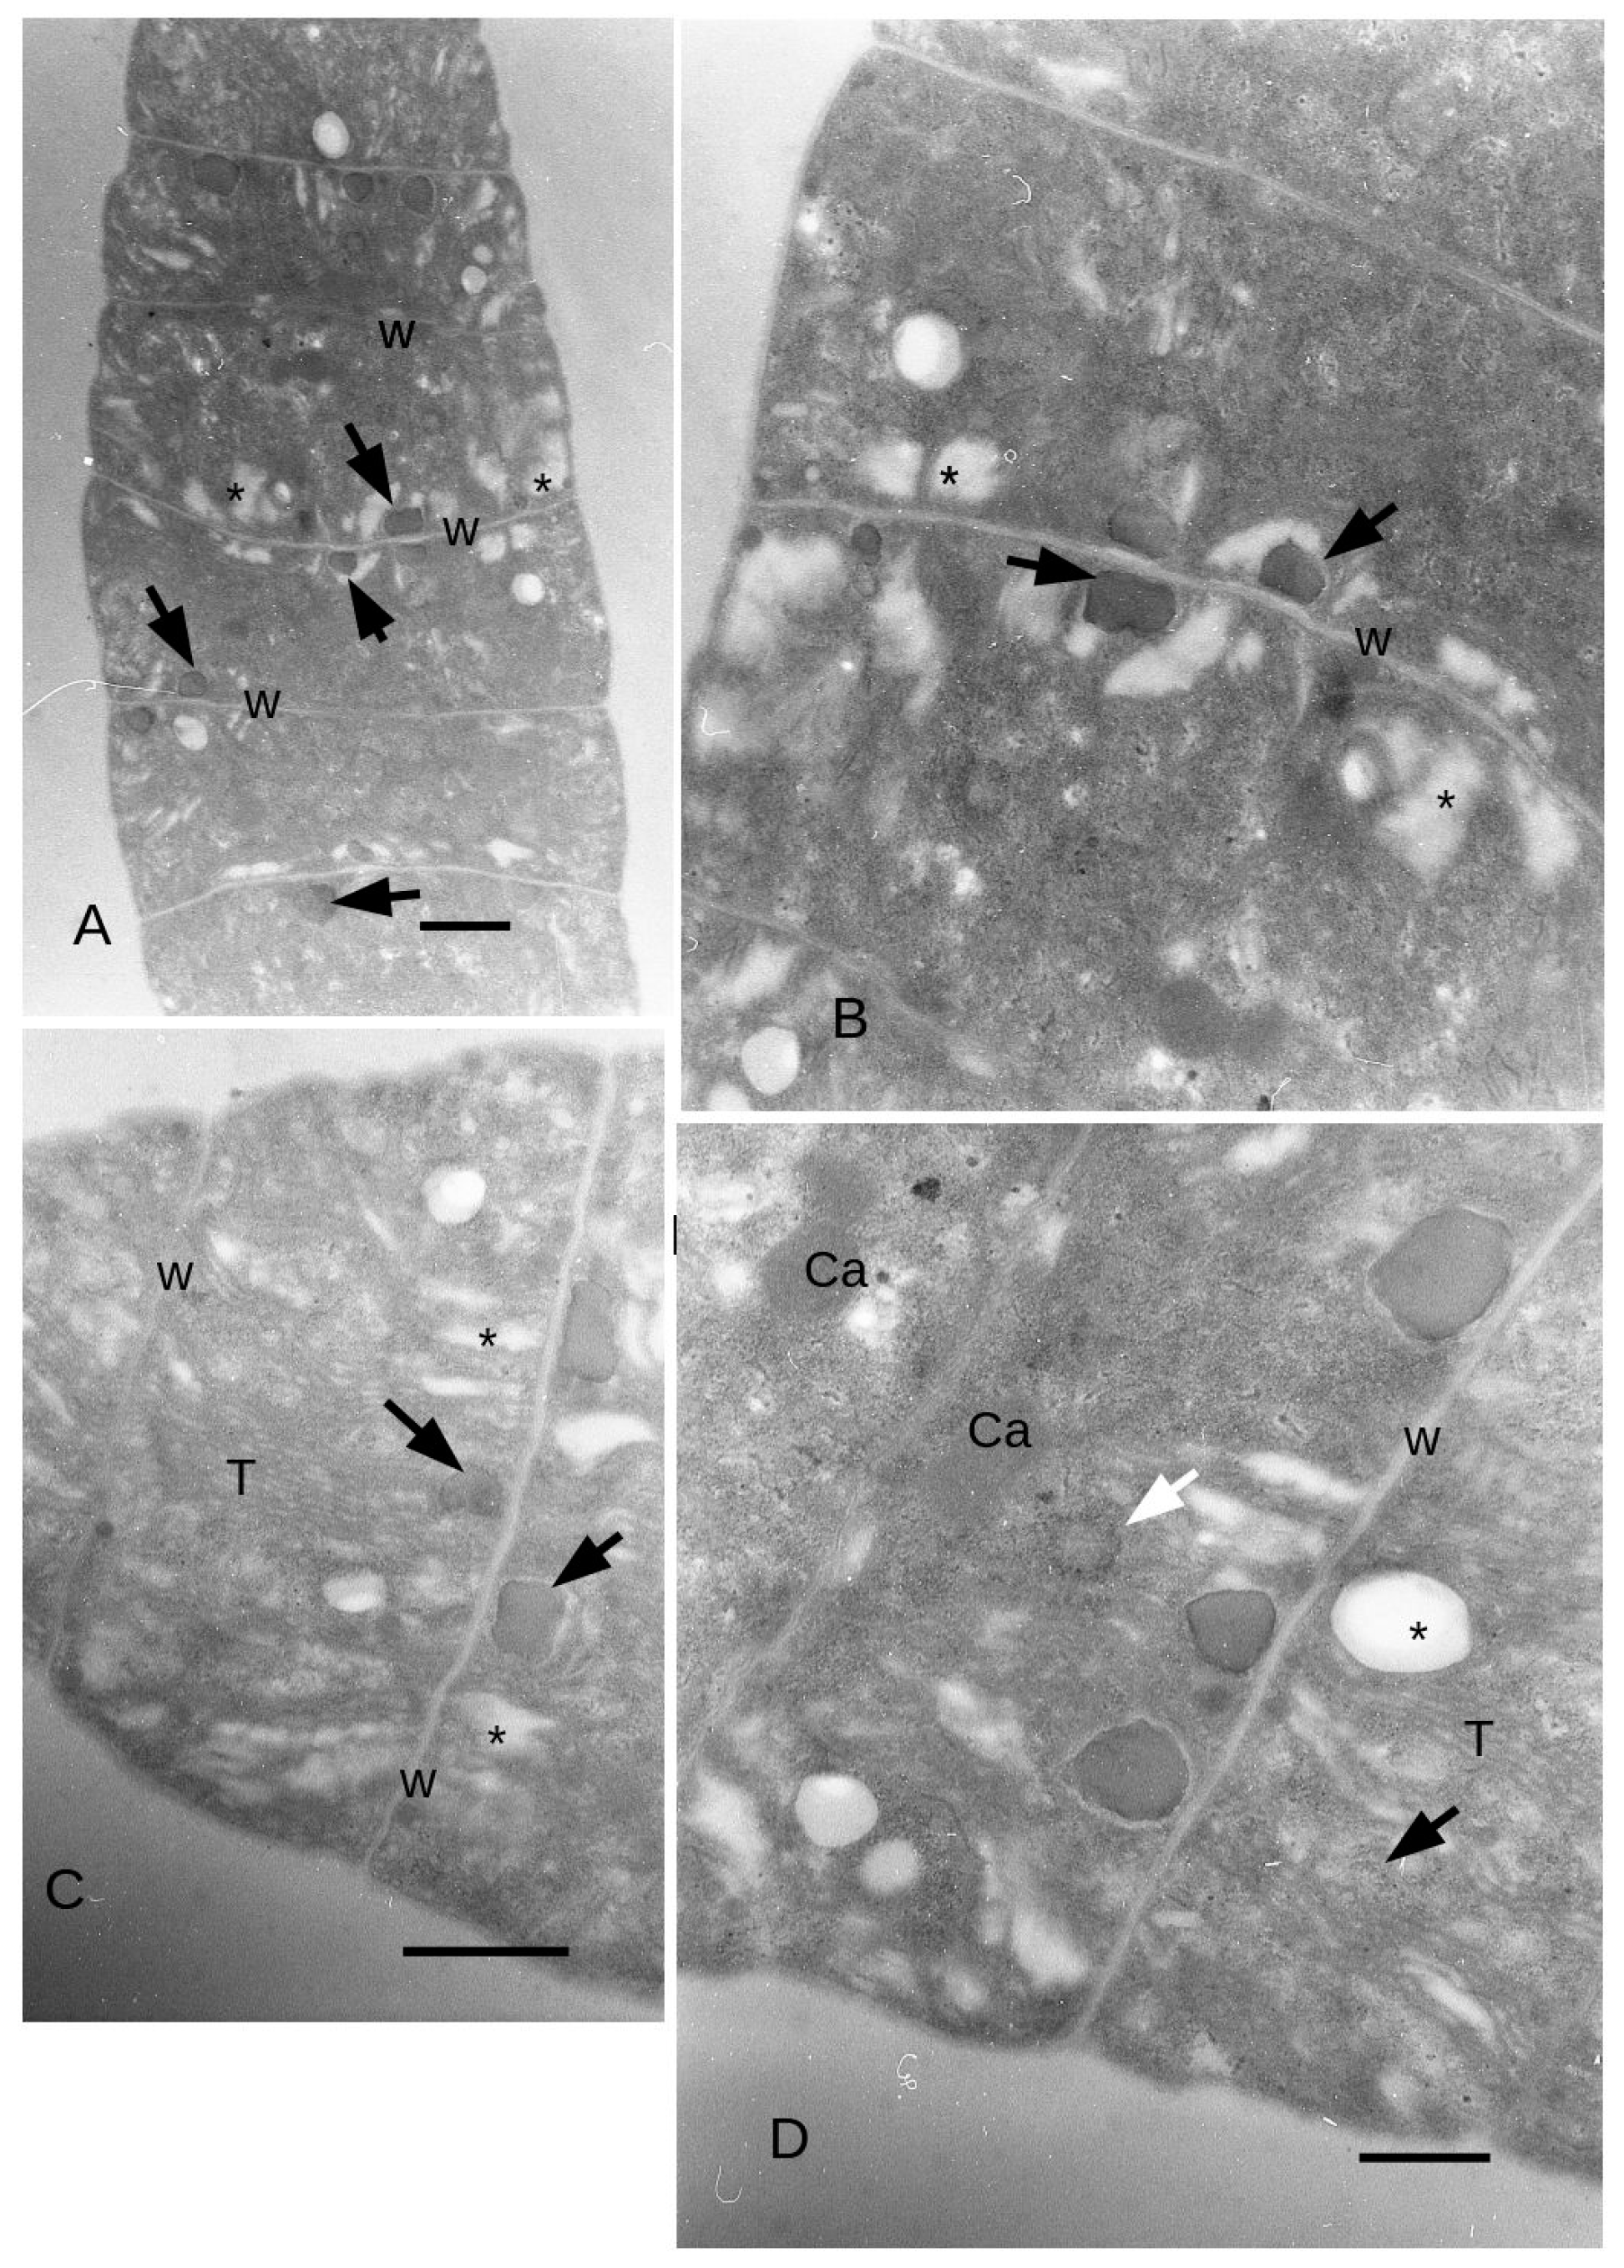
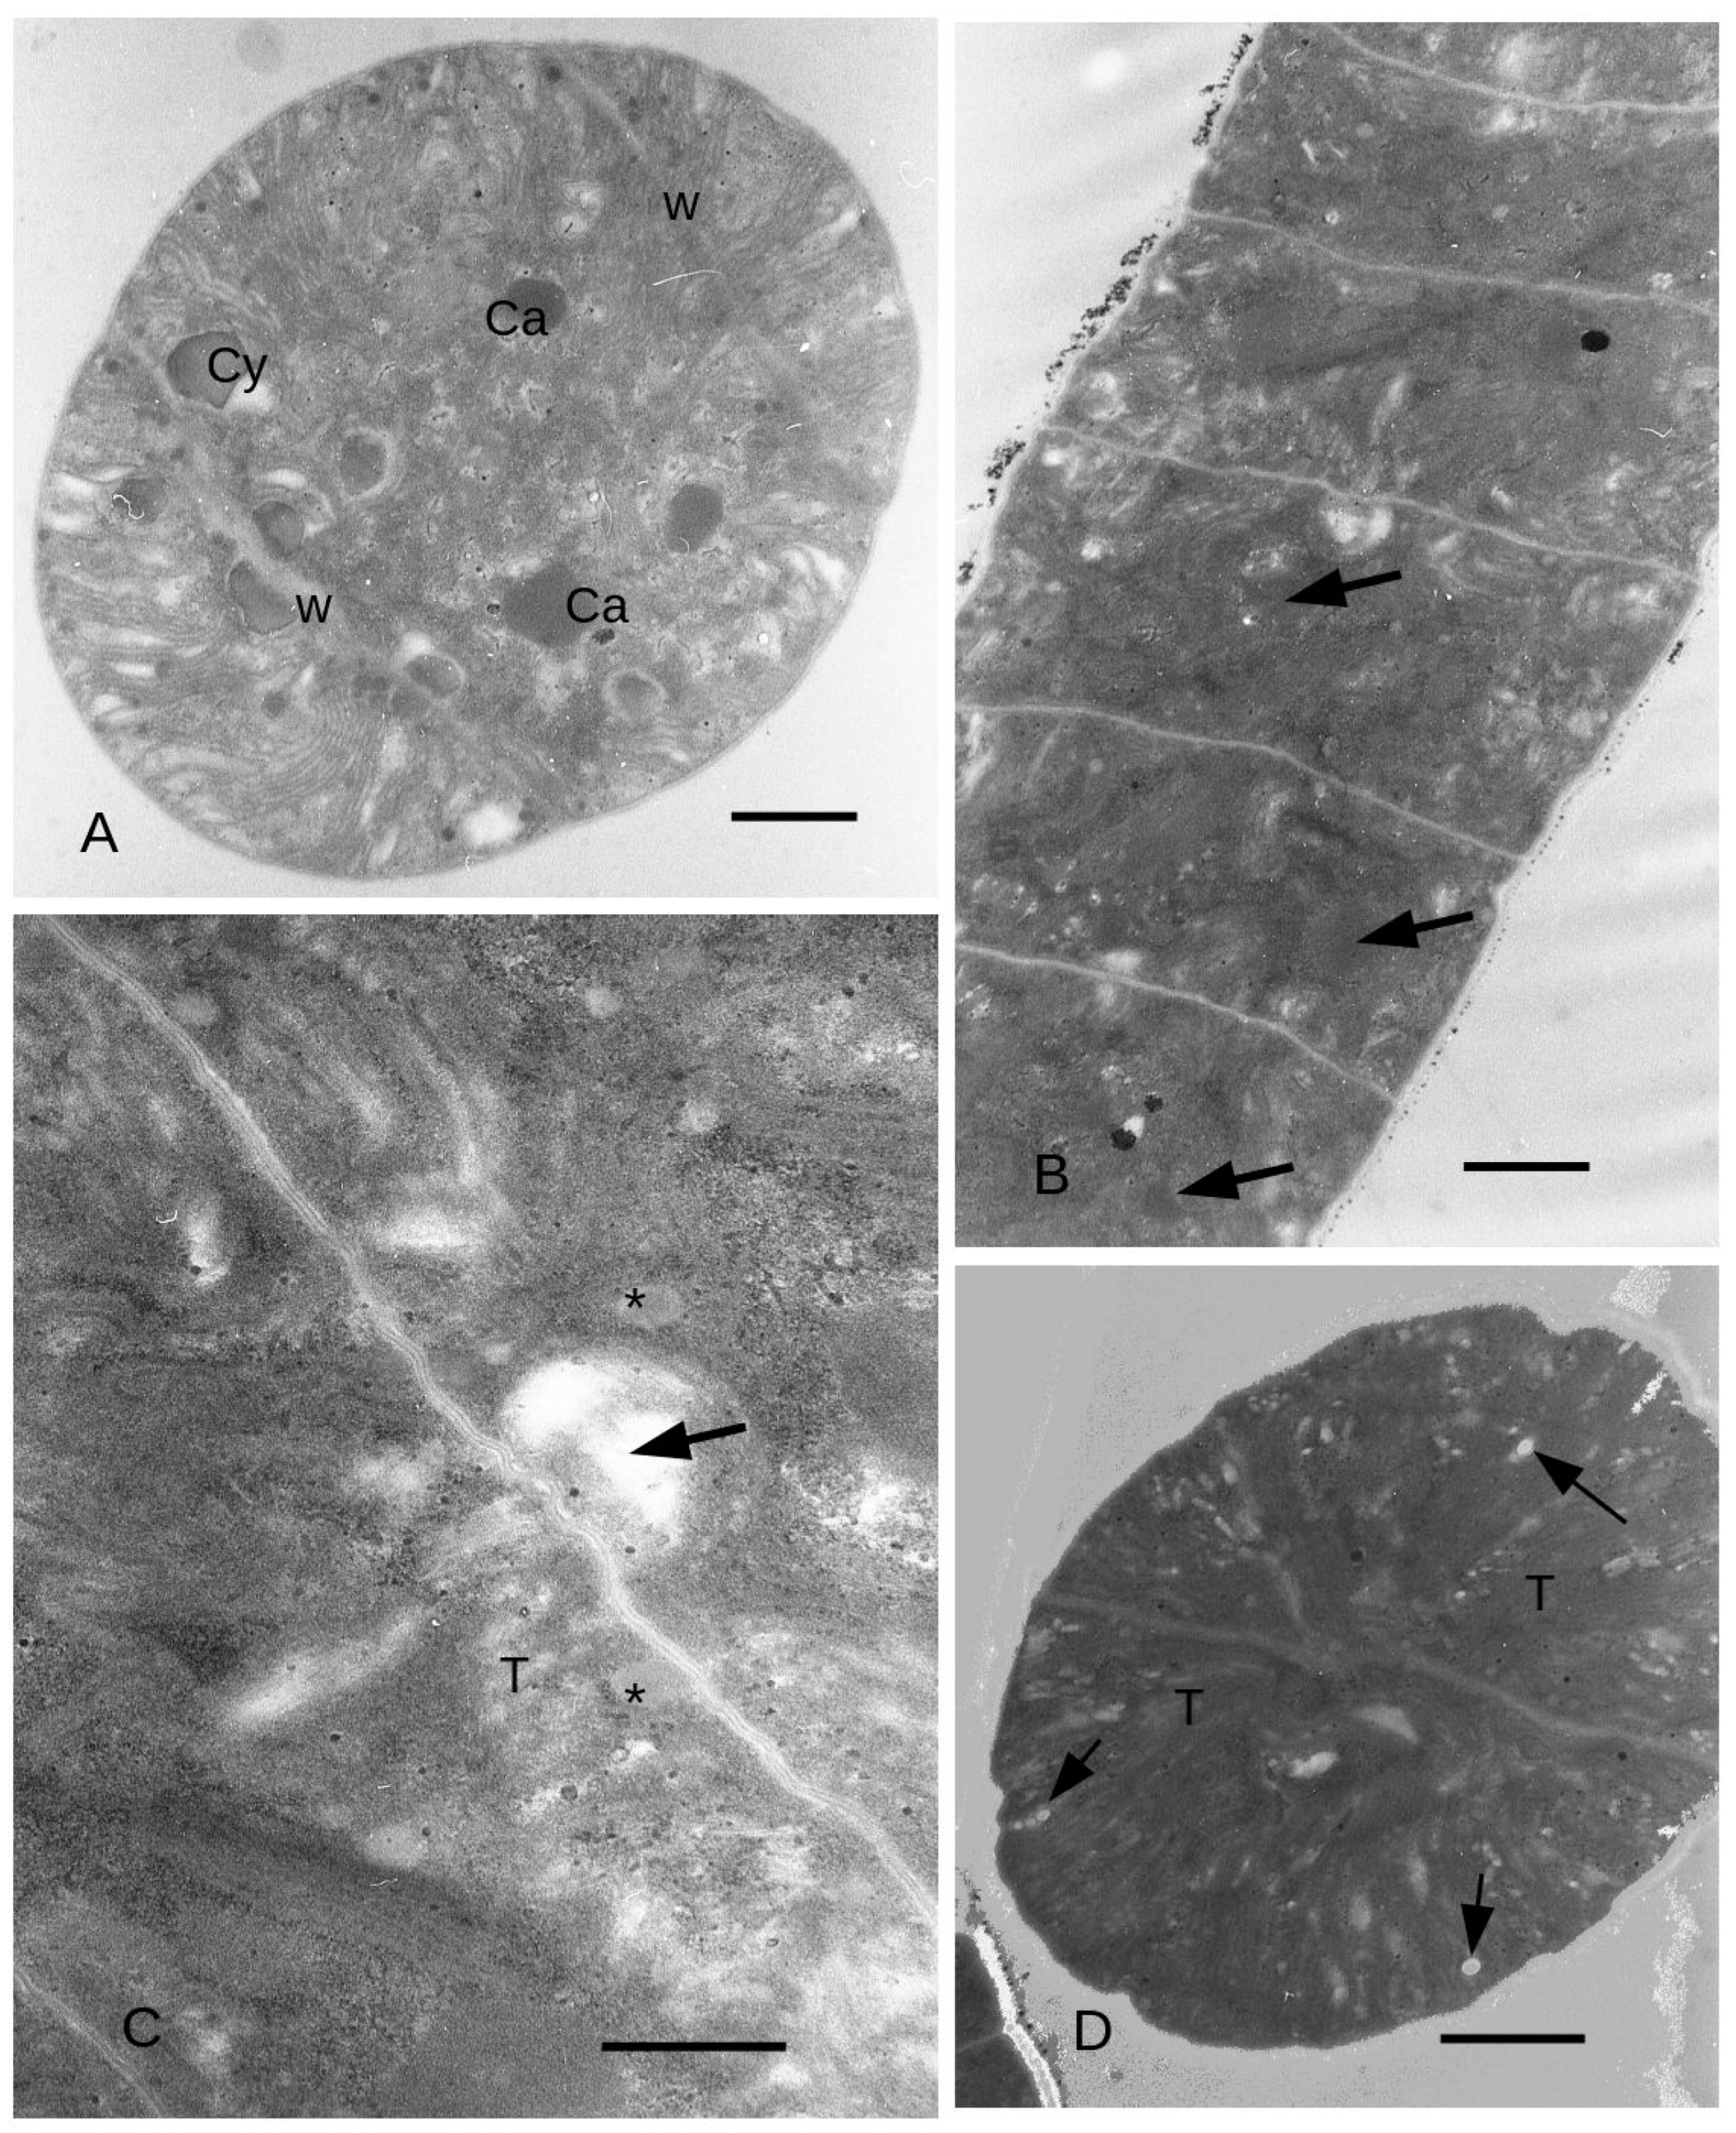
3.4. Ultrastructure
4. Discussion
5. Conclusions
Author Contributions
Funding
Data Availability Statement
Conflicts of Interest
Abbreviations
References
- Karssa, T.H.; Papini, A.; Kasan, N.A. Cultivation of Arthrospira Strains in Tropical Conditions, with Particular Reference to Ethiopia. Int. J. Food Sci. Nutr. Eng. 2018, 8, 107–118. [Google Scholar]
- Nowicka-Krawczyk, P.; Mühlsteinova, R.; Hauer, R. Detailed characterization of the Arthrospira type species separating commercially grown taxa into the new genus Limnospira (Cyanobacteria). Sci. Rep. 2019, 9, 694. [Google Scholar] [CrossRef] [PubMed]
- Ciferri, O. Spirulina, the Edible Microorganism. Microbiol. Rev. 1983, 47, 551–578. [Google Scholar] [CrossRef] [PubMed]
- Fujimori, E.; Pecci, J. Dissociation and association of phycocyanin. Biochemistry 1966, 5, 3500–3508. [Google Scholar] [CrossRef] [PubMed]
- Hsieh-Lo, M.; Castillo, G.; Ochoa-Becerra, M.A.; Mojica, L. Phycocyanin and phycoerythrin: Strategies to improve production yield and chemical stability. Algal Res. 2019, 42, 101600. [Google Scholar] [CrossRef]
- Lazzara, L.; Bricaud, A.; Claustre, H. Spectral absorption and fluorescence excitation properties of phytoplanktonic populations at a mesotrophic and an oligotrophic site in the Tropical North Atlantic (EUMELI program). Deep-Sea Res. Part I 1996, 43, 1215–1240. [Google Scholar] [CrossRef]
- Caroppo, C.; Pagliara, P. Microalgae: A Promising Future. Microorganisms 2022, 10, 1488. [Google Scholar] [CrossRef]
- Gobbetti, M.; Cagno, R.D.; De Angelis, M. Functional microorganisms for functional food quality. Crit. Rev. Food Sci. Nutr. 2010, 50, 716–727. [Google Scholar] [CrossRef]
- Zarrouk, C. Contribution a l’Etude d’Une Cyanobacterie: Influence de Divers Facteurs Physiques et Chimiques sur la Croissance et la Photosynthese de Spirulina maxima (Setchell et Gardner) Geitler. Ph.D. Thesis, University of Paris, Paris, France, 1996. [Google Scholar]
- Silva, M.B.; Azero, E.G.; Teixeira, C.M.; Andrade, C.T. Influence of culture conditions on the production of extracellular polymeric substances (EPS) by Arthrospira platensis. Bioresour. Bioprocess. 2020, 7, 47. [Google Scholar] [CrossRef]
- Sforza, E.; Simionato, D.; Giacometti, G.M.; Bertucco, A.; Morosinotto, T. Adjusted light and dark cycles can optimize photosynthetic efficiency in algae growing in photobioreactors. PLoS ONE 2012, 7, e38975. [Google Scholar] [CrossRef]
- Emerson, R. The quantum yield of photosynthesis. Annu. Rev. Plant Physiol. 1958, 9, 1–24. [Google Scholar] [CrossRef]
- Kirk, J.T.O. Light and Photosynthesis in Aquatic Ecosystems; Cambridge University Press: Cambridge, UK, 1994. [Google Scholar]
- Lazzara, L.; Bianchi, F.; Massi, L.; Ribera D’Alcalà, M. Pigmenti clorofilliani per la stima della biomassa fotototrofa. In Metodologie di Campionamento e di Studio del Plancton Marino; Manuali e Linee guida 56/2010; ISPRA-SIBM: Rome, Italy, 2010; pp. 365–378. [Google Scholar]
- Jeffrey, S.W.; Humphrey, G.F. New spectrophotometric equations for determining chlorophyll a, b, c and c2 in algae, phytoplankton and higher plants. Biochem. Plant Physiol. 1975, 167, 191–194. [Google Scholar] [CrossRef]
- Richards, F.A.; Thompson, T.G. The estimation and characterization of plankton populations by pigment analyses. II. A spectrophotometric method for the estimation of plankton pigments. J. Mar. Res. 1952, 11, 156–172. [Google Scholar]
- Srickland, J.D.H.; Parson, T.R. A Pratical Handbook of Seawater Analysis; Fisheries Research Board of Canada: Ottawa, ON, Canada, 1968; Volume 167. [Google Scholar]
- Kursar, T.A.; Alberte, R.S. PSU organization in a red alga. Relationship between LH pigments and reaction centers. Plant Physiol. 1983, 72, 409–414. [Google Scholar] [CrossRef]
- Bradford, M.M. A rapid and sensitive method for the quantification of microgram quantities of protein utilizing the principle of protein-dye binding. Anal. Biochem. 1976, 72, 248–254. [Google Scholar] [CrossRef] [PubMed]
- Van Der Linde, D.W. Protocol for the Determination of Total Suspended Matter in Oceans and Coastal Zone; Technical Note No. I.98.182; Joint Research Centre: Ispra, Italy, 1998. [Google Scholar]
- Hultberg, M.; Lind, O.; Birgersson, G.; Asp, H. Use of the effluent from biogas production for cultivation of Spirulina. Bioprocess. Biosyst. Eng. 2017, 40, 625–631. [Google Scholar] [CrossRef]
- Spurr, A.R. A low-viscosity epoxy resin embedding medium for electron microscopy. J. Ultrastucture Res. 1969, 26, 31–43. [Google Scholar] [CrossRef]
- Kimura, K.; Tomaru, Y.; Nagasaki, K. Ultrastructural observation of natural field phytoplankton cells by using rapid freezing and freeze substitution. Plankton Benthos Res. 2012, 7, 126–134. [Google Scholar] [CrossRef]
- Yau, S.K.; Yussof, F.M.; Khong, N.M.H.; Foo, S.C.; Lai, J.I. Improved pre-treatment protocol for scanning electron microscopy coupled with energy dispersive x-ray spectroscopy analysis of selected tropical microalgae. Pertanika J. Trop. Agric. Sci. 2016, 39, 321–342. [Google Scholar]
- Capelli, C.; Ballot, A.; Cerasino, L.; Papini, A.; Salmaso, N. Biogeography of bloom-forming microcystin producing and non-toxigenic populations of Dolichospermum lemmermannii (Cyanobacteria). Harm. Algae 2017, 67, 1–12. [Google Scholar] [CrossRef]
- Papini, A.; Fani, F.; Belli, M.; Niccolai, C.; Tani, C.; Di Falco, P.; Nuccio, C.; Lazzara, L. Structural and ultrastructure changes show an increase of amoeboid forms in Heterosigma akashiwo (Raphidophyceae) during recovery after nutrient depletion. Plant Biosys. 2017, 151, 965–973. [Google Scholar] [CrossRef]
- Papini, A.; Gonnelli, C.; Tani, C.; Di Falco, P.; Wolswijk, G.; Santosuosso, U.; Nuccio, C.; Schiff, S.; Lazzara, L.; Menicucci, F.; et al. Autophagy induced by heavy metal and starvation stress in microalgae. Phytomorphology 2018, 68, 7–12. [Google Scholar]
- Tomaselli, L. Morphology, ultrastructure and taxonomy of Arthrospira (Spirulina) maxima and Arthrospira (Spirulina) platensis. In Spirulina platensis (Arthrospira): Physiology, Cell-Biology and Biotechnology; Vonshak, A., Ed.; Taylor and Francis: Abingdon, UK, 1997; pp. 1–16. [Google Scholar]
- Van Eykelenburg, C. The ultrastructure of Spirulina platensis in relation to temperature and light intensity. Antonie Van Leeuwenhoek 1979, 45, 369–390. [Google Scholar] [CrossRef] [PubMed]
- Jeeji Bai, N.; Seshadri, C.V. On coiling and uncoiling of thricomes in the genus Spirulina. Arch. Hydrobiol. Suppl. Vol. 1980, 26, 32–47. [Google Scholar]
- Jeeji Bai, N. Competitive exclusion or morphological trans-formation? A case study with Spirulina fusiformis. Arch. Hydrobiol. Suppl. Vol. 1985, 38–39, 191–199. [Google Scholar]
- Vonshak, A. Strain selection of Spirulina suitable for mass production. Hydrobiologia 1987, 151–152, 75–77. [Google Scholar] [CrossRef]
- Wang, H.P.; Zhao, Y. Morphological reversion of Spirulina (Arthrospira) platensis (Cyanophyta): From linear to helical. Phycol. Soc. Am. 2005, 41, 622–628. [Google Scholar] [CrossRef]
- Markou, G. Effect of Various Colors of Light-Emitting Diodes (LEDs) on the Biomass Composition of Arthrospira platensis Cultivated in Semi-continuous Mode. Appl. Biochem. Biotechnol. 2014, 172, 2758–2768. [Google Scholar] [CrossRef]
- Walter, A. Study of Phycocyanin Production from Spirulina platensis Under Different Light Spectra. Braz. Arch. Biol. Technol. 2011, 54, 675–682. [Google Scholar] [CrossRef]
- Kumar, S.; Cheng, J.; Kubar, A.A.; Guo, W.; Song, Y.; Liu, S.; Chen, S.; Tian, J. Orange light spectra filtered through transparent colored polyvinyl chloride sheet enhanced pigment content and growth of Arthrospira cells. Bioresour. Technol. 2021, 319, 124179. [Google Scholar] [CrossRef]
- Oliveira, M.A.C.L.; De Monteiro, M.P.C.; Robbs, P.G.; Leite, S.G.F. Growth and chemical composition of Spirulina maxima and Spirulina platensis biomass at different temperatures. Aquac. Int. 1999, 7, 261–275. [Google Scholar] [CrossRef]
- Soni, S.K.; Agrawal, K.; Srivastava, S.K.; Gupta, S.; Pankaj, C.K. Growth performance and biochemical analysis of Spirulina platensis under different culture conditions. J. Algal Biomass Util. 2012, 3, 55–58. [Google Scholar]
- Madkour, F.F.; Kamil, A.E.W.; Nasr, H.S. Production and nutritive value of Spirulina platensis in reduced cost media. Egypt. J. Aquat. Res. 2012, 38, 51–57. [Google Scholar] [CrossRef]
- Danesi, E.D.G.; Rangel-Yagui, C.O.; Sato, S.; Monteiro de Carvalho, J.C. Growth and content of Spirulina platensis biomass chlorophyll cultivated at different values of light intensity and temperature using different nitrogen sources. Braz. J. Microbiol. 2011, 42, 362–373. [Google Scholar] [CrossRef]
- Ajayan, K.V.; Selvaraju, M.; Thirugnanamoorthy, K. Enrichment of chlorophyll and phycobiliproteins in Spirulina platensis by the use of reflector light and nitrogen sources: An in vitro study. Biomass Bioenergy 2012, 47, 436–461. [Google Scholar] [CrossRef]
- Shams, M.; Haji Aghababa, A.; Kardani-Esfahani, S.M.; Amini, N.G. Industrial Production of Microalgae Arthrospira (Spirulina) platensis in the Central Iran. Int. J. Pure Appl. Biosci. 2017, 5, 31–36. [Google Scholar] [CrossRef]
- Olaizola, M. Effects of light intensity and quality on the growth rate and photosynthetic pigment content of Spirulina platensis. J. Appl. Phycol. 1990, 2, 97–104. [Google Scholar] [CrossRef]
- Chen, H.B.; Wu, J.Y.; Wang, C.F.; Fu, C.C.; Shieh, C.J.; Chen, C.I.; Wang, C.-Y.; Liu, Y.C. Modeling on chlorophyll a and phycocyanin production by Spirulina platensis under various light-emitting diodes. Biochem. Eng. J. 2010, 53, 52–56. [Google Scholar] [CrossRef]
- Akimoto, S.; Yokono, M.; Hamada, F.; Teshigahara, A.; Aikawa, S.; Kondo, A. Adaptation of light-harvesting systems of Arthrospira platensis to light conditions, probed by time-resolved fluorescence spectrosco-py. Biochim. Biophys. Acta Bioenerg. 2012, 1817, 1483–1489. [Google Scholar] [CrossRef]
- Kehoe, D.M.; Grossman, A.R. Complementary chromatic adaptation: Photoperception to gene regulation. Semin. Cell Biol. 1994, 5, 303–313. [Google Scholar] [CrossRef]
- Lazzara, L. Phytoplankton pigments: Photoadaptation, in vivo optical properties and primary production estimates. G. Bot. Ital. 1995, 129, 1244–1255. [Google Scholar]
- Tandeau de Marsac, N. Occurrence and nature of chromatic adaptation in cyanobacteria. J. Bacteriol. 1977, 130, 82–91. [Google Scholar] [CrossRef] [PubMed]
- Ley, A.C.; Butler, W.L. Effects of chromatic adaptation on the photochemical apparatus of photosynthesis in Porphyridium cruentum. Plant Physiol. 1980, 65, 714–722. [Google Scholar] [CrossRef]
- Lawrenz, E.; Richardson, T.L. Differential effects of changes in spectral irradiance on photoacclimation, primary productivity and growth in Rhodomonas salina (Cryptophyceae) and Skeletonema costatum (Bacillariophyceae) in simulated blackwater environments. J. Phycol. 2017, 53, 1241–1254. [Google Scholar] [CrossRef]
- Aouir, A.; Amiali, M.; Bitam, A.; Benchabane, A.; Raghavan, V.G. Comparison of the biochemical composition of different Arthrospira platensis strains from Algeria, Chad and the USA. Food Meas. 2017, 11, 913–923. [Google Scholar] [CrossRef]
- Simon, R.D. The effect of chloramphenicol on the production of cyanophycin granule polypeptide in the blue-green alga Anabaena cylindrica. Arch. Mikrobiol. 1973, 92, 115–122. [Google Scholar] [CrossRef] [PubMed]
- Flores, E.; Arévalo, S.; Burnat, M. Cyanophycin and arginine metabolism in cyanobacteria. Algal Res. 2019, 42, 101577. [Google Scholar] [CrossRef]
- Boussiba, S.; Richmond, A.E. C-phycocyanin as a storage protein in the blue-green alga Spirulina platensis. Arch. Microbiol. 1980, 125, 143–147. [Google Scholar] [CrossRef]
- Rangsayatorn, N.; Upatham, E.S.; Kruatrachue, M.; Pokethitiyook, P.; Lanza, G.R. Phytoremediation potential of Spirulina (Arthrospira) platensis: Biosorption and toxicity studies of cadmium. Environ. Pollut. 2002, 119, 45–53. [Google Scholar] [CrossRef]
- Porta, D.; Rippka, R.; Hernández-Mariné, M. Unusual ultrastructural features in three strains of Cyanothece (cyanobacteria). Arch. Microbiol. 2000, 173, 154–163. [Google Scholar] [CrossRef]
- Kerfeld, C.A.; Melnicki, M.R. Assembly, function and evolution of cyanobacterial carboxysomes. Curr. Opin. Plant Biol. 2016, 31, 66–75. [Google Scholar] [CrossRef] [PubMed]
- Yeates, T.O.; Kerfeld, C.A.; Heinhorst, S.; Cannon, G.C.; Shively, J.M. Protein-based organelles in bacteria: Carboxysomes and related microcompartments. Nat. Rev. Microbiol. 2008, 6, 681–691. [Google Scholar] [CrossRef] [PubMed]
- Orùs, M.I.; Rodríguez, M.L.; Martinez, F.; Marco, E. Biogenesis and ultrastructure of carboxysomes from wild type and mutants of Synechococcus sp. strain PCC 7942. Plant Physiol. 1995, 107, 1159–1166. [Google Scholar] [CrossRef] [PubMed]


| Chl | CAR | PC | SD | Proteins | SD | DW | SD | ||
|---|---|---|---|---|---|---|---|---|---|
| µg/mL | µg/mL | µg/mL | µg/mL | µg/mL | |||||
| T0 | 2.62 | 0.83 | 8.22 | 1.01 | 73.69 | 4.31 | 214.42 | 6.68 | |
| Blue | T1 | 2.86 | 0.89 | 12.16 | 0.72 | 77.06 | 0.50 | 217.60 | 2.07 |
| T8 | 2.41 ** | 0.90 | 5.86 ** | 0.74 | 79.52 ** | 9.30 | 202.3 ** | 3.69 | |
| Yellow | T1 | 2.74 | 0.99 | 9.80 | 0.00 | 107.46 | 1.32 | 269.51 | 5.64 |
| T8 | 3.14 ** | 1.51 | 11.37 ** | 0.31 | 150.7 ** | 13.36 | 378.9 ** | 0.94 |
Disclaimer/Publisher’s Note: The statements, opinions and data contained in all publications are solely those of the individual author(s) and contributor(s) and not of MDPI and/or the editor(s). MDPI and/or the editor(s) disclaim responsibility for any injury to people or property resulting from any ideas, methods, instructions or products referred to in the content. |
© 2023 by the authors. Licensee MDPI, Basel, Switzerland. This article is an open access article distributed under the terms and conditions of the Creative Commons Attribution (CC BY) license (https://creativecommons.org/licenses/by/4.0/).
Share and Cite
Pelagatti, M.; Mori, G.; Falsini, S.; Ballini, R.; Lazzara, L.; Papini, A. Blue and Yellow Light Induce Changes in Biochemical Composition and Ultrastructure of Limnospira fusiformis (Cyanoprokaryota). Microorganisms 2023, 11, 1236. https://doi.org/10.3390/microorganisms11051236
Pelagatti M, Mori G, Falsini S, Ballini R, Lazzara L, Papini A. Blue and Yellow Light Induce Changes in Biochemical Composition and Ultrastructure of Limnospira fusiformis (Cyanoprokaryota). Microorganisms. 2023; 11(5):1236. https://doi.org/10.3390/microorganisms11051236
Chicago/Turabian StylePelagatti, Matilde, Giovanna Mori, Sara Falsini, Raffaello Ballini, Luigi Lazzara, and Alessio Papini. 2023. "Blue and Yellow Light Induce Changes in Biochemical Composition and Ultrastructure of Limnospira fusiformis (Cyanoprokaryota)" Microorganisms 11, no. 5: 1236. https://doi.org/10.3390/microorganisms11051236