Article

Impact of IsaA Gene Disruption: Decreasing Staphylococcal Biofilm and Alteration of Transcriptomic and Proteomic Profiles

1
School of Postgraduate Studies, International Medical University, Kuala Lumpur 57000, Malaysia
2
School of Pharmacy, Monash University Malaysia, Subang Jaya 47500, Malaysia
3
Department of Medical Microbiology, Faculty of Medicine and Health Sciences, University Putra Malaysia, Serdang 43400, Malaysia
4
Department of Medical Microbiology and Immunology, Pusat Perubatan UKM, Kuala Lumpur 56000, Malaysia
5
Department of Life Sciences, School of Pharmacy, International Medical University, Kuala Lumpur 57000, Malaysia
*
Author to whom correspondence should be addressed.
Microorganisms 2022, 10(6), 1119; https://doi.org/10.3390/microorganisms10061119
Submission received: 12 May 2022 / Revised: 26 May 2022 / Accepted: 27 May 2022 / Published: 29 May 2022
(This article belongs to the Section Molecular Microbiology and Immunology)

Abstract

:
Staphylococcus aureus expresses diverse proteins at different stages of growth. The immunodominant staphylococcal antigen A (IsaA) is one of the proteins that is constitutively produced by S. aureus during colonisation and infection. SACOL2584 (or isaA) is the gene that encodes this protein. It has been suggested that IsaA can hydrolyse cell walls, and there is still need to study isaA gene disruption to analyse its impact on staphylococcal phenotypes and on alteration to its transcription and protein profiles. In the present study, the growth curve in RPMI medium (which mimics human plasma), autolytic activity, cell wall morphology, fibronectin and fibrinogen adhesion and biofilm formation of S. aureus SH1000 (wildtype) was compared to that of S. aureus MS001 (isaA mutant). RNA sequencing and liquid chromatography–tandem mass spectrometry were carried out on samples of both S. aureus strains taken during the exponential growth phase, followed by bioinformatics analysis. Disruption of isaA had no obvious effect on the growth curve and autolysis ability or thickness of cell walls, but this study revealed significant strength of fibronectin adherence in S. aureus MS001. In particular, the isaA mutant formed less biofilm than S. aureus SH1000. In addition, proteomics and transcriptomics showed that the adhesin/biofilm-related genes and hemolysin genes, such as sasF, sarX and hlgC, were consistently downregulated with isaA gene disruption. The majority of the upregulated genes or proteins in S. aureus MS001 were pur genes. Taken together, this study provides insight into how isaA disruption changes the expression of other genes and has implications regarding biofilm formation and biological processes.

1. Introduction

Humans serve as a major reservoir for Staphylococcus aureus. This important opportunistic pathogen is a member of normal human flora and is generally found on the skin, mucous membrane and especially in the anterior nares of 20–40% of healthy adults [1,2]. Reports have shown that approximately 20% of humans are persistent S. aureus carriers without knowing it, as asymptomatic colonisation is very common. In addition, strains of S. aureus, some more virulent than others, can be detected from various sources [3,4,5]. During hospitalisation, they can attach to or persist on host tissues or implanted materials. Healthcare workers, immunocompromised patients, intravenous drug users and hospitalised patients (particularly those with long-term indwelling intravascular catheters) tend to have higher rates of S. aureus colonisation, up to 80%, as S. aureus typically spread by direct contact or fomites [6,7,8,9]. This indicates that they are versatile and opportunistic in nature, which often leads them to cause community-acquired and nosocomial infections, from minor skin infections to life-threatening infections [1,6,10,11]. Despite using various effective antibiotics in treatments, instances of isolating antimicrobial-resistant strains are reported periodically [6]. As a result, the treatment and management of S. aureus infections remains challenging as the species has the potential to evolve from single-drug resistant strains to multi-drug resistant strains (e.g., methicillin-resistant S. aureus (MRSA), vancomycin-resistant S. aureus (VRSA)) [12,13]. Moreover, their ability to adopt a diverse range of niches through the expression of protective functional proteins is considered one of the challenges in eliminating them.
Given their advantage of expressing survival proteins, researchers have extensively used ‘omic’ approaches to study several strains of S. aureus. It has been shown that S. aureus expresses a wide variety of proteins, and some of them might have a role in virulence, such as the immunodominant staphylococcal antigen A (IsaA). In early 2000, IsaA was shown to be either displayed on the cell surface or secreted into the host [14]. Ziebandt et al. revealed that most strains of S. aureus could produce IsaA protein. It is expressed only at low staphylococcal cell densities, which indicates that IsaA protein is expressed during the exponential growth phase [15,16]. These surface proteins are able to promote the adherence of S. aureus to damaged host tissue and to help evade antibody-mediated immune responses by binding proteins in the blood [10,17,18]. Further, IsaA protein is also involved in cell wall turnover [19,20]. Additionally, it is believed that the protein is associated with cell growth, separation, and survival due to the highly abundant IsaA found in the septal region of dividing staphylococcal cells [21].
On the other hand, several studies have shown that IsaA protein is against IgGs in human body serum [22,23,24,25]. Hence, IsaA protein is expressed as an antigenic molecule on the surface of staphylococcal cells, and thus it is recognisable by the IgGs of patients [22]. Another study identified that the serum IgG levels against IsaA in healthy S. aureus carriers were significantly higher than in those who are non-carriers [23]. Hence, IsaA is considered an immunogen that is suspected to be responsible for protecting us from opportunistic infection. In a study using an animal model, anti-IsaA monoclonal antibody (IgG1) effectively prevented murine staphylococcal infection, including in a central venous catheter-related infection model, as it can recognise all tested S. aureus strains including MRSA [24,25,26,27,28]. In addition to this finding, Sanne et al. also investigated that human anti-IsaA IgG1 monoclonal antibodies (mAb) can improve the survival of mice with S. aureus bacteraemia [29].
All these studies provide pieces of evidence pointing to the high immunogenicity of IsaA, its invariantly on the S. aureus cell surface and its involvement in virulence. Therefore, the present study aims to further investigate IsaA by focusing on its mutant and its impact on the growth, adhesion to human fibrinogen and fibronectin, biofilm formation, autolysis and cell morphology. The isaA mutant and its parent were also processed by RNA-seq and tandem mass spectrometry to investigate differential protein and gene expression.

2. Materials and Methods

2.1. Bacterial Strain and Culture Conditions

S. aureus wildtype (SH1000) and ΔisaA mutant (MS001) were obtained from Prof. Foster (The Krebs Institute, Department of Molecular Biology and Biotechnology, University of Sheffield). SH1000 was inoculated in tryptic soy broth (TSB), while MS001 was grown in TSB supplemented with 5 µg/mL tetracycline at 37 °C overnight [19]. The bacteria culture solution was supplemented with 10% glycerol and stored at −80 °C as stock.

2.2. Growth Curves

Overnight cultures of both strains in TSB were centrifuged, and the pellet was suspended with Dulbecco’s-phosphate-buffered saline (D-PBS) and standardised by adjusting optical density at 600 nm (OD600) to 1 with RPMI-1640. The suspension was serially diluted to 1:1000 with RPMI-1640 and then incubated at 37 °C with shaking in an incubator shaker at 200 rpm. Bacterial growth was measured every 0.5 h for a total of 24 h using a microplate reader. Absorbance versus time of each strain was plotted. Data analysis was performed from three independent experiments, and Baranyi modelling was used to determine the maximum bacteria density and maximum specific growth rate [30]. Statistical significance of MS001 versus parent strain (SH1000) growth at all time points was analysed by a Student’s t-test.

2.3. Autolysis Assay

Both strains were cultured in TSB overnight and were centrifuged. The pellet was resuspended in 1 M NaCl TSB and adjusted to an OD600 of 0.08. The cells were harvested in an incubator shaker (200 rpm) at 37 °C to OD600 of 0.8~1.0 and were centrifuged at 6500× g for 10 min. The pellet was resuspended in sterile-ice-cold milli-Q water and adjusted with 50 mM Tris–HCl buffer (pH 7.2, containing 0.05% Triton X-100) to an OD600 of 1. The cell suspension was incubated at 37 °C with shaking at 125 rpm. At 30 min intervals, the progression of lysis was measured by using a spectrophotometer at OD600, and data were reported as percentage of initial OD600 for each sample. Statistical significance was analysed using IBM SPSS v.28.0.0 (USA) via Student’s t-test at all time points for the autolytic activity.

2.4. Biofilm Formation

Overnight cultures grown in TSB were centrifuged, and the pellet was washed with PBS. The cells were adjusted to OD600 in TSB supplemented with 0.2% glucose and diluted to 1:50. A total of 200 µL of the diluted culture was loaded into each well of a 96-well flat-bottomed tissue culture plate and incubated at 37 °C for 24 h. The wells were gently rinsed three times with D-PBS, incubated at 60 °C for 15 min and stained with 0.1% crystal violet for 10 min at room temperature. The plate was rinsed three times under running tap water and air-dried. Crystal violet was solubilised with 40 mM HCl in ethanol and incubated at room temperature for 5 min. The content in the wells was mixed by pipetting, and absorbance was measured at OD595 with a microplate spectrophotometer. An independent triplicate experiment was performed, each being repeated at least three times, and Student’s t-test was done to show the differences between wildtype and mutant strains, with a p-value ≤ 0.05 considered significant.

2.5. Adhesion Assay

Human fibrinogen (10 mg/mL) and fibronectin (1 mg/mL) in D-PBS was diluted to 2.5 µg/mL. The 96-well flat-bottom enzyme-linked immunosorbent assay (ELISA) plates coated with fibrinogen and fibronectin were incubated at 4 °C overnight. The coated wells were washed with PBS-0.05% Tween 20 (PBS-T) and were blocked with PBS-T supplemented with 1% bovine serum albumin at room temperature for one hour. The wells were rewashed with PBS-T. Bacterial cultures in TSB were grown until an OD600 of 1, centrifuged, and washed with PBS-T. The pellet was resuspended to an OD600 of 0.45 in TSB-0.4% glucose. Adjusted cultures were pipetted into the coated plate and incubated at 37 °C for one hour. Wells were washed aggressively with PBS-T and BacTiter-GloTM Reagent, which generated a glow-type luminescent signal from the BacTiter Glo kit added to each well. The content was mixed with an orbital shaker and incubated for 5 min. A luminescence microplate reader was used to measure the amount of bacterial ATP according to the manufacturer’s guidelines in order to quantify the number of bacteria adhered to the plate-bound fibrinogen or fibronectin. This experiment was carried out at least in triplicate. The Student’s t-test was used to compare means of bacterial ATP.

2.6. Transmission Electron Microscopy (TEM) Analysis

Bacteria cultures in TSB were grown to the log phase at 37 °C and centrifuged at 3900× g for 5 min. The pellet was resuspended in 1 mL of 3% (v/v) glutaraldehyde in 0.1 M sodium cacodylate. Glutaraldehyde-fixed samples were stored at 4 °C for 4 days before being washed twice with 0.1 M sodium cacodylate. After washing, the samples were postfixed with 1.0% osmium tetroxide containing 1.5% potassium-ferrocyanide in 0.1 M cacodylate buffer for 2 h at 4 °C. Samples were rinsed in distilled water, treated with 1% aqueous uranyl acetate (w/v) in 50% ethanol for one hour at 4 °C and dehydrated in ascending series of graded ethanol dilutions to 100%. Then, dehydrated samples were embedded into Spurr resin and left to polymerise in an oven at 60 °C for 24 h. Resins were sectioned by cutting 30 nm films at 25 °C using an ultramicrotome. Subsequently, the ultrathin sections were mounted on carbon-coated copper grids and observed with a JEOL JEM-2100F transmission electron microscope. Cell wall thickness was measured from photographic images at a final magnification of at least ×20,000.

2.7. RNA Preparation and DEG Analysis

2.7.1. Total RNA Extraction

Bacteria was grown in TSB at 37 °C and harvested during the exponential growth phase, then centrifuged at 3900× g for 10 min at 4 °C. The pellet was resuspended with Tris–EDTA (TE) buffer containing 2 mg/mL Lysostaphin and 50 mg/mL lysozyme and incubated at 37 °C for one hour. An equal volume of RNA lysis buffer was added to the incubated mixture and briefly vortexed. The mixture was centrifuged at 16,000× g for 2 min, and proceeded to the RNA binding and elution step as instructed in the Monarch Total RNA Miniprep Kit. The amount of total RNA was determined by NanoVue Plus (GE Healthcare), followed by checking the quality of the extracted RNA using the Bioanalyzer Nano RNA chip with an RNA integrity number (RIN) > 8.0 for cDNA library preparation prior to RNA-sequencing (RNA-seq).

2.7.2. Differentially Expressed Gene (DEG) Analysis

The quality of sequencing raw data were inspected using FastQC (version 0.11.8, Cambridge, UK). Low-quality reads (with Phred score less than Q20) and adapter and poly G sequences were removed using Fastp [31]. The clean reads were aligned against a S. aureus reference genome from the NCBI database using HISAT2 [32]. The reference genome index was built using the accessory script of the HISAT2 package. The aligned RNA-seq reads in BAM format were quantified using featureCounts [33]. DESeq2 was adopted to perform differentially expressed gene (DEG) analysis. To compare expression levels between samples, raw read normalisation was performed. DESeq2 [34] performed an internal normalisation where the geometric mean was calculated for each gene across all samples. Before running DEG analysis, sample-level and gene-level QC were performed on the count data. At sample-level QC, principal component analysis (PCA) was constructed to identify any potential outliers. At gene-level QC, genes with read counts of zero or with a mean less than ten were omitted from downstream analysis. DESeq2 fits negative binomial generalised linear models for each gene and uses the Wald test for significance testing. DEGs with p-adjusted value ≤ 0.05 and log2 fold change ≥1 and ≤−1 were categorised as significant. The significant DEGs were selected to perform Gene Ontology and Pathway Analysis using EnrichR or clusterProfiler [35]. The hierarchical heatmap was plotted to represent the expression of the significant DEGs in all the samples.

2.8. Quantitative Proteomic Analysis

Protein Preparation, Digesting and LC–MS/MS Analysis

Bacteria grown in TSB at 37 °C was harvested at the log-growth phase and centrifuged at 3900× g for 15 min. The pellet was washed with detergent extraction buffer containing 25 mM Tris-HCl (pH7.2), 10 mM CHAPS, 0.5 M NaCl, 5% glycerol and 1 mM phenylmethylsulfonyl fluoride (PMSF) and lysed with homogeniser through 0.1 mm glass beads. Cell debris was removed by centrifuging the mixture in the tubes at 15,000× g for 15 min at 4 °C. The supernatant was transferred and mixed well with six volumes of ice-cold acetone with trichloroacetic acid. The pellet was dried. Protein quantitation of each sample was performed using a BCA assay.
Sample digestion followed the S-Trap Mini Spin digestion protocol outlined by the manufacturer (ProtiFi, New York, NY, USA). The obtained peptides were dried by vacuum centrifugation and then reconstituted in 200 mM HEPES pH 8.8. Peptide concentration was determined using the Pierce quantitative colourimetric peptide assay (Thermo Scientific, Waltham, MA, USA). Tandem mass tag (TMT) reagent labelling of the samples was performed as per the manufacturer’s (Thermo Scientific, Waltham, MA, USA) instructions. Samples were reconstituted in 2% ACN 0.1% formic acid and analysed by LC–MS/MS (Q-Exactive HFX, Thermo Fisher, Waltham, MA, USA). A normalisation factor was obtained from the label check experiment, and the original TMT-labelled peptide samples were then pooled at a 1:1 ratio across all individual samples.
The combined sample mixture was vacuum dried and resuspended in 0.1% trifluoroacetic acid then fractionated by Pierce High pH Reversed-Phase Peptide Fractionation Kit (Thermo Scientific, Waltham, MA, USA) according to the manufacturer’s instructions. Each fraction was vacuum centrifuged to complete dryness and then reconstituted in 0.1% formic acid for LC–MS/MS.
LC–MS/MS was performed by Q-Exactive HFX, Thermo Fisher, Waltham, MA, USA. The peptide mixture in each fraction was injected onto the peptide trap and washed with loading buffer for 10 min. The peptide trap was then switched in line with the analytical nano-LC column. Peptides were eluted from the trap onto the nano-LC column, and peptides were separated with a linear gradient of 5% mobile phase B to 30% mobile over 110 min at a flow rate of 600 nL/min, followed by 85% B for 8 min. The column was re-equilibrated using 5% mobile phase B.
The column eluent was directed into the ionisation source of the mass spectrometer operating in positive ion mode. Peptide precursors from 350 to 1850 m/z were scanned at 60 k resolution. The 10 most intense ions in the survey scan were fragmented by higher energy collisional dissociation (HCD) using a normalised collision energy of 33 with a precursor isolation width of 0.8 m/z. Only precursors with charge states +2 to +5 were subjected to MS/MS analysis. MS/MS scan resolution was set at 45 k and dynamic exclusion was set to 30 s.
The MS/MS data files were processed using Proteome Discoverer (Version 2.1.0.81, Thermo Scientific, Waltham, MA, USA). The data were searched using search engine SequestHT against S. aureus (bacteria) proteins from the Uniprot database. All data used for protein identification were evaluated by the peptide-to-spectrum match false discovery rate (PSM FDR) ≤ 1% analysis. A pairwise-relative abundance comparison was performed. Statistical significance of protein was measured using the Student’s t-test, and differences were considered significant at p-value ≤ 0.05 and fold change greater than ±1.2, at which point they were recognised as differentially expressed proteins.

3. Results

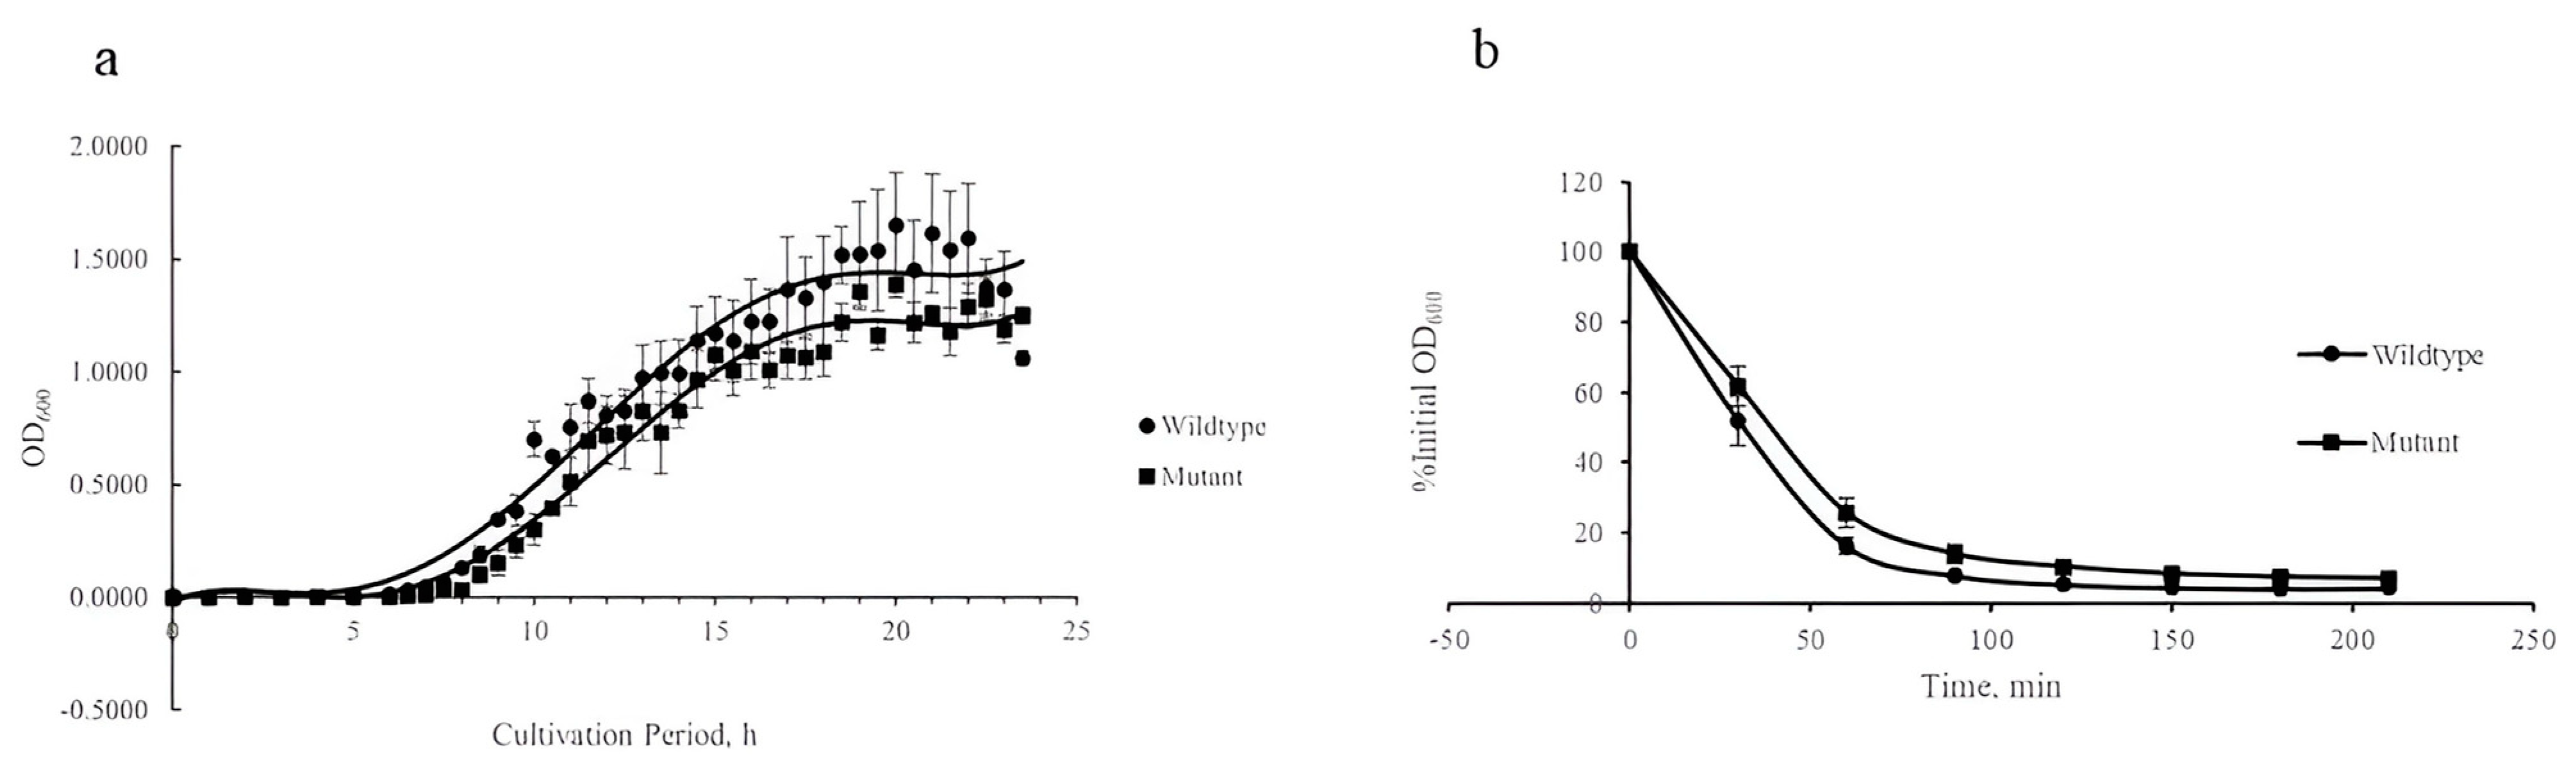
3.1. Growth Pattern and Autolysis of S. aureus isaA Mutant

There were no significant changes in the growth and autolysis curves upon isaA gene disruption (Figure 1). However, the ΔisaA mutant showed a slight reduction in maximum bacterial density as determined by Baranyi modelling, such as OD600 values of 1.24 and 1.46 for mutant and wildtype, respectively. The maximum specific growth rate of both S. aureus strains was the same (≈0.5 h−1), but the isaA mutant had a slightly prolonged lag phase, as illustrated in Figure 1a. Similarly, isaA gene disruption only reduced the autolysis rate to a certain extent for S. aureus relative to the wildtype (Figure 1b). For example, the ΔisaA mutant exhibited 75% autolytic activity, while its parental strain showed about 84% autolysis in 60 min of Triton X-100-induced lysis at 37 °C, but the results were not significance (p = 0.096). However, the phenotype with reduced autolysis (ΔisaA mutant) had slight growth retardation with a more prolonged lag phase and lower final optical density.

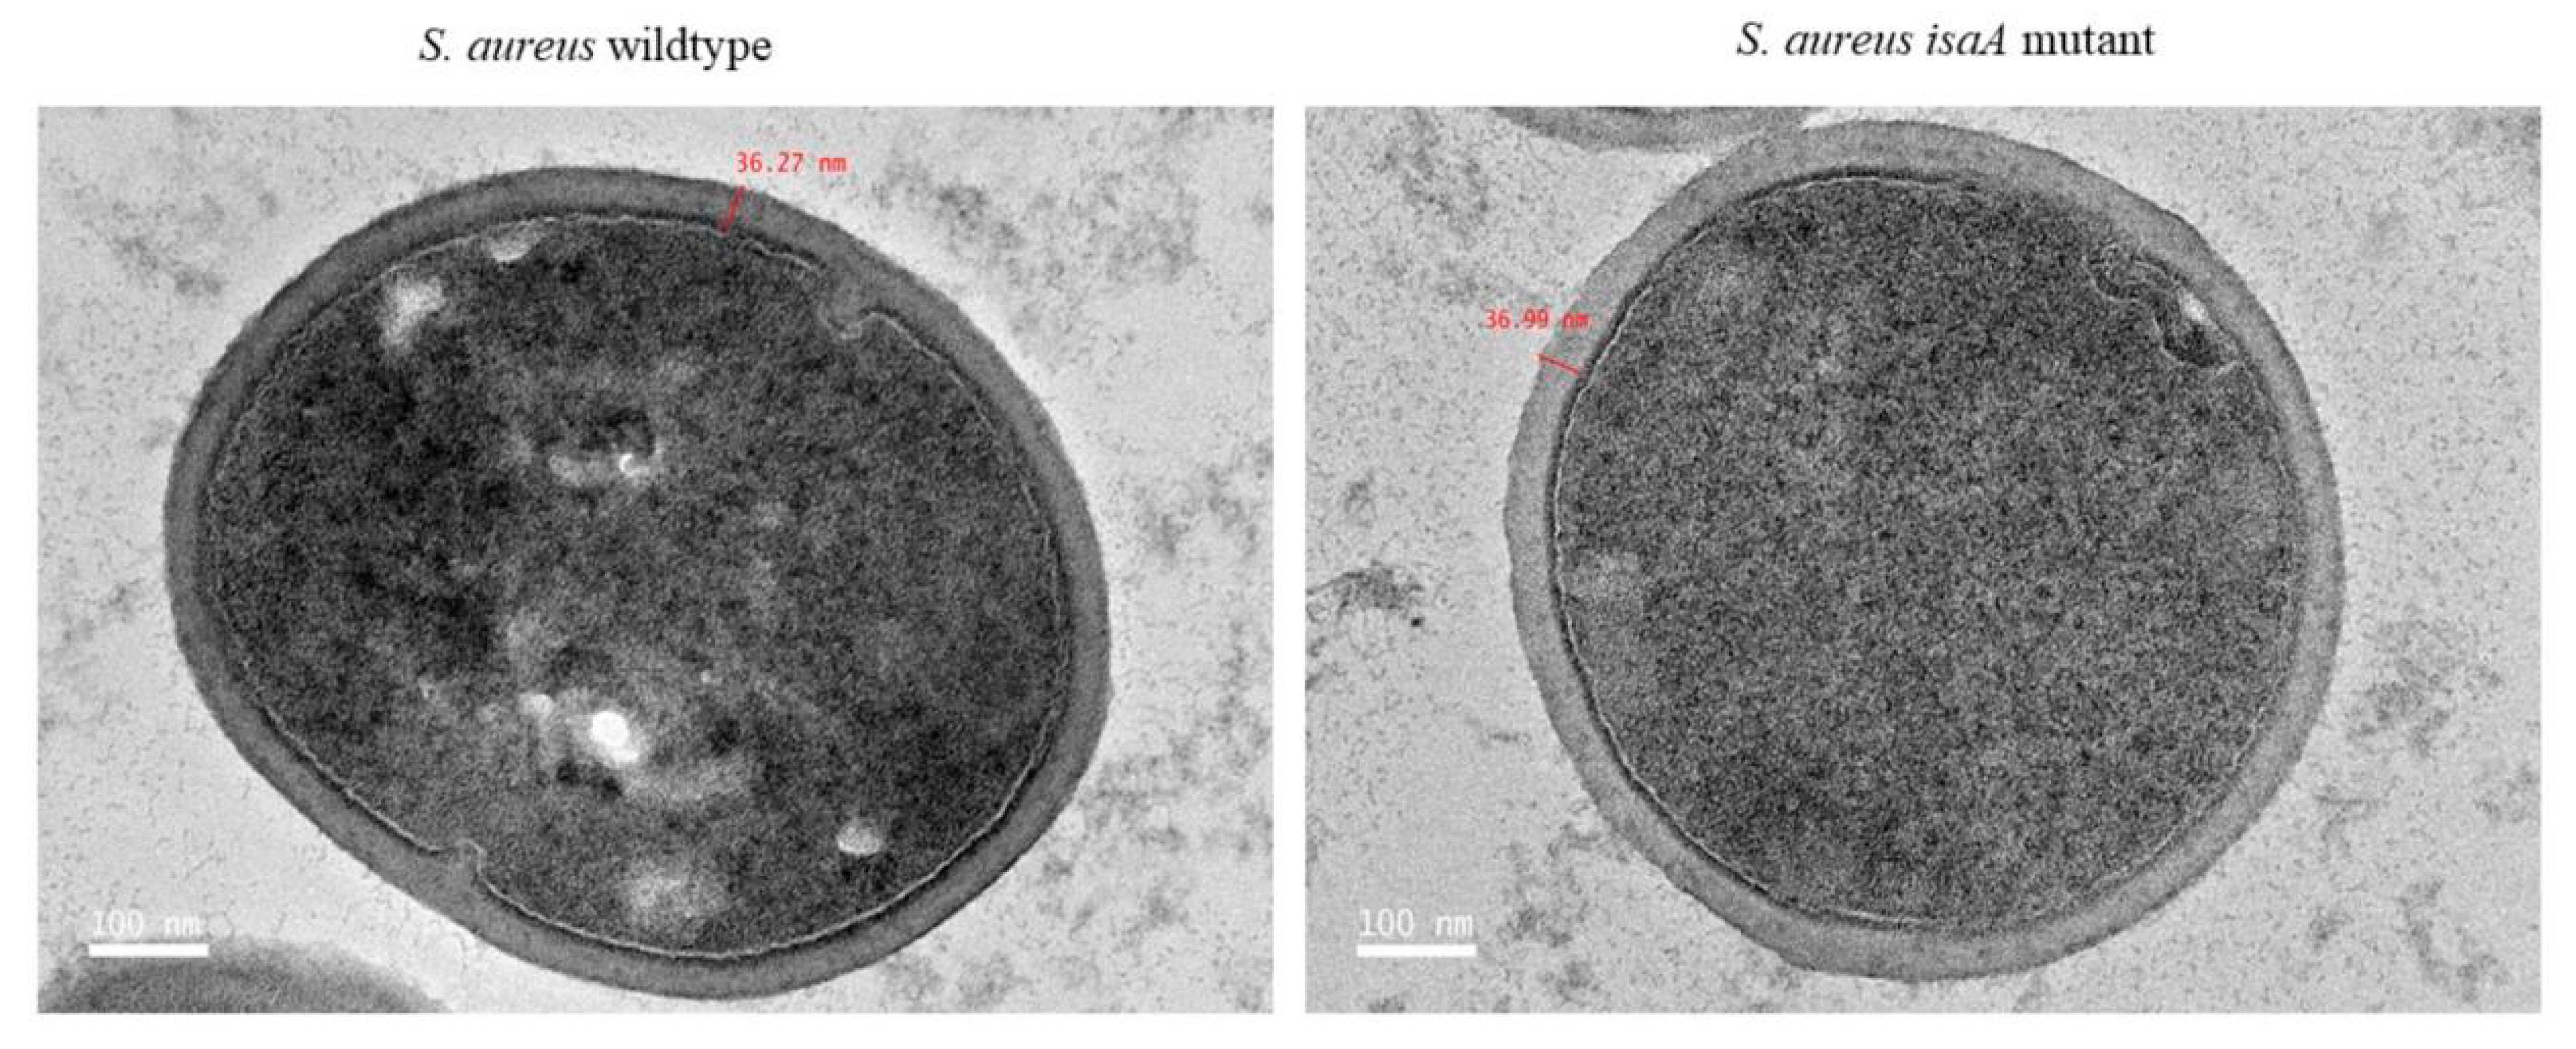
3.2. Cell Wall Morphology of Wildtype and Mutant Strains

The ΔisaA mutant cells maintained a cocci shape with a smooth cell surface, similar to wildtype cells. Microscopic inspection also showed no changes to cell morphology in the absence of the isaA gene (Figure 2). Additionally, the thickness of the S. aureus cell wall was unaffected with isaA gene disruption (32.03 ± 1.63 nm and 31.38 ± 1.22 nm for S. aureus ΔisaA mutant and wildtype, respectively).

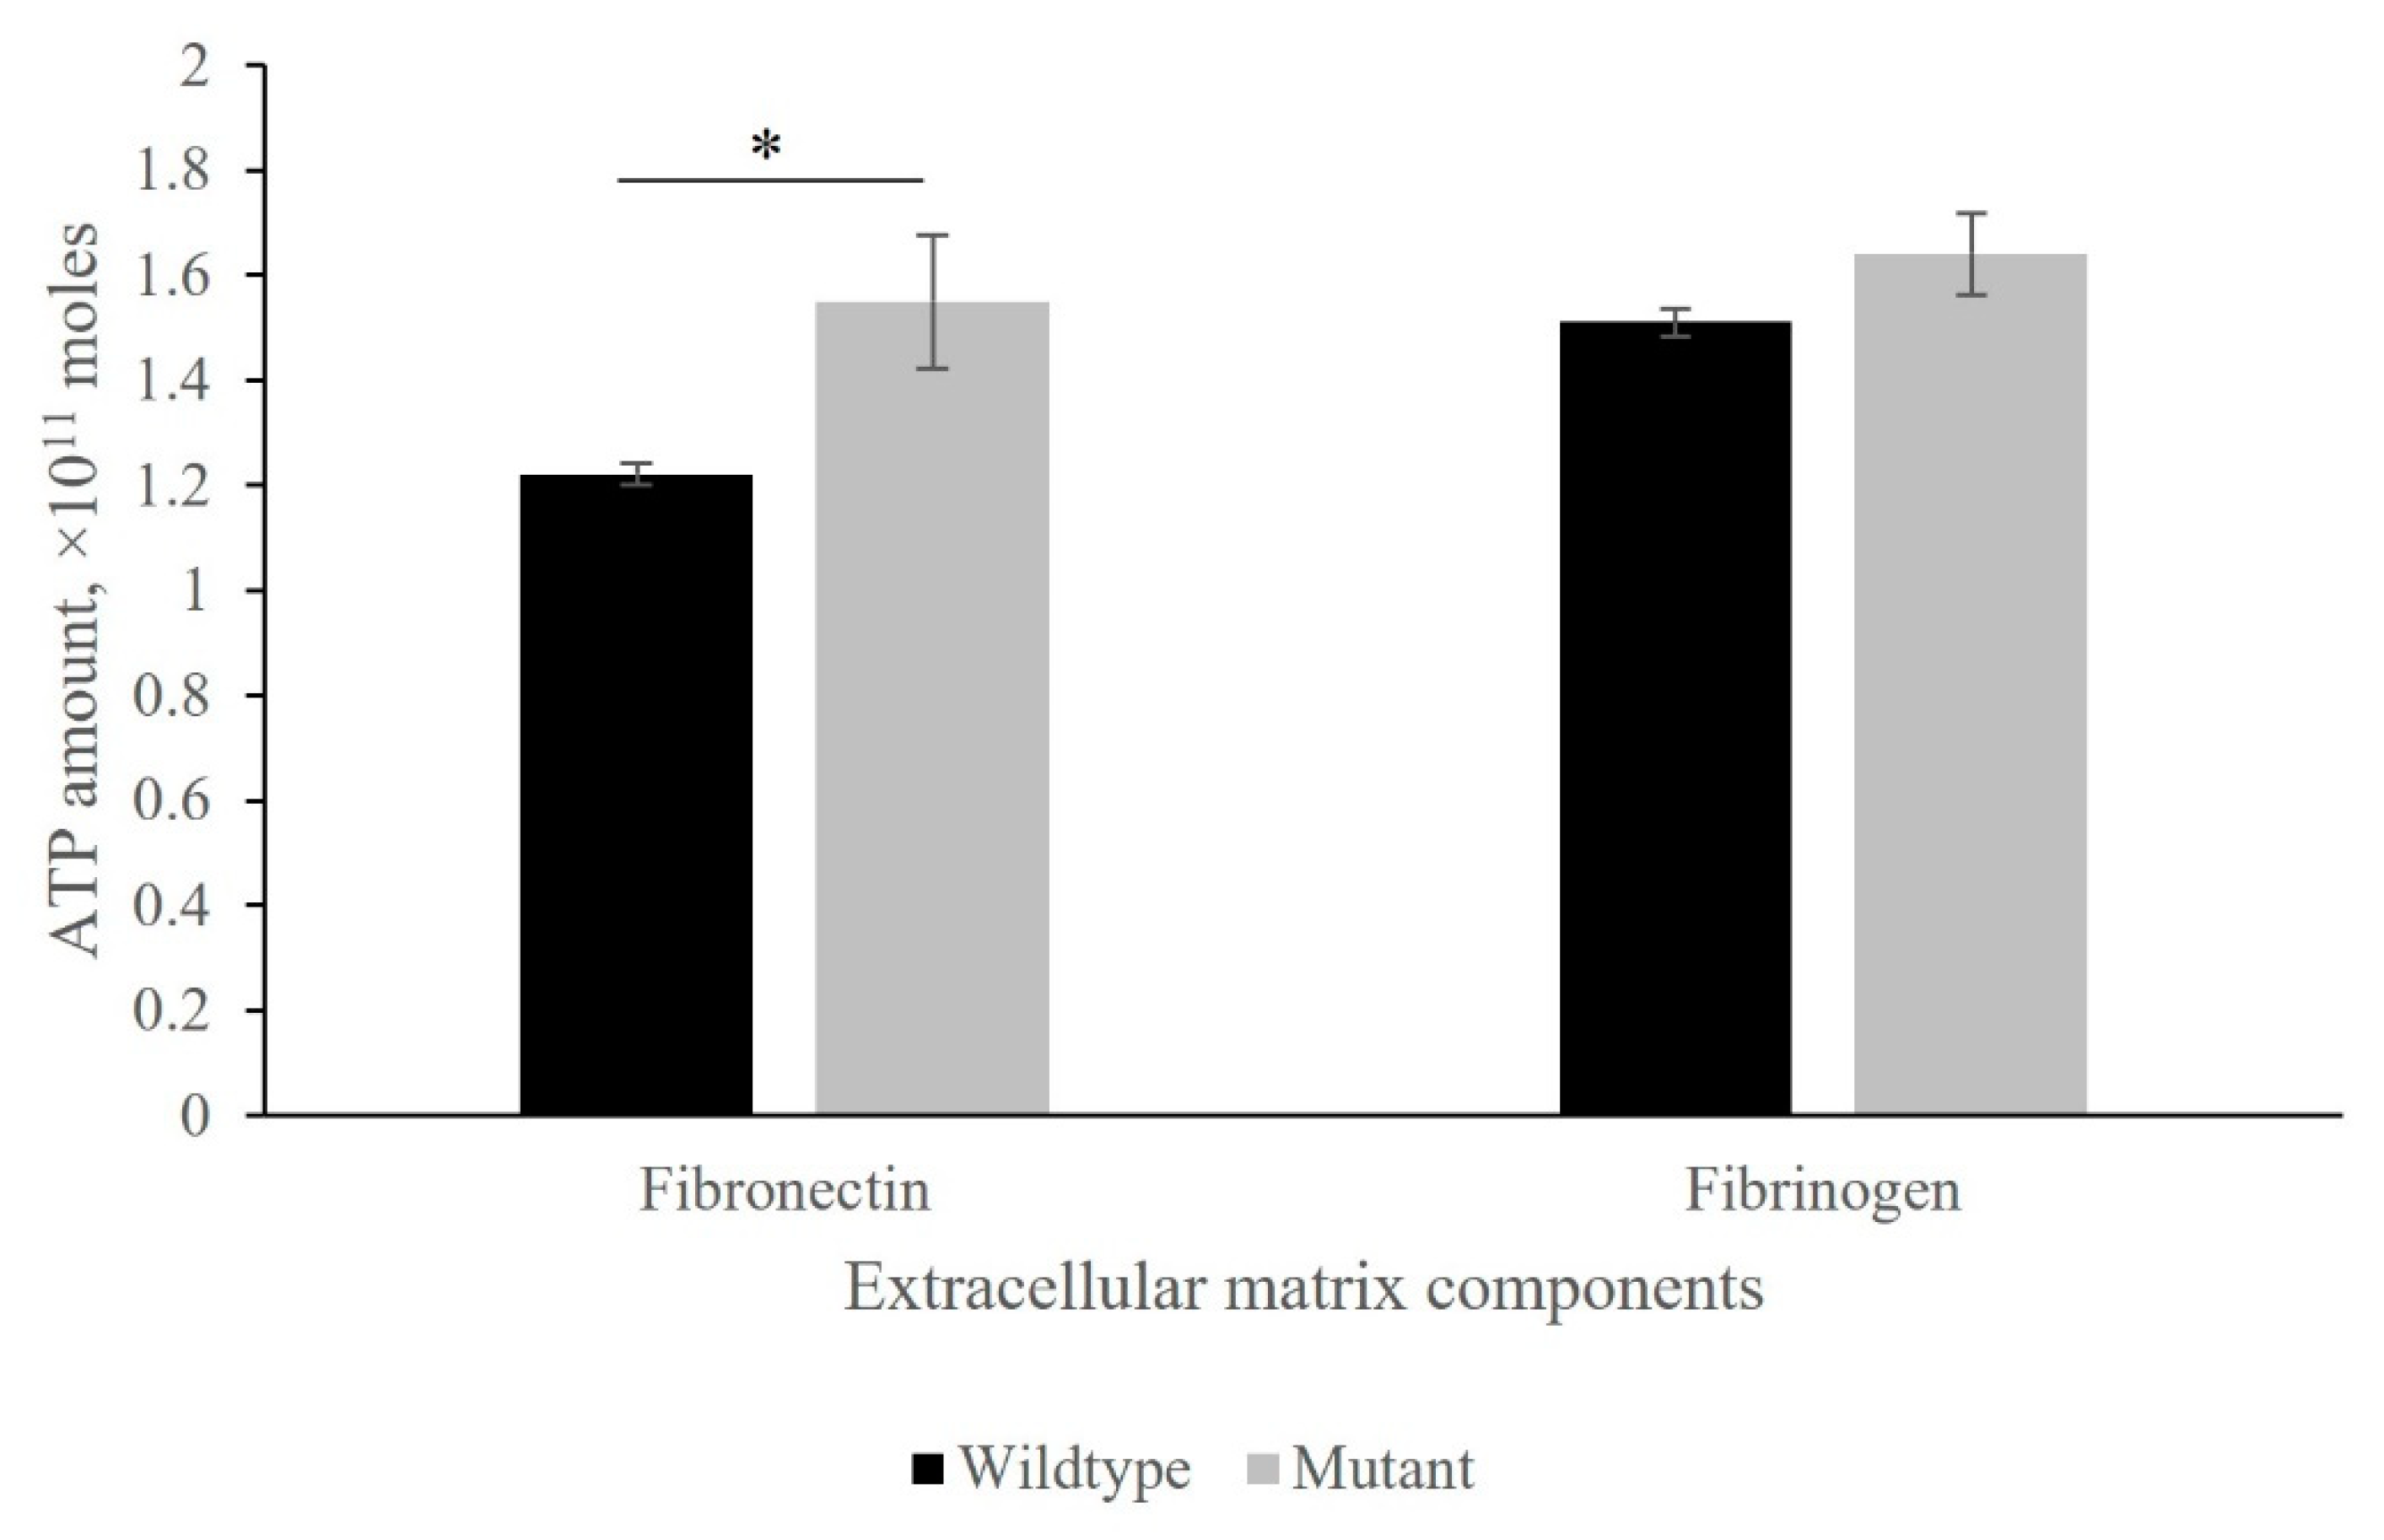
3.3. Adherence of Wildtype and Mutant Strains to Fibronectin and Fibrinogen

In the isaA mutant, staphylococci tend to adhere to the tested fibronectin or fibrinogen, where overall ATP bioluminescence was much higher than that of the wildtype S. aureus. Importantly, there was a statistically significant difference between the binding of ΔisaA mutant and its wildtype strain on fibronectin. Figure 3 illustrate representative amounts of released bacterial ATP detected in different extracellular matrix components which clearly shows a different ATP profile.

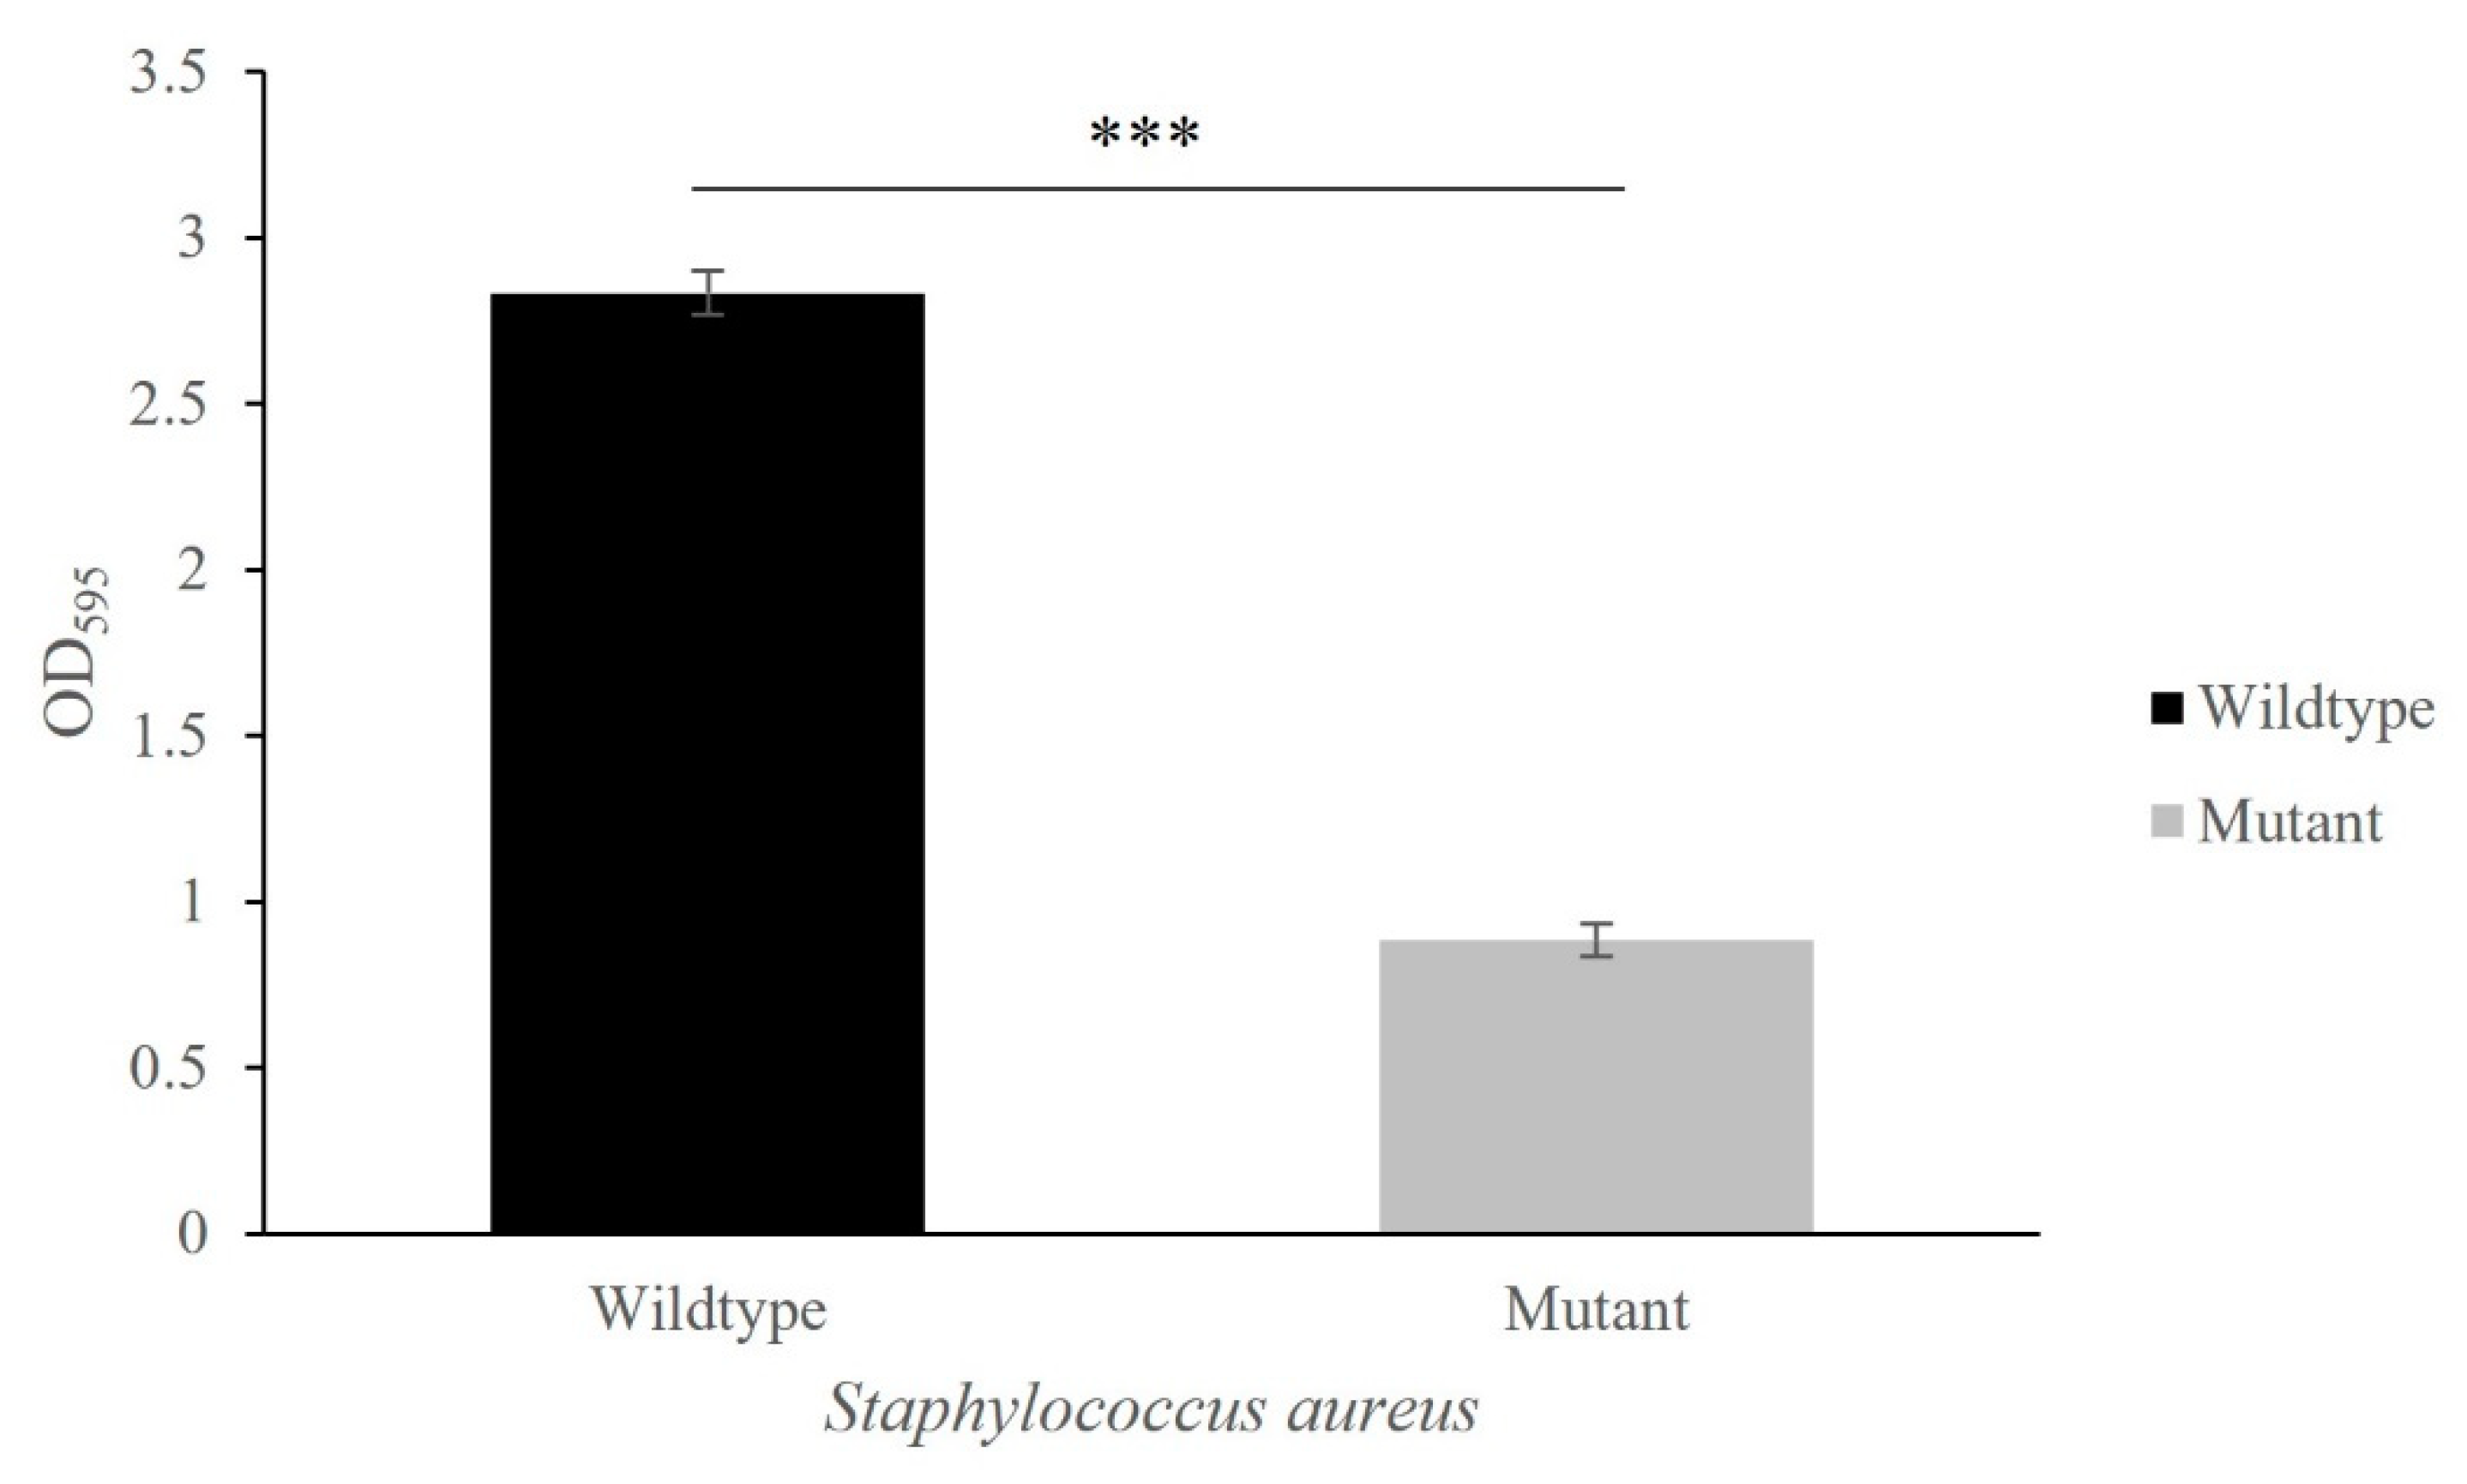
3.4. Capability of Biofilm Formation

The isaA gene strongly influenced biofilm formation; the ΔisaA mutant is less likely to produce biofilms than its parental strain SH1000 (Figure 4). Generally, there was an approximately 70% reduction in biofilm formation in the isaA mutant when grown in TSB medium supplemented with 0.2% glucose. Significant biofilm was only observed for S. aureus SH1000 and not the ΔisaA mutant.

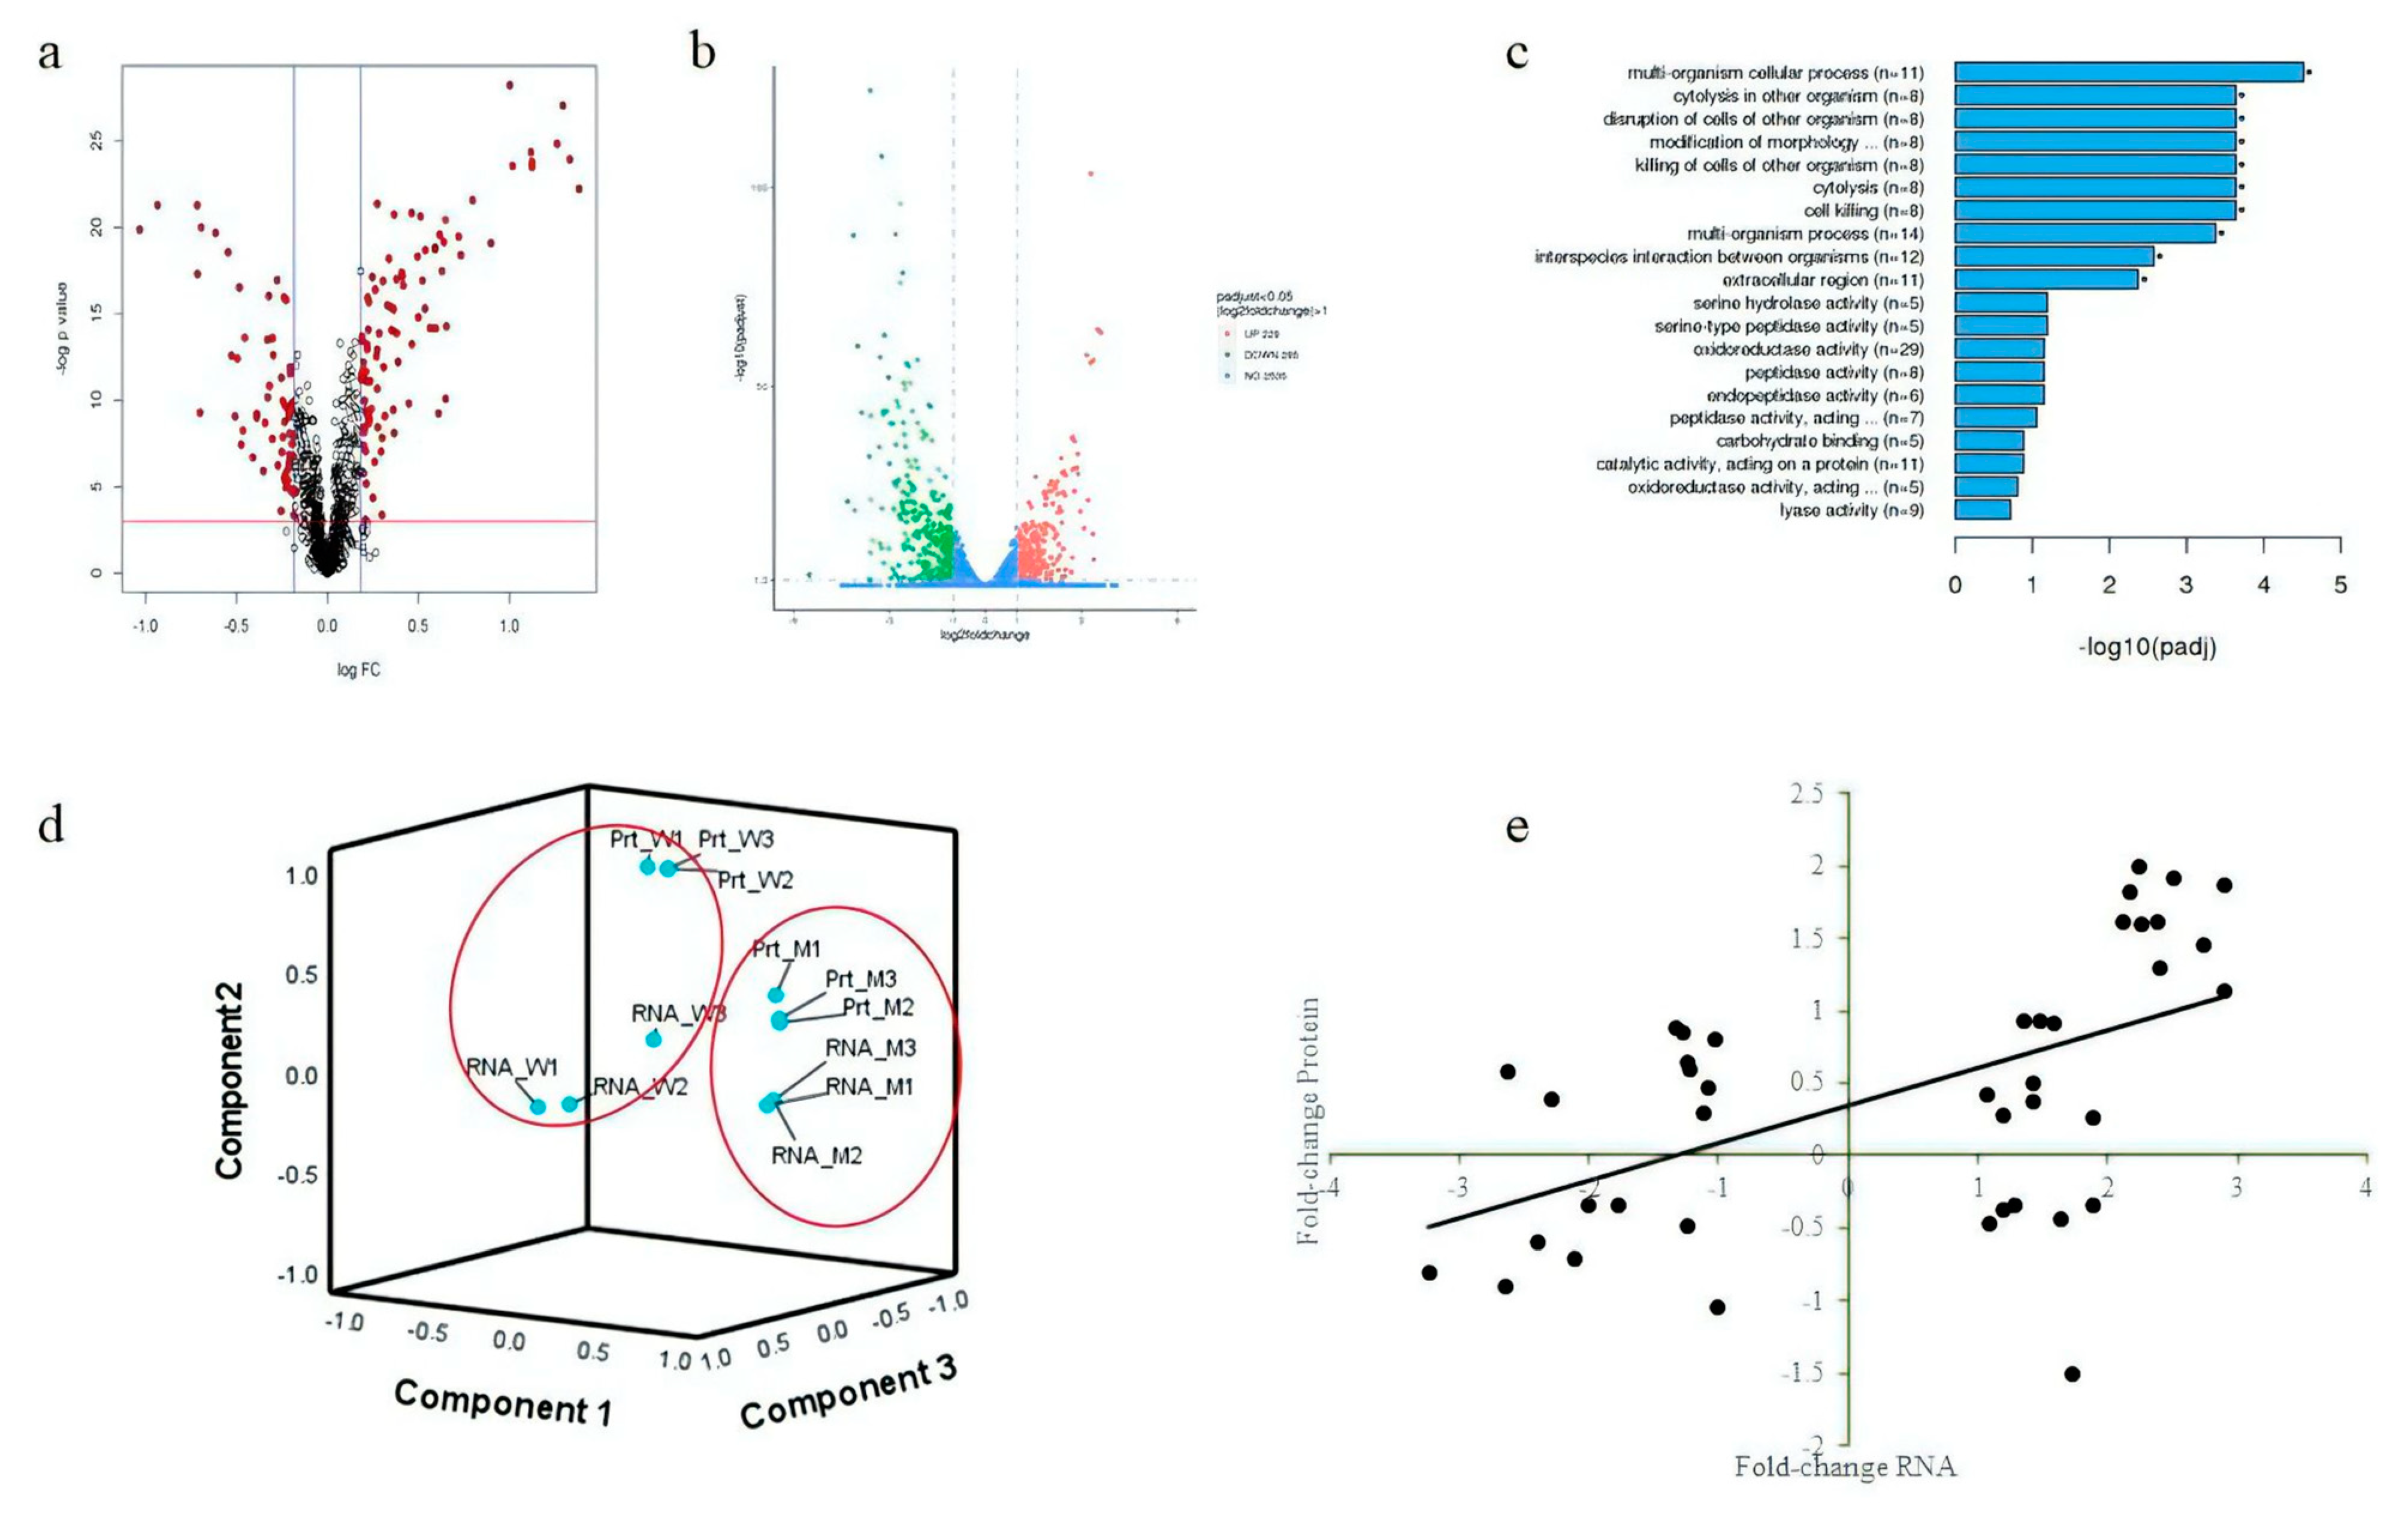
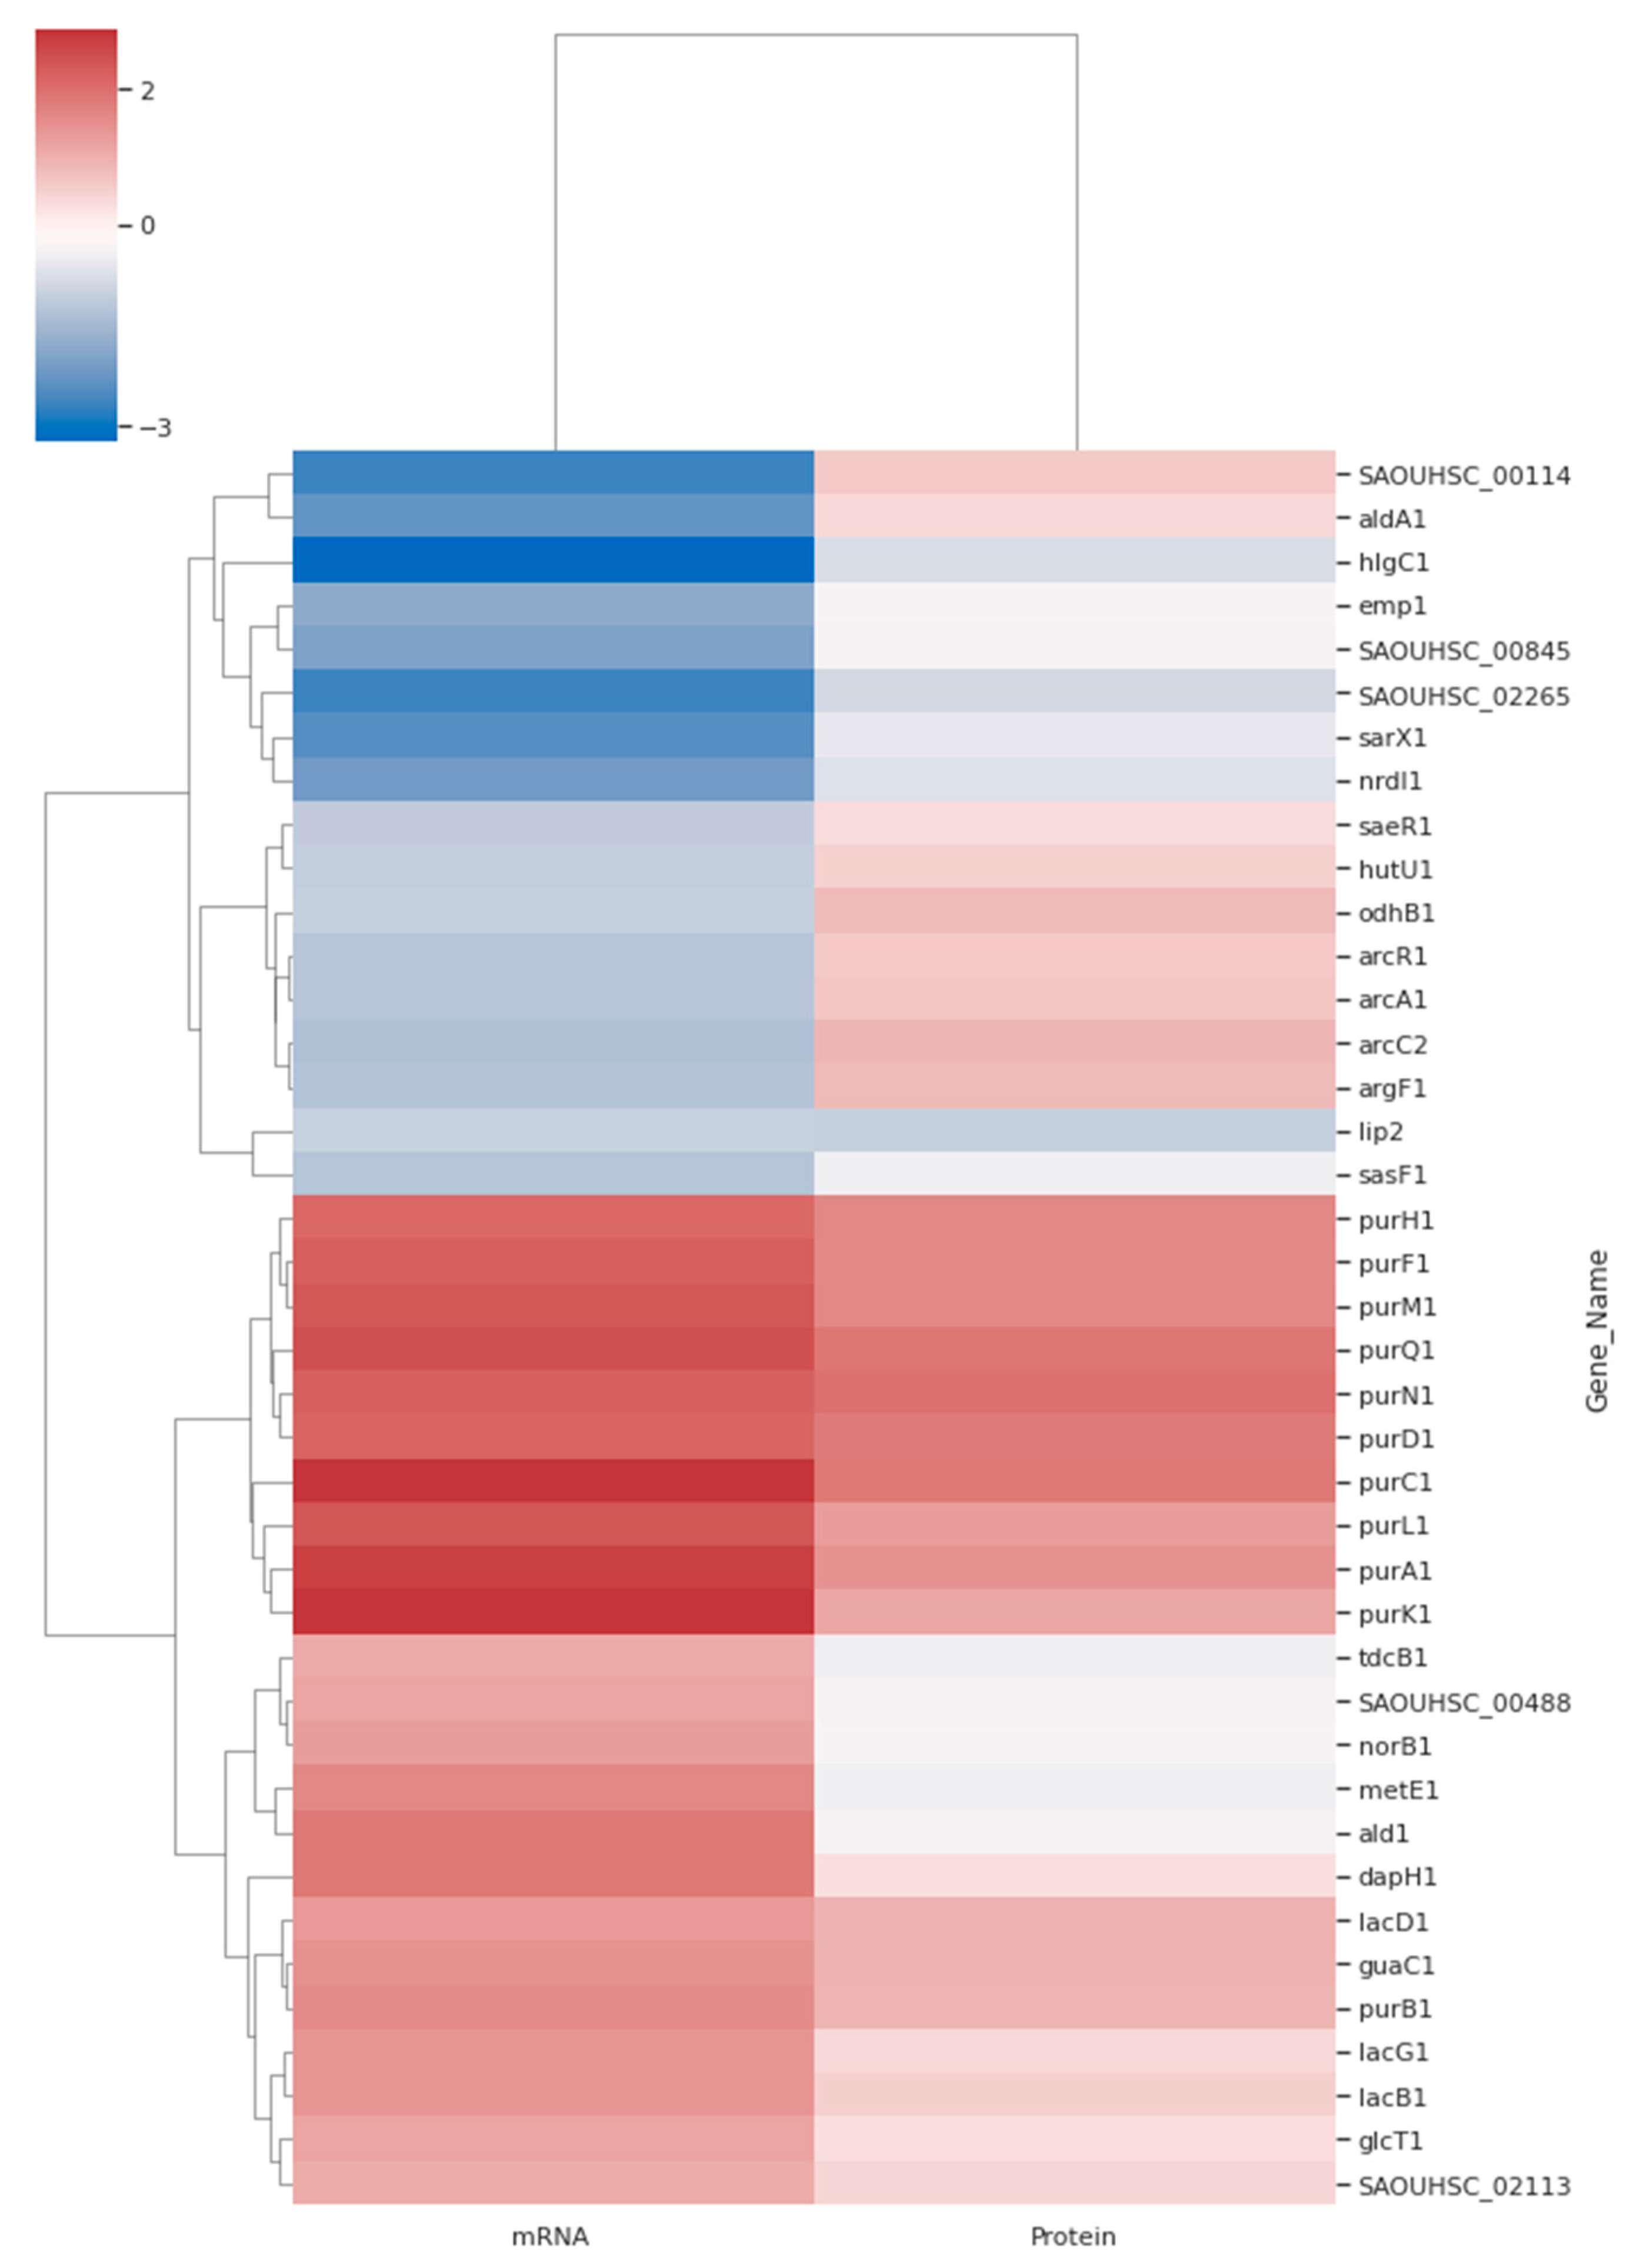
3.5. Differentially Expressed Protein and Gene Analysis

Volcano plots of fold changes were created to view variations in gene and protein expression between isaA mutant and wildtype S. aureus (Figure 5a,b). A total of 135 DEPs were found in the S. aureus proteome using tandem mass spectrometry (LC–MS/MS), where 55 were downregulated proteins and 80 were upregulated proteins in the ΔisaA mutant. Apart from the proteome, high-throughput RNA sequencing (RNA-seq) identified 514 DEGs when the isaA gene was disrupted, of which 285 were downregulated and 229 were upregulated. For proteomics, several proteins were more downregulated in the ΔisaA mutant than in the wildtype strain, such as those involved in immunoglobulin binding (protein A (SpA), Staphylococcal binding immunoglobulin protein (Sbi)) and adherence to host cells (serine–aspartate repeat containing protein D (SdrD)), as well as lipid modifying (lipase 2, SAL2). In addition, transcriptomics found that mRNA corresponding to proteases, staphylococcal hemolysins and adhesive surface protein were highly downregulated in the ΔisaA mutant, at 19.7, 16.9, 15.8, 14.5, 12.3, 12.1, 11.9, 9.4, 9.4 and 9.1-fold for splE, splD, splC, splB, splA, hlgB, hld, hlgC, splF and clfA genes, respectively.
GO enrichment analyses unravelled nine significant GO terms, which were classified into the category of biological process (BP). These included the top three enriched terms of “multi-organism cellular process (GO:0044764)”, “cell killing (GO:0001906)” and “cytolysis (GO:0019835)”. On the other hand, there is only one significant GO term enriched into the category of cellular component (CC) with 11 DEGs. As shown in Figure 5c, this particular GO term is “extracellular region (GO:0005576)” involving the genes associated with virulence factors, such as hemolysins and superantigen-like proteins. All these significant GO terms in BP and CC were enriched from the downregulated genes. The PCA of both omics showed that samples could be generally clustered into two groups, either wildtype or mutant (Figure 5d). The dots labelled as RNA_W or Prt_W are the dataset of wildtype S. aureus generated from transcriptomics and proteomics, respectively, while RNA_M or Prt_M are the dataset from the ΔisaA mutant. All these datasets were obtained from three replicates. It was noted that the RNA-seq data and proteomics were further grouped into representative small groups within each cluster (Figure 5d). This indicates high levels of reproducibility between replicates within each omics approach. Moreover, the correlation between mRNA and protein levels was moderately positive, with correlation coefficient of rs = 0.613 for the matched DEGs and DEPs (Figure 5e).
The co-expression of genes for the production of corresponding proteins is depicted as a heatmap in Figure 6. It found that not all the matched mRNA and protein for the respective gene necessarily has the same differential expression profile. For example, SAOUHSC_00114 was downregulated according to transcriptomics, but was slightly upregulated in the ΔisaA mutant based on proteomics. This opposite expression pattern could also be observed for other genes, as shown in Figure 6. However, a consistent expression pattern was found between the transcripts and proteins for the ΔisaA mutant. There were eight genes and proteins consistently downregulated, while another 18 upregulated proteins also demonstrated a pattern similar to their corresponding mRNA transcription profile.

4. Discussion

Understanding the associated phenotypes, protein or gene expression profiles change upon the isaA gene disruption is important in guiding the development of an effective way to treat or limit the spread of the S. aureus. Previous studies suggest that the isaA are expressed during infection as well as colonisation; however, the disruption of the isaA gene on its influence on proteome or transcriptome alteration of S. aureus is still unclear.
Here, we present the disruption of the isaA gene; there were significant differences in certain phenotypes for the isaA mutant strain. However, the growth pattern, autolysis profiles and cell wall morphology were not greatly influenced, but some differences were observed in this study for growth and autolysis profiles. As reported, IsaA was found to have autolytic activity that can assist in cell wall expansion, turnover, growth and cell separation. Besides, researchers found that cell wall turnover is dependent on autolytic activity [19,36]. Therefore, as shown in Figure 1a, the growth curve of the isaA mutant has a slightly lower (but not significant) maximum bacterial density than the wildtype strain. Similarly, autolytic activity in the isaA mutant was slightly decreased in the present study. The reduced autolysis might explain the growth retardation of the isaA mutant by slowing the cell replication, which leads to decreased bacterial density. Importantly, the downregulation of the nrdI gene in the ΔisaA mutant as determined by proteomics and RNA-seq may also be one reason for the reduction in maximum bacterial density. It is known that the nrdI gene product is involved in ribonucleotide reductase function, which is responsible for replication and adaptation to different phases in the growth curve [37,38,39]. In the exponential to stationary phase they even have similar maximum specific growth rates or slopes, but a prolonged lag phase for the isaA mutant was observed. Disruption of the isaA gene caused the cells to require more time to adapt gene regulation during the lag phase, thus growth retardation occurred with its modified autolytic rate for cell wall turnover and downregulated nrdI gene. However, no changes were observed in the cell wall thickness and morphology. Undeniably, the loss of IsaA function alone may still be able to be compensated by other gene products with similar functions for cell wall expansion, turnover, growth and cell separation. For example, transglycosylase (SceD), cell wall hydrolase (LytN), and autolysins (Atl, Sle1) might have compensatory roles in autolytic activity and are expressed for cell division in S. aureus [19,40,41,42]. Based on our transcriptomic data, the genes of atl, sle1 and lytN were not affected by isaA gene disruption, while the sceD gene had increased expression.
In the present study, significant reduction in biofilm formation for the ΔisaA mutant under static conditions is in good agreement with previous data showing that deletion of isaA significantly decreased biofilm formation. A number of studies have shown that the expression of intercellular adhesion (ica), fibrinogen-binding proteins (Fib), fibronectin-binding proteins (FnBPs), collagen-binding protein (cna), Sdr proteins, clumping factors (Clfs), bone sialoprotein-binding protein (Bbp), SpA and S. aureus surface proteins (Sas) are associated with biofilm production [43,44,45,46]. Notably, our proteomic data showed that the production of SdrD and SpA was significantly reduced in the isaA mutant strain. A study carried out by Merino et al. also indicated that SpA is a protein that might affect biofilm formation in S. aureus. The deletion of the spa gene significantly reduced staphylococcal biofilm production [47]. Markedly downregulated genes coding for SasF, Fib and ClfA were also detected in the ΔisaA mutant in this present study. It was previously shown that ClfA plays an important role as an adhesin for the early stages of biofilm formation, and SasF was recently found to be a component of the biofilm matrix [44,48]. Although Fib was significantly reduced in the ΔisaA mutant, it did not decrease the binding of isaA mutant to fibrinogen. In contrast, isaA gene disruption further enhanced the binding of S. aureus to these tested extracellular matrix components (fibrinogen and fibronectin), irrespective of the downregulation of the fib gene. However, the fnbA gene was significantly upregulated, with approximately a 3 log2 fold change in the ΔisaA mutant. The highest binding of the isaA mutant to extracellular matrix components, especially fibronectin, might therefore be related to the upregulation of the fnbA gene. Furthermore, the other genes, such as eap, coa and vWbp, can compensate for the function of Fib as well [49,50,51].
Protein analysis revealed greatly reduced Sbi synthesis (along with SpA and SdrD as mentioned above) in the ΔisaA mutant. Sbi is the main key for staphylococcal immune evasion. Additionally, a few virulence factor genes have been shown to be highly downregulated with isaA gene disruption, including genes responsible for serine proteases (SplA to -F) and hemolysins (gamma- and delta-hemolysin) as found in the present transcript database. Several studies reported that these serine proteases cause many clinical infections, such as endocarditis, pneumonia, and allergic asthma [52,53,54]. Meanwhile, hemolysins can lyse mammalian cell membranes to escape killing by phagocyte and cause septic arthritis in the host [55,56,57,58,59,60]. Our enrichment analysis results indicate that a few more genes encoding virulence factors were significantly enriched in the BP or CC categories, such as virulence factor alpha-hemolysin, leukocidins, leukotoxin, superantigen-like proteins and hyaluronate lyase. The role of these virulence factors has been well documented elsewhere [61,62,63,64,65]. For example, hyaluronate lyase plays a vital role in subcutaneous infections; hemolysin, leukocidins and leukotoxin might exhibit lytic activity on host cells and subsequently evade the host immune response. The role of superantigen-like proteins and their association with S. aureus pathogenesis are comprehensively discussed in the literature written by Fraser and Proft [66]. Basically, superantigen-like proteins can lead to severe life-threatening conditions.
It is unsurprising that the transcriptome and proteome were moderately related rather than being strongly correlated. This partial discordance supports that post-transcriptional processes play a significant role in adapting to growth conditions and protein synthesis. It could also be because some proteins detected by proteomic analysis were not or were weakly detected in transcriptomic analysis, probably due to the mRNA’s half-life and stability. On the other hand, some insoluble proteins, low abundance proteins and post-translational factors also contribute to the inconsistent finding between protein and transcript correlation. Nevertheless, as shown in the heatmap, we still observed consistent expression profiles in both omics for certain genes. One of the remarkable findings of this heatmap is that the expression of sarX and pur genes was consistent between transcriptomics and proteomics. The ΔisaA mutant downregulated expression of sarX and upregulated purine biosynthesis genes purA, purB, purC, purD, purF, purH, purK, purL, purM, purN and purQ. A study has shown that the sarX gene plays an important role in biofilm production because it can activate the ica genes, which are associated with biofilm formation [67]. Thus, downregulation of sarX in the isaA mutant may be another factor related to the significant reduction in biofilm production. A previous study also demonstrated that purine biosynthesis genes might be involved in biofilm formation [68]. They found that the disruption of some pur genes resulted in significantly impaired S. aureus biofilm formation. However, a clear mechanism regarding the upregulated pur genes—which in turn deactivates the other genes, leading to biofilm reduction—is still unknown.
Taken together, our results provide evidence that isaA is a gene that affects biofilm formation and the expression of other virulence factors in the biological process of S. aureus, especially leukocidins and hemolysins.

Author Contributions

Y.K.L. designed the experiments and drafted and supervised the manuscript; P.Y.M. performed the experiments and drafted the manuscript; C.W.C., L.T.L.T., A.B.S., K.L.H., V.K.N. and Z.S. supervised the manuscript and validated the experiments; Y.K.L. also contributed to evaluating analyses; A.B.S., K.L.H. and V.K.N. contributed resources. All authors have read and agreed to the published version of the manuscript.

Funding

This research was supported by a grant from the Fundamental Research Grant Scheme (FRGS), grant number: FRGS/1/2018/SKK11/IMU/03/1.

Institutional Review Board Statement

Not applicable.

Informed Consent Statement

Not applicable.

Data Availability Statement

Not applicable.

Acknowledgments

We would like to thank Simon J. Foster, the School of Postgraduate Studies and the Institute for Research, Development and Innovation (IRDI) of the International Medical University for their support.

Conflicts of Interest

The authors declare no conflict of interest.

References

  1. Collee, J.G.; Fraser, A.G.; Marmion, B.P.S. A Mackie and McCartney Practical Medical Microbiology; Simmons: Atlanta, GA, USA, 1996. [Google Scholar]
  2. Lowy, F.D. Staphylococcus aureus infections. N. Engl. J. Med. 1998, 339, 520–532. [Google Scholar] [CrossRef] [PubMed]
  3. Trochesset, D.A.; Walker, S.G. Isolation of Staphylococcus aureus from environmental surfaces in an academic dental clinic. J. Am. Dent. Assoc. 2012, 143, 164–169. [Google Scholar] [CrossRef] [PubMed]
  4. Scott, E.; Duty, S.; Callahan, M. A pilot study to isolate Staphylococcus aureus and methicillin-resistant S. aureus from environmental surfaces in the home. Am. J. Infect. Control. 2008, 36, 458–460. [Google Scholar] [CrossRef] [PubMed]
  5. Merghni, A.; Ben Nejma, M.; Dallel, I.; Tobji, S.; Ben Amor, A.; Janel, S.; Lafont, F.; Aouni, M.; Mastouri, M. High potential of adhesion to biotic and abiotic surfaces by opportunistic Staphylococcus aureus strains isolated from orthodontic appliances. Microb. Pathog. 2016, 91, 61–67. [Google Scholar] [CrossRef] [PubMed]
  6. Peacock, S.J.; de Silva, I.; Lowy, F.D. What determines nasal carriage of Staphylococcus aureus? Trends Microbiol. 2001, 9, 605–610. [Google Scholar] [CrossRef]
  7. Chambers, H.F. The changing epidemiology of Staphylococcus aureus? Emerg. Infect. Dis. 2001, 7, 178–182. [Google Scholar] [CrossRef]
  8. Tong, S.Y.; Davis, J.S.; Eichenberger, E.; Holland, T.L.; Fowler, V.G., Jr. Staphylococcus aureus infections: Epidemiology, pathophysiology, clinical manifestations, and management. Clin. Microbiol. Rev. 2015, 28, 603–661. [Google Scholar] [CrossRef] [Green Version]
  9. Rasigade, J.; Vandenesch, F. Staphylococcus aureus: A pathogen with still unresolved issues. Infect. Genet. Evol. 2014, 21, 510–514. [Google Scholar] [CrossRef]
  10. Foster, T.J.; Höök, M. Surface protein adhesins of Staphylococcus aureus. Trends Microbiol. 1998, 6, 484–488. [Google Scholar] [CrossRef]
  11. Skinner, D.; Keefer, C.S. Significance of bacteremia caused by Staphylococcus aureus: A study of one hundred and twenty-two cases and a review of the literature concerned with experimental infection in animals. Arch. Intern. Med. 1941, 68, 851–875. [Google Scholar] [CrossRef]
  12. Kadariya, J.; Thapaliya, D.; Bhatta, S.; Mahatara, R.L.; Bempah, S.; Dhakal, N.; Smith, T.C. Multidrug-resistant Staphylococcus aureus colonization in healthy adults is more common in Bhutanese refugees in Nepal than those resettled in Ohio. Biomed. Res. Int. 2019, 2019, 5739247. [Google Scholar] [CrossRef] [PubMed] [Green Version]
  13. Raafat, D.; Otto, M.; Reppschläger, K.; Iqbal, J.; Holtfreter, S. Fighting Staphylococcus aureus biofilms with monoclonal antibodies. Trends Microbiol. 2019, 27, 303–322. [Google Scholar] [CrossRef] [PubMed]
  14. Liew, Y.K.; Awang Hamat, R.; van Belkum, A.; Chong, P.P.; Neela, V. Comparative exoproteomics and host inflammatory response in Staphylococcus aureus skin and soft tissue infections, bacteremia, and subclinical colonization. Clin. Vaccine Immunol. 2015, 22, 593–603. [Google Scholar] [CrossRef] [PubMed]
  15. Ziebandt, A.; Becher, D.; Ohlsen, K.; Hacker, J.; Hecker, M.; Engelmann, S. The influence of agr and σB in growth phase dependent regulation of virulence factors in Staphylococcus aureus. Proteomics 2004, 4, 3034–3047. [Google Scholar] [CrossRef]
  16. Ziebandt, A.; Kusch, H.; Degner, M.; Jaglitz, S.; Sibbald, M.J.; Arends, J.P.; Chlebowicz, M.A.; Albrecht, D.; Pantuček, R.; Doškar, J. Proteomics uncovers extreme heterogeneity in the Staphylococcus aureus exoproteome due to genomic plasticity and variant gene regulation. Proteomics 2010, 10, 1634–1644. [Google Scholar] [CrossRef]
  17. Dinges, M.M.; Orwin, P.M.; Schlievert, P.M. Exotoxins of Staphylococcus aureus. Clin. Microbiol. Rev. 2000, 13, 16–34. [Google Scholar] [CrossRef]
  18. Fedtke, I.; Götz, F.; Peschel, A. Bacterial evasion of innate host defenses–the Staphylococcus aureus lesson. Int. J. Med. Microbiol. 2004, 294, 189–194. [Google Scholar] [CrossRef]
  19. Stapleton, M.R.; Horsburgh, M.J.; Hayhurst, E.J.; Wright, L.; Jonsson, I.M.; Tarkowski, A.; Kokai-Kun, J.F.; Mond, J.J.; Foster, S.J. Characterization of IsaA and SceD, two putative lytic transglycosylases of Staphylococcus aureus. J. Bacteriol. 2007, 189, 7316–7325. [Google Scholar] [CrossRef] [Green Version]
  20. Dreisbach, A.; Hempel, K.; Buist, G.; Hecker, M.; Becher, D.; van Dijl, J.M. Profiling the surfacome of Staphylococcus aureus. Proteomics 2010, 10, 3082–3096. [Google Scholar] [CrossRef]
  21. Sakata, N.; Terakubo, S.; Mukai, T. Subcellular location of the soluble lytic transglycosylase homologue in Staphylococcus aureus. Curr. Microbiol. 2005, 50, 47–51. [Google Scholar] [CrossRef]
  22. Dreisbach, A.; van Dijl, J.M.; Buist, G. The cell surface proteome of Staphylococcus aureus. Proteomics 2011, 11, 3154–3168. [Google Scholar] [CrossRef] [PubMed]
  23. Kloppot, P.; Selle, M.; Kohler, C.; Stentzel, S.; Fuchs, S.; Liebscher, V.; Müller, E.; Kale, D.; Ohlsen, K.; Bröker, B.M. Microarray-based identification of human antibodies against Staphylococcus aureus antigens. Proteomics Clin. Appl. 2015, 9, 1003–1011. [Google Scholar] [CrossRef] [PubMed]
  24. Glasner, C.; Van Timmeren, M.M.; Stobernack, T.; Omansen, T.F.; Raangs, E.C.; Rossen, J.W.; De Goffau, M.C.; Arends, J.P.; Kampinga, G.A.; Koedijk, D.G. Low anti-staphylococcal IgG responses in granulomatosis with polyangiitis patients despite long-term Staphylococcus aureus exposure. Sci. Rep. 2015, 5, 8188. [Google Scholar] [CrossRef] [PubMed] [Green Version]
  25. Van Der Kooi-pol, M.M.; De Vogel, C.P.; Westerhout-Pluister, G.N.; Veenstra-Kyuchukova, Y.K.; Duipmans, J.C.; Glasner, C.; Buist, G.; Elsinga, G.S.; Westra, H.; Bonarius, H.; et al. High anti-staphylococcal antibody titers in patients with epidermolysis bullosa relate to long-term colonization with alternating types of Staphylococcus aureus. J. Invest. Dermatol. 2013, 133, 847–850. [Google Scholar] [CrossRef] [PubMed] [Green Version]
  26. Romero Pastrana, F.; Neef, J.; Koedijk, D.G.; De Graaf, D.; Duipmans, J.; Jonkman, M.F.; Engelmann, S.; Van Dijl, J.M.; Buist, G. Human antibody responses against non-covalently cell wall-bound Staphylococcus aureus proteins. Sci. Rep. 2018, 8, 3234. [Google Scholar] [CrossRef]
  27. Wojciechowska, J.; KręCicki, T. Clinical characteristics of patients with granulomatosis with polyangiitis and microscopic polyangiitis in ENT practice: A comparative analysis. Acta Otorhinolaryngol. Ital. 2018, 38, 517. [Google Scholar] [CrossRef]
  28. Lorenz, U.; Lorenz, B.; Schmitter, T.; Streker, K.; Erck, C.; Wehland, J.; Nickel, J.; Zimmermann, B.; Ohlsen, K. Functional antibodies targeting IsaA of Staphylococcus aureus augment host immune response and open new perspectives for antibacterial therapy. Antimicrob. Agents Chemother. 2011, 55, 165–173. [Google Scholar] [CrossRef] [Green Version]
  29. van den Berg, S.; Bonarius, H.P.; van Kessel, K.P.; Elsinga, G.S.; Kooi, N.; Westra, H.; Bosma, T.; van der Kooi-Pol, M.M.; Koedijk, D.G.; Groen, H. A human monoclonal antibody targeting the conserved staphylococcal antigen IsaA protects mice against Staphylococcus aureus bacteremia. Int. J. Med. Microbiol. 2015, 305, 55–64. [Google Scholar] [CrossRef]
  30. Baty, F.; Delignette-Muller, M. Estimating the bacterial lag time: Which model, which precision? Int. J. Food Microbiol. 2004, 91, 261–277. [Google Scholar] [CrossRef]
  31. Chen, S.; Zhou, Y.; Chen, Y.; Gu, J. Fastp: An ultra-fast all-in-one FASTQ preprocessor. Bioinformatics 2018, 34, i884–i890. [Google Scholar] [CrossRef]
  32. Kim, D.; Langmead, B.; Salzberg, S.L. HISAT: A fast spliced aligner with low memory requirements. Nat. Methods 2015, 12, 357–360. [Google Scholar] [CrossRef] [PubMed] [Green Version]
  33. Liao, Y.; Smyth, G.K.; Shi, W. featureCounts: An efficient general purpose program for assigning sequence reads to genomic features. Bioinformatics 2014, 30, 923–930. [Google Scholar] [CrossRef] [PubMed] [Green Version]
  34. Love, M.I.; Huber, W.; Anders, S. Moderated estimation of fold change and dispersion for RNA-seq data with DESeq2. Genome Biol. 2014, 15, 550. [Google Scholar] [CrossRef] [PubMed] [Green Version]
  35. Kuleshov, M.V.; Jones, M.R.; Rouillard, A.D.; Fernandez, N.F.; Duan, Q.; Wang, Z.; Koplev, S.; Jenkins, S.L.; Jagodnik, K.M.; Lachmann, A. Enrichr: A comprehensive gene set enrichment analysis web server 2016 update. Nucleic Acids Res. 2016, 44, W90–W97. [Google Scholar] [CrossRef] [Green Version]
  36. Wong, W.; Chatterjee, A.N.; Young, F.E. Regulation of bacterial cell walls: Correlation between autolytic activity and cell wall turnover in Staphylococcus aureus. J. Bacteriol. 1978, 134, 555–561. [Google Scholar] [CrossRef] [Green Version]
  37. Roca, I.; Torrents, E.; Sahlin, M.; Gibert, I.; Sjoöberg, B. NrdI essentiality for class Ib ribonucleotide reduction in Streptococcus pyogenes. J. Bacteriol. 2008, 190, 4849–4858. [Google Scholar] [CrossRef] [Green Version]
  38. Said-Salim, B.; Dunman, P.M.; McAleese, F.M.; Macapagal, D.; Murphy, E.; McNamara, P.J.; Arvidson, S.; Foster, T.J.; Projan, S.J.; Kreiswirth, B.N. Global regulation of Staphylococcus aureus genes by Rot. J. Bacteriol. 2003, 185, 610–619. [Google Scholar] [CrossRef] [Green Version]
  39. Torrents, E. Ribonucleotide reductases: Essential enzymes for bacterial life. Front. Cell. Infect. Microbiol. 2014, 4, 52. [Google Scholar] [CrossRef] [Green Version]
  40. Frankel, M.B.; Schneewind, O. Determinants of murein hydrolase targeting to cross-wall of Staphylococcus aureus peptidoglycan. J. Biol. Chem. 2012, 287, 10460–10471. [Google Scholar] [CrossRef] [Green Version]
  41. Becker, S.; Frankel, M.B.; Schneewind, O.; Missiakas, D. Release of protein A from the cell wall of Staphylococcus aureus. Proc. Natl. Acad. Sci. USA 2014, 111, 1574–1579. [Google Scholar] [CrossRef] [Green Version]
  42. Kajimura, J.; Fujiwara, T.; Yamada, S.; Suzawa, Y.; Nishida, T.; Oyamada, Y.; Hayashi, I.; Yamagishi, J.; Komatsuzawa, H.; Sugai, M. Identification and molecular characterization of an N-acetylmuramyl-l-alanine amidase Sle1 involved in cell separation of Staphylococcus aureus. Mol. Microbiol. 2005, 58, 1087–1101. [Google Scholar] [CrossRef] [PubMed]
  43. Vergara-Irigaray, M.; Valle, J.; Merino, N.; Latasa, C.; García, B.; Ruiz de los Mozos, I.; Solano, C.; Toledo-Arana, A.; Penadés, J.R.; Lasa, I. Relevant role of fibronectin-binding proteins in Staphylococcus aureus biofilm-associated foreign-body infections. Infect. Immun. 2009, 77, 3978–3991. [Google Scholar] [CrossRef] [PubMed] [Green Version]
  44. Lei, M.G.; Gupta, R.K.; Lee, C.Y. Proteomics of Staphylococcus aureus biofilm matrix in a rat model of orthopedic implant-associated infection. PLoS ONE 2017, 12, e0187981. [Google Scholar] [CrossRef] [PubMed] [Green Version]
  45. Paharik, A.E.; Horswill, A.R. The staphylococcal biofilm: Adhesins, regulation, and host response. In Virulence Mechanisms of Bacterial Pathogens; ASM Press: Washington, DC, USA, 2016; pp. 529–566. [Google Scholar]
  46. Hiltunen, A.K.; Savijoki, K.; Nyman, T.A.; Miettinen, I.; Ihalainen, P.; Peltonen, J.; Fallarero, A. Structural and functional dynamics of Staphylococcus aureus biofilms and biofilm matrix proteins on different clinical materials. Microorganisms 2019, 7, 584. [Google Scholar] [CrossRef] [PubMed] [Green Version]
  47. Merino, N.; Toledo-Arana, A.; Vergara-Irigaray, M.; Valle, J.; Solano, C.; Calvo, E.; Lopez, J.A.; Foster, T.J.; Penadés, J.R.; Lasa, I. Protein A-mediated multicellular behavior in Staphylococcus aureus. J. Bacteriol. 2009, 191, 832–843. [Google Scholar] [CrossRef] [Green Version]
  48. Entenza, J.; Moreillon, P.; Senn, M.M.; Kormanec, J.; Dunman, P.M.; Berger-Bächi, B.; Projan, S.; Bischoff, M. Role of σB in the expression of Staphylococcus aureus cell wall adhesins ClfA and FnbA and contribution to infectivity in a rat model of experimental endocarditis. Infect. Immun. 2005, 73, 990–998. [Google Scholar] [CrossRef] [Green Version]
  49. Ko, Y.; Kang, M.; Ganesh, V.K.; Ravirajan, D.; Li, B.; Höök, M. Coagulase and Efb of Staphylococcus aureus have a common fibrinogen binding motif. mBio 2016, 7, 1885. [Google Scholar] [CrossRef] [Green Version]
  50. Thomer, L.; Schneewind, O.; Missiakas, D. Multiple ligands of von Willebrand factor-binding protein (vWbp) promote Staphylococcus aureus clot formation in human plasma. J. Biol. Chem. 2013, 288, 28283–28292. [Google Scholar] [CrossRef] [Green Version]
  51. Palma, M.; Haggar, A.; Flock, J. Adherence of Staphylococcus aureus is enhanced by an endogenous secreted protein with broad binding activity. J. Bacteriol. 1999, 181, 2840–2845. [Google Scholar] [CrossRef] [Green Version]
  52. Reed, S.B.; Wesson, C.A.; Liou, L.E.; Trumble, W.R.; Schlievert, P.M.; Bohach, G.A.; Bayles, K.W. Molecular characterization of a novel Staphylococcus aureus serine protease operon. Infect. Immun. 2001, 69, 1521–1527. [Google Scholar] [CrossRef] [Green Version]
  53. Paharik, A.E.; Salgado-Pabon, W.; Meyerholz, D.K.; White, M.J.; Schlievert, P.M.; Horswill, A.R. The Spl serine proteases modulate Staphylococcus aureus protein production and virulence in a rabbit model of pneumonia. mSphere 2016, 1, 208. [Google Scholar] [CrossRef] [PubMed] [Green Version]
  54. Stentzel, S.; Teufelberger, A.; Nordengrün, M.; Kolata, J.; Schmidt, F.; Van Crombruggen, K.; Michalik, S.; Kumpfmüller, J.; Tischer, S.; Schweder, T. Staphylococcal serine protease–like proteins are pacemakers of allergic airway reactions to Staphylococcus aureus. J. Allergy Clin. Immunol. 2017, 139, 492–500.e8. [Google Scholar] [CrossRef] [PubMed] [Green Version]
  55. Nilsson, I.; Hartford, O.; Foster, T.; Tarkowski, A. Alpha-toxin and gamma-toxin jointly promote Staphylococcus aureus virulence in murine septic arthritis. Infect. Immun. 1999, 67, 1045–1049. [Google Scholar] [CrossRef] [Green Version]
  56. Divyakolu, S.; Chikkala, R.; Ratnakar, K.S.; Sritharan, V. Hemolysins of Staphylococcus aureus—An Update on Their Biology, Role in Pathogenesis and as Targets for Anti-Virulence Therapy. Adv. Infect. Dis. 2019, 9, 80–104. [Google Scholar] [CrossRef] [Green Version]
  57. Yoong, P.; Torres, V.J. The effects of Staphylococcus aureus leukotoxins on the host: Cell lysis and beyond. Curr. Opin. Microbiol. 2013, 16, 63–69. [Google Scholar] [CrossRef] [Green Version]
  58. Schmitz, F.; Veldkamp, K.; Kessel, K.P.V.; Verhoef, J.; Strijp, J.A.V. Delta-toxin from Staphylococcus aureus as a ostimulatory of human neutrophil oxidative burst. J. Infect. Dis. 1997, 176, 1531–1537. [Google Scholar] [CrossRef] [PubMed] [Green Version]
  59. Giese, B.; Glowinski, F.; Paprotka, K.; Dittmann, S.; Steiner, T.; Sinha, B.; Fraunholz, M.J. Expression of δ-toxin by Staphylococcus aureus mediates escape from phago-endosomes of human epithelial and endothelial cells in the presence of β-toxin. Cell Microbiol. 2011, 13, 316–329. [Google Scholar] [CrossRef]
  60. Vandenesch, F.; Lina, G.; Henry, T. Staphylococcus aureus hemolysins, bi-component leukocidins, and cytolytic peptides: A redundant arsenal of membrane-damaging virulence factors? Front. Cell. Infect. Microbiol. 2012, 2, 12. [Google Scholar] [CrossRef] [Green Version]
  61. Wardenburg, J.B.; Patel, R.J.; Schneewind, O. Surface proteins and exotoxins are required for the pathogenesis of Staphylococcus aureus pneumonia. Infect. Immun. 2007, 75, 1040–1044. [Google Scholar] [CrossRef] [Green Version]
  62. Kebaier, C.; Chamberland, R.R.; Allen, I.C.; Gao, X.; Broglie, P.M.; Hall, J.D.; Jania, C.; Doerschuk, C.M.; Tilley, S.L.; Duncan, J.A. Staphylococcus aureus α-hemolysin mediates virulence in a murine model of severe pneumonia through activation of the NLRP3 inflammasome. J. Infect. Dis. 2012, 205, 807–817. [Google Scholar] [CrossRef]
  63. Bhattacharya, M.; Berends, E.T.; Chan, R.; Schwab, E.; Roy, S.; Sen, C.K.; Torres, V.J.; Wozniak, D.J. Staphylococcus aureus biofilms release leukocidins to elicit extracellular trap formation and evade neutrophil-mediated killing. Proc. Natl. Acad. Sci. USA 2018, 115, 7416–7421. [Google Scholar] [CrossRef] [PubMed] [Green Version]
  64. Alonzo III, F.; Torres, V.J. Bacterial survival amidst an immune onslaught: The contribution of the Staphylococcus aureus leukotoxins. PLoS Pathog. 2013, 9, e1003143. [Google Scholar] [CrossRef] [PubMed] [Green Version]
  65. Makris, G.; Wright, J.D.; Ingham, E.; Holland, K.T. The hyaluronate lyase of Staphylococcus aureus–a virulence factor? Microbiology 2004, 150, 2005–2013. [Google Scholar] [CrossRef] [PubMed] [Green Version]
  66. Fraser, J.D.; Proft, T. The bacterial superantigen and superantigen-like proteins. Immunol. Rev. 2008, 225, 226–243. [Google Scholar] [CrossRef]
  67. Hoang, T.; Zhou, C.; Lindgren, J.K.; Galac, M.R.; Corey, B.; Endres, J.E.; Olson, M.E.; Fey, P.D. Transcriptional regulation of icaADBC by both IcaR and TcaR in Staphylococcus epidermidis. J. Bacteriol. 2019, 201, 524. [Google Scholar] [CrossRef] [Green Version]
  68. Gélinas, M.; Museau, L.; Milot, A.; Beauregard, P.B. Cellular adaptation and the importance of the purine biosynthesis pathway during biofilm formation in Gram-positive pathogens. bioRxiv 2020. [Google Scholar] [CrossRef]
Figure 1. The influence of isaA on the growth patterns and autolysis profiles of S. aureus. (a) The ΔisaA mutant and the parental strain SH1000 grown in RPMI medium with similar growth curves. (b) Autolysis curve for both bacterial strains, with autolysis activity expressed as percentage of the respective initial OD600.
Microorganisms 10 01119 g001
Figure 2. Transmission electron microscopy (TEM) images of Staphylococcus aureus. Both wildtype (S. aureus SH1000) and isaA mutant (S. aureus MS001) have intact cell walls. Scale bars: 100 nm.
Microorganisms 10 01119 g002
Figure 3. IsaA gene disruption affects fibronectin/fibrinogen binding. Adhesion of S. aureus ΔisaA mutant and its parental strain SH1000 were examined for the immobilised extracellular matrix proteins fibronectin and fibrinogen. This was quantified as ATP amounts in a luminescence microplate reader. High levels of ATP were detected in the isaA mutant, with the range of 1.3 × 10¹¹ to 2.0 × 10¹¹ mole for fibronectin and fibrinogen. * p ≤ 0.05.
Microorganisms 10 01119 g003
Figure 4. Decreased biofilm formation in isaA mutant compared to wildtype. Quantification of biofilm formation was based on the crystal violet retained by bacterial biofilm. *** p ≤ 0.001.
Microorganisms 10 01119 g004
Figure 5. Proteomics and transcriptomics of the S. aureus wildtype and isaA mutant. (a) Volcano plot of differentially expressed proteins (DEPs). The red dots are proteins with significant differences compared to wildtype. (b) Volcano plot of differentially expressed genes (DEGs). The pink dots represent the significantly upregulated genes, and the green dots indicate genes that have been significantly downregulated in that ΔisaA mutant. (c) Gene Ontology (GO) enrichment analysis by clusterProfiler for those differentially expressed genes. (d) Principal component analysis (PCA) of significant gene and protein expression data. Wildtype samples are shown within the closed circle on the left, while isaA mutant samples are represented by the dots within the closed circle on right. (e) Correlation between DEPs and DEGs.
Microorganisms 10 01119 g005
Figure 6. Heatmap of significance of differentially expressed genes and proteins. Forty genes according to matching between proteomic and transcriptomic datasets were used to generate the heatmap. All of these data were log2 transformed, and red to blue colour represents high to low expression.
Microorganisms 10 01119 g006
Publisher’s Note: MDPI stays neutral with regard to jurisdictional claims in published maps and institutional affiliations.

