Article

Short-Term PE Generation Processes in the Soils of a Farmer Plots Network in the Madagascar Highlands: Actors and Drivers

by
Kanto Razanamalala
1,
Tantely Razafimbelo
1,
Pierre-Alain Maron
2,
Lionel Ranjard
2,
Nicolas Chemidlin Prévost-Bouré
2,
Samuel Dequiedt
2,
Thierry Becquer
3,
Jean Trap
3,
Eric Blanchart
1,3 and
Laetitia Bernard
1,3,*
1
Laboratoire des Radio-Isotopes, Université d’Antananarivo, BP 3383, Route d’Andraisoro, Antananarivo 101, Madagascar
2
Agroécologie, INRAE, AgroSup Dijon, Université Bourgogne Franche-Comté, 21000 Dijon, France
3
Eco&Sols, Institut Agro, Université de Montpellier, IRD, INRAE, CIRAD, 34394 Montpellier, France
*
Author to whom correspondence should be addressed.
Microbiol. Res. 2023, 14(4), 1702-1719; https://doi.org/10.3390/microbiolres14040117
Submission received: 28 September 2023 / Revised: 23 October 2023 / Accepted: 24 October 2023 / Published: 27 October 2023

Abstract

:
Carbon sequestration in agricultural soils, through the accumulation of high-quality organic matter, represents great potential to mitigate climate change and simultaneously improve soil fertility. Such a challenge is particularly important and relevant in developing tropical countries like Madagascar, where soil carbon storage is vulnerable to climatic variations and where fertilization is generally applied through amendments in organic matter of various origins. The priming effect (PE) is considered here as the stimulation of the mineralization of soil organic matter (SOM) by a supply of fresh organic matter (FOM). PE results from different microbial processes driven by specific biotic and abiotic parameters. Depending on the processes involved, it has been suggested that PE could either counteract SOM accumulation or promote it. The objective of the present study was to explore the relationships between certain agricultural practices (type of crop, quality of fertilization, association with trees), the potential intensity of PE, as well as several abiotic (texture, quantity and quality SOM, nutrient enrichment) a1nd biotic (biomass and phylogenetic composition of microbial communities) factors which have been proposed in the literature as specific determinants of the different PE generation mechanisms. The soils for this study come from a network of farms in a commune in the Highlands of Madagascar. The PE, generated by a supply of 13C-enriched wheat straw, could not directly correlate with agricultural treatments. However, several indirect correlations could be found via several specific abiotic and microbial determinants that are discussed in terms of soil fertility restoration.

1. Introduction

CO2 emissions leading to climate change could be mitigated by a 0.4% increase in C sequestration in soil, per year [1]. This C sequestration is of great interest in agricultural fields, enabling at the same time an enhancement in soil fertility. The challenge of agroecology, seen as a sustainable and climate-smart form of agriculture, is therefore to design practices allowing to intensify crop productivity and to increase C storage at the same time. Such a challenge is particularly important in tropical countries where climate changes are projected to occur one to two decades earlier than the global average [2]. Moreover, rainfed agriculture is the main economic activity in tropical developing countries [3] and fertilization is usually applied through organic matter amendments of various local origins.
Microorganisms have a key role in carbon and nutrient cycling in soil [4] and consequently in soil fertility and C storage. Bacterial and fungal diversities are strongly associated to the fate of organic matter in soil [5,6,7,8,9]. The priming effect (PE) is a change in the mineralization rate of soil organic matter (SOM) by microorganisms following an input of fresh organic matter (FOM) (see for review [10]). Positive PE (i.e., stimulation of SOM mineralization) has been proposed to be generated by mainly three different mechanisms: (1) through collateral damages exerted on SOM by extracellular enzymes released by FOM feeders, (2) directly via the co-metabolism of energy-rich FOM catabolites by SOM feeders specific to the decomposition of a more recalcitrant SOM to retrieve nutrients (i.e., “nutrient mining”—NM-PE) [11], and (3) through the release of organic acids by roots, fungi, or bacteria which disorganize the organo-mineral associations and liberate labile OM that were previously chemically protected [12]. All these processes are differently driven by abiotic and biotic variables, and therefore follow different dynamics, sometimes happening simultaneously. For example, Chen et al. [13] have shown that the first (indirect) process that they called “microbial stoichiometric decomposition” (MSD-PE) was fostered by high nitrogen concentration, while NM-PE was fostered by nitrogen depletion. Therefore, in the absence of nutrient input (concomitantly with the fresh carbon input), the MSD-PE should happen first and be followed by the NM-PE after exhaustion of the available nitrogen in the soil solution. The third mechanism, which has been called “abiotically mediated PE” (AM-PE) [10] has mostly been described when generated by plant roots and also corresponds to a plant strategy to acquire nutrients [12,14,15,16]. However, some fungi and bacteria are also able to actively produce organic acids [17,18,19], mainly to solubilize phosphorus when soil solution is depleted. Organic matter can therefore be simultaneously dissociated from minerals [20].
SOM is of a very heterogeneous quality and corresponds to a gradient of decomposition from plant tissues to microbial residues via recalcitrant macromolecules of vegetal origin [21]. Each PE generation mechanism is supposed to target a different pool of this SOM. Some authors have shown that the MSD-PE corresponds to the mineralization of a younger and more labile SOM than the NM-PE [22,23]. AM-PE stimulates the dissociation of mineral associated organic matter (MAOM), releasing mainly microbial residues and labile molecules [21]. All these SOM pools have different average residence times in the soil (plant tissues < recalcitrant macromolecules < MAOM) depending on their biochemical or chemical protection [21,24]. Thus, the various PE-generating mechanisms do not have similar consequences on the fate of organic matter and on the storage and release balance of C in the soil. In the general objective to increase sustainable soil C sequestration, it is better to stimulate the mineralisation of an organic matter with a short residence time rather than a long one. MSD-PE has been proposed as an acceleration of a SOM pool decomposition of vegetal origin, leading not only to CO2 loss by respiration but also to microbial biomass formation, which is the first step for long-term C storage [10,25].
The microbial community composition plays an important role in SOM dynamics [26]. More precisely, many authors have suggested that each PE-generation process should involve different functional guilds of microorganisms [11,13,22,23]. MSD-PE is based on the activity of enzymes (hydrolase-type) released by populations decomposing the labile part of the FOM and which allocate their energy rather than duplicating themselves to acquiring resources [10]. Those can be defined as Y-strategists, if referring to the nomenclature recently proposed by Malik et al. [27], or more commonly as r-strategists [13]. Conversely, NM-PE and AM-PE are driven by populations specialized in the acquisition of resources to the detriment of duplication (A-strategists [27], or more commonly K-strategist [13]). For NM-PE, such populations are characterized by the capacity to produce various specialized enzymes able to break recalcitrant bonds like oxydases. For AM-PE, those are able to release organic acids (citrate, oxalate…) like P-solubilizing bacteria or some ectomycorrhizal fungi [20].
Knowing how agricultural practices can promote long-term sequestration of a nutrient-rich organic matter is of great value for improving agroecosystem productivity, sustainability, resilience, and combating food insecurity in South Countries. In this context, the aim of the present work was to explore how some agricultural practices (fertilization, crops type, agroforestry) can modulate environmental conditions and actors specific to the different PE-generation processes. This study focused on the PE generated in the early stages after the addition of fresh organic matter in order to target as closely as possible the MSD-PE generation window highlighted on these Ferralsols during a previous study [28]. This knowledge will then be able to fuel reflection around the co-construction of innovative practices with farmers in these regions.
Soils were randomly sampled from a network of smallholder fields in a farming region of the Malagasy Highlands. Sampling covered a large variety of cultures (legumes, cereals, tubers, fallow) cultivated as monocultures or associated with trees, non-amended or amended by compost or cattle manure, and belonging to different rotations. Soil physicochemical and biological parameters were characterized. SOM pools targeted by the different PE-generation mechanisms have been assessed by densitometric and size-specific fractionation. Microbial community composition using next generation sequencing techniques on bacterial and fungal ribosomal genes was also determined. Soils were incubated in the presence of 13C-labeled wheat straw and CO2 accumulation corresponding to basal respiration, straw mineralization, and its early induced PE were registered between day 4 and day 7.

2. Materials and Methods

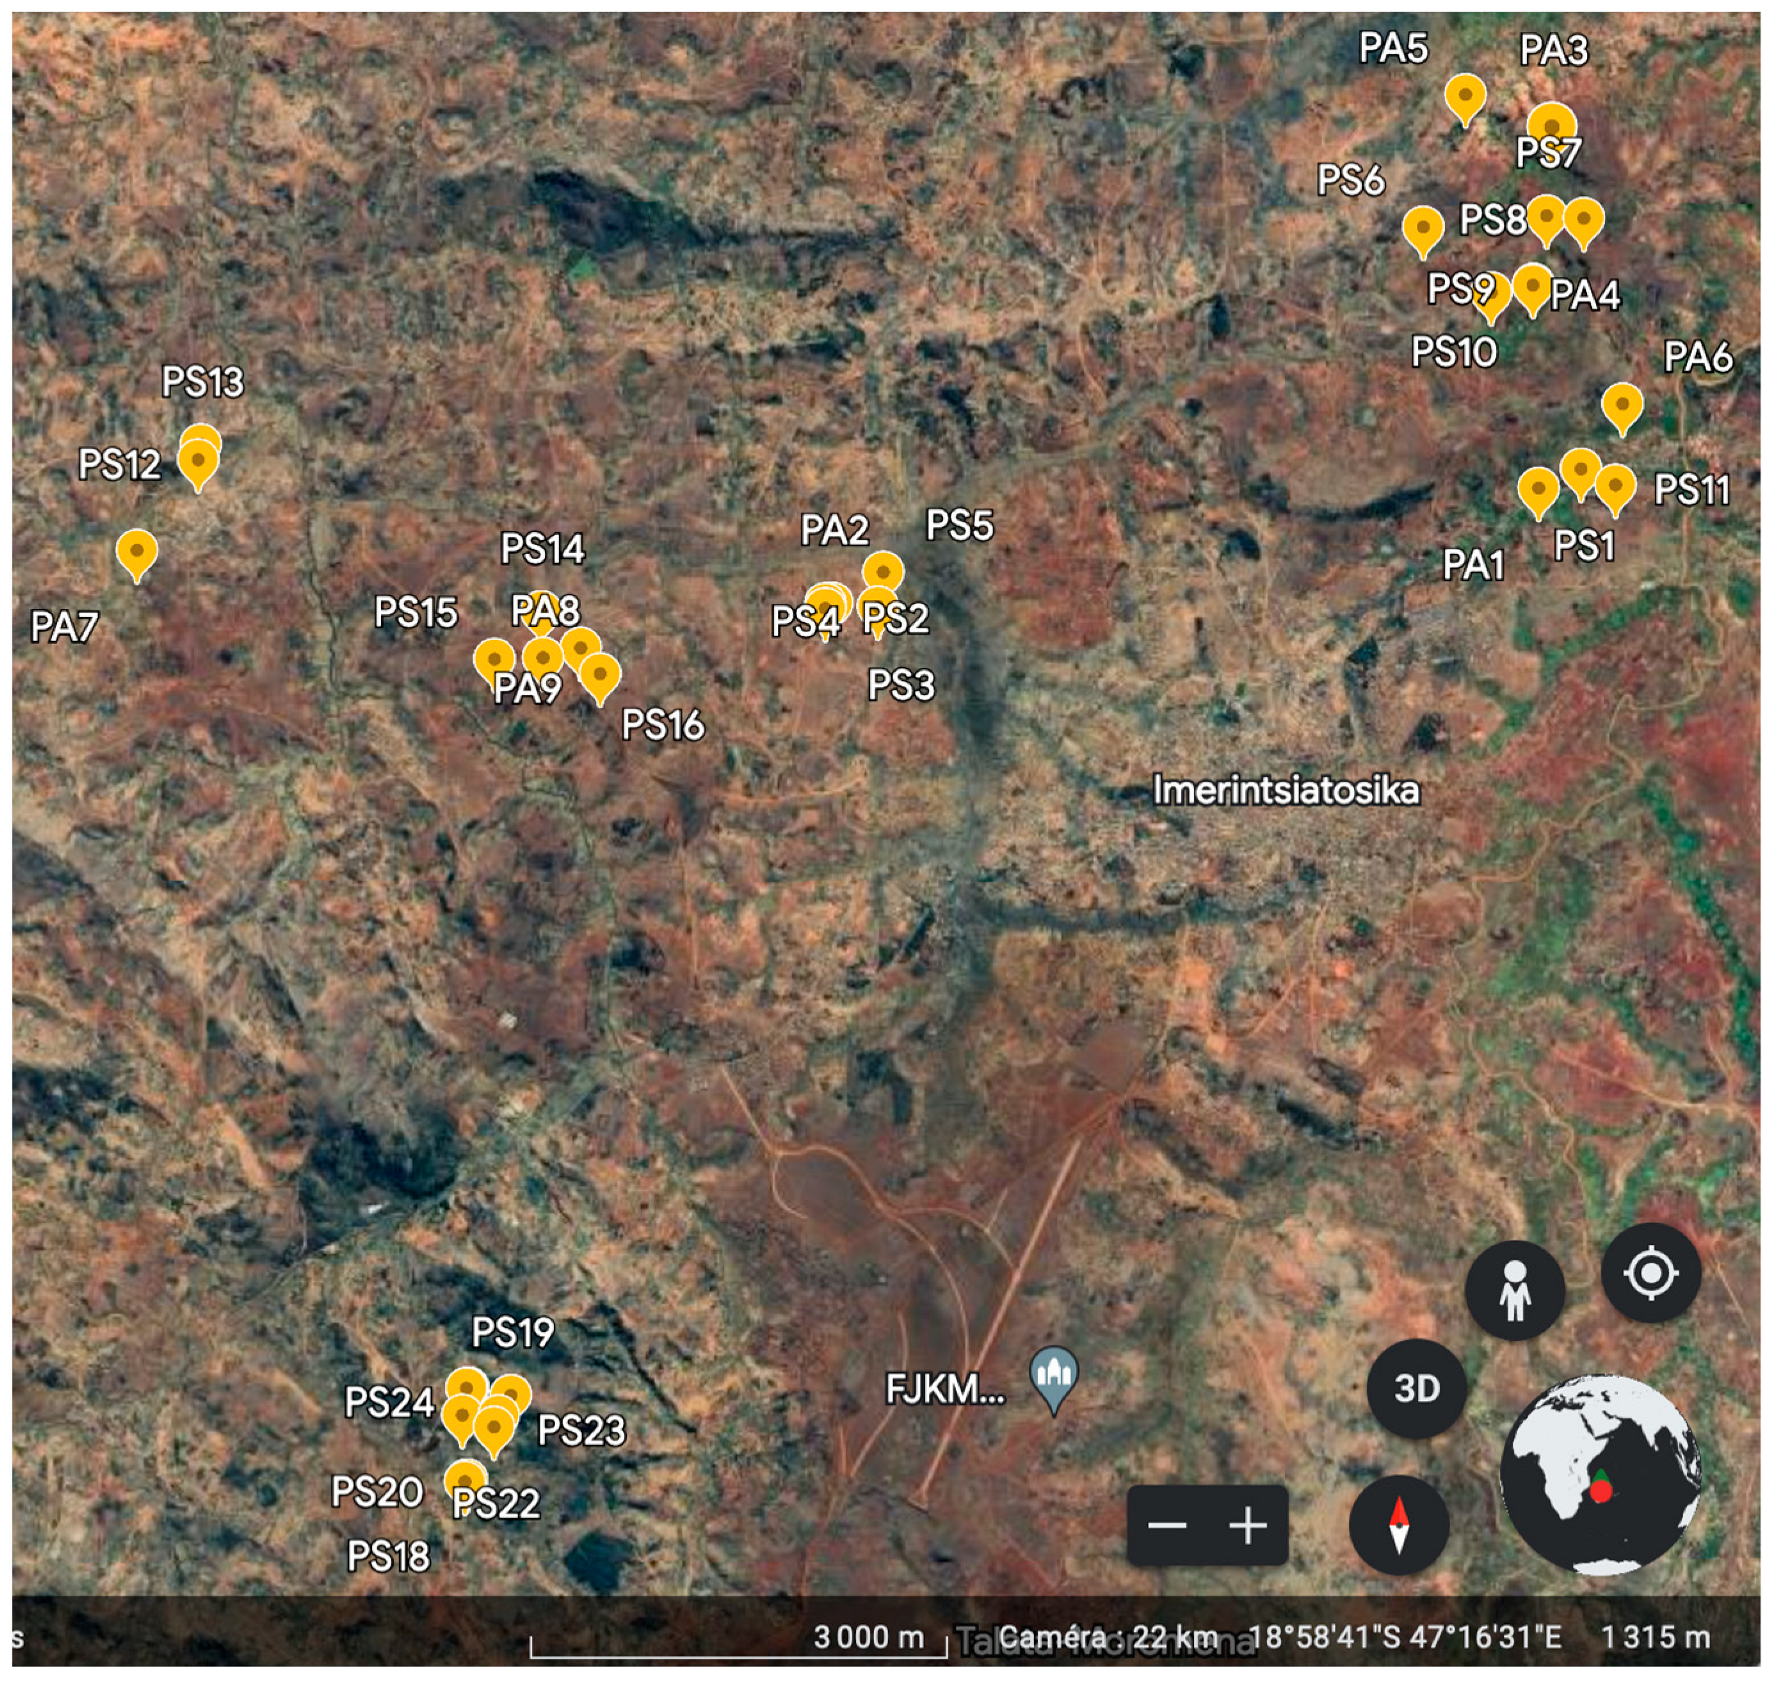
2.1. Soil Sampling Strategy

This study was carried out in the agricultural region of Itasy located in the Highlands of Madagascar, near the municipality of Imerintsiatosika (18°59′00″ S, 47°19′00″ E). This region is characterized by a tropical altitude climate with a mean annual temperature of 18.4 °C and mean annual precipitation of 1319 mm. Hillsides are dominated by Ferralsols, according to the FAO classification [29], and are subjected to a hot rainy season from November to April and a cold dry season from May to October. In April 2015, i.e., at the end of the cropping season, composite soil samples from 33 agricultural plots managed by smallholder famers were taken. Plots were all located in an area of 70 km2. The minimal distance between two agricultural plots was 15 m. All plots were independent from each other, avoiding pseudo-replicates. Sampling plots were presented on a map generated by Google Earth (Figure 1). The precise coordinates are reported in Table S1.
The agricultural plots were located at different topographical levels (bottom hill, slope, downhill) and devoted to different cultures conducted by smallholder farmers during the cropping season and the previous off-season (Table S1a). The plants belonged to three classes of crops (legumes, cereals, and tubers) and fallow. The legume class included green beans (Phaseolus vulgaris), peanuts (Arachis hypogea), green peas (Pisum sativum), and Bambara-bean (Vigna subterranea). The cereal class included rainfed rice (Oryza sativa) and maize (Zea mays). The tuber class included manioc (Manihot esculenta), sweet potato (Ipomoea batatas), and taro (Colocasia esculenta). Nine plots were cultivated in agroforestry with a variety of perennials, including Citrus, Eucalyptus, Pinus, Acacia, Banana, Coffee, Medlar, and Avocado trees. Fertilization was only organic and consisted of one handful of compost or cattle manure per seed hole amended at the time of seedling. All cultivated plots, but not fallow, were submitted to manual tillage.
In each plot, six soil cores, 0–10 cm depth, were sampled using a metallic cylinder. One core was used to measure the soil bulk density and other physicochemical parameters. The remaining five soil cores were pooled, sieved (2 mm), and coarse plant debris were removed. Composite samples were maintained at 4 °C for no more than one week, prior to further fresh soil incubations and analyses.

2.2. Soil Characterization

After sampling, soil samples were physically and chemically characterized at their initial state, before incubation. Soil color was determined as red, yellow, or brown using the Munsell soil color chart. Soil bulk density and water content were measured by weighing fresh and oven-dried bulk soil cores. Particle size distribution was determined by the Robinson pipette method [30]. Clay, silt, and sand classes (Table S1b) corresponded, respectively, to the granulometric fractions of 0–2, 2–50, and 50–2000 µm. Total carbon (Ctot) and nitrogen (Ntot) contents were evaluated by dry combustion in a CHN microanalyser (PerkinElmer Inc., Waltham, MA, USA). Light fraction soil organic matter (LF) and organic particle size fractions (F: 200–2000 µm; F: 50–200 µm; F: 20–50 µm, F < 20 m) were measured following the procedure described by Gavinelli et al. [31]. Soil mineral contents (i.e., kaolinite, gibbsite, and Fe2O3_cbd) were estimated by near infrared reflectance spectroscopy (NIRS), using the model developed for Malagasy Ferralsols by Ramaroson et al. [32].
Soil pH-H2O was measured by suspending soil in water (1:5 ratio). The effective cation exchange capacity (CEC) was determined by suspending soil in a cobaltihexamine chloride solution (100 mg.L−1; 1:10 ratio) at soil pH and measured by flame spectrophotometry [33]. The nitrate and ammonium (NO3 and NH4+) contents, obtained after KCl extraction, were determined by colorimetry according to the Berthelot reaction (NH4+) and the Griess reaction (NO3, after reduction in NO2 on cadmium columns) [34] using an automated continuous flow analyser San++ (Skalar analytique, France). The total P content was determined using perchloric acid attack [35]. The available phosphorus (avP) and microbial phosphorus (MBP) contents were measured using anion exchange resin after a fumigation extraction method [36], adapted from the method of [37].
Microbial C (MBC) and N (MBN) were extracted by fumigation with chloroform and extraction in K2SO4 solution according to the method of [38], adapted by Jenkinson et al. [39]. MBC and MBN contents were measured by TOC/TN analyser.

2.3. Molecular Analyses of Soil Bacterial and Fungal Communities

After field sampling, 50 g of subsamples were maintained at 4 °C for no more than one week, transported to France (Genosol platform, Dijon, France), and lyophilized for further molecular analyses. Microbial DNA was extracted from 1 g of lyophilized soil subsamples using the procedure described in [40].
For prokaryotic (bacterial–archaeal) diversity, a fragment of 440 bases of the gene coding for the 16S subunit of the ribosomal RNA was amplified from each DNA sample (5 ng) with the corresponding primers: F479 (5′-CAG CMG CYG CNG TAA NAC-3′) and R888 (5′-CCG YCA ATT CMT TTR AGT-3′), as previously described [41]. For each sample, 5 ng of DNA were used for a 25 µL polymerase chain reaction (PCR) conducted under the following conditions: 94 °C for 2 min, 35 cycles of 30 s at 94 °C, 52 °C for 30 s, and 72 °C for 1 min, followed by 7 min at 72 °C. For fungal diversity, a 350-base 18S rRNA fragment was amplified from each DNA sample (5 ng) with the corresponding primers: FF390 (5′-CGA TAA CGA ACG AGA CCT-3′) and FR1 (5′-ANC CAT TCA ATC GGT ANT-3′) [42]. For each sample, 5 ng of DNA were used for a 25 µL PCR conducted under the following conditions: 94 °C for 3 min, 35 cycles of 30 s at 94 °C, 52 °C for 1 min, and 72 °C for 1 min, followed by 5 min at 72 °C. All PCR products were purified using the Agencourt® AMPure® XP kit (Beckman Coulter, Milano, Italy) and quantified with the Quantifluor (Promega, Lyon, France) staining kit according to the manufacturer’s instructions. A second PCR was performed with the purified PCR products, with 10 bp multiplex identifiers added to the 5′ end of the primers for the specific identification of each sample and the prevention of PCR biases.
For bacteria and archaea, the second PCR conditions were the same as previously described but with only seven cycles. For fungi, the second PCR conditions were optimized, with the number of cycles being reduced to seven and the denaturation step processed at 94 °C for 1 min. PCR products were purified with the MinElute gel extraction kit (Qiagen NV) and quantified with the Quantifluor (Promega, Lyon, France) staining kit according to the manufacturer’s instructions. Equal amounts of each sample were pooled and then cleaned with the SPRI (Solid Phase Reverse Immobilization Method) using the Agencourt® AMPure® XP kit (Beckman Coulter, Milano, Italy). The pool was finally sequenced with a MiSeq Illumina instrument (Illumina Inc., San Diego, CA, USA) operating with V3 chemistry and producing 300 bp paired reads.
Bioinformatic analyses were performed using the BIOCOM-PIPE, which was initially developed by the Genosol platform (INRAE, Dijon, France), to identify bacterial and fungal taxonomic groups. The methodology followed is fully described in [43]. In order to compare the data sets efficiently and avoid biased community comparisons, the sample reads were reduced by random selection close to the lowest data sets (3000 reads for 16 S- and 18 S-rRNA gene sequences, respectively, for each soil sample). The retained high-quality reads were used for taxonomy-based analysis using similarity approaches and dedicated reference databases from SILVA. Richness and diversity indexes (number of operational taxonomic units (OTUs), 1/Simpson and Evenness indices) were determined at a dissimilarity threshold of 5%. DNA sequences were deposited in the European Nucleotide Archive, under the study accession number PRJEB19977.

2.4. Soil Microcosm Set-Up for CO2 Measurements

To assess the potential capacity of microbial communities to mineralize native (SOM) and fresh organic matter (FOM) at a similar temperature of 27 °C, fresh composite soil samples were used to fill two sets of 150 mL flasks with 10 g of equivalent dry soil. The soil water content was adjusted to 70% of the field capacity using sterile deionized water. Both sets were pre-incubated for 7 days at 27 °C in the dark. Then, one of the microcosm sets was amended with a 7% 13C-enriched powdered wheat straw (obtained by continuous labelling) characterized by a C:N:P ratio of 108:4:1 (4 mg straw.g−1 of dry soil); the other set was not amended, but soil was mixed like in the amended condition. Both sets of microcosms were then incubated (opened) at 27 °C in the dark for 4 days. Since the microcosms were left open, the soil water content was controlled daily and adjusted with sterile deionized water to prevent variation in soil moisture. After 4 days, the microcosms were flushed with air to renew the atmosphere and were hermetically sealed for 3 more days before total CO2 measurements and gas sampling for 13CO2 analyses.
The total atmospheric CO2 concentration was measured in all microcosms by Gas Chromatography using a micro-GC (CP-4900, Varian, Middelburg, The Netherlands). After CO2 measurement, a 5 mL volume of the gaseous phase, of the straw-amended microcosms, was sampled in Exatainer evacuated tubes for further determination of carbon isotopic abundances using isotope ratio mass spectrometry (IRMS) [44]. Three samples of atmospheric gas from the laboratory room were also taken at the time of microcosm sealing in order to remove the 13CO2 of the room atmosphere from the calculation. PE was calculated as follows:
PE = total measured CO2 of the straw-amended microcosm—straw-derived CO2 (calculated from the 13CO2 atomic percentage)—total CO2 measured in the non-amended microcosm (i.e., Basal respiration).

2.5. Statistics

Pearson correlations between the relative sequence densities of bacterial and fungal phyla or families into initial soil samples and C-mineralization activities (basal respiration: BR; straw mineralization: SM; priming effect: PE) were calculated using XLSTAT software (Addinsoft, Bordeaux, France). Significance of correlations was tested at p-value < 0.01, 0.05, and 0.1. Phylogenetic groups not correlated to any C-mineralization activity were eliminated for further correlation analysis.
Pearson correlations between all biotic (including phylogenetic groups previously selected), edaphic, and activity variables were calculated. Agricultural practices were introduced into the analysis as supplementary quantitative variables.
Edaphic, biotic, and activity variables were also used to build up a principal component analysis (PCA).

3. Results

3.1. Soil Characteristics

Data of soil edaphic parameters and the main statistics are detailed in Table S1b. The soil bulk density (BD) ranged between 0.8 and 1.47 g dry soil.cm−3. Soil texture was highly variable, as clays represented between 43 and 75% of soil minerals. The predicted amounts of gibbsite, iron oxides, and kaolinite ranged between 76 and 524 g.kg−1 dry soil, 13 and 63 g.kg−1 dry soil and 182 and 568 g.kg−1 dry soil, respectively. Soils were acidic (pH from 4.6 to 5.8), with a cation exchange capacity (CEC) ranging between 0.72 and 2.89 cmol+.kg−1 soil. In those acidic soils, total soil carbon (Ctot) was mostly under its organic form (SOC) and ranged from 10 to 28 g C.kg−1 of soil, with a C:N ratio comprised between 14 and 24. Density and granulometric fractionation of organic matter led to a light fraction (OM-LF) ranging from 0.15 to 6.71 mgC.g−1 soil and four heavy fractions of size comprised between 200–2000, 50–200, 20–50, and 0–20 µm ranging from, respectively, 0.02 to 0.46, 0.29 to 6.92, 0.34 to 3.16, and 8.13 to 24.96 mgC.g−1 soil.
Mineral nitrogen contents varied between 1.2 and 22.52 mg.kg−1 soil for NH4+ and between 0.25 and 10.86 mg.kg−1 of soil for NO3. The total phosphorus varied between 300 and 1800 mg P.kg−1 of soil, while its available form (avP) was less than 6.43 mg.kg−1 of soil.

3.2. Microbial Community Properties

Contents of microbial biomass C, N, and P (MBC, MBN, and MBP) were highly variable and MBC accounted for 0.5% on average and no more than 1.2% of the SOC (Table S1c), as well as microbial C/N ranging from 3 to 10. Bacterial richness, with a number of OTU (95% similarity threshold) ranging from 1127 to 2100, was less variable than fungal richness (235 to 1377 OTU). Sequences affiliated with the different bacterial or fungal phyla, subgroups, and families have been expressed as number of sequences, considering that total sequences obtained was set to 10,000 after the rarefying step. Bacterial communities were dominated by Proteobacteria (26% of total bacterial sequence in average), and more specifically by the α-Proteobacteria (10%). Acidobacteria were the second most represented bacterial phylum (23%), with almost all sequences belonging to the GP1 (21% of total bacterial sequences). Fungal communities were mainly shared between Ascomycota (35% of total sequences) and Basidiomycota (23% of total sequences). Bacterial and fungal sequences which could not be affiliated accounted for 12 and 26%, respectively.

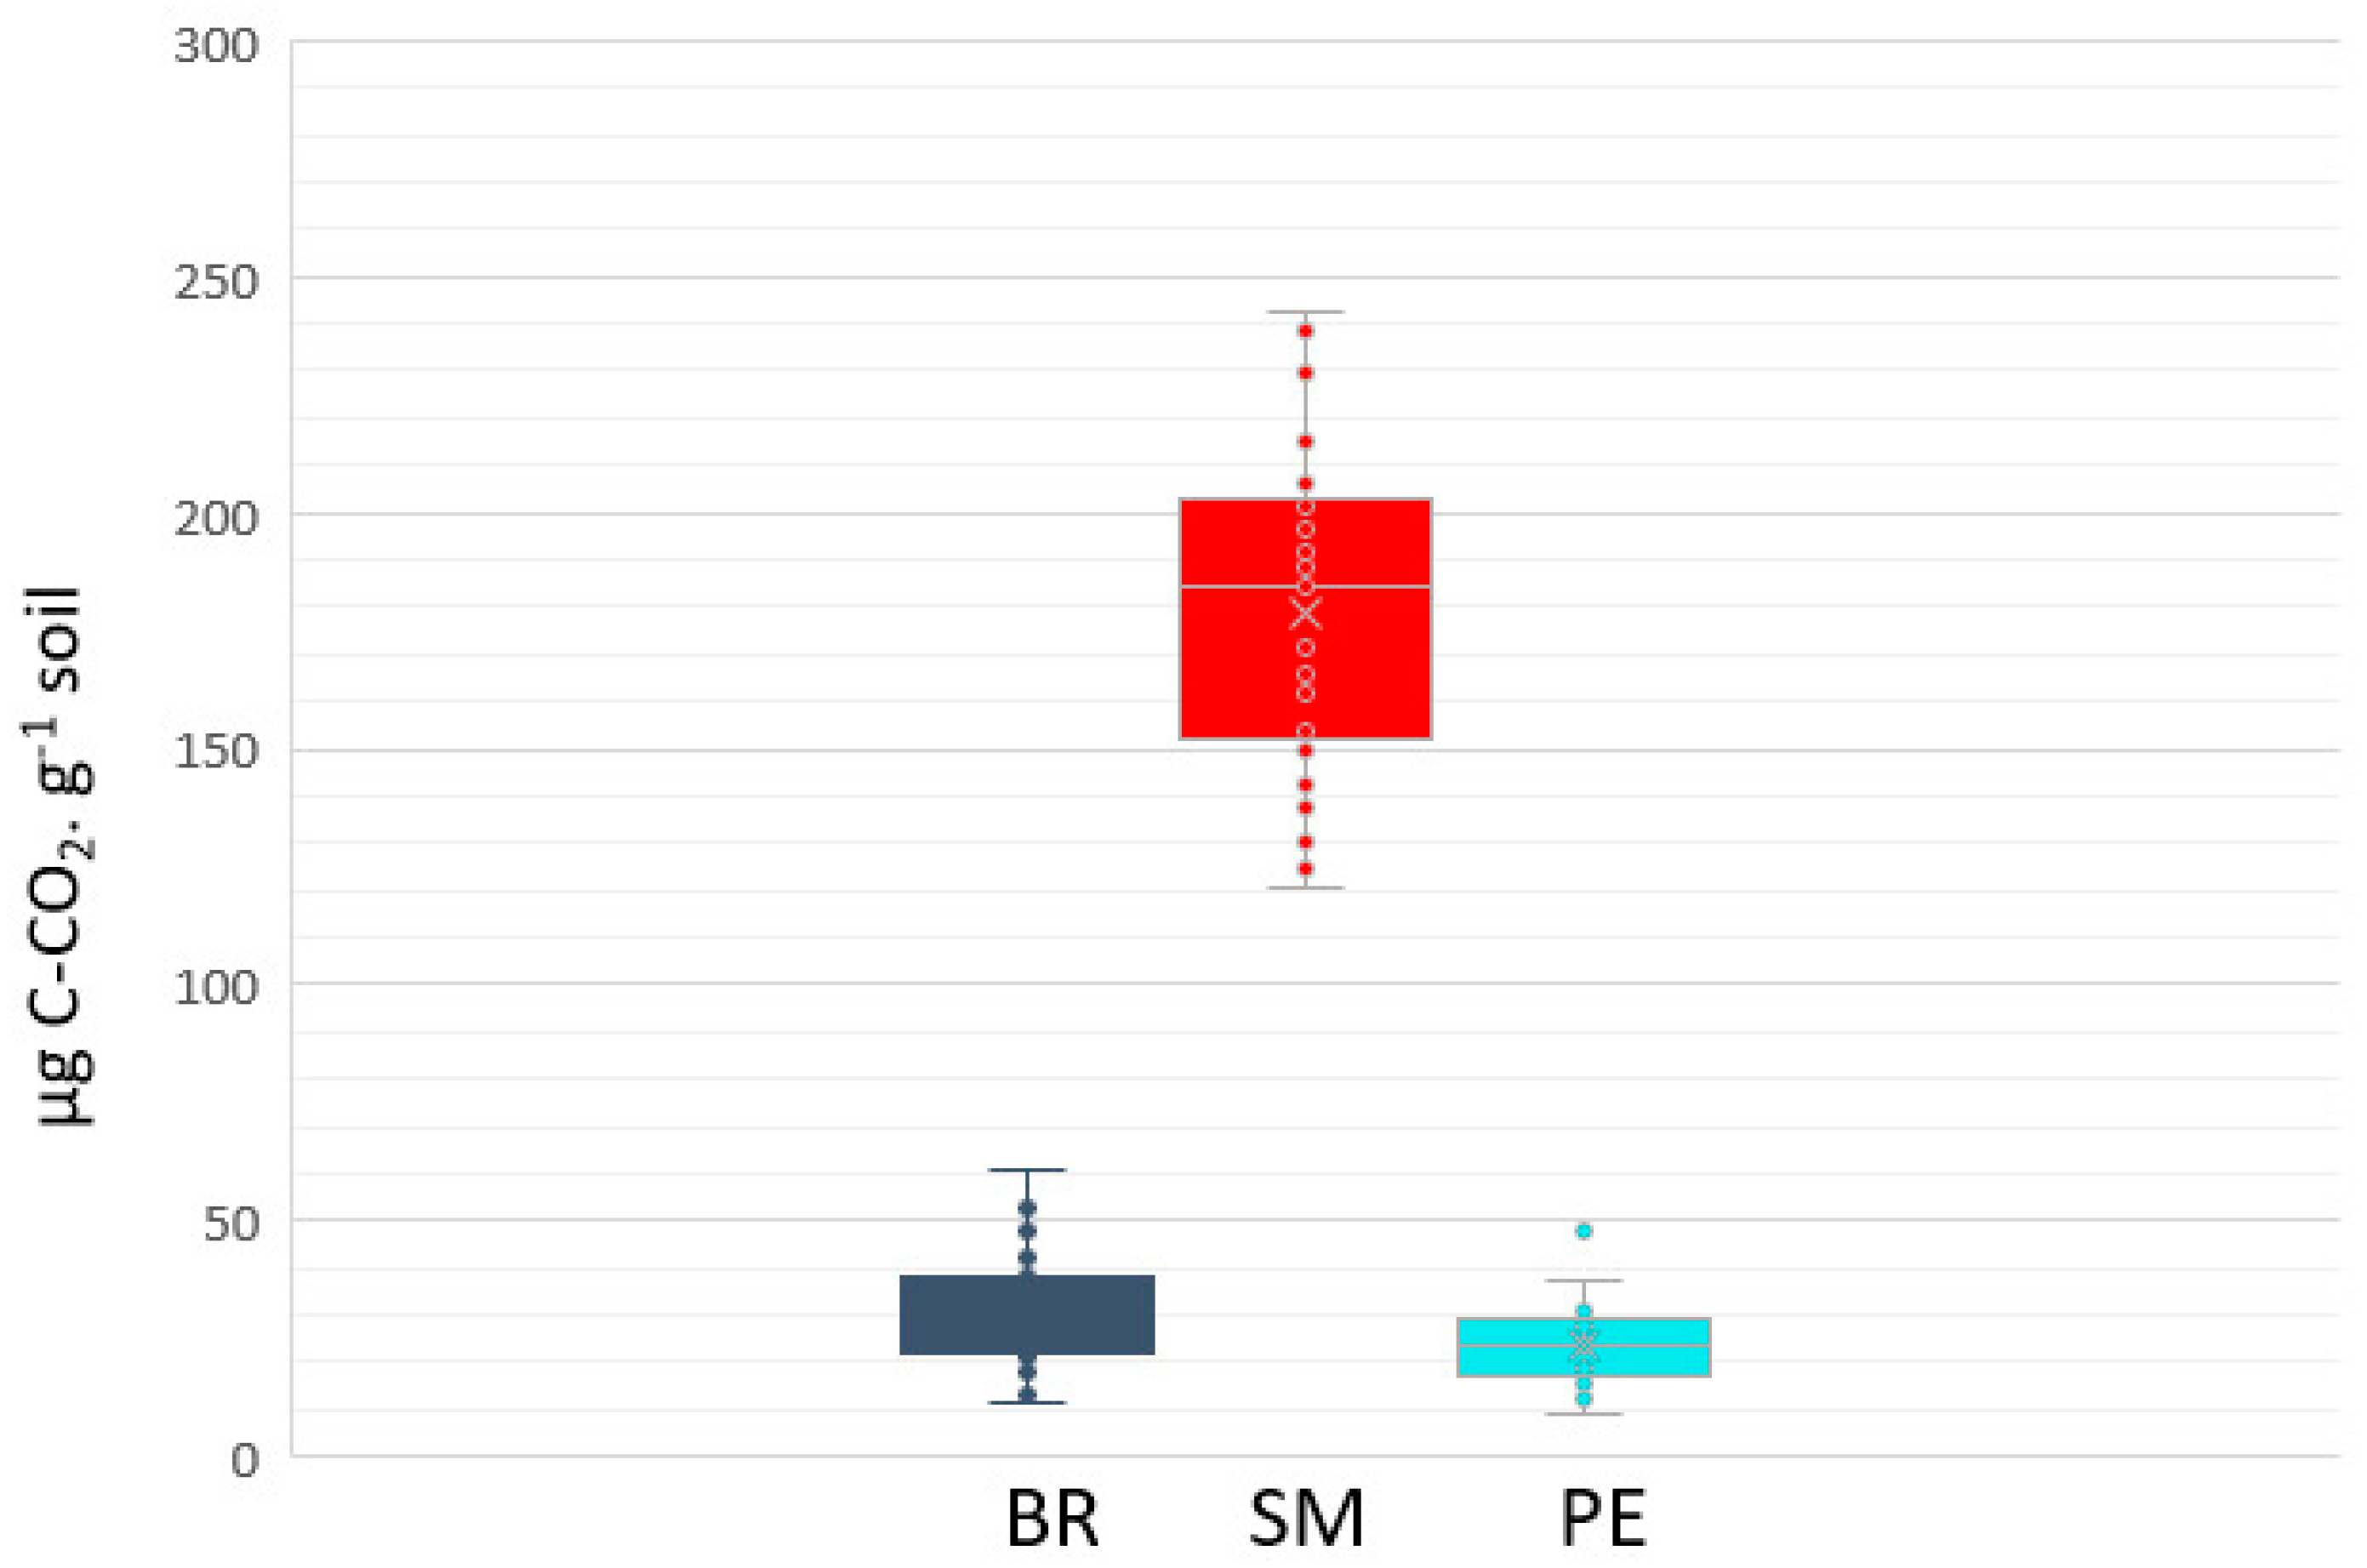
3.3. Potential Mineralization Activities

C released by soil basal respiration between day 4 and day 7 of the incubation (BR) ranged between 11 and 61 µg C-CO2.g−1 of soil (Figure 2). During the same time, C released by wheat straw mineralization (SM) ranged between 120 and 243 µg C-CO2.g−1 of soil. Deduced priming effect rate (PE) ranged from 9 to 48 µg C-CO2.g−1 of soil, which represented from 18 to 205% of BR and from 7 to 29% of SM.

3.4. Links between Agricultural, Edaphic, Biotic Soil Parameters and C-Cycling Activities

Table S2 regroups the Pearson correlation coefficients between all measured variables two by two. The following sections will highlight some specific part of this correlation matrix.

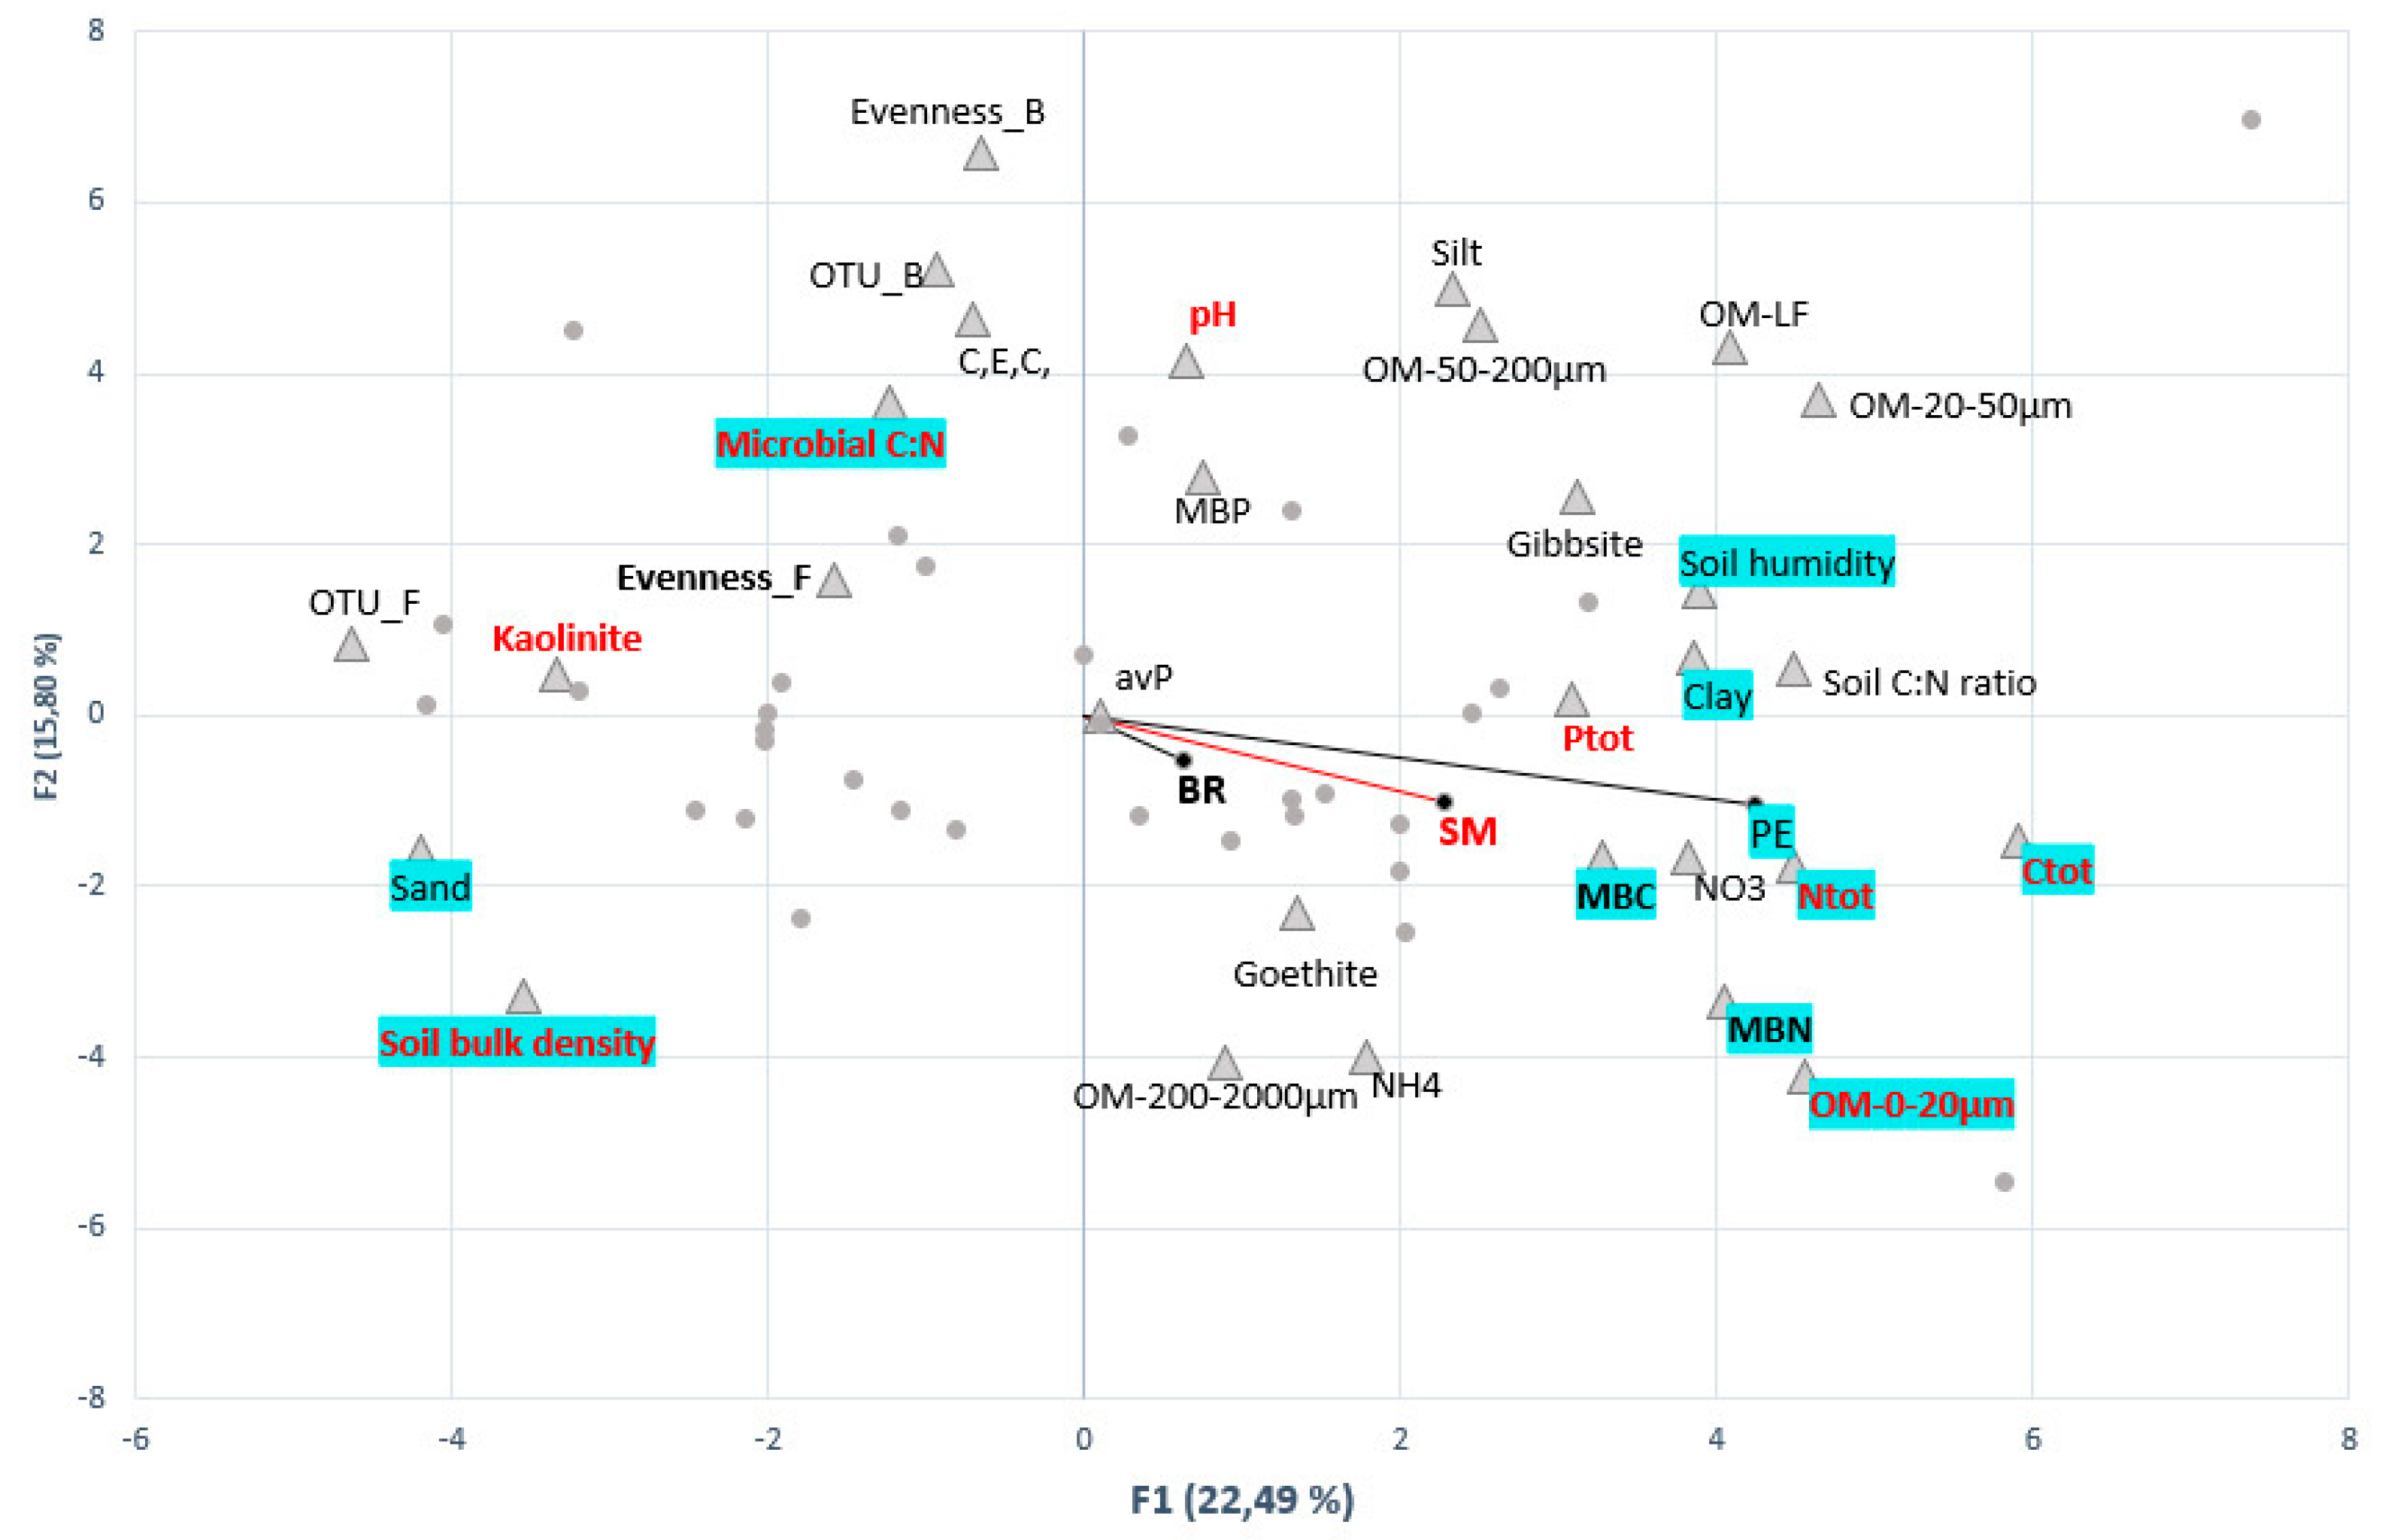
3.4.1. Biotic and Abiotic Drivers of C-Mineralization Activities

A PCA has been built using correlations between soil biotic and abiotic variables and C-mineralization activities (Figure 3). BR was positively correlated to the SBD (0.34) and to the MBC (0.52), and negatively to the fungal evenness (−0.62). SM was positively correlated to the soil humidity at sampling time (0.33), the total soil C (0.38), N (0.42), and P (0.36), the 0–20 µm OM fraction (0.40). SM was negatively correlated to soil bulk density (−0.48), kaolinite content (−0.36), pH (−0.38), and microbial C:N (−0.49).
PE was positively correlated to SM (but not to BR) and both shared a similar relationship with Ctot, Ntot, 0–20 µm OM fraction, soil humidity at sampling time, and SBD. But, PE was also specifically corelated to MBN (0.71) and Clay content (0.64).

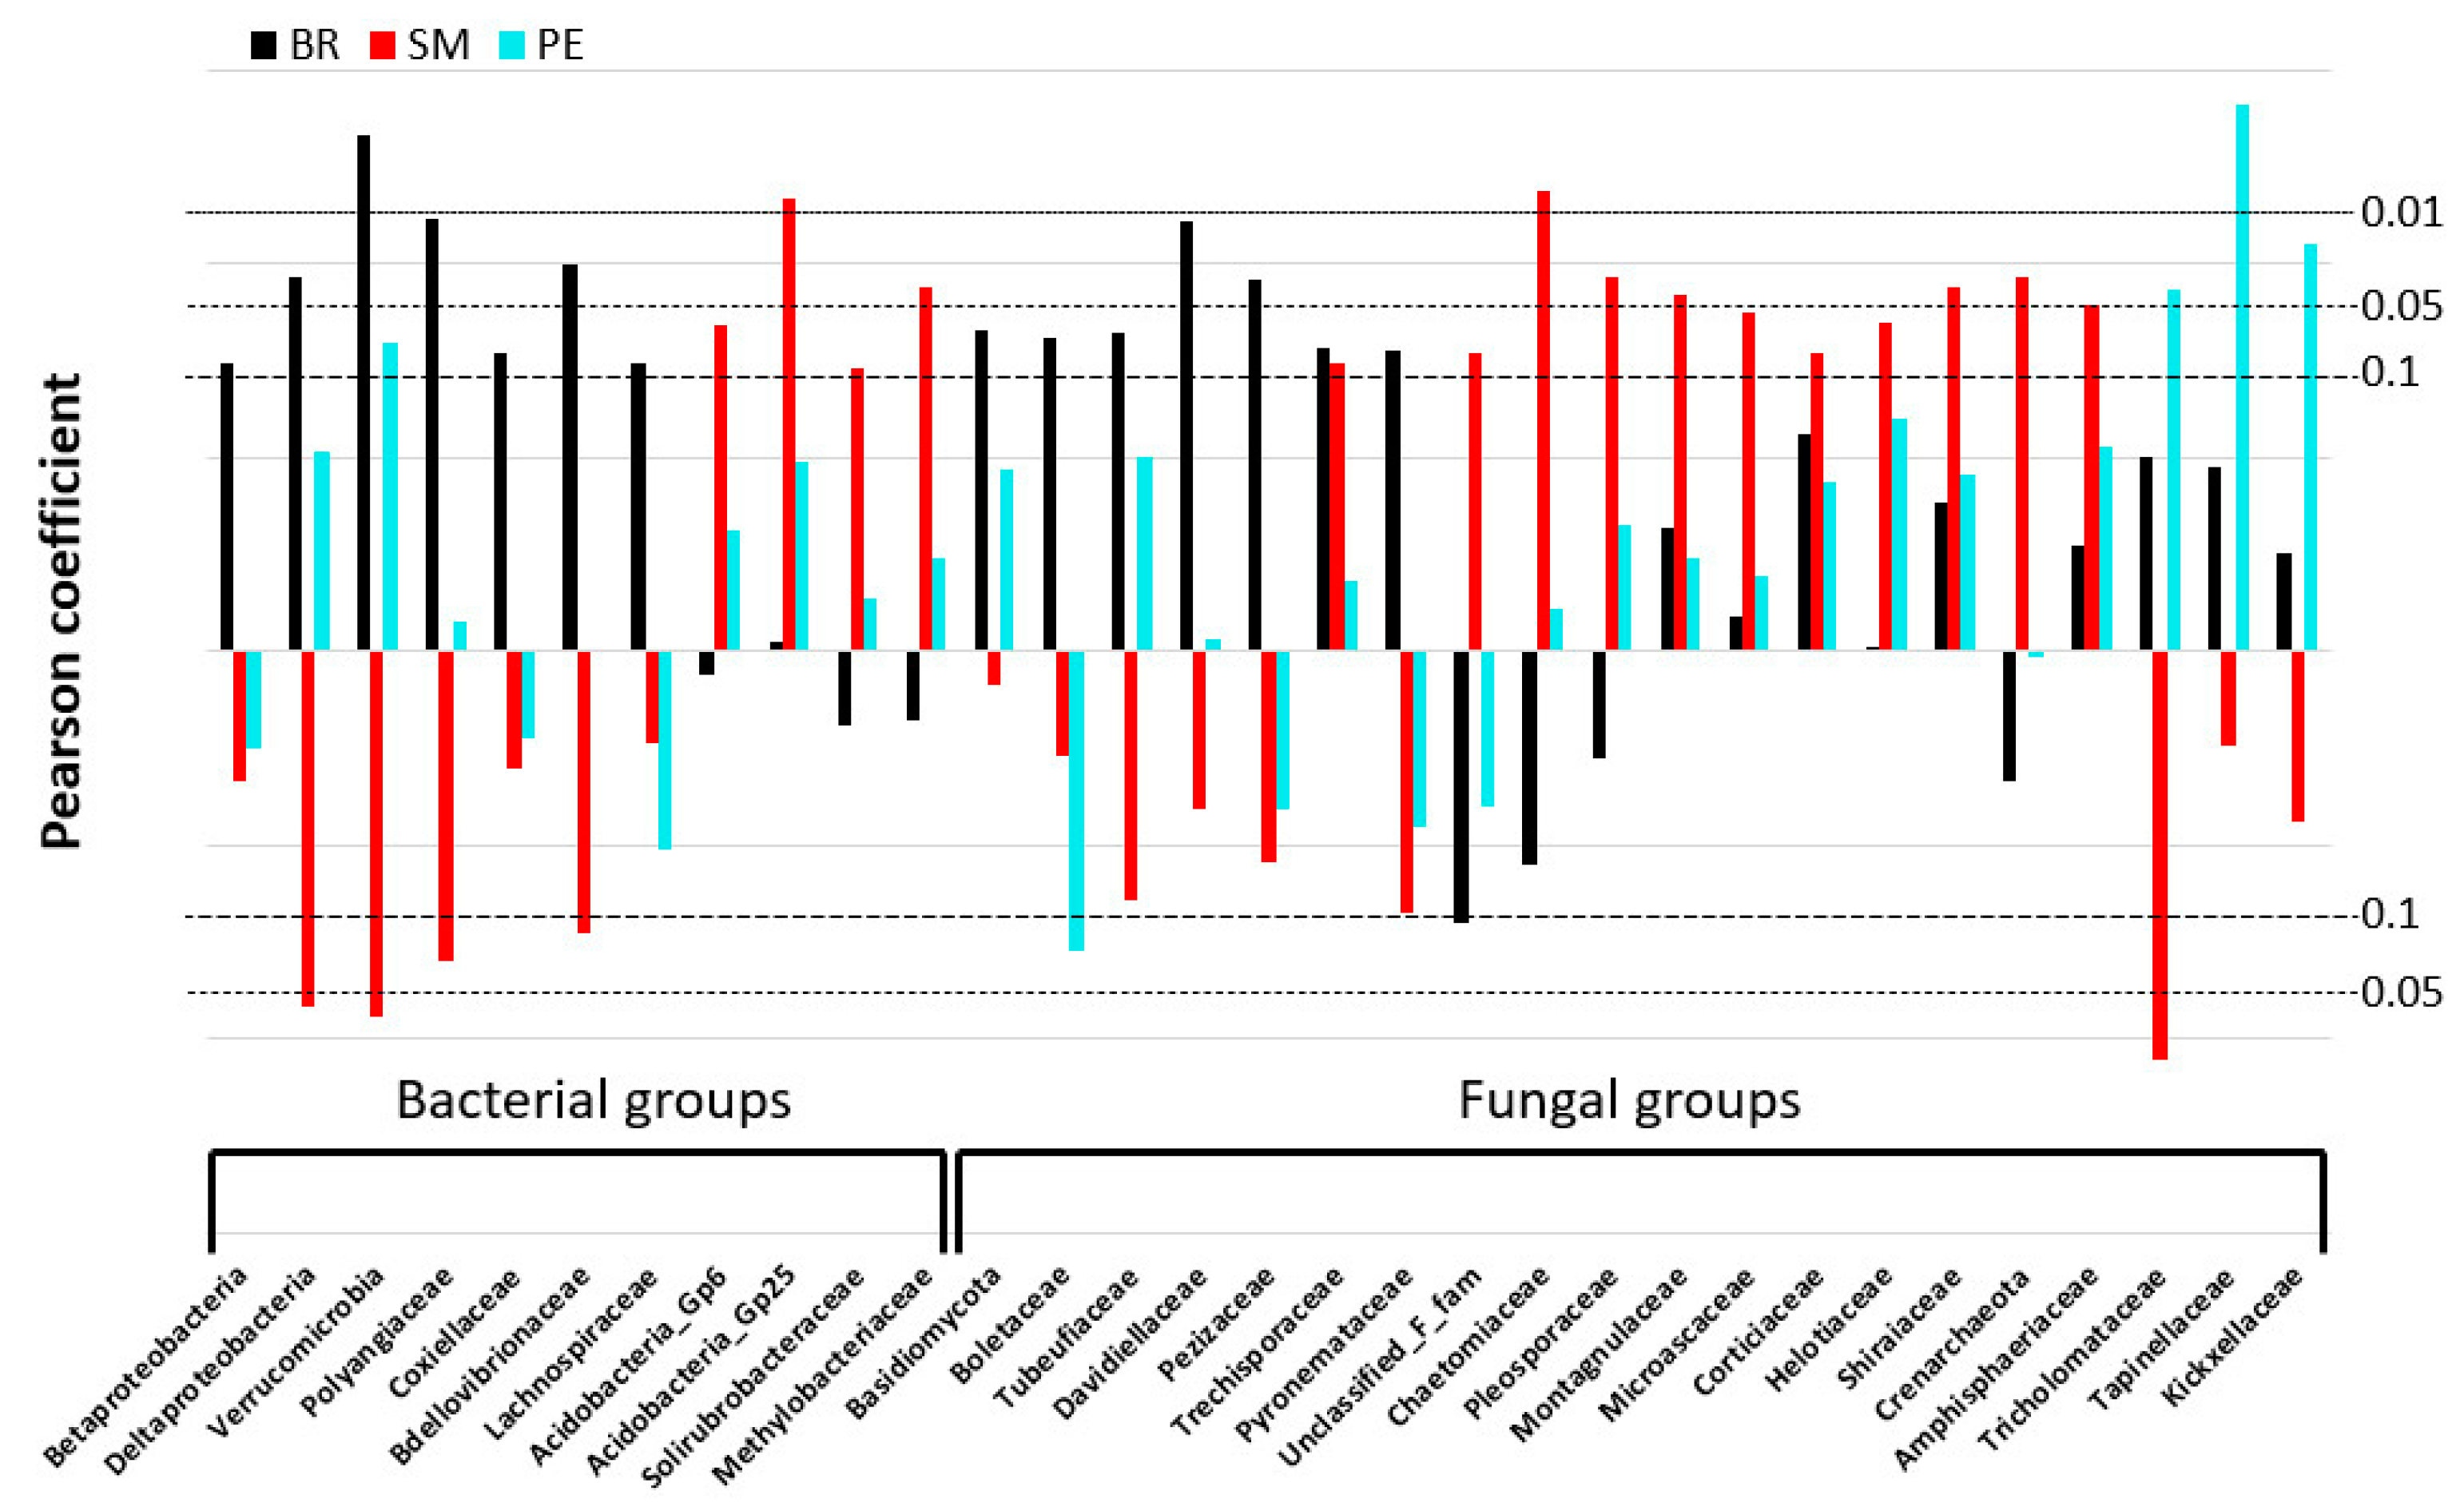
3.4.2. Microbial Populations Linked to C-mineralization Activities

Eight bacterial and twenty fungal phylogenetic groups (phylum, class, or families) were correlated to each potential C-mineralization activity (BR, SM, and PE—Figure 4). Sequences correlated to BR represented 19% of total bacterial and fungal sequences, against 18% for SM and only 1.8% for PE. Some of them did significantly correlate to more than one activity, both positively (Trechisporaceae: BR and SM), or one positively and one negatively (Deltaproteobacteria and Polyangiaceae: +BR and −SM). The Verrucomicrobia is the only phylogenetic group which significantly correlated to all three activities (+BR, +PE, −SM).

3.4.3. Determinants of Microbial Functional Groups

Abiotic and biotic variables correlated to the phylogenetic groups previously selected (linked to BR, SM, or PE), are presented in Table 1. Data were extracted from Table S2. Basically, phylogenetic groups related to BR did negatively correlate to SOM and nitrate content, to soil humidity, and Gibbsite, while positively to SBD, pH, and CEC. From a biotic point of view, they did positively correlate to total MBC, C:Nmic and negatively to fungal evenness. Phylogenetic groups related to SM did positively correlate to SOM and specifically to its finest fraction, and from a biotic point, those groups are positively linked to the number of bacterial and fungal OTU. The few phylogenetic groups linked to PE did positively correlate to coarse fractions of SOM (200–2000 µm and 50–200 µm), and to NH4. From a biotic point of view, they did positively correlate to microbial biomass but negatively to fungal and bacterial evenness.

3.4.4. Influence of Agricultural Practices on Soil Characteristics and C-Mineralization Processes

The different correlations between biotic, abiotic variables, and phylogenetic groups with agricultural practices are presented in Table 2. No agricultural practice significantly correlated to any C-mineralization activities. Biotic and abiotic variables did correlate to cultures as well as fertilization. Soil humidity and pH depended more on off-season practices, while all the others from practices applied in the last season. Compost fertilization showed highly significant positive correlations, especially with 0–20 µm and 200–2000 µm OM fractions, NH4+, and MBN. The 200–2000 µm OM fraction did also positively correlate to legume cropping and to the number of trees in the parcel. Bacterial phylogenetic groups linked to C-mineralizations were mainly correlated to off-season cultures, except for the Verrucomicrobia, which did positively correlate to the compost fertilization during the season. Fungal phylogenetic groups linked to BR or SM did correlate to cereal or legumes from the season or off-season, depending on the group. Fallow did positively correlate only to groups linked to BR. Groups linked to PE did only positively correlate to legumes during cropping season.

4. Discussion

4.1. C-Cycling Activities in Agricultural Ferralsols

All three C-cycling activities were in the same range as those measured in savanna soils [28]. In the present agricultural context, BR was mainly driven by microbial biomass (mostly on its C content) and the fungal evenness, suggesting that its variations were mainly due to the fluctuation of specific fungal populations (Table S2Figure 3). As for savannas, SM was negatively driven by pH. The fact that SM was positively linked to the organic matter content and especially to the finest fraction and to the humidity of soil at the time of sampling suggests a preponderant role for extracellular enzymes in its mineralization, and some of them may be already present in soils [45]. As SM was not correlated to the whole microbial biomass, we can hypothesize that its variations were mostly limited by the release of specialized enzymes by restricted populations.
As for BR, PE depended mostly on the whole microbial biomass but probably more specifically on the bacterial part (MBN), as bacterial biomass is characterized by lower C:N. Early-stage PE may be the result of the microbial biomass turnover feeding on the newly amended FOM, referred to as “apparent PE”, and/or an acceleration of non-living SOM mineralization generated by fast-growing populations, which is the real PE we wish to investigate here [46]. Our experimental design does not allow us to directly discriminate each one by differences in 13C signatures. Therefore, we started accumulating CO2 on day 4 assuming that most of the biomass of the fast-growing microbial populations would have already been renewed. The fact that straw-derived CO2 (SM), liberated between day 4 and day 7, accounted for 3 to 15 times the total microbial biomass C measured in each soil sample tends to corroborate our assumption (Table S1).
Early-stage PE was strongly correlated to SM, and like SM, to the finest fraction of organic matter and the humidity of the soil at the time of sampling. As PE did slightly positively correlate to an available form of mineral nitrogen (NO3−), it could have been, at least partly, generated by stoichiometric decomposition [13]. PE was also strongly linked to the soil clay and gibbsite content (while not SM), suggesting that dissociation of MAOM could also be implicated in its generation (Figure 3). As Ferralsols are always strongly depleted in available PO43− [47], organic acids, they could have been released during the wheat straw decomposition, and dissociated some SOM components from the minerals, to the benefit of the microbes, and mainly bacteria. It is logically preferable to stimulate the mineralization of a young OM pool, which in any case was transient in the kinetics of decomposition. However, stimulating the mineralization of a pool with slow turnover could be akin to destocking C. Of course, things are not so simple. Actually, a small part of the MAOM can be more dynamic than previously thought [10] due, for example, to weaker chemical bounds associated with the replacement of the freshly dissociated OM by the microbial necromass generated during straw decomposition (“entombing effect” [48]). More investigation has to be done on the consequences of this process on the balance between C storage and loss through the atmosphere.

4.2. Microbial Actors of C Dynamic in Agricultural Ferralsols

In natural savanna soils, all C mineralization activities (BR, SM, and PE) are mainly related to the bacterial community composition of the pristine soil [28]. Conversely, in the agricultural soils of the present study, fungal population composition appeared to play a higher role in all three C mineralization processes compared to the bacterial ones (Figure 4). This can be explained by the stability of natural ecosystems compared to highly disturbed agricultural soils undergoing changes in culture, management, and fertilization quality every season and off-season. Actually, extracted DNA integrates more the system history than the actual conditions for several ecologic reasons [49], but also because free DNA has the property to be highly protected from decomposition by clay minerals [50]. The analysis of the composition of the microbial communities at the end of the incubation time would perhaps have made it possible to highlight the dynamics of the active populations. However, as high-throughput sequencing is not a quantitative approach, the analysis of the differential in proportion of specific genes between the end and the beginning of incubation would have mainly highlighted fast-growing species. Indeed, this strategy would not have made it possible to discriminate between the populations, which preferentially allocate their energy to the acquisition of substrates rather than to splitting from the non-active populations. However, substrate acquisitors are of great importance in the various mechanisms of PE generation. Therefore, we preferred to examine the correlations between potential fluxes (recorded over a short period of 7 days) and the proportions of taxa on the original soil microbial communities.
As expected from the precedent section, fungal and bacterial phylogenetic groups associated to basal respiration appeared to be functionally diversified (Table 1), as they covered phyla characterized by strong decomposition capacities like the Basidiomycota [51] to groups known to have more opportunistic behaviors, like some from the Firmicutes or the Gamma-proteobacteria [52]. Fungal families could correspond to key actors in the decomposition of SOM, driving early steps of SOM decomposition by releasing specialized enzymes, and sharing the decomposition products with other members of the community that have complementary catalytic capacities. For example, the Deltaproteobacteria and especially the Polyangiaceae are known to degrade cellulose [53]. Finally, the whole microbial compartment respiration seemed to benefit from the decomposer’s activities, as BR was positively correlated to MBC. We have seen in the previous section that BR was positively linked to SBD but neither directly to the organic matter content or quality nor to the soil texture. Our results suggest that it is because some key fungal (Tubeufiaceae, Davidiellaceae, and Pyronemataceae) and bacterial decomposers (Polyangiaceae and Verrucomicrobia) were also favored by such field conditions.
Wheat straw mineralization correlated to unclassified fungal families, saprophytic fungi, and early decomposers such as the Corticiaceae and many other Ascomycota families like the Chaetomiaceae, Pleosporaceae, Montagnulaceae, Helotiaceae, and Shiraiaceae [54]. Ascomycota are known to prefer higher litter quality (nutrient-enriched) than other fungi like Basidiomycota [55]. Their activity may have been boosted by the supply of wheat straw, which had a relatively low C:N of 27. Most of those phylogenetic groups appeared to be associated with the finest fraction of the SOM, conversely to those correlated to BR. This is quite surprising, as fungi would rather be associated to coarser OM fractions with a vegetal signature. But, as the finest OM fraction is the richest in N and P, it can be easy to consider that those populations can meet their nutrient requirement by extraction from this compartment. As the wheat we added was in a powder form, we can conceive that those hyphal-shaped organisms could have easily accessed both types of substrates simultaneously [56]. As for BR, some bacterial groups appeared to be associated to fungal activities: two Acidobacterial groups (GP6 and 25), usually considered as oligotrophic organisms [57]; the Solirubrobacteraceae from the Actinobacteria phylum, known to be favored in highly disturbed agricultural systems [58]; and the Methylobacteriaceae, able to grow on one-C compounds [59]. Those families could have also benefited from the decomposition activities of fungi on the labelled straw and participated in the mineralization of small labelled catabolites.
PE correlated to three fungal families (Tricholomataceae, Tapinellaceae, and Kickxellaceae) and the bacterial Verrucomicrobia phylum only, representing no more than 1.8% of total microbial sequences. The cellulolytic Tricholomataceae [60], and the oligotrophic Verrucomicrobia [61], were strongly correlated together (Pearson Coefficient of 0.63) and appeared to be associated with the 200–2000 µm OM fraction and both were limited by NH4+. The Verrucomicrobia were also correlated to BR. This reinforces the precedent suggestion that a part of this PE could have been generated by the action of enzymes, liberated by straw decomposers, on a SOM fraction still having a vegetal signature, therefore helping some SOM decomposer populations usually participating in BR (i.e., MSD-PE–[13]).

4.3. How Agricultural System Components Drive C-Cycling Activities?

None of the agricultural drivers (culture types, amendment, rotations) included in the present study showed a direct and significant effect on any of the three C-cycling activities concerned. This can easily be explained by the fact that mineralization activities integrate several components: (1) the actors present and their interactions with substrate (niche complementarity, facilitation, competition…), and the environmental conditions driving (2) their physiological status (carbon use efficiency), but also (3) the first steps of OM decomposition by extracellular enzymes. Therefore, while C mineralization might have been considered as a good indicator of microbial activity when comparing different land uses [62], or using the opposite agricultural practices on long-term agricultural trials [63], it appears to not be adapted to evaluate a set of different agricultural drivers all together (crop choice, rotation, organic amendment type, and management…) usually characterizing a farmer network. However, by examining how the different components of agricultural systems affect the key microbial species of carbon mineralization, as well as the abiotic conditions favoring these flows, we can consider some ways of improving the systems (Table 2). Agroecology has the goal of intensifying soil functions to improve soil fertility in a durable manner. Therefore, what we can expect first from an agroecological system is to promote an optimal decomposition of the organic matter amended, followed by an efficient incorporation of catabolites into the microbial biomass. Such a biomass is the node between nutrient recycling for crops by the microbial loop [64] and long-term organic matter storage by mineral complexation (corresponding to the long-term nutrient stock) by what has been called the “entombing effect” [48]. We did not measure the carbon use efficiency, but it has been shown that N availability, high quality OM, and bacterial biomass favored high CUE into agroecosystems [65]. As a consequence, in the present study, components of agricultural systems that promote straw-decomposer populations, N availability, and microbial biomass N can optimize microbial use of crop residues.
Cereal cultivation appeared to be positively correlated to some ascomycetal families implied in straw mineralization, while their associated bacterial families were more promoted by legume cropping. Cereal cultivation likely increased P availability, which is the most limiting nutrient in Ferralsols [47], and also microbial biomass P. Legume cropping was also positively correlated to the few fungal populations that we suspected to be involved in MSD-PE. Therefore, rotations with cereal and legumes can favor organic matter mineralization by increasing the diversity of crop residue decomposers, while it has also been advocated to increase long-time C sequestration because of their low C:N ratio [66].
Composting is known to lower the C:N of the organic matter but also to increase its recalcitrance, leading to regular and long-term nutrient delivery [67,68]. In the present study, compost amendment was effectively associated with soil NH4 enrichment and to the N in microbial biomass. Compost also appeared to enrich the finest OM fraction of soil, associated with many straw-decomposers populations, while cattle manure, which is the traditional fertilizer of local farmers [69], showed the opposite effect. As this is the fraction usually protected in the long term by mineral sorption, compost amendment can participate in carbon sequestration more efficiently than any vegetal residues, which lose a lot of C by respiration before reaching this OM fraction. Supplying the finest OM fraction could also compensate the PE generated by mineral dissociation (AM-PE) during crop residue decomposition, to remobilize nutrients toward microbial biomass without depleting the soil carbon stock. Moreover, compost amendment appeared to also enrich a coarser OM fraction (200–2000 µm) that linked to the few fungal decomposers suspected to be involved in a PE generated by stoichiometric decomposition (MSD-PE). That fraction was also linked to the number of trees present on the cultivated plots. Therefore, Agroforestry, which is believed to increase soil C sequestration mainly by fixing atmospheric C into perennial biomass [70], could also positively influence soil C dynamics toward organic matter microbial decomposition.

5. Conclusions

Our findings have led to a few hypotheses on short-term priming generation in agricultural Ferralsol, which have been summarized in a conceptual scheme (Figure 5). Our data suggest that short-term PE generated by the input of a crop residue in an agricultural Ferralsol, as linked to the size of the finest SOM fraction, likely resulted from the mineralization of MAOM. This implies that microorganisms could also directly destabilize mineral associations, as has been described for roots in Rhizosphere PE. Future work should include reactive compound monitoring to deepen this hypothesis. Some hints also suggested that a minor part of PE could have been generated simultaneously by stoichiometric decomposition. The impact of this process on long-term C storage in soil is still unclear, as the targeted organic matter seems to correspond to coarse fractions (vegetal tissue in decomposition), but the ultimate beneficiaries appeared to be oligotrophic organisms with a low CUE. Finally, our data highlighted that cereal and legumes cropping, agroforestry, and compost amendment can select populations and set environmental conditions favorable to a progressive accumulation of nutrient-rich organic matter in Ferralsols.

Supplementary Materials

The following supporting information can be downloaded at: https://www.mdpi.com/article/10.3390/microbiolres14040117/s1, Table S1a: environmental description and agricultural history of plots sampled, Table S1b: edaphic parameters of soil samples, Table S1c: microbial parameters of soil samples, Table S1d: potential mineralization activities, Table S2: Correlation matrix (Pearson (n)) calculated on all abiotic, biotic and agricultural variables.

Author Contributions

The study conception and design were elaborated by L.B., E.B., T.B. and T.R. All authors including P.-A.M., L.R., N.C.P.-B., S.D. and J.T., contributed to at least one of the following steps: material preparation, data collection, and analysis. The first draft of the manuscript was written by K.R. and all authors commented on previous versions of the manuscript. All authors have read and agreed to the published version of the manuscript.

Funding

The present study was funded by the French Foundation for Research on Biodiversity (FRB-AAP-SCEN-2013 II—CAMMiSolE project). The travel associated with sampling was sponsored by the local facilities of the French National Institute of Research for Development (IRD). The first author was awarded of two mobility research grants funded by Agropolis Foundation (AAP Open Science-CARIM project) and the French Ministry of Foreign Affairs (MAE-Bourse BGF) to travel from Madagascar and stay for 5 months at INRA Dijon to perform the molecular analyses.

Institutional Review Board Statement

Not applicable.

Informed Consent Statement

Not applicable.

Data Availability Statement

The dataset generated and analysed during the current study is available as a numerical document attached to the article (i.e., Table S1).

Acknowledgments

We would like to thank the whole consortium of the CAMMiSolE project for their help in the soil sampling at farmer plots, and in particular our partner NGO Agrisud International which was in charge of the choice, monitoring and support of the 20 farming families involved in the project.

Conflicts of Interest

The authors declare no conflict of interest.

References

  1. Paustian, K.; Lehmann, J.; Ogle, S.; Reay, D.; Robertson, G.P.; Smith, P. Climate-smart soils. Nature 2016, 532, 49–57. [Google Scholar] [CrossRef] [PubMed]
  2. Niang, I.; Ruppel, O.C.; Abdrabo, M.A.; Essel, A.; Lennard, C.; Padgham, J.; Urquhart, P. Africa. In Climate Change: Impacts, Adaptation, and Vulnerability. Part B: Regional Aspects; Contribution of Working Group II to the Fifth Assessment Report of the Intergovernmental Panel on Climate Change; Cambridge University Press: Cambridge, UK; New York, NY, USA, 2014; pp. 1199–1265. [Google Scholar]
  3. FAO. World Agriculture: Towards 2015/2030; Summary Report; Food and Agriculture Organization of the United Nations (FAO): Rome, Italy, 2002; p. 97. [Google Scholar]
  4. Waldrop, M.P.; Balser, T.C.; Firestone, M.K. Linking microbial community composition to function in a tropical soil. Soil Biol. Biochem. 2000, 32, 1837–1846. [Google Scholar] [CrossRef]
  5. Moorhead, D.L.; Sinsabaugh, R.L. A Theoretical Model Of Litter Decay And Microbial Interaction. Ecol. Monogr. 2006, 76, 151–174. [Google Scholar] [CrossRef]
  6. Neill, C.; Gignoux, J. Soil organic matter decomposition driven by microbial growth: A simple model for a complex network of interactions. Soil Biol. Biochem. 2006, 38, 803–811. [Google Scholar] [CrossRef]
  7. Six, J.; Frey, S.D.; Thiet, R.K.; Batten, K.M. Bacterial and Fungal Contributions to Carbon Sequestration in Agroecosystems. Soil Sci. Soc. Am. J. 2006, 70, 555. [Google Scholar] [CrossRef]
  8. Schmidt, M.W.I.; Torn, M.S.; Abiven, S.; Dittmar, T.; Guggenberger, G.; Janssens, I.A.; Kleber, M.; Kögel-Knabner, I.; Lehmann, J.; Manning, D.A.C.; et al. Persistence of soil organic matter as an ecosystem property. Nature 2011, 478, 49–56. [Google Scholar] [CrossRef] [PubMed]
  9. Louis, B.P.; Maron, P.-A.; Menasseri-Aubry, S.; Sarr, A.; Lévêque, J.; Mathieu, O.; Jolivet, C.; Leterme, P.; Viaud, V. Microbial Diversity Indexes Can Explain Soil Carbon Dynamics as a Function of Carbon Source. PLoS ONE 2016, 11, e0161251. [Google Scholar] [CrossRef]
  10. Bernard, L.; Basile-Doelsch, I.; Derrien, D.; Fanin, N.; Fontaine, S.; Guenet, B.; Karimi, B.; Marsden, C.; Maron, P. Advancing the mechanistic understanding of the priming effect on soil organic matter mineralization. Funct. Ecol. 2022, 36, 1355–1377. [Google Scholar] [CrossRef]
  11. Fontaine, S.; Mariotti, A.; Abbadie, L. The priming effect of organic matter: A question of microbial competition? Soil Biol. Biochem. 2003, 35, 837–843. [Google Scholar] [CrossRef]
  12. Keiluweit, M.; Bougoure, J.J.; Nico, P.S.; Pett-Ridge, J.; Weber, P.K.; Kleber, M. Mineral protection of soil carbon counteracted by root exudates. Nat. Clim. Change 2015, 5, 588–595. [Google Scholar] [CrossRef]
  13. Chen, R.; Senbayram, M.; Blagodatsky, S.; Myachina, O.; Dittert, K.; Lin, X. Soil C and N availability determine the priming effect: Microbial N mining and stoichiometric decomposition theories. Glob. Change Biol. 2014, 20, 2356–2367. [Google Scholar] [CrossRef] [PubMed]
  14. Clarholm, M.; Skyllberg, U.; Rosling, A. Organic acid induced release of nutrients from metal-stabilized soil organic matter—The unbutton model. Soil Biol. Biochem. 2015, 84, 168–176. [Google Scholar] [CrossRef]
  15. Jilling, A.; Keiluweit, M.; Gutknecht, J.L.M.; Grandy, A.S. Priming mechanisms providing plants and microbes access to mineral-associated organic matter. Soil Biol. Biochem. 2021, 158, 108265. [Google Scholar] [CrossRef]
  16. Li, H.; Bölscher, T.; Winnick, M.; Tfaily, M.M.; Cardon, Z.G.; Keiluweit, M. Simple plant and microbial exudates destabilize mineral-associated organic matter via multiple pathways. Environ. Sci. Technol. 2021, 55, 3389–3398. [Google Scholar] [CrossRef]
  17. Sano, M.; Tanaka, T.; Ohara, H.; Aso, Y. Itaconic acid derivatives: Structure, function, biosynthesis, and perspectives. Appl. Microbiol. Biotechnol. 2020, 104, 9041–9051. [Google Scholar] [CrossRef]
  18. Thevenot, M.; Dignac, M.F.; Rumpel, C. Fate of lignins in soils: A review. Soil Biol. Biochem. 2010, 42, 1200–1211. [Google Scholar] [CrossRef]
  19. Uroz, S.; Kelly, L.C.; Turpault, M.P.; Lepleux, C.; Frey-Klett, P. The mineralosphere concept: Mineralogical control of the distribution and function of mineral-associated bacterial communities. Trends Microbiol. 2015, 23, 751–762. [Google Scholar] [CrossRef]
  20. Adeleke, R.; Nwangburuka, C.; Oboirien, B. Origins, roles and fate of organic acids in soils: A review. S. Afr. J. Bot. 2017, 108, 393–406. [Google Scholar] [CrossRef]
  21. Lehmann, J.; Kleber, M. The contentious nature of soil organic matter. Nature 2015, 528, 60–68. [Google Scholar] [CrossRef]
  22. Blagodatskaya, E.; Khomyakov, N.; Myachina, O.; Bogomolova, I.; Blagodatsky, S.; Kuzyakov, Y. Microbial interactions affect sources of priming induced by cellulose. Soil Biol. Biochem. 2014, 74, 39–49. [Google Scholar] [CrossRef]
  23. Derrien, D.; Plain, C.; Courty, P.-E.; Gelhaye, L.; Moerdijk-Poortvliet, T.C.; Thomas, F.; Versini, A.; Zeller, B.; Koutika, L.-S.; Boschker, H.T.; et al. Does the addition of labile substrate destabilise old soil organic matter? Soil Biol. Biochem. 2014, 76, 149–160. [Google Scholar] [CrossRef]
  24. Balesdent, J.; Mariotti, A.; Guillet, B. Natural 13C abundance as a tracer for studies of soil organic matter dynamics. Soil Biol. Biochem. 1987, 19, 25–30. [Google Scholar] [CrossRef]
  25. Cotrufo, M.F.; Wallenstein, M.D.; Boot, C.M.; Denef, K.; Paul, E. The Microbial Efficiency-Matrix Stabilization (MEMS) framework integrates plant litter decomposition with soil organic matter stabilization: Do labile plant inputs form stable soil organic matter? Glob. Change Biol. 2013, 19, 988–995. [Google Scholar] [CrossRef]
  26. Tardy, V.; Spor, A.; Mathieu, O.; Lévèque, J.; Terrat, S.; Plassart, P.; Regnier, T.; Bardgett, R.D.; van der Putten, W.H.; Roggero, P.P.; et al. Shifts in microbial diversity through land use intensity as drivers of carbon mineralization in soil. Soil Biol. Biochem. 2015, 90, 204–213. [Google Scholar] [CrossRef]
  27. Malik, A.A.; Martiny, J.B.; Brodie, E.L.; Martiny, A.C.; Treseder, K.K.; Allison, S.D. Defining trait-based microbial strategies with consequences for soil carbon cycling under climate change. ISME J. 2020, 14, 1–9. [Google Scholar] [CrossRef] [PubMed]
  28. Razanamalala, K.; Razafimbelo, T.; Maron, P.-A.; Ranjard, L.; Chemidlin, N.; Lelièvre, M.; Dequiedt, S.; Ramaroson, V.H.; Marsden, C.; Becquer, T.; et al. Microbial diversity drives Priming effect along climate gradients of the Madagascar Highlands. ISME J. 2018, 12, 451–462. [Google Scholar] [CrossRef]
  29. IUSS Working Group WRB. World reference base for soil resources 2014 international soil classification system. In World Soil Resources Reports; Food and Agriculture Organization of the United Nations: Rome, Italy, 2014; Volume 106, 203p. [Google Scholar]
  30. Pansu, M.; Gautheyrou, J. Handbook of Soil Analysis: Mineralogical, Organic and Inorganic Methods; Springer Science & Business: Berlin/Heidelberg, Germany, 2007. [Google Scholar]
  31. Gavinelli, E.; Feller, C.; Larré-Larrouy, M.C.; Bacye, B.; Djegui, N.; Nzila, J.D.D. A routine method to study soil organic matter by particle-size fractionation: Examples for tropical soils. Commun. Soil Sci. Plant Anal. 1995, 26, 1749–1760. [Google Scholar] [CrossRef]
  32. Ramaroson, V.H.; Becquer, T.; Sá, S.O.; Razafimahatratra, H.; Delarivière, J.L.; Blavet, D.; Vendrame, P.R.; Rabeharisoa, L.; Rakotondrazafy, A.F. Mineralogical analysis of ferralitic soils in Madagascar using NIR spectroscopy. CATENA 2017, 168, 102–109. [Google Scholar] [CrossRef]
  33. Ciesielski, H.; Sterckeman, T.; Santerne, M.; Willery, J.P. Determination of cation exchange capacity and exchangeable cations in soils by means of cobalt hexamine trichloride. Effects of experimental conditions. Agronomy 1997, 17, 1–7. [Google Scholar] [CrossRef]
  34. Mulvaney, M.L. Nitrogen —Inorganic forms. In Methods of Soil Analysis Part 3. Chemical Methods; Klute, A., Ed.; American Society of Agronomy: Madison, WI, USA, 1996; p. 1130. [Google Scholar]
  35. Jackson, M.L. Soil Chemical Analysis; Prentice Hall: Englewood Cliffs, NJ, USA, 1958. [Google Scholar]
  36. Kouno, K.; Tuchiya, Y.; Ando, T. Measurement of Soil Microbial Biomass Phosphorus by an Anion-Exchange Membrane Method. Soil Biol. Biochem. 1995, 27, 1353–1357. [Google Scholar] [CrossRef]
  37. Amer, F.; Bouldin, D.R.; Black, C.A.; Duke, F.R. Characterization of soil phosphorus by anion exchange resin adsorption and P32-equilibration. Plant Soil 1955, 6, 391–408. [Google Scholar] [CrossRef]
  38. Vance, E.D.; Brookes, P.C.; Jenkinson, D.S. An extraction method for measuring soil microbial biomass C. Soil Biol. Biochem. 1987, 19, 703–707. [Google Scholar] [CrossRef]
  39. Jenkinson, D.S.; Brookes, P.C.; Powlson, D.S. Measuring soil microbial biomass. Soil Biol. Biochem. 2004, 36, 5–7. [Google Scholar] [CrossRef]
  40. Plassart, P.; Terrat, S.; Thomson, B.; Griffiths, R.; Dequiedt, S.; Lelievre, M.; Regnier, T.; Nowak, V.; Bailey, M.; Lemanceau, P.; et al. Evaluation of the ISO Standard 11063 DNA Extraction Procedure for Assessing Soil Microbial Abundance and Community Structure. PLoS ONE 2012, 7, e44279. [Google Scholar] [CrossRef] [PubMed]
  41. Terrat, S.; Christen, R.; Dequiedt, S.; Lelièvre, M.; Nowak, V.; Regnier, T.; Bachar, D.; Plassart, P.; Wincker, P.; Jolivet, C.; et al. Molecular biomass and MetaTaxogenomic assessment of soil microbial communities as influenced by soil DNA extraction procedure. Microbiol. Biotechnol. 2012, 5, 135–141. [Google Scholar] [CrossRef] [PubMed]
  42. Prévost-Bouré, N.C.; Christen, R.; Dequiedt, S.; Mougel, C.; Lelièvre, M.; Jolivet, C.; Shahbazkia, H.R.; Guillou, L.; Arrouays, D.; Ranjard, L. Validation and application of a PCR primer set to quantify fungal communities in the soil environment by real-time quantitative PCR. PLoS ONE 2011, 6, e24166. [Google Scholar] [CrossRef]
  43. Djemiel, C.; Dequiedt, S.; Karimi, B.; Cottin, A.; Girier, T.; El Djoudi, Y.; Wincker, P.; Lelièvre, M.; Mondy, S.; Prévost-Bouré, N.C.; et al. BIOCOM-PIPE: A new user-friendly metabarcoding pipeline for the characterization of microbial diversity from 16S, 18S and 23S rRNA gene amplicons. BMC Bioinf. 2020, 21, 492. [Google Scholar] [CrossRef]
  44. Bernard, L.; Chapuis-Lardy, L.; Razafimbelo, T.; Razafindrakoto, M.; Pablo, A.-L.; Legname, E.; Poulain, J.; Brüls, T.; O′Donohue, M.; Brauman, A.; et al. Endogeic earthworms shape bacterial functional communities and affect organic matter mineralization in a tropical soil. ISME J. 2012, 6, 213–222. [Google Scholar] [CrossRef]
  45. Fanin, N.; Mooshammer, M.; Sauvadet, M.; Meng, C.; Alvarez, G.; Bernard, L.; Bertrand, I.; Blagodatskaya, E.; Bon, L.; Fontaine, S.; et al. Soil enzymes in response to climate warming: Mechanisms and feedbacks. Funct. Ecol. 2022, 36, 1378–1395. [Google Scholar] [CrossRef]
  46. Blagodatskaya, E.; Kuzyakov, Y. Mechanisms of real and apparent priming effects and their dependence on soil microbial biomass and community structure: Critical review. Biol. Fert. Soil 2008, 45, 115–131. [Google Scholar] [CrossRef]
  47. Raminoarison, M.; Razafimbelo, T.; Rakotoson, T.; Becquer, T.; Blanchart, E.; Trap, J. Multiple-nutrient limitation of upland rainfed rice in Ferralsols: A greenhouse nutrient-omission trial. J. Plant Nut. 2020, 43, 270–284. [Google Scholar] [CrossRef]
  48. Liang, C.; Schimel, J.P.; Jastrow, J.D. The importance of anabolism in microbial control over soil carbon storage. Nat. Microbiol. 2017, 2, 17105 . [Google Scholar] [CrossRef] [PubMed]
  49. Ge, Y.; Zhang, J.; Zhang, L.; Yang, M.; He, J.Z. Long-term fertilization regimes affect bacterial community structure and diversity of an agricultural soil in northern China. J. Soil Sediments 2008, 8, 43–50. [Google Scholar] [CrossRef]
  50. Recorbet, G.; Picard, C.; Normand, P.; Simonet, P. Kinetics of the persistence of chromosomal DNA from genetically engineered Escherichia coli introduced into soil. Appl. Environ. Microbiol. 1993, 59, 4289–4294. [Google Scholar] [CrossRef] [PubMed]
  51. Chen, Z.; Li, Y.; Chang, S.X.; Xu, Q.; Li, Y.; Ma, Z.; Qin, H.; Cai, Y. Linking enhanced soil nitrogen mineralization to increased fungal decomposition capacity with Moso bamboo invasion of broadleaf forests. Sci. Total Environ. 2021, 771, 144779. [Google Scholar] [CrossRef]
  52. Cleveland, C.C.; Nemergut, D.R.; Schmidt, S.K.; Townsend, A.R. Increases in soil respiration following labile carbon additions linked to rapid shifts in soil microbial community composition. Biogeochemistry 2007, 82, 229–240. [Google Scholar] [CrossRef]
  53. Wang, J.; Ran, Q.; Du, X.; Wu, S.; Wang, J.; Sheng, D.; Chen, Q.; Du, Z.; Li, Y.-Z. Two new Polyangium species, P. aurulentum sp. nov. and P. jinanense sp. nov., isolated from a soil sample. Syst. Appl. Microbiol. 2021, 44, 126274. [Google Scholar] [CrossRef]
  54. Schoch, C.L.; Sung, G.-H.; López-Giráldez, F.; Townsend, J.P.; Miadlikowska, J.; Hofstetter, V.; Robbertse, B.; Matheny, P.B.; Kauff, F.; Wang, Z.; et al. The Ascomycota Tree of Life: A Phylum-wide Phylogeny Clarifies the Origin and Evolution of Fundamental Reproductive and Ecological Traits. Syst. Biol. 2009, 58, 224–239. [Google Scholar] [CrossRef]
  55. Christensen, M. A View of Fungal Ecology. Mycologia 1989, 81, 1–19. [Google Scholar] [CrossRef]
  56. Fontaine, S.; Henault, C.; Aamor, A.; Bdioui, N.; Bloor, J.; Maire, V.; Mary, B.; Revaillot, S.; Maron, P. Fungi mediate long term sequestration of carbon and nitrogen in soil through their priming effect. Soil Biol. Biochem. 2011, 43, 86–96. [Google Scholar] [CrossRef]
  57. De Chaves, M.G.; Silva, G.G.Z.; Rossetto, R.; Edwards, R.A.; Tsai, S.M.; Navarrete, A.A. Acidobacteria subgroups and their metabolic potential for carbon degradation in sugarcane soil amended with vinasse and nitrogen fertilizers. Front. Microbiol. 2019, 10, 1680. [Google Scholar] [CrossRef] [PubMed]
  58. Shange, R.S.; Ankumah, R.O.; Ibekwe, A.M.; Zabawa, R.; Dowd, S.E. Distinct soil bacterial communities revealed under a diversely managed agroecosystem. PLoS ONE 2012, 7, e40338. [Google Scholar] [CrossRef]
  59. Lueders, T.; Wagner, B.; Claus, P.; Friedrich, M.W. Stable isotope probing of rRNA and DNA reveals a dynamic methylotroph community and trophic interactions with fungi and protozoa in oxic rice field soil. Environ. Microbiol. 2004, 6, 60–72. [Google Scholar] [CrossRef] [PubMed]
  60. Tedersoo, L.; May, T.W.; Smith, M.E. Ectomycorrhizal lifestyle in fungi: Global diversity, distribution, and evolution of phylogenetic lineages. Mycorrhiza 2010, 20, 217–263. [Google Scholar] [CrossRef] [PubMed]
  61. Bergmann, G.T.; Bates, S.T.; Eilers, K.G.; Lauber, C.L.; Caporaso, J.G.; Walters, W.A.; Knight, R.; Fierer, N. The under-recognized dominance of Verrucomicrobia in soil bacterial communities. Soil Biol. Biochem. 2011, 43, 1450–1455. [Google Scholar] [CrossRef]
  62. Thoumazeau, A.; Bessou, C.; Renevier, M.-S.; Trap, J.; Marichal, R.; Mareschal, L.; Decaëns, T.; Bottinelli, N.; Jaillard, B.; Chevallier, T.; et al. Biofunctool®: A new framework to assess the impact of land management on soil quality. Part A: Concept and validation of the set of indicators. Ecol. Indic. 2019, 97, 100–110. [Google Scholar] [CrossRef]
  63. Obriot, F.; Stauffer, M.; Goubard, Y.; Cheviron, N.; Peres, G.; Eden, M.; Revallier, A.; Vieublé-Gonod, L.; Houot, S. Multi-criteria indices to evaluate the effects of repeated organic amendment applications on soil and crop quality. Agric. Ecosyst. Environ. 2016, 232, 165–178. [Google Scholar] [CrossRef]
  64. Trap, J.; Bonkowski, M.; Plassard, C.; Villenave, C.; Blanchart, E. Ecological importance of soil bacterivores for ecosystem functions. Plant Soil 2016, 398, 1–24. [Google Scholar] [CrossRef]
  65. Soares, M.; Rousk, J. Microbial growth and carbon use efficiency in soil: Links to fungal-bacterial dominance, SOC-quality and stoichiometry. Soil Biol. Biochem. 2019, 131, 195–205. [Google Scholar] [CrossRef]
  66. Jensen, E.S.; Peoples, M.B.; Boddey, R.M.; Gresshoff, P.M.; Hauggaard-Nielsen, H.; Alves, B.J.; Morrison, M.J. Legumes for mitigation of climate change and the provision of feedstock for biofuels and biorefineries. A review. Agron. Sustain. Dev. 2012, 32, 329–364. [Google Scholar] [CrossRef]
  67. Bulluck III, L.R.; Brosius, M.; Evanylo, G.K.; Ristaino, J.B. Organic and synthetic fertility amendments influence soil microbial, physical and chemical properties on organic and conventional farms. Appl. Soil Ecol. 2002, 19, 147–160. [Google Scholar] [CrossRef]
  68. Pérez-Piqueres, A.; Edel-Hermann, V.; Alabouvette, C.; Steinberg, C. Response of soil microbial communities to compost amendments. Soil Biol. Biochem. 2006, 38, 460–470. [Google Scholar] [CrossRef]
  69. Andriarimalala, J.H.; Rakotozandriny, J.N.; Andriamandroso, A.L.H.; Penot, E.; Naudin, K.; Dugué, P.; Tillard, E.; Decruyenaere, V.; Salgado, P. Creating synergies between conservation agriculture and cattle production in crop–livestock farms: A study case in the lake Alaotra region of Madagascar. Exp. Agric. 2013, 49, 352–365. [Google Scholar] [CrossRef]
  70. Albrecht, A.; Kandji, S.T. Carbon sequestration in tropical agroforestry systems. Agric. Ecosyst. Environ. 2003, 99, 15–27. [Google Scholar] [CrossRef]
Figure 1. Map of the sampling area centered around the municipality of Imerintsiatosika located in the agricultural area of Itasy, 30 km west of Antananarivo (Madagascar).
Microbiolres 14 00117 g001
Figure 2. Carbon cycling activities. Box plot of C released by basal respiration (BR), straw mineralization (SM), and priming effect (PE) between day 4 and day 7 of incubation on 33 ferralitic soils sampled in cultivated farmer plots in the area of Imerintsiatosika (Madagascar Highlands).
Microbiolres 14 00117 g002
Figure 3. Environmental drivers of carbon cycling activities. Biplot representation of the principal component analysis (PCA) calculated using soil biotic and abiotic variables (plain triangles). Samples are represented with plain grey circles. C-mineralization activities (BR: basal respiration, SM: straw mineralization, PE: priming effect) are represented by plain black circles. Bold-character variables are correlated to BR (black) and SM (red) while blue filled variables are correlated to PE, all with a p-value < 0.05. Abbreviations: OTU_F/OTU_B: number of fungal or bacterial operational taxonomic units; C,E,C: cation exchange capacity; MBC/MBN/MBP: microbial biomass carbon, nitrogen or phosphorus; OM_LF: light fraction of Organic Matter; OM_0–20 µm, 20–50 µm, 50–200 µm, 200–2000 µm: organic matter granulometric fractions comprised between 0–20 µm…; Ptot, Ntot, Ctot: total soil content of phosphorus, nitrogen, and carbon.
Microbiolres 14 00117 g003
Figure 4. Microbial diversity drivers of carbon cycling activities. Histogram plot of the Pearson coefficients of correlation between each of the 11 phylogenetic bacterial and 20 fungal groups and the three C-cycling activities. Basal respiration (BR), straw mineralization (SM), and priming effect (PE). Dashed lines represent the p-values.
Microbiolres 14 00117 g004
Figure 5. Conceptual scheme of the driving mechanisms of OM mineralization. The present scheme has been adapted from [13]. The microbial compartment is divided into three functional groups (opportunists, decomposers, oligotrophs) and filled with associated phylogenetic groups. Light grey arrows represent influence of abiotic parameters on quality or quantity of OM or biomass pools; plain black arrow corresponds to basal respiration (BR); plain red arrows represent regular C fluxes resulting from the wheat straw; dashed green arrows represent the priming effect generated by microbial stoichiometric decomposition (MSD-PE); and dashed blue arrows represent what is generated by organic matter dissociation from minerals (AM-PE). Phylogenetic groups are colored depending on their supposed implication in the different mineralization activities.
Microbiolres 14 00117 g005
Table 1. List of biotic and abiotic variables, with their respective Pearson coefficient (0.xx), significantly correlated to microbial phylogenetic groups linked to C cycling activities. Data extracted from Table S2.
Phylogenetic Groups
(BR, SM, PE)
Abiotic VariablesBiotic Variables
Archaebacteria
Crenarchaetoa (SM) MBC (−0.36); C:Nmic (−0.34)
Bacteria
Acidobacteria_gp6 (SM)Silt (0.33); Ctot (0.31); OM 0–20 µm (0.31)OTU-B (0.40)
Acidobacteria_gp25 (SM)Kt (−0.37); Ctot (0.37); Ntot (0.37); Ptot (0.37); OM 0–20 µm (0.43)
Solirubrobacteraceae (SM)Kt (−0.32); OM 0–20 µm (0.33)OTU-B (0.32)
Methylobacteriaceae (SM)Kt (−0.32);
Deltaproteobacteria (BR, −SM)Kt (0.36); Fe203cbd (−0.38); pH (0.37); C.E.C (0.49); Ctot (−0.29); OM 0–20 µm (−0.36)MBC (0.36); C:Nmic (0.34); OTU-B (0.34)
Polyangiaceae (BR, −SM)SBD (0.39); Kt (0.3); pH (0.38); Ctot (−0.39); Ntot (−0.30); OM 0–20 µm (−0.40); NO3 (−0.30)C:Nmic (0.32)
Verrucomicrobia (BR, PE, −SM)SBD (0.40); Kt (0.30); C.E.C (0.30); OM 200–2000 µm (0.41); NH4 (0.48)MBC (0.72); MBN (0.51); Evenness F (−0.39)
Betaproteobacteria (BR)Ctot (−0.29); OM 200–2000 µm (−0.37); OM 0–20 µm (−0.29)Evenness F (−0.5)
Coxiellaceae (BR)Kt (0.32), Gb (−0.30);
Lachnospiraceae (BR)Ctot (−0.32); OM 0–20 µm (−0.34); NO3 (−0.34); AvP (0.40)
Bdellovibrionaceae (BR)SBD (−0.30); Fe203cbd (−0.34); OM 0–20 µm (−0.35)
Fungi
Unclassified F families(SM)Silt (−0.38); SH (−0.39); pH (−0.44);
Soil C:N (−0.51); OM-LF (−0.64);
OM 20–50 (−0.55), NH4 (−0.33)
 
MBC (−0.53); MBN (−0.34), OTU-F (0.68)
Chaetomiaceae (SM)Kt (−0.35); Fe203cbd (0.33); C.E.C (−0.33); Ntot (0.40); OM-LF (−0.33); OM 0–20 µm (0.36);MBC (−0.40); OTU-F (0.36)
Pleosporaceae (SM)Kt (−0.45); C.E.C (−0.35);C:Nmic (−0.30)
Montagnulaceae (SM)Kt (−0.40); Fe203cbd (0.38); Ctot (0.30); Ntot (0.30); Ptot (0.36); OM 0–20 µm (0.36)
Microascaceae (SM)Kt (−0.34); Ntot (0.35); Ptot (0.39); 0M 0–20 µm (0.34)
Corticiaceae (SM)Ntot (0.38); Ptot (0.50); OM 0–20 µm (0.29)
Helotiaceae (SM)SBD (−0.30); Kt (0.36); Fe203cbd (−0.33); OM 20–50 µm (−0.36)OTU-F (0.32)
Shiraiaceae (SM)OM 20–50 µm (−0.31)
Amphisphaeriaceae (SM)Ntot (0.31); Ptot (0.40); OM 0–20 µm (0.34)
Trechisporaceae (BR, SM)Ptot (0.34)
Basidiomycota (BR) Evenness F (−0.71)
Boletaceae (BR)NO3 (−0.42); AvP (0.40)MBP (0.48); C:Nmic (0.52)
Tubeufiaceae (BR)SBD (0.40); Fe203cbd (−0.32); Ptot (−0.36); NH4 (0.37)MBC (0.60); MBN (0.52); Evenness B (−0.45)
Davidiellaceae (BR)SBD (0.40); Fe203cbd (−0.40)
Pezizaceae (BR)NO3 (−0.30)MBP (0.55); C:Nmic (0.54)
Pyronemataceae (BR)SBD (0.41); SH (−0.37); Ptot (−0.30); Evenness F (−0.30)
Tricholomataceae (PE)pH (0.41); Ctot (0.31); OM 200–2000 µm (0.47); NH4 (0.62)MBC (0.63); MBN (0.54); Evenness B (−0.41); OTU-F (−0.35);
Tapinellaceae (PE)Clay (0.51); SH (0.33); OM 20–50 µm (0.30); NH4 (0.35)MBC (0.49); MBN (0.52); Evenness F (−0.42)
Kickxellaceae (PE)Clay (0.36); SBD (−0.30);Evenness F (−0.32)
Bold correlation coefficients represent p-values < 0.01. underlined correlation coefficients represent p-values < 0.05. Abbreviations: OTU_F/OTU_B: numbers of fungal or bacterial operational taxonomic units; C,E,C: cation exchange capacity; MBC/MBN/MBP: microbial biomass carbon, nitrogen or phosphorus; OM_LF: light fraction of Organic Matter; OM_0–20 µm, 20–50 µm, 50–200 µm, 200–2000 µm: organic matter granulometric fractions comprised between 0–20 µm…; Ptot, Ntot, Ctot: total soil content of Phosphorus, Nitrogen and Carbon; C:Nmic: ratio of MBC on MBN; Kt: Kaolinite; Gb: Gibbsite; Fe2O3 cbd: Goëthite; AvP: Available Phorphorus; SBD: soil bulk density.
Table 2. List of agricultural components, with their respective Pearson coefficient (0.xx), significantly correlated to abiotic and biotic variables and to microbial phylogenetic groups linked to C cycling activities (indicated in brackets). Data extracted from Table S2.
CultureFertilizationTrees NB
VariablesOff-SeasonSeasonOff-SeasonSeason
Soil humidity Compost (0.30)
PHTuber (0.31) Cereal (−0.29) Compost (−0.33) CM (−0.37)
C.E.CCereal (−0.36)Legume (0.33)
Ctot Tuber (−0.30) Compost (0.33) CM (−0.38)
Ntot Compost (0.30) CM (−0.38)
Om-200–2000µmTuber (0.32)Legume (0.39) Compost (0.65)(0.48)
Om-0–20µm Compost (0.47) CM (−0.34)
NH4 Compost (0.48)
AvP Cereal (0.29)
MBN Compost (0.38)
MBP Cereal (0.36)
OTU_B Compost (0.31)
OTU_F Tuber (−0.31)
Acidobacteria_gp6 (SM)Legume (0.38)
Acidobacteria_gp25 (SM)Legume (0.32)
Solirubrobacteraceae (SM)Legume (0.35)
Methylobacteriaceae (SM)Legume (0.40)
Deltaproteobacteria (BR) (−0.32)
Polyangiaceae (BR)Tuber (0.34) Fallow (−0.3)
Verrucomicrobia (BR, PE) Compost (0.39)
Betaproteobacteria (BR)Cereal (0.32) Fallow (−0.4)
Bdellovibrionaceae (BR)Cereal (0.32) Fallow (0.6)
Chaetomiaceae (SM) CM (−0.3)
Pleosporaceae (SM)Tuber (−0.36) Cereal (0.41) CM (−0.35)
Montagnulaceae (SM)Cereal (0.29)
Microascaceae (SM) CM (−0.36)
Helotiaceae (SM) Cereal (−0.29) Compost (−0.32)
Shiraiaceae (SM) Tuber (0.31) Fallow (−0.31)
Amphisphaeriaceae (SM)Legume (0.38)
Trechisporaceae (BR, SM)
Basidiomycota (BR)
Boletaceae (BR)Cereal (0.30)Cereal (0.31)
Tubeufiaceae (BR)Fallow (0.39)Fallow (0.38)
Pezizaceae (BR)Cereal (0.44) Tuber-Cereal (0.44)Compost (0.35)
Pyronemataceae (BR)Fallow (0.34)Fallow (0.60)CM (−0.31)
Tricholomataceae (PE) Legume (0.32)
Tapinellaceae (PE) Legume (0.34)
Kickxellaceae (PE) Legume (0.31)
Bold correlation coefficients represent p-values < 0.01. underlined correlation coefficients represent p-values < 0.05. CM: Cattle manure; Trees NB: Total number of trees per plot. BR: basal respiration; SM: straw mineralization; PE: priming effect.
Disclaimer/Publisher’s Note: The statements, opinions and data contained in all publications are solely those of the individual author(s) and contributor(s) and not of MDPI and/or the editor(s). MDPI and/or the editor(s) disclaim responsibility for any injury to people or property resulting from any ideas, methods, instructions or products referred to in the content.

