
Longitudinal Evaluation Using Preclinical 7T-Magnetic Resonance Imaging/Spectroscopy on Prenatally Dose-Dependent Alcohol-Exposed Rats

Abstract
:1. Introduction
2. Materials and Methods
2.1. Animal Preparation
2.2. FASD Model
2.3. Magnetic Resonance Imaging
2.4. T2-Weighted Images Brain Volume
2.5. T2 Relaxation Time
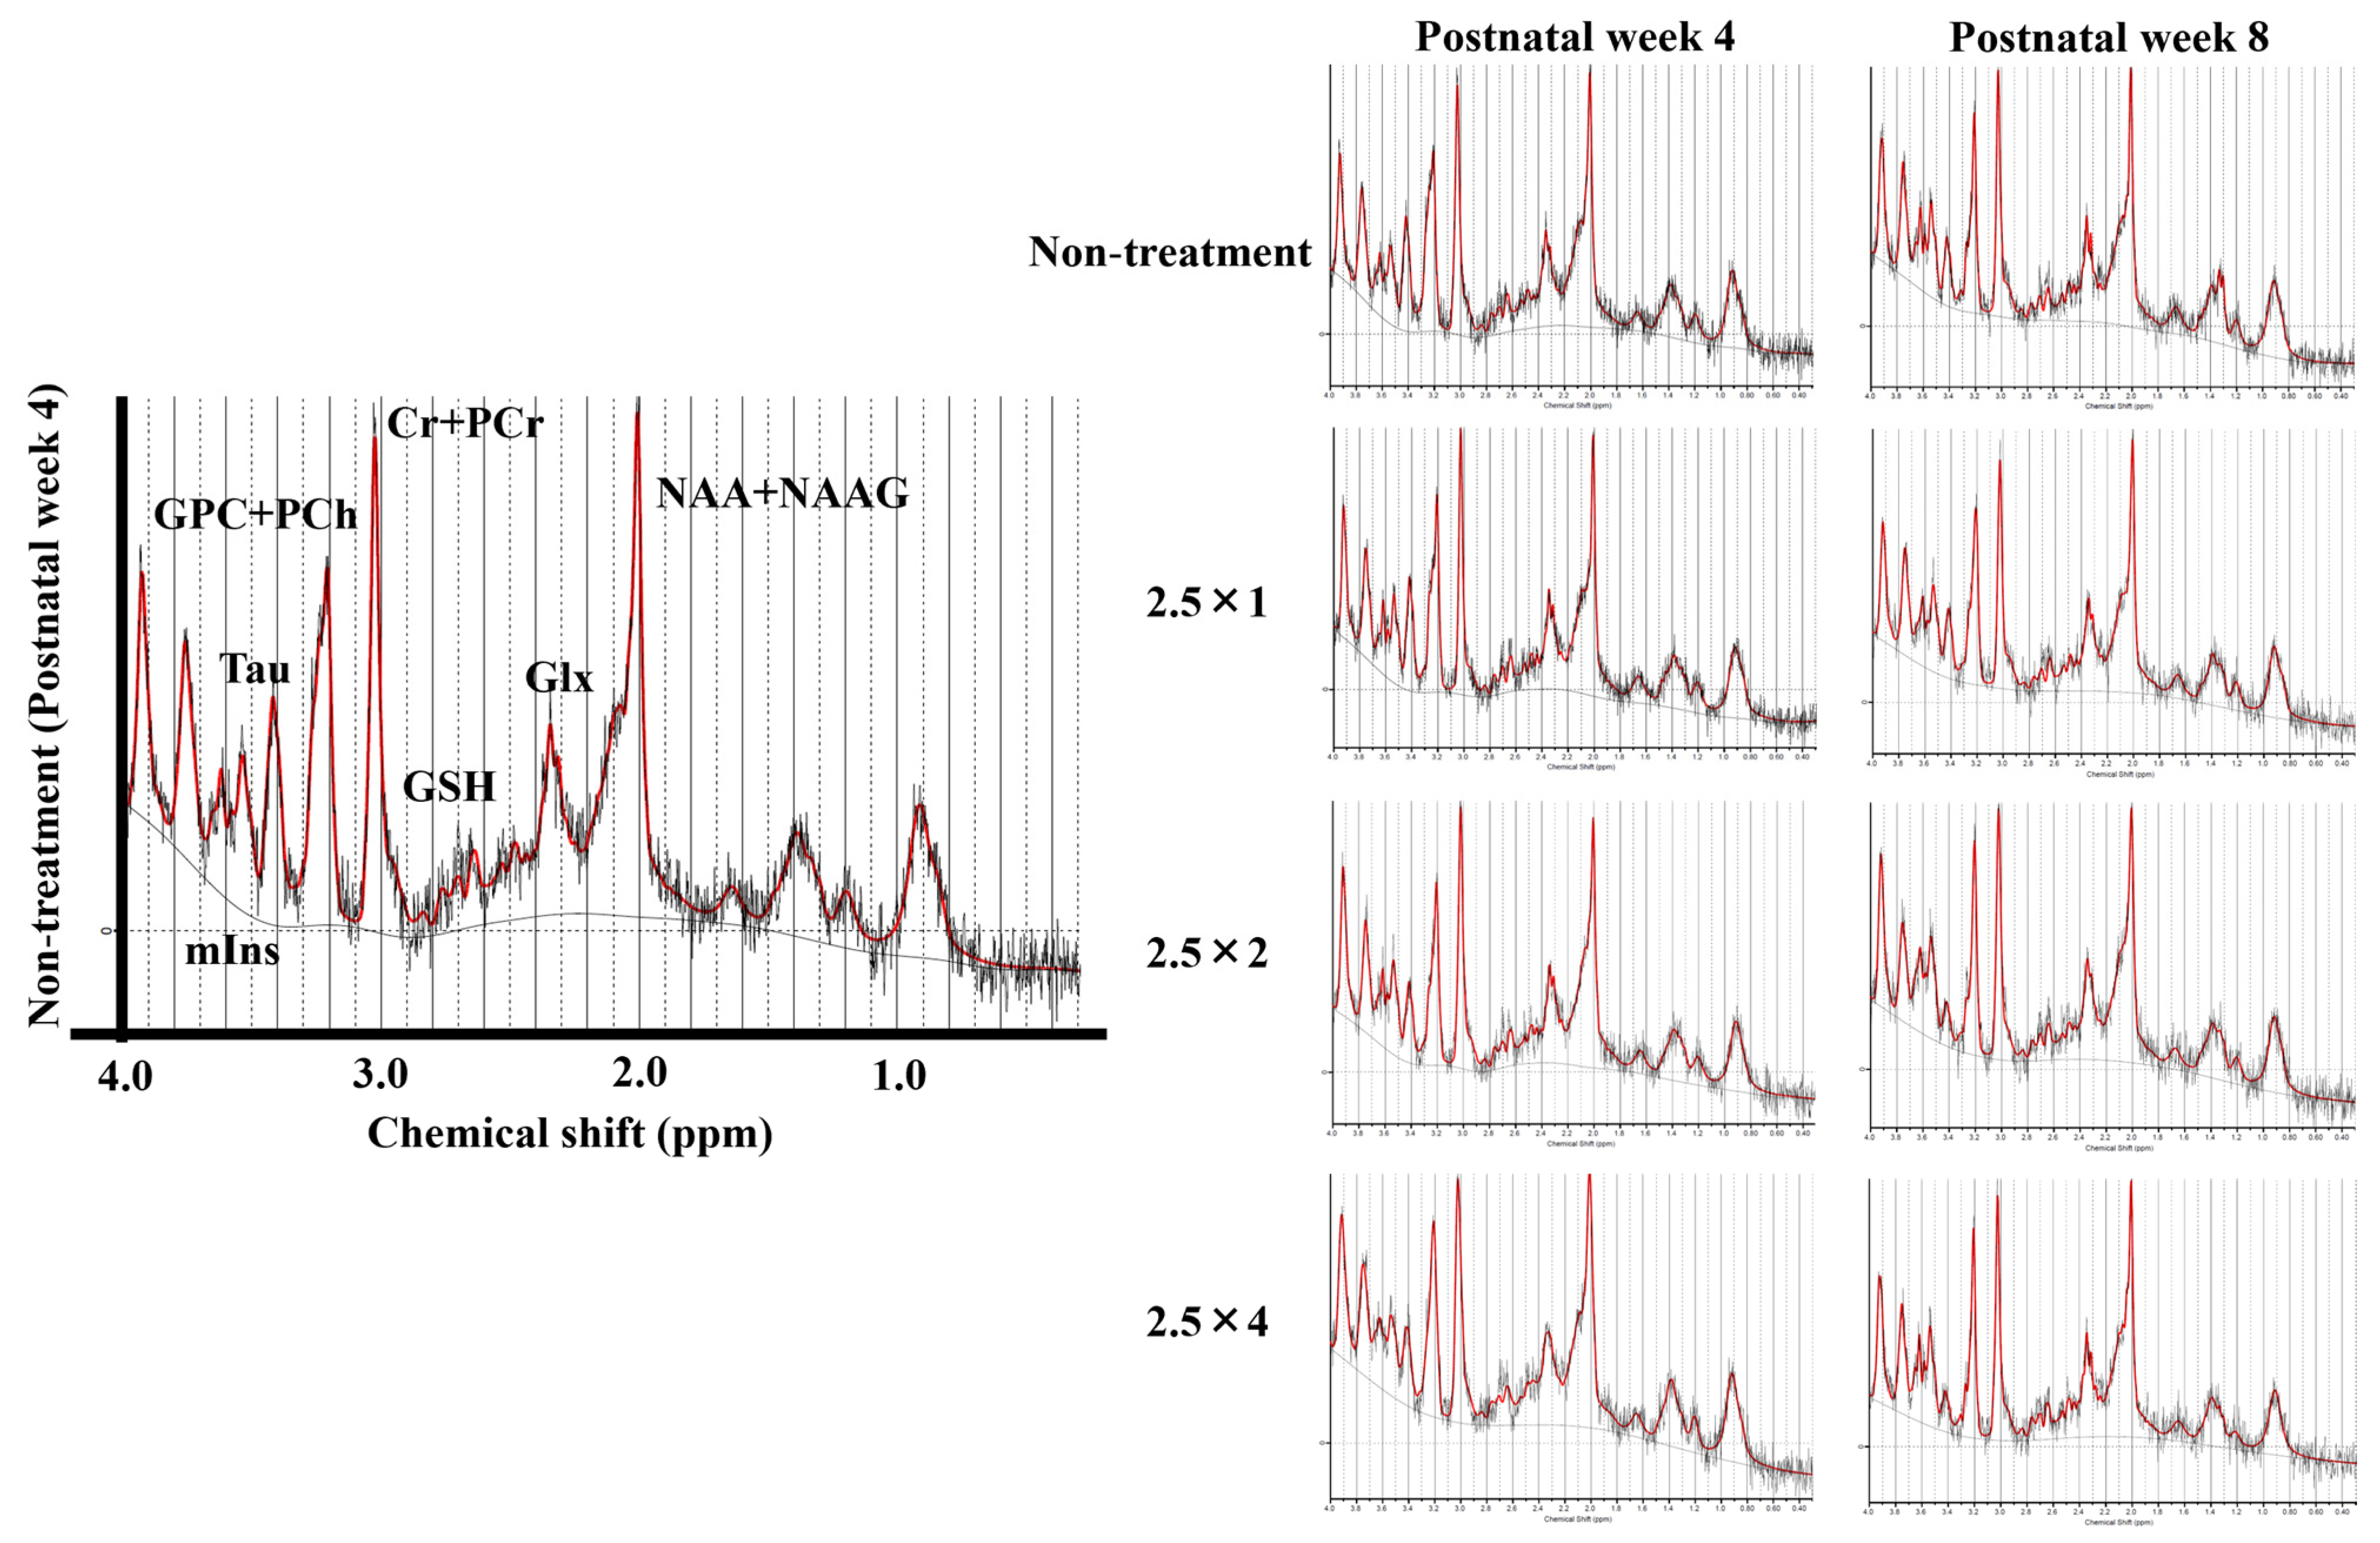
2.6. Magnetic Resonance Spectroscopy (MRS) for Brain Metabolites
2.7. Image Analysis and Statistical Analysis
3. Results
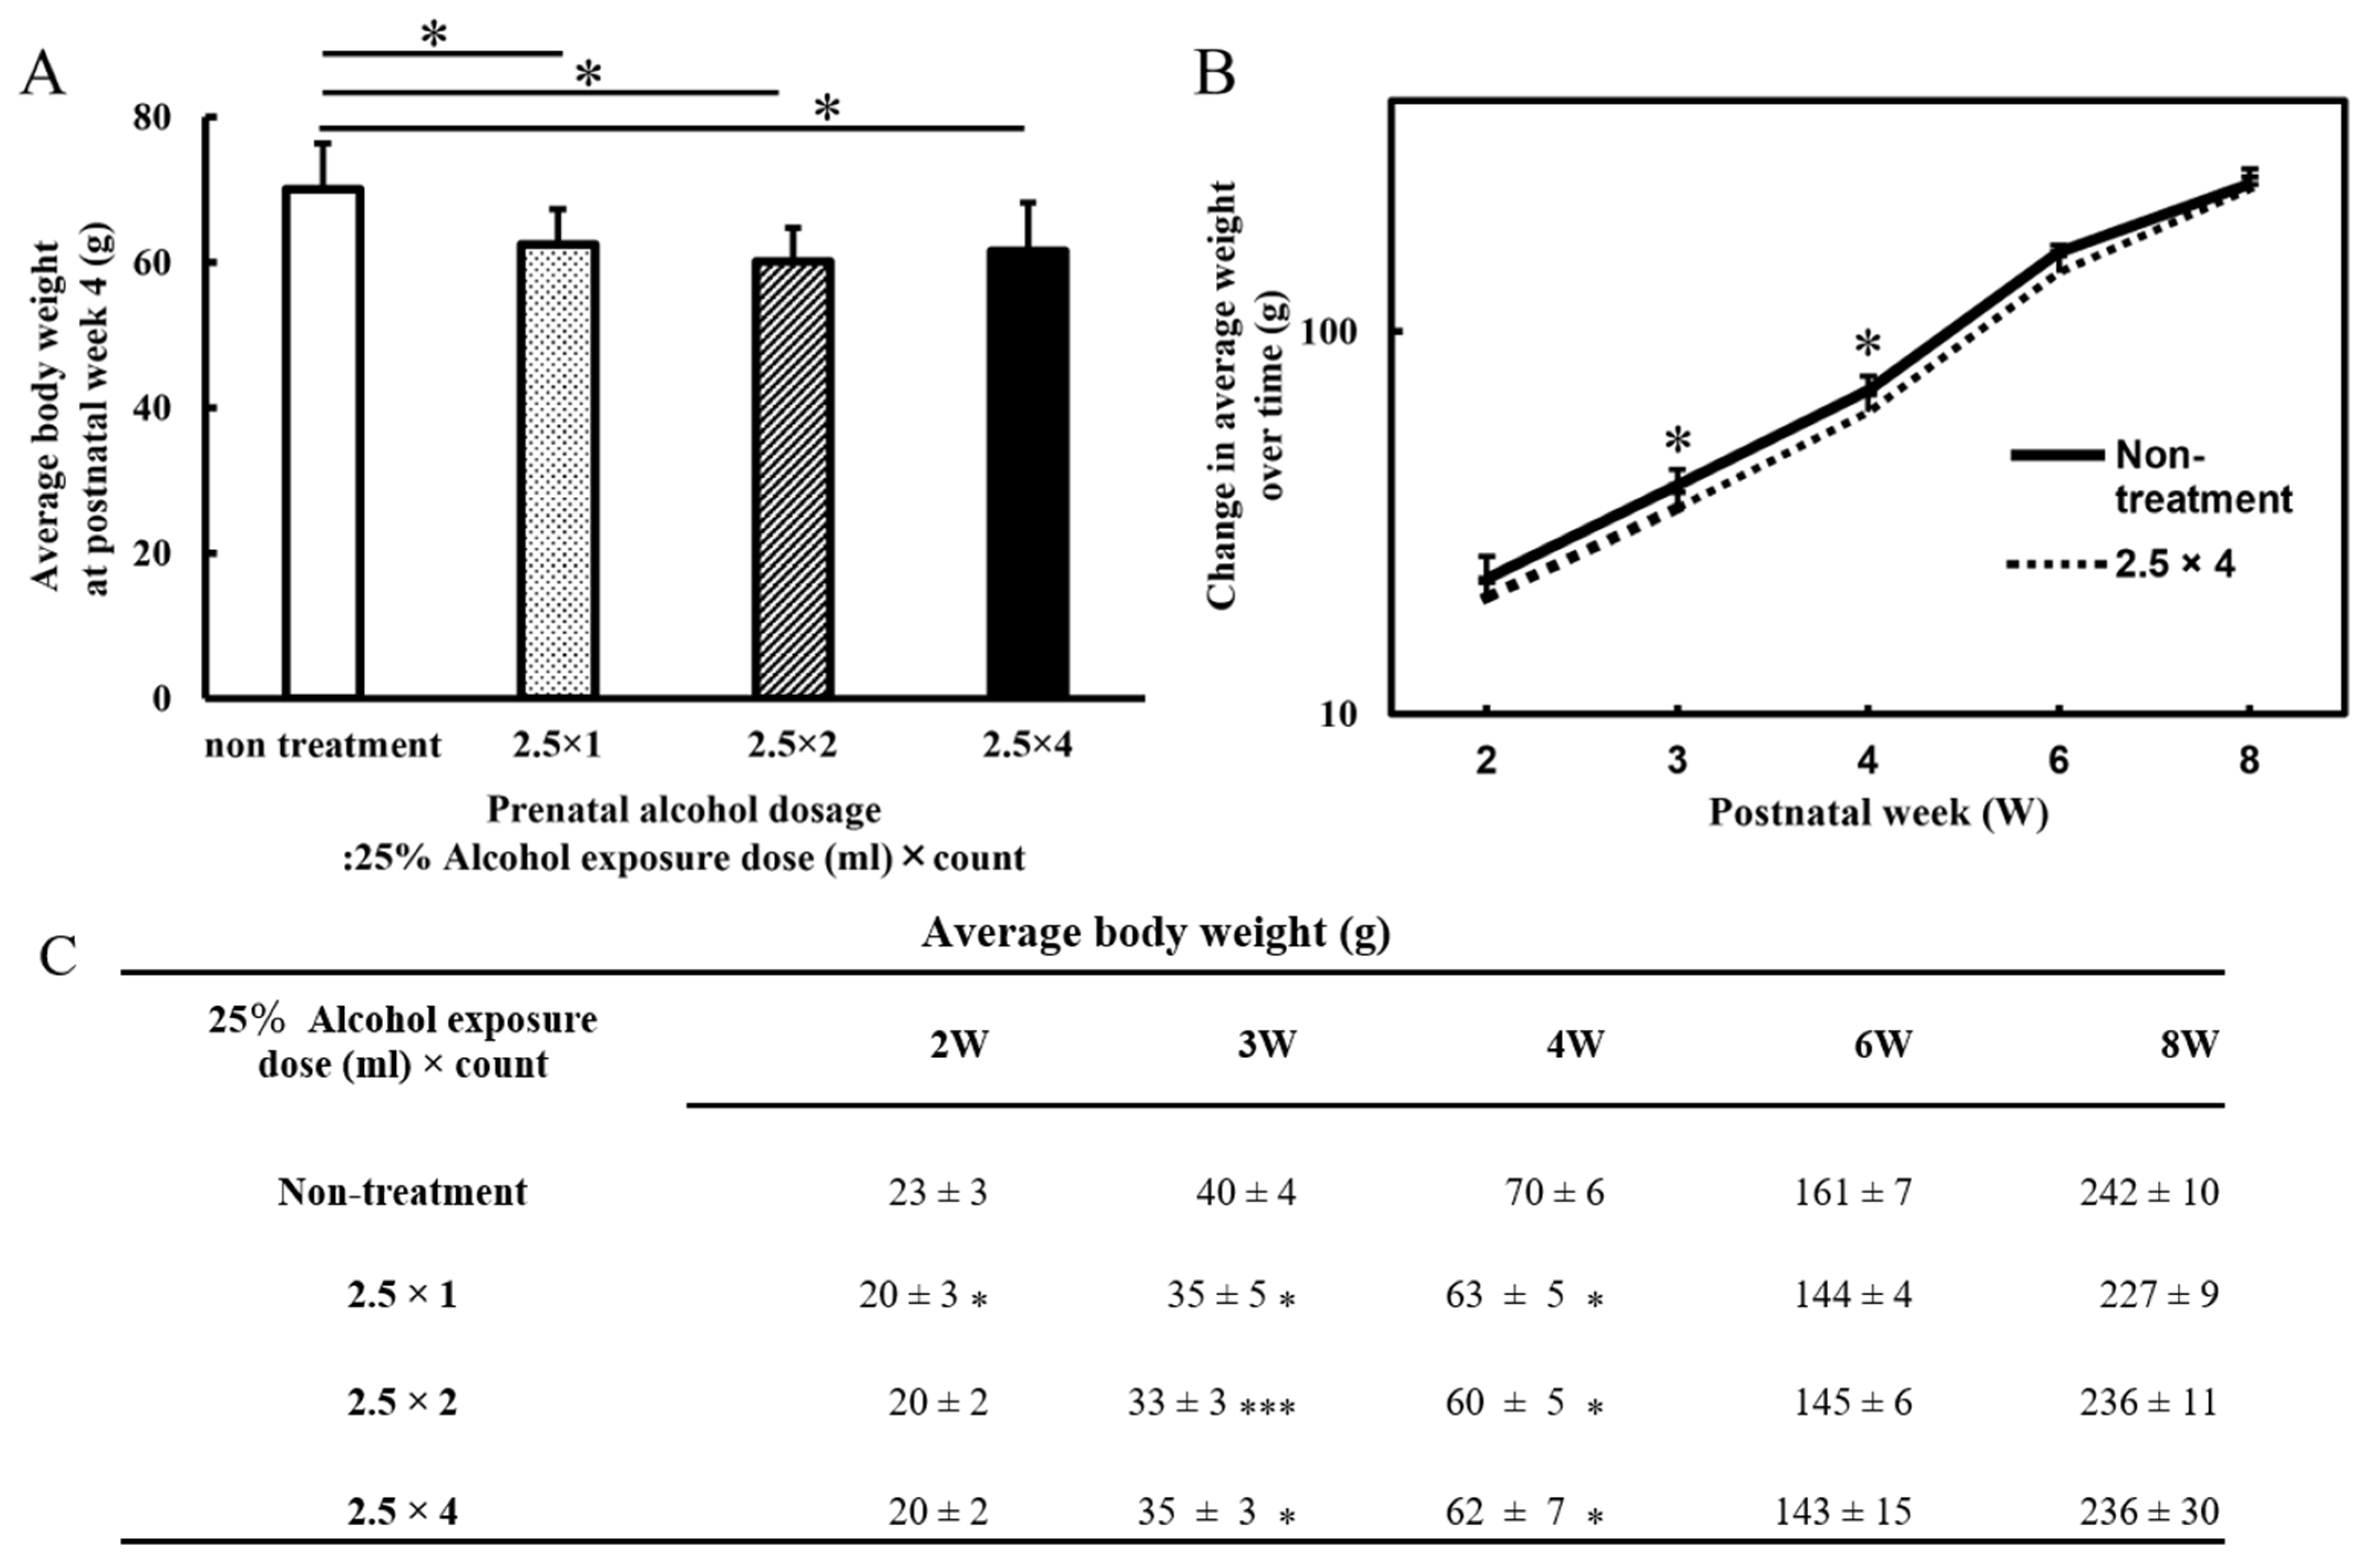
3.1. Body Weight
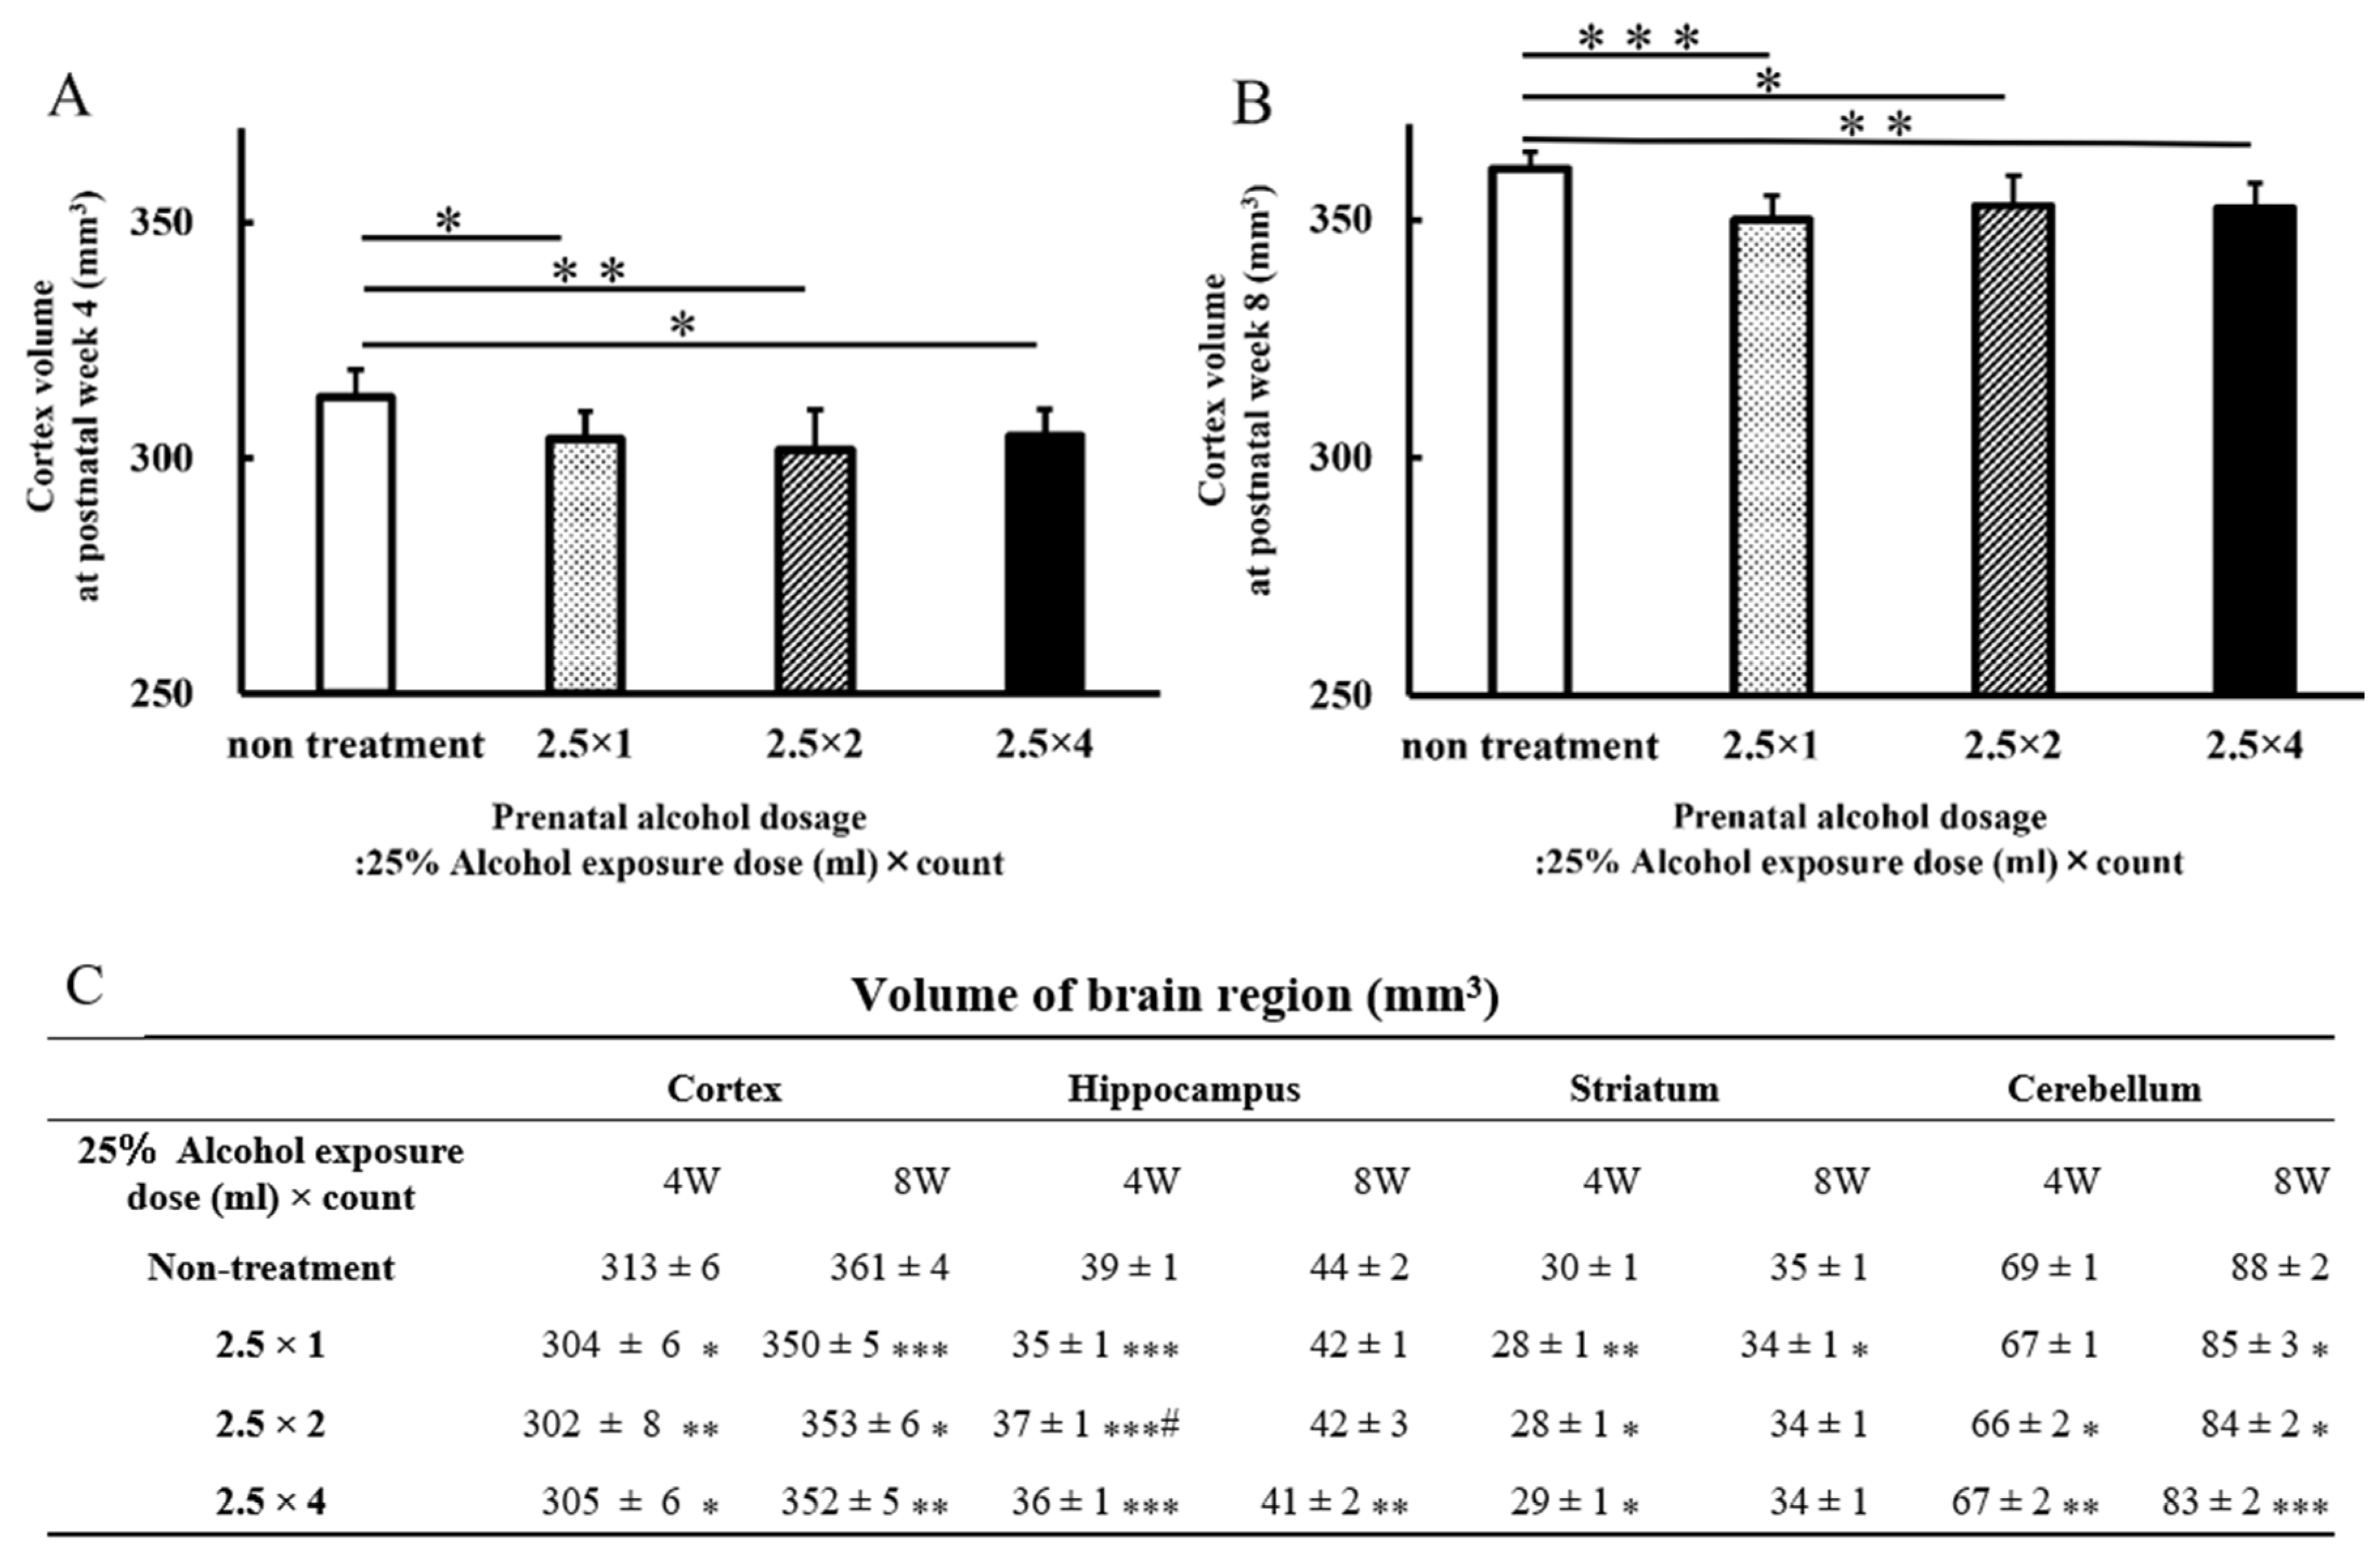
3.2. Brain Volumes
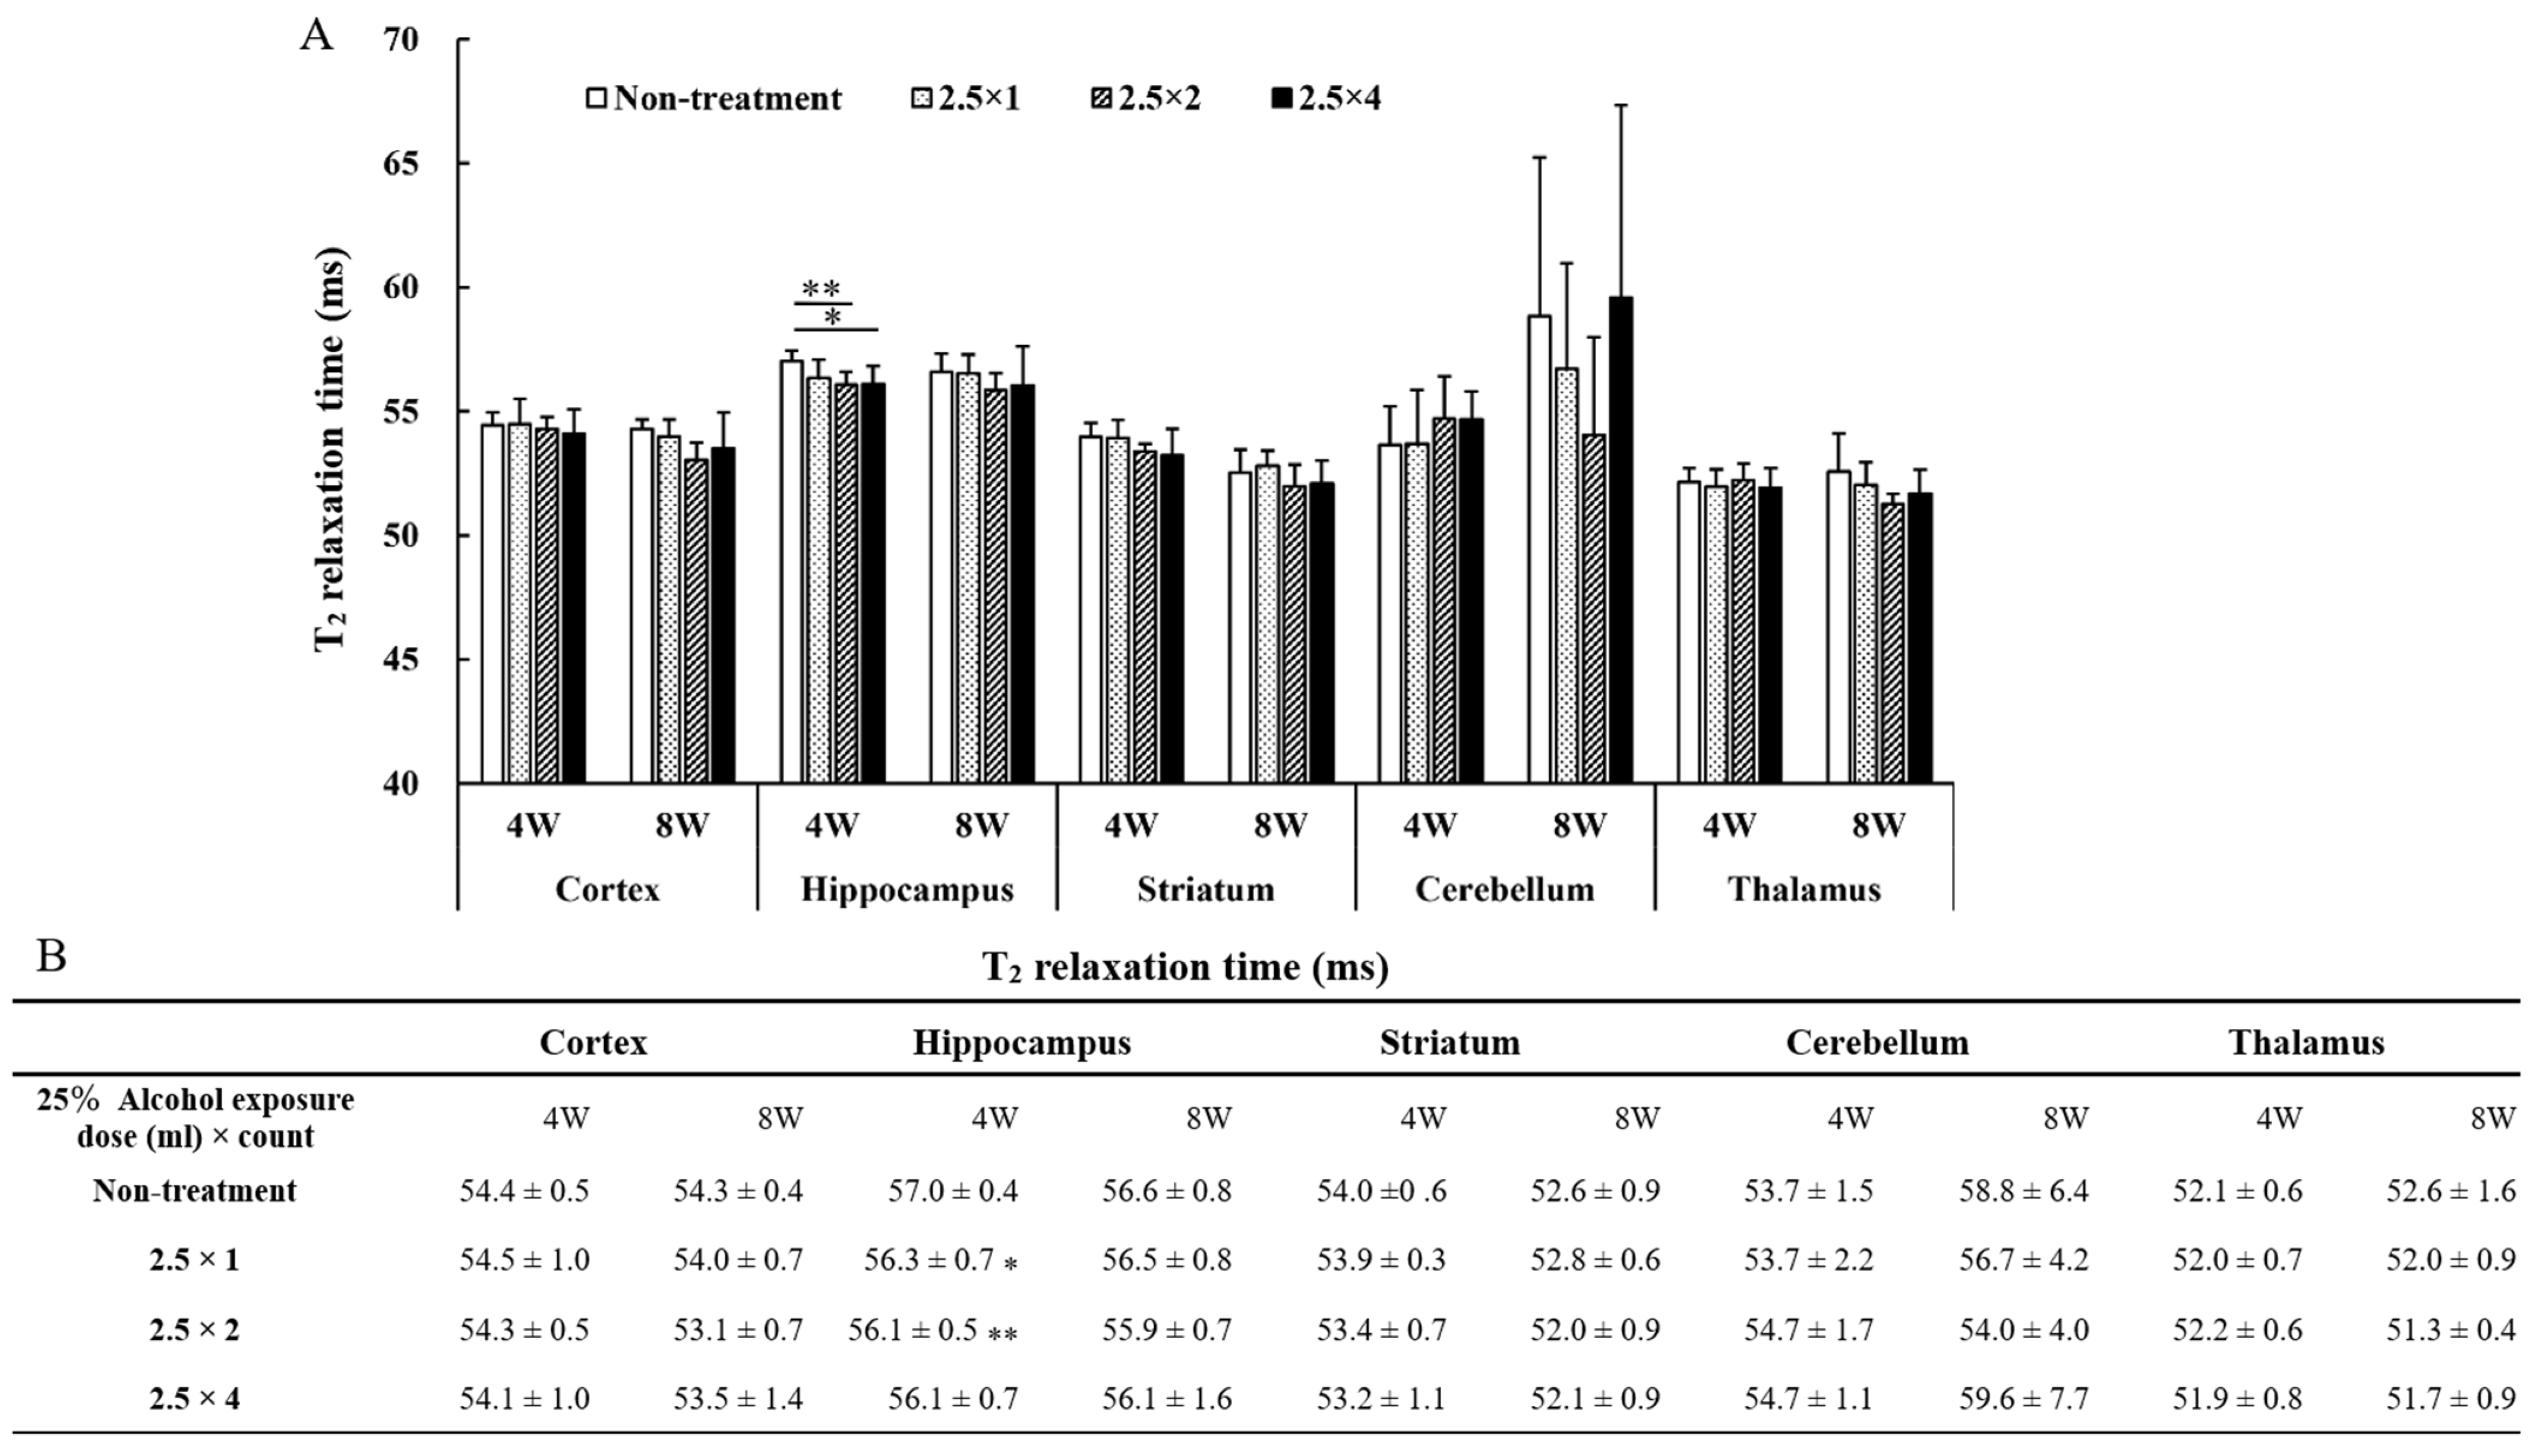
3.3. T2 Relaxation Time
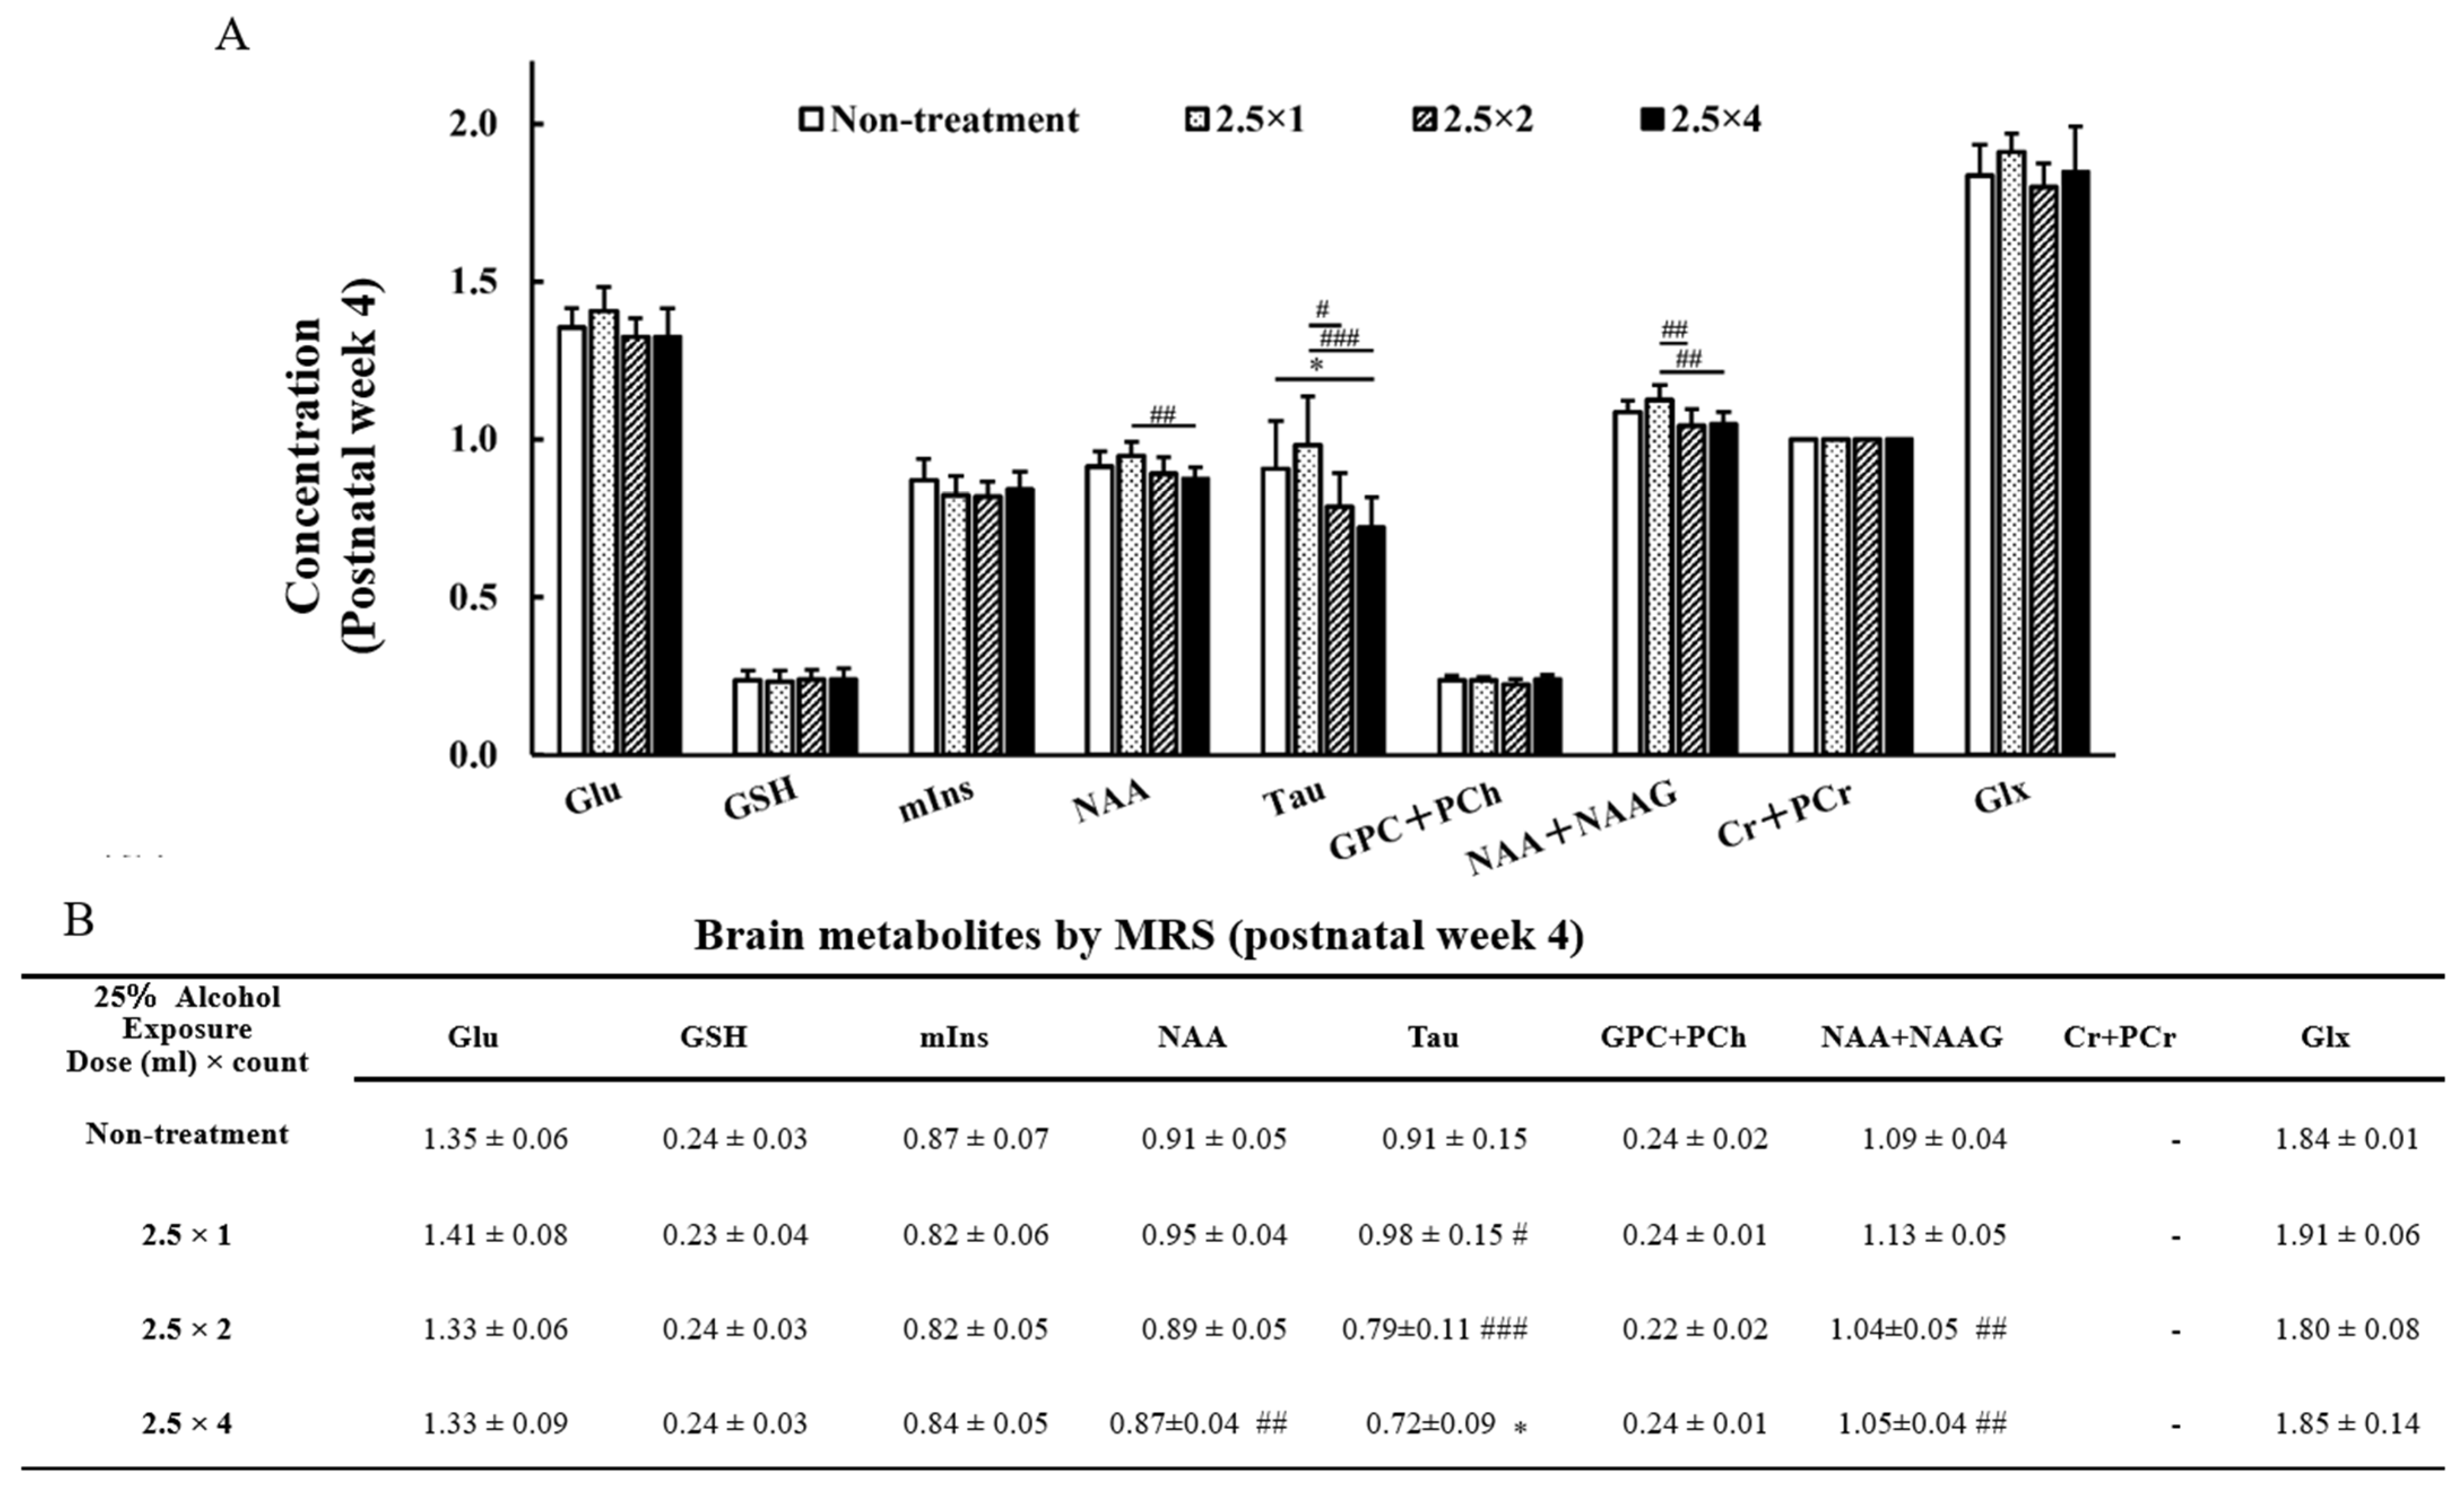
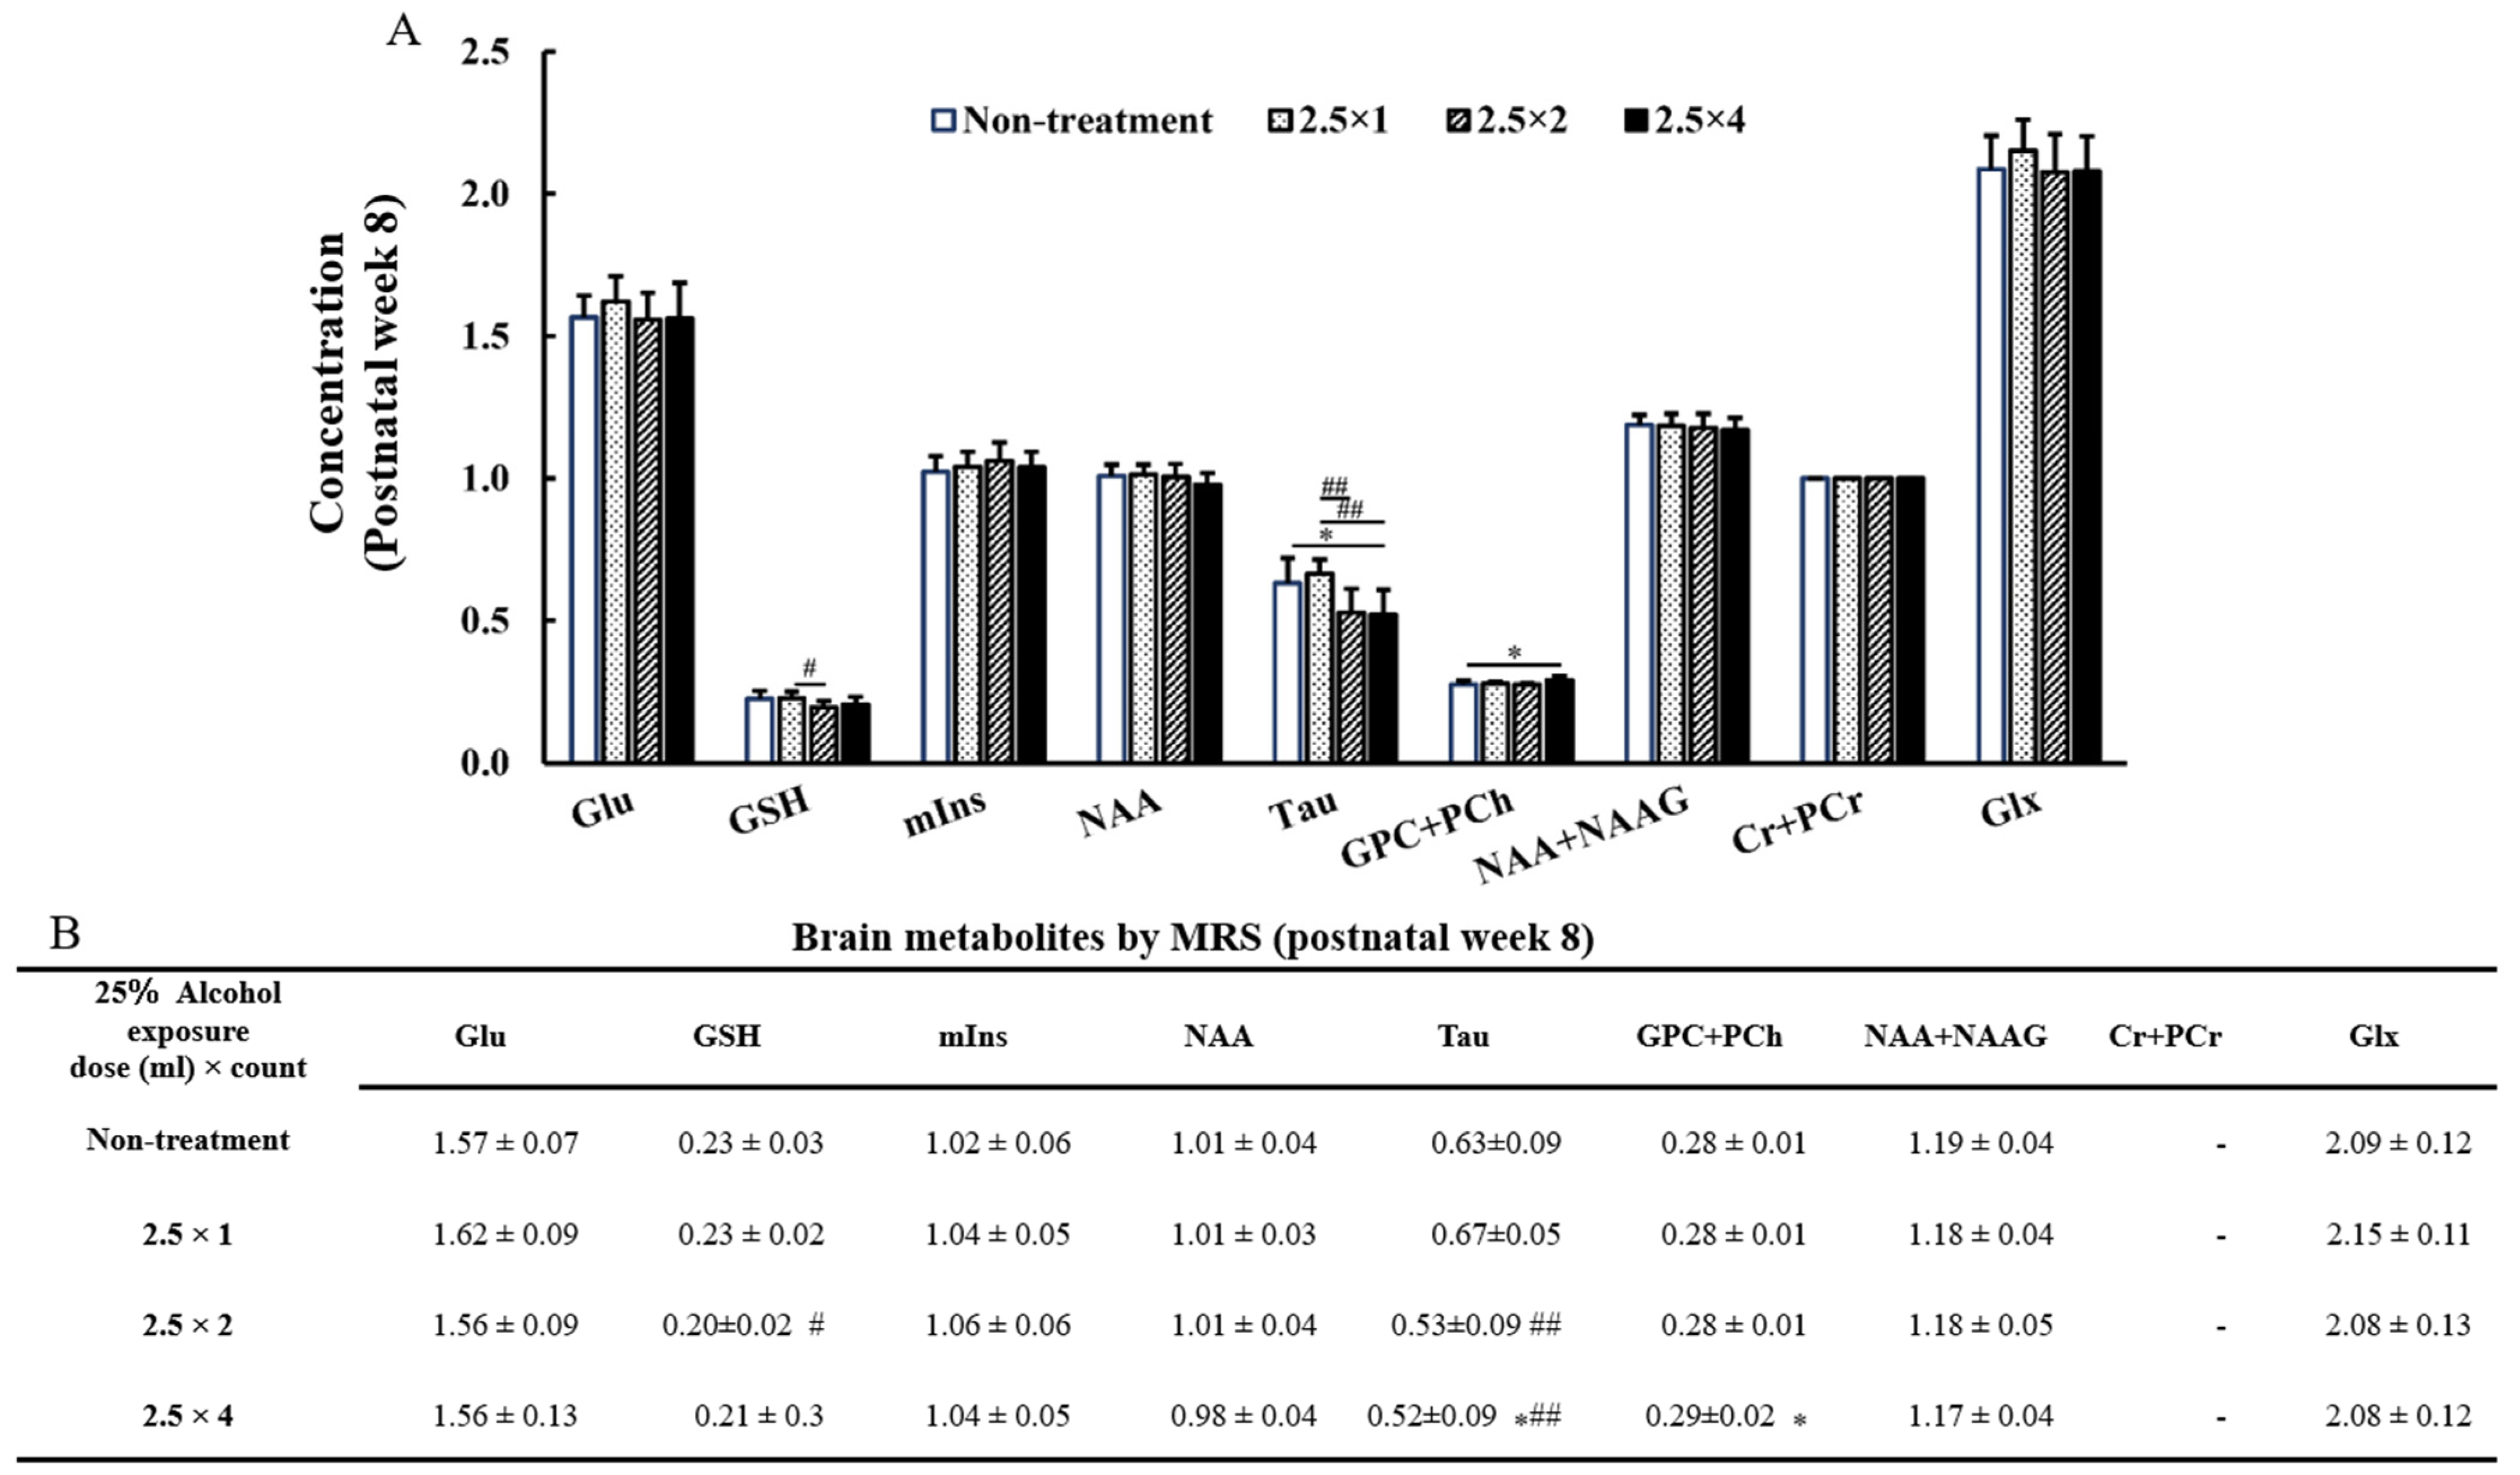
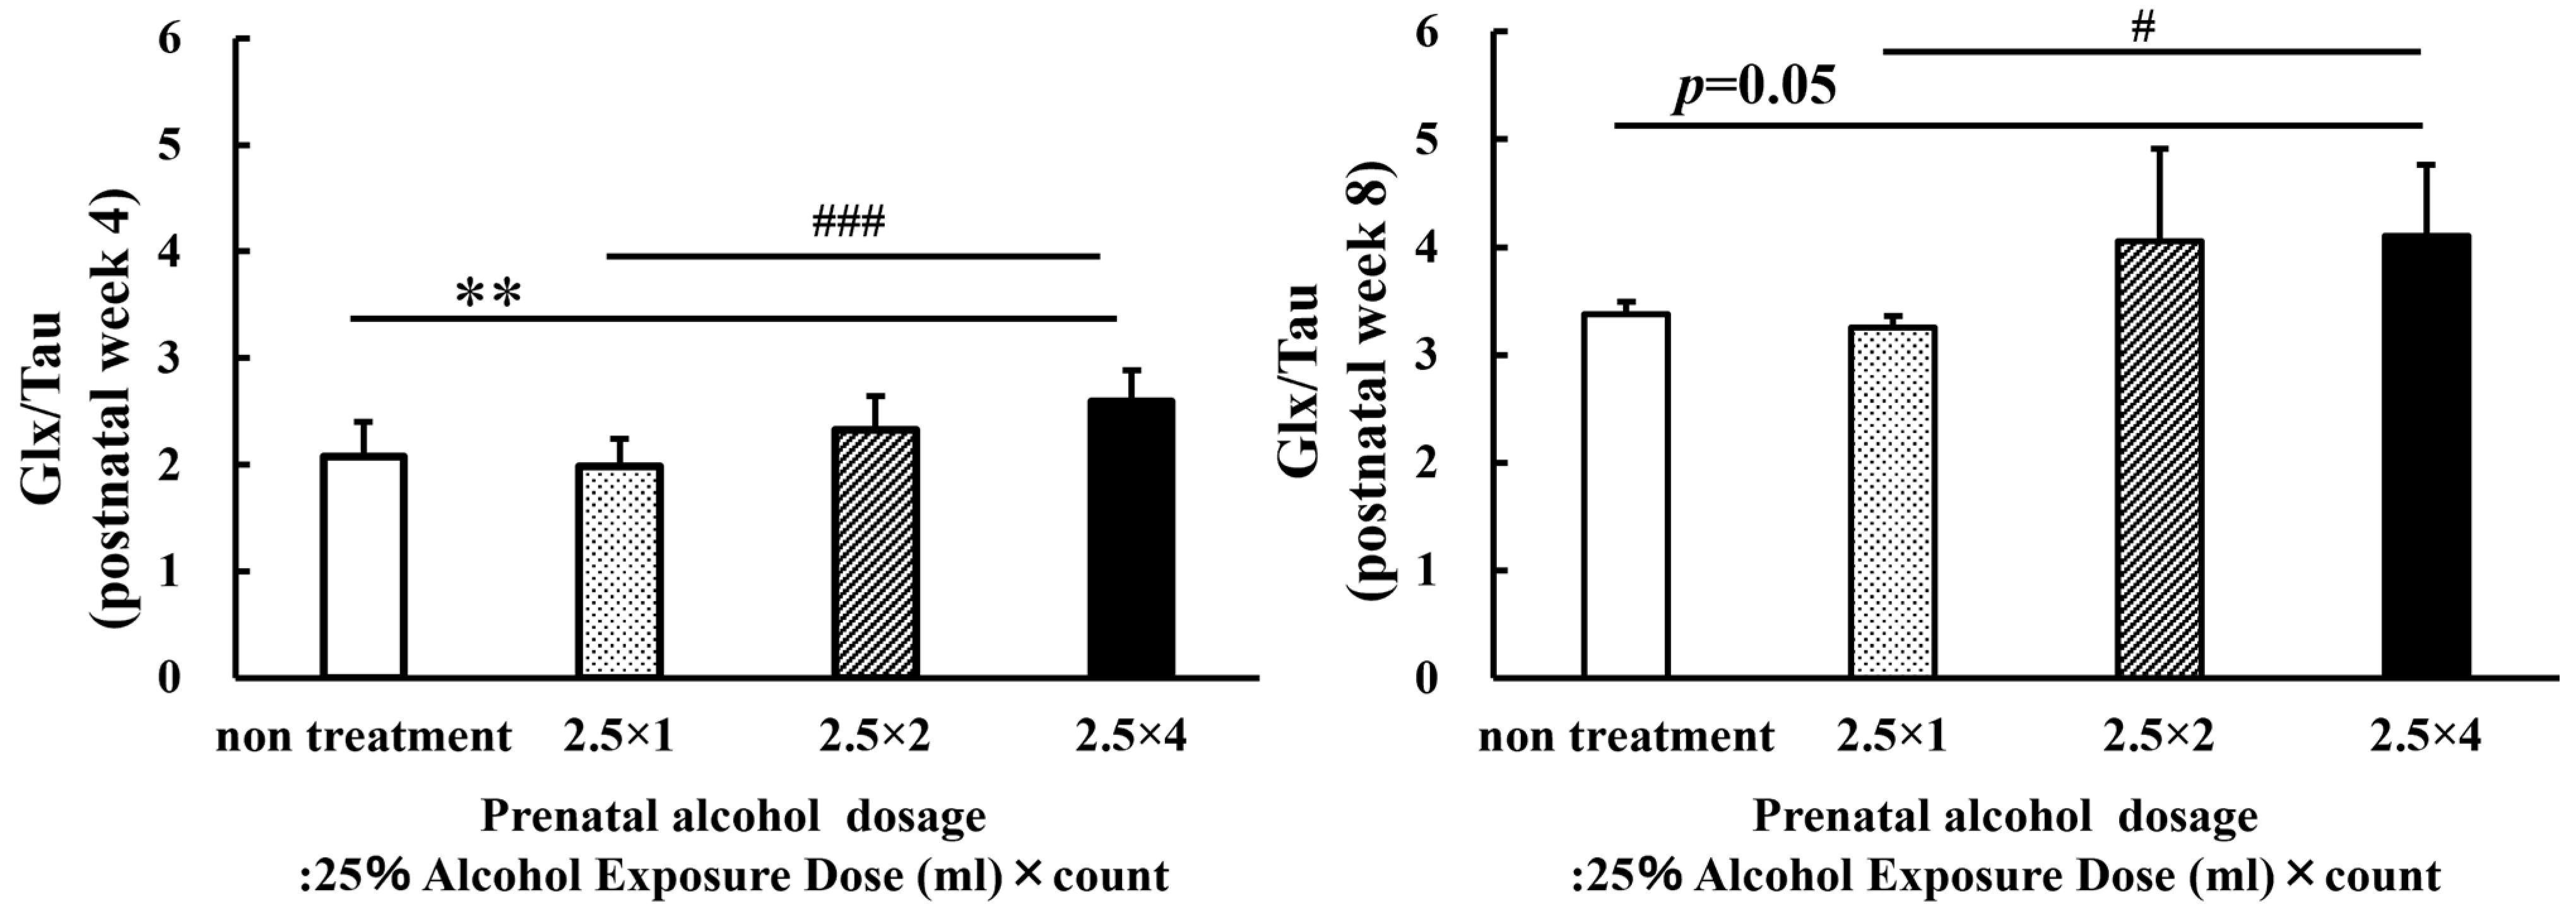
3.4. MRS Brain Metabolites
3.5. NAA + NAAG, NAA at 4 Weeks of Age
3.6. GPC + PCh, GSH at 8 Weeks of Age
4. Discussion
4.1. Alteration of Body Weight and MRI Parameters in FASD Rats
4.2. Brain Metabolites in FASD Rats Measured Using MRS
4.3. Limitations
5. Conclusions
Author Contributions
Funding
Institutional Review Board Statement
Informed Consent Statement
Data Availability Statement
Conflicts of Interest
References
- Hoyme, H.E.; Kalberg, W.O.; Elliott, A.J.; Blankenship, J.; Buckley, D.; Marais, A.S.; Manning, M.A.; Robinson, L.K.; Adam, M.P.; Abdul-Rahman, O.; et al. Updated Clinical Guidelines for Diagnosing Fetal Alcohol Spectrum Disorders. Pediatrics 2016, 138, e20154256. [Google Scholar] [CrossRef] [PubMed] [Green Version]
- Correction to Lancet Glob Health 2017; 5: e290–99. Lancet Glob. Health 2017, 5, e276. [CrossRef] [PubMed] [Green Version]
- Chasnoff, I.J.; Wells, A.M.; King, L. Misdiagnosis and missed diagnoses in foster and adopted children with prenatal alcohol exposure. Pediatrics 2015, 135, 264–270. [Google Scholar] [CrossRef] [PubMed] [Green Version]
- Wozniak, J.R.; Riley, E.P.; Charness, M.E. Clinical presentation, diagnosis, and management of fetal alcohol spectrum disorder. Lancet Neurol. 2019, 18, 760–770. [Google Scholar] [CrossRef] [PubMed]
- O’Leary-Moore, S.K.; Parnell, S.E.; Lipinski, R.J.; Sulik, K.K. Magnetic resonance-based imaging in animal models of fetal alcohol spectrum disorder. Neuropsychol. Rev. 2011, 21, 167–185. [Google Scholar] [CrossRef] [PubMed] [Green Version]
- Higashiyama, D.; Saitsu, H.; Komada, M.; Takigawa, T.; Ishibashi, M.; Shiota, K. Sequential developmental changes in holoprosencephalic mouse embryos exposed to ethanol during the gastrulation period. Birth Defects Res. Part A Clin. Mol. Teratol. 2007, 79, 513–523. [Google Scholar] [CrossRef] [Green Version]
- Archibald, S.L.; Fennema-Notestine, C.; Gamst, A.; Riley, E.P.; Mattson, S.N.; Jernigan, T.L. Brain dysmorphology in individuals with severe prenatal alcohol exposure. Dev. Med. Child Neurol. 2001, 43, 148–154. [Google Scholar] [CrossRef] [Green Version]
- Ucar, M.; Tokgoz, N.; Damar, C.; Alimli, A.G.; Oncu, F. Diagnostic performance of heavily T2-weighted techniques in obstructive hydrocephalus: Comparison study of two different 3D heavily T2-weighted and conventional T2-weighted sequences. Jpn. J. Radiol. 2015, 33, 94–101. [Google Scholar] [CrossRef]
- Kartal, M.G.; Algin, O. Evaluation of hydrocephalus and other cerebrospinal fluid disorders with MRI: An update. Insights Imaging 2014, 5, 531–541. [Google Scholar] [CrossRef] [Green Version]
- de la Monte, S.M.; Kril, J.J. Human alcohol-related neuropathology. Acta Neuropathol. 2014, 127, 71–90. [Google Scholar] [CrossRef]
- Fagerlund, A.; Heikkinen, S.; Autti-Ramo, I.; Korkman, M.; Timonen, M.; Kuusi, T.; Riley, E.P.; Lundbom, N. Brain metabolic alterations in adolescents and young adults with fetal alcohol spectrum disorders. Alcohol. Clin. Exp. Res. 2006, 30, 2097–2104. [Google Scholar] [CrossRef]
- Cortese, B.M.; Moore, G.J.; Bailey, B.A.; Jacobson, S.W.; Delaney-Black, V.; Hannigan, J.H. Magnetic resonance and spectroscopic imaging in prenatal alcohol-exposed children: Preliminary findings in the caudate nucleus. Neurotoxicol. Teratol. 2006, 28, 597–606. [Google Scholar] [CrossRef]
- Connor, P.D.; Sampson, P.D.; Streissguth, A.P.; Bookstein, F.L.; Barr, H.M. Effects of prenatal alcohol exposure on fine motor coordination and balance: A study of two adult samples. Neuropsychologia 2006, 44, 744–751. [Google Scholar] [CrossRef]
- O’Leary-Moore, S.K.; McMechan, A.P.; Galloway, M.P.; Hannigan, J.H. Neonatal alcohol-induced region-dependent changes in rat brain neurochemistry measured by high-resolution magnetic resonance spectroscopy. Alcohol. Clin. Exp. Res. 2008, 32, 1697–1707. [Google Scholar] [CrossRef]
- Ripps, H.; Shen, W. Review: Taurine: A “very essential” amino acid. Mol. Vis. 2012, 18, 2673–2686. [Google Scholar]
- Ramirez-Guerrero, S.; Guardo-Maya, S.; Medina-Rincon, G.J.; Orrego-Gonzalez, E.E.; Cabezas-Perez, R.; Gonzalez-Reyes, R.E. Taurine and Astrocytes: A Homeostatic and Neuroprotective Relationship. Front. Mol. Neurosci. 2022, 15, 937789. [Google Scholar] [CrossRef]
- Wang, X.; Kroenke, C.D. Utilization of Magnetic Resonance Imaging in Research Involving Animal Models of Fetal Alcohol Spectrum Disorders. Alcohol Res. 2015, 37, 39–51. [Google Scholar]
- Lunde-Young, R.; Davis-Anderson, K.; Naik, V.; Nemec, M.; Wu, G.; Ramadoss, J. Regional dysregulation of taurine and related amino acids in the fetal rat brain following gestational alcohol exposure. Alcohol 2018, 66, 27–33. [Google Scholar] [CrossRef]
- Taranukhin, A.G.; Taranukhina, E.Y.; Saransaari, P.; Pelto-Huikko, M.; Podkletnova, I.M.; Oja, S.S. Taurine protects cerebellar neurons of the external granular layer against ethanol-induced apoptosis in 7-day-old mice. Amino Acids 2012, 43, 1705–1711. [Google Scholar] [CrossRef]
- Zhao, H.; Qu, J.; Li, Q.; Cui, M.; Wang, J.; Zhang, K.; Liu, X.; Feng, H.; Chen, Y. Taurine supplementation reduces neuroinflammation and protects against white matter injury after intracerebral hemorrhage in rats. Amino Acids 2018, 50, 439–451. [Google Scholar] [CrossRef]
- Menzie, J.; Prentice, H.; Wu, J.Y. Neuroprotective Mechanisms of Taurine against Ischemic Stroke. Brain Sci. 2013, 3, 877–907. [Google Scholar] [CrossRef] [PubMed] [Green Version]
- Lang, F.; Busch, G.L.; Ritter, M.; Volkl, H.; Waldegger, S.; Gulbins, E.; Haussinger, D. Functional significance of cell volume regulatory mechanisms. Physiol. Rev. 1998, 78, 247–306. [Google Scholar] [CrossRef]
- Yancey, P.H.; Clark, M.E.; Hand, S.C.; Bowlus, R.D.; Somero, G.N. Living with water stress: Evolution of osmolyte systems. Science 1982, 217, 1214–1222. [Google Scholar] [CrossRef] [PubMed]
- Saito, S.; Takahashi, Y.; Ohki, A.; Shintani, Y.; Higuchi, T. Early detection of elevated lactate levels in a mitochondrial disease model using chemical exchange saturation transfer (CEST) and magnetic resonance spectroscopy (MRS) at 7T-MRI. Radiol. Phys. Technol. 2019, 12, 46–54. [Google Scholar] [CrossRef] [PubMed]
- Provencher, S.W. Automatic quantitation of localized in vivo 1H spectra with LCModel. NMR Biomed. 2001, 14, 260–264. [Google Scholar] [CrossRef]
- Maier, S.E.; Chen, W.J.; Miller, J.A.; West, J.R. Fetal alcohol exposure and temporal vulnerability regional differences in alcohol-induced microencephaly as a function of the timing of binge-like alcohol exposure during rat brain development. Alcohol. Clin. Exp. Res. 1997, 21, 1418–1425. [Google Scholar] [CrossRef]
- Ananchaipatana-Auitragoon, P.; Ananchaipatana-Auitragoon, Y.; Siripornpanich, V.; Kotchabhakdi, N. Protective role of taurine in developing offspring affected by maternal alcohol consumption. EXCLI J. 2015, 14, 660–671. [Google Scholar] [CrossRef]
- Norman, A.L.; Crocker, N.; Mattson, S.N.; Riley, E.P. Neuroimaging and fetal alcohol spectrum disorders. Dev. Disabil. Res. Rev. 2009, 15, 209–217. [Google Scholar] [CrossRef] [Green Version]
- Jarmasz, J.S.; Basalah, D.A.; Chudley, A.E.; Del Bigio, M.R. Human Brain Abnormalities Associated With Prenatal Alcohol Exposure and Fetal Alcohol Spectrum Disorder. Neuropathol. Exp. Neurol. 2017, 76, 813–833. [Google Scholar] [CrossRef] [Green Version]
- Lee, J.; Naik, V.; Orzabal, M.; Lunde-Young, R.; Ramadoss, J. Morphological alteration in rat hippocampal neuronal dendrites following chronic binge prenatal alcohol exposure. Brain Res. 2021, 1768, 147587. [Google Scholar] [CrossRef]
- Sullivan, E.V.; Sable, H.J.; Strother, W.N.; Friedman, D.P.; Davenport, A.; Tillman-Smith, H.; Kraft, R.A.; Wyatt, C.; Szeliga, K.T.; Buchheimer, N.C.; et al. Neuroimaging of rodent and primate models of alcoholism: Initial reports from the integrative neuroscience initiative on alcoholism. Alcohol. Clin. Exp. Res. 2005, 29, 287–294. [Google Scholar] [CrossRef]
- Zahr, N.M.; Pfefferbaum, A. Alcohol’s Effects on the Brain: Neuroimaging Results in Humans and Animal Models. Alcohol Res. 2017, 38, 183–206. [Google Scholar]
- Gursky, Z.H.; Spillman, E.C.; Klintsova, A.Y. Single-day Postnatal Alcohol Exposure Induces Apoptotic Cell Death and Causes long-term Neuron Loss in Rodent Thalamic Nucleus Reuniens. Neuroscience 2020, 435, 124–134. [Google Scholar] [CrossRef]
- Anton-Bolanos, N.; Espinosa, A.; Lopez-Bendito, G. Developmental interactions between thalamus and cortex: A true love reciprocal story. Curr. Opin. Neurobiol. 2018, 52, 33–41. [Google Scholar] [CrossRef]
- Baggio, S.; Zenki, K.; Martins Silva, A.; Dos Santos, T.G.; Rech, G.; Lazzarotto, G.; Dias, R.D.; Mussulini, B.H.; Rico, E.P.; de Oliveira, D.L. Fetal alcohol spectrum disorders model alters the functionality of glutamatergic neurotransmission in adult zebrafish. Neurotoxicology 2020, 78, 152–160. [Google Scholar] [CrossRef]
- Howells, F.M.; Donald, K.A.; Roos, A.; Woods, R.P.; Zar, H.J.; Narr, K.L.; Stein, D.J. Reduced glutamate in white matter of male neonates exposed to alcohol in utero: A (1)H-magnetic resonance spectroscopy study. Metab. Brain Dis. 2016, 31, 1105–1112. [Google Scholar] [CrossRef]
- du Plessis, L.; Jacobson, J.L.; Jacobson, S.W.; Hess, A.T.; van der Kouwe, A.; Avison, M.J.; Molteno, C.D.; Stanton, M.E.; Stanley, J.A.; Peterson, B.S.; et al. An in vivo 1H magnetic resonance spectroscopy study of the deep cerebellar nuclei in children with fetal alcohol spectrum disorders. Alcohol. Clin. Exp. Res. 2014, 38, 1330–1338. [Google Scholar] [CrossRef] [Green Version]
- Albrecht, J.; Norenberg, M.D. Glutamine: A Trojan horse in ammonia neurotoxicity. Hepatology 2006, 44, 788–794. [Google Scholar] [CrossRef]
- Banerjee, R.; Vitvitsky, V.; Garg, S.K. The undertow of sulfur metabolism on glutamatergic neurotransmission. Trends Biochem. Sci. 2008, 33, 413–419. [Google Scholar] [CrossRef]
- Aragon, C.M.; Trudeau, L.E.; Amit, Z. Effect of taurine on ethanol-induced changes in open-field locomotor activity. Psychopharmacology 1992, 107, 337–340. [Google Scholar] [CrossRef]
- Xu, S.; Zhu, W.; Wan, Y.; Wang, J.; Chen, X.; Pi, L.; Lobo, M.K.; Ren, B.; Ying, Z.; Morris, M.; et al. Decreased Taurine and Creatine in the Thalamus May Relate to Behavioral Impairments in Ethanol-Fed Mice: A Pilot Study of Proton Magnetic Resonance Spectroscopy. Mol. Imaging 2018, 17, 1536012117749051. [Google Scholar] [CrossRef] [PubMed]
- Demougeot, C.; Marie, C.; Giroud, M.; Beley, A. N-acetylaspartate: A literature review of animal research on brain ischaemia. J. Neurochem. 2004, 90, 776–783. [Google Scholar] [CrossRef] [PubMed]
- Stanley, J.A.; Vemulapalli, M.; Nutche, J.; Montrose, D.M.; Sweeney, J.A.; Pettegrew, J.W.; MacMaster, F.P.; Keshavan, M.S. Reduced N-acetyl-aspartate levels in schizophrenia patients with a younger onset age: A single-voxel 1H spectroscopy study. Schizophr. Res. 2007, 93, 23–32. [Google Scholar] [CrossRef] [PubMed] [Green Version]
- Lopez-Sobaler, A.M.; Lorenzo Mora, A.M.; Salas Gonzalez, M.; Peral Suarez, A.; Aparicio, A.; Ortega, R.M. Importance of choline in cognitive function. Nutr. Hosp. 2021, 37, 18–23. [Google Scholar] [CrossRef]
- Astley, S.J.; Richards, T.; Aylward, E.H.; Olson, H.C.; Kerns, K.; Brooks, A.; Coggins, T.E.; Davies, J.; Dorn, S.; Gendler, B.; et al. Magnetic resonance spectroscopy outcomes from a comprehensive magnetic resonance study of children with fetal alcohol spectrum disorders. Magn. Reson. Imaging 2009, 27, 760–778. [Google Scholar] [CrossRef] [Green Version]
- Aoyama, K. Glutathione in the Brain. Int. J. Mol. Sci. 2021, 22, 5010. [Google Scholar] [CrossRef]


Disclaimer/Publisher’s Note: The statements, opinions and data contained in all publications are solely those of the individual author(s) and contributor(s) and not of MDPI and/or the editor(s). MDPI and/or the editor(s) disclaim responsibility for any injury to people or property resulting from any ideas, methods, instructions or products referred to in the content. |
© 2023 by the authors. Licensee MDPI, Basel, Switzerland. This article is an open access article distributed under the terms and conditions of the Creative Commons Attribution (CC BY) license (https://creativecommons.org/licenses/by/4.0/).
Share and Cite
Nakano, T.; Natsuyama, T.; Tsuji, N.; Katayama, N.; Ueda, J.; Saito, S. Longitudinal Evaluation Using Preclinical 7T-Magnetic Resonance Imaging/Spectroscopy on Prenatally Dose-Dependent Alcohol-Exposed Rats. Metabolites 2023, 13, 527. https://doi.org/10.3390/metabo13040527
Nakano T, Natsuyama T, Tsuji N, Katayama N, Ueda J, Saito S. Longitudinal Evaluation Using Preclinical 7T-Magnetic Resonance Imaging/Spectroscopy on Prenatally Dose-Dependent Alcohol-Exposed Rats. Metabolites. 2023; 13(4):527. https://doi.org/10.3390/metabo13040527
Chicago/Turabian StyleNakano, Tensei, Tomohiro Natsuyama, Naoki Tsuji, Nanami Katayama, Junpei Ueda, and Shigeyoshi Saito. 2023. "Longitudinal Evaluation Using Preclinical 7T-Magnetic Resonance Imaging/Spectroscopy on Prenatally Dose-Dependent Alcohol-Exposed Rats" Metabolites 13, no. 4: 527. https://doi.org/10.3390/metabo13040527