
Plasma Lipidomic and Metabolomic Profiling after Birth in Neonates Born to SARS-CoV-19 Infected and Non-Infected Mothers at Delivery: Preliminary Results

 , , , , and
Abstract
:1. Introduction
2. Results
2.1. Study Population
2.2. Metabolomics Analysis
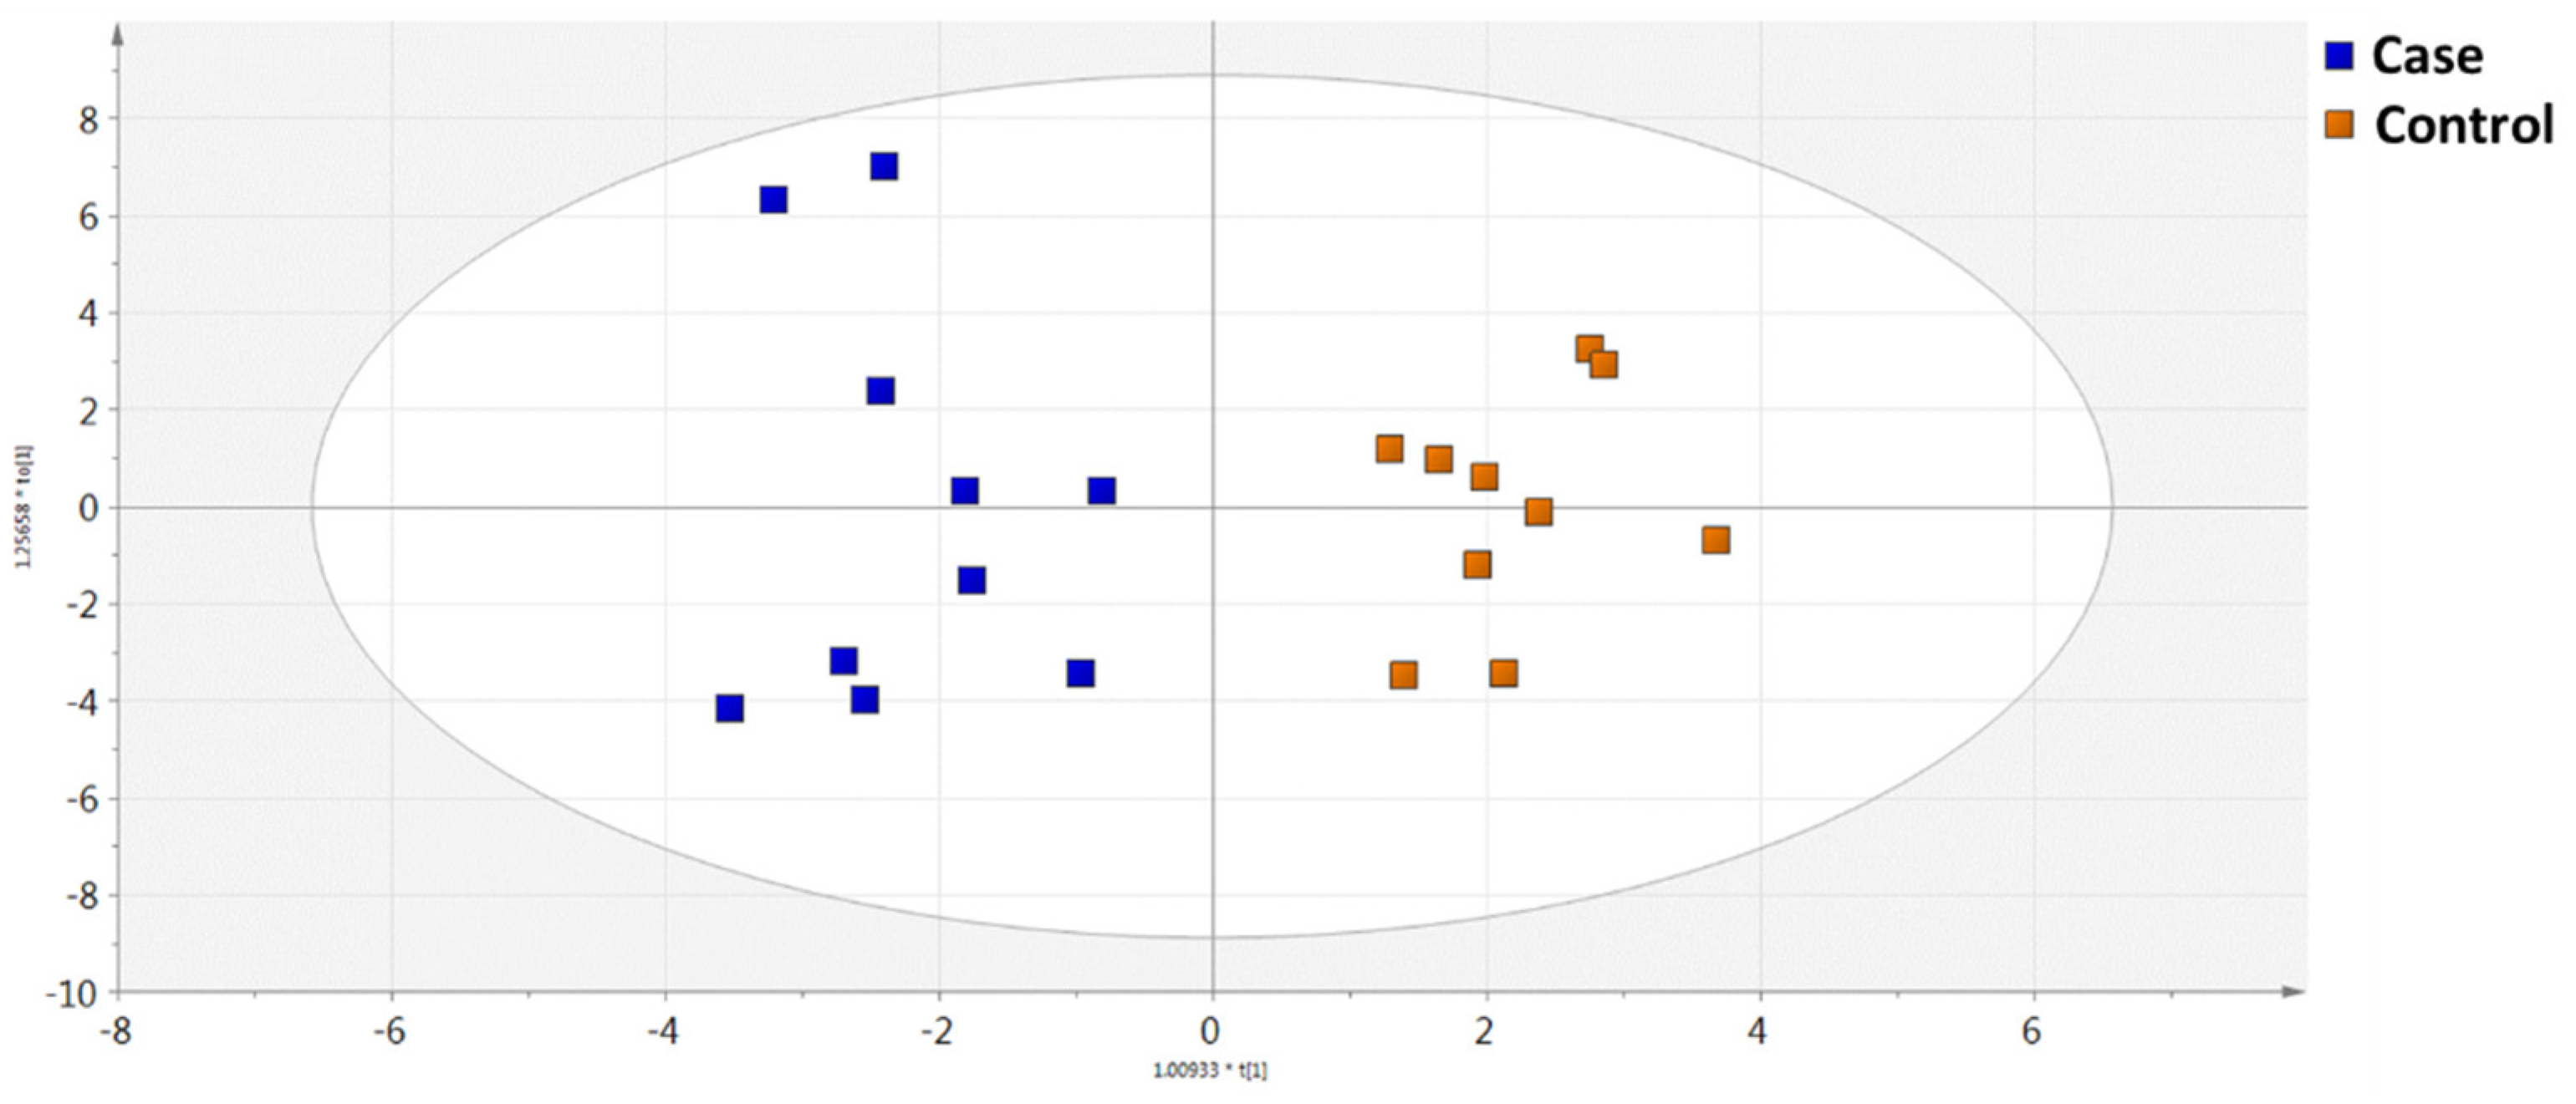
2.2.1. GC-MS Metabolomics Analysis
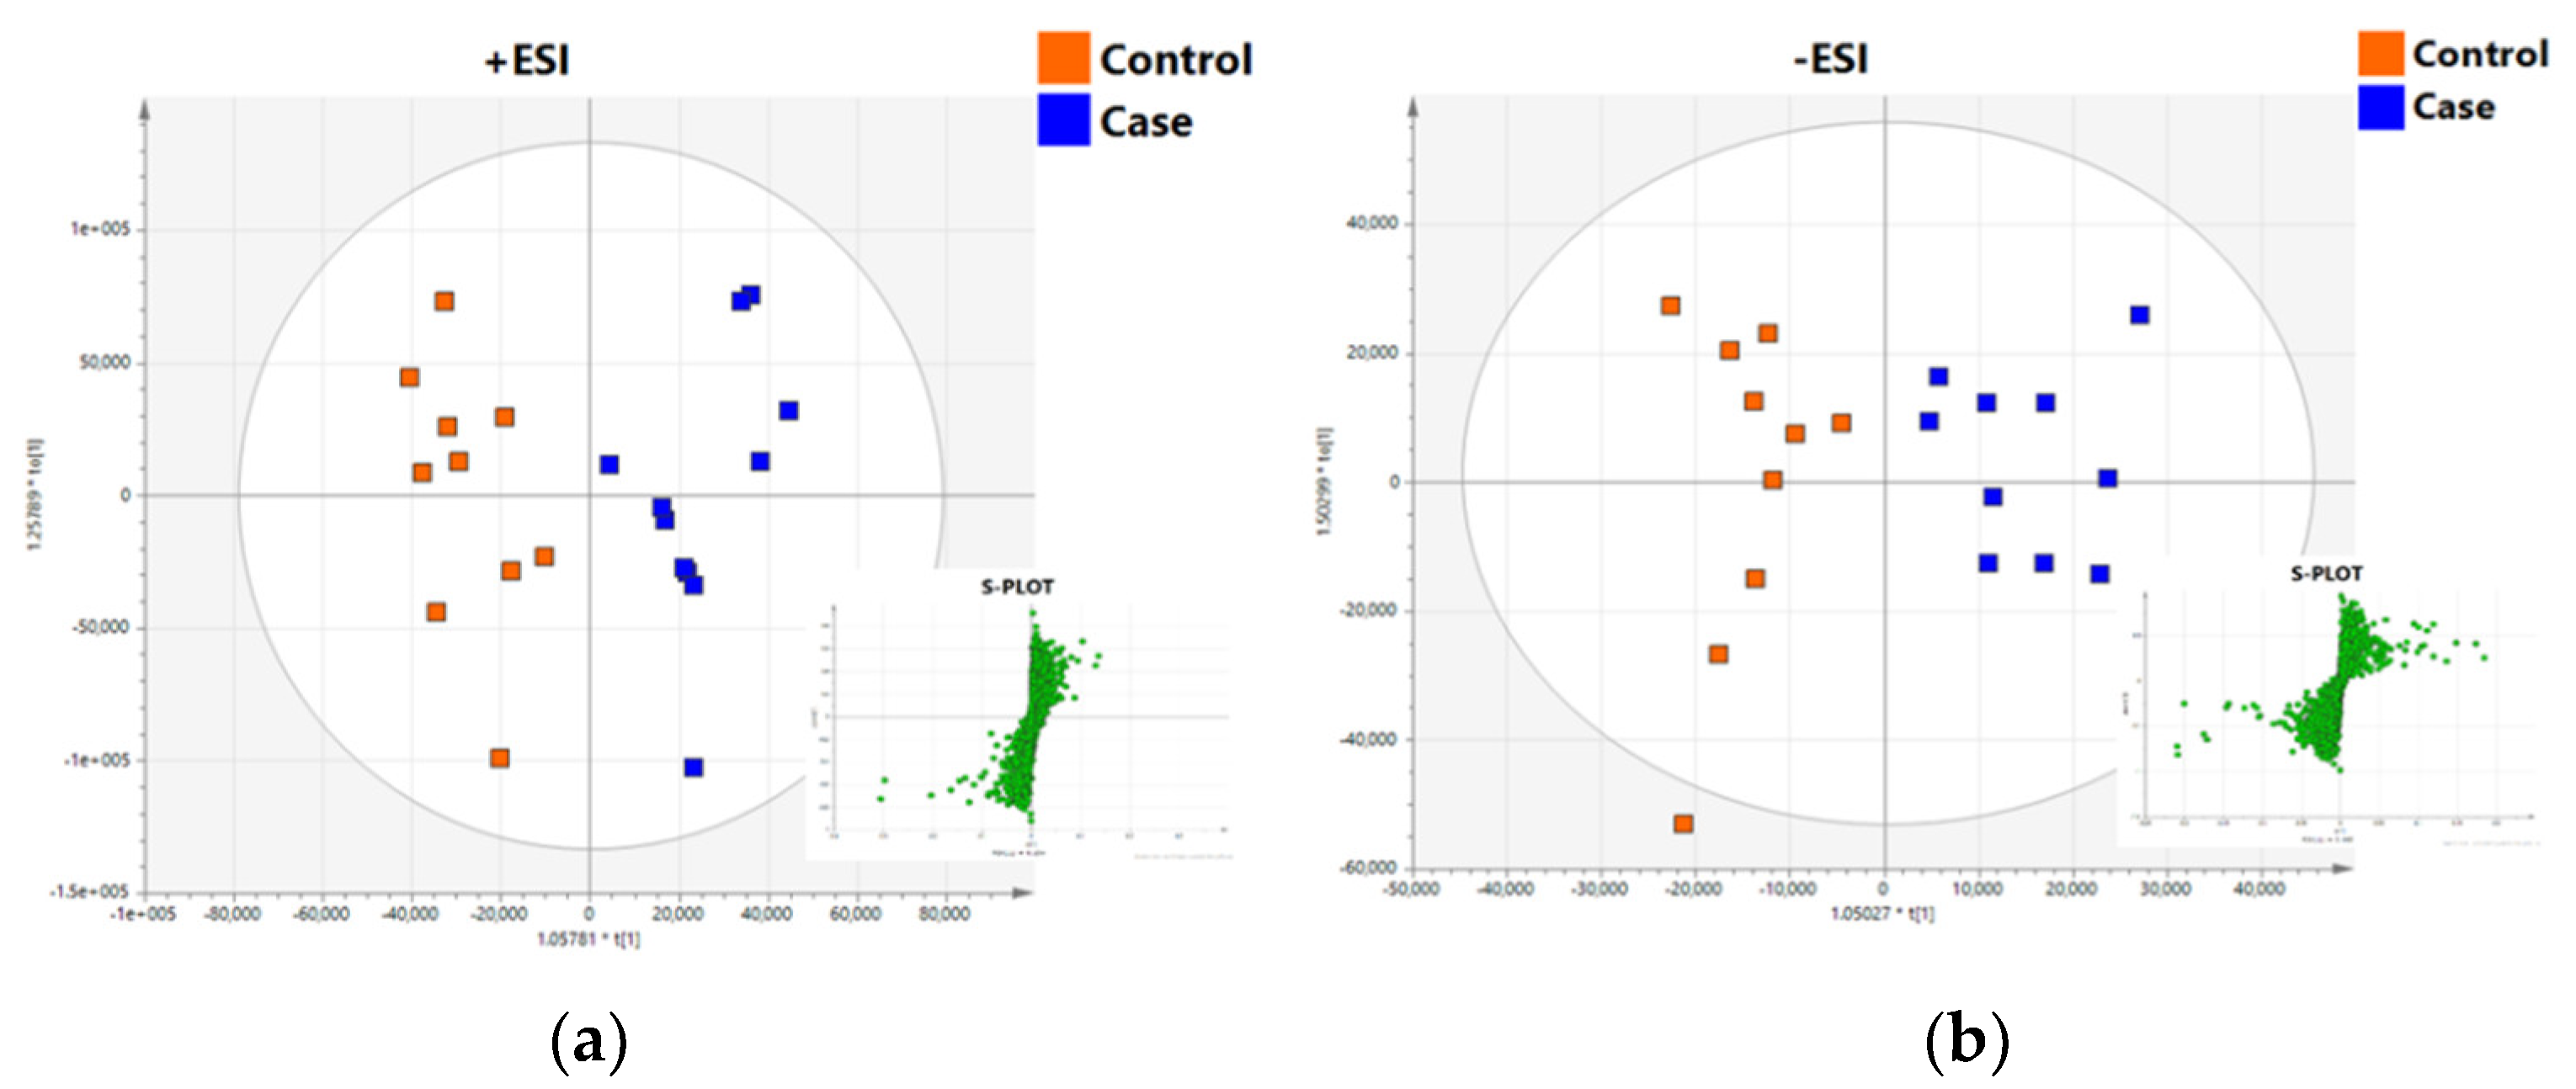
2.2.2. UHPLC-TOF/MS Lipidomics Analysis
3. Discussion
4. Materials and Methods
4.1. Study Population
4.2. Samples
4.3. Chemicals and Reagents
4.4. Sample Preparation
4.5. GC-MS Analysis
4.6. UHPLC-TOF/MS Analysis
4.7. Data Processing and Statistical Analysis
5. Conclusions
Supplementary Materials
Author Contributions
Funding
Institutional Review Board Statement
Informed Consent Statement
Data Availability Statement
Acknowledgments
Conflicts of Interest
References
- Schwartz, D.A.; Graham, A.L. Potential Maternal and Infant Outcomes from Coronavirus 2019-NCoV (SARS-CoV-2) Infecting Pregnant Women: Lessons from SARS, MERS, and Other Human Coronavirus Infections. Viruses 2020, 12, 194. [Google Scholar] [CrossRef] [PubMed] [Green Version]
- Pierce, M.; Kurinczuk, J.J.; Spark, P.; Brocklehurst, P.; Knight, M. Perinatal Outcomes after Maternal 2009/H1N1 Infection: National Cohort Study. BMJ 2011, 342, d3214. [Google Scholar] [CrossRef] [PubMed] [Green Version]
- Liu, H.; Wang, L.-L.; Zhao, S.-J.; Kwak-Kim, J.; Mor, G.; Liao, A.-H. Why Are Pregnant Women Susceptible to COVID-19? An Immunological Viewpoint. J. Reprod. Immunol. 2020, 139, 103122. [Google Scholar] [CrossRef]
- Martinez-Portilla, R.J.; Sotiriadis, A.; Chatzakis, C.; Torres-Torres, J.; Espino y Sosa, S.; Sandoval-Mandujano, K.; Castro-Bernabe, D.A.; Medina-Jimenez, V.; Monarrez-Martin, J.C.; Figueras, F.; et al. Pregnant Women with SARS-CoV-2 Infection Are at Higher Risk of Death and Pneumonia: Propensity Score Matched Analysis of a Nationwide Prospective Cohort (COV19Mx). Ultrasound Obstet. Gynecol. 2021, 57, 224–231. [Google Scholar] [CrossRef] [PubMed]
- Zambrano, L.D.; Ellington, S.; Strid, P.; Galang, R.R.; Oduyebo, T.; Tong, V.T.; Woodworth, K.R.; Nahabedian, J.F.; Azziz-Baumgartner, E.; Gilboa, S.M.; et al. Update: Characteristics of Symptomatic Women of Reproductive Age with Laboratory-Confirmed SARS-CoV-2 Infection by Pregnancy Status—United States, January 22–October 3, 2020. MMWR Morb. Mortal. Wkly. Rep. 2020, 69, 1641–1647. [Google Scholar] [CrossRef]
- Mullins, E.; Hudak, M.L.; Banerjee, J.; Getzlaff, T.; Townson, J.; Barnette, K.; Playle, R.; Perry, A.; Bourne, T.; Lees, C.C. Pregnancy and Neonatal Outcomes of COVID-19: Coreporting of Common Outcomes from PAN-COVID and AAP-SONPM Registries. Ultrasound Obstet. Gynecol. 2021, 57, 573–581. [Google Scholar] [CrossRef]
- Bahadur, G.; Bhat, M.; Acharya, S.; Janga, D.; Cambell, B.; Huirne, J.; Yoong, W.; Govind, A.; Pardo, J.; Homburg, R. Retrospective Observational RT-PCR Analyses on 688 Babies Born to 843 SARS-CoV-2 Positive Mothers, Placental Analyses and Diagnostic Analyses Limitations Suggest Vertical Transmission Is Possible. Facts Views Vis. Obgyn. 2021, 13, 53–66. [Google Scholar] [CrossRef]
- Gale, C.; Quigley, M.A.; Placzek, A.; Knight, M.; Ladhani, S.; Draper, E.S.; Sharkey, D.; Doherty, C.; Mactier, H.; Kurinczuk, J.J. Characteristics and Outcomes of Neonatal SARS-CoV-2 Infection in the UK: A Prospective National Cohort Study Using Active Surveillance. Lancet Child Adolesc. Health 2021, 5, 113–121. [Google Scholar] [CrossRef]
- Joma, M.; Fovet, C.-M.; Seddiki, N.; Gressens, P.; Laforge, M. COVID-19 and Pregnancy: Vertical Transmission and Inflammation Impact on Newborns. Vaccines 2021, 9, 391. [Google Scholar] [CrossRef]
- Yoon, S.H.; Kang, J.-M.; Ahn, J.G. Clinical Outcomes of 201 Neonates Born to Mothers with COVID-19: A Systematic Review. Eur. Rev. Med. Pharmacol. Sci. 2020, 24, 7804–7815. [Google Scholar] [CrossRef]
- Deda, O.; Virgiliou, C.; Armitage, E.G.; Orfanidis, A.; Taitzoglou, I.; Wilson, I.D.; Loftus, N.; Gika, H.G. Metabolic Phenotyping Study of Mouse Brains Following Acute or Chronic Exposures to Ethanol. J. Proteome Res. 2020, 19, 4071–4081. [Google Scholar] [CrossRef]
- Barberis, E.; Timo, S.; Amede, E.; Vanella, V.V.; Puricelli, C.; Cappellano, G.; Raineri, D.; Cittone, M.G.; Rizzi, E.; Pedrinelli, A.R.; et al. Large-Scale Plasma Analysis Revealed New Mechanisms and Molecules Associated with the Host Response to SARS-CoV-2. Int. J. Mol. Sci. 2020, 21, 8623. [Google Scholar] [CrossRef]
- Pérez-Torres, I.; Guarner-Lans, V.; Soria-Castro, E.; Manzano-Pech, L.; Palacios-Chavarría, A.; Valdez-Vázquez, R.R.; Domínguez-Cherit, J.G.; Herrera-Bello, H.; Castillejos-Suastegui, H.; Moreno-Castañeda, L.; et al. Alteration in the Lipid Profile and the Desaturases Activity in Patients With Severe Pneumonia by SARS-CoV-2. Front. Physiol. 2021, 12, 624. [Google Scholar] [CrossRef]
- Mussap, M.; Fanos, V. Could Metabolomics Drive the Fate of COVID-19 Pandemic? A Narrative Review on Lights and Shadows. Clin. Chem. Lab. Med. 2021, 59. [Google Scholar] [CrossRef] [PubMed]
- Zhao, Y.; Shang, Y.; Ren, Y.; Bie, Y.; Qiu, Y.; Yuan, Y.; Zhao, Y.; Zou, L.; Lin, S.-H.; Zhou, X. Omics Study Reveals Abnormal Alterations of Breastmilk Proteins and Metabolites in Puerperant Women with COVID-19. Signal Transduct. Target. Ther. 2020, 5, 1–3. [Google Scholar] [CrossRef] [PubMed]
- Theken, K.N.; FitzGerald, G.A. Bioactive Lipids in Antiviral Immunity. Science 2021, 371, 237–238. [Google Scholar] [CrossRef] [PubMed]
- Das, U.N. Can Bioactive Lipids Inactivate Coronavirus (COVID-19)? Arch. Med. Res. 2020, 51, 282–286. [Google Scholar] [CrossRef]
- van der Veen, J.N.; Kennelly, J.P.; Wan, S.; Vance, J.E.; Vance, D.E.; Jacobs, R.L. The Critical Role of Phosphatidylcholine and Phosphatidylethanolamine Metabolism in Health and Disease. Biochim. Biophys. Acta (BBA)-Biomembr. 2017, 1859, 1558–1572. [Google Scholar] [CrossRef]
- Song, J.-W.; Lam, S.M.; Fan, X.; Cao, W.-J.; Wang, S.-Y.; Tian, H.; Chua, G.H.; Zhang, C.; Meng, F.-P.; Xu, Z.; et al. Omics-Driven Systems Interrogation of Metabolic Dysregulation in COVID-19 Pathogenesis. Cell Metab. 2020, 32, 188–202.e5. [Google Scholar] [CrossRef]
- Caterino, M.; Gelzo, M.; Sol, S.; Fedele, R.; Annunziata, A.; Calabrese, C.; Fiorentino, G.; D’Abbraccio, M.; Dell’Isola, C.; Fusco, F.M.; et al. Dysregulation of Lipid Metabolism and Pathological Inflammation in Patients with COVID-19. Sci. Rep. 2021, 11, 2941. [Google Scholar] [CrossRef]
- Bruzzone, C.; Bizkarguenaga, M.; Gil-Redondo, R.; Diercks, T.; Arana, E.; García de Vicuña, A.; Seco, M.; Bosch, A.; Palazón, A.; San Juan, I.; et al. SARS-CoV-2 Infection Dysregulates the Metabolomic and Lipidomic Profiles of Serum. iScience 2020, 23, 101645. [Google Scholar] [CrossRef] [PubMed]
- Páez-Franco, J.C.; Torres-Ruiz, J.; Sosa-Hernández, V.A.; Cervantes-Díaz, R.; Romero-Ramírez, S.; Pérez-Fragoso, A.; Meza-Sánchez, D.E.; Germán-Acacio, J.M.; Maravillas-Montero, J.L.; Mejía-Domínguez, N.R.; et al. Metabolomics Analysis Reveals a Modified Amino Acid Metabolism That Correlates with Altered Oxygen Homeostasis in COVID-19 Patients. Sci. Rep. 2021, 11, 6350. [Google Scholar] [CrossRef]
- Behrends, V.; Tredwell, G.; Bundy, J. A Software Complement to AMDIS for Processing GC-MS Metabolomic Data. Anal. Biochem. 2011, 415, 206–208. [Google Scholar] [CrossRef] [PubMed]
- Smith, C.A.; Want, E.J.; O’Maille, G.; Abagyan, R.; Siuzdak, G. XCMS: Processing Mass Spectrometry Data for Metabolite Profiling Using Nonlinear Peak Alignment, Matching, and Identification. Anal. Chem. 2006, 78, 779–787. [Google Scholar] [CrossRef] [PubMed]
- Wu, Z.; Li, D.; Meng, J.; Wang, H. Introduction to SIMCA-P and Its Application. In Handbook of Partial Least Squares: Concepts, Methods and Applications; Esposito Vinzi, V., Chin, W.W., Henseler, J., Wang, H., Eds.; Springer Handbooks of Computational Statistics; Springer: Berlin/Heidelberg, Germany, 2010; pp. 757–774. ISBN 978-3-540-32827-8. [Google Scholar]
- Chong, J.; Soufan, O.; Li, C.; Caraus, I.; Li, S.; Bourque, G.; Wishart, D.S.; Xia, J. MetaboAnalyst 4.0: Towards More Transparent and Integrative Metabolomics Analysis. Nucleic Acids Res. 2018, 46, W486–W494. [Google Scholar] [CrossRef] [Green Version]
- Sumner, L.W.; Amberg, A.; Barrett, D.; Beale, M.H.; Beger, R.; Daykin, C.A.; Fan, T.W.-M.; Fiehn, O.; Goodacre, R.; Griffin, J.L.; et al. Proposed Minimum Reporting Standards for Chemical Analysis Chemical Analysis Working Group (CAWG) Metabolomics Standards Initiative (MSI). Metabolomics 2007, 3, 211–221. [Google Scholar] [CrossRef] [Green Version]


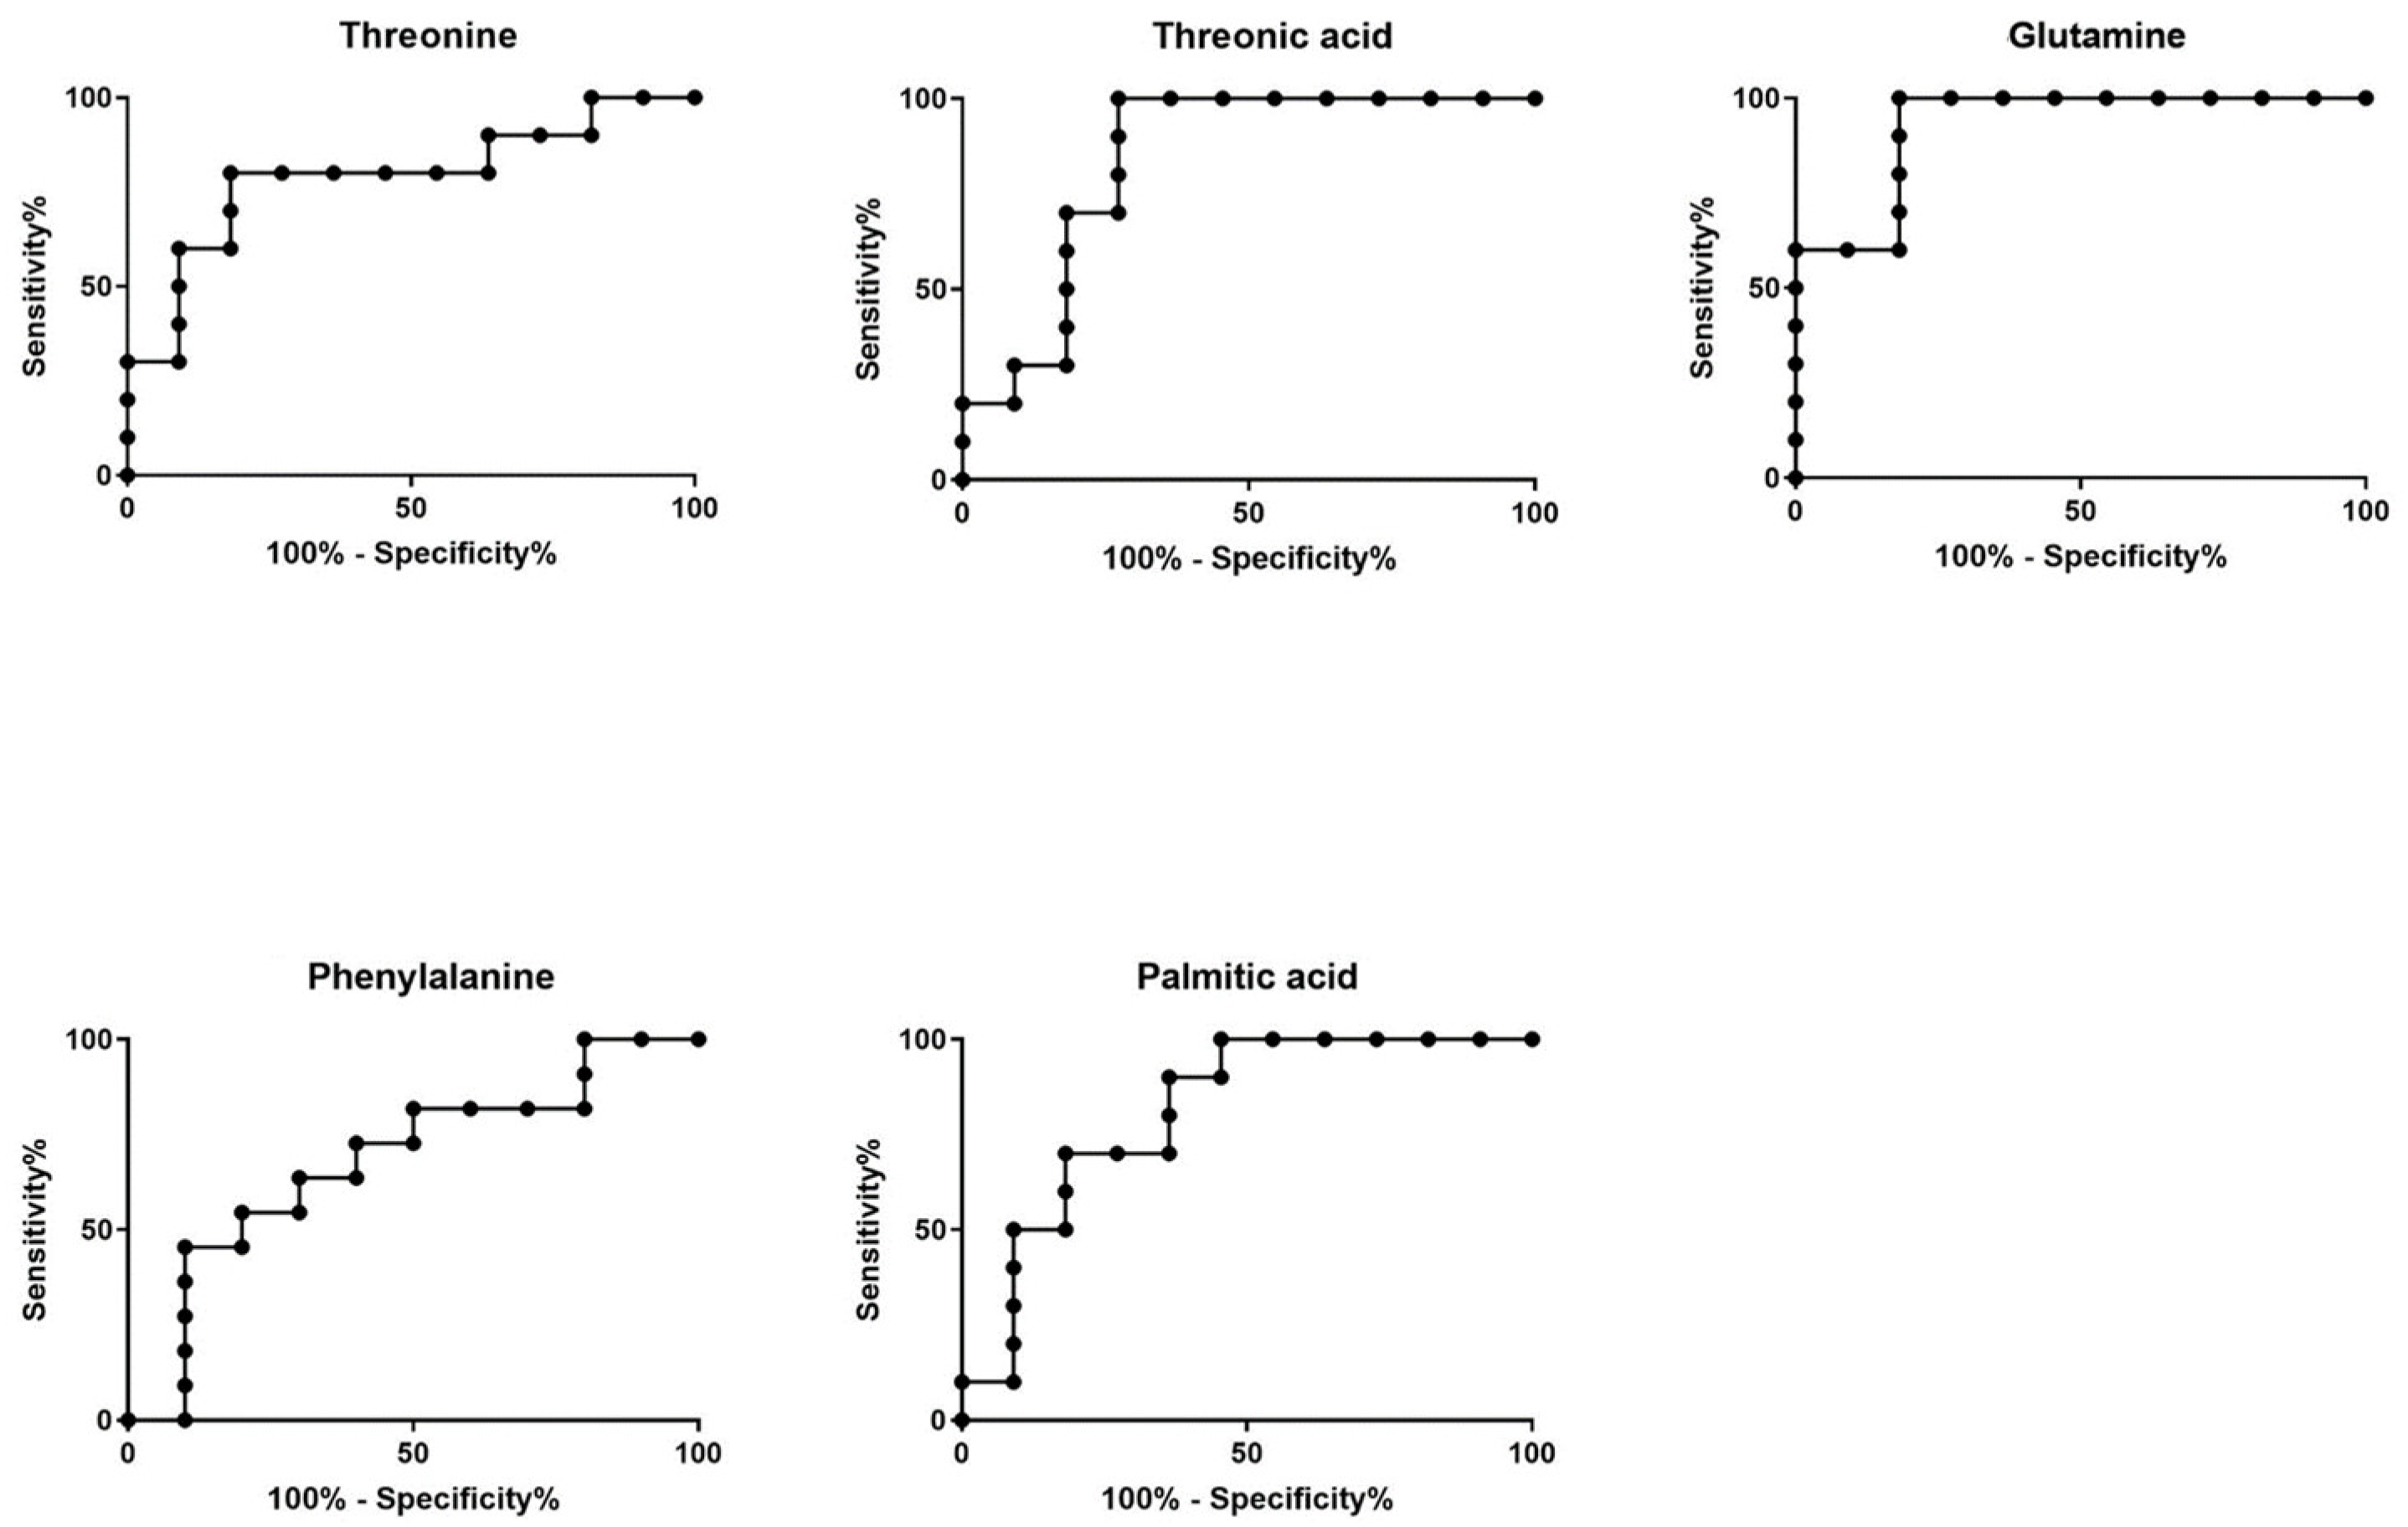
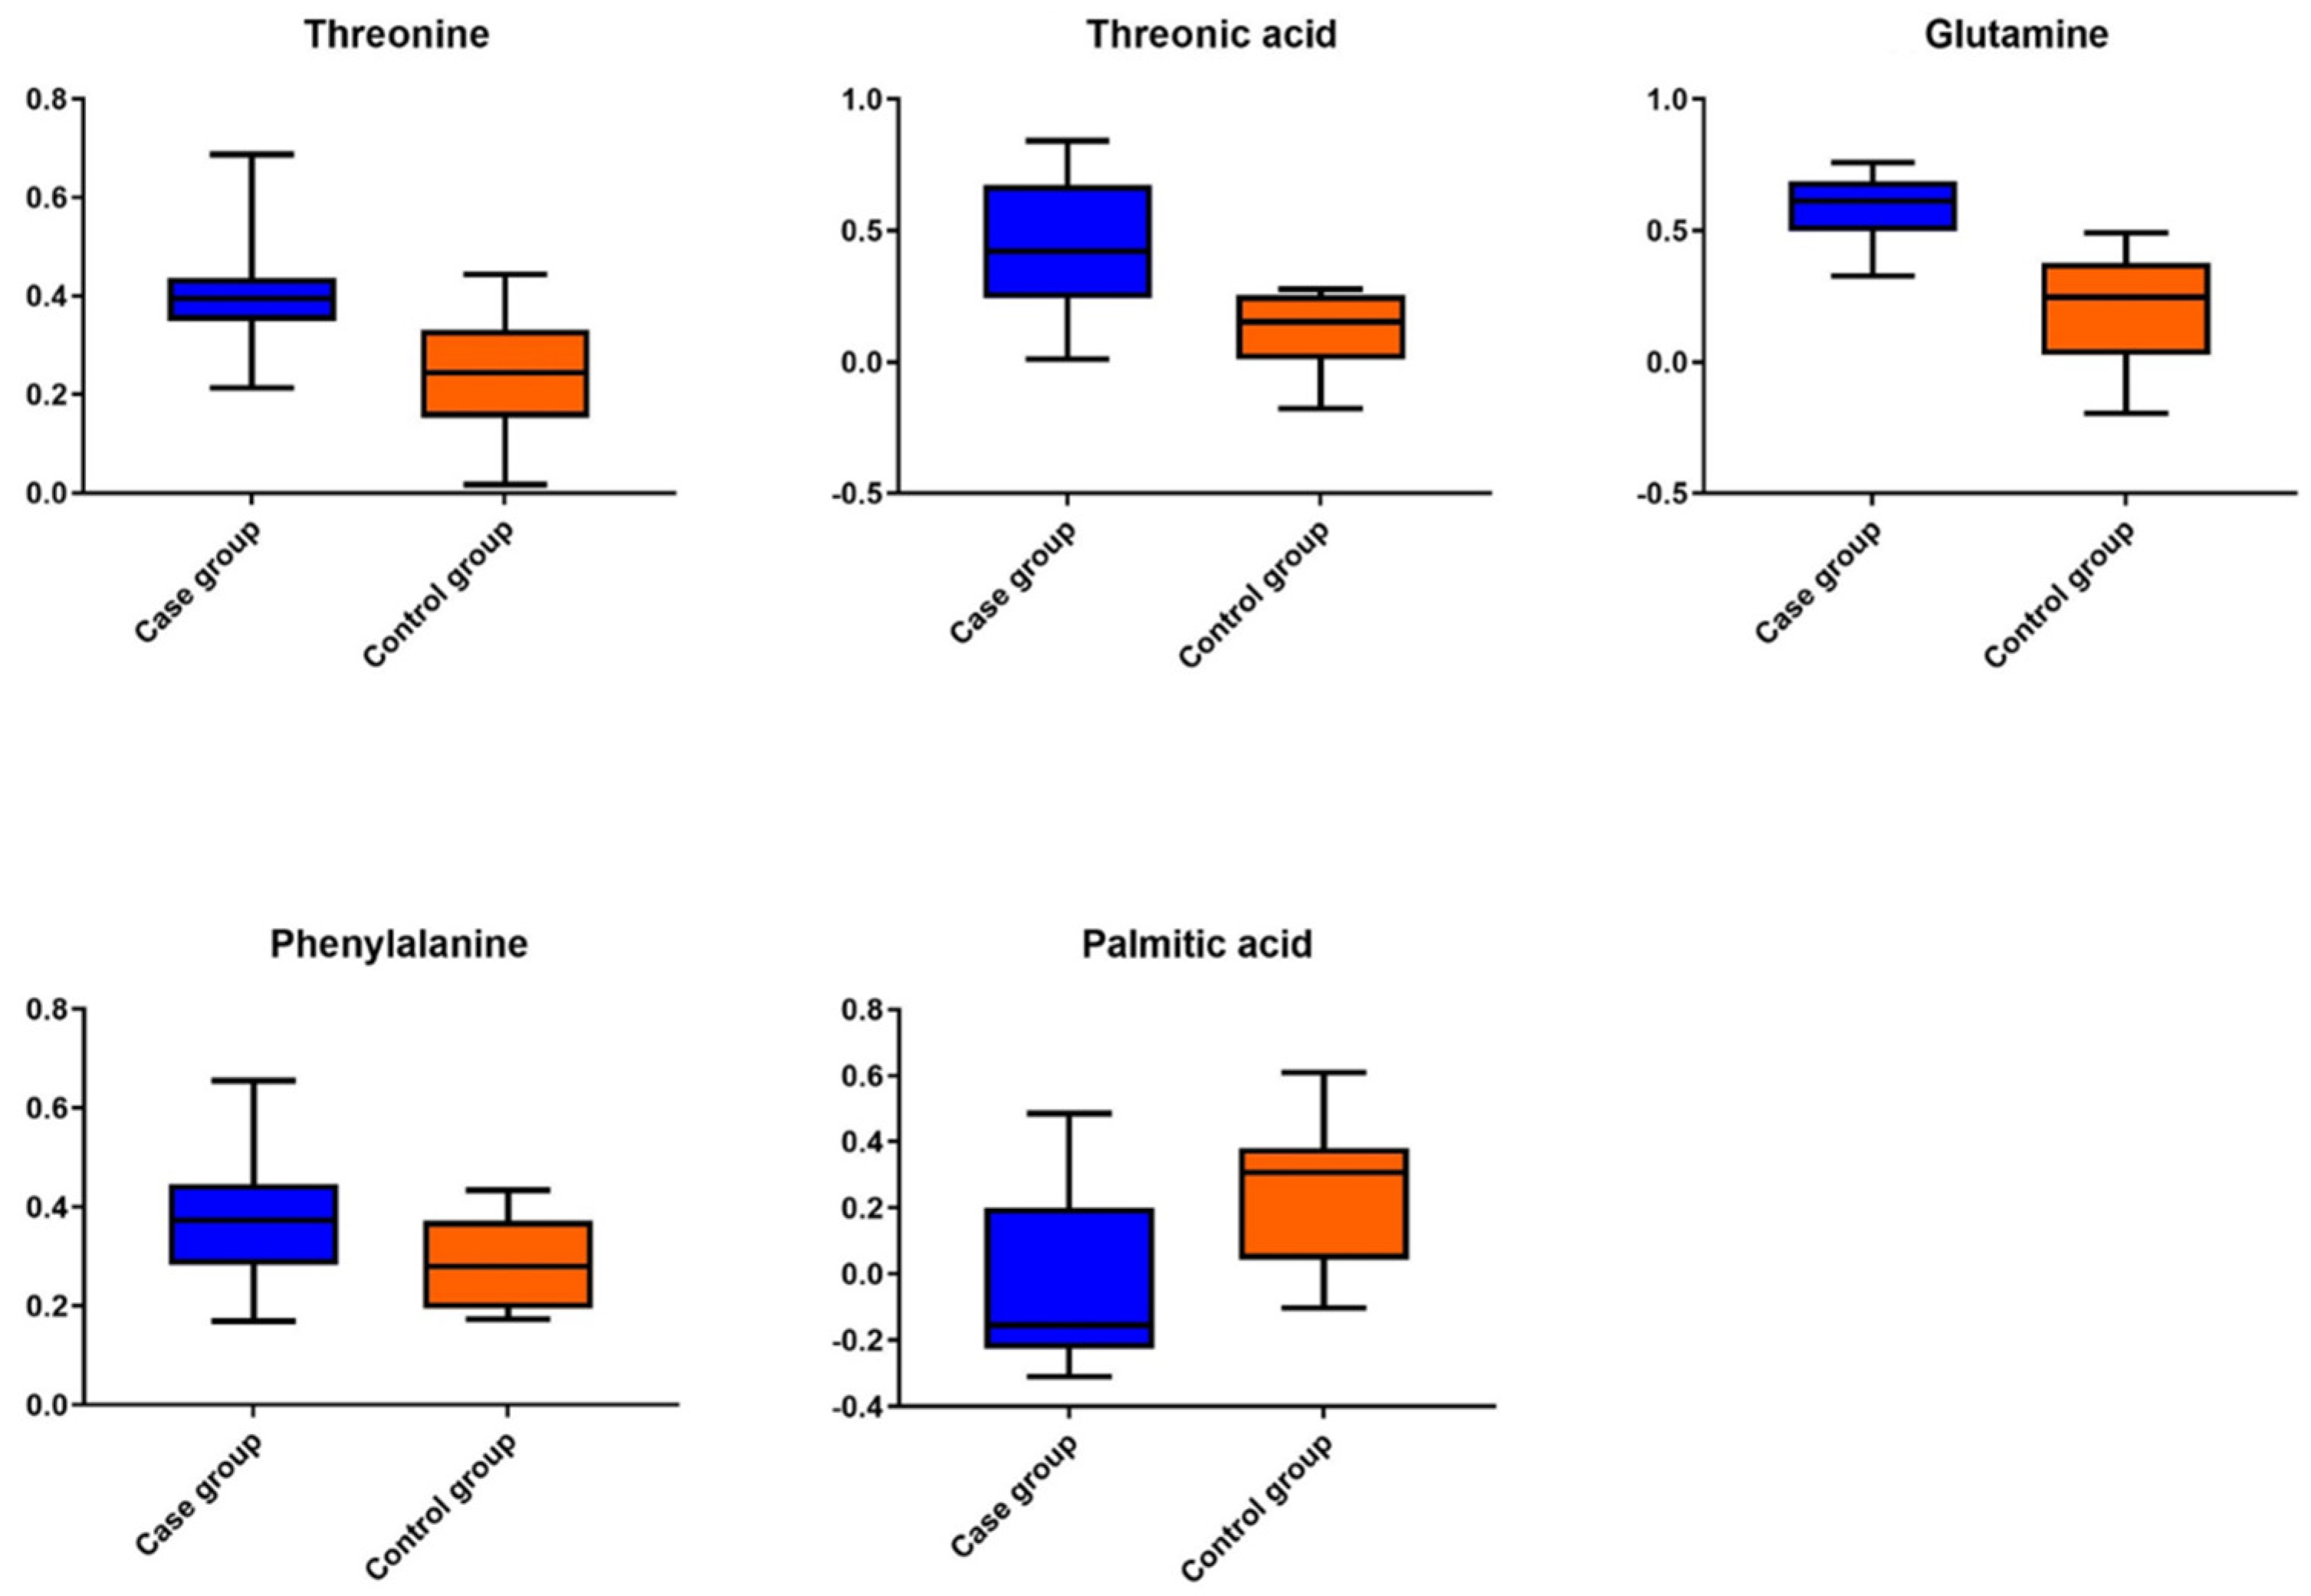
| Compound | VIP | p Value | AUC-ROC (95% CI) | Log2FC |
|---|---|---|---|---|
| Threonine | 1.9 | 9.6 × 10⁻³ | 0.79 * (0.59–0.99) | 0.55 |
| Threonic acid | 2.1 | 4.0 × 10⁻³ | 0.84 ** (0.65–1.0) | 1.16 |
| Glutamine | 2.5 | 3.9 × 10⁻⁴ | 0.93 *** (0.82–1.0) | 1.15 |
| Phenylalanine | 1.6 | 3.0 × 10⁻² | 0.75 (0.45–0.92) | 0.4 |
| Palmitic acid | 1.8 | 1.2 × 10⁻² | 0.81 * (0.62–1.0) | −0.85 |
| A/A | VIP | m/z | RT min | p Value | Log2FC | Annotation |
|---|---|---|---|---|---|---|
| +ESI | ||||||
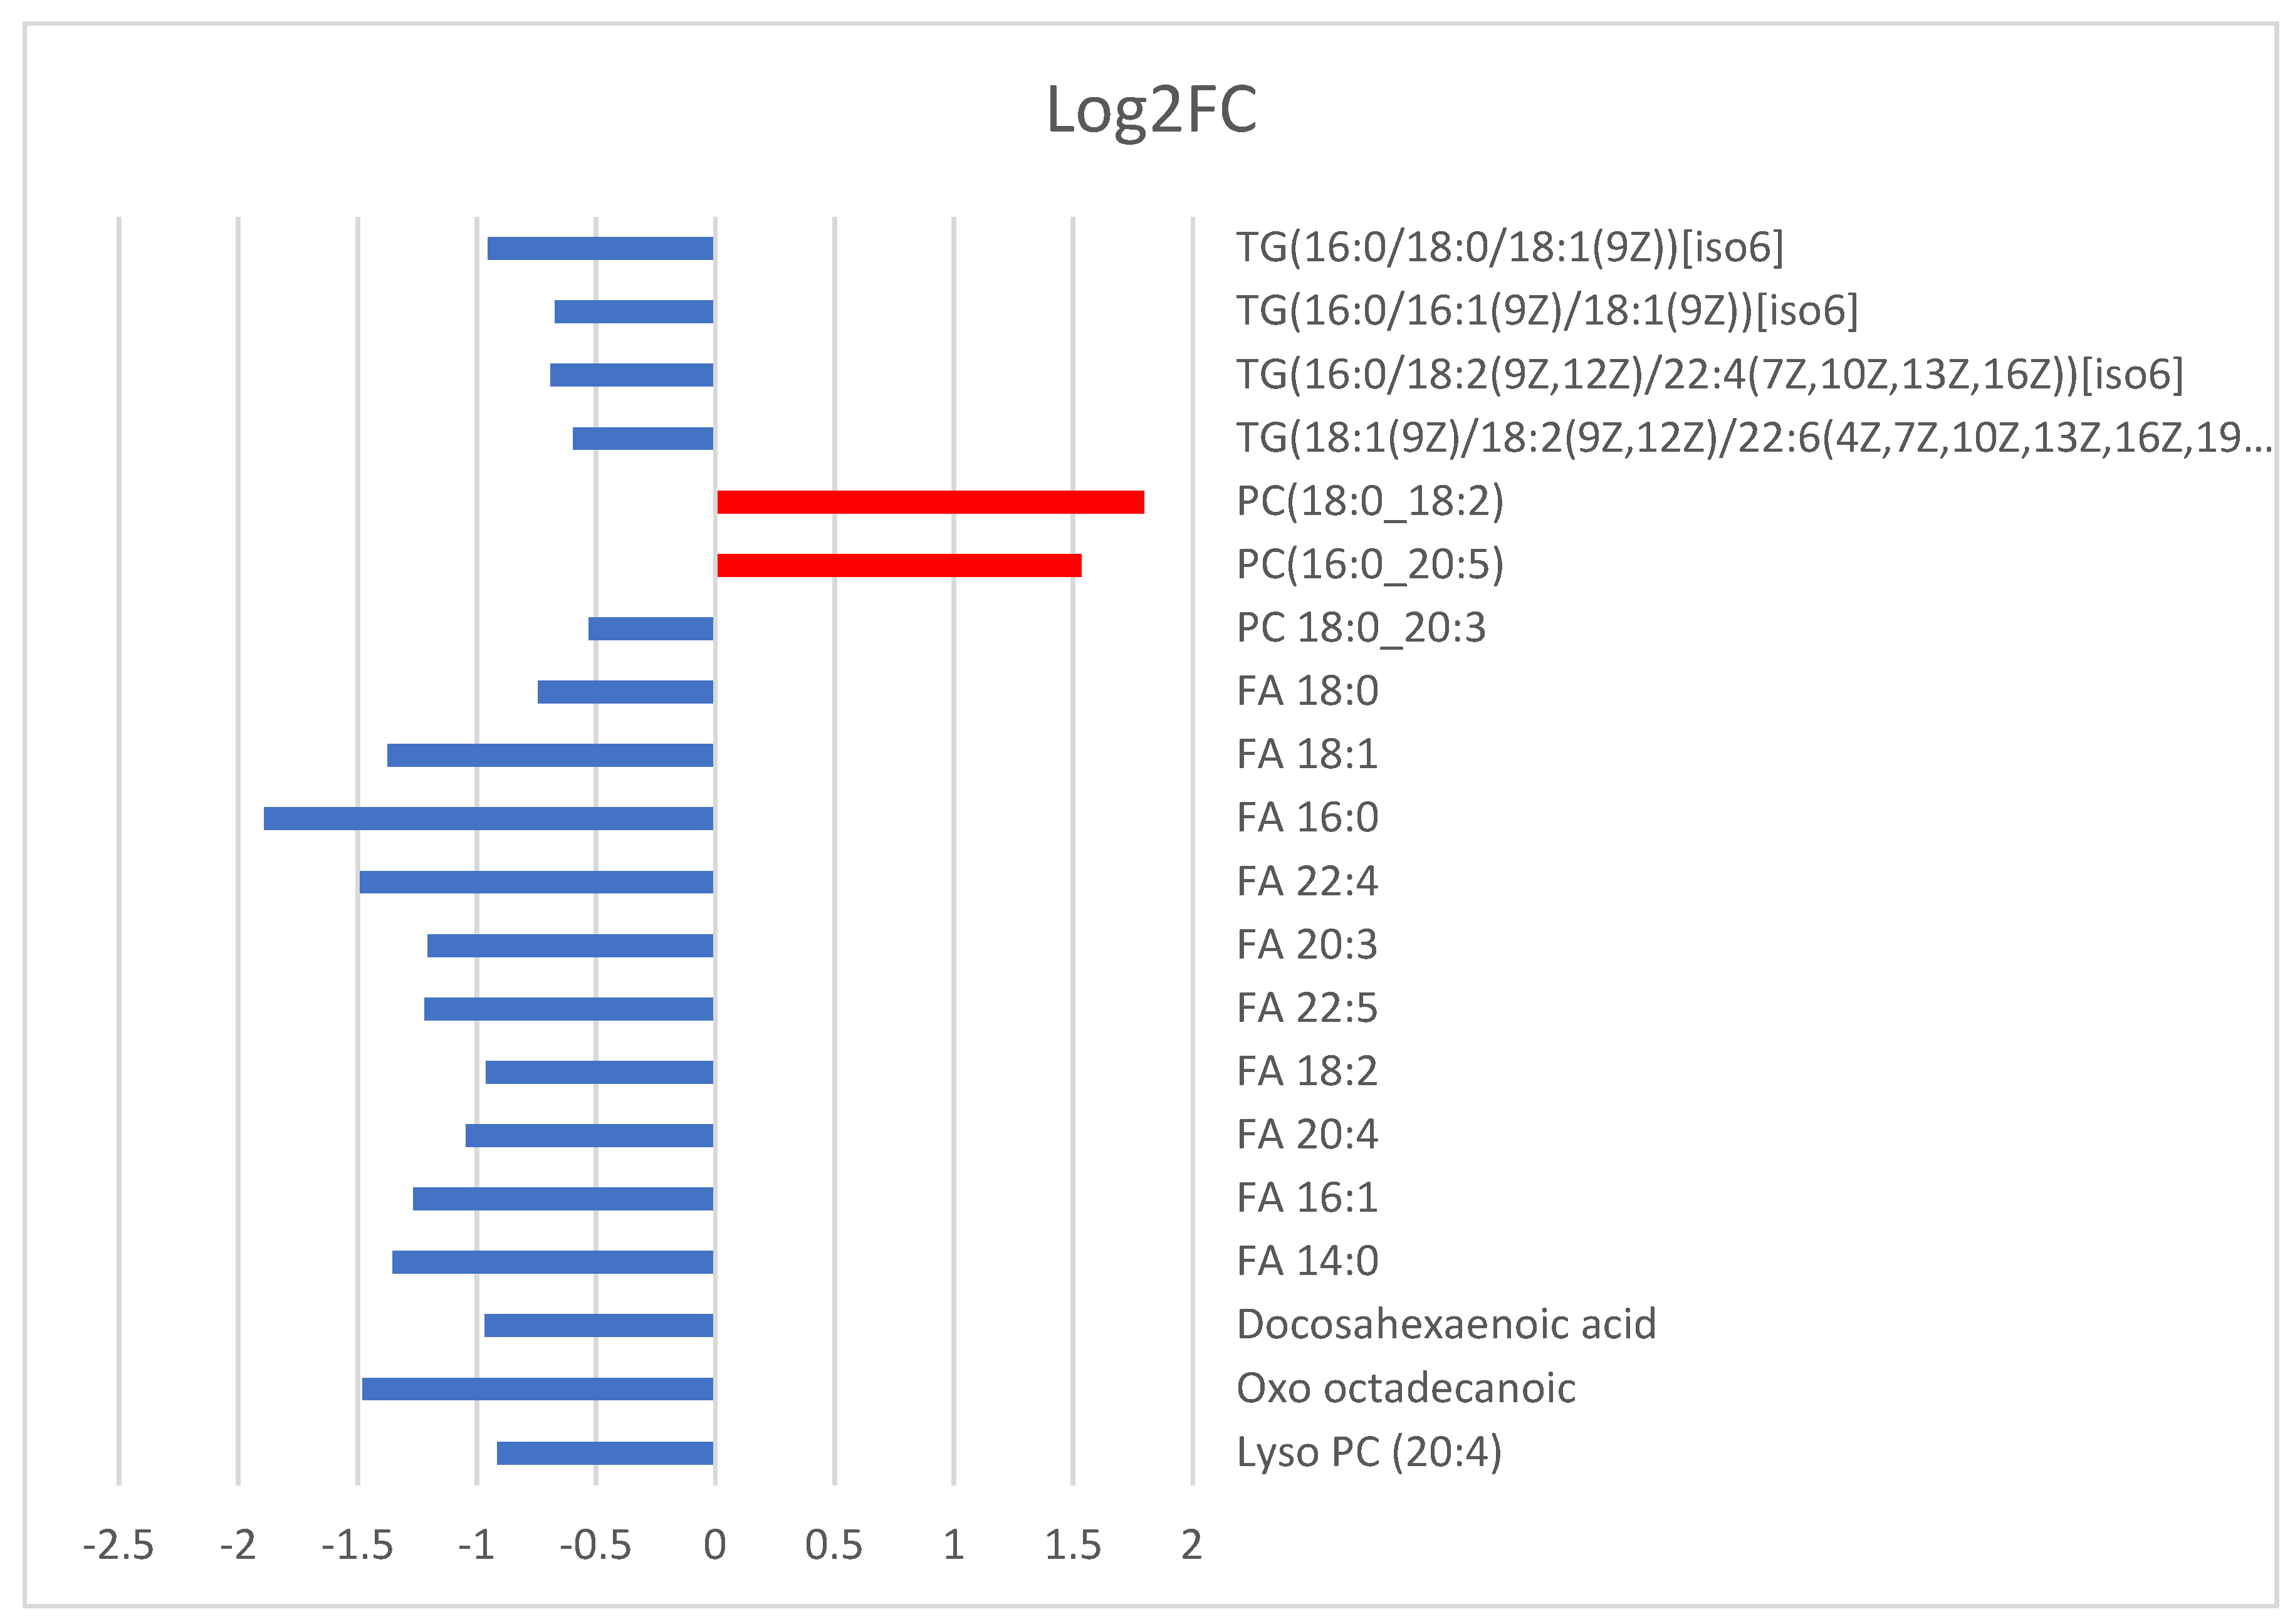
| 1 | 9 | 780.557 | 5.2 | 2.18 × 10⁻² | 1.53 | PC (16:0_20:5) |
| 2 | 11 | 788.619 | 8.6 | 7.12 × 10⁻³ | 1.80 | PC (18:0_18:2) |
| 3 | 3 | 824.619 | 9.1 | 2.89 × 10⁻³ | −1.58 | Unknown |
| 4 | 3 | 946.783 | 15.3 | 1.15 × 10⁻² | −0.59 | TG(18:1(9Z)/18:2(9Z,12Z)/22:6(4Z,7Z,10Z,13Z,16Z,19Z))[iso6] |
| 5 | 4 | 925.802 | 15.7 | 2.86 × 10⁻² | −0.69 | TG(16:0/18:2(9Z,12Z)/22:4(7Z,10Z,13Z,16Z))[iso6] |
| 6 | 12 | 848.771 | 15.7 | 1.21 × 10⁻³ | −0.67 | TG(16:0/16:1(9Z)/18:1(9Z))[iso6] |
| 7 | 11 | 878.819 | 16.3 | 4.29 × 10⁻⁴ | −0.95 | TG(16:0/18:0/18:1(9Z))[iso6] |
| −ESI | ||||||
| 1 | 5 | 383.149 | 0.6 | 7.23 × 10⁻⁵ | −1.09 | Unknown |
| 2 | 3 | 411.180 | 0.6 | 3.92 × 10⁻³ | −0.78 | Unknown |
| 3 | 4 | 588.324 | 1.0 | 6.23 × 10⁻³ | −0.91 | Lyso PC (20:4) |
| 4 | 3 | 297.240 | 1.0 | 1.36 × 10⁻⁴ | −1.48 | Oxo octadecanoic |
| 5 | 5 | 327.229 | 1.8 | 7.26 × 10⁻³ | −0.97 | Docosahexaenoic acid |
| 6 | 3 | 227.198 | 1.9 | 1.11 × 10⁻⁴ | −1.35 | FA 14:0 |
| 7 | 10 | 253.215 | 2.0 | 8.96 × 10⁻⁴ | −1.26 | FA 16:1 |
| 4 | 254.217 | 2.0 | 8.87 × 10⁻⁴ | −1.26 | ||
| 8 | 7 | 303.229 | 2.0 | 2.46 × 10⁻³ | −1.05 | FA 20:4 |
| 3 | 304.232 | 2.0 | 2.94 × 10⁻³ | −0.95 | ||
| 9 | 3 | 280.232 | 2.1 | 3.53 × 10⁻³ | −0.96 | FA 18:2 |
| 10 | 3 | 329.245 | 2.3 | 3.19 × 10⁻³ | −1.22 | FA 22:5 |
| 11 | 3 | 305.245 | 2.3 | 3.24 × 10⁻⁴ | −1.20 | FA 20:3 |
| 12 | 3 | 445.328 | 2.5 | 1.44 × 10⁻² | −1.04 | Unknown |
| 13 | 4 | 331.260 | 2.6 | 4.65 × 10⁻⁴ | −1.49 | FA 22:4 |
| 14 | 3 | 255.247 | 2.7 | 3.62 × 10⁻⁴ | −1.89 | FA 16:0 |
| 7 | 256.233 | 2.7 | 6.80 × 10⁻⁵ | −1.09 | ||
| 17 | 255.230 | 2.7 | 3.70 × 10⁻⁴ | −1.14 | ||
| 15 | 5 | 281.264 | 2.8 | 6.85 × 10⁻³ | −1.37 | FA 18:1 |
| 8 | 282.248 | 2.8 | 2.84 × 10⁻³ | −0.84 | ||
| 13 | 281.246 | 2.8 | 2.25 × 10⁻² | −0.65 | ||
| 16 | 4 | 284.264 | 3.6 | 8.83 × 10⁻⁵ | −0.74 | FA 18:0 |
| 9 | 283.261 | 3.6 | 6.09 × 10⁻⁴ | −0.85 | ||
| 17 | 4 | 857.598 | 9.3 | 1.24 × 10⁻² | −0.32 | PC 18:0_20:3 |
| 6 | 856.593 | 9.3 | 3.22 × 10⁻³ | −0.53 | ||
| +ESI | ||||||
| 1 | 9 | 780.557 | 5.2 | 2.18 × 10⁻² | 1.53 | PC (16:0_20:5) |
| 2 | 11 | 788.619 | 8.6 | 7.12 × 10⁻³ | 1.80 | PC (18:0_18:2) |
| 3 | 3 | 824.619 | 9.1 | 2.89 × 10⁻³ | −1.58 | Unknown |
| 4 | 3 | 946.783 | 15.3 | 1.15 × 10⁻² | −0.59 | TG(18:1(9Z)/18:2(9Z,12Z)/22:6(4Z,7Z,10Z,13Z,16Z,19Z))[iso6] |
| 5 | 4 | 925.802 | 15.7 | 2.86 × 10⁻² | −0.69 | TG(16:0/18:2(9Z,12Z)/22:4(7Z,10Z,13Z,16Z))[iso6] |
| 6 | 12 | 848.771 | 15.7 | 1.21 × 10⁻³ | −0.67 | TG(16:0/16:1(9Z)/18:1(9Z))[iso6] |
| 7 | 11 | 878.819 | 16.3 | 4.29 × 10⁻⁴ | −0.95 | TG(16:0/18:0/18:1(9Z))[iso6] |
| −ESI | ||||||
| 1 | 5 | 383.149 | 0.6 | 7.23 × 10⁻⁵ | −1.09 | Unknown |
| 2 | 3 | 411.180 | 0.6 | 3.92 × 10⁻³ | −0.78 | Unknown |
| 3 | 4 | 588.324 | 1.0 | 6.23 × 10⁻³ | −0.91 | Lyso PC (20:4) |
| 4 | 3 | 297.240 | 1.0 | 1.36 × 10⁻⁴ | −1.48 | Oxo octadecanoic |
| 5 | 5 | 327.229 | 1.8 | 7.26 × 10⁻³ | −0.97 | Docosahexaenoic acid |
| 6 | 3 | 227.198 | 1.9 | 1.11 × 10⁻⁴ | −1.35 | FA 14:0 |
| 7 | 10 | 253.215 | 2.0 | 8.96 × 10⁻⁴ | −1.26 | FA 16:1 |
| 4 | 254.217 | 2.0 | 8.87 × 10⁻⁴ | −1.26 | ||
| 8 | 7 | 303.229 | 2.0 | 2.46 × 10⁻³ | −1.05 | FA 20:4 |
| 3 | 304.232 | 2.0 | 2.94 × 10⁻³ | −0.95 | ||
| 9 | 3 | 280.232 | 2.1 | 3.53 × 10⁻³ | −0.96 | FA 18:2 |
| 10 | 3 | 329.245 | 2.3 | 3.19 × 10⁻³ | −1.22 | FA 22:5 |
| 11 | 3 | 305.245 | 2.3 | 3.24 × 10⁻⁴ | −1.20 | FA 20:3 |
| 12 | 3 | 445.328 | 2.5 | 1.44 × 10⁻² | −1.04 | Unknown |
| 13 | 4 | 331.260 | 2.6 | 4.65 × 10⁻⁴ | −1.49 | FA 22:4 |
| 14 | 3 | 255.247 | 2.7 | 3.62 × 10⁻⁴ | −1.89 | FA 16:0 |
| 7 | 256.233 | 2.7 | 6.80 × 10⁻⁵ | −1.09 | ||
| 17 | 255.230 | 2.7 | 3.70 × 10⁻⁴ | −1.14 | ||
| 15 | 5 | 281.264 | 2.8 | 6.85 × 10⁻³ | −1.37 | FA 18:1 |
| 8 | 282.248 | 2.8 | 2.84 × 10⁻³ | −0.84 | ||
| 13 | 281.246 | 2.8 | 2.25 × 10⁻² | −0.65 | ||
| 16 | 4 | 284.264 | 3.6 | 8.83 × 10⁻⁵ | −0.74 | FA 18:0 |
| 9 | 283.261 | 3.6 | 6.09 × 10⁻⁴ | −0.85 | ||
| 17 | 4 | 857.598 | 9.3 | 1.24 × 10⁻² | −0.32 | PC 18:0_20:3 |
| 6 | 856.593 | 9.3 | 3.22 × 10⁻³ | −0.53 | ||
Publisher’s Note: MDPI stays neutral with regard to jurisdictional claims in published maps and institutional affiliations. |
© 2021 by the authors. Licensee MDPI, Basel, Switzerland. This article is an open access article distributed under the terms and conditions of the Creative Commons Attribution (CC BY) license (https://creativecommons.org/licenses/by/4.0/).
Share and Cite
Kontou, A.; Virgiliou, C.; Mouskeftara, T.; Begou, O.; Meikopoulos, T.; Thomaidou, A.; Agakidou, E.; Gika, H.; Theodoridis, G.; Sarafidis, K. Plasma Lipidomic and Metabolomic Profiling after Birth in Neonates Born to SARS-CoV-19 Infected and Non-Infected Mothers at Delivery: Preliminary Results. Metabolites 2021, 11, 830. https://doi.org/10.3390/metabo11120830
Kontou A, Virgiliou C, Mouskeftara T, Begou O, Meikopoulos T, Thomaidou A, Agakidou E, Gika H, Theodoridis G, Sarafidis K. Plasma Lipidomic and Metabolomic Profiling after Birth in Neonates Born to SARS-CoV-19 Infected and Non-Infected Mothers at Delivery: Preliminary Results. Metabolites. 2021; 11(12):830. https://doi.org/10.3390/metabo11120830
Chicago/Turabian StyleKontou, Aggeliki, Christina Virgiliou, Thomai Mouskeftara, Olga Begou, Thomas Meikopoulos, Agathi Thomaidou, Eleni Agakidou, Helen Gika, Georgios Theodoridis, and Kosmas Sarafidis. 2021. "Plasma Lipidomic and Metabolomic Profiling after Birth in Neonates Born to SARS-CoV-19 Infected and Non-Infected Mothers at Delivery: Preliminary Results" Metabolites 11, no. 12: 830. https://doi.org/10.3390/metabo11120830