Article

Tolerant Larvae and Sensitive Juveniles: Integrating Metabolomics and Whole-Organism Responses to Define Life-Stage Specific Sensitivity to Ocean Acidification in the American Lobster

1
Département de Biologie, Chimie et Géographie, Université du Québec à Rimouski, 300 allée des Ursulines, Rimouski, QC G5L 3A1, Canada
2
ECOMARE-Laboratory for Innovation and Sustainability of Marine Biological Resources, CESAM-Centre for Environmental and Marine Studies, Department of Biology, University of Aveiro, Estrada do Porto de Pesca Costeira, 3830-565 Gafanha da Nazaré, Portugal
3
Saint Andrews Biological Station, Fisheries and Oceans Canada, 125 Marine Science Drive, Saint Andrews, NB E5B 0E4, Canada
4
Homarus Inc., 408 rue Main, Shediac, NB E4P 2G1, Canada
5
EcoNov, 44 ave Bromley, Moncton, NB E1C 5T9, Canada
6
Bedford Institute Oceanography, Fisheries and Oceans, Dartmouth, NS B2Y 4A2, Canada
*
Authors to whom correspondence should be addressed.
Current Address: Institut des Sciences de la Mer de Rimouski, Université du Québec à Rimouski, 310 allée des Ursulines, Rimouski, QC G5L 3A1, Canada.
Current Address: Ocean Wise Conservation Association, 1675 Avenue des Hôtels, Québec, QC G1W 4S3, Canada.
Metabolites 2021, 11(9), 584; https://doi.org/10.3390/metabo11090584
Submission received: 16 May 2021 / Revised: 30 July 2021 / Accepted: 16 August 2021 / Published: 30 August 2021
(This article belongs to the Special Issue Ectotherms Metabolism: Plasticity and Adaptation)

Abstract

:
Bentho-pelagic life cycles are the dominant reproductive strategy in marine invertebrates, providing great dispersal ability, access to different resources, and the opportunity to settle in suitable habitats upon the trigger of environmental cues at key developmental moments. However, free-dispersing larvae can be highly sensitive to environmental changes. Among these, the magnitude and the occurrence of elevated carbon dioxide (CO2) concentrations in oceanic habitats is predicted to exacerbate over the next decades, particularly in coastal areas, reaching levels beyond those historically experienced by most marine organisms. Here, we aimed to determine the sensitivity to elevated pCO2 of successive life stages of a marine invertebrate species with a bentho-pelagic life cycle, exposed continuously during its early ontogeny, whilst providing in-depth insights on their metabolic responses. We selected, as an ideal study species, the American lobster Homarus americanus, and investigated life history traits, whole-organism physiology, and metabolomic fingerprints from larval stage I to juvenile stage V exposed to different pCO2 levels. Current and future ocean acidification scenarios were tested, as well as extreme high pCO2/low pH conditions that are predicted to occur in coastal benthic habitats and with leakages from underwater carbon capture storage (CCS) sites. Larvae demonstrated greater tolerance to elevated pCO2, showing no significant changes in survival, developmental time, morphology, and mineralisation, although they underwent intense metabolomic reprogramming. Conversely, juveniles showed the inverse pattern, with a reduction in survival and an increase in development time at the highest pCO2 levels tested, with no indication of metabolomic reprogramming. Metabolomic sensitivity to elevated pCO2 increased until metamorphosis (between larval and juvenile stages) and decreased afterward, suggesting this transition as a metabolic keystone for marine invertebrates with complex life cycles.

1. Introduction

Bentho-pelagic life cycles are the dominant reproductive strategy in the oceans, as they are found in more than 75% of known marine invertebrate species [1]. This reproductive strategy can provide various benefits, including long distance dispersal, colonisation of new habitats, access to different resources, and competition avoidance of resources with conspecifics. However, pelagic early life stages are also subjected to increased mortality due to predation and exposure to environmental fluctuations experienced in their pelagic habitats [1]. Moreover, complex life cycles are punctuated by critical junctures along the ontogenetic trajectory, beginning at hatching when larvae are released in the water column, continuing with metamorphosis when larvae transform into post-larvae and reach the juvenile stages when they return to the sea floor [2]. These junctures represent bottlenecks, or biological filters, that reduce recruitment to the adult population [3].
Early life stages strongly differ from one another for their anatomical, physiological, and behavioural traits. Changes occurring throughout ontogeny progressively contribute to the ecological shift that takes place during the transition from the planktonic to the benthic habitat, with metamorphosis representing a fundamentally key moment during development [4,5]. Homeostatic and regulatory functions develop throughout ontogeny and, as a consequence, early life stages are overall considered to be more sensitive to environmental changes when compared to later life stages [6,7,8].
Along their ontogeny, with habitat transition, early life stages naturally face changes in temperature, salinity, dissolved oxygen (O2) and carbon dioxide (CO2), among other environmental drivers [6]. However, ongoing environmental changes are occurring at a faster rate than documented before, and are punctuated with more frequent and intense extreme events, when compared to those that organisms have experienced in their evolutionary history [9,10,11]. Among these changes, ocean acidification (OA) is recognised as a major threat for marine life, and in particular for calcifying species [12]. Due to the increase in atmospheric CO2 partial pressure (pCO2), pH in surface waters is predicted to decline by 0.3 pH units by the end of the century, according to the Intergovernmental Panel on Climate Change (IPCC RCP 8.5; [13]). Modifications of seawater carbonate chemistry due to OA also lead to a decrease in carbonate ion concentrations (CO32−) [14] and a reduction in the calcium carbonate saturation state (Ω), which regulates the thermodynamics of calcium carbonate (CaCO3) precipitation [15]. However, pH levels predicted to occur by the end of the century for the open ocean have already been reached in coastal areas, and even lower levels have already been documented, associated with upwellings, freshwater influxes, and eutrophication events [16,17]. These pH decreases, and changes in carbonate chemistry, are known to affect marine organisms’ mineralisation and mineralised structures [18]. In addition, these conditions challenge a number of marine organisms physiologically, more specifically impacting their energy metabolism, acid-base balance, osmo-ionic regulation, and general homeostasis [19]. Whether and how marine invertebrates’ early life stages will be able to cope with these environmental changes is still poorly understood [20], particularly from a metabolic perspective.
Among marine invertebrates, crustaceans, and especially decapods, are considered to be among the least affected calcifying species by the exposure to low pH/high pCO2 conditions [8,12] in terms of survival, growth, metabolism, acid-base balance, carapace mineralisation, and behaviour [21,22,23,24,25,26]. While different species can show opposite responses [27,28], this overall low sensitivity to OA may be linked to crustaceans homeostatic and regulatory abilities, their capacity to relocate exoskeletal calcium (Ca2+) and carbonate (CO32−) ions during moulting, and their impermeable cuticle protecting the carapace from dissolution and limiting exchanges with the surrounding environment [28,29,30]. Results of studies on decapods’ sensitivity to OA are disparate, especially considering the discrepancy in results across species and life stages (e.g., [27,31,32,33,34,35]). In addition, most studies on this subject have mainly focused on life history and developmental traits [8], creating an important paucity in terms of our understanding of the metabolic mechanisms involved in OA responses [36]. This is also true for species of great economic importance, such as the American lobster (Homarus gammarus, Milne Edwards, 1837), which supports the most valuable and lucrative single fishery in Atlantic North America [37,38].
Lobster pre-larvae, hatched from the egg mass carried by the female, moult into the first mobile zoea larval stage (stage I) [4]. This stage is followed by two other planktonic zoea stages (stage II and III), each separated from one another by a moult. Subsequently, a metamorphic moult occurs at the end of stage III, leading to the post-larval stage IV. Stage IV lobsters eventually reach the seafloor to search for a suitable habitat in which to settle, swimming between the water column and the benthic habitat. When they finally settle, another moult transforms post-larvae into stage V juveniles. A series of juvenile stages follows, ultimately leading to the adult stage. Along with ontogeny, different studies have shown that OA conditions could affect survival, development, growth, carapace composition and size, feeding capacities, swimming behaviour, and oxygen consumption, but also elementary composition and gene expression in some stages [36,39,40,41,42].
While these studies have a great value in outlining the sensitivity of the American lobster to OA, improving our appreciation of the metabolic challenges that early life stages face under OA conditions requires: (i) investigating multiple successive early life stages, not excluding developmental keystones; (ii) determining early life stages responses to a discreet pH/pCO2 gradient, instead of single or few specific OA scenarios, which enables us to produce more robust predictions of physiological responses and supports science-informed management decisions [43,44,45,46]; and (iii) explicitly investigating the metabolic implications of exposure to low pH/high pCO2 [47]. Consequently, the aim of our work was to simultaneously investigate life history traits and metabolic (both at the cellular and whole-organism level) responses of successive early life stages exposed to a range of elevated pCO2 conditions.
We exposed consecutive stages I to V of the American lobster to seven different pCO2 representing current (400 µatm), OA predictions for open ocean (600, 800, and 1000 µatm), and extreme levels which are already experienced in coastal benthic environment, and are expected to occur more frequently with predicted global changes and potential leakages from underwater carbon capture storages (CCS) (1200, 2000, and 3000 µatm). We particularly investigated changes in survival, developmental time, morphometrics, mineralisation, metabolic rates, and metabolic pathway utilisation as a function of seawater pCO2 in early development. As strong changes in anatomy, physiology, ecology, and behaviour occur during development, we hypothesized that progressive changes in metabolic functions and sensitivity to elevated pCO2 will occur with ontogeny. In line with the historical view that larvae are less tolerant to environmental changes [6,48], we hypothesized on one hand that larval stages would be more sensitive than juveniles to high pCO2 especially due to their poor homeostatic and regulatory functions. On another hand, the ongoing organogenesis and progressive mineralisation of the carapace of juvenile stages would cause them to be more negatively impacted by elevated pCO2 than larvae, according to a more modern view [34,42]. Finally, given the significance of metamorphosis occurring between stage III and stage IV [4], we specifically hypothesized that the sensitivity to elevated pCO2 is highest at this transition phase between the last larval and post-larval/first juvenile stage, particularly for the metabolic functions investigated.

2. Results

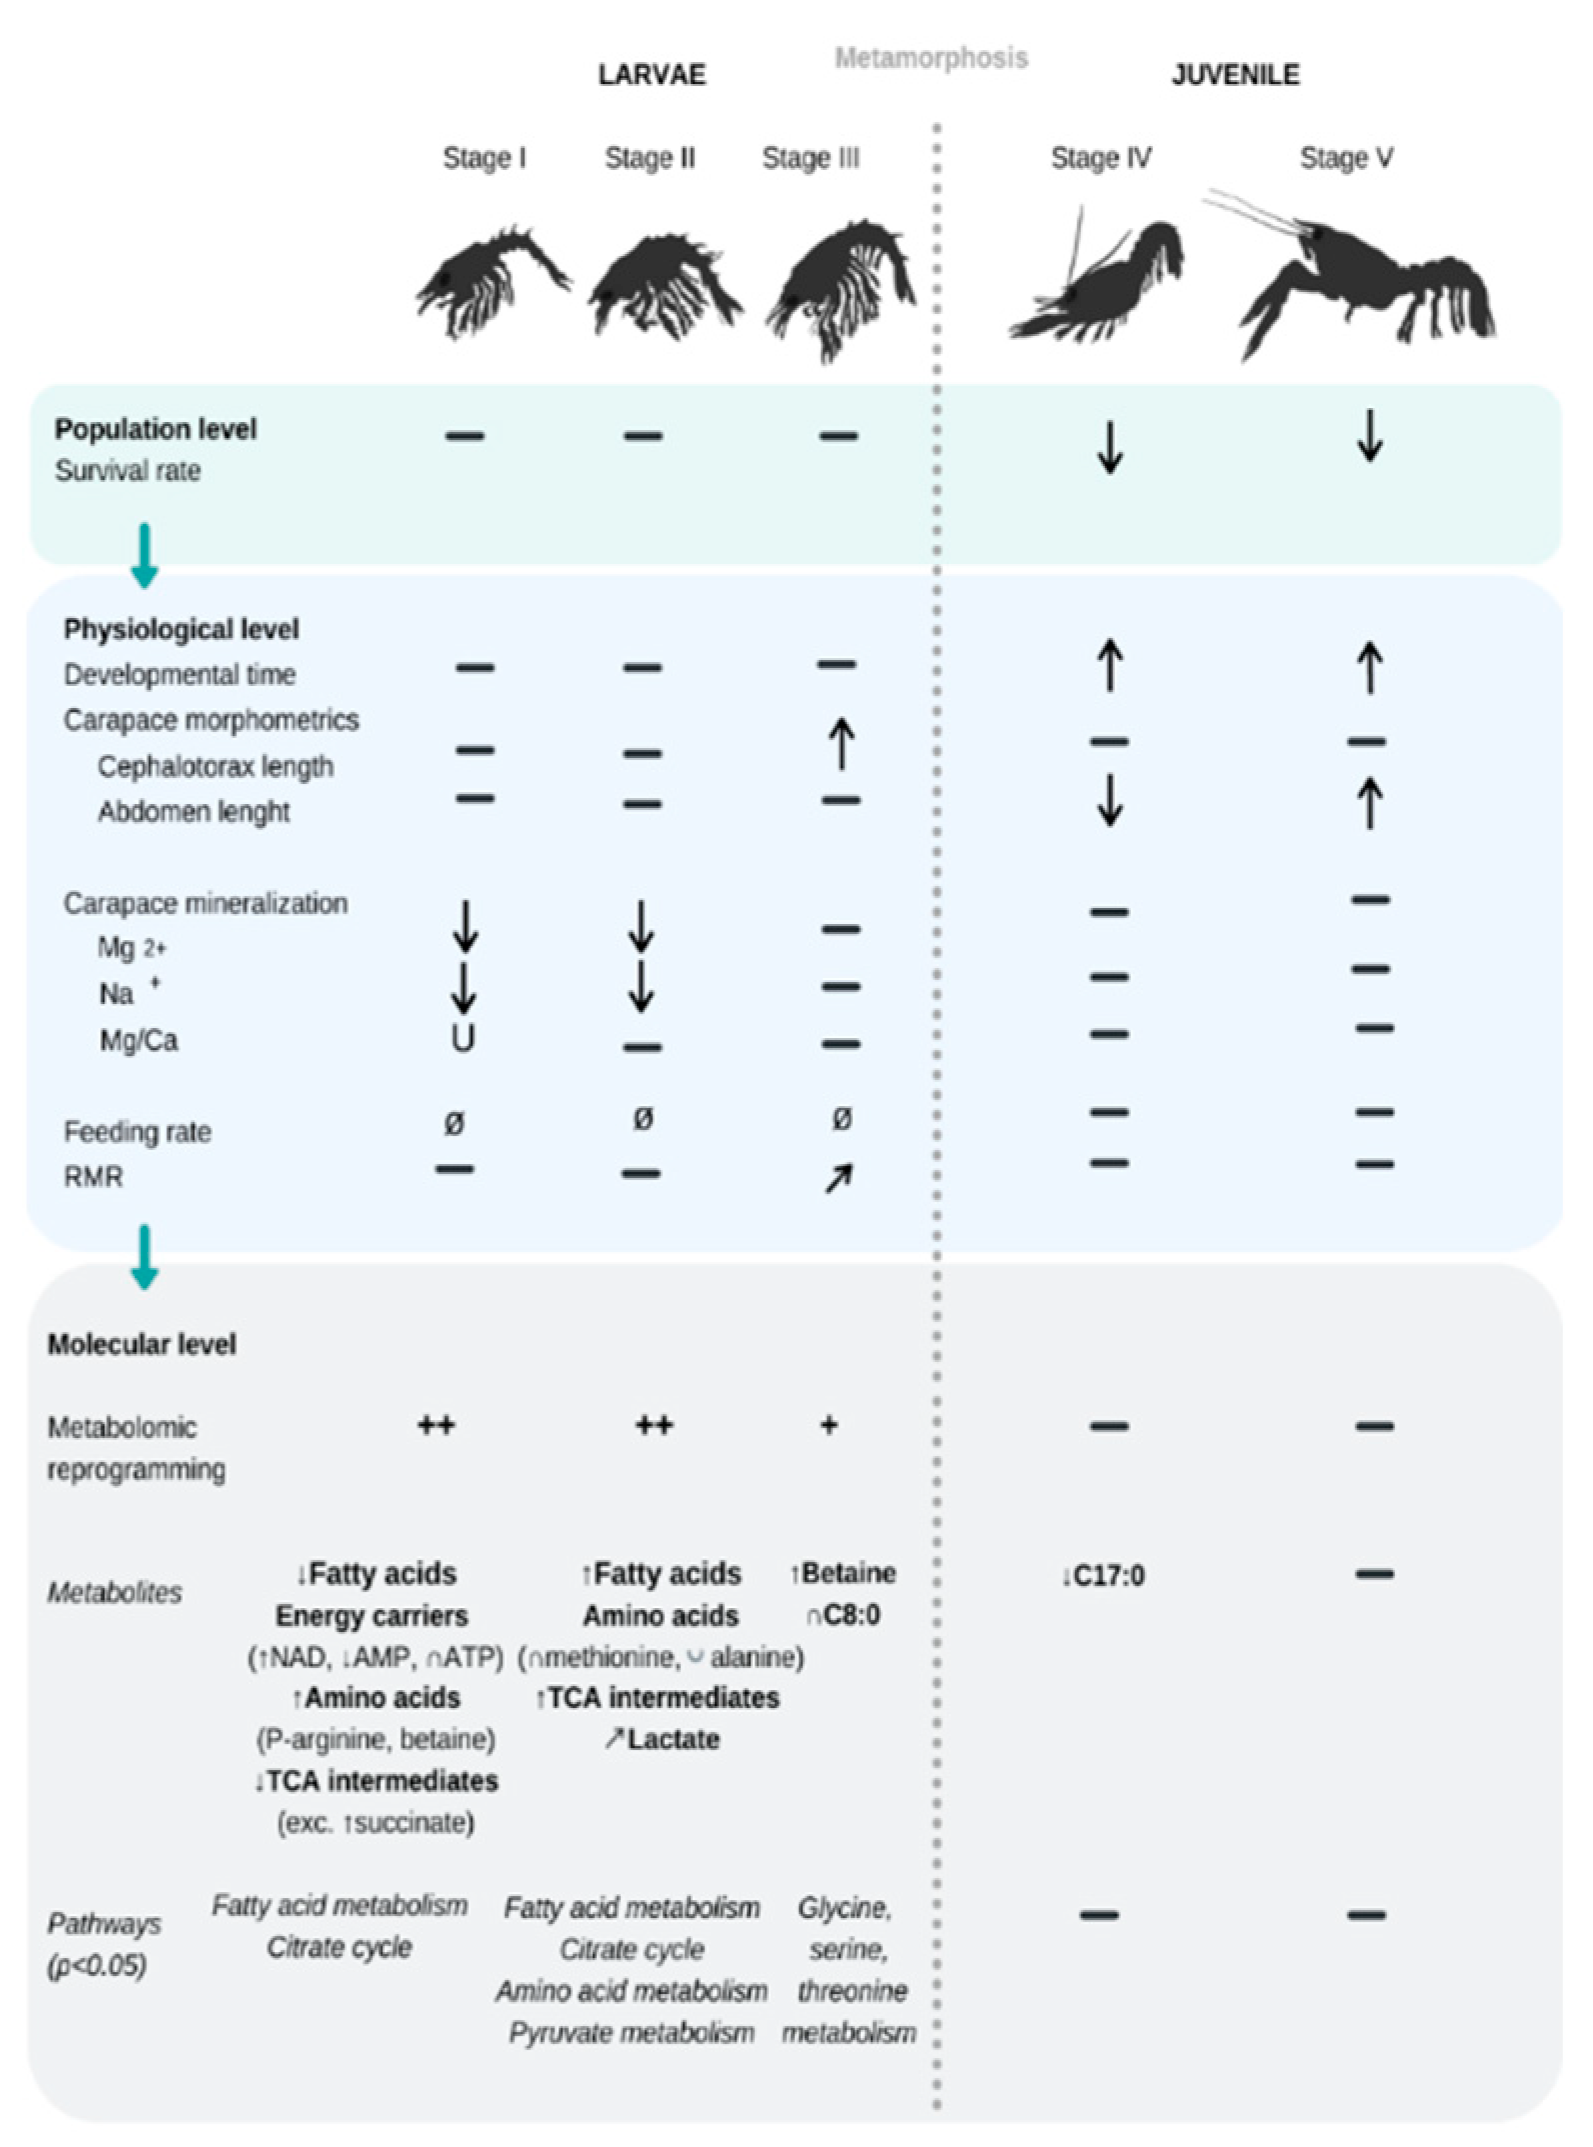
2.1. Functional Changes across Ontogeny

Throughout their development, early life stages of the American lobster Homarus americanus changed significantly, not only in terms of body size and carapace mineralisation (main components Ca2+, Mg2+, Na+, K+, and Sr +), but also in terms of metabolic rates. Fundamentally, all traits increase from one stage to the next along lobsters’ ontogenetic trajectory (Tables S1–S3). Briefly, for body size, from stage I to stage V (i) mean body size increased progressively from 4.72 ± 0.05 to 9.38 ± 0.12 mm, (ii) mean cephalothorax length increased from 1.93 ± 0.03 to 4.57 ± 0.06 mm, and (iii) mean abdomen size increased from 2.78 ± 0.03 to 4.80 ± 0.07 mm (Table S1). In addition, stage IV and V lobsters show higher carapace [Ca2+] and [Mg2+] and lower carapace [K+] when compared to the larval stages (Table 1 and Table S2). In particular, [Ca2+] showed a major increase between stage III and stage IV (Table S2).
Metabolomic profiles differed significantly between larval and post-metamorphosis stages, as the metabolomes of developmental stages formed two discernible clusters for the different phases (Figure 1). More specifically, one grouping included stage I, II, and III, and the other grouping stage IV and V (explained variance of 24.1% for PC1 and PC2, Figure 1a), despite a progressive shift from stage I to stage V metabolomics profile being evident (Figure 1c). Metabolite C17:0 presented higher concentrations during early developmental stages, decreasing toward post-metamorphosis stages. ADP, AMP, C22:6, and C22:1 were also among the top five ranked metabolites with greater discriminatory power, which mostly increased in later developmental stages (Figure 1d). The full list of metabolites that significantly changed throughout ontogeny are involved in 18 pathways, identified as important in developmental processes (red area, Figure 1e).

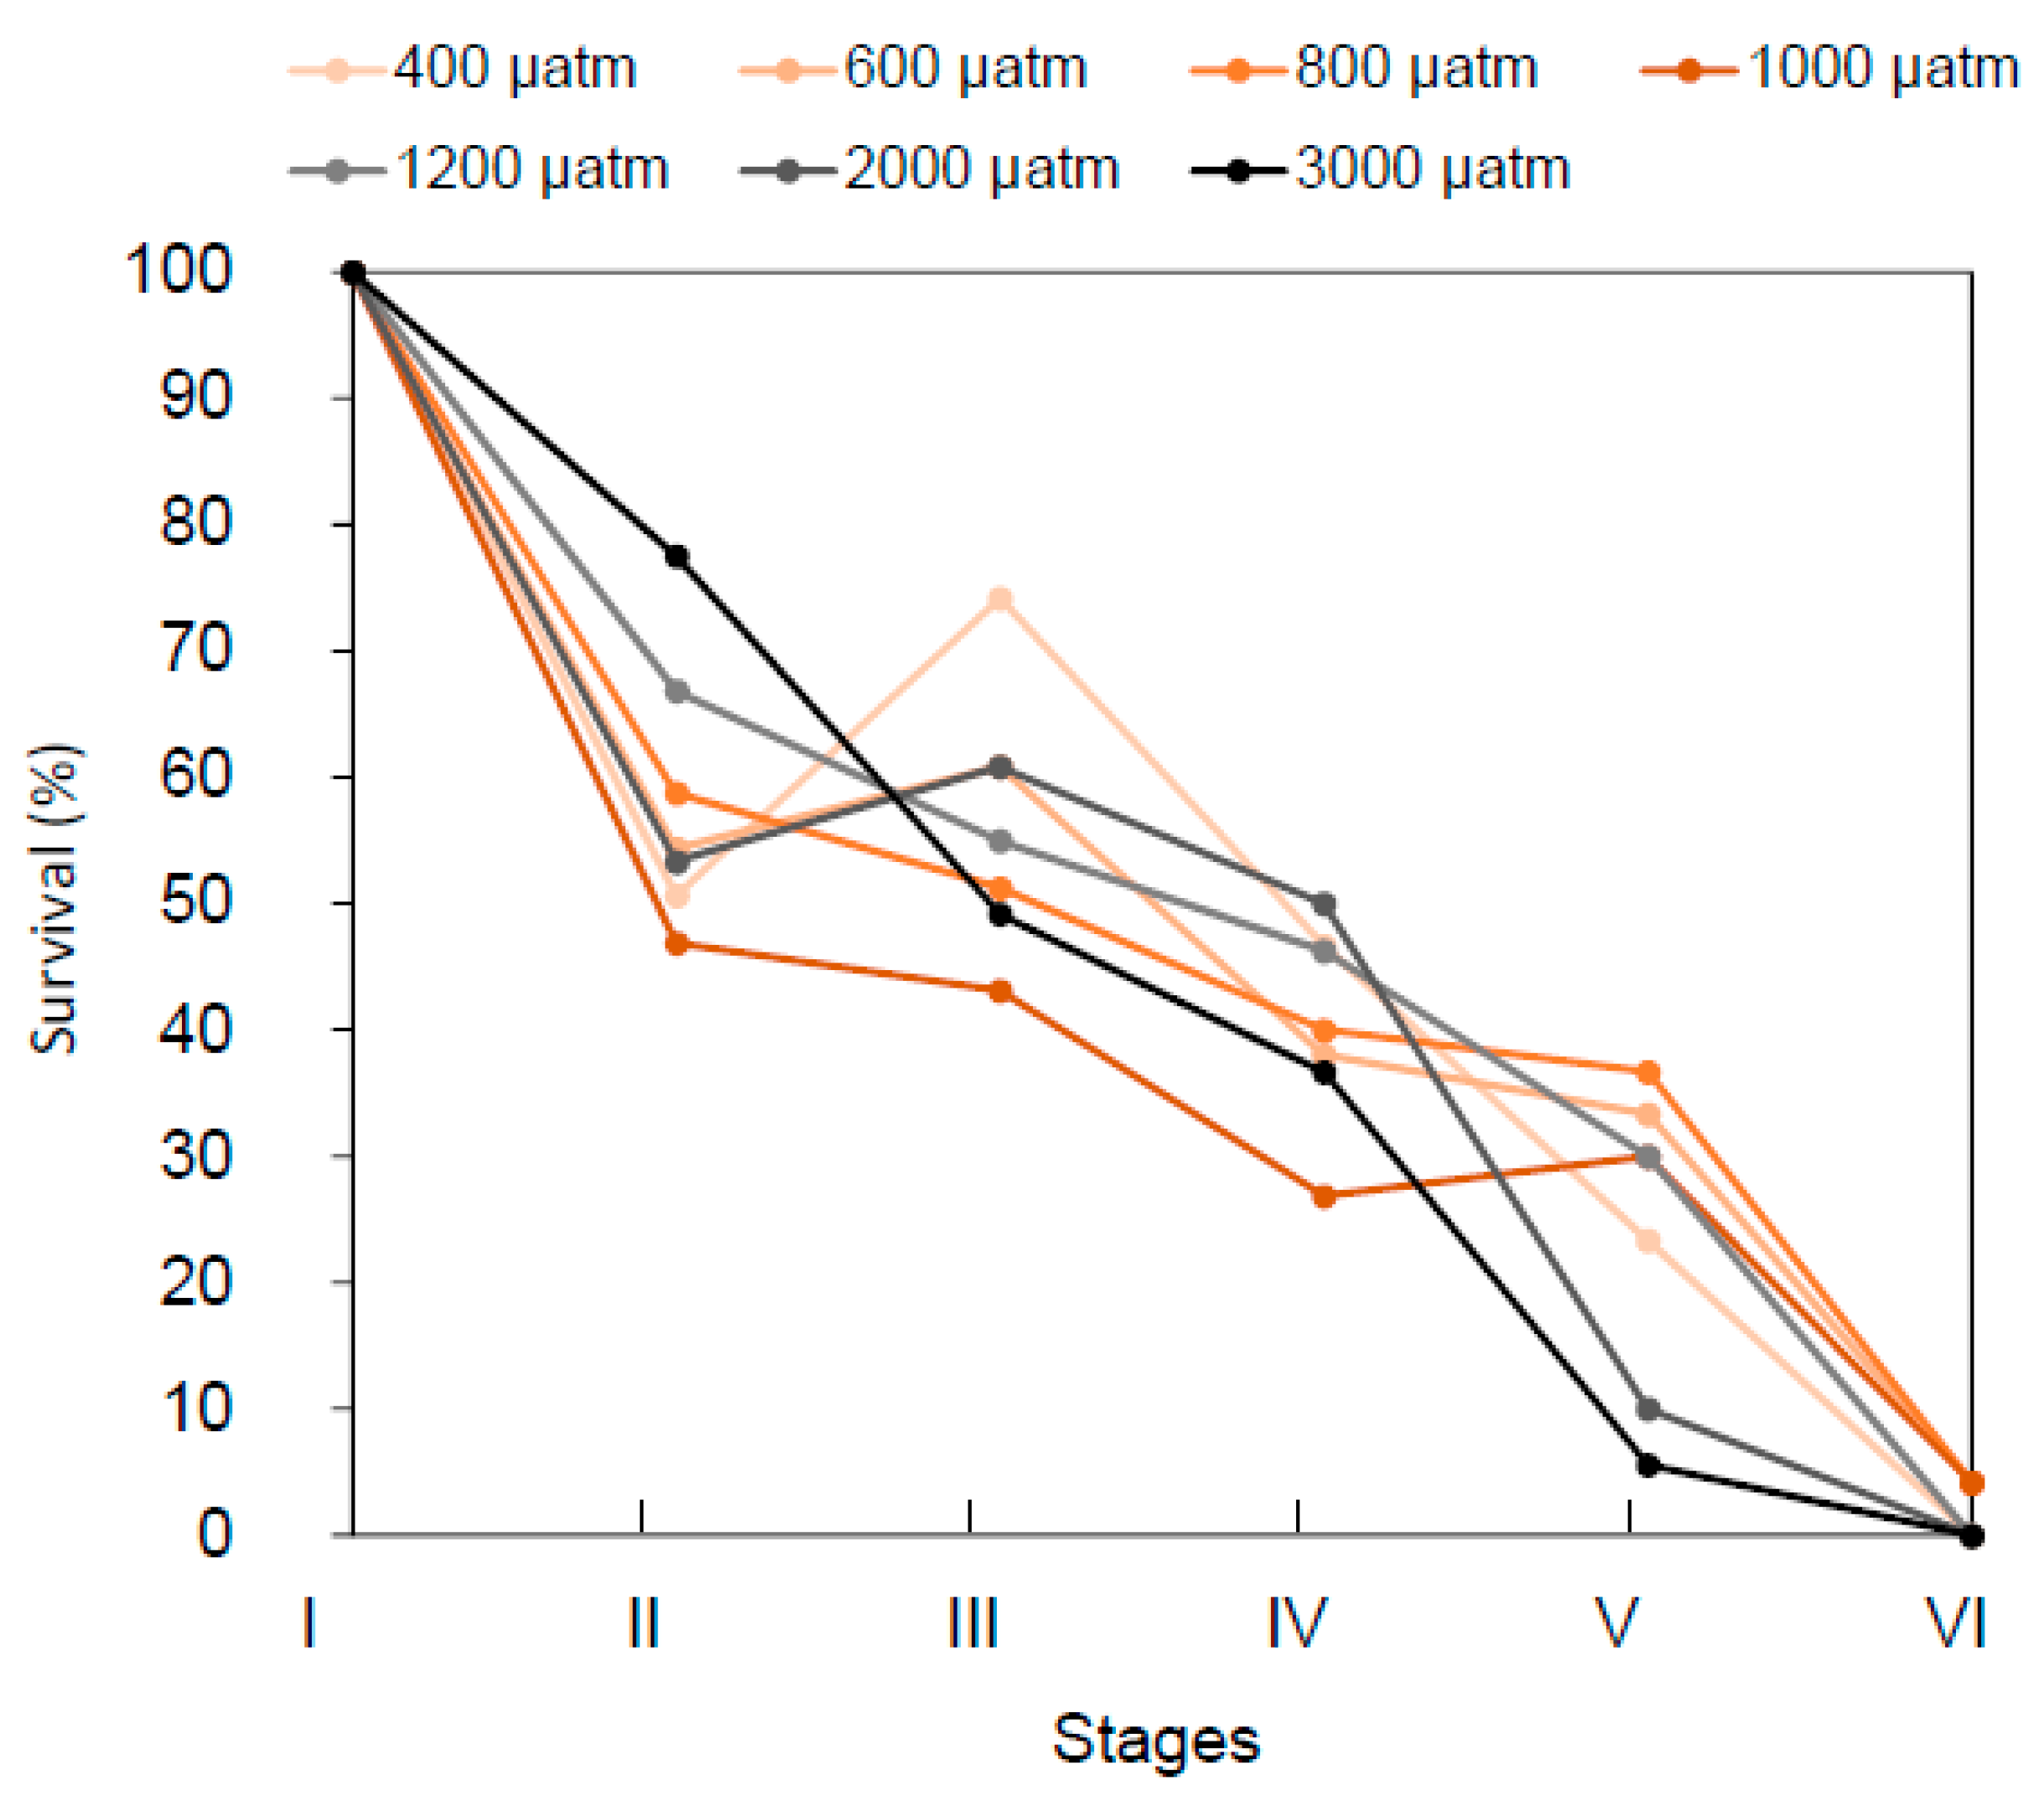
2.2. Stage-Specific pCO2 Effect on Survival Rates

Cumulative survival rates were negatively impacted by increasing pCO2 (Figure 2 and Figure 3), whilst survival between stages (Table S1) was differentially affected by pCO2 over developmental stages, as indicated by the presence of a significant interaction between the terms “pCO2” and “Stage” (Table 1). Specifically, a 42% survival decrease was observed between stage I and II for all the pCO2 conditions, without any clear pattern of differences as a function of pCO2. At the transition between stage III and IV, survival rates were between 30 and 50%, with the best survival rates recorded for pCO2 conditions of 1200 and 2000 µatm. At stage V, the survival drastically dropped to 10% for the two highest pCO2 conditions, and the highest survival rates (33 and 37%) were recorded at pCO2 600 and 800 µatm, respectively. Finally, at the juvenile stage VI, less than 5% of the initial number of larvae survived at 600 and 1000 µatm pCO2, whilst no survivor was recorded for all other treatments. Comparing the specific survival at each stage showed that only stage V survival significantly decreased with the increasing pCO2 (linear model, p = 0.003).

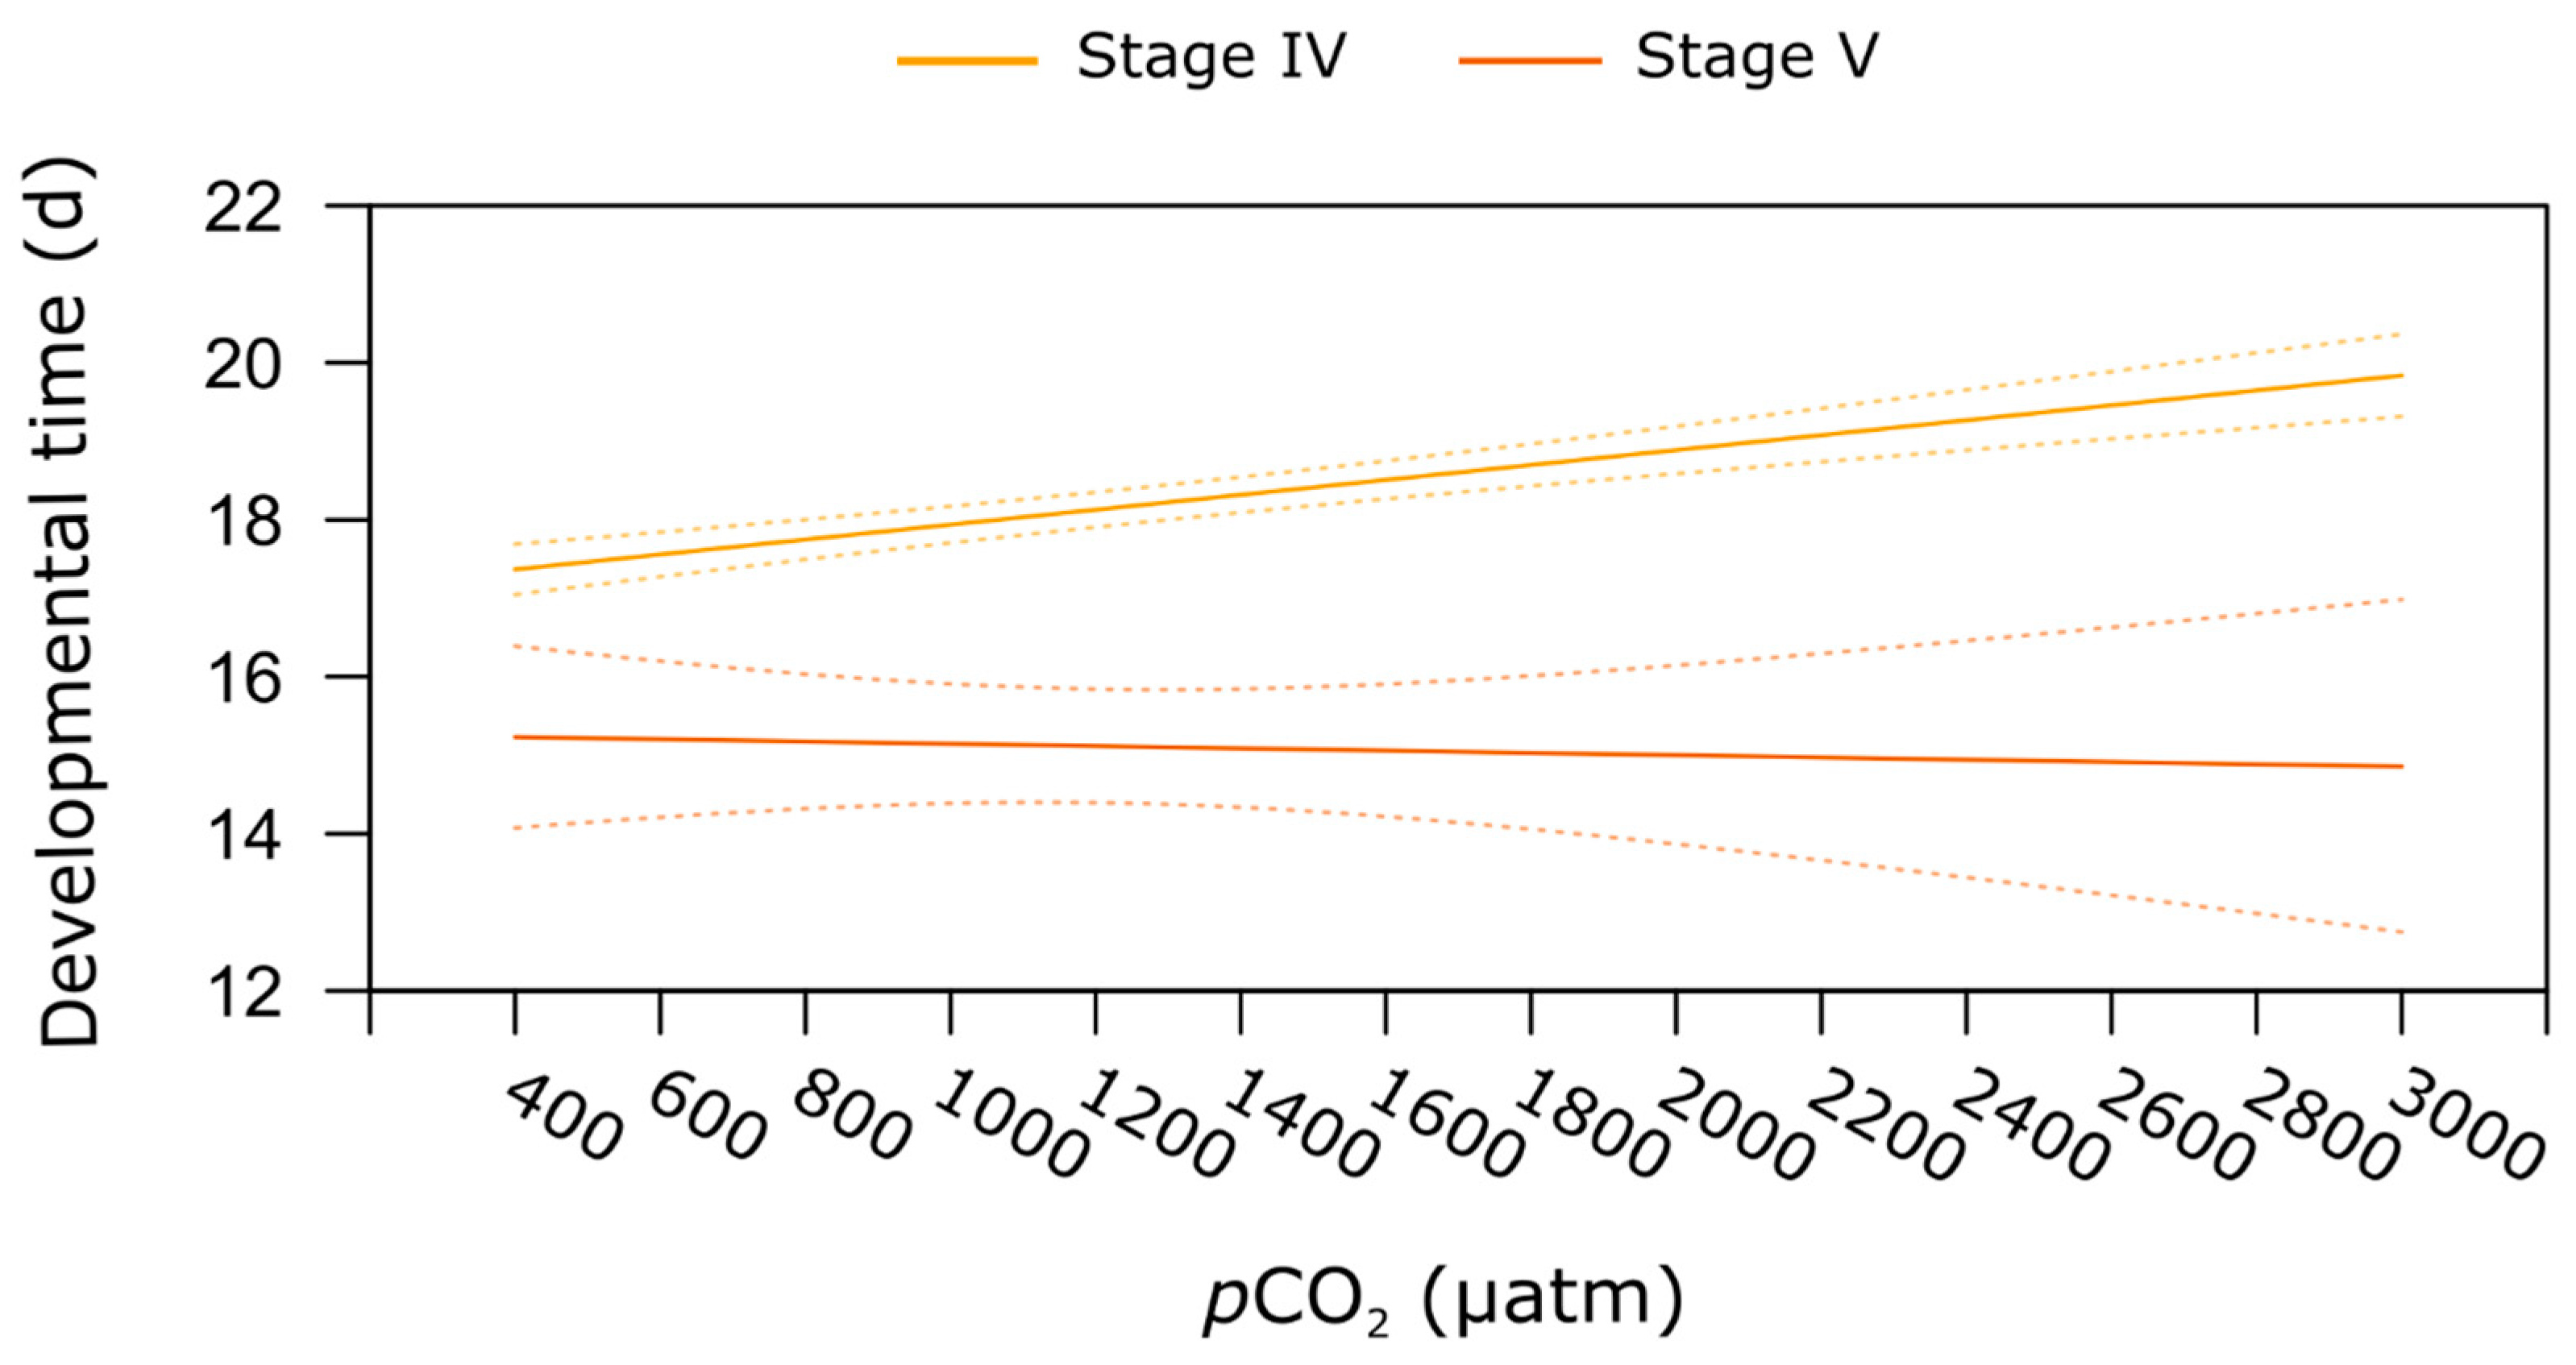
2.3. Stage-Specific pCO2 Effect on Developmental Time

Elevated pCO2 did not affect the duration of the development (i.e., developmental time) in the three larval stages. Transition between stages lasted on average 5 d for stages I to II and stages III to IV, and 6 d between stages II and III. As we used different techniques to determine developmental time (in batch for larvae versus individually for juveniles), the interaction between all life stages and pCO2 was not tested. However, for juveniles, exposure to increasing pCO2 significantly extended the duration of the developmental period, regardless of the post-larvae and juvenile stages (linear model, p < 0.001, Table 1). For stage IV, the developmental period increased significantly from 18 d at 400 µatm to 21 d at 3000 µatm of pCO2. The mean duration of the development period for stage V was 15 d, therefore shorter than for stage IV juveniles (Table 1, stage effect p < 0.001). Finally, we observed an increase in variation of the mean of the duration for the developmental period at the highest pCO2 tested, this pattern being more marked at stage V when compared to stage IV (see confidence interval, Figure 4).

2.4. Stage-Specific pCO2 Effect on Carapace Morphometrics

Lobsters’ cephalothorax, abdomen, and tail length varied in relation to increasing levels of pCO2 depending on the life stage, as indicated by the presence of a significant interaction between the terms “pCO2”and “Stage” for all these variables (linear models, Table 1). pCO2-dependent variation of cephalothorax length was best explained by a linear relationship, whilst abdomen and tail lengths by a logarithmic relationship (Table S4). In more detail, larval stage I and II morphometric measurements were comparable across all the different pCO2 conditions with a difference of 16 and 9% between the shortest and the longest cephalothorax and abdomen recorded, respectively (Figure 5). As a result, exposure to increasing seawater pCO2 did not affect these traits in larval stages I and II (stage-specific linear model, p > 0.05). Conversely, cephalothorax length of stage III larvae increased significantly with increasing seawater pCO2 (stage-specific linear model, p < 0.001). Mean cephalothorax length ranged from 2.78 to 3.15 mm, respectively measured at 400 to 3000 µatm, i.e., a 36% increase in this trait. Finally, no effect of seawater pCO2 was found on stage III abdomen length (stage-specific linear model, p > 0.05). Juvenile stages showed opposite responses when compared to those observed at stage III, with a slight decrease in abdomen length with increasing pCO2 (stage-specific linear models, p = 0.019 for stage IV and p = 0.004 for stage V; Figure 5). However, seawater pCO2 had no significant effect on mean cephalothorax length at stage IV and V.
In general, increasing pCO2 alone did not affect morphometric parameters except for the total length of individuals (linear model, all stages included, p < 0.001; Table 1), which tended to increase slightly with increasing pCO2 (Table S1). Total length measured at 400 µatm was generally the shortest length, and the increase in pCO2 led to an increase in length of 10 to 20% from one stage to another.

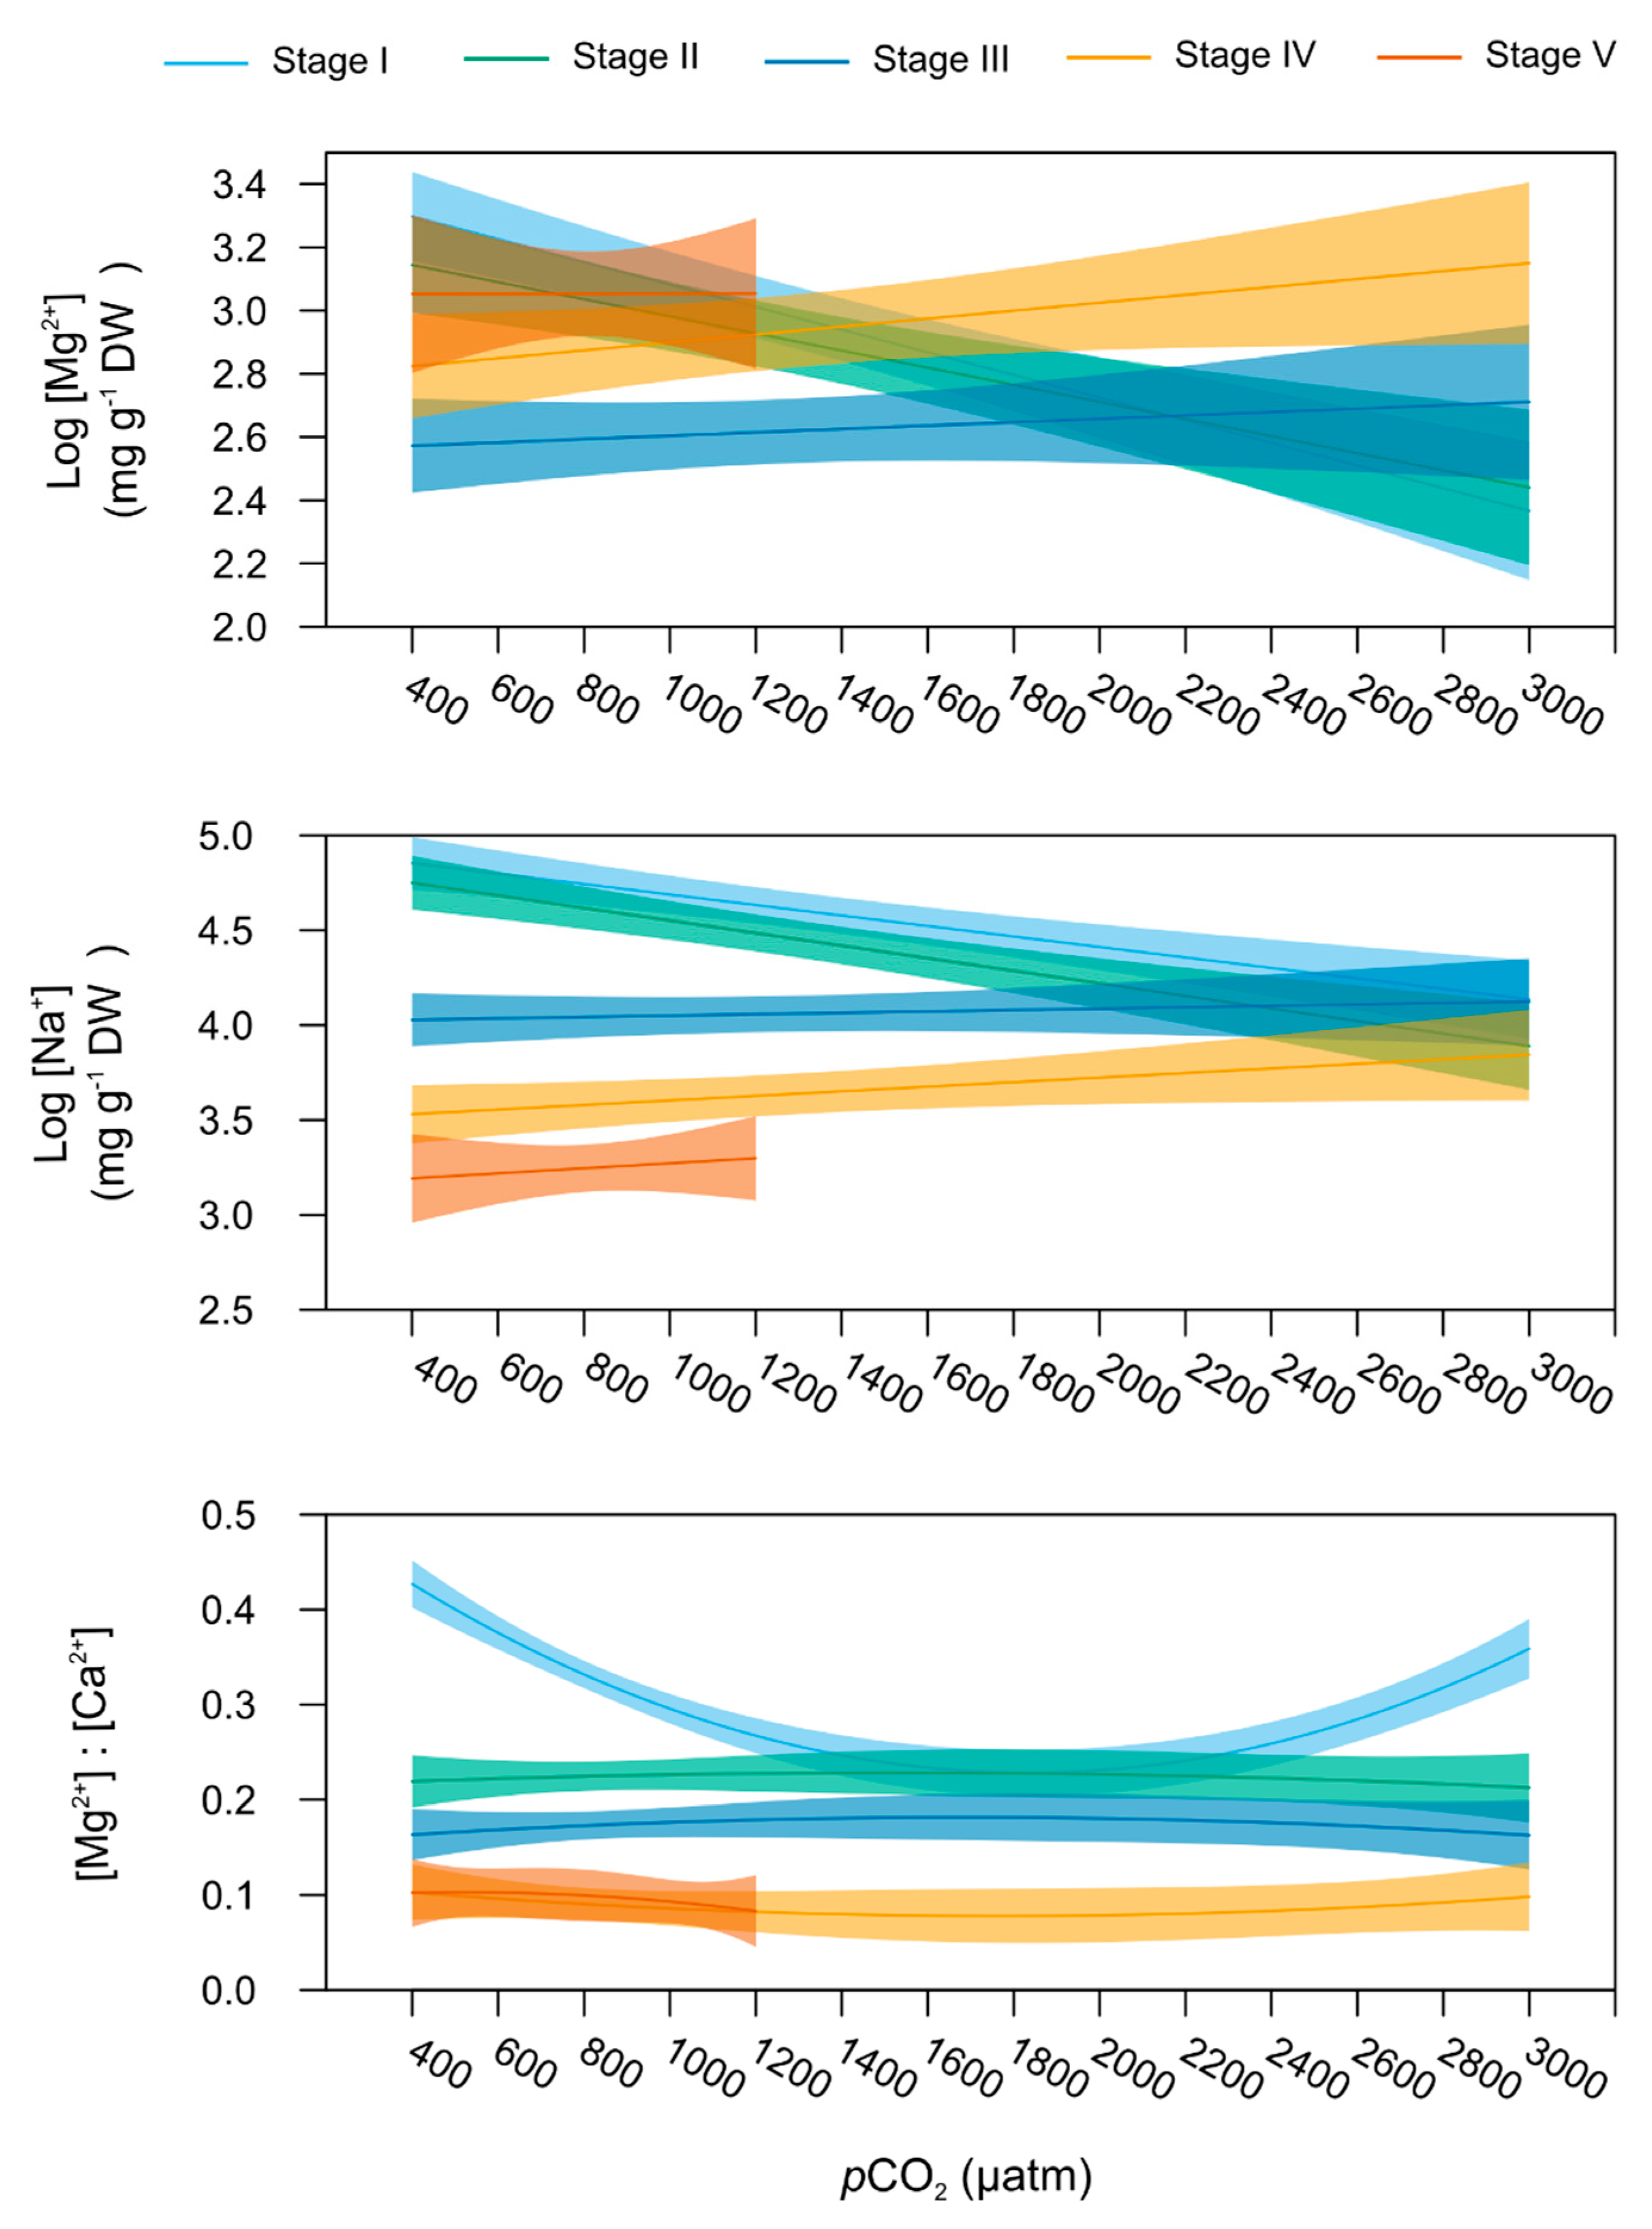
2.5. Stage-Specific pCO2 Effect on Carapace Mineralisation

Among the six ions measured in the lobsters’ carapace, only [Mg2+] and [Na+] varied significantly with increasing levels of pCO2 depending on the life stage (linear model, p = 0.033 and 0.034, respectively, Table 1). [Mg2+] and [Na+] pCO2-dependent responses were best explained by a linear relationship (Table S4), whilst a polynomial model better fitted [Mg2+]:[Ca2+]-pCO2 relationship (model polynomial 2nd degree, Table 1 and Table S4).
In particular, larvae stage I and II (Figure 6) were seen to possess lowering carapace [Mg2+] and [Na+] with seawater pCO2 increasing from 400 to 3000 µatm (stage-specific linear models, stage I: pMg2+ = 0.004 and pNa+ = 0.026, and stage II: pMg2+ = 0.045 and pNa+ = 0.006). No significant pCO2 effect was observed on these mineral contents for larvae stage III and subsequent juvenile stages (stage-specific linear models, p > 0.05).
In stage I larvae, [Mg2+]:[Ca2+] described a U-shaped response pattern to increasing pCO2 (stage-specific linear model, p = 0.04). The lowest ratios were observed at 800 and 1000 µatm (Figure 6). Even if none of the stage-specific linear model showed a significant pCO2 effect, stages II and III showed the highest [Mg2+]:[Ca2+] values for pCO2 between 800 and 1200 µatm (Figure 5, Table S2) while stage IV presented the lowest [Mg2+]:[Ca2+] ratio at 600 and 800 µatm (Table S2). Finally, mean cation ratios did not change significantly across the pCO2 gradient for stage V lobsters.
Carapace [K+] was the only parameter not showing stage-specific sensitivity to seawater pCO2, as it followed a comparable slight linear decreasing trend with increasing seawater pCO2 across all stages (p = 0.033, Table 1).

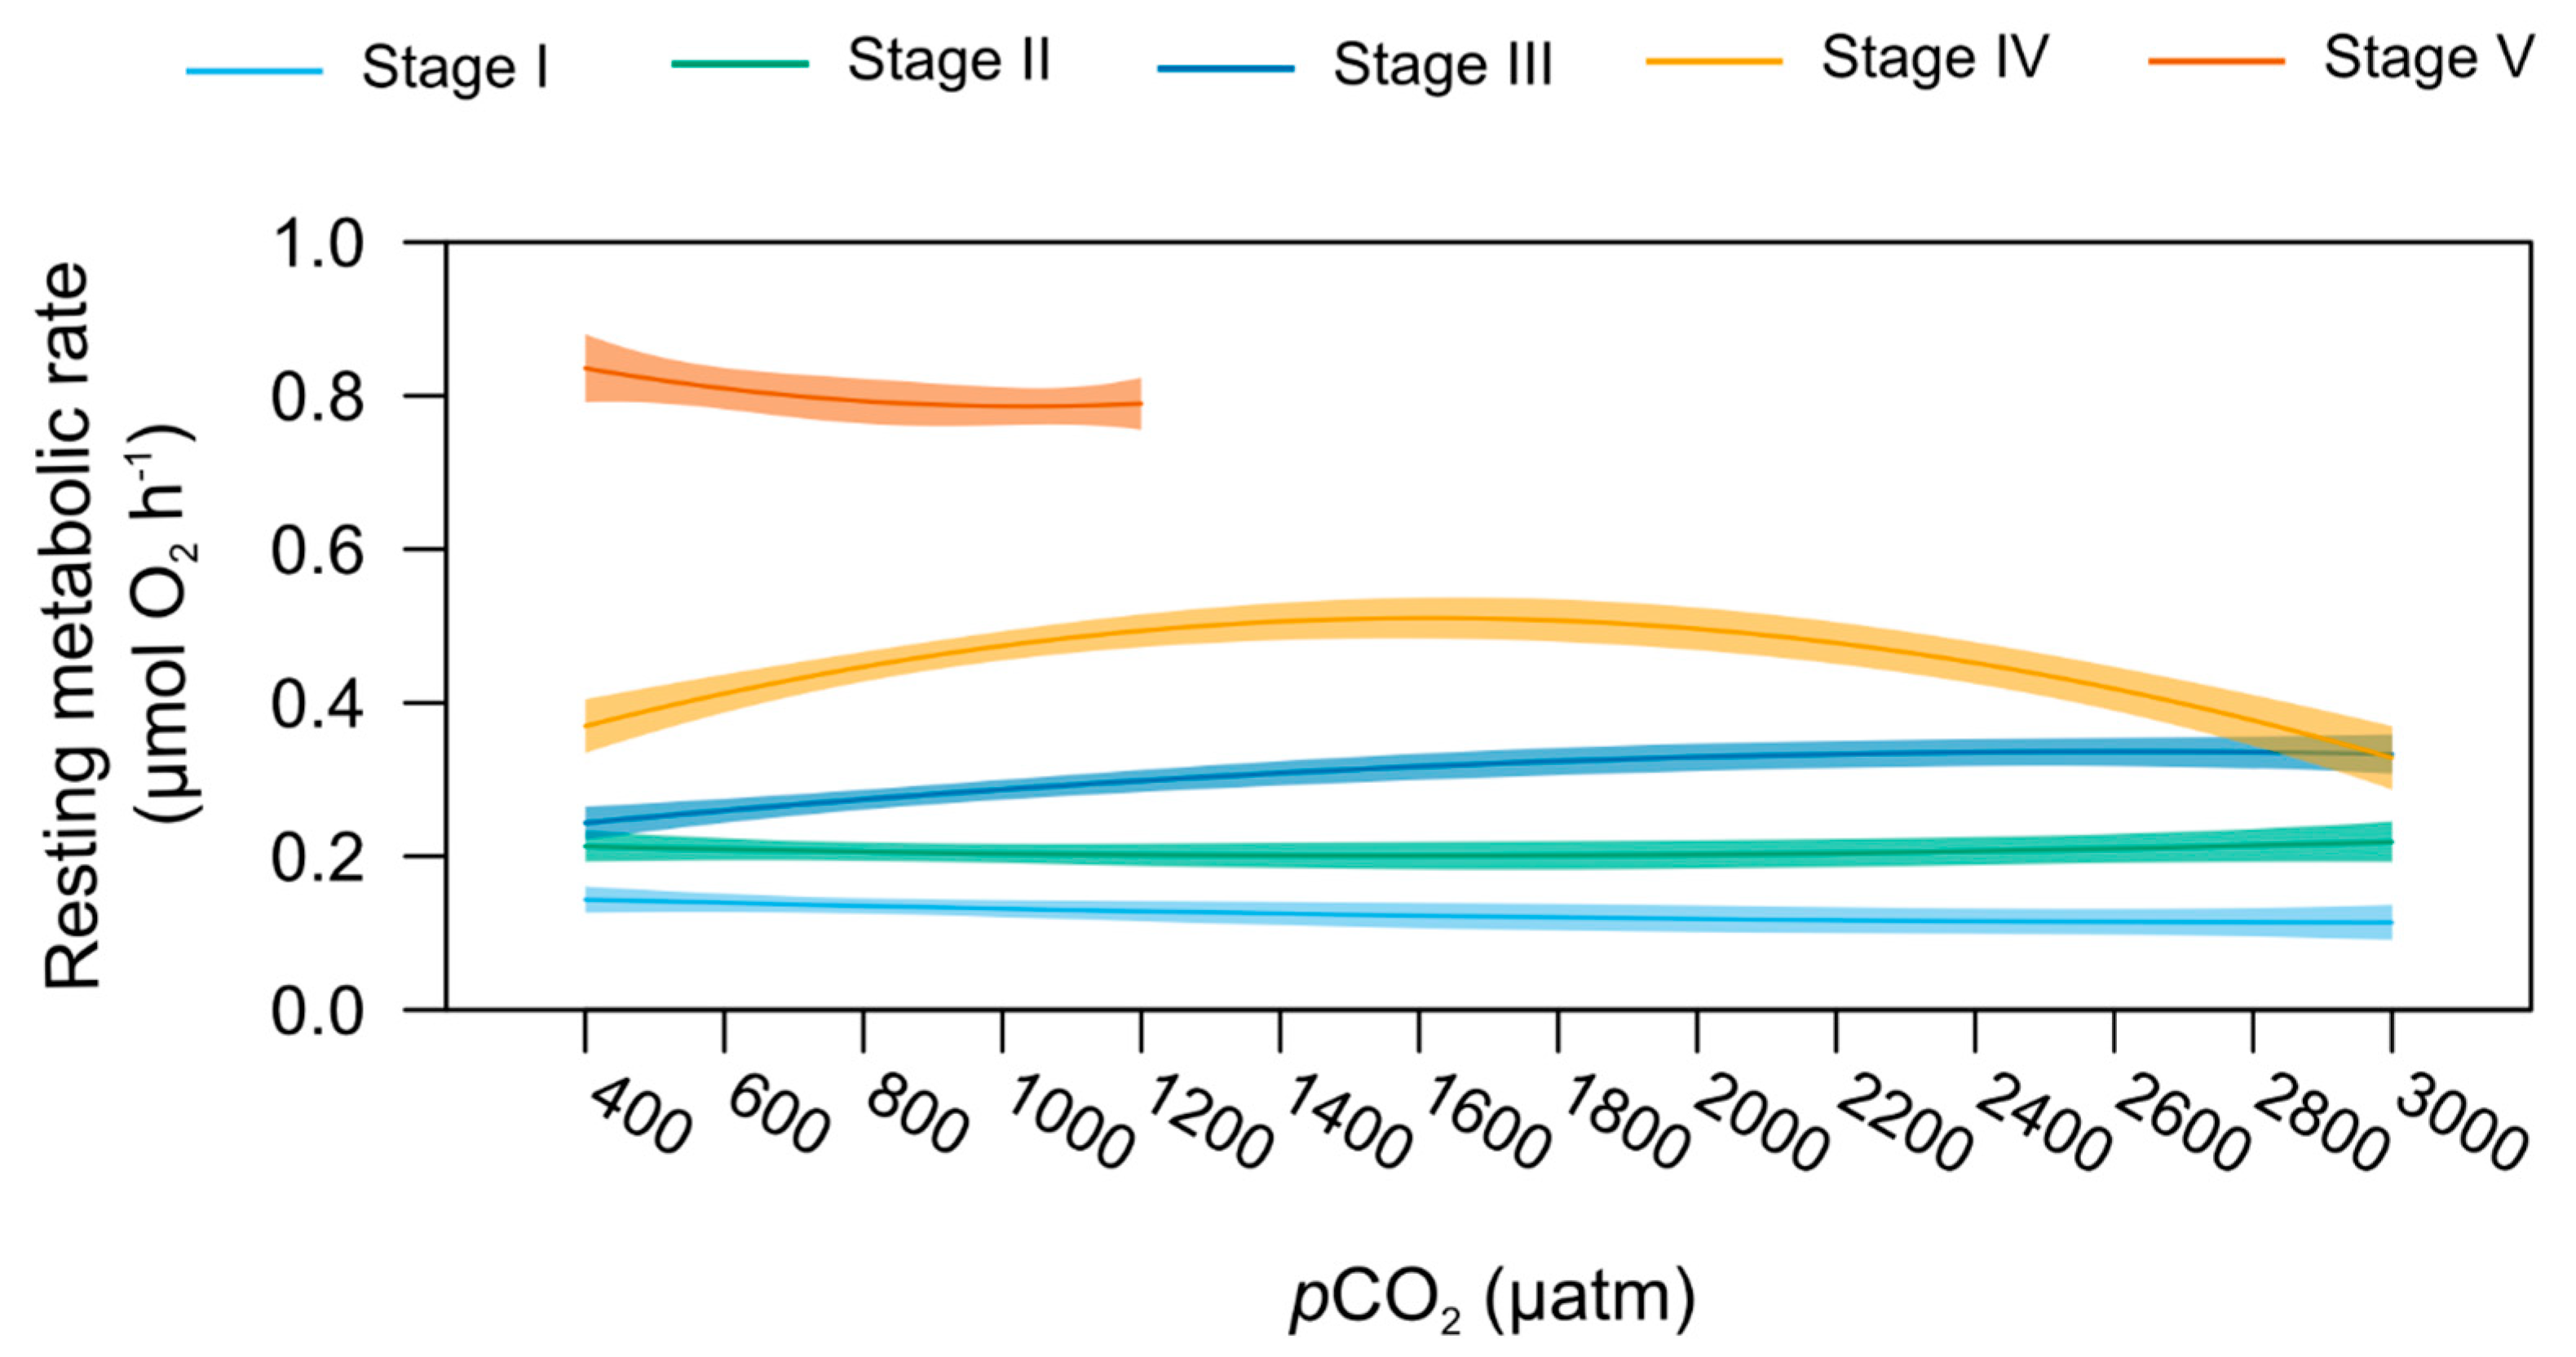
2.6. Stage-Specific pCO2 Effect on Resting Metabolic and Feeding Rates

Resting metabolic rates (MO2) responded differently to increasing seawater pCO2 at the different life stages investigated, as shown by the presence of a significant interaction between the term “Stage” and “pCO2” (polynomial model, p < 0.001, Figure 2). However, no significant pCO2 effect on MO2 was detected using stage-specific models (Figure 7). It is noted that stage III MO2 trended upwards with the increasing pCO2 from 0.17 µmol O2 h−1 at 400 µatm to 0.30 µmol O2 h−1 at 3000 µatm (Table S3).
The increase in pCO2 did not significantly affect feeding rate, neither in juvenile stage IV (mean ± SE = 9.51 ± 1.18 mg fish h−1 all pCO2 considered) nor in juvenile stage V (mean ± SE = 11.44 ± 1.23 mg fish h−1 all pCO2 considered, Table 1).

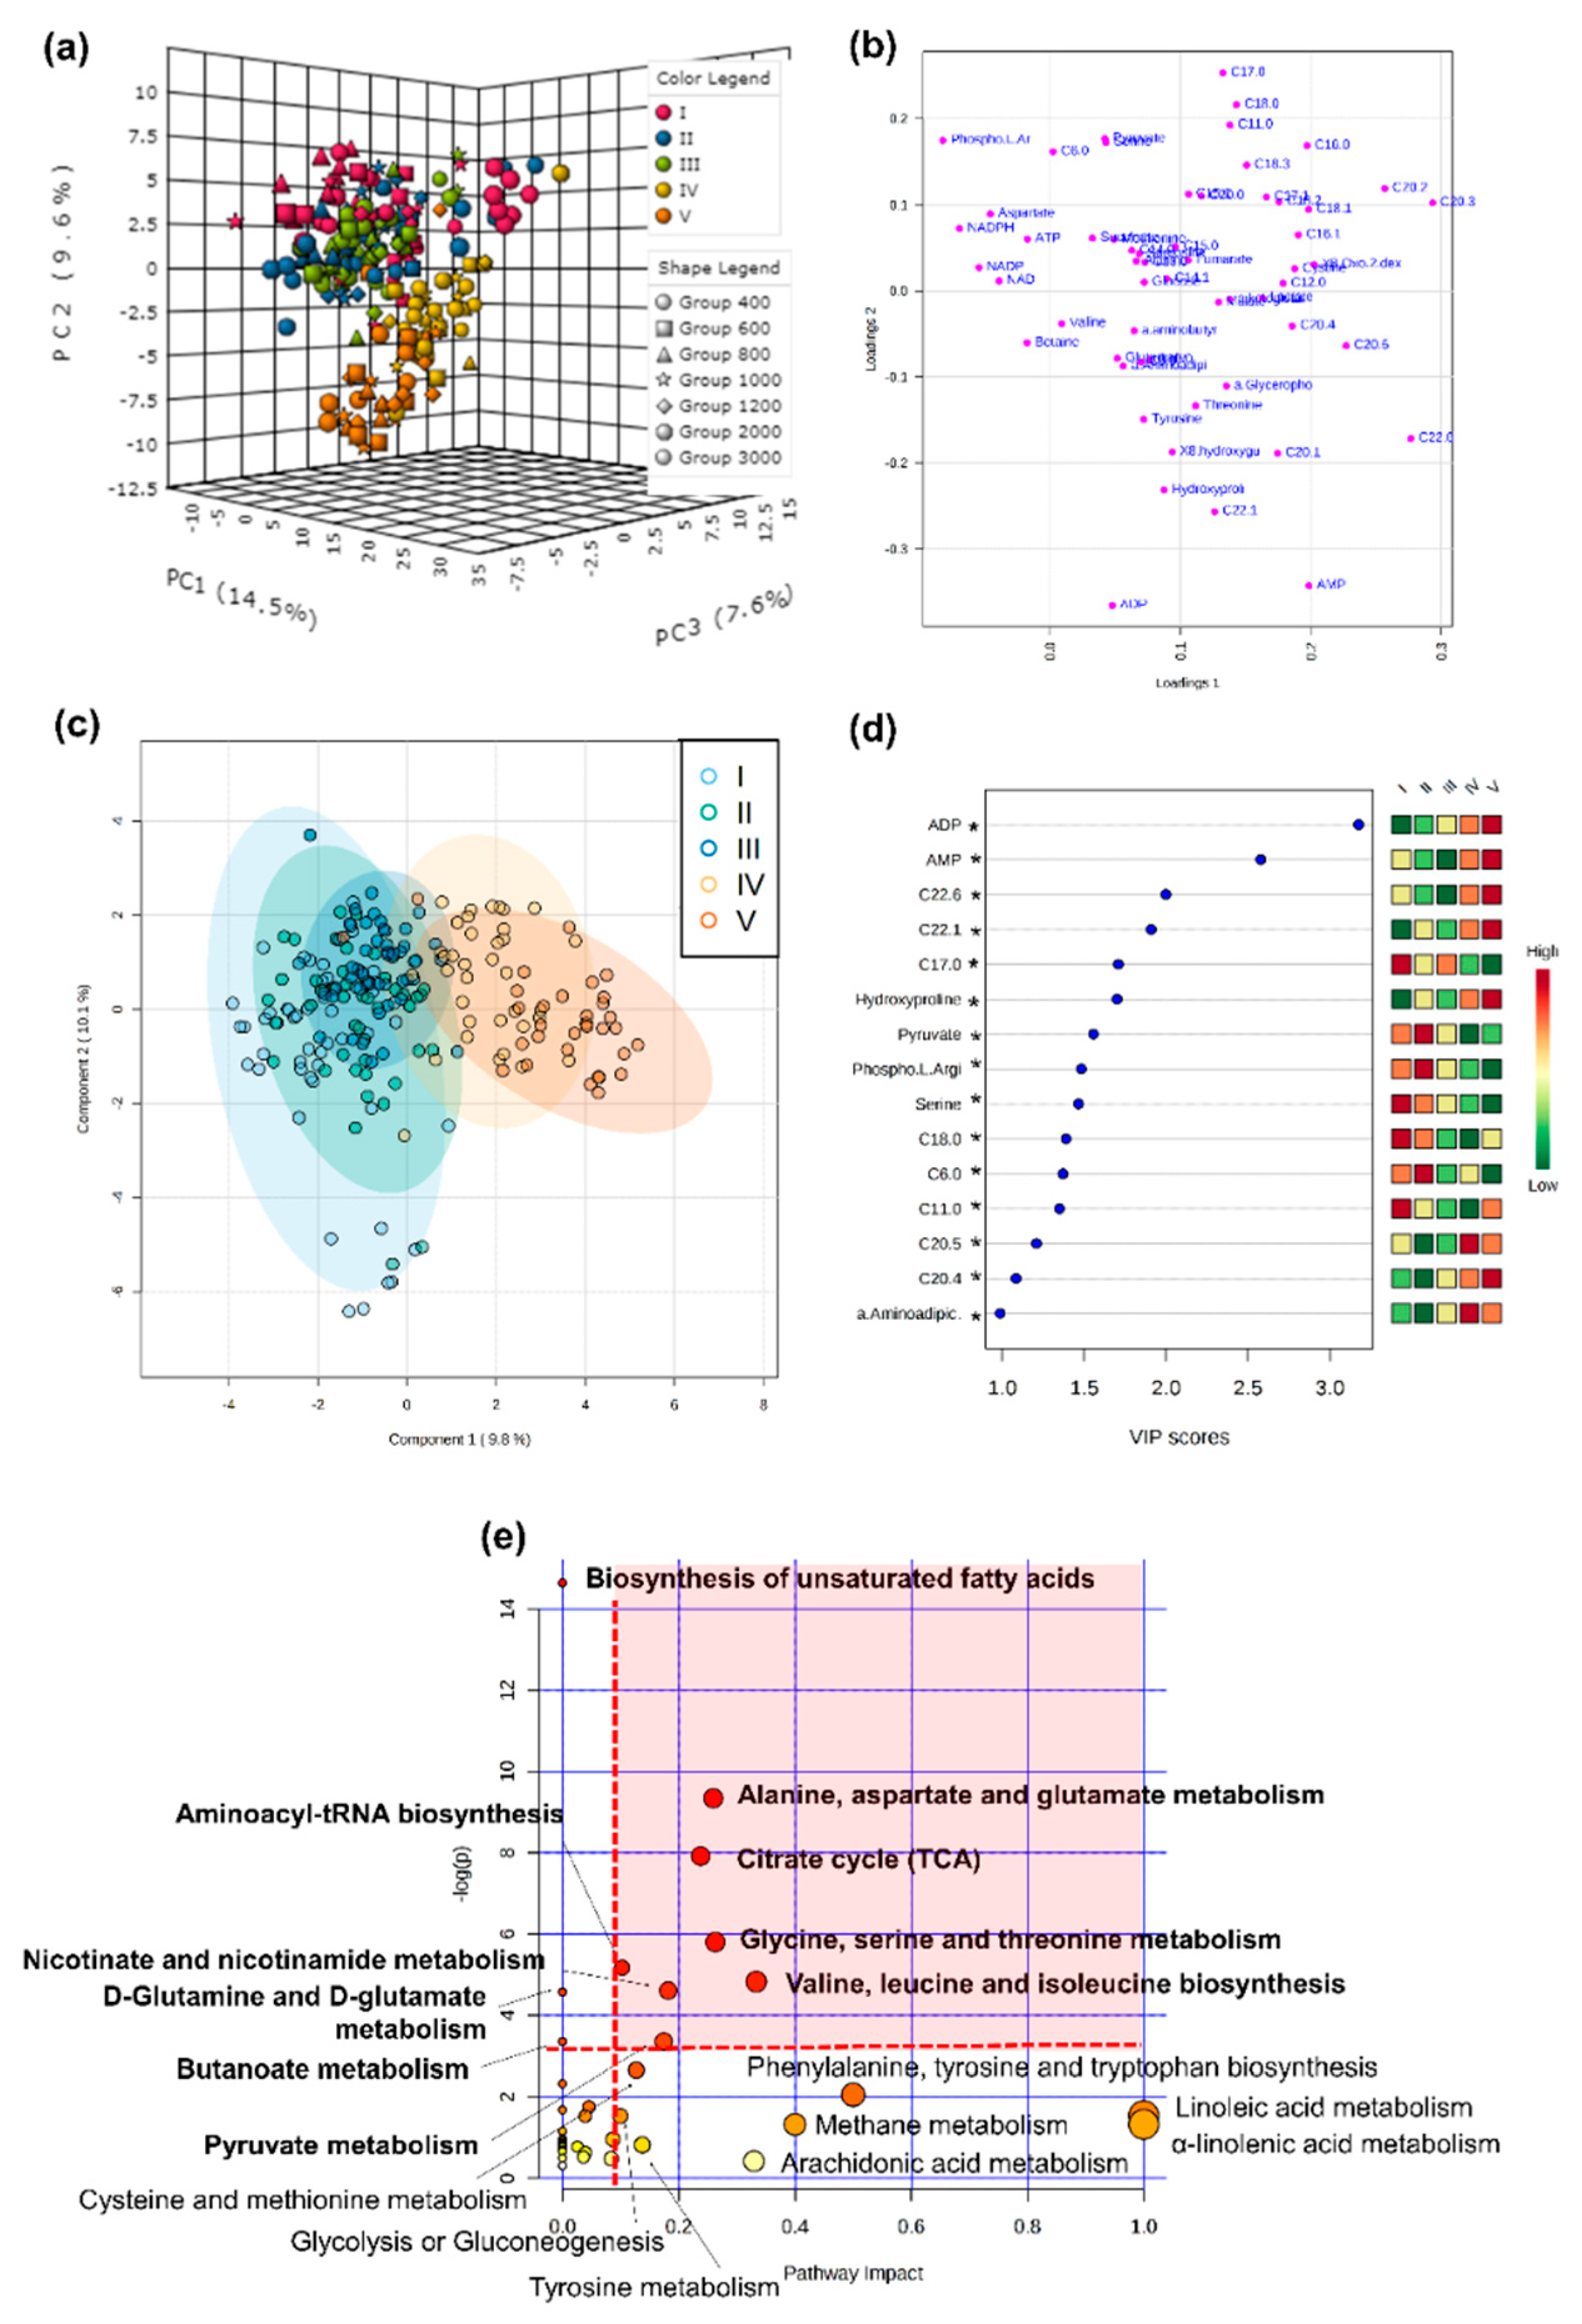
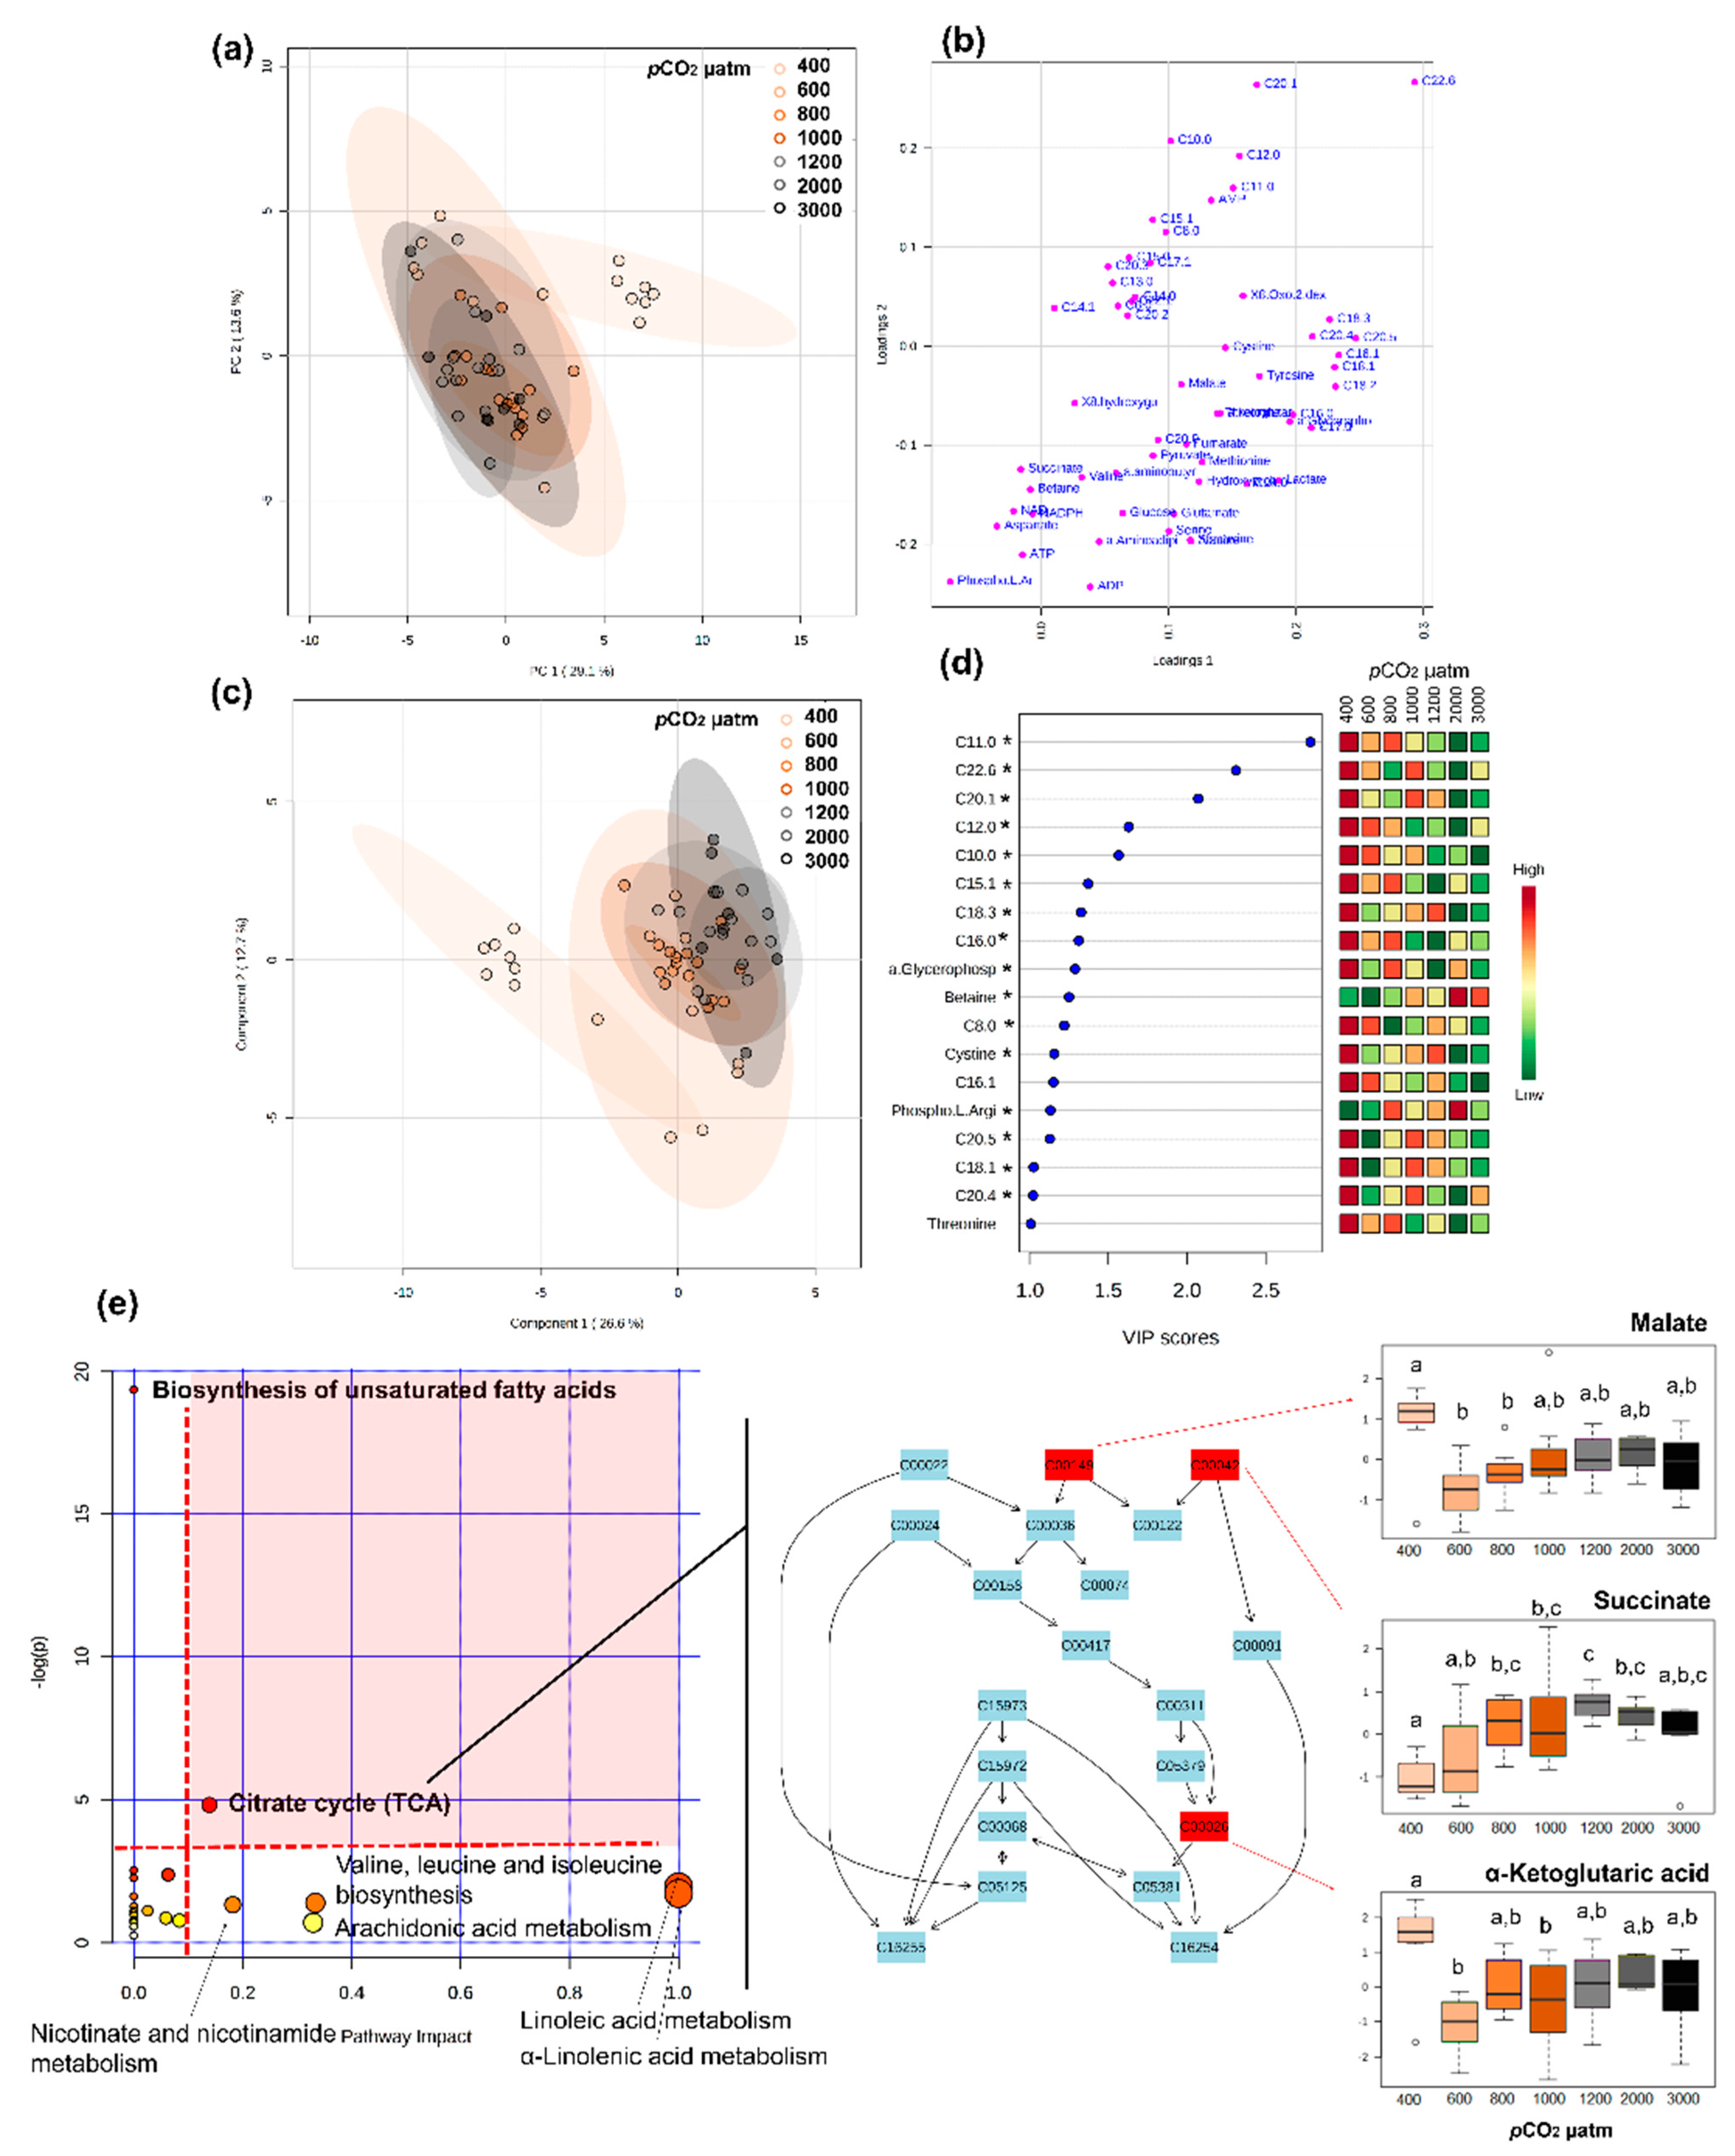
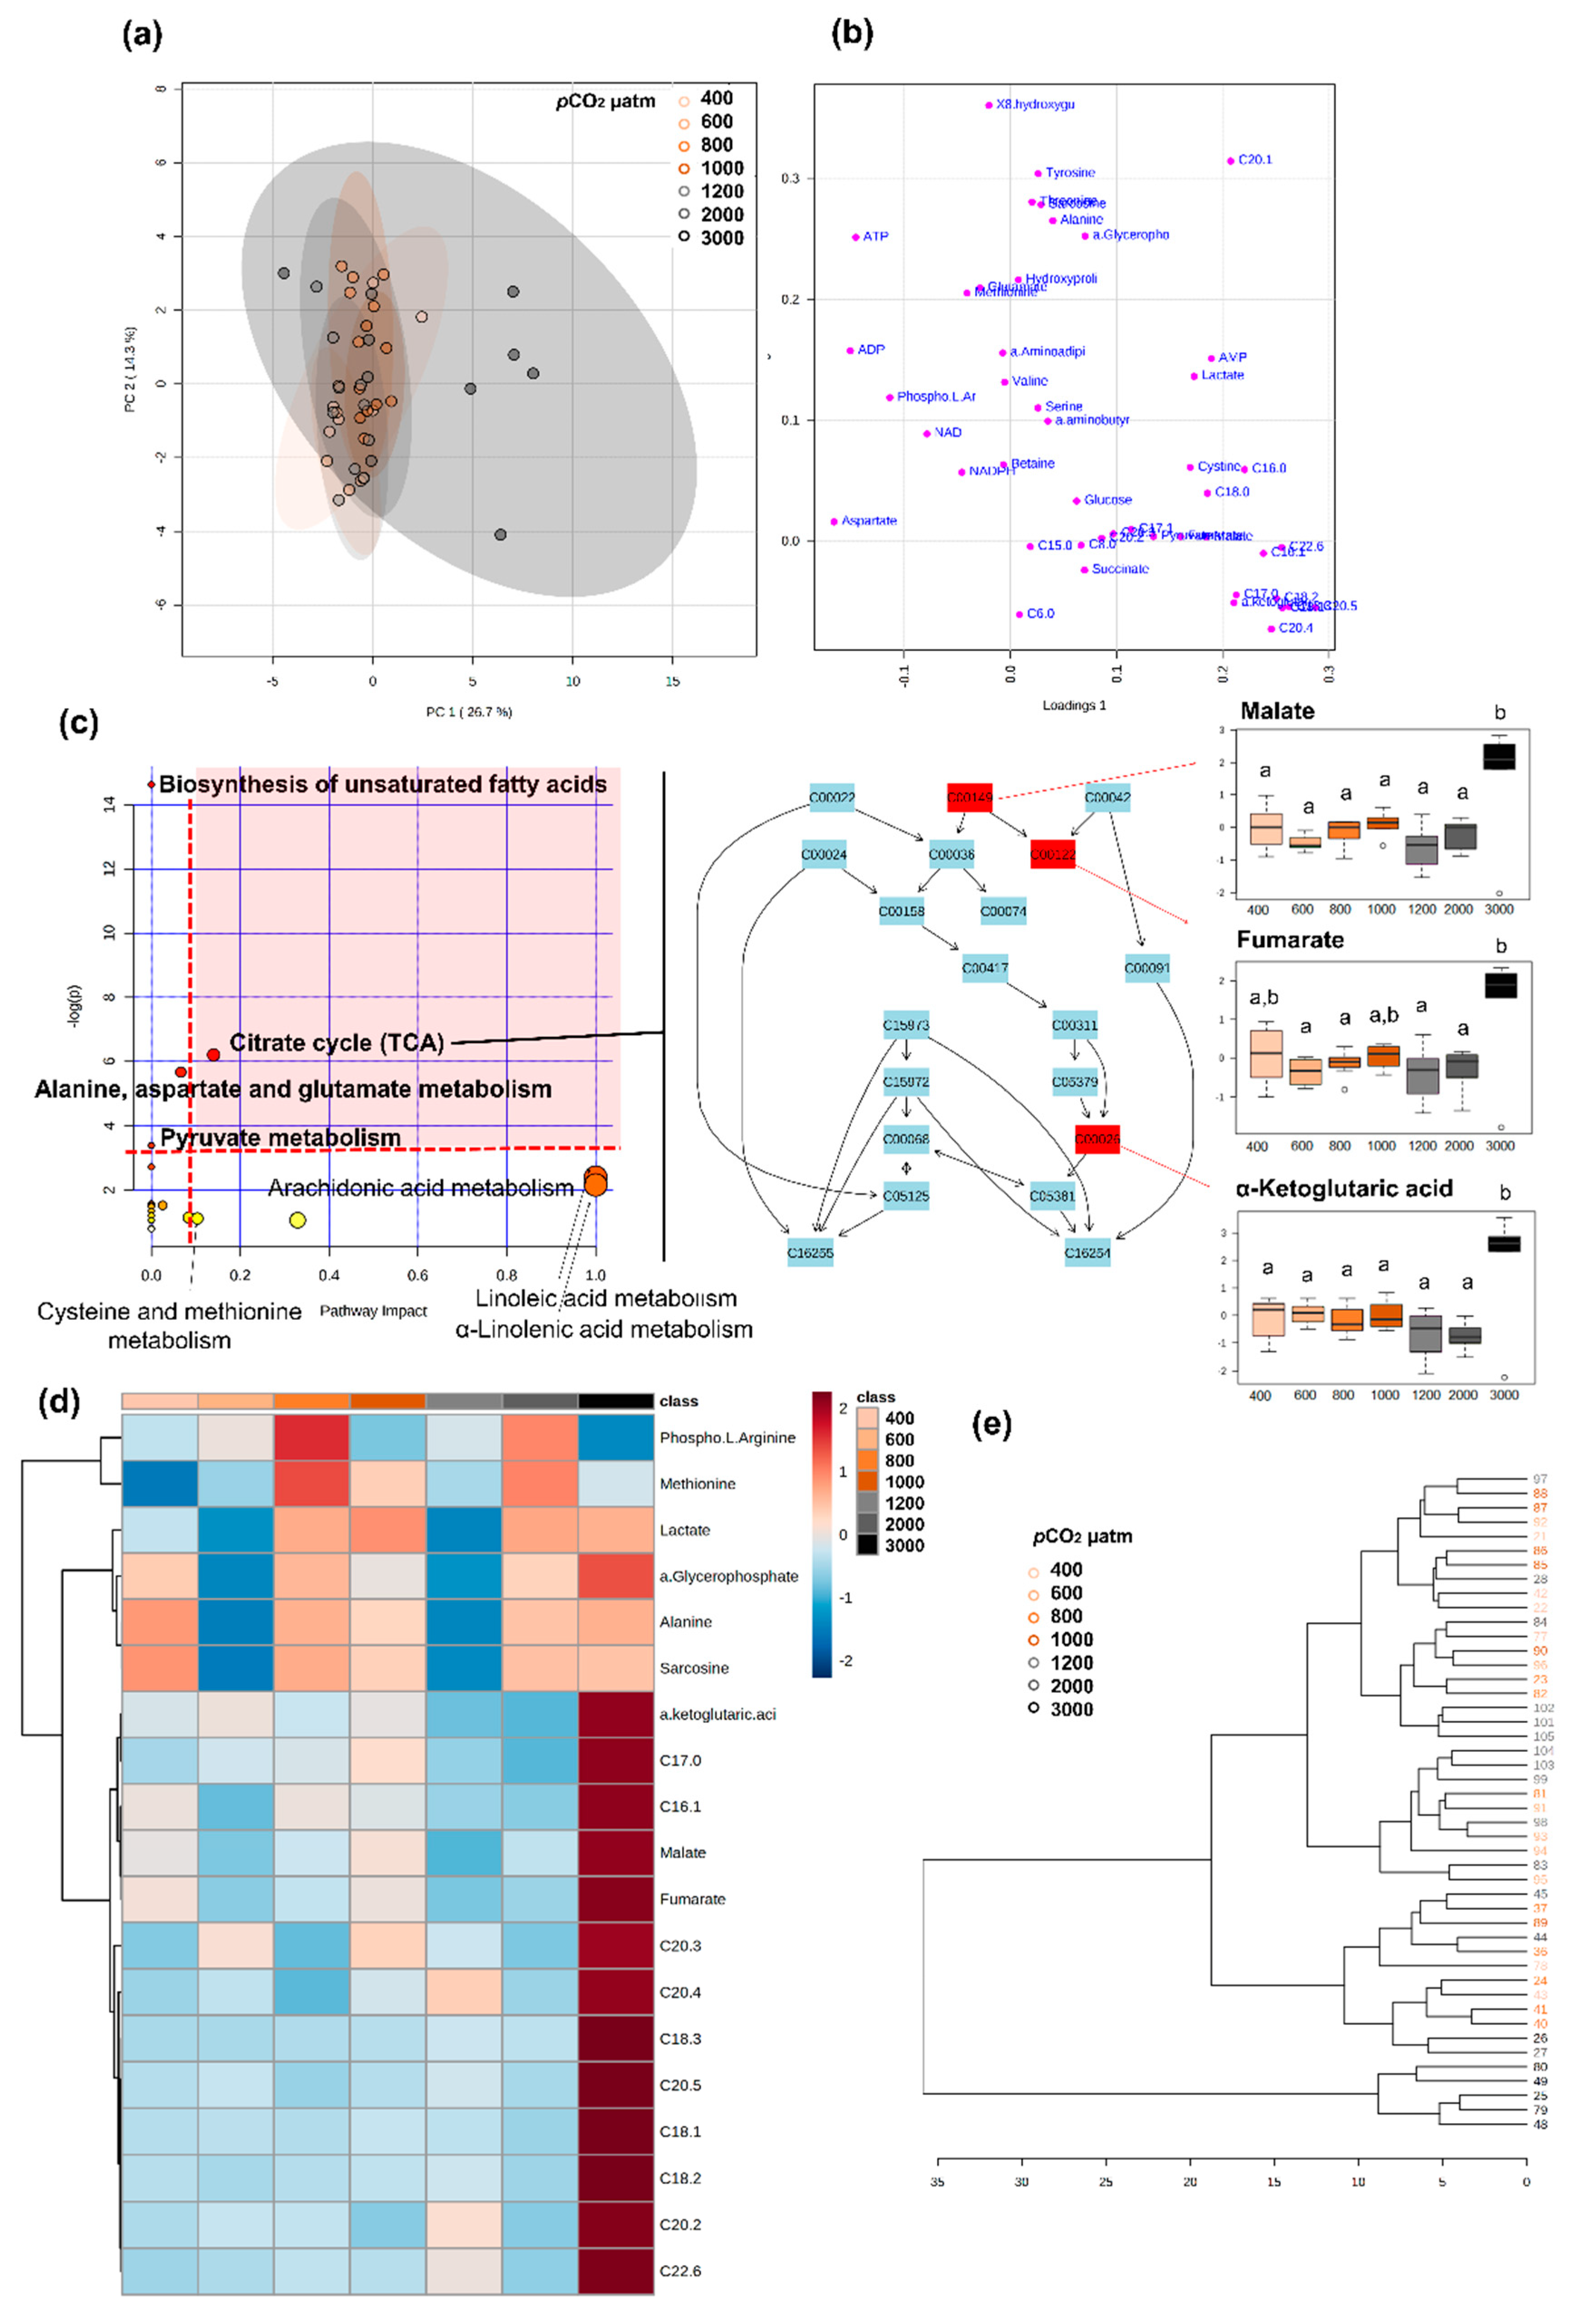
2.7. Stage-Specific pCO2 Effect on Metabolomic Fingerprints

Metabolomics profiles of larval stages I and II differed significantly when exposed to different seawater pCO2 conditions (Figure 8 and Figure 9, respectively).
For stage I, 18 metabolites showed VIP scores > 1, the top five being fatty acids (C11:0, C22:6, C20:1, C12:0, and C10:0), which mostly decreased with increasing pCO2 (Figure 8). Thirty-two metabolites were found to change significantly among pCO2 treatments, including lipids, energy carriers, amino acids, and a marker of DNA oxidation (Table S5). Pathway analysis showed that these metabolites were involved in seven pathways (considered relevant according to either over-representation p < 0.05 or pathway topology analysis with impact > 0.1), including: biosynthesis of unsaturated fatty acids, citrate cycle, nicotinate and nicotinamide metabolism, amino acid metabolism and fatty acid metabolism (Figure 8e). Among these, the most relevant pathway (combination of over-representation p < 0.05 and pathway impact > 0.1) was the citrate cycle (Figure 8e, Table S5). Malate and α-ketoglutaric acid decreased with increasing seawater pCO2 and succinate mostly increased with increasing pCO2.
For stage II larvae, group separation was not very clear in the PCA, as there is some overlapping between treatments, even though larvae exposed to 3000 µatm seem to respond differently (Figure 9). Moreover, no conclusion could be reached about which metabolites had discriminative power, as the PLS-DA model was not significant. Nonetheless nineteen metabolites were found to change significantly between seawater pCO2 treatments, including lipids, citrate cycle metabolites, lactate, and amino acids (Table S6). Pathway analysis showed that these metabolites were involved in eight relevant pathways (according to either over-representation p < 0.05 or pathway topology analysis with impact > 0.1) including biosynthesis of unsaturated fatty acids, citrate cycle, pyruvate metabolism, amino acid metabolism, and fatty acid metabolism (Figure 9c,d). Among these, the most relevant pathway (combination of over-representation p < 0.05 and pathway impact > 0.1) was the citrate cycle, similarly to stage I larvae (Figure 8c, Table S6). Conversely, in this case, malate, fumarate, and α-ketoglutaric acid increased in larvae exposed to 3000 µatm of pCO2, remaining low in the other pCO2 treatments (Figure 9a,b).
Stage III, IV, and V lobsters did not undergo extensive metabolic reprogramming when exposed to increasing pCO2/decreasing pH, compared to larval stages I and II. For these three stages, different pCO2 treatments show a high degree of overlapping (Figure S1), and PLS-DAs showed no significant pattern (prediction accuracy during training test statistic with 1000 permutations, p > 0.05).
Stage III larvae showed very few significant differences in metabolome when exposed to different seawater pCO2. Betaine increased at 600, 800, 1200, and 3000 µatm seawater pCO2, when compared to control conditions (400 µatm), and C8:0 increased significantly at 1200 µatm in relation to control. Despite the low number of significant metabolites, the pathway analysis showed one significant pathway, which was glycine, serine, and threonine metabolism (over-representation analysis, p = 0.045; pathway topology, impact = 0.0).
Similarly, only C17:0 varied significantly in stage IV lobsters, decreasing as pCO2 rose (ANOVA, F = 5.1, p = 0.001). No significantly changed pathway was detected in stage IV lobsters exposed to increasing seawater pCO2. Finally, there were no metabolome differences between stage V lobsters exposed to different pCO2 conditions (ANOVA, p > 0.05 for all metabolites, Figure S1).

3. Discussion

Our study comprehensively integrates the investigation of life history, mineralisation, and metabolic and metabolomic responses to a broad seawater pCO2 gradient across multiple early ontogenetic stages, in an ecological and economic important marine invertebrate species with a bentho-pelagic life cycle, the American lobster Homarus americanus. As such, our work represents the largest most comprehensive study of its kind. In addition, and most importantly, the complementarity of the tools used, and the biological variables measured, provide compelling evidence that metabolomic reprogramming at the cellular level buffers, at the whole organism level, the physiological and morphological responses to the exposure to elevated seawater pCO2.
Here, we document the metabolic reprogramming that lobster early life-stages undergo throughout their development, and then focus on the main objective of this study by discussing stage-specific pCO2 responses separately for stage I–II larvae, stage III pre-metamorphosis, and post-metamorphosis stage IV–V. We give particular consideration to the integration of both whole-organism and cellular responses to elevated seawater pCO2 across development in an innovative approach, to gain a better, more comprehensive, and thorough understanding of lobster early life stage capacities to face OA conditions.

3.1. Metabolomic Reprogramming throughout Development in the American Lobster

An ontogenetic change in metabolomic signatures is evident in H. americanus, with a turning point corresponding to metamorphosis happening between stages III and IV. Pathways that change during development are mostly related to energy regulation, namely amino acid synthesis and metabolism, citrate cycle, aminoacyl-tRNA biosynthesis, and unsaturated fatty acids biosynthesis. This finding is supported by the presence of shifts in the concentration of metabolites such as ADP, AMP, and unsaturated fatty acids, which increase in post-metamorphic lobsters; while some saturated fatty acids, pyruvate and amino acids are more concentrated in pre-metamorphic lobsters. Metamorphosis thus seems to induce a metabolic shift from an amino-acid based metabolism to an unsaturated fatty acid-based metabolism, although a change in diet may also partly explain the observed changes. Studies on spiny lobsters suggest that the final larval instar needs to reach a critical and specific level of energy storage to support the swimming activity of the non-feeding puerulus (i.e., the intermediary free-swimming nektonic phase between pelagic larvae and benthic juveniles) and its subsequent moult to the first juvenile stage, with lipids being crucial for metamorphosis progression [49]. This could potentially explain the transition to an unsaturated-fatty acid-based metabolism upon metamorphosis in lobsters, as fatty acids and phospholipids are important sources of energy for lobster growth [49,50]. We further propose that the transition in metabolome signatures may be related to the development of specific organs (and thus new functions, e.g., osmo-ionic regulatory control), as amino acids need to be used as building blocks for biomass accumulation. For example, ontogenetic metabolomic profiling in the zebrafish Danio rerio (Hamilton, 1822) revealed the importance of nucleotides and glucose during early embryogenesis, while amino acids and intermediates of the citrate cycle were highly abundant in later stages, coinciding with the organogenesis of the liver and pancreas [51]. Hence, a similar trend could occur in invertebrate species, as tissue building blocks are conserved across the animal kingdom.

3.2. Larval Stages I and II: The Establishment of the Internal Regulation Machinery

Pelagic larval stages are considered particularly sensitive to environmental fluctuations [1,52]. In this sense, larval stages have been shown to be negatively affected by OA [53]. In particular, the first larval stage of the red king crab, Paralithodes camtschaticus (Tilesius, 1815) [54] and the European lobster Homarus gammarus (Linneaus, 1758) [33,34] exposed to OA conditions showed drastic decrease in survival rates, with these stages being considered as bottlenecks (or biological filters) for the recruitment to the adult populations [35]. Conversely, the survival of stage I and II larvae is not impacted by exposure to OA conditions in our study. Similar results were shown by Waller et al. [42] in the American lobster, supporting the idea that first larval stages of this species are highly tolerant to elevated pCO2, as it is for other crustaceans regardless of female pre-exposure to high pCO2 [55,56,57].
The duration of the larval development was similar in all the pCO2 conditions, conversely to the results reported by Keppel et al. [39]. In fact, the intermoult period between larval stages lasts approximately 5–6 d, matching the values measured for the same species at 19 °C [42]. As already shown for the European [34] and the American [42] lobsters, the increase in seawater pCO2 does not seem to cause an increase in the duration of the larva intermoult period in our study. This again supports the idea that larvae are highly tolerant to increasing seawater pCO2, even a drastic increase leading to pH values of 7.4, expected during coastal acidification events [17].
Similarly, zoea larvae morphometrics are not affected by exposure to OA in stages I and II; the mean carapace length compares broadly to values reported for the same species by Waller et al. [42]. This differs from the pCO2-dependent decrease in carapace length in American lobsters’ stage II and III individuals reported previously [39]. Differences between Keppel et al. [39] and our study might be due to differences in culturing conditions: notably their elevated temperature (20 °C), which also induced delayed moulting under OA conditions. Equally different starting conditions and environmental history of individuals brought to the laboratory may play an important role.
Low pH conditions which are induced by OA or other phenomena such as upwelling can challenge mineralised structures (such as carapaces and shells) and mineralisation, the former being decreases in calcium carbonate saturation state [15], and the latter demanding increased energy investment to replace damaged carbonated structures. In American lobster stage I and II larvae, we report a linear decrease in [Mg2+] and [Na+] along the pCO2 gradient tested. The decrease in [Mg2+] was also observed for the larvae of the European lobster [34]. In calcified structures, this decrease in [Mg2+] is usually concomitant with a reduction in [Ca2+] caused by a reduction in mineralisation and an increase in dissolution (e.g., [54,58]). However, we observe no reduction in [Ca2+] in larval stages of the American lobster, as reported for the European lobster [34]. Lobster larvae are poorly calcified [32], and we were not able to separate the carapace from the flesh for mineralisation analyses in larval stages. Thus, changes in [Mg2+] and [Na+] observed may be related to changes in carapace precipitation/dissolution, but in part (although we consider it marginal) also to energetic trade-offs during larval development [32,35].
On some occasions, changes occurring at the cellular level may be sufficient to prevent changes at the whole-organism level [59]. In the present study, lobster larvae stage I and II maintain similar whole-organism resting metabolism in the different pCO2 conditions tested while they undergo intense metabolic reprogramming when exposed to OA conditions. During these stages I and II, thirty-two metabolites change significantly between pCO2 treatments, mainly involving the pathways of unsaturated fatty acids biosynthesis, amino acid metabolism, and fatty acid metabolism. However, the changes induced by the increase in seawater pCO2 for the main metabolites (e.g., malate, fumarate, succinate, and fatty acids) are different for larvae stage I and II. Fatty acids and citrate cycle intermediates significantly decrease in stage I lobsters as seawater pCO2 increases, suggesting an increase in energy demand under OA conditions. The exception is represented by succinate, which increases between 800 and 2000 µatm seawater pCO2. Previous studies in fish and invertebrates reported that OA can reduce mitochondrial capacity and lead to the inhibition of enzymes of the electron transport system and citrate cycle, such as succinate dehydrogenase (complex II) [60,61], which could lead to the accumulation of succinate, as observed, for instance, in oysters [62]. An accumulation of succinate under stressful conditions could also be relevant, considering other functions of succinate in cellular physiology, namely its role in cell signalling, gene expression and enzyme function modulation [63]. An increase in phospho-L-arginine is also a hallmark of exposure to OA in stage I larvae. This amino acid has an important role in buffering high energy phosphate in invertebrates, acting also as a shuttle mechanism for ATP production when needed [64,65].
In stage II larvae, the same metabolites (fatty acids and citrate cycle intermediates) accumulate under 3000 µatm, with no change in succinate or a clear trend in phospho-L-arginine, but with a trend of increasing lactate concentration, suggesting a transition to anaerobic metabolism. An increase in lactate has also been reported in juveniles of several crab species, suggesting the utilisation of anaerobic metabolism to support acid-base regulation under increased seawater pCO2 [66,67,68]. However, in subadult females H. americanus (50–65 mm CL), elevated pCO2 induced a depletion of L-lactate, which was considered to lead to a putative reduction in oxygen carrying capacity, as L-lactate is a known molecular modulator of hemocyanin’s oxygen affinity [69]. As larvae from stage I to stage III are osmoconformers, their ionic concentration changes according to the environment [7,70]. Thus, changes in environmental pCO2 may induce considerable changes in the organism’s extracellular fluid acid-base and osmo-ionic status, likely compensated by costly energetic processes: including, for example, ion homeostasis, organic osmolytes pathway regulation, buffering of intracellular [CO2] via carbonic anhydrase activity, and mobilisation of carapace carbonates to buffer via bicarbonates dumping the extracellular space. For example, the Dungeness crab Cancer magister (Dana, 1852) held under low pH conditions increased ATP production, with a significant impact on amino acid, sugars, and fatty acid metabolic pathways [71]. Moreover, in the green crab Carcinus maenas (Linnaeus, 1758) exposure to hypercapnia for two-weeks led to a reduction in intracellular osmolytes such as amino acids, also suggesting disturbances in intracellular iso-osmotic regulation [72]. The increase in betaine observed in stage I larvae exposed to increasing seawater pCO2 (especially > 1000 µatm) supports the idea that lobsters face cellular osmotic stress at these conditions, as betaine is an intracellular organic osmolyte commonly found in crustaceans [73,74] and other marine animals [75]. Nevertheless, the downregulation of other metabolic pathways, not investigated here, such as those underpinning mineralisation processes, might have caused energetic trade-offs, resulting in comparable resting metabolic rates across the different pCO2 conditions tested.

3.3. Stage III Larvae: The Metamorphosis as a Turning Point in the Ontogeny

Stage III larvae in this study appear to be tolerant to OA. Increases in seawater pCO2 do not affect their survival, developmental time, mineral contents, or most of the morphological parameters except for cephalothorax length, as also globally shown by Waller et al. [42]. As an exception, the increase in cephalothorax length under OA conditions might be a positive carry-over effect from the exposure of stages I and II to high pCO2 levels. In fact, an increase in cephalothorax length in developing lobsters has been hypothesized to play an important role in improving ventilation and gas exchange capacity under high pCO2 conditions [41]. Under OA conditions, possessing an enlarged cephalothorax may support an increase in ventilation capacity, thus potentially enabling an organism to attain a higher level of energy production. This may, in turn, increase the probability for survival and help stage III larvae to prepare for metamorphosis.
From a metabolic point of view, stage III larvae present transitional metabolomics fingerprinting between that of earlier larvae and post-larval and juvenile stages, and an upward trend in resting metabolic rates: the latter showing to increase with an increase in seawater pCO2. This suggests that this larval stage is a metabolic turning point in the ontogeny of the American lobster, as the larvae prepare to undergo metamorphosis and they acquire greater osmoregulatory abilities [4,70], both processes being highly energetically demanding. This increase in energy requirements may explain the slight increase in metabolic rates that is observed at stage III under OA conditions. The latest trend was likely highlighted as we applied a regression approach with a seven pCO2 level gradient. Other, studies testing a smaller number of pCO2 conditions, and which did not employ an individual-based measurement philosophy, have to date not shown any change in oxygen consumption for stage III lobster larvae exposed to OA [34,42]. An activation of the specific pathway of glycine/serine/threonine metabolism was detected at stage III, with betaine concentrations rising with the increase in seawater pCO2. This corroborates the suggestion that stage III lobsters exposed to elevated pCO2 face osmotic (and likely including acid-base) challenges, by compensating via the upregulation of intracellular organic osmolytes, as also described for stage I larvae above.

3.4. Passed Metamorphosis: Post-Larval and Juvenile Stages Can Cope with Elevated pCO2 but Are More Sensitive Than Larvae

Metamorphosis of stage III larvae results in post-larval stage IV, which is considered as the first manifestation of juvenile traits along the American lobster ontogeny [4]. Survival rates recorded in stage IV lobsters (>30% in all the pCO2 conditions) in our experiment are higher than those measured in other experiments: 2.6% in the American lobster at 19 °C [42], and 0.5% in the European lobster at 17 °C [34]. Stage V juveniles show an approximate two-fold increase in mortality compared to previous life stages, increasing with elevated pCO2 (only 10% survival at the highest pCO2 levels tested), as similarly reported for the European lobster [76]. Finally, the survival rate of stage VI is between 0 and <5% (pCO2 600 and 1000 µatm), this value being close to the very low successful settlement rate estimated via modelling for American lobster post-larvae (∼2.5%, [77]).
In parallel, intermoult periods between stage IV–V and V–VI increase under OA conditions in the juvenile stages, as already shown by Menu-Courey et al. [41]. It is known that the time at which settlement behaviour first appears in post-larvae can vary according to environmental conditions [78]. The increase in pCO2 seems to postpone the settlement of the post-larval stage IV and their transformation into stage V juveniles, leading to a longer planktonic phase which may increase the predation risk [39,79]. The significant effect of elevated pCO2 conditions (>1200 µatm) on juvenile survival and developmental time supports the theory that juveniles are more sensitive to OA than larvae, as also described by Waller et al. [42].
The formation of the calcified exoskeleton is a costly energetic process [21]. This process is usually one of the first that is down-regulated under elevated pCO2 conditions in order to reallocate energy to other avenues, resulting in mineralisation changes or carapace length reductions [32,76]. No significant change in carapace cation contents or [Mg2+]:[Ca2+] is shown under elevated pCO2 scenarios in our study. We provide no evidence of any change in morphometric traits, with the exception of abdomen length, which slightly changes with increasing pCO2, shortening for stage IV and extending for stage V. This lack of strong changes in this parameter differs from the general reduction trend that has been reported for lobster juveniles exposed acutely to OA and carbon capture storage (CCS) leakage conditions [40,41,76].
Resting metabolic rates of the American lobster post-larvae and juveniles were not significantly affected by the increase in pCO2, as previously demonstrated in the same species [41,42], but also for other crustaceans [80,81,82] under OA scenarios. This capacity to face OA conditions, even extreme ones found in coastal areas or potentially caused by CCS leakages, without undergoing metabolic depression may be related to efficient homeostasis and/or acid-base buffering evolved by crustaceans [28,83,84] and underpinned by gene upregulation [36].
In juveniles of the American lobster, the lack of changes in resting metabolic rates, mineralisation compounds, and feeding rate tends to indicate that there is no apparent physiological compensation or trade-offs in response to increasing levels of seawater pCO2. This finding is further supported by the absence of metabolomics reprogramming at this stage. Interestingly, the capacity for molecular reprogramming (i.e., metabolomic plasticity) may ultimately prevent changes at the whole-organism level [59,85], which seems to be the case for early larvae, as opposed to post-metamorphic lobsters. The lack of metabolomic plasticity to OA and CCS leakage conditions in stage IV and V provide a mechanistic basis for the inability of juvenile lobsters to cope with OA, shown by our study and others before [42,76]. As the increase in pCO2 levels delays the moult and leads to higher mortality rates in stage V and VI without apparent physiological adjustment, the juveniles of the American lobster appear quite sensitive to elevated seawater pCO2 conditions mimicking future coastal acidification or CCS leakages.

4. Materials and Methods

4.1. Specimen Collection

Berried females of the American lobster Homarus americanus (H. Milne Edwards, 1837), were captured in late in Spring 2016 off the coast of Shippagan (NB, Canada) in the Baie des Chaleurs (47°46’47″ N 64°42’49″ W) and held at the Coastal Zones Research Institute (CZRI, Shippagan, NB, Canada, now named Valores) in highly aerated 1500 L tanks filled with seawater pumped in front of the CZRI. Newly hatched larvae (stage I) were released after female exposure to a thermal shock and collected early in the morning with big nets. Then, they were transported by car over a 5 h driving distance, in continuously aerated 60-L coolers (Coleman Company Inc., Kingfisher, OK, USA) filled with ambient seawater (18 °C, salinity 34) from the CZRI. Larvae were then transferred in the experimental system at the Department of Fisheries and Oceans facility at the Saint Andrews Biological Station (SABS, Saint Andrews, NB, Canada).

4.2. Experimental Design, Setup and Protocol

In order to verify the impacts of the increase in seawater pCO2/decrease in pH on life-history and physiological traits of early life stages of the American lobster throughout their ontogeny, early life stage individuals were exposed to seven pCO2 levels corresponding to different pHT (pH on the total scale) from the first larval stage to the stage V juvenile in a larval and then a juvenile setup. These treatments were selected to mimic current pCO2 condition (400 µatm), predicted values that could be encountered by coastal organisms under ocean acidification scenarios or during upwellings (600, 800, 1000, 1200, and 2000 µatm) and extreme coastal acidification or carbon capture storage leaks (3000 µatm) [13,17,86,87].
In turns, six hundred stage I larvae were transferred by gently siphoning from the cooler to each of the twenty-eight 60 L kreisel tanks (hereafter called “kreisel”) where pelagic larvae were housed during the exposure period (density 10 larvae L−1). Lobster larvae were grown from stages I to IV in this system between the 1st and the 18th of July 2016. After metamorphosis (stage IV to stage V), 12 stage IV juveniles from a subset of three kreisels per pCO2 condition were transferred in the twenty-one 500 L tanks (hereafter called “tanks”) from the juvenile setup. Individuals from the same kreisel were assigned to one specific tank where they grew up from the 18th of July until the 21st of August 2016. Juveniles were gently scooped up using polypropylene cups (Disposable Polypropylene Graduated Medicine Cup, SETON Canada, Markham, ON, Canada) and then transferred to individual floating basket-like pots (Net Pots, Canadian Wholesale Hypotonics, Elie, MN, Canada; 3.5 inches in diameter) allowing water to flow through them. These containers are permitted to individually recognize and track daily survival, development, and growth of juveniles, as well as prevent cannibalism [88].
Each kreisel and tank continuously received sea water at a rate of 1 L min−1 (i.e., a renewal rate of 100% h−1) from three header tanks where temperature was maintained around 18 °C with heaters and a photoperiod of 16:8. These header tanks were supplied with 20 µm sand-filtered UV sterilized seawater continuously pumped in Passamaquoddy Bay (45°04′60.00″ N-67°04′60.00″ W) in front of SABS, between 10 and 30 m depth, depending on the tide.
Each of the seven pCO2 treatments had four replicates for the 60 L-kreisel system and three replicates for the 150 L-tank system. The different conditions were gradually reached over the first day of larval transfer to avoid any pH shock. The autonomous feedback system (IKS Aquastar, Karlsbad, Germany) was used to reproduce the different pCO2 treatments (600, 800, 1000, 1200, 2000, and 3000 µatm) and adjusted the corresponding pH values by bubbling pure CO2 to maintain the required conditions independently in each kreisel or tank. The ambient treatment (400 µatm) had no gas regulation and the pH measured was representative of that found in Passamaquoddy Bay. The pH values of the IKS system were adjusted from daily measurements of pHT in the 28 kreisels and 21 tanks using a pH meter (SevenGo pH meter MT, Mettler Toledo AG, Schwerzenbach, Switzerland), coupled to a pH/temperature probe (InLab 413 SG/2m, Mettler Toledo AG), and calibrated with Tris HCl buffer [89]. The temperature was kept constant in the system, at 18 °C, representing the measured water temperature in the Baie des Chaleurs, St Lawrence Gulf (Shippagan, NB, Canada) when larvae were released.
Larvae were fed ad libitum, every day with frozen Artemia (Brine Shrimp, Kyorin Co. Ltd., Tokyo, Japan). Stage I received 10 g twice a day at a concentration of approximately 0.3 g larva−1 d−1. Stage II and III received 5 g twice a day as the larval density decreased in the kreisels (similar concentration food as for stage I). During the day, the food was eaten by the larvae, limiting potential bacterial development and the remaining pieces stuck to the kreisel walls were removed every day with a paper towel. When juveniles were transferred in the individual pots, they were fed ad libitum with small pieces of fish. In turn, thawed cubes of herring (Clupea harengus Linneaus 1758) were replaced in the pots every 2 d to keep the food fresh and avoid any bacterial contamination.
As soon as 95% of the individuals reached the following stage, individuals were gently scooped up in the kreisels/tanks and then transferred in vials for resting metabolism determination (see below).

4.3. Seawater Parameter Monitoring

Seawater parameters were monitored throughout the experiment. Temperature, dissolved oxygen (% air saturation) and pHT were recorded daily in each of the 28 kreisels and 21 tanks using a dissolved oxygen meter (SevenGo Pro, Mettler Toledo AG) and a pH/temperature meter (SevenGo pH meter MT, Mettler Toledo AG) coupled to a calibrated pH/temperature probe (InLab 413 SG/2m, Mettler Toledo AG) as described above. Seawater samples (500 mL) were randomly taken in one of each kreisel and tank per pCO2 condition every week. Samples for total alkalinity and (TA) and dissolved inorganic carbon (DIC) were fixed with HgCl2 (0.02%) to eliminate microbial activity, stored in 500 mL borosilicate flasks, and maintained in dark and dry conditions until they were shipped to the Bedford Institute of Oceanography (BIO, Dartmouth, NS, Canada) where they were analysed. Salinity was measured at BIO using a conductivity/salinity meter (YSI EC300A, YSI Inc./Xylem Inc., Yellow Springs, OH, USA—calibrated with Ricca conductivity solutions). TA was analysed by open cell potentiometric titration (Metrohm Titrando with an 800 Dosino, Metrohm AG, Herisau, Switzerland). DIC was determined using gas extraction from acidified samples with coulometric quantification of CO2 (Dickson et al., 2007).
Partial pressure of CO2 (pCO2), bicarbonate (HCO3) and carbonate (CO32−) ion concentrations and the saturation state of calcite (ΩCa) and aragonite (ΩAr) were calculated on daily samples for each kreisel and tank with CO2SYS software [90] using constants from Mehrbach et al. (1973) refitted by Dickson and Millero (1987). The mean ± standard error (SE) results for each pCO2 treatment and for both larval and juvenile setups are reported in Table S7.

4.4. Survival

Survival rate expressed as the percentage of live individuals compared to the number of larvae introduced into the kreisel at the beginning of the experiment (i.e., 600 larvae) was determined every 2 d in each kreisel. Larval survival was calculated as the average of live larvae counted in four subsamples of 500 mL for stage I, and 1 L for stage II and III, rescaled to the volume of the kreisel, and then divided by the total of larvae introduced at the beginning of the experiment [42]. Individuals removed (and not replaced) for metabolic measurements were also taken into account. Sampling every 2 d allowed for larval intermoult-period lengths to be determined. Juvenile condition (i.e., ‘alive’, ‘dead’, or ‘moulted’) was visually checked every day after individuals were transferred in floating basket-like pots. As for larvae, survival rate was expressed as the number of individuals transferred from the larval system (12 per tank), taking into account individuals that were not replaced for metabolic measurements.

4.5. Feeding Rate (Only for Juveniles)

Feeding rates (FR) were assessed for the stage IV post-larvae and stage V juveniles, between 5 and 8 d after the moult from the previous stage was completed, on the same individuals used later for MO2 measurements. Individuals were not fed for 24 h, and then fed with pre-weighed and paper-blotted blocks of herring C. harengus. After 1 h, non-consumed food was removed from the pots and weighed again. Feeding rates (in mg h−1) were calculated as:
FR   = Δ W   Δ t  
where ΔW (in mg) is the difference between initial and final herring weight, and Δt (in h) is the feeding time.

4.6. Resting Metabolic Rates (MO2)

Oxygen consumption rates (MO2), used as a proxy for resting metabolic rates [91] were measured at each life stage, during the intermoult (7 to 10 d after the moult was completed and the carapace had hardened). For stages I, II, and III, 20 larvae per pCO2 condition (i.e., 5 per kreisel from that pCO2 condition) were scooped up in 500 mL beakers. They were then gently transferred with plastic pipettes in glass vials filled with 0.7 µm (GF/F) filtered sea water (Whatman® glass microfiber filters grade GF/F 0.7 µm, GE Healthcare, Chicago, IL, USA) mixed between the kreisels from a same pCO2 condition. Larvae were incubated individually in 6.3 ± 0.1 mL vials, containing filtered sea water at the same temperature and pCO2 to which the individual had been previously exposed. In the vial, the larva was placed onto a plastic grid which separated it from a magnetic flea used to mix the water inside. For stages IV and V, six juveniles per pCO2 condition were not fed for 24 h prior to the measurement of oxygen to minimise the influence of feeding history and digestive activity [92]. Individuals were carefully transferred to 16.9 ± 0.1 mL vials, used as respiration chambers, the day before measuring MO2 in order to reduce the stress induced by the new environment. They stayed overnight in their own 150 L tanks, in floating vials sealed with mesh, allowing the water to flow through to avoid hypoxia. In each vial, the juvenile was separated from the magnetic flea by a net which constrained its movement to a 3 cm-length section from the cap.
Determination of oxygen consumption rates was carried out over a 90-min period for stage I to III and over a 60-min period for stage IV and V. Previous tests were run to be sure that the oxygen consumption of each larval and juvenile stage was linear between 100 and 30% air saturation in the vial. Blank incubations, containing only filtered sea water from the kreisels or water from the tank, fleas, and grids used in the vials, also helped to correct fluxes for any microbiological activity and background respiration in seawater. Vials fitted with magnetic flea (speed 350 rpm) were placed in a container for incubation over a magnetic stirrer plate (Mix 15, 2Mag AG, Munich, Germany), to ensure water homogeneity and keep the temperature constant. Incubations were carried out in a temperature-controlled room, with red light to avoid lobsters responding behaviourally to visual stimuli whilst in incubation [93]. Oxygen concentrations were measured at the beginning and the end of the incubation period with a non-invasive fiber-optic system and reactive oxygen spots attached to the inner wall of the chambers (FIBOX 4, PreSens, Regensburg, Germany). The optical fiber was calibrated at 18 °C with 0% and 100% oxygen buffers. Resting metabolic rates called MO2 (in µmol O2 h−1) were calculated from the decline in oxygen concentration per unit time:
MO 2   = Δ O 2 × V   Δ t    
where ΔO2 (in µmol O2 L−1) is the difference between initial and final O2 concentrations; V (in L) is the volume of vial; and Δt (in h) is the incubation time.

4.7. Morphological Traits

All larvae and juveniles used for metabolic rates were laid on their right-hand side under a binocular (M80, Leica Microsystems GmbH, Wetzlar, Germany) to be photographed under at magnification ×7.5 with a picture acquisition system (IC80 HD, Leica Microsystems GmbH). Pictures were then analysed with the ImageJ software (Rasband, WS, US National Institutes of Health, Bethesda, MD, USA) in order to determine individuals’ measurements for total body length (BL: tip of rostrum to end of uropods, mm), carapace length (CL: rear of eye socket to rear of carapace, mm), abdomen length (AL: front of first abdominal segment to rear of last abdominal segment, mm), tail length (TL: rear of last abdominal segment to rear of the tail, mm), and chaela length (ChL, mm).
Wet body mass (WBM, g) was measured at a precision of ±1 mg using an electronic scale (ENTRIS 623-19, Sartorius Lab Instruments GmbH KG, Goettingen, Germany) after the excess of water was removed by gently blotting individuals with fine tissue paper (Kimwipes, Kimberly Clark Professional, Roswell, GA, USA). The consecutive tasks of taking a picture, blotting, and weighing took approximately 2 min for each individual after they have been removed from their vial. Entire larvae were then directly flash frozen using liquid nitrogen while the cephalothorax, abdomen, and claw of the juveniles were separated using plastic tools (White Plastic Tweezers, Swiss Precision Instrument Inc., Garden Grove, CA, USA) in order to prevent metal contamination. Samples were stored at −80 °C to preserve them for carapace mineralisation and metabolomics analyses (see below).

4.8. Carapace Mineralisation

Chemical analyses on the carapace mineralisation status of the lobster larvae and juveniles, as an important proxy for changes in the composition of this organ in crustaceans under low pH seawater conditions, were performed at the Laboratoire de Chimie Marine et Spectrométrie de Masse at the University of Quebec in Rimouski (Rimouski, QC, Canada). Previously frozen entire larvae and juvenile’s cephalothorax carapace were removed using non-metal tools (White Plastic Tweezers, Swiss Precision Instrument Inc., Garden Grove, CA, USA) and freeze dried for 12 h to remove any residual moisture (Freezone Freeze Dry Systems, Labcono, Kansas City, MO, USA). Samples were then weighed on a high precision microbalance (MX5 Analytical Micro-balance, Mettler Toledo). Hereafter, they were digested in a mixture of pure nitric acid and peroxide hydrogen (375 µL:125 µL) (TraceSelect grade, Sigma Aldrich, St. Louis, MO, USA) at room ambient temperature for 24 h and after short periods of sonication and warming. Samples diluted in ultrapure water were analysed by inductively coupled plasma (ICP) interfaced to a quadruple mass spectrometer (MS-ICP-MS, Agilent 7500c with micro flow nebulizer, Agilent Technologies, Santa Clara, CA, USA) equipped with an autosampler (ASX 520, Teledyne CETAC, Omaha, NB, USA). Element signals were acquired for 200 msec per mass, and three acquisitions were realized. Element quantification ([Sr+], [Ca2+], [Mg2+], [Na+], and [K+]) was performed in normal mode with a ten points external calibration using multi-element reference material (Multi-Element 5, Sigma Aldrich) with a concentration range between 0.10 and 50 for [Sr+] and 1.00 and 500 ng mL−1 for other elements. Performances of the method and instrument stability were assessed by the analysis of a quality control (QC) solution of known metal concentration repeatedly during the course of analysis and a procedural blank. Control of the system, acquisition, and data processing were carried out with the Agilent ChemStation software (Agilent Technologies). [Mg2+]:[Ca2+] were calculated, as these two ions, in the form of carbonates, are essential components of the carapace.

4.9. Statistical Analyses for Life-History and Physiological Traits

All statistical analyses were performed using the R software, version 2.15.0 (R Core Team 2013, R foundation for Statistical computing, Vienna, Austria). Cumulated survival was analysed by a binomial model weighted by the initial effective of larvae or juveniles. For all the other data analysed, normality and homoscedasticity of the data and residuals were checked using Shapiro’s test and Bartlett’s test, respectively. Data were log transformed to respect the assumptions for the mineralisation traits. Linear mixed effect models [94] were built for each variable with “pCO2” and “stage” as fixed factors. The wet body mass (for MO2, feeding rate, and mineralisation traits) or the total length (morphometric traits except ratios) of each individual, and the mean temperature measured during the experiment (for MO2), were added as covariates. Spatial pseudoreplication was taken into account by considering “kreisel” or “tank” as random factors for all variables tested. The significance of the random term was first tested with the function “rand” of the package lmerTest [95], and the random term was removed as it was non-significant for all parameters tested. After removing the random term, linear, log, and polynomial models were compared with Akaike information criteria (AIC). The best model was determined as the one with the lower AIC: however, ΔAIC were calculated, and for models with ΔAIC < 2, thus considerably comparable, the best model has been chosen as the most parsimonious one, i.e., the simplest order equation type, e.g., linear over log over polynomial 2 degrees over polynomial 3 degrees. In case significant interaction between pCO2 and stage was found, the best model was used to predict the responses and assess the significance of the trait to pCO2 for each stage, fixing the value of the covariate as the mean value for each stage.
All results in the tables are given as mean ± standard error (SE) and the graphs represent the predicted response to pCO2 flanked by the confidence interval for each developmental stage, except for the graph presenting cumulative survival (mean ± SE).

4.10. Metabolomic Fingerprints

Metabolite quantification: The extraction of key targeted metabolites was carried out on previously frozen entire larvae and juvenile’s abdomen (same individuals used for respiration measurements, n = 20 and 6, respectively), following the method described by Lu et al. [96] and the adapted protocol detailed in [97]. Briefly, a fast “cold quenching salt-eliminating” extraction was first prepared, using an ammonium carbonate extraction solution. Centrifugal PP tubes (1.5 mL) containing the samples were kept in liquid nitrogen, while 250 µL of the extraction solution were added in the tube. Each sample was crushed with a potter pestle (blue pre-sterilized, Axygen, Tewksbury, MA, USA), sonicated for 3 s (Sonication bath, model Symphony, VWR, West Chester, PA, USA) and centrifuged at 11,000 rpm for 3 min at 4 °C (centrifuge 5430R, Eppendorf, Hamburg, Germany). After transfer in a 250 µL amber HPLC vial with insert (Wheaton, NJ, USA), 225 µL of the supernatant were injected in a liquid chromatography system (Accela, Thermo Electron Corporation, San Jose, CA, USA) equipped with a 150 mm × 2 mm Luna C5 guard column for Phenomenex (Torrance, CA, USA). The identification of metabolites previously separated was then achieved on an Orbitrap LTQ Discovery high-resolution mass spectrometer (HRMS) (Thermo Electron Corporation). HRMS data were then analysed on Xcalibur 2.0 software (Thermo Electron Corporation). For each targeted metabolite, a calibration curve was created using amino-acid (from Phenomenex), free fatty-acid (from hydrolyzed FAME 37 standard, Sigma-Aldrich), and other metabolites standards (Sigma-Aldrich). Metabolite concentrations for all the samples were then assessed from the area of the working standard solution by extraction integration.
Data pre-processing: Raw data matrices were blank subtracted (a mean blank value was calculated per metabolite) and normalized by wet weight, with final concentration values expressed as ng metabolite mg−1 wet weight. Matrices were then imported into the freely available web tool MetImp v1.2 (https://metabolomics.cc.hawaii.edu/software/MetImp/, accessed in April 2021) for missing data imputation. Following the protocol established for targeted LC-MS [98], the QRILC algorithm (Quantile Regression Imputation of Left-Censored Data) with 50% group wise missing filtering was used to input missing values (seed 1234). Afterwards, data were imported to Metaboanalyst 4.0 (http://www.metaboanalyst.ca/, accessed in April 2021), log-transformed to reduce heteroscedasticity and pareto-scaled to adjust for differences in fold-changes between metabolites.
Data analysis: Multivariate and univariate analyses were performed to identify metabolites that discriminate between (i) developmental stages and (ii) different pCO2 concentrations within each stage. Unsupervised principal components analysis (PCA) was applied to unravel data structure, and was followed by a supervised method, namely partial-least-squares discriminant analysis (PLS-DA) in order to identify which metabolites are useful to predict group membership, following the rationale described in Worley and Powers [99,100]. Metabolites with discriminative power were ranked based on VIP values > 1 (Variable Importance in Projection score) and PLS-DA models were validated based on the “prediction accuracy during training” test statistic with 1000 permutations (p < 0.05 for significance). Heat maps with hierarchical clustering of metabolites were constructed based on the following metrics (i) distance measure: Pearson correlation (similarity of expression profiles), (ii) clustering algorithm: complete linkage (forms compact clusters), and (iii) feature autoscale. Hierarchical clustering of samples was carried out based on the following metrics: (i) distance measure: Euclidean distance (sensitive to magnitude differences), and (ii) clustering algorithm: Ward (minimizes within-cluster variance). Differences in metabolites between groups were further evaluated using one-way analysis of variance (ANOVA) with a False Discovery Rate (FDR) cut-off set at 0.05 for significance. Tukey’s post hocs were applied to check which groups differed. Significant metabolites unravelled by ANOVA were then used for pathway analysis to identify the most relevant pathways that are involved in developmental processes and responses to seawater pCO2. As there are no libraries available for lobster, the pathway library used was from the model species D. rerio (zebrafish), and analysis was based on homology. Pathway analysis was carried out based on two features, (i) functional enrichment, which was assessed using hypergeometric tests for over-representation analysis (p < 0.05 for significance), and (ii) pathway topology analysis, which was implemented using the relative betweenness centrality. Pathway topology takes into account the role of the metabolite, position and direction of the interaction, measuring the centrality of a given metabolite in the metabolic network. This gives information about the relative importance or role of the metabolite in the organization of the metabolic network. Indeed, central metabolites are assumed to have primary functions in metabolism when compared to peripheral metabolites, as they control other metabolic reactions and, thus, network flow, having greater downstream consequences in cellular functioning—see Xia and Wishart [101] for further details. Pathway impact was considered relevant if >0.1.

5. Conclusions

Our study further confirms the low sensitivity of the larval stages of the American lobster to OA and CCS leakage conditions (up to pCO2 3000 µatm/pH 7.2), conversely to the historically accepted idea that early larvae would be the most sensitive life stages to elevated seawater pCO2 [48,102]. Stage IV post-larvae and stage V juveniles possess the narrowest tolerance window to OA. Homarus americanus stage IV post-larvae in particular, the transitional bentho-pelagic stage, appear to be one of the main bottlenecks along crustacean development (as observed in decapod crustaceans: e.g., [34,35]). This has likely profound ecological and population dynamics implications for the American lobster, as observed for other crustaceans: e.g., the estuarine crab Chasmagnathus granulata (Dana, 1851) [103] and the barnacle Semibalanus balanoides (Linnaeus, 1767) [104].
Our study provides evidence that the ability to activate cellular compensatory mechanisms can minimize the negative impacts of high pCO2 conditions on life history and whole-organism physiological responses, as observed in our study for larval stages. Interestingly, a similar pattern was observed at the gene expression level by Niemisto et al. [36]. In more detail, we show that larvae OA buffering capacity in the American lobster is connected to their ability to regulate energy metabolic pathways related to fatty acid metabolism, amino acid metabolism, and citrate cycle metabolism.
Future experiments should continue the efforts to investigate life history, whole organism physiology and cell responses over discrete pH/pCO2 gradients, as we achieved in this study. In addition, future studies should attempt to further integrate multi omics approaches, to deepen our mechanistic understanding of marine species responses to global changes, whilst extending the exposure to OA and CCS conditions over further life stages, and even over multiple generations. Indeed, it is still to be determined if the impacts observed for early life stages will translate into impacts at the adult stages, and if there will be longer-term effects on population fecundity due to maternal carry-over exposures, as well as across multiple-generations of exposures. Finally, there is an urgent need to acquire an in-depth understanding of marine invertebrates’ stage-specific physiological sensitivity to future global change drivers at different scales of the biological hierarchy, renewing Bartholomew’s lesson [105], particularly for species characterised by complex life-cycles.

Supplementary Materials

The following are available online at https://www.mdpi.com/article/10.3390/metabo11090584/s1, Figure S1: Metabolomic fingerprinting stages III to IV. Metabolome differences between pCO2 groups in lobster larval stages III, IV and V (a) PCA 2D score plot with 95% confidence intervals for stage III, (b) PCA 2D score plot with 95% confidence intervals for stage IV, (c) PCA 2D score plot with 95% confidence intervals for stage V, (d) PLS-DA scores plot with 95% confidence intervals for stage V. Model validation was calculated by the prediction accuracy during training test statistic with 1000 permutations, p = 0.016, (e) PLS-DA Variable Importance in Projection scores (VIP > 1 for significance). None of the metabolites were significant in the univariate ANOVA (FDR 0.05). pCO2 groups: 1—400 µatm, 2—600 µatm, 3—800 µatm, 4—1000 µatm, 5—1200 µatm, 6—2000 µatm, 7—3000 µatm. Groups 6 and 7 are lacking from stage V analysis due to mortality levels., Table S1: Stage survival and morphological measurements for each pCO2 condition of exposure at each stage of development, Table S2: Mineral contents in the cephalothorax for each pCO2 condition of exposure at each stage of development, Table S3: Resting metabolic rates (individual and mass normalized) for each pCO2 condition of exposure at each stage of development. n = 20 for larval stages I, II, III and n = 6 for postlarvae (stage IV) and juveniles (stage V), Table S4: Models testing the responses of life-history and physiological traits to pCO2 and stage (+covariate when needed). AIC, R² and adjusted R² are given for each equation. Bold R² shows the best fitted model based on AIC selection for each trait, following the rule of parsimony when AIC differ for less than a value of 2: i.e., when AIC are comparable the simpler model was consider as the best-fit model, Table S5 ANOVA and post-hoc Tukey HSD results assessing the effects of ocean acidification (pCO2 concentration groups: 1—400 µatm; 2—600 µatm; 3—800 µatm; 4—1000 µatm; 5—1200 µatm; 6—2000 µatm; 7—3000 µatm) in stage I larvae. Only significant metabolites are included in the table, Table S6. ANOVA and Tukey HSD post-hoc results assessing the effects of ocean acidification (pCO2 concentration groups: 1—400 µatm; 2—600 µatm; 3—800 µatm; 4—1000 µatm; 5—1200 µatm; 6—2000 µatm; 7—3000 µatm) in stage II larvae. Only significant metabolites are included in the table, Table S7: Physico-chemical parameters (mean ± SE) of the different pCO2 treatments for larval setup (nkreisels = 4 per pCO2 condition) and juvenile setup (ntanks = 3 per pCO2 condition). Seawater temperature, salinity, oxygen content, pHT (pH on the total scale) and total alkalinity (At) were measured whereas the other parameters of the carbonate system were calculated with CO2sys software (Lewis & Wallace, 1998). pCO2: CO2 partial pressure; DIC: dissolved inorganic carbon; HCO3−: bicarbonates concentration; CO32−: carbonates concentration; Ω Ca: saturation state of seawater with respect to calcite and Ω Ar: saturation state of seawater with respect to aragonite.

Author Contributions

D.D., K.A.-S., and P.C. wrote the original grant proposal that supported this work. F.N., D.D., K.A.-S. and P.C. devised the work plan for the experiment. F.N. and P.C. selected the biological metrics to be measured and analyses to be undertaken to characterise lobster responses to elevated pCO2. F.N., K.M.-C. and S.P. carried out the experiments. F.N. and M.C. carried out the carapace mineral analyses, morphometrics and metabolomics samples. K.A.-S. did the water analysis. Statistical analyses were carried out by F.N. for life-history traits, carapace mineralisation and metabolic rates, by D.M. for metabolomics; all with input from P.C., H.G.-S. provided theoretical inputs and brainstorming during discussions that helped to draft the manuscript. F.N., D.M., and P.C. wrote the first manuscript, which was then improved with editorial inputs from all authors. All authors have read and agreed to the published version of the manuscript.

Funding

This work was supported by a MEOPAR I-CAP Ocean Acidification research grant awarded to D.D., K.A.-S. and P.C., a DFO ACCASP and Partnership programs to K.A.-S., and by a Natural Sciences and Engineering Research Council of Canada (NSERC) Discovery Program grant (RGPIN-2015-06500) awarded to P.C., F.N. was supported by MEOPAR funding and Quebec Center for Biodiversity Science (QCBS) Excellence Fellowship (#199173). S.P. was supported by a NSERC Undergraduate Student Research Award (USRA) (reference #440371). K.M.-C. was supported by MEOPAR funding and a NSERC Industrial Undergraduate Student Research Award (IUSRA) (481258). D.M. was supported by the Portuguese Fundação para a Ciência e Tecnologia (CEECIND/01250/2018) and further acknowledges the financial support to CESAM (UIDP/50017/2020 and UIDB/50017/2020). P.C. is currently supported by a NSERC Discovery Program grant (RGPIN-2020-005627).

Institutional Review Board Statement

Experimental research in lobsters’ early life stages is not under any specific ethics regulation in Canada. This said, our study was designed to use at the beginning of our experiment the minimal number of larvae necessary to achieve our objectives.

Informed Consent Statement

Not applicable.

Data Availability Statement

All data from this article will be available on the Open Access Repository PANGAEA, under OA-ICC data compilation, DOI TO COME.

Acknowledgments

The authors thank Valores for providing larvae and all the staff from the Saint Andrews Biological Station for their daily help during the experiment, in particular Steven Neil, Jocelyn Leger, Tammy Blair, and Lara Cooper. We are also grateful to Fanny Vermandele and Mathieu Babin for technical support with the metabolomics analyses. F.N. and P.C. are members of the research excellence network Québec-Océan. F.N. is also a member of the research excellence network Ressources Aquatiques Quebec.

Conflicts of Interest

The authors declare no conflict of interest.

References

  1. Pechenik, J.A. On the advantages and disadvantages of larval stages in benthic marine invertebrate life cycles. Mar. Ecol. -Prog. Ser. 1999, 177, 269–297. [Google Scholar] [CrossRef] [Green Version]
  2. Marshall, D.J.; Morgan, S.G. Ecological and evolutionary consequences of linked life-history stages in the sea. Curr. Biol. 2011, 21, R718–R725. [Google Scholar] [CrossRef] [Green Version]
  3. Young, C.M. Larval ecology of marine invertebrates: A sesquicentennial history. Ophelia 1990, 32, 1–48. [Google Scholar] [CrossRef]
  4. Charmantier, G.; Charmantier-Daures, M.; Aiken, D.E. Metamorphosis in the Lobster Homarus (Decapoda): A Review. J. Crustacean Biol. 1991, 11, 481–495. [Google Scholar] [CrossRef]
  5. Pechenik, J.A. Larval experience and latent effects: Metamorphosis is not a new beginning. Integr. Comp. Biol. 2006, 46, 323–333. [Google Scholar] [CrossRef]
  6. Byrne, M. Impact of ocean warming and ocean acidification on marine invertebrate life history stages: Vulnerabilities and potential for persistence in a changing ocean. In Oceanography and Marine Biology: An Annual Review; Gibson, R., Atkinson, R., Gordon, J., Smith, I., Hughes, D., Eds.; Taylor & Francis: Abingdon, UK, 2011. [Google Scholar]
  7. Charmantier, G.; Haond, C.; Lignot, J.; Charmantier-Daures, M. Ecophysiological adaptation to salinity throughout a life cycle: A review in homarid lobsters. J. Exp. Biol. 2001, 204, 967–977. [Google Scholar] [CrossRef]
  8. Whiteley, N.M. Physiological and ecological responses of crustaceans to ocean acidification. Mar. Ecol. Prog. Ser. 2011, 430, 257–271. [Google Scholar] [CrossRef] [Green Version]
  9. Bindoff, N.L.; Cheung, W.W.L.; Kairo, J.G.; Aristegui, G.; Guinder, V.A.; Hallberg, R.; Hilmi, N.; Jiao, N.; Karim, M.S.; Levin, L.A.; et al. Changing Ocean, Marine Ecosystems, and Dependent Communities. In IPCC Special Report on the Ocean and Cryosphere in a Changing Climate; Pörtner, H.-O., Roberts, D.C., Masson-Delmotte, V., Zhai, P., Tignor, M., Poloczanska, E., Mintenbeck, K., Alegría, A., Nicolai, M., Okem, A., et al., Eds.; Intergovernmental Panel on Climate Change, Press CU: Cambridge, UK; New York, NY, USA, 2019; pp. 447–588. [Google Scholar]
  10. Burger, F.A.; John, J.G.; Frölicher, T.L. Increase in ocean acidity variability and extremes under increasing atmospheric CO2. Biogeosciences 2020, 17, 4633–4662. [Google Scholar] [CrossRef]
  11. Diaz, R.J.; Rosenberg, R. Spreading dead zones and consequences for marine ecosystems. Science 2008, 321, 926–929. [Google Scholar] [CrossRef] [PubMed]
  12. Kroeker, K.J.; Kordas, R.; Crim, R.; Hendriks, I.E.; Ramajo, L.; Singh, G.S.; Duarte, C.M.; Gattuso, J.-P. Impacts of ocean acidification on marine organisms: Quantifying sensitivities and interaction with warming. Glob. Chang. Biol. 2013, 19, 1884–1896. [Google Scholar] [CrossRef] [Green Version]
  13. Stocker, T.F.; Qin, D.; Plattner, G.-K.; Tignor, M.M.B.; Allen, S.K.; Boschung, J.; Nauels, A.; Xia, Y.; Bex, V.; Midgley, P.M. Climate Change 2013. The Physical Science Basis. In Working Group I Contribution to the Fifth Assessment Report of the Intergovernmental Panel on Climate Change; Press CU: Cambridge, UK; New York, NY, USA, 2013. [Google Scholar]
  14. Orr, J.C.; Fabry, V.J.; Aumont, O.; Bopp, L.; Doney, S.; Feely, R.A.; Gnanadesikan, A.; Gruber, N.; Ishida, A.; Joos, F.; et al. Anthropogenic ocean acidification over the twenty-first century and its impact on calcifying organisms. Nature 2005, 437, 681–686. [Google Scholar] [CrossRef] [PubMed]
  15. Feely, R.A.; Doney, S.C.; Cooley, S.R. Ocean acidification: Present conditions and future changes in a high-CO2 world. Oceanography 2009, 22, 36–47. [Google Scholar] [CrossRef] [Green Version]
  16. Duarte, C.M.; Hendriks, I.E.; Moore, T.S.; Olsen, Y.S.; Steckbauer, A.; Ramajo, L.; Carstensen, J.; Trotter, J.A.; McCulloch, M. Is ocean acidification an open-ocean syndrome? Understanding anthropogenic impacts on seawater pH. Estuaries Coasts 2013, 36, 221–236. [Google Scholar] [CrossRef] [Green Version]
  17. Waldbusser, G.G.; Salisbury, J.E. Ocean acidification in the coastal zone from an organism’s perspective: Multiple system parameters, frequency domains, and habitats. Annu. Rev. Mar. Sci. 2013, 6, 221–247. [Google Scholar] [CrossRef] [PubMed]
  18. Spalding, C.; Finnegan, S.; Fischer, W.W. Energetic costs of calcification under ocean acidification. Glob. Biogeochem. Cycles 2017, 31, 866–877. [Google Scholar] [CrossRef] [Green Version]
  19. Melzner, F.; Mark, F.C.; Seibel, B.A.; Tomanek, L. Ocean Acidification and Coastal Marine Invertebrates: Tracking CO2 Effects from Seawater to the Cell. Annu. Rev. Mar. Science 2020, 12, 499–523. [Google Scholar] [CrossRef]
  20. Pandori, L.L.; Sorte, C.J. The weakest link: Sensitivity to climate extremes across life stages of marine invertebrates. Oikos 2019, 128, 621–629. [Google Scholar] [CrossRef] [Green Version]
  21. Coffey, W.D.; Nardone, J.A.; Yarram, A.; Long, W.C.; Swiney, K.M.; Foy, R.J.; Dickinson, G.H. Ocean acidification leads to altered micromechanical properties of the mineralized cuticle in juvenile red and blue king crabs. J. Exp. Mar. Biol. Ecol. 2017, 495, 1–12. [Google Scholar] [CrossRef]
  22. Donohue, P.; Calosi, P.; Bates, A.; Laverock, B.; Rastrick, S.P.S.; Mark, F.C.; Strobel, A.; Widdicombe, S. Physiological and behavioural impacts of exposure to elevated pCO2 on an important ecosystem engineer the burrowing shrimp Upogebia deltaura. Aquat. Biol. 2012, 15, 73–86. [Google Scholar] [CrossRef] [Green Version]
  23. Hammer, K.M.; Pedersen, S.A. Deep-water prawn Pandalus borealis displays a relatively high pH regulatory capacity in response to CO2-induced acidosis. Mar. Ecol. -Prog. Ser. 2013, 492, 139–151. [Google Scholar] [CrossRef]
  24. Knapp, J.L.; Bridges, C.R.; Krohn, J.; Hoffman, L.C.; Auerswald, L. The effects of hypercapnia on the West Coast rock lobster (Jasus lalandii) through acute exposure to decreased seawater pH—Physiological and biochemical responses. J. Exp. Mar. Biol. Ecol. 2016, 476, 58–64. [Google Scholar] [CrossRef]
  25. Lowder, K.B.; Allen, M.C.; Day, J.M.; Deheyn, D.D.; Taylor, J.R.; Woodson, H.E.B. Assessment of ocean acidification and warming on the growth, calcification, and biophotonics of a California grass shrimp. ICES J. Mar. Science 2017, 74, 1150–1158. [Google Scholar] [CrossRef]
  26. Miller, J.J.; Maher, M.; Bohaboy, E.; Friedman, C.S.; Mcelhany, P. Exposure to low pH reduces survival and delays development in early life stages of Dungeness crab (Cancer magister). Mar. Biol. 2016, 163, 118. [Google Scholar] [CrossRef]
  27. Green, B.S.; Gardner, C.; Hochmuth, J.D.; Linnane, A. Environmental effects on fished lobsters and crabs. Rev. Fish Biol. Fish. 2014, 24, 613–638. [Google Scholar] [CrossRef]
  28. Whiteley, N.M.; Taylor, E. Responses to environmental stresses: Oxygen, temperature and pH. Physiol. Nat. Hist. Crustacea 2015, 4, 320–358. [Google Scholar]
  29. Aiken, D. Proecdysis, setal development, and molt prediction in the American lobster (Homarus americanus). J. Fish. Board Can. 1973, 30, 1337–1344. [Google Scholar] [CrossRef]
  30. Roer, R.; Dillaman, R. The structure and calcification of the crustacean cuticle. Am. Zool. 1984, 24, 893–909. [Google Scholar] [CrossRef]
  31. Arnberg, M.; Calosi, P.; Spicer, J.I.; Tandberg, A.H.S.; Nilsen, M.; Westerlund, S.; Bechmann, R.K. Elevated temperature elicits greater effects than decreased pH on the development, feeding and metabolism of northern shrimp (Pandalus borealis) larvae. Mar. Biol. 2013, 160, 2037–2048. [Google Scholar] [CrossRef]
  32. Arnold, K.; Findlay, H.; Spicer, J.; Daniels, C.; Boothroyd, D. Effect of CO 2-related acidification on aspects of the larval development of the European lobster, Homarus gammarus (L.). Biogeosciences 2009, 6, 1747–1754. [Google Scholar] [CrossRef] [Green Version]
  33. Rato, L.D.; Novais, S.C.; Lemos, M.F.; Alves, L.M.; Leandro, S.M. Homarus gammarus (Crustacea: Decapoda) larvae under an ocean acidification scenario: Responses across different levels of biological organization. Comp. Biochem. Physiol. Part C Toxicol. Pharmacol. 2017, 203, 29–38. [Google Scholar] [CrossRef]
  34. Small, D.P.; Calosi, P.; Boothroyd, D.; Widdicombe, S.; Spicer, J.I. Stage-Specific Changes in Physiological and Life-History Responses to Elevated Temperature and Pco2 during the Larval Development of the European LobsterHomarus gammarus (L.). Physiol. Biochem. Zool. 2015, 88, 494. [Google Scholar] [CrossRef]
  35. Walther, K.; Anger, K.; Portner, H.O. Effects of ocean acidification and warming on the larval development of the spider crab Hyas araneus from different latitudes (54 degrees vs. 79 degrees N). Mar. Ecol. -Prog. Ser. 2010, 417, 159–170. [Google Scholar] [CrossRef] [Green Version]
  36. Niemisto, M.; Fields, D.M.; Clark, K.F.; Waller, J.D.; Greenwood, S.J.; Wahle, R.A. American lobster postlarvae alter gene regulation in response to ocean warming and acidification. Ecol. Evol. 2021, 11, 806–819. [Google Scholar] [CrossRef]
  37. Caputi, N.; Lestang, S.; Frusher, S.; Wahle, R.A. The impact of climate change on exploited lobster stocks. In Lobsters: Biology, Management, Aquaculture and Fisheries, 2nd ed.; John Wiley and Sons: Hoboken, NJ, USA, 2013; pp. 84–112. [Google Scholar]
  38. Comeau, M.; Savoie, F. Movement of American lobster (Homarus americanus) in the southwestern Gulf of St. Lawrence. Fish. Bull. 2002, 100, 181–192. [Google Scholar]
  39. Keppel, E.A.; Scrosati, R.A.; Courtenay, S.C. Ocean acidification decreases growth and development in American lobster (Homarus americanus) larvae. J. Northwest Atl. Fish. Sci. 2012, 44, 61–66. [Google Scholar] [CrossRef]
  40. Mclean, E.L.; Katenka, N.V.; Seibel, B.A. Decreased growth and increased shell disease in early benthic phase Homarus americanus in response to elevated CO2. Mar. Ecol. -Prog. Ser. 2018, 596, 113–126. [Google Scholar] [CrossRef]
  41. Menu-Courey, K.; Noisette, F.; Piedalue, S.; Daoud, D.; Blair, T.; Blier, P.U.; Azetsu-Scott, K.; Calosi, P. Energy metabolism and survival of the juvenile recruits of the American lobster (Homarus americanus) exposed to a gradient of elevated seawater pCO2. Mar. Environ. Res. 2019, 143, 111–123. [Google Scholar] [CrossRef]
  42. Waller, J.D.; Wahle, R.A.; Mcveigh, H.; Fields, D.M. Linking rising pCO2 and temperature to the larval development and physiology of the American lobster (Homarus americanus). ICES J. Mar. Sci. 2016, 74, 1210–1219. [Google Scholar] [CrossRef]
  43. Bednaršek, N.; Calosi, P.; Feely, R.A.; Ambros, R.; Byrne, M.; Dupont, S.; Padilla-Gamiño, J.L.; Spicer, J.I.; Kessouri, F.; Roethler, M.; et al. Synthesis of Thresholds of Ocean Acidification Impacts on Calcifying Echinoderms. Front. Mar. Sci. 2021, 8, 261. [Google Scholar] [CrossRef]
  44. Bednaršek, N.; Feely, R.A.; Howes, E.L.; Hunt, B.P.V.; Kessouri, F.; León, P.; Lischka, S.; Maas, A.E.; McLaughlin, K.; Nezlin, N.P.; et al. Systematic Review and Meta-Analysis Toward Synthesis of Thresholds of Ocean Acidification Impacts on Calcifying Pteropods and Interactions with Warming. Front. Mar. Sci. 2019, 6, 6. [Google Scholar] [CrossRef] [Green Version]
  45. Christen, N.; Calosi, P.; Mcneill, C.L.; Widdicombe, S. Structural and functional vulnerability to elevated pCO2 in marine benthic communities. Mar. Biol. 2013, 160, 2113–2128. [Google Scholar] [CrossRef]
  46. Dupont, S.; Pörtner, H.-O. A snapshot of ocean acidification research. Mar. Biol. 2013, 160, 1765–1771. [Google Scholar] [CrossRef] [Green Version]
  47. Walther, K.; Sartoris, F.J.; Bock, C.; Portner, H.O. Impact of anthropogenic ocean acidification on thermal tolerance of the spider crab Hyas araneus. Biogeosciences 2009, 6, 2207–2215. [Google Scholar] [CrossRef] [Green Version]
  48. Spicer, J.I.; Gaston, K.J. Physiological Diversity and Its Ecological Implications; Blackwell Science: Oxford, UK, 1999; p. 241. [Google Scholar]
  49. Mcwilliam, P.S.; Phillips, B.F. Spiny lobster development: Mechanisms inducing metamorphosis to the puerulus: A review. Rev. Fish Biol. Fish. 2007, 17, 615–632. [Google Scholar] [CrossRef]
  50. Jung, H.; Lyons, R.E.; Hurwood, D.A.; Mather, P.B. Genes and growth performance in crustacean species: A review of relevant genomic studies in crustaceans and other taxa. Rev. Aquac. 2013, 5, 77–110. [Google Scholar] [CrossRef]
  51. Dhillon, S.S.; Torell, F.; Donten, M.; Lundstedt-Enkel, K.; Bennett, K.; Rännar, S.; Trygg, J.; Lundstedt, T. Metabolic profiling of zebrafish embryo development from blastula period to early larval stages. PLoS ONE 2019, 14, e0213661. [Google Scholar] [CrossRef] [PubMed]
  52. Byrne, M. Global change ecotoxicology: Identification of early life history bottlenecks in marine invertebrates, variable species responses and variable experimental approaches. Mar. Environ. Res. 2012, 76, 3–15. [Google Scholar] [CrossRef] [PubMed]
  53. Byrne, M.; Przeslawski, R. Multistressor impacts of warming and acidification of the ocean on marine invertebrates’ life histories. Integr. Comp. Biol. 2013, 53, 582–596. [Google Scholar] [CrossRef] [PubMed] [Green Version]
  54. Long, C.W.; Swiney, K.M.; Foy, R.J. Effects of ocean acidification on the embryos and larvae of red king crab, Paralithodes camtschaticus. Mar. Pollut. Bull. 2013, 69, 38–47. [Google Scholar] [CrossRef] [PubMed]
  55. Bechmann, R.K.; Taban, I.C.; Westerlund, S.; Godal, B.F.; Arnberg, M.; Vingen, S.; Ingvarsdottir, A.; Baussant, T. Effects of ocean acidification on early life stages of shrimp (Pandalus borealis) and mussel (Mytilus edulis). J. Toxicol. Environ. Health Part A 2011, 74, 424–438. [Google Scholar] [CrossRef]
  56. Long, W.C.; Swiney, K.M.; Foy, R.J. Effects of high pCO2 on Tanner crab reproduction and early life history, Part II: Carryover effects on larvae from oogenesis and embryogenesis are stronger than direct effects. ICES J. Mar. Sci. J. Cons. 2016, 73, 836–848. [Google Scholar] [CrossRef] [Green Version]
  57. Schiffer, M.; Harms, L.; Pörtner, H.O.; Lucassen, M.; Mark, F.C.; Storch, D. Tolerance of Hyas araneus zoea I larvae to elevated seawater PCO2 despite elevated metabolic costs. Mar. Biol. 2013, 160, 1943–1953. [Google Scholar] [CrossRef] [Green Version]
  58. Page, T.M.; Worthington, S.; Calosi, P.; Stillman, J.H. Effects of elevated pCO2 on crab survival and exoskeleton composition depend on shell function and species distribution: A comparative analysis of carapace and claw mineralogy across four porcelain crab species from different habitats. ICES J. Mar. Sci. J. Cons. 2016, 74, 1021–1032. [Google Scholar] [CrossRef]
  59. Tsang, H.H.; Welch, M.J.; Munday, P.L.; Ravasi, T.; Schunter, C. Proteomic Responses to Ocean Acidification in the Brain of Juvenile Coral Reef Fish. Front. Mar. Sci. 2020, 7, 605. [Google Scholar] [CrossRef]
  60. Aze, T.; Barry, J.; Bellerby, R.G.; Brander, L.; Byrne, M.; Dupont, S.; Gattuso, J.P.; Gibbs, S.; Hansson, L.; Hattam, C.; et al. An Updated Synthesis of the Impacts of Ocean Acidification on Marine Biodiversity (CBD Technical Series; 75); Secretariat of the Convention on Biological Diversity: Rio de Janeiro, Brazil, 2014. [Google Scholar]
  61. Zhan, Y.; Cui, D.; Xing, D.; Zhang, J.; Zhang, W.; Li, Y.; Li, C.; Chang, Y. CO2-driven ocean acidification repressed the growth of adult sea urchin Strongylocentrotus intermedius by impairing intestine function. Mar. Pollut. Bull. 2020, 153, 110944. [Google Scholar] [CrossRef] [PubMed]
  62. Lannig, G.; Eilers, S.; Pörtner, H.-O.; Sokolova, I.M.; Bock, C. Impact of ocean acidification on energy metabolism of oyster, Crassostrea gigas-Changes in metabolic pathways and thermal response. Mar. Drugs 2010, 8, 2318–2339. [Google Scholar] [CrossRef] [Green Version]
  63. Mills, E.; O’neill, L.A.J. Succinate: A metabolic signal in inflammation. Trends Cell Biol. 2014, 24, 313–320. [Google Scholar] [CrossRef] [Green Version]
  64. Laino, A.; Lopez-Zavala, A.A.; Garcia-Orozco, K.D.; Carrasco-Miranda, J.S.; Santana, M.; Stojanoff, V.; Sotelo-Mundo, R.R.; Garcia, C.F. Biochemical and structural characterization of a novel arginine kinase from the spider Polybetes pythagoricus. PeerJ 2017, 5, e3787. [Google Scholar] [CrossRef] [PubMed] [Green Version]
  65. Schneider, A.; Wiesner, R.J.; Grieshaber, M.K. On the role of arginine kinase in insect flight muscle. Insect Biochem. 1989, 19, 471–480. [Google Scholar] [CrossRef]
  66. Lin, W.; Ren, Z.; Mu, C.; Ye, Y.; Wang, C. Effects of Elevated pCO2 on the Survival and Growth of Portunus trituberculatus. Front. Physiol. 2020, 11, 750. [Google Scholar] [CrossRef] [PubMed]
  67. Pane, E.F.; Barry, J.P. Extracellular acid–base regulation during short-term hypercapnia is effective in a shallow-water crab, but ineffective in a deep-sea crab. Mar. Ecol. -Prog. Ser. 2007, 334, 1–9. [Google Scholar] [CrossRef] [Green Version]
  68. Zittier, Z.M.; Hirse, T.; Pörtner, H.-O. The synergistic effects of increasing temperature and CO 2 levels on activity capacity and acid–base balance in the spider crab, Hyas araneus. Mar. Biol. 2013, 160, 2049–2062. [Google Scholar] [CrossRef]
  69. Harrington, A.M.; Hamlin, H.J. Ocean acidification alters thermal cardiac performance, hemocyte abundance, and hemolymph chemistry in subadult American lobsters Homarus americanus H. Milne Edwards, 1837 (Decapoda: Malcostraca: Nephropidae). J. Crustacean Biol. 2019, 39, 468–476. [Google Scholar] [CrossRef] [Green Version]
  70. Charmantier, G.; Charmantier-Daures, M.; Bouaricha, N.; Thuet, P.; Trilles, J.-P.; Aiken, D. Ontogeny of osmoregulation and salinity tolerance in two decapod crustaceans: Homarus americanus and Penaeus japonicus. Biol. Bull. 1988, 175, 102–110. [Google Scholar] [CrossRef]
  71. Trigg, S.A.; McElhany, P.; Maher, M.; Perez, D.; Busch, D.S.; Nichols, K.M. Uncovering mechanisms of global ocean change effects on the Dungeness crab (Cancer magister) through metabolomics analysis. Sci Rep. 2019, 9, 10717. [Google Scholar] [CrossRef] [Green Version]
  72. Hammer, K.M.; Pedersen, S.A.; Størseth, T.R. Elevated seawater levels of CO2 change the metabolic fingerprint of tissues and hemolymph from the green shore crab Carcinus maenas. Comp. Biochem. Physiol. Part D Genom. Proteom. 2012, 7, 292–302. [Google Scholar] [CrossRef] [PubMed]
  73. Delgado-Gaytán, M.F.; Hernández-Palomares, M.L.; Soñanez-Organis, J.G.; Muhlia-Almazán, A.; Sánchez-Paz, A.; Stephens-Camacho, N.A.; Valenzuela-Soto, E.M.; Rosas-Rodríguez, J.A. Molecular characterization and organ-specific expression of the gene that encodes betaine aldehyde dehydrogenase from the white shrimp Litopenaeus vannamei in response to osmotic stress. Comp. Biochem. Physiol. Part B Biochem. Mol. Biol. 2015, 189, 40–46. [Google Scholar] [CrossRef]
  74. Stephens-Camacho, N.A.; Muhlia-Almazan, A.; Sanchez-Paz, A.; Rosas-Rodríguez, J.A. Surviving environmental stress: The role of betaine aldehyde dehydrogenase in marine crustaceans. Invertebr. Surviv. J. 2015, 12, 66–74. [Google Scholar]
  75. Burg, M.B.; Ferraris, J.D. Intracellular organic osmolytes: Function and regulation. J. Biol. Chem. 2008, 283, 7309–7313. [Google Scholar] [CrossRef] [Green Version]
  76. Small, D.P.; Calosi, P.; Boothroyd, D.; Widdicombe, S.; Spicer, J.I. The sensitivity of the early benthic juvenile stage of the European lobster Homarus gammarus (L.) to elevated pCO 2 and temperature. Mar. Biol. 2016, 163, 53. [Google Scholar] [CrossRef]
  77. Incze, L.S.; Wolff, N.; Wahle, R.A. Can scientific observations of early life stages be scaled up to the level of a fished population? A case study using Homarus americanus. Fish. Res. 2003, 65, 33–46. [Google Scholar] [CrossRef]
  78. Cobb, J.S.; Wahle, R.A. Early Life History and Recruitment Processes of Clawed Lobsters. Crustaceana 1994, 67, 1–25. [Google Scholar] [CrossRef]
  79. Wahle, R.A.; Steneck, R.S. Habitat restrictions in early benthic life: Experiments on habitat selection and in situ predation with the American lobster. J. Exp. Mar. Biol. Ecol. 1992, 157, 91–114. [Google Scholar] [CrossRef]
  80. Carter, H.A.; Ceballos-Osuna, L.; Miller, N.A.; Stillman, J.H. Impact of ocean acidification on metabolism and energetics during early life stages of the intertidal porcelain crab Petrolisthes cinctipes. J. Exp. Biol. 2013, 216, 1412–1422. [Google Scholar] [CrossRef] [PubMed] [Green Version]
  81. Small, D.; Calosi, P.; White, D.; Spicer, J.I.; Widdicombe, S. Impact of medium-term exposure to CO2 enriched seawater on the physiological functions of the velvet swimming crab Necora puber. Aquat. Biol. 2010, 10, 11–21. [Google Scholar] [CrossRef]
  82. Wood, H.L.; Eriksson, S.P.; Nordborg, M.; Styf, H.K. The effect of environmental stressors on the early development of the Norway lobster Nephrops norvegicus (L.). J. Exp. Mar. Biol. Ecol. 2015, 473, 35–42. [Google Scholar] [CrossRef]
  83. Spicer, J.I.; Raffo, A.; Widdicombe, S. Influence of CO2-related seawater acidification on extracellular acid–base balance in the velvet swimming crab Necora puber. Mar. Biol. 2007, 151, 1117–1125. [Google Scholar] [CrossRef]
  84. Whiteley, N.M.; Egginton, S.; Taylor, E.W.; Raven, J. Acid-base regulation in crustaceans: The role of bicarbonate ions. In Seminar Series-Society for Experimental Biology; Cambridge University Press: Cambridge, UK, 1999; Volume 68, pp. 233–256. [Google Scholar]
  85. Calosi, P.; Melatunan, S.; Turner, L.M.; Artioli, Y.; Davidson, R.; Byrne, J.J.; Viant, M.R.; Widdicombe, S.; Rundle, S.D. Regional adaptation defines sensitivity to future ocean acidification. Nat. Commun. 2017, 8, 13994. [Google Scholar] [CrossRef] [Green Version]
  86. Blackford, J.C.; Jones, N.; Proctor, R.; Holt, J.; Widdicombe, S.; Lowe, D.J.; Rees, A.P. An initial assessment of the potential environmental impact of CO2 escape from marine carbon capture and storage systems. Proc. Inst. Mech. Eng. Part A J. Power Energy 2009, 223, 269–280. [Google Scholar] [CrossRef]
  87. Hauri, C.; Gruber, N.; Vogt, M.; Doney, S.C.; Feely, R.A.; Lachkar, Z.; Leinweber, A.; McDonnell, A.M.P.; Munnich, M.; Plattner, G.-K. Spatiotemporal variability and long-term trends of ocean acidification in the California Current System. Biogeosciences 2013, 10, 193–216. [Google Scholar] [CrossRef] [Green Version]
  88. Romano, N.; Zeng, C. Cannibalism of Decapod Crustaceans and Implications for Their Aquaculture: A Review of its Prevalence, Influencing Factors, and Mitigating Methods. Rev. Fish. Sci. Aquac. 2017, 25, 42–69. [Google Scholar] [CrossRef]
  89. Dickson, A.G.; Sabine, C.L.; Christian, J.R. (Eds.) Guide to Best Practices for Ocean CO2 Measurements; North Pacific Marine Science Organization: Sidney, Australia, 2007. [Google Scholar]
  90. Lewis, E.; Wallace, D.W.R. Program Developed for CO2 System Calculations; Carbon Dioxide Information Analysis Center, Oak Ridge National Laboratory, U.S. Department of Energy: Oak Ridge, TN, USA, 1998. [Google Scholar]
  91. Brown, J.H.; Gillooly, J.F.; Allen, A.P.; Savage, V.M.; West, G.B. Toward a metabolic theory of ecology. Ecology 2004, 85, 1771–1789. [Google Scholar] [CrossRef]
  92. Speakman, J.R.; Mcqueenie, J. Limits to Sustained Metabolic Rate: The Link between Food Intake, Basal Metabolic Rate, and Morphology in Reproducing Mice, Mus musculus. Physiol. Zool. 1996, 69, 746–769. [Google Scholar] [CrossRef] [Green Version]
  93. Weiss, H.M.; Lozano-Álvarez, E.; Briones-Fourzán, P.; Negrete-Soto, F. Using red light with fixed-site video cameras to study the behavior of the spiny lobster, Panulirus argus, and associated animals at night and inside their shelters. Mar. Technol. Soc. J. 2006, 40, 86–95. [Google Scholar] [CrossRef]
  94. Pinheiro, J.C.; Bates, D.M.; Debroy, S.; Sarkar, D.; Team, R.C. Linear and Nonlinear Mixed Effects Models-Package “nlme”; Version 3.1-104; CRAN: Vienna, Austria, 2012. [Google Scholar]
  95. Kuznetsova, A.; Brockhoff, P.B.; Christensen, R.H.B. lmerTest package: Tests in linear mixed effects models. J. Stat. Softw. 2017, 82, 1–26. [Google Scholar] [CrossRef] [Green Version]
  96. Lu, W.; Kimball, E.; Rabinowitz, J.D. A high-performance liquid chromatography-tandem mass spectrometry method for quantitation of nitrogen-containing intracellular metabolites. J. Am. Soc. Mass Spectrom. 2016, 17, 37–50. [Google Scholar] [CrossRef] [Green Version]
  97. Thibault, C.; Massamba-N’siala, G.; Noisette, F.; Vermandele, F.; Babin, M.; Calosi, P. Within- and trans-generational responses to combined global changes are highly divergent in two congeneric species of marine annelids. Mar. Biol. 2020, 167, 41. [Google Scholar] [CrossRef]
  98. Wei, R.; Wang, J.; Su, M.; Jia, E.; Chen, S.; Chen, T.; Ni, Y. Missing value imputation approach for mass spectrometry-based metabolomics data. Sci. Rep. 2018, 8, 1–10. [Google Scholar] [CrossRef] [PubMed] [Green Version]
  99. Worley, B.; Powers, R. Multivariate analysis in metabolomics. Curr. Metab. 2013, 1, 92–107. [Google Scholar]
  100. Worley, B.; Powers, R. PCA as a practical indicator of OPLS-DA model reliability. Curr. Metab. 2016, 4, 97–103. [Google Scholar] [CrossRef] [PubMed] [Green Version]
  101. Xia, J.; Wishart, D.S. MetPA: A web-based metabolomics tool for pathway analysis and visualization. Bioinformatics 2010, 26, 2342–2344. [Google Scholar] [CrossRef] [Green Version]
  102. Pörtner, H.-O.; Farrell, A.P. Physiology and climate change. Science 2008, 322, 690–692. [Google Scholar] [CrossRef]
  103. Giménez, K.A.; Torres, G.L. Linking life history traits in successive phases of a complex life cycle: Effects of larval biomass on early juvenile development in an estuarine crab, Chasmagnathus granulata. Oikos 2004, 104, 570–580. [Google Scholar] [CrossRef]
  104. Jarrett, J.N. Seasonal variation in larval condition and postsettlement performance of the barnacle Semibalanus balanoides. Ecology 2003, 84, 384–390. [Google Scholar] [CrossRef] [Green Version]
  105. Huey, R.B.; Bennett, A.F. Bart’s familiar quotations: The enduring biological wisdom of George A. Bartholomew. Physiol. Biochem. Zool. 2008, 81, 519–525. [Google Scholar] [CrossRef] [PubMed]
Figure 1. Metabolome differences between developmental stages of the American lobster Homarus americanus. (a) PCA 3D score plot, (b) PCA 2D loadings plot, (c) PLS−DA score plot with 95% confidence intervals. Model validation was calculated by the prediction accuracy during training test statistics with 1000 permutations, p = 0.001, (d) PLS−DA Variable Importance in Projection scores (VIP > 1 for significance). Metabolites with an asterisk were also significant in the ANOVA, with p < 0.05 (for full ANOVA results see Table S5). The coloured boxes on the right indicate the relative concentrations of the corresponding metabolite in each developmental stage, (e) pathway analysis of metabolomic changes carried out with the statistically significant metabolites (ANOVA p < 0.05). Hypergeometric test was used for over-representation analysis (p < 0.05 for significance) and relative betweenness centrality for pathway topology analysis (impact > 0.1). Annotated pathways were important in developmental processes based on either criterion. Bold pathways indicate p < 0.05. Pathways within the red area were considered the most relevant as they have p < 0.05 and impact > 0.1.
Metabolites 11 00584 g001
Figure 2. Summary of the significant effects of increasing pCO2 conditions (from 400 to 3000 µatm, i.e., pH 8.0 to 7.2) on the biological traits measured in the present study, for five consecutive early life-stages of the American lobster H. americanus (from larval stage I to juvenile stage V). Arrows and U indicate the direction of the response to increasing pCO2—means no change detected with pCO2, while + indicates a semi-quantitative intensity of reprogramming. Ø is for a trait that was not measured for certain life stages. No feeding rate was measured on larvae.
Metabolites 11 00584 g002
Figure 3. Survival. Survival rates as percentages of the initial larvae concentration (600 larvae per tank) for five early life stages of the American lobster H. americanus exposed to pCO2 conditions mimicking the current pCO2 condition, ocean acidification scenarios or during upwellings (600, 800, 1000, 1200, and 2000 µatm) and carbon capture storage leaks (3000 µatm). Dots represent the mean value (n = 3 to 4 tank replicates per pCO2 condition), SE bars are not represented for a better legibility.
Metabolites 11 00584 g003
Figure 4. Juvenile stages developmental time. Relationship between seawater pCO2 and developmental time (i.e., period between two moults) in stage IV post-larvae and stage V juveniles of the American lobster H. americanus exposed to a pCO2 gradient. Full curves represent the predicted values (from the linear model) for developmental time as a function of pCO2 for each stage; dashed lines represent the 95% upper and lower confidence intervals.
Metabolites 11 00584 g004
Figure 5. Morphometrics. Relationship between the cephalothorax and abdomen lengths (in mm) and the seawater pCO2 for the early life stages of the American lobster. Bold lines represent the predicted values (from the linear and logarithmic model for cephalothorax and abdomen, respectively) as a function of pCO2 for stage I (light blue), stage II (green), stage III (dark blue), stage IV (yellow), and stage V (orange), with the total length (covariate) fixed at the stage mean value for each stage. Shaded areas around regression lines represent the 95% confidence interval of the predicted values. Models stop at 1200 µatm for stage V juvenile lobsters, as all the individuals were dead in the 2000 and 3000 µtm treatments.
Metabolites 11 00584 g005
Figure 6. Mineralisation. Relationship between mineralisation contents and the seawater pCO2 for the early life stages of the American lobster. Bold lines represent the predicted values (from the linear for Mg2+ and Na+ contents and polynomial model for [Mg]:[Ca] ratio as a function of pCO2 for stage I (light blue), stage II (green), stage III (dark blue), stage IV (yellow), and stage V (orange), with the total wet body mass (covariate) fixed at the stage mean value for each stage. Shaded areas around the lines represent the 95% confidence interval of the predicted values. Models stop at 1200 µatm for stage V juvenile lobsters, as all the individuals were dead in the 2000 and 3000 µtm treatments.
Metabolites 11 00584 g006
Figure 7. Resting metabolism. Relationship between the resting metabolic rates (in µmol O2 h−1) and seawater pCO2 for the early life stages of the American lobster. Bold lines represent the predicted values (from the polynomial model) in function of pCO2 per stage, with the wet body mass (covariate) fixed at its mean value for each stage, and temperature (second covariate) set at 18 °C. Shaded areas around regression lines represent the 95% confidence interval of the predicted values. The model stops at 1200 µatm for stage V juvenile lobsters, as there were not enough individuals at 2000 and 3000 µtm to carry out respirometry.
Metabolites 11 00584 g007
Figure 8. Metabolomic fingerprinting larvae stage I. Metabolome differences between pCO2 treatments in lobster larval stage I (a) PCA 2D score plot with 95% confidence intervals, (b) PCA 2D loadings plot, (c) PLS-DA score plot with 95% confidence intervals. Model validation was calculated by the prediction accuracy during training test statistics with 1000 permutations, p = 0.028, (d) PLS-DA Variable Importance in Projection scores (VIP > 1 for significance). Metabolites with an asterisk were also significant in the ANOVA, with p < 0.05 (for full ANOVA results see Table S5). The coloured boxes on the right indicate the relative concentrations of the corresponding metabolite in each pCO2 treatment: and (e) pathway analysis of metabolic changes carried out with the statistically significant metabolites (ANOVA p < 0.05). Hypergeometric test was used for over-representation analysis (p < 0.05 for significance, pathways highlighted in bold) and relative betweenness centrality for pathway topology analysis (impact > 0.1 for relevance). Annotated pathways were important in response to pCO2 based on either criterion. Pathways within the red area were considered the most relevant as they have p < 0.05 and impact > 0.1, i.e., citrate cycle. On the right panel, the citrate cycle is represented, with metabolites coded by KEGG number; metabolites coloured in red varied significantly. Boxplots of each compound highlighted in red were constructed based on the 25th and 75th percentiles (bottom and top of the box) with the middle line representing the median. The upper whisker represents the smaller maximum value and Q3 + 1.5 × IQR (Interquartile Range) and the lower whisker represents the larger minimum value and Q1 − 1.5 × IQR. Different letters indicate significant differences (p < 0.05) between groups.
Metabolites 11 00584 g008
Figure 9. Metabolomic fingerprinting larvae stage II. Metabolome differences between pCO2 treatments in lobster larval stage II (a) PCA 2D score plot, (b) PCA 2D loadings plot, (c) pathway analysis of metabolic changes carried out with the statistically significant metabolites (ANOVA p < 0.05). Hypergeometric test was used for over-representation analysis (p < 0.05 for significance, pathways highlighted in bold) and relative betweenness centrality for pathway topology analysis (impact > 0.1 for relevance). Annotated pathways were important in response to pCO2 based on either criterion. Pathways within the red area were considered the most relevant, as they have p < 0.05 and impact > 0.1, i.e., citrate cycle. On the right panel, the citrate cycle is represented, with metabolites coded by KEGG number; metabolites coloured in red varied significantly. Boxplots of each compound highlighted in red were constructed based on the 25th and 75th percentiles (bottom and top of the box) with the middle line representing the median. Upper whisker represents the smaller maximum value and Q3 + 1.5 × IQR (Interquartile Range) and the lower whisker represents the larger minimum value and Q1 − 1.5 × IQR. Malate, fumarate, and α-ketoglutaric acid measured at 3000 µatm pCO2 were significantly different (as indicated by different letters, p < 0.05) from the other pCO2 treatments, (d) Heat map of clustered data (distance measure: Pearson correlation, clustering algorithm: complete linkage) in which cells denote the log transformed and pareto-scaled values of metabolite concentration. The colour scale ranges from red (higher than mean concentration) to blue (lower than mean concentration). Rows are the metabolites that were significantly different between treatments (ANOVA, p < 0.05) and columns are the pCO2 treatments, and (e) Hierarchical clustering of samples (distance measure: Euclidean distance, clustering algorithm: Ward) to unravel data structure. pCO2 treatments.
Metabolites 11 00584 g009
Table 1. Models and statistics. Summary of best model fitted testing the effect of pCO2, stage and their interaction on the American lobster Homarus americanus life history and physiological traits. Numbers in bold indicate significant p-values. Lt: total length and wbm: wet body mass. Survival between stages is calculated as the percentage of survival at each stage, assuming 100% corresponds to the number of larvae at the beginning of each larval stage. Developmental time was only determined for stages IV and V.
Best Model Fitted
pCO2StagepCO2: StageCovariate
dfFpdfFpdfFpdfdfFp
Survival cumulated131.2<0.001 no
Survival between stages129.87<0.00142129.87<0.0014666.51<0.001no
Developmental time111.572<0.001115.884<0.00110.9080.342no
Morphometrics
Total length (Lt)113.981<0.0014582.854<0.00140.3270.860no
ceph/Lt10.3170.574494.258<0.00141.9470.102no
abd/Lt12.2910.131423.342<0.00141.6730.155no
ceph/abd11.4360.232465.443<0.00141.4340.222no
Rostrum13.7330.054414.608<0.00141.4670.211Lt1356.727<0.001
Cephalothorax10.3300.568440.443<0.00142.8370.024Lt15075.599<0.001
Abdomen10.8470.358421.266<0.00143.5380.007Lt12885.833<0.001
Tail10.0070.932424.358<0.00144.5260.001Lt11095.440<0.001
Claw11.1660.2814120.891<0.00140.7930.530Lt14108.430<0.001
Mineralisation
log(Ca2+)10.7660.38445.955<0.00141.4780.215wbm155.695<0.001
log(Mg2+)14.3570.04042.9620.02442.7480.033wbm10.3340.565
log(Na+)15.1370.02642.1110.08642.7200.034wbm1102.544<0.001
log(K+)14.6650.03343.9700.00541.7530.145wbm195.232<0.001
log(Sr+)10.5410.46445.849<0.00141.2570.293wbm149.116<0.001
[Mg2+]:[Ca2+]15.0490.008419.040<0.00142.3160.026wbm1125.105<0.001
Feeding rate10.1690.68341.6200.20941.1430.290wbm15.3770.024
Resting metabolic rate (MO2)11.6080.20244.4400.00243.2100.001wbm11196.088<0.001
Publisher’s Note: MDPI stays neutral with regard to jurisdictional claims in published maps and institutional affiliations.

