On the Effectiveness of Different Surface Finishing Techniques on A357.0 Parts Produced by Laser-Based Powder Bed Fusion: Surface Roughness and Fatigue Strength


Department of Engineering Enzo Ferrari, University of Modena and Reggio Emilia, 41125 Modena, Italy
*
Author to whom correspondence should be addressed.
Metals 2019, 9(12), 1284; https://doi.org/10.3390/met9121284
Submission received: 12 November 2019
/
Revised: 22 November 2019
/
Accepted: 26 November 2019
/
Published: 29 November 2019
Abstract
:Laser-based powder bed fusion (L-PBF) is an additive manufacturing (AM) technique that uses a computer-controlled laser beam as the energy source to consolidate a metal powder according to a layer-upon-layer strategy in order to manufacture a three dimensional part. This opens the way for an unprecedented freedom in geometry, but the layer-wise build-up strategy typically results in a very poor surface finish, which is affected by the staircase effect and by the presence of partially molten particles. Surface finishing treatments are therefore necessary to obtain an adequate surface finish, to improve the fatigue behavior and to meet mechanical and aesthetic needs. The present contribution systematically compares numerous surface finishing techniques, including laser shock processing, plastic media blasting, sand blasting, ceramic shot peening and metal shot peening with steel particles of different sizes (ϕ = 0.2 mm and ϕ = 0.4 mm). The results show that all the proposed methods improve the surface quality and the fatigue life of A357.0 L-PBF parts. However, the achievement of the lowest surface roughness does not necessarily correspond to the best fatigue performance, thus suggesting that multiple mechanisms may be active and that besides surface roughness also residual stresses contribute to increase the fatigue strength.
1. Introduction
At present, laser-based powder bed fusion (L-PBF) is the prevailing additive manufacturing (AM) technique to produce metal-based parts [1]. A powder bed is selectively melted (or sintered) and solidified layer-upon-layer by a laser beam that is computer-controlled according to an assigned model, which can be either a computer-aided-design (CAD) or a tomography-based project. The process is repeated until the intended geometry is completed [2].
L-PBF paves the way for the production of extremely complicated parts, conformal channels and assemblies, with substantial advantages for high-end applications in the automotive, aeronautic and biomedical fields. Moreover, since the total cost per part in L-PBF depends on the volume of the part, especially its height, rather than on its shape [3], geometric complication comes at no cost and therefore L-PBF offers the opportunity to manufacture customized and one-of-a-kind parts economically [4]. However, L-PBF is still a recent technique and, for this reason, very few feedstock materials are currently available on the market [5]. Recently, substantial progress has been achieved to extend the range of raw powders that may be successfully used for L-PBF. In particular, great attention has been paid to emerging metal-based composite systems [6,7]. Nonetheless, according to a recent survey [8], fewer than 50 different metals and alloy compositions are currently commercialized as atomized powders from about 15 suppliers and are processed in AM at various technology readiness levels. Moreover, the selection of the optimal alloy for fabrication purposes is not straightforward, because the research is still on-going and because materials and processes in AM are interdependent [9]. As a consequence, a gap still exists between the range of materials that are ready to use in AM industry in comparison with conventional casting and forging processes.
Generally speaking, the assessment of part quality for components produced by means of AM is still the object of intensive debate in the literature [10], although the American Society for Testing and Materials International (ASTM) is publishing specific technical standards [11,12]. Moreover, the behavior of L-PBF components in service conditions must be improved further to support the widespread diffusion of this technique. In particular, very few contributions have been dedicated so far to the systematic investigation of the fatigue behavior of L-PBF components under cyclic loading [13,14,15,16,17,18,19]. Another hurdle to face is the relatively poor surface quality of L-PBF parts. In fact, the staircase effect that derives from the layer-wise build-up strategy and the presence of satellite particles that adhere to the surface of L-PBF usually result in a high surface roughness [20]. The surface quality is influenced by the size and shape of the feedstock particles, as well as by numerous processing parameters including energy density, building orientation and layer thickness. Also hatching distance, scan pattern and re-melting strategies, and even gravity may affect the surface quality [21,22,23]. Although it is possible to improve the surface finish through the appropriate choice of starting powder and processing conditions, the surface roughness of as-built parts is usually in the 25–35 μm range [20]. Surface finishing treatments are therefore required to allow for correct operation conditions and more reliable fatigue behavior. However, conventional tooling-based surface finishing methods and post-processing treatments are incompatible with AM parts. In fact, the geometric complexity that is typical of AM demands for contactless processes [24]. In this paper, numerous surface finishing treatments are systematically compared to assess their effects on surface roughness and fatigue behavior of A357.0 parts produced by L-PBF. As a comprehensive retrospect of a wide research activity [18,19,25], the present contribution takes into consideration:
- Laser shock processing
- Plastic media blasting
- Sand blasting
- Ceramic shot peening
- Metal shot peening with small steel particles
- Metal shot peening with large steel particles
Unlike heat treatments that are intended to modify the volume microstructure of the built part to change its properties [26,27], laser shock processing, surface blasting and shot peening are specifically designed to be surface finishing methods. In fact, they improve the surface roughness and, at the same time, they are known to induce surface compressive stresses that ameliorate the performance and prolong the life of critical components [28]. As an additional advantage, laser shock processing, surface blasting and shot peening were chosen because they are all contactless methods. Although they cannot be applied to internal cavities such as conformal channels, they have no geometry limitations and therefore they are well suited to treat AM parts.
In laser shock processing, samples are wrapped and surrounded by a transparent layer (often immersed in water). A laser beam scans the surface passing through the transparent layer. As a consequence, the surface is heated and instantaneously vaporized. Subsequently, a plasma plume is generated due to vapor ionization and heating, while the remaining laser beam radiation is additionally absorbed. When the plasma tries to expand, it remains entrapped between the surface and the transparent layer. This creates a high surface pressure and ultimately a shock wave that propagates into the material and deforms it plastically. At the same time, a thin surface layer is heated to very high temperature due to fast heat transfer. The combined action of the plastic deformation caused by the shock wave and of the superficial heat-up is expected to impose compressive residual stress to a depth of some hundreds of microns [19,29]. According to recent studies, besides creating a beneficial compressive stress state, laser shock processing is thought to help closing the pores near the surface of AM aluminum alloys (AlSi10Mg) [30].
Plastic media blasting, originally proposed to substitute methylene chloride paint stripping in the aerospace industry, uses soft and angular plastic particles as the blasting medium [31]. The basic advantage of plastic media blasting is that soft particles pneumatically applied at low pressure (typically 1.4–2.8 bar) can remove the external surface layer without interfering with the underlying material, even if the substrate is a relatively delicate material such as aluminum. Since the part is not deformed and warped, geometric constraints can be easily respected [32]. During sand blasting, fine and irregular ceramic particles hit the surface of the metal part at high velocity under controlled conditions. Sand blasting is applied not just to ameliorate the surface finish, but also to improve the fatigue life of metal workpieces. In fact, the important near-surface plastic deformation that is caused by sand blasting is responsible for work hardening and for developing compressive residual stresses [33]. As far as shot peening is concerned, ceramic or metal particles strike the metal part and create multiple, partly overlapped dimples. The repeated impact of the impinging medium causes sturdy compressive stresses, as high as 600 MPa [15], that improve fatigue behavior and corrosion resistance [34]. Although optimizing the shot peening parameters to control the residual stress intensity and distribution, shot peening is already the most popular surface treatment for metal parts produced by means of the PBF technique [35].
2. Materials and Methods
2.1. L-PBF Conditions
A357.0 (also known as A357 or A13570, although A357.0 is the official designation for this alloy recommended by the Aluminum Association—American National Standards Institute, AA-ANSI [36] was used to build the samples and to test the effect of surface finishing on roughness and fatigue behavior. The samples were produced on an X Line 2000R Concept Laser equipment (Concept Laser GmbH, Lichtenfels, Germany) according to the set of parameters listed in Table 1, which correspond to the optimized processing conditions to minimize microstructural defects and residual pores in the finished part, as described in preliminary investigations [18,19,25]. A stripes scan strategy was used for the core, while two contour passes were applied to the skin. The baseplate was pre-heated to 200 °C in order to cause an in situ aging effect that reduced the anisotropy of the finished part and to diminish the residual stress state by slowing the cooling rate [14,37]. As shown in Figure 1, the geometry of the samples complied with the prescriptions of UNI EN 3987:2010 standard [38] and the orientation was kept parallel to the growth direction (Z axis), which is considered the most challenging condition for fatigue resistance [39].
2.2. Surface Finishing
The surface finishing methods applied to the A357.0 parts before fatigue testing were:
- Laser shock processing: as detailed in a previous contribution [19], each sample was treated singularly and the main axis on the laser shock processing equipment was kept parallel to the Z axis so as to control the rotation properly, thus ensuring a complete and uniform treatment of the surface;
- Plastic media blasting: pressure: 3 bar, distance: 0.3 m, medium: thermoset urea formaldehyde particles (MIL-P-85891A, Type II), density 1.47–1.52 g/cm3 [40];
- Sand blasting: pressure: 3 bar, distance: 0.3 m, medium: Zirblast ceramic particles (composition: ZrO2 60–70%, SiO2 28–33%, Al2O3 < 10%)(SEPR Saint-Gobain ZirPro, Le Pontet Cedex, France), density 3.85 g/cm3 [41];
- Metal shot peening (small particles): medium: steel S70 particles, ϕ = 0.2 mm, 4–6 Almen A;
- Metal shot peening (large particles): medium: steel S170 particles, ϕ = 0.4 mm, 8–10 Almen A.
The surface coverage, which represents the extent of the original surface area that is obliterated by dents, was 200% for plastic media blasting and for sand blasting, as well as for ceramic and metal shot peening.
All the surface finishing processes were performed on A357.0 parts produced according to the same parameters previously listed in Section 2.1 in order to have comparative results. In fact, all the as-built parts were analogous and therefore the differences observed on the surface finished parts were due only to the surface finishing treatments.
2.3. Measurement of Surface Roughness and Observation at the Scanning Electron Microscope
The surface roughness was measured on the as-built samples and on the surface treated ones according to ISO 25178-603:2013 [44] using a Nikon LV 150 Confovis Microscope equipment(Nikon, Tokyo, Japan). The following conditions were applied:
- 20X microscopy objective;
- 0.595 µm lateral resolution, 10 nm vertical quantization and automatic field stitching;
- Scanned area of 0.5 mm × 1.5 mm;
- Three samples for each kind of material
- Map form removal, GAUSS filter ISO 16610-21:2011 [45] with a cut off of 2.5 µm × 2.5 µm, and bilateral symmetric threshold filtering (for the removal of spikes).
- Potential hurdles that may derive from the high reflectivity of Al alloys [1] were tackled by applying a double exposure procedure at each site.
Maps were acquired on 0.5 mm × 1.5 mm areas. In order to verify the consistency of the surface features, three samples were considered for each group and a surface map was scanned on each of them. The results were highly repeatable for the single groups as the deviation across different samples of the same group was comparable to the deviation within each map. Since it was not possible to scan exactly the same areas before and after surface finishing, as-built parts were also analyzed in order to have a term of comparison.
Following the prescriptions of ISO 25178-603:2013 [44], the maps were processed to determine the average surface roughness (Sa), the surface kurtosis (Sku, which is representative of the sharpness of the roughness profile), the surface skewness (Ssk) and the Abbott-Firestone curve to define the reduced peak height (Spk) and the reduced valley depth (Svk). Due to its popularity in industrial practice, Ra was determined based on five profiles extracted along the build direction according to UNI EN ISO 4287:2009 [46]. However, besides Ra, areal parameters were considered because they provide a more robust description of the surface features of AM parts. Moreover, multiple surface parameters were calculated in order to obtain an appropriate description of the surface properties of the parts, because a single value brings about a limited amount of information, which is not sufficient to characterize the surface of AM components [21].
According to the definitions provided by ISO 25178-2:2012 [47], the surface characterization was complemented by the calculation of the texture aspect ratio (Str) and of the texture direction (Std). Str spans between 0 and 1 and gives information about the isotropy of the surface features. As the value of Str approaches 1, the surface is increasingly isotropic. Std expresses the preferential direction of the surface features. In the present contribution, the vertical axis (namely the build direction) was considered as the reference axis to determine Std.
The external surface, before and after finishing, was also directly observed under a scanning electron microscope, SEM (ESEM, Quanta FEI, Eindhoven, The Netherlands), operated in high vacuum mode.
2.4. Axial Fatigue Tests
Axial fatigue tests to draw the stress-number of cycles (S–N) curves were conducted on an MTS 858 Mini Bionix II (MTS Systems Corp., Eden Prairie, MN, USA). The tests were performed according to the UNI EN 3987:2010 standard [38], which includes detailed instructions about the initial peak stress level, the subsequent changes of the maximum stress level and the minimum number of experimental points. The endurance limit was fixed to 2 × 10⁶ cycles for all samples, as-built and surface finished. The UNI EN 3987:2010 standard [38] imposes that the initial peak level for fatigue testing must be defined according to the results of a preliminary tensile test. The outcomes of these static tests were fully described in a previous paper [25]. Based on the results of the tensile tests, the initial peak stress level for the fatigue tests was set to 190 MPa, and this value was reduced to 150 MPa for the subsequent test and then progressively lowered by a step of 20 MPa until the endurance limit was reached (Table 2). In order to accomplish with the guidelines of UNI EN 3987:2010 [38] to draw the Wohler curve by using the minimum number of test pieces, at least 15 samples were considered for each group. As long as the standard does not specify the minimum number of samples that should be tested for each stress level, at least two samples of each group were cycled at each stress level in order to obtain average data. The fatigue tests were conducted in air at room temperature. The fatigue behavior of as-built parts was considered as a term of comparison [18].
2.5. Fractography and Cross Sectional Observation
For each kind of material, the fracture surface of both samples that had failed under the maximum stress level of 110 MPa was observed with the scanning electron microscope, SEM (ESEM, Quanta FEI, Eindhoven, The Netherlands), operated in high vacuum mode. These samples were considered for the SEM analysis because 110 MPa was the lowest value of the maximum stress level that caused all the specimens to fail before reaching the endurance limit of 2 × 10⁶ cycles.
In order to obtain additional information about the microstructure of the samples before and after surface finishing, one specimen for each kind of material was cut normal to the growth direction and the cut surface (parallel to the powder bed) was polished and etched with the Dix-Keller reactant (HF 2% vol, HCl 1.5% vol, HNO3 2.5% vol; water bal.). Metallurgical structures at the sub-surface zone were investigates by a Nova NanoSEM 450 FEG-SEM (FEI, ThermoFisher Scientific, Eindhoven, The Netherland) in immersion lens mode.
3. Results and Discussion
3.1. Surface Maps
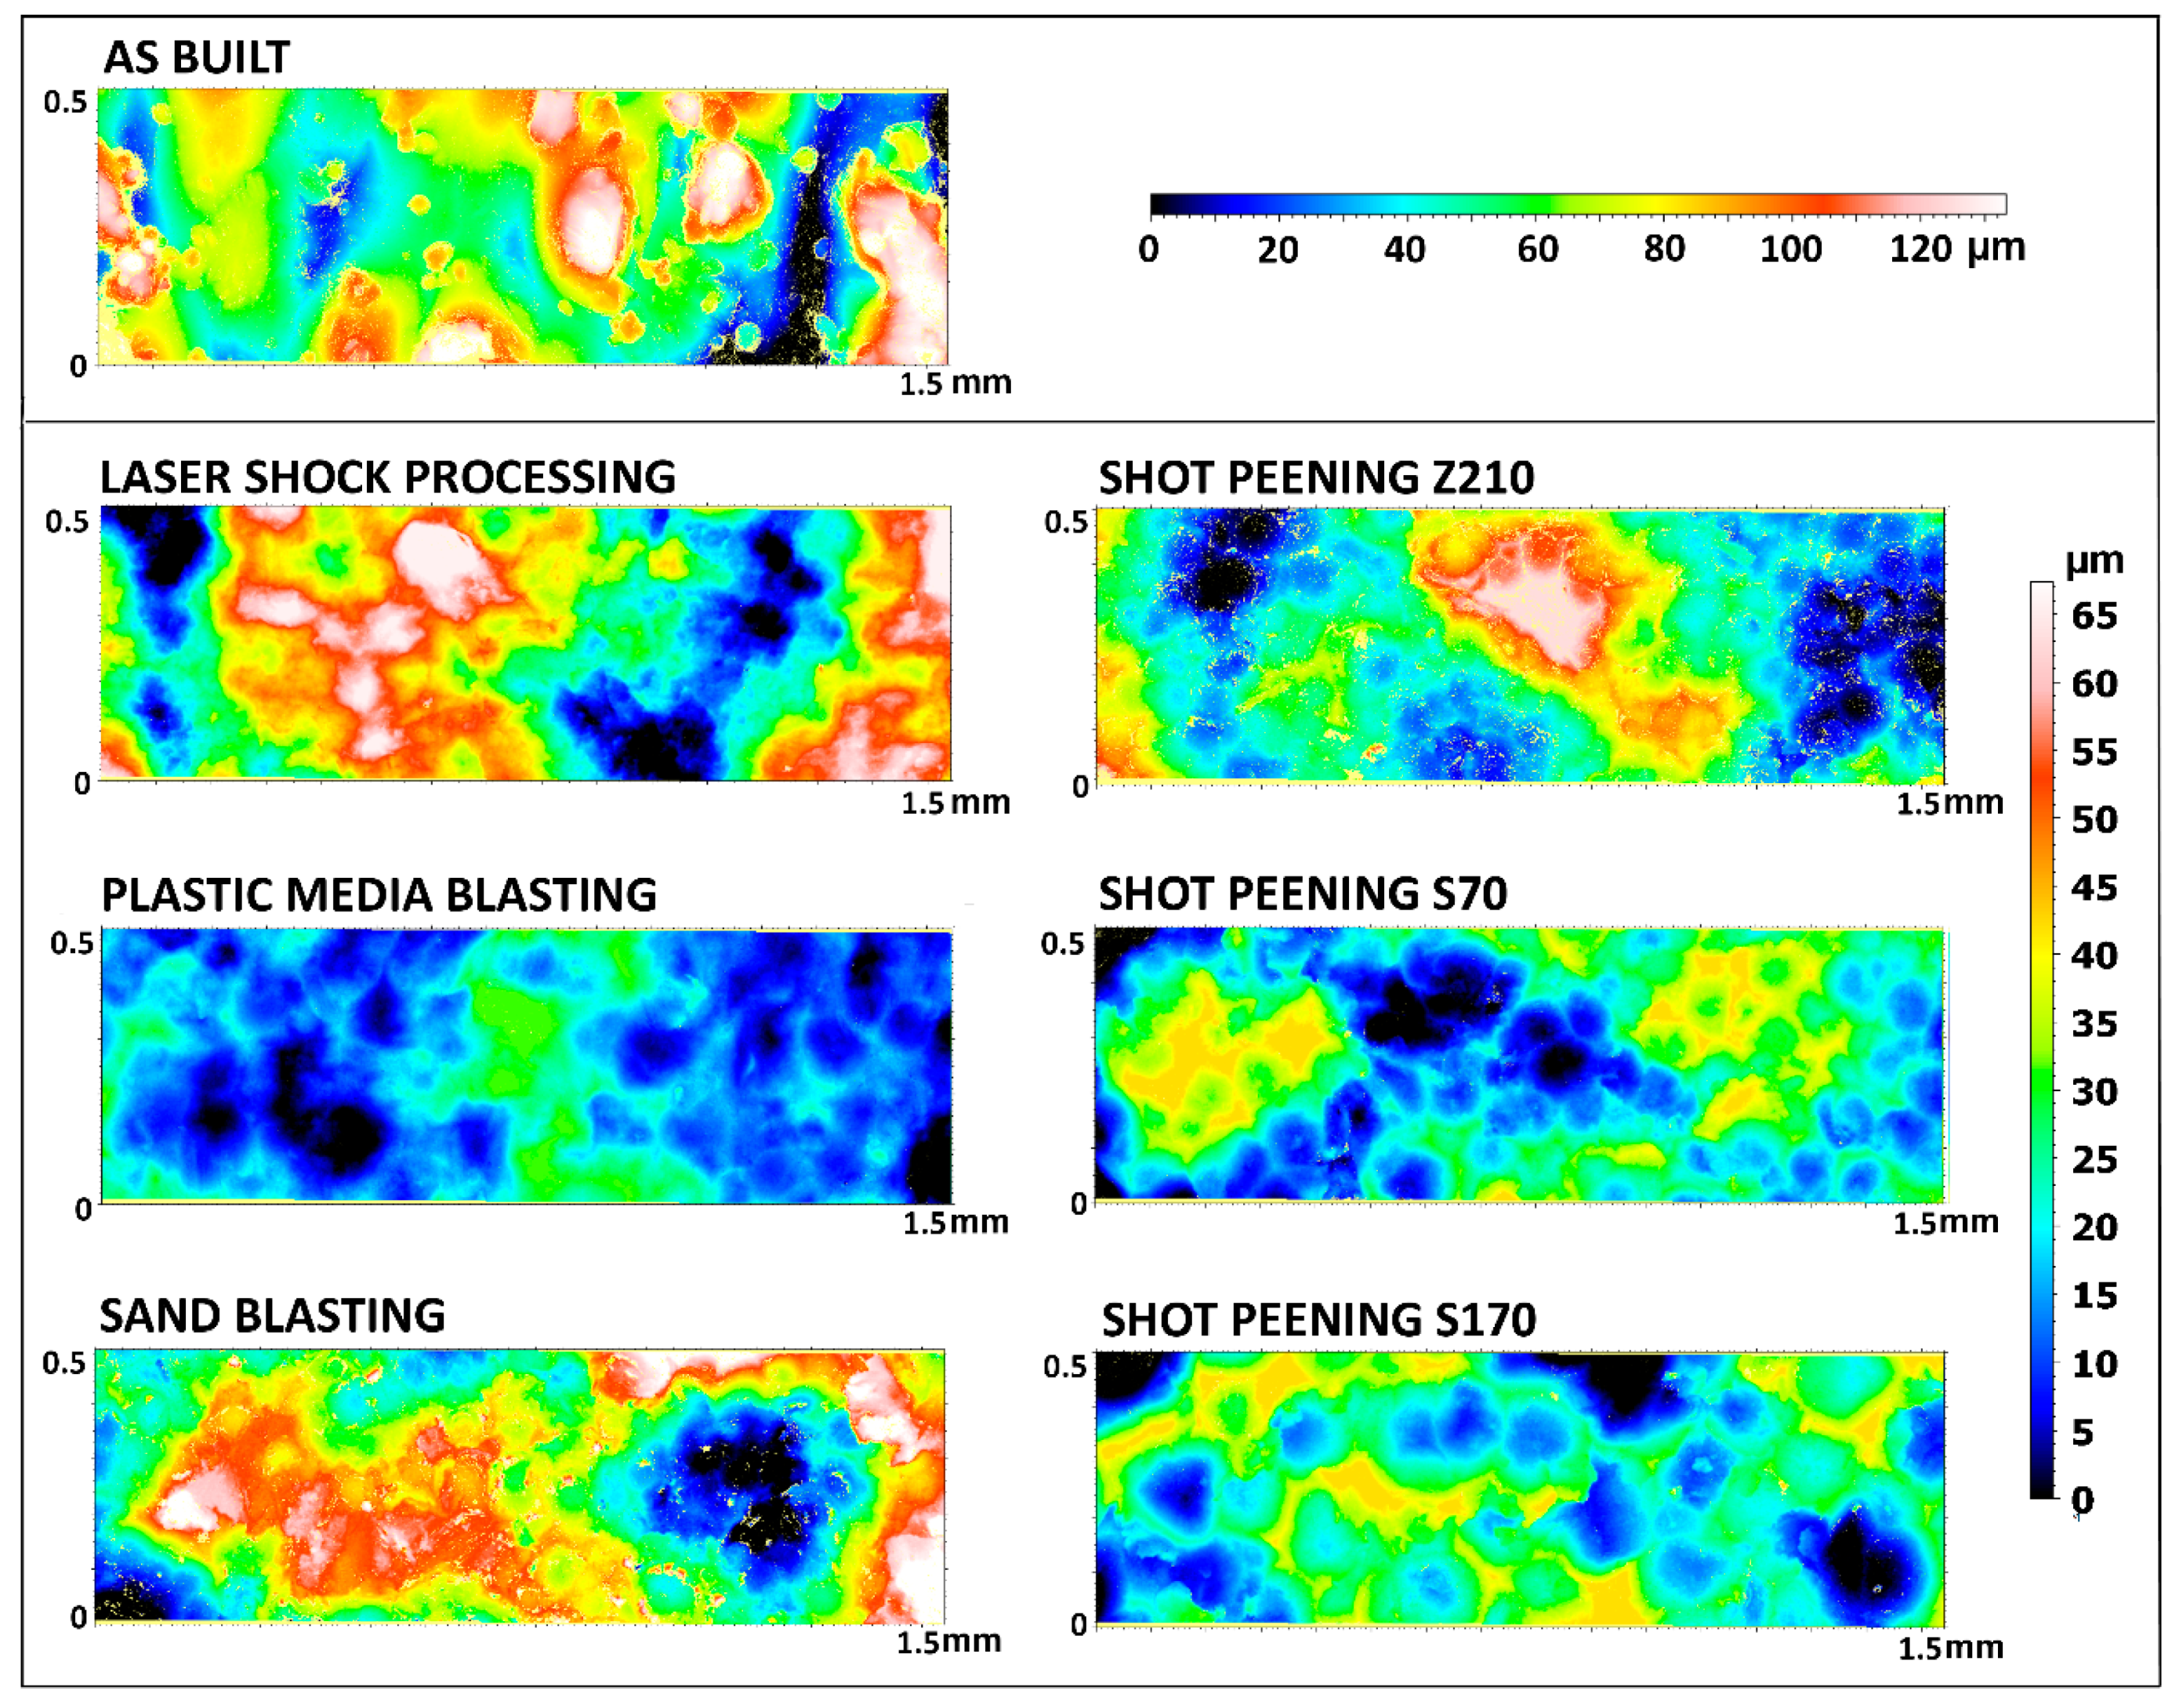
Figure 2 compares the false color views of the surface height maps of the as-built sample and of the surface finished ones. The surface of the as-built part was the only one that clearly showed satellites and weakly joined particles, which are typical of L-PBF processing [13]. These protruding particles were removed as a consequence of surface finishing and this contributed to a substantial decrease in surface roughness, as further discussed in Section 3.2. Steel shot peening, independently of the size of the medium, removed or crushed the top of satellite particles, which created hemispherical marks. The action of ceramic shot peening was more complicated, since the removal of satellite particles and the plastic deformation previously seen for metal shot peening were also accompanied by abrasion. After laser shock processing, a wavy pattern could be detected as a consequence of the propagation of pressure waves, whereas the surface was extremely flat, without obvious marks, after plastic media blasting.
3.2. Surface Roughness Parameters
The results of the measurement of the surface roughness for the as-built samples and the surface finished ones are listed in Table 3. All the surface finishing methods significantly reduced the average surface roughness, Sa, with respect to the as-built condition. The reduction was indeed as high as −77% for plastic media blasting. The reduction was about −46% for ceramic sand blasting and −51% for ceramic shot peening and between −65% up to −69% for metal shot peening. The lowest reduction of Sa, namely −42%, was observed instead for laser shock processing. However, laser shock processing was very effective to decrease the reduced peak height, Spk, and the reduced valley depth, Svk. Spk is a very important surface parameter, because it deeply affects abrasive wear resistance [48]. Under this respect, the least effective treatment was ceramic shot peening that reduced Spk by about −55%, whereas plastic media blasting ameliorated Spk by about −86%. Skewness, Ssk, is negative if a distribution has a long flat tail for smaller values. In other words, a surface has a negative skewness (Ssk < 0) if valley structures are predominant; otherwise, if peak structures are predominant, skewness is positive (Ssk > 0). Interestingly, ceramic shot peening decreased the Sa value but increased the Ssk value with respect to the as-built sample. In fact, the combined action of ceramic abrasion, local plastic deformation and partial removal of satellite particles (where a “satellite particle” is a weakly joined particle with a small area joined to the surface) greatly decreased the surface roughness and even produced a new “zero” surface from which the residual abraded and deformed particles emerged. Ceramic sand blasting, S170 steel shot peening and laser shock processing caused instead a negative Ssk. In fact, ceramic sand blasting and S170 steel shot peening imprinted hemispherical impact marks on the surface of the A357.0 parts, which implied the predominance of valleys. In turn, laser shock processing determined the vaporization of the surface peaks and, accordingly, a predominance of valleys. Kurtosis of the areal surface (Sku) is lower than 3 when the surface distribution has a shorter and flatter peak than the standard distribution. In this comparative analysis, the Kurtosis of the areal surface was lower than 3 (Sku < 3) for all the tested samples, before and after surface finishing. This result is consistent with the surface morphology of L-PBF parts, which typically present a smooth solidified surface with spherical particles joined to it [1]. Skewness and Kurtosis are often considered as inadequate indicators to describe corrugated surfaces [49]. Nonetheless, they are effective to characterize blasted surfaces and to offer complementary information to correctly interpret the Sa value. Table 3 also reports the average profile roughness Ra. Although this value is less representative than areal parameters to describe the surface features of AM parts, it was also included in the calculations due to its widespread usage in industry. As already seen for Sa, also Ra was substantially lowered after surface finishing, with a remarkable reduction of −74% after plastic media blasting and a decrease between −58% and −65% for all the other finishing treatments.
Each polar spectrum graph in Figure 3 is based on the Fourier spectrum of the corresponding surface. The Fourier spectrum of a surface represents the energy content of each spatial frequency on that surface. For each direction, the amplitudes of the spatial frequency along the radius can be integrated between two selected values, fmin and fmax, in order to calculate a parameter that expresses the spatial frequency content in that direction. The repetition of this operation for all angles between 0° and 180° generates a polar spectrum like those in Figure 3. The maximum value of the polar spectrum graph identifies the main texture direction, Std (which is given in degrees, between 0° and 180°) [50]. As shown in Table 4, the value of the texture aspect ratio, Str, of the as-built material was relatively low as a consequence of the layered morphology that derives from the layer-wise build up mechanism. The maximum value in the polar spectrum graph in Figure 3A confirmed that the main texture direction coincided with the orientation of the layers [50]. The Str values calculated for the surface treated samples in Figure 3B–G were still very similar to the reference datum of the as-built material, thus suggesting that, apart from sand blasting, a surface texture could be observed also after finishing.
The results of the surface analysis were substantially confirmed by the direct SEM observation, as exemplified by the images in Figure 4. Whereas plastic media blasting produced a very smooth surface finish (Figure 4C), impact marks could be easily recognized on the surfaces treated by sand blasting (Figure 4D) and by ceramic shot peening (Figure 4E). Metal shot peening, independently of the size of the media, produced scaly and flaking surfaces (Figure 4F,G). A wavy morphology was instead typical of laser shock processing (Figure 4B).
3.3. Fatigue Strength
Figure 5 compares the complete S–N curves and Table 5 reports the maximum stress level that corresponds to the achievement of the endurance limit of 2 × 10⁶ cycles for the as-built samples and the surface finished ones. All the samples were cycled along the growth direction that is usually considered the worst condition due to the layer-wise build-up strategy of L-BPF. As a consequence, the fatigue strength measured in the present research can be considered as a conservative result [51,52,53]. Although comparing the experimental results to the fatigue data currently available in the literature is not straightforward because different geometries and loading conditions are applied in different researches, the fatigue performance of the as-built A357.0 parts was comparable to that of AlSi10Mg [13,39]. Based on the Wohler diagram published by Mower and Long [39], in fact, a peak stress level of about 80 MPa led to fatigue failure after 7 × 10⁵ cycles and the fatigue life of 1 × 10⁷ cycles was measured at about 55 MPa for AlSi10Mg parts axially tested in fully reversed rotating mode. According to Mower and Long [39], the fatigue behavior was not improved after surface finishing as long as surface finishing reduced the surface roughness, but also opened sub-superficial pores and defects. In the present contribution, instead, all the surface finishing methods increased the infinite fatigue life with an improvement of +40% for laser shock processing and for S70 metal shot peening and of +80% for plastic media blasting, sand blasting, ceramic shot peening and S170 metal shot peening. Quite interestingly, sand blasting and ceramic shot peening did not produce the best surface finish (Table 3) and yet they were very effective to increase the value of σmax corresponding to the endurance limit (+80%, Table 5). Generally speaking, these data support the idea that the best surface finishing conditions do not necessarily imply the best fatigue performance. Coherently with the remarks of Aboulkhair et al. [13], it is plausible that the role of surface quality on fatigue behavior of aluminum-based parts produced by L-PBF has been overestimated in the available literature. In fact, since the surface of as-built parts is very heterogeneous (Figure 2a and Figure 4a), surface finishing is effective to reduce the surface roughness but not to remove all the micro-defects and notches that may generate cracks. However, after crack initiation, the crack propagation is deeply affected by the stress state that is induced by surface finishing. This implies that multiple mechanisms may be active besides surface defects removal. For example, surface finishing may useful to retard the propagation of cracks by inducing a compressive residual stress state. Uzan et al. [17] studied the consequences of mechanical and electrolytic polishing after shot peening on AlSi10Mg parts. As a first result, the Uzan et al. [17] observed a relevant improvement in fatigue resistance after shot peening that derived from strain hardening and development of compressive stresses in the sub-surface area. Usually L-PBF implies fast cooling rates and localized thermal gradients that impart complicated residual stresses to the finished part [54]. However, since Uzan et al. [17] had thermally treated their samples at 300 °C for 2 h after processing, the residual stresses observed in the surface finished components were directly attributable to shot peening. In the present contribution, no thermal relieve was performed post-processing, however the baseplate was pre-heated to 200 °C to minimize the residual stresses caused by L-PBF and therefore the residual stresses in the finished parts were mainly originated by surface finishing. The second result reported by Uzan et al. [17] was that an additional treatment by mechanical or electrolytic polishing sensibly reduced the surface roughness but slightly increased the fatigue behavior, thus confirming the conclusion that residual stresses affect the fatigue behavior more than surface quality does.
The role of residual stresses also justifies the different efficacy of S70 and S170 steel shot peening on the fatigue strength. In fact, as previously mentioned (Table 5), the maximum stress level (σmax) corresponding to the endurance limit was increased by +40% when using S70 particles (smaller ones, with lower Almen A) and by +80% when using instead S170 particles (larger ones, with higher Almen A). Mehmood et al. [55] observed indeed that larger shots cause stronger residual stresses in the surface layers of shot-peened specimens as compared to smaller ones. However, this may have negative consequences on the fatigue life if residual stresses are excessive [55].
Laser shock processing increased the infinite fatigue life with respect to the as-build parts, but was less effective than the other finishing methods. As discussed in detail by Gatto et al. [19], laser shock processing may cause a dominant shock wave on the material and, for high pulse densities, also thermally induced relaxation [56,57]. In the present contribution, the focal diameter was relatively low (1.5 mm) in order to induce strong compressive stresses. However, according to the results, it seems that having deep compressive stresses is more effective than having stronger residual stresses and, for this reason, a larger spot diameter should be preferred for future optimization studies.
3.4. Fractography and Cross Sectional Observation
Generally speaking, the fracture surface of specimens failed under cyclic loading may be subdivided in three main regions, which correspond to the crack initiation area, to crack propagation area, where the crack propagates at a constant speed, and the final area. The comparison between the broken surface (breakthrough crack) of the as-built sample (Figure 6A) and those of the surface finished ones (Figure 6B–G) shows that the finishing treatments changed the morphology of the external surface and therefore they also changed the triggering point for crack initiation.
However, the first area of the fracture surface had a fan-like shape for all the samples, independently of the external surface condition. In more detail, the crack consistently started from a single point and then diverged in a typical fan-like pattern. The crack was likely to run parallel to the external surface and to undergo a radial bifurcation, with a dramatic impact on fatigue life. Quite often, after surface finishing the starting point was preferentially located at the interface between a crushed or plastically deformed satellite particle and the underlying surface of the sample. The presence of sub-surface defects, such as pores or unmelted particles, is frequently considered as an important reason for crack initiation in L-PBF parts. The problem may be even worsened by surface finishing treatments if a superficial material layer is removed thus opening pores at the skin-core interface [14,55]. However, none of the fracture surfaces observed in this research exhibited this kind of crack initiation. This is the consequence of two concomitant factors. First of all, the processing parameters in Table 1 were optimized to obtain fully dense parts and to minimize the presence of microstructural defects, including sub-superficial ones [25]. Moreover, although satellite particles were obviously detached from the external surface, the surface finishing treatments conducted in the present contribution were designed to induce a plastic deformation of the surface, rather than a massive removal of material. The formation of a thin but continuous layer at the boundary between the external surface and the bulky internal zone of the specimen plays a key role to hinder the crack propagation.
The crack propagation through the second area is controlled by the applied load, by the cross sectional area of the sample and by the intrinsic properties of the material. When the cross sectional area becomes lower than a critical value or the stress intensity factor exceeds the fracture toughness limit or the material strength, the crack propagation enters the third area and depends only on the properties of the material. The SEM observation suggested that the transition from the second area to the third one occurred at a distance of some hundreds of microns from the crack initiation point for all the samples, as-built and surface finished. Moreover, the third area was analogous for all the samples, with a cellular morphology that is characteristic of polyphase materials [58]. In fact, during L-PBF processing the solidification mechanisms in A357.0 result into a cellular-dendritic microstructure, where α-aluminum solidifies first and rejects the excess silicon to precipitate at the cellular boundaries [59]. The hexagonal cells produced by the segregation of silicon are responsible for the development of the dimples (concavities) in the fracture surfaces that can be seen in Figure 7, as already reported in the past for AlSi10Mg parts [16,17,60].
The polished and etched cross sections of the A357.0 parts before and after surface finishing with different methods are compared in Figure 8. As already reported in the literature for this kind of aluminum-based alloy, during processing, as the material cools down, silicon segregates and precipitates into fine particles that surround the columnar α-aluminum phase [61]. The result is a grid of hexagonal cells whose size depends on the location within the melt track, as previously discussed by Trevisan et al. [62]. Based on the micrographs in Figure 8A–F, the metallurgical structure of the sub-surface zone was similar for the as-built samples and the surface finished ones, apart from the workpieces treated by S170 shot peening. In fact, as seen in Figure 8G, it is worth noting that after metal shot peening with S170 particles, which corresponded to the highest Almen A value, the silicon-rich particles experienced a coarsening effect, probably as a consequence of local heating and mechanical strain [13,14,61]. Although additional investigations are required to clarify the existence of any systematic correlation, it should be noted that, in spite of this peculiar microstructure, no negative effects were observed for the fatigue behavior of these samples.
4. Conclusions
The surface quality of as-built workpieces produced by L-PBF is a critical issue, since their high surface roughness may compromise fatigue resistance, aesthetic properties and correct functioning in service conditions. The present contribution proposes a systematic comparison between numerous surface finishing methods, including:
- (1)
- Laser shock processing;
- (2)
- Plastic media blasting;
- (3)
- Sand blasting;
- (4)
- Ceramic shot peening;
- (5)
- Metal shot peening (S70 small steel particles);
- (6)
- Metal shot peening (S170 large steel particles).
The results obtained from fatigue tests and surface characterization can be summarized as follows:
- the best surface finishing conditions were achieved by plastic media blasting, which induced the highest decrease in average surface roughness (Sa, −77% with respect to the as-built surface, values in Table 3), in reduced peak height (Spk, −86%) and in reduced valley depth (Svk, −83%);
- ceramic shot peening lowered the Sa value (−51% with respect to the as-build part) but increased the skewness (Ssk,) value (from 0.204 to 0.533) with respect to the as-built sample due to the combined action of ceramic abrasion, local plastic deformation and partial removal of satellite particles;
- laser shock processing, sand blasting and S170 steel shot peening caused a negative Ssk (−0.137, −0.130 and −0.203, respectively), which implied the predominance of valley structures on the finished surface;
- also Ra was lowered after surface finishing, with an important reduction of −74% after plastic media blasting and a decrease between −58% and −65% for all the other finishing treatments;
- the maximum stress level (σmax) corresponding to the endurance limit of 2 × 10⁶ cycles was 50 MPa for the as-built parts;
- all the surface finishing methods increased the peak stress level corresponding to the endurance limit of 2 × 10⁶ cycles, with an improvement of +40% for laser shock processing and for S70 metal shot peening and of +80% for plastic media blasting, sand blasting, ceramic shot peening and S170 metal shot peening;
- sand blasting and ceramic shot peening did not produce the best surface finishing effect, nonetheless they sensibly increased the peak stress level corresponding to the endurance limit;
- all the acquired data support the hypothesis that multiple mechanisms may be active and that, besides the reduction in surface roughness, also the development of compressive residual stresses is important to improve the fatigue strength of aluminum-based L-PBF parts;
- crack initiation always occurred at the external surface of the as-built and surface finished samples, often at the interface between crushed or deformed satellite particles and the underlying surface;
- the third and last part of the fracture surface presented a cellular morphology typical of polyphase materials for all the samples under exam; this derives from cooling mechanisms in L-PBF manufacturing, where α-aluminum solidifies first and rejects the excess silicon to precipitate at the cellular boundaries.
Author Contributions
L.D. and A.S. equally contributed to conceptualization; methodology; validation; formal analysis; investigation; resources; data curation; writing—original draft preparation; writing—review and editing; project administration.
Funding
This research received no external funding.
Acknowledgments
Grateful acknowledgements are made to Andrea Pasquali, general manager of ZARE Srl (Boretto-RE, Italy), for the technical support and for the construction and surface treatments of the specimens, and to Peen Service (Bologna-BO, Italy), for the technical support and surface treatments of the specimens. José. L. Ocaña is gratefully acknowledged for the laser shock processing operation.
Conflicts of Interest
The authors declare no conflict of interest.
References
- Townsend, A.; Senin, N.; Blunt, L.; Leach, R.K.; Taylor, J.S. Surface texture metrology for metal additive manufacturing: A review. Precis. Eng. 2016, 46, 34–47. [Google Scholar] [CrossRef]
- Yap, C.Y.; Chua, C.K.; Dong, Z.L.; Liu, Z.H.; Zhang, D.Q.; Loh, L.E.; Sing, S.L. Review of selective laser melting: Materials and applications. Appl. Phys. Rev. 2015, 2, 041101. [Google Scholar] [CrossRef]
- Rickenbacher, L.; Spierings, A.; Wegener, K. An integrated cost-model for selective laser melting (SLM). Rapid Prototyp. J. 2013, 19, 208–214. [Google Scholar] [CrossRef]
- Zhai, Y.; Lados, D.A.; Lagoy, J.L. Additive manufacturing: Making imagination the major limitation. JOM 2014, 66, 808–816. [Google Scholar] [CrossRef]
- Oerlikon. Additive Manufacturing. The Next Industrial Revolution. Factsheet II. 2017. Available online: https://www.google.com/url?sa=t&rct=j&q=&esrc=s&source=web&cd=1&cad=rja&uact=8 &ved=2ahUKEwiG0cnNkuTjAhVMJlAKHdd-AY0QFjAAegQIARAC&url=https%3A%2F%2Fwww.oerlikon.com%2Fecoma%2Ffiles%2FOerlikon-AMFactsheet_II.pdf%3Fdownload%3D1&usg=AOvVaw0Rc5hTez5OO9RZX_UXb8ia (accessed on 28 November 2019).
- Yu, W.H.; Sing, S.L.; Chua, C.K.; Kuo, C.N.; Tian, X.L. Particle-reinforced metal matrix nanocomposites fabricated by selective laser melting: A state of the art review. Prog. Mater. Sci. 2019, 104, 330–379. [Google Scholar] [CrossRef]
- Dadbakhsh, S.; Mertens, R.; Hao, L.; Van Humbeeck, J.; Kruth, J.-P. Selective laser melting to manufacture “in situ” metal matrix composites: A review. Adv. Eng. Mater. 2019, 21, 1801244. [Google Scholar] [CrossRef]
- Gorsse, S.; Hutchinson, C.; Gouné, M.; Banerjee, R. Additive manufacturing of metals: A brief review of the characteristic microstructures and properties of steels, Ti-6Al-4V and high-entropy alloys. Sci. Technol. Adv. Mater. 2017, 18, 584–610. [Google Scholar] [CrossRef]
- Niu, X.; Singh, S.; Garg, A.; Singh, H.; Panda, B.; Peng, X.; Zhang, Q. Review of materials used in laser-aided additive manufacturing processes to produce metallic products. Front. Mech. Eng. 2019, 14, 282–298. [Google Scholar] [CrossRef]
- Minetola, P.; Iuliano, L.; Marchaindi, G. Benchmarking of FDM machines through part quality using IT grades. Procedia CIRP 2016, 41, 1027–1032. [Google Scholar] [CrossRef]
- ASTM F3303-18. Standard for Additive Manufacturing—Process Characteristics and Performance: Practice for Metal Powder Bed Fusion Process to Meet Critical Applications; ASTM International: West Conshohocken, PA, USA, 2018. [Google Scholar]
- ASTM F3318-18. Standard for Additive Manufacturing—Finished Part Properties—Specification for AlSi10Mg with Powder Bed Fusion—Laser Beam; ASTM International: West Conshohocken, PA, USA, 2018. [Google Scholar]
- Aboulkhair, N.T.; Maskery, I.; Tuck, C.; Ashcroft, I.; Everitt, N.M. Improving the fatigue behaviour of a selectively laser melted aluminium alloy: Influence of heat treatment and surface quality. Mater. Des. 2016, 104, 174–182. [Google Scholar] [CrossRef]
- Brandl, E.; Heckenberger, U.; Holzinger, V.; Buchbinder, D. Additive manufactured AlSi10Mg samples using Selective Laser Melting (SLM): Microstructure, high cycle fatigue, and fracture behavior. Mater. Des. 2012, 34, 159–169. [Google Scholar] [CrossRef]
- Sanz, C.; García Navas, V. Structural integrity of direct metal laser sintered parts subjected to thermal and finishing treatments. J. Mater. Process. Technol. 2013, 213, 2126–2136. [Google Scholar] [CrossRef]
- Uzan, N.E.; Shneck, R.; Yeheskel, O.; Frage, N. Fatigue of AlSi10Mg specimens fabricated by additive manufacturing selective laser melting (AM-SLM). Mater. Sci. Eng. A 2017, 704, 229–237. [Google Scholar] [CrossRef]
- Uzan, N.E.; Ramati, S.; Shneck, R.; Frage, N.; Yeheskel, O. On the effect of shot-peening on fatigue resistance of AlSi10Mg specimens fabricated by additive manufacturing using selective laser melting (AM-SLM). Addit. Manuf. 2018, 21, 458–464. [Google Scholar] [CrossRef]
- Bassoli, E.; Denti, L.; Comin, A.; Sola, A.; Tognoli, E. Fatigue behavior of as-built L-PBF A357.0 parts. Metals 2018, 8, 634. [Google Scholar] [CrossRef]
- Gatto, A.; Bassoli, E.; Denti, L.; Sola, A.; Tognoli, E.; Comin, A.; Porro, J.A.; Cordovilla, F.; Angulo, I.; Ocaña, J.L. Effect of three different finishing processes on the surface morphology and fatigue life of A357.0 parts produced by laser-based powder bed fusion. Adv. Eng. Mater. 2019, 21, 1801357. [Google Scholar] [CrossRef]
- Bhavar, V.; Kattire, P.; Patil, V.; Khot, S.; Gujar, K.; Singh, R. A review on powder bed fusion technology of metal additive manufacturing. In Proceedings of the 4th International Conference and Exhibition on Additive Manufacturing Technologies, Bangalore, India, 1–2 September 2014. [Google Scholar]
- Lou, S.; Jiang, X.; Sun, W.; Zeng, W.; Pagani, L.; Scott, P.J. Characterisation methods for powder bed fusion processed surface topography. Precis. Eng. 2019, 57, 1–15. [Google Scholar] [CrossRef]
- Yu, W.; Sing, S.L.; Chua, C.K.; Tian, X. Influence of re-melting on surface roughness and porosity of AlSi10Mg parts fabricated by selective laser melting. J. Alloys Compd. 2019, 792, 574–581. [Google Scholar] [CrossRef]
- Charles, A.; Elkaseer, A.; Thijs, L.; Hagenmeyer, V.; Scholz, S. Effect of process parameters on the generated surface roughness of down-facing surfaces in selective laser melting. Appl. Sci. 2019, 9, 1256. [Google Scholar] [CrossRef]
- Calignano, F.; Denti, L.; Bassoli, E.; Gatto, A.; Iuliano, L. Studies on electrodischarge drilling of an Al2O3–TiC composite. The International J. Adv. Manuf. Technol. 2013, 66, 1757–1768. [Google Scholar] [CrossRef]
- Denti, L. Additive manufactured A357.0 samples using the laser powder bed fusion technique: Shear and tensile. Metals 2018, 8, 670. [Google Scholar] [CrossRef]
- Sing, S.L.; Huang, S.; Yeong, W.Y. Effect of solution heat treatment on microstructure and mechanical properties of laser powder bed fusion produced cobalt-28chromium-6molybdenum. Mater. Sci. Eng. A 2020, 769, 138511. [Google Scholar] [CrossRef]
- Li, J.; Zhao, Z.; Bai, P.; Qu, H.; Liu, B.; Li, L.; Wu, L.; Guan, R.; Guo, Z. Microstructural evolution and mechanical properties of IN718 alloy fabricated by selective laser melting following different heat treatments. J. Alloys Compd. 2019, 772, 861–870. [Google Scholar] [CrossRef]
- Kulekci, M.K.; Esme, U. Critical analysis of processes and apparatus for industrial surface peening technologies. Int. J. Adv. Manuf. Technol. 2014, 74, 1551–1565. [Google Scholar] [CrossRef]
- Rozmus, M.; Rusiński, J.; Blicharski, M.; Marczak, J. Laser shock peening of a Ti6Al4V titanium alloy. Arch. Metall. Mater. 2009, 54, 665–670. [Google Scholar]
- Du Plessis, A.; Glaser, D.; Moller, H.; Mathe, N.; Tshabalala, L.; Mfusi, B.; Mostert, R. Pore closure effect of laser shock peening of additively manufactured AlSi10Mg. 3D Print. Addit. Manuf. 2019, 6, 245–252. [Google Scholar] [CrossRef]
- Abbott, K.E. Dry media blasting for the removal of paint coatings on aerospace surfaces. Met. Finish. 1996, 94, 33–35. [Google Scholar] [CrossRef]
- Nudelman, A.K.; Abbott, K. Plastic media blasting. Met. Finish. 1999, 9, 472–474, 476–480. [Google Scholar] [CrossRef]
- Fedoryszyn, A.; Zyzak, P. Characteristics of the outer surface layer in casts subjected to shot blasting treatment. Arch. Metall. Mater. 2010, 55, 813–818. [Google Scholar]
- Wang, Z.-Y.; Wang, Q.-Y.; Cao, M. Experimental study on fatigue behaviour of shot-peened open-hole steel plates. Materials 2017, 10, 996. [Google Scholar] [CrossRef]
- AlMangour, B.; Yang, J.-M. Improving the surface quality and mechanical properties by shot-peening of 17-4 stainless steel fabricated by additive manufacturing. Mater. Des. 2016, 110, 914–924. [Google Scholar] [CrossRef]
- Kaufman, J.G. Understanding wrought and cast aluminum alloy designations. In Introduction to Aluminum Alloys and Tempers; ASM International: Materials Park, OH, USA, 2000; Chapter 3; pp. 23–37. [Google Scholar]
- Aversa, A.; Lorusso, M.; Trevisan, F.; Ambrosio, E.P.; Calignano, F.; Manfredi, D.; Biamino, S.; Fino, P.; Lombardi, M.; Pavese, M. Effect of process and post-process conditions on the mechanical properties of an A357 alloy produced via laser powder bed fusion. Metals 2017, 8, 68. [Google Scholar] [CrossRef]
- UNI EN 3987:2010. Aerospace Series—Test Methods for Metallic Materials—Constant Amplitude Force-Controlled High Cycle Fatigue Testing; European Committee for Standardization: Brussels, Belgium, 2010. [Google Scholar]
- Mower, T.M.; Long, M.J. Mechanical behavior of additive manufactured, powder-bed laser-fused materials. Mater. Sci. Eng. A 2016, 651, 198–213. [Google Scholar] [CrossRef]
- Sinplast Melamina, Technical Data Sheet. Available online: http://silcotorino.it/graniglia_plastica/ (accessed on 28 November 2019).
- Zirblast® Ceramic Sand, Saint-Gobain, Technical Data Sheet. Available online: https://www.zirpro.com/sites/imdf.zirpro.com/files/zirpro-tds-zirblast-blasting_media-201204-e.pdf (accessed on 28 November 2019).
- Zirshot® Ceramic Beads, Saint-Gobain, Technical Data Sheet. Available online: https://www.zirpro.com/sites/imdf.zirpro.com/files/zirpro-tds-zirshot-ceramic_shots-201204-e.pdf (accessed on 28 November 2019).
- Champaign, J. Shot Peening Intensity Measurement. The Shot Peener. Winter. 1992/93. Volume 6, pp. 1–6. Available online: https://www.shotpeener.com/library/pdf/1992082.pdf (accessed on 28 November 2019).
- ISO 25178-603:2013. Geometrical Product Specifications (GPS)—Surface Texture: Areal—Part 603: Nominal Characteristics of Non-Contact (Phase-Shifting Interferometric Microscopy) Instruments; International Organization for Standardization: Geneva, Switzerland, 2013. [Google Scholar]
- ISO 16610-21:2011. Geometrical Product Specifications (GPS)—Filtration—Part 21: Linear Profile Filters: Gaussian Filters; International Organization for Standardization: Geneva, Switzerland, 2011. [Google Scholar]
- UNI EN ISO 4287:2009. European Committee for Standardization. Geometrical Product Specifications (GPS)—Surface Texture: Profile Method—Terms, Definitions and Surface Texture Parameters; European Committee for Standardization: Brussels, Belgium, 2009. [Google Scholar]
- ISO 25178-2:2012. Geometrical Product Specifications (GPS)—Surface Texture: Areal—Part 2: Terms, Definitions and Surface Texture Parameters; International Organization for Standardization: Geneva, Switzerland, 2012. [Google Scholar]
- Grzesik, W. Prediction of the functional performance of machined components based on surface topography: State of the art. J. Mater. Eng. Perform. 2016, 25, 4460–4468. [Google Scholar] [CrossRef] [Green Version]
- Downey, T.J.G.; Martin, P.; Sedlaček, M.; Beaulieu, L.Y. A computational analysis of the application of skewness and kurtosis to corrugated and abraded surfaces. Q. Phys. Rev. 2017, 3, 1–9. [Google Scholar]
- Blateyron, F. The areal field parameters. In Characterisation of Areal Surface Texture; Leach, R., Ed.; Springer Science & Business Media; Springer: Berlin/Heidelberg, Germany, 2013; Chapter 2; pp. 15–44. [Google Scholar]
- Aboulkhair, N.T.; Simonelli, M.; Parry, L.; Ashcroft, I.; Tuck, C.; Hague, R. 3D printing of aluminium alloys: Additive manufacturing of aluminium alloys using selective laser melting. Prog. Mater. Sci. 2019, 106, 100578. [Google Scholar] [CrossRef]
- Prashanth, K.G.; Eckert, J. Formation of metastable cellular microstructures in selective laser melted alloys. J. Alloys Compd. 2017, 707, 27–34. [Google Scholar] [CrossRef]
- Hitzler, L.; Hirsch, J.; Schanz, J.; Heine, B.; Merkel, M.; Hall, W.; Öchsner, A. Fracture toughness of selective laser melted AlSi10Mg. J. Mater. Des. Appl. 2019, 233, 615–621. [Google Scholar] [CrossRef]
- Salmi, A.; Atzeni, E.; Iuliano, L.; Galati, M. Experimental analysis of residual stresses on AlSi10Mg parts produced by means of Selective Laser Melting (SLM). Procedia. CIRP 2017, 62, 458–463. [Google Scholar] [CrossRef]
- Mehmood, A.; Hammouda, M.M.I. Effect of shot peening on the fatigue life of 2024 aluminum alloy. In Failure of Engineering Materials & Structures; Mechanical Engineering Department, University of Engineering & Technology: Taxila, Pakistan, 2007. [Google Scholar]
- Ocaña, J.L.; Morales, M.; Molpeceres, C.; Porro, J.A.; García-Beltrán, A. Laser shock processing as a method for the improvement of metallic materials surface properties: A discussion on the influence of combined mechanical and thermal effects. Mater. Sci. Forum 2007, 539–543, 1116–1121. [Google Scholar]
- Trdan, U.; Porro, J.A.; Ocaña, J.L.; Grum, J. Laser shock peening without absorbent coating (LSPwC) effect on 3D surface topography and mechanical properties of 6082-T651 Al alloy. Surf. Coat. Technol. 2012, 208, 109–116. [Google Scholar] [CrossRef] [Green Version]
- Warmuzek, M. Aluminum-Silicon Casting Alloys: Atlas of Microfractographs; ASM International Materials Park: Novelty, OH, USA, 2004. [Google Scholar]
- Aboulkhair, N.T.; Maskery, I.; Tuck, C.; Ashcroft, I.; Everitt, N.M. The microstructure and mechanical properties of selectively laser melted AlSi10Mg: The effect of a conventional T6-like heat treatment. Mater. Sci. Eng. A 2016, 667, 139–146. [Google Scholar] [CrossRef]
- Yan, C.; Hao, L.; Hussein, A.; Young, P.; Huang, J.; Zhu, W. Microstructure and mechanical properties of aluminium alloy cellular lattice structures manufactured by direct metal laser sintering. Mater. Sci. Eng. A 2015, 628, 238–246. [Google Scholar] [CrossRef]
- Takata, N.; Kodaira, H.; Sekizawa, K.; Suzuki, A.; Kobashi, M. Change in microstructure of selectively laser melted AlSi10Mg alloy with heat treatments. Mater. Sci. Eng. A 2017, 704, 218–228. [Google Scholar] [CrossRef]
- Trevisan, F.; Calignano, F.; Lorusso, M.; Pakkanen, J.; Aversa, A.; Ambrosio, E.P.; Lombardi, M.; Fino, P.; Manfredi, D. On the selective laser melting (SLM) of the AlSi10Mg alloy: Process, microstructure, and mechanical properties. Materials 2017, 10, 76. [Google Scholar] [CrossRef] [Green Version]
Figure 1.
Fatigue test samples: (A) geometry and size, and (B) building orientation.

Figure 2.
Surface maps acquired on different samples before and after surface finishing with different methods. Each map shows in false color the relative height of each point of the surface with respect to a “zero” given by the lowest point of the same surface.
Figure 2.
Surface maps acquired on different samples before and after surface finishing with different methods. Each map shows in false color the relative height of each point of the surface with respect to a “zero” given by the lowest point of the same surface.

Figure 3.
Polar spectrum graphs of as-built samples and surface finished ones. (A) as-built material; (B) surface finished material after laser shock processing; (C) surface finished material after plastic media blasting; (D) surface finished material after sand blasting; (E) surface finished material after ceramic shot peening; (F) surface finished material after S70 metal shot peening; (G) surface finished material after S170 metal shot peening.

Figure 4.
SEM images acquired on the external surface of different samples: (A) as-built material; (B) surface finished material after laser shock processing; (C) surface finished material after plastic media blasting; (D) surface finished material after sand blasting; (E) surface finished material after ceramic shot peening; (F) surface finished material after S70 metal shot peening; (G) surface finished material after S170 metal shot peening.

Figure 5.
Fatigue behavior of the as-built material and surface finished ones.

Figure 6.
SEM images acquired on the fracture surface of different samples showing the crack initiation point: (A) as-built material; (B) surface finished material after laser shock processing; (C) surface finished material after plastic media blasting; (D) surface finished material after sand blasting; (E) surface finished material after ceramic shot peening; (F) surface finished material after S70 metal shot peening; (G) surface finished material after S170 metal shot peening.

Figure 7.
SEM images showing the transition from the second (A) to the third (B) area of the fracture surface.
Figure 7.
SEM images showing the transition from the second (A) to the third (B) area of the fracture surface.

Figure 8.
SEM images acquired on the polished and etched cross section (sub-surface zone) of different samples: (A) as-built material; (B) surface finished material after laser shock processing; (C) surface finished material after plastic media blasting; (D) surface finished material after sand blasting; (E) surface finished material after ceramic shot peening; (F) surface finished material after S70 metal shot peening; (G) surface finished material after S170 metal shot peening.


Table 1.
Processing parameters applied to build the A357.0 samples on an X Line 2000 R Concept Laser equipment.
Table 1.
Processing parameters applied to build the A357.0 samples on an X Line 2000 R Concept Laser equipment.
| Processing Parameters | Set Values |
|---|---|
| Scan strategy | Skin-core |
| Skin-core transition depth | 2 mm |
| Skin-core overlap | 0.5 mm |
| Power | Core: 950 W |
| Skin: 750 W | |
| Scanning speed | Core: 2000 mm/s |
| Skin: 1875 mm/s | |
| Hatch distance | Core: 0.2 mm |
| Skin: Not applicable | |
| Spot size | 400 µm |
| Layer thickness | 50 µm |
| Inert gas | Nitrogen |
| Platform temperature | 200 °C |
Table 2.
Experimental parameters of axial fatigue tests.
| Test Parameters | Set Values |
|---|---|
| Wave shape | Sinusoidal load from origin (R = 0) |
| Frequency | 5 (Hz) |
| Peak stress level (σmax) | 190, 150, 130, 110, 90, 70, 50 (MPa) |
Table 3.
Surface roughness parameters of as-built samples and surface finished ones. The values in parenthesis express (in %) the change in the surface roughness parameters occurred with respect to the as-built part that was assumed as reference value ("ref."); the sign “−“ stands for a reduction.
Table 3.
Surface roughness parameters of as-built samples and surface finished ones. The values in parenthesis express (in %) the change in the surface roughness parameters occurred with respect to the as-built part that was assumed as reference value ("ref."); the sign “−“ stands for a reduction.
| Surface Condition | Sa (µm) | Spk (µm) | Svk (µm) | Ssk | Sku | Ra (µm) |
|---|---|---|---|---|---|---|
| As-built | 25.9 (ref.) | 10.40 (ref.) | 7.30 (ref.) | 0.204 | 2.59 | 14.7 (ref.) |
| Laser shock processing | 14.9 (−42%) | 2.07 (−80%) | 1.83 (−75%) | −0.137 | 2.09 | 6.2 (−58%) |
| Plastic media blasting | 6.1 (−77%) | 1.48 (−86%) | 1.21 (−83%) | 0.324 | 2.62 | 3.8 (−74%) |
| Sand blasting | 14.0 (−46%) | 4.35 (−58%) | 3.68 (−50%) | −0.130 | 2.29 | 6.1 (−59%) |
| Ceramic shot peening | 12.8 (−51%) | 4.69 (−55%) | 2.46 (−66%) | 0.533 | 2.64 | 6.2 (−58%) |
| Metal shot peening, S70 | 9.0 (−65%) | 2.16 (−79%) | 1.78 (−76%) | 0.018 | 2.23 | 5.2 (−65%) |
| Metal shot peening, S170 | 8.0 (−69%) | 4.17 (−60%) | 2.90 (−60%) | −0.203 | 2.62 | 5.3 (−64%) |
Table 4.
Texture aspect ratio (Str) and the texture direction (Std) of as-built samples and surface finished ones.
Table 4.
Texture aspect ratio (Str) and the texture direction (Std) of as-built samples and surface finished ones.
| Surface Condition | Str | Std (°) |
|---|---|---|
| As-built | 0.629 | 82 |
| Laser shock processing | 0.518 | 133 |
| Plastic media blasting | 0.573 | 55.5 |
| Sand blasting | 0.789 | 46.5 |
| Ceramic shot peening | 0.650 | 101 |
| Metal shot peening, S70 | 0.676 | 30.8 |
| Metal shot peening, S170 | 0.554 | 35.5 |
Table 5.
Maximum stress level (σmax) corresponding to the endurance limit of 2 × 10⁶ cycles. The values in parenthesis express (in %) the change in σmax occurred with respect to the as-built part; the sign “+“ stands for an increase. The as-built part was assumed as reference value ("ref.")
Table 5.
Maximum stress level (σmax) corresponding to the endurance limit of 2 × 10⁶ cycles. The values in parenthesis express (in %) the change in σmax occurred with respect to the as-built part; the sign “+“ stands for an increase. The as-built part was assumed as reference value ("ref.")
| Surface Condition | σmax (MPa) |
|---|---|
| As-built | 50 (ref.) |
| Laser shock processing | 70 (+40%) |
| Plastic media blasting | 90 (+80%) |
| Sand blasting | 90 (+80%) |
| Ceramic shot peening | 90 (+80%) |
| Metal shot peening, S70 | 70 (+40%) |
| Metal shot peening, S170 | 90 (+80%) |
© 2019 by the authors. Licensee MDPI, Basel, Switzerland. This article is an open access article distributed under the terms and conditions of the Creative Commons Attribution (CC BY) license (http://creativecommons.org/licenses/by/4.0/).
Share and Cite
MDPI and ACS Style
Denti, L.; Sola, A. On the Effectiveness of Different Surface Finishing Techniques on A357.0 Parts Produced by Laser-Based Powder Bed Fusion: Surface Roughness and Fatigue Strength. Metals 2019, 9, 1284. https://doi.org/10.3390/met9121284
AMA Style
Denti L, Sola A. On the Effectiveness of Different Surface Finishing Techniques on A357.0 Parts Produced by Laser-Based Powder Bed Fusion: Surface Roughness and Fatigue Strength. Metals. 2019; 9(12):1284. https://doi.org/10.3390/met9121284
Chicago/Turabian StyleDenti, Lucia, and Antonella Sola. 2019. "On the Effectiveness of Different Surface Finishing Techniques on A357.0 Parts Produced by Laser-Based Powder Bed Fusion: Surface Roughness and Fatigue Strength" Metals 9, no. 12: 1284. https://doi.org/10.3390/met9121284
Note that from the first issue of 2016, this journal uses article numbers instead of page numbers. See further details here.