Article

Preparation and Characterization of Mg-RE Alloy Sheets and Formation of Amorphous/Crystalline Composites by Twin Roll Casting for Biomedical Implant Application

1
Department of High-Tech Research Center, University of Saitama Institute of Technology, Fusaiji 1690, Fukaya 369-0293, Japan
2
High-Tech Research Center, Saitama Institute of Technology, Fusaiji 1690, Fukaya 369-0293, Japan
3
School of Materials and Metallurgy, University of Science and Technology Liaoning, Anshan 114051, China
4
Institute of Metal Research, Chinese Academy of Sciences, Shenyang 110016, China
5
School of Materials Science and Engineering, University of Science and Technology of China, Hefei 230026, China
*
Author to whom correspondence should be addressed.
Metals 2019, 9(10), 1075; https://doi.org/10.3390/met9101075
Submission received: 27 August 2019 / Revised: 29 September 2019 / Accepted: 1 October 2019 / Published: 3 October 2019
(This article belongs to the Special Issue Recent Advancements in Metallic Glasses)

Abstract

:
A new type of Mg-based metallic glass has attracted extensive attention due to its excellent corrosion resistance and favorable biocompatibility. In this study, an amorphous/crystalline composite Mg-RE alloy sheet was prepared by a vertical type twin roll caster (VTRC) method, and its microstructure was characterized by scanning electron microscopy (SEM), X-ray diffraction (XRD), and electron probe micro-analysis (EPMA) and transmission electron microscopy (TEM); furthermore, the corrosion behaviors of the Mg-RE alloy sheet were investigated in PBS solution using electrochemical techniques and immersion testing in a simulated physiological condition. Furthermore, it was implanted into the femur of rats to explore its prospect as biological transplantation material. Its microscopic characterization experiments show that the crystal structure is crystalline phase containing amorphous phase. Electrochemical experiments and immersion testing both showed that Mg-RE(La,Ce) sheet with VTRC has a better corrosion resistance than master alloy, and a uniform corrosion layer on the surface. In vivo, as an implant material, tests show that Mg-RE alloy sheets have better biocompatibility and induce new bone formation, and they can be expected to be utilized as implant materials in the future.

1. Introduction

Metallic glasses present excellent mechanical and chemical properties that are distinctive among solid metals, and are becoming a research hotspot for current studies in the field of metallic materials [1]. In the field of biological health, biomaterials are developing rapidly and improving people’s life quality. Among biomaterials, bioinert metals have been found to be mainly used in cardiovascular scaffolds, orthopedics and dental implants [2,3,4]. However, the characteristics of these crystalline alloys, instance of high elastic modulus, relative low abrasion resistance, and stress corrosion cracking lead to bone stress shielding. Compared with traditional crystalline metals, metallic glass has an amorphous structure, higher strength, lower Young’s modulus, better wear resistance, higher corrosion resistance, and anti-fatigue performance for some Ti-, Zr-, Fe-base systems [5,6]. Over the course of the decades, many metallic glassy alloys have been developed using a wide range of components, including Pd-, Pt-, Zr-, Mg-, Ti-, Co-, and Au-base systems. Among the various different compositions of metallic glasses, Mg-based metallic glass has been widely studied for biomedical applications.
Many amorphization techniques have been developed for metallic glasses, including gun and splat quenching [7], melt spinning [8], high-pressure die casting [9,10], copper mold casting [11], and twin roll casting (TRC). TRC has the advantages of a shorter production cycle, low production cost and lower capital investment compared with conventional techniques [12]. In 1970, following Duvez’s seminal discoveries, Chen and Miller developed a TRC technique for producing metastable uniform sheets [13]. Until now, the technique for producing metallic glass strips has been almost solely confined to laboratory-scale research [14,15,16,17,18,19,20].
Previous studies have shown that TRC is a useful technique for preparing amorphous alloy sheets with an extensive cooling speed. However, the major research until now has been based on horizontal double roll casters. It is turns out that the heat transfer efficiency of vertical-type twin roll casting (VTRC) is higher than that of horizontal double roll casting (HTRC), and the cooling speed of VTRC is higher [21,22]. The rapid cooling speed of the alloy during the TRC process is beneficial for reducing segregation, achieving higher uniformity and expanded solid solubility, refining the microstructure characteristics [23]. It enables better utilization to be made of a variety of transition elements that have limited solid solubilities in magnesium alloy, to improve mechanical and chemical properties [24]. As mentioned above, heat transfer VTRC is more effective method for continuous production of magnesium alloy sheet than HTRC, and the VTRC process enables achieve a wide range of variable casting speed [25], as a result, the processability and application performance of the products are improved.
However, studies of the rapid casting speed of Mg alloy sheets produced by rapid solidification technology using TRC are rare. In this study, based on the VTRC process, the Mg-RE (RE—rare-earth elements) sheets were produced on a vertical twin roll caster and then were annealed. The microstructure of the Mg-RE sheets was investigated. The corrosion behavior properties were studied. Through this study, we expect to the Mg-RE sheet with a special organizational structure to be potential biodegradable material. Meanwhile, it was implanted into the femur of rat to explore its prospect as biological transplantation material.

2. Materials and Methods

Ingots of Mg-RE alloy were prepared by induction melting the mixture of industrial AZ31, Mg-10%La and Mg-20%Ce (wt%) master alloys in an induction furnace at 993 K for 30 min under the protection of high-purity argon. The chemical compositions of the ingots were measured by X-ray fluorescence spectrometry, and the results are listed in Table 1. Figure 1 is a schematic diagram of the manufacturing process for magnesium alloy sheets. The Mg-based sheets were prepared by VTRC. The roll, which had a diameter of 300 mm and a width of 100 mm, was made from a copper alloy. Twin roll casting experiments were carried out under casting conditions with a casting speed of 10 m/min and a pouring temperature 973 K. Because the casting produces separation force during the casting process, the metal block was set at the side of the moving roller to form a supporting force in order to minimize the gap between the rollers as much as possible during the casting process. Afterward, the melt of magnesium alloy flowed through a nozzle to a position between running rolls. The initial roll gap was set to 0 mm. An oil tank was set under the roll and the Mg-RE alloy sheet was completely submerged in the tank when the casting process was completed to prevent further grain growth. The final thickness of the sheets between 0.5 mm and 1.1 mm and the width of the strip rang is 25 mm to 50 mm.
From the Mg-RE master ingots and the as-extruded Mg-RE sheets, samples with a dimension of 10 × 10 × 1 mm3 were firstly grounded with SiC papers to1200 grid, and then by diamond pastes down to #0.25 μm grade. The microstructures of the polished surfaces were observed using a field emission scanning electron microscope (FE-SEM, JMS-6301, Tokyo, Japan) and the elements distribution maps were observed by electron probe micro-analysis (EPMA, JXA-8530F, Tokyo, Japan). The alloy phases were obtained by an X-ray diffractometer (XRD, D/Max 2500 PC, Tokyo, Japan). For TEM (HF-3300, Tokyo, Japan) analysis, the focused ion beam (FIB, JIB-4500, Tokyo, Japan) was used for preparation. During the original work of sample preparation, the alloy sheet was cut into 10 mm2 square shapes, and the thinned section thickness was about 60 μm. Square metal sheets with an area of 1.5 mm2 were cut off from the as-cast sheet and stuck together on a Mo grid with some resin glue, and then the sample was further cut with FIB to obtain the ultimate sample thickness of 0.1 μm.
The corrosion behaviors of the alloys were studied by potentiodynamic polarization (HZ700, Tokyo, Japan) and electrochemical impedance spectroscopy (Modulab XM, Tokyo, Japan), using a three-electrode cell comprising an auxiliary electrode of platinum counter, a reference electrode of Ag/AgCl electrode, and a working of the samples. The exposure area was 1 cm2. After immersion for 0.5 h, electrochemical impedance tests were operated at the open circuit potential with signal amplitude of 10 mV over a frequency varying between 100,000 Hz and 0.01 Hz. After immersion for 1 h, potentiodynamic polarization was performed at a scanning rate of 1 mV/s. All electrochemical tests were conducted in PBS (phosphate buffer saline) solution at 310 K. A triplicate electrochemical test was carried out to ensure the reproducibility of the results. For immersion tests, for each sample, only one side of 1 cm2 was exposed. Then, the samples were immersed in PBS solution at 310 K for 30 days. After immersion, the section corrosion morphologies were observed by SEM. The concentration of metal ions in the solutions were analyzed by Inductively Coupled Plasma (ICP) (ICPS-7000 Sequential Plasma Spectrometer, Tokyo, Japan).
All animal experiments were approved by the University of Saitama Institute of Technology Animal Care and Use Committee (Grant NO. 2019-5). The project recognition date is 20 May 2019. 5 white rats (12 weeks of age, 0.36 ± 0.02 kg) from Tokyo University Institute of medicine were used in this study. Rats were anesthetized with isofluane and the right thighs were shaving and disinfected. The skin and muscle of thighs were carefully retracted to expose the femurs. Single screw fixation was used in this implantation experiment. Sheets were 22 × 4.8 mm2 with a thickness of 1 mm. Screws were 5 mm in length, with an outer shaft diameter of 1.75 mm and shaft inner diameter of 1 mm. Animals were monitored daily for general behavior, movement, and food and water intake. High resolution microCT (R.mCT2, Rigaku, Tokyo, Japan) was used to assess Mg-RE sheets degradation and new bone formation.

3. Results and Discussion

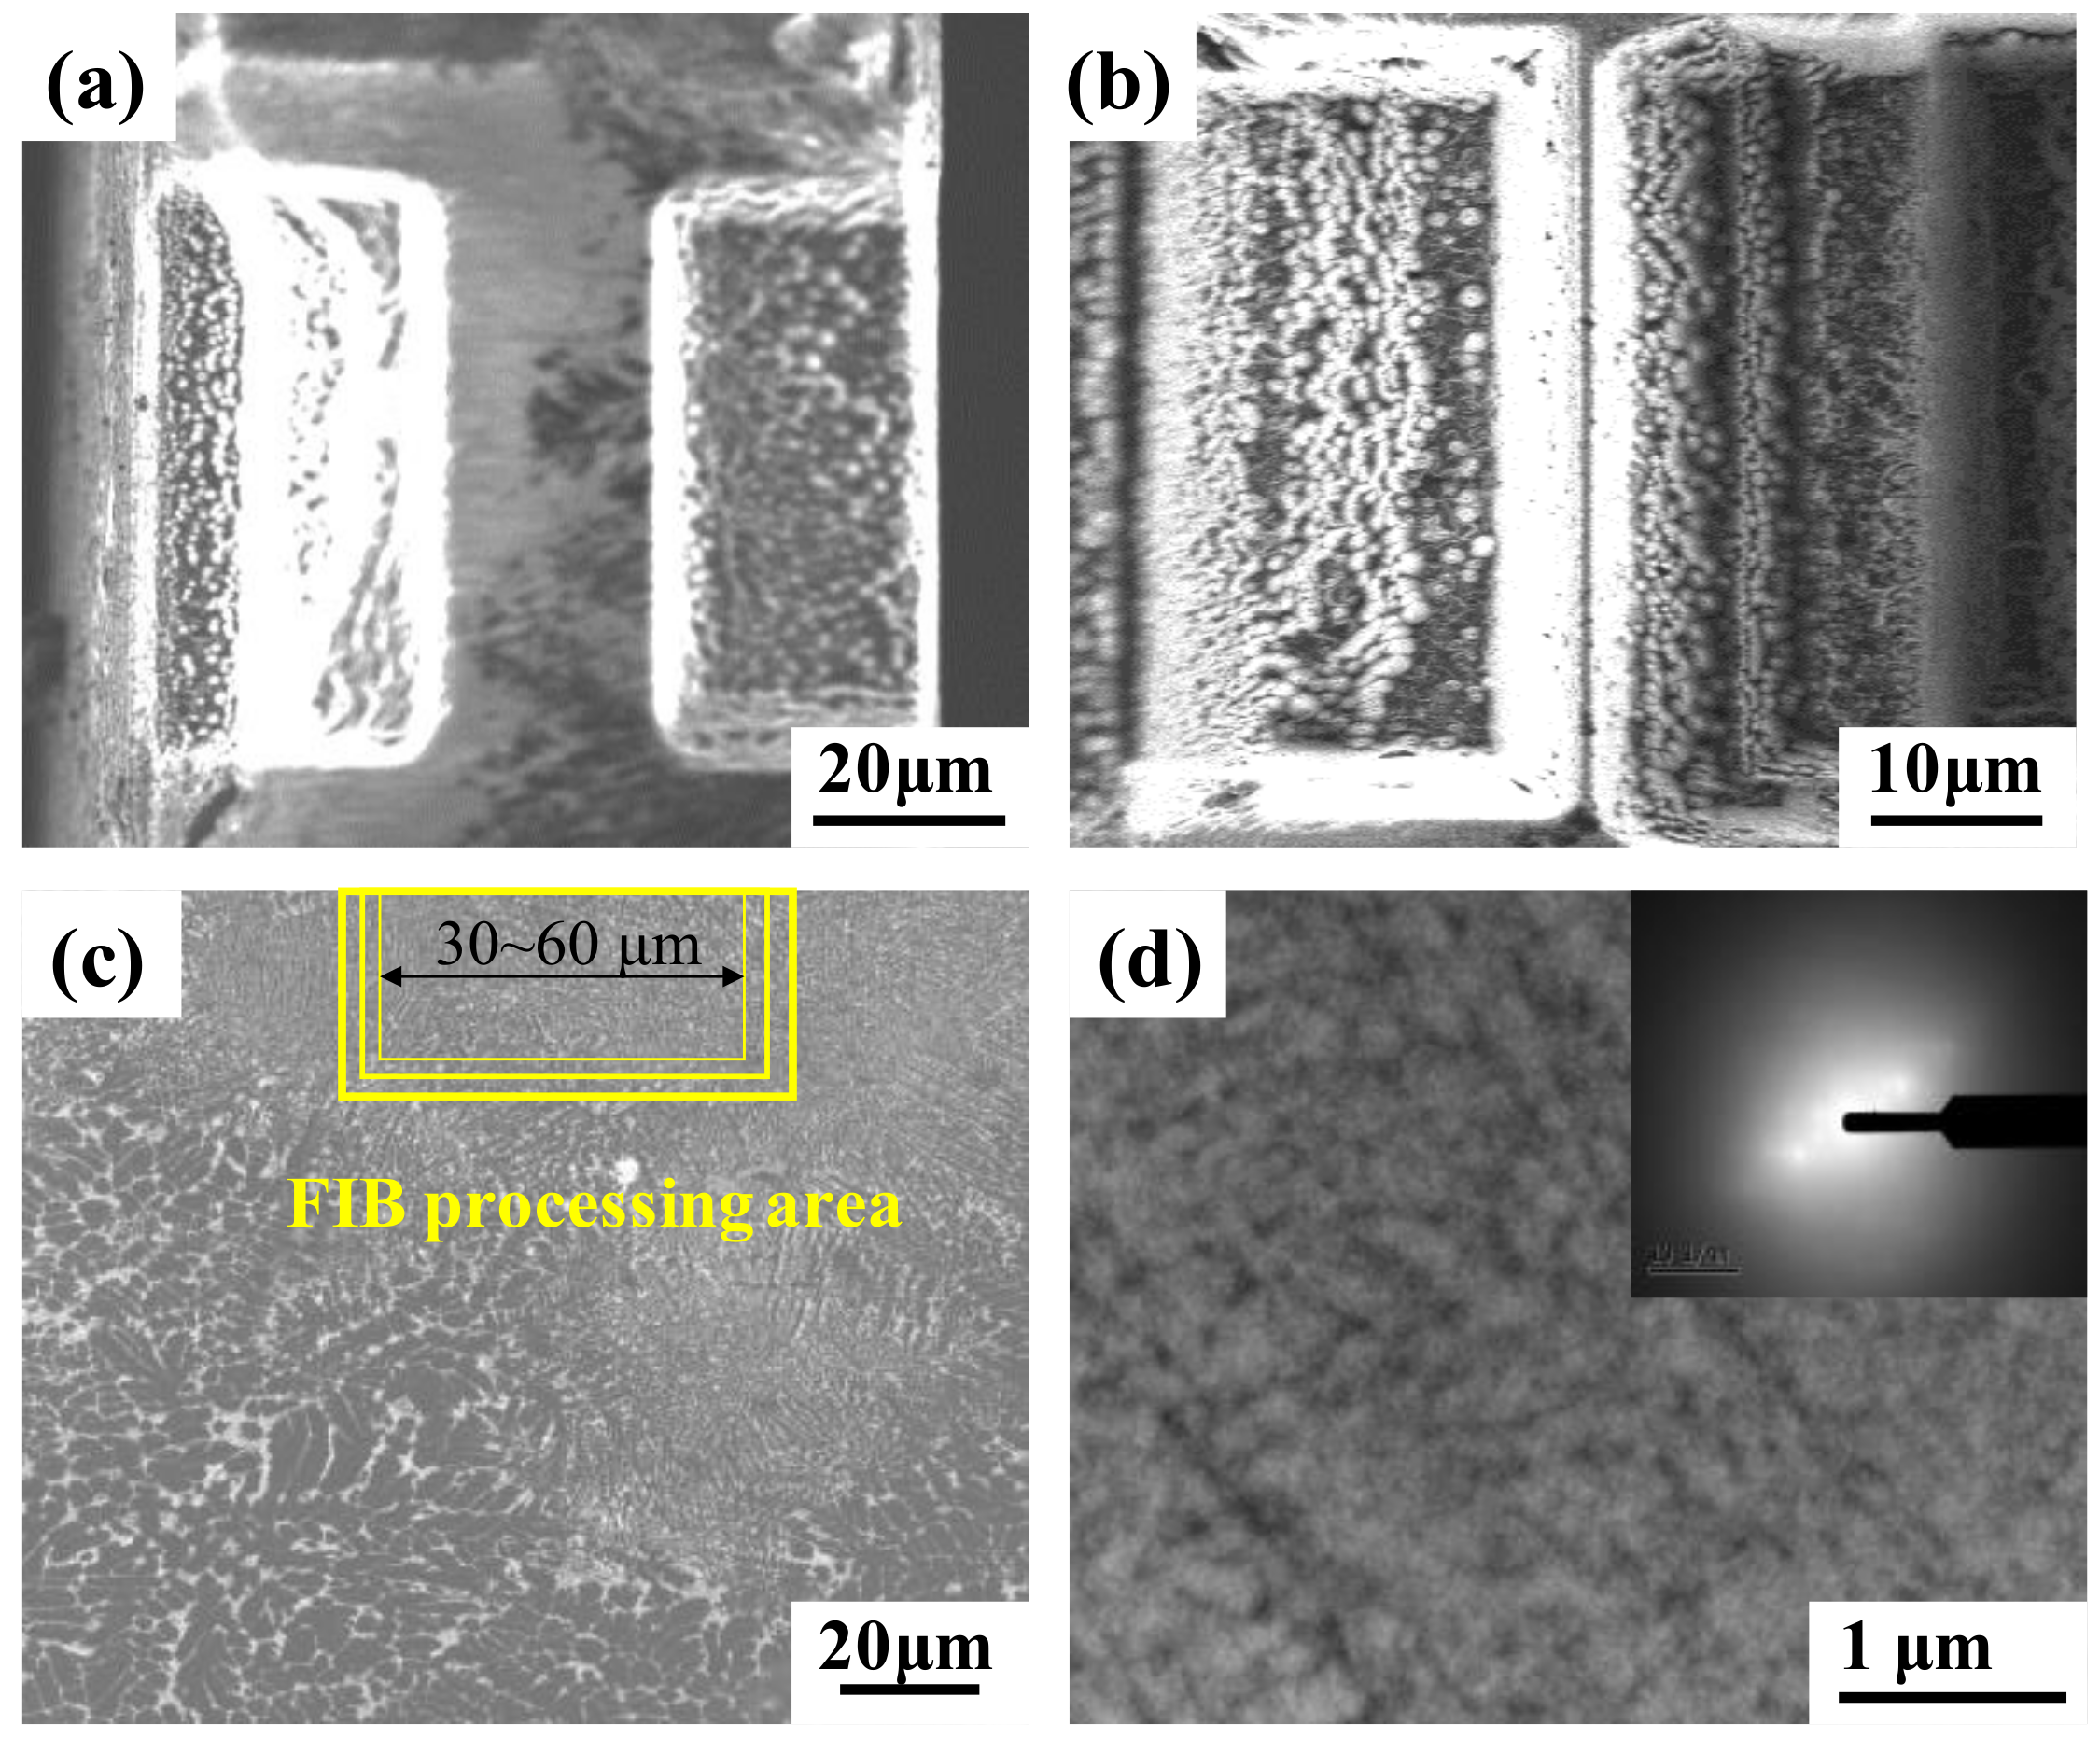
3.1. Microstructure Characteristic

Figure 2 reveals the surface morphologies and EDS analyses of the as-cast Mg-RE alloy ingot. It can be seen from Figure 2a that acicular intermetallic compounds crystallize in the Mg-RE alloy ingots. Figure 2b presents the combined EDS results, and the acicular compound crystallization in the red rectangle contains higher contents of Ce elements. Figure 3a presents the microstructure of the Mg-RE alloy sheet at a thickness of ~1.1 mm and a width of ~50 mm obtained at the casting speed of 30 m/min, in which the microstructure of the Mg-RE alloy sheet is characterized by dendrites of fine grains and a closely spaced secondary dendrite axis. Apart from that, as shown by the red rectangular area in Figure 3a, it can be seen that there are portions where no appreciable crystalline features can be observed. Figure 3c shows the XRD patterns of the studied alloys. It can be concluded that the as-cast Mg-RE alloy sheets (Figure 3a) consisted mainly of α-Mg, La-Al and Ce-Al, and it is worth noting that a broad peak appears at the angle of 20°~30°, indicating that the sample may contain both crystalline and amorphous phases.
The crystallite size of each detected phase in Figure 3c could be calculated using the Scherrer equation, which is expressed by Dhkl = Kλ/Bhkl cosθ [26], where Dhkl is the grain size perpendicular to the lattice planes, hkl are the Miller index of the planes being analyzed, K is a constant numerical factor called the crystallite-shape factor, λ is the wavelengths of the X-rays, Bhkl is the width of the X-ray diffraction peak in radians and θ is the Bragg angle. The calculated results are listed in Table 2. It turns out that the grain sizes of the detected phase are very fine. However, the X-ray tube on the line focus side is unsuitable for analyzing such a specific area without crystals, as shown in Figure 3a, as the line focus range is 0.1~0.2 mm wide and 8~12 mm long [27]. To solve these problems, the structure of the areas without crystals was analyzed by means of micro area X-ray diffraction. In the current operation, a collimator that was 0.03 mm in diameter was situated at the point focus side of the X-ray tube. Therefore, very small specific areas could be analyzed without reflecting unnecessary regional structural information. Figure 3d displays the μ-XRD of the areas without crystals of the Mg-RE sheet. The amorphous structure was determined by a peak that does not correspond to any sharp crystalline peak. As shown in Figure 3b and Table 2, very fine grains and dendrites with closely spaced secondary dendrite axes can be found around a large amorphous region.
Figure 4 shows the solute element distribution of Mg-RE with TRC. It can be seen that Mg elements are evenly distributed along the matrix, while Al/Ce/La are concentrated in amorphous areas. In addition, Al, Ce, La element segregation exists between crystal phase and the amorphous region. Meanwhile, the grain boundary is prone to segregation, because the relative atomic radius difference (ARDMg) between Mg and other elements is more than 10% [28], as shown in Table 1. It can also be found that Al, Ce and La elements are enriched in the amorphous phase region, which may be related to the fact that the alloy is prone to producing very stable Al-RE compounds under the solidification condition of low cooling rate. Figure 5 presents the values of enthalpy of mixing (∆ H [ A B ] m i x ) calculated by Miedma’s model for atomic pairs between major elements of Mg-RE sheet samples, in which the enthalpy of mixing between Mg-Al, Mg-La and Mg-Ce are −2 KJ/mol, −7 KJ/mol and −7 KJ/mol, respectively, while the enthalpy of mixing between Al-La and Al-Ce are −38 KJ/mol, which is greater than that between Mg and other major elements [29]. The design of Mg-RE alloy conforms to the three rules summarized by Inoue et al. [30] for the glass forming ability (GFA) of alloys: first, a multi-component system consisting of more than three major elements; second, the difference in atomic size between major elements is large (greater than 10%), and in line with the relationship of large, medium and small; third, the mixed heat between the main elements is a suitable negative value. In other words, Mg-RE alloy has good glass-forming ability.
To ascertain the amorphous phase structure, many initial specimens were prepared using the FIB technique, and TEM observation was further performed. Figure 6c shows that the first step of TEM sample preparation is to find the amorphous phase on the surface of the sample in the SEM diagram, and then cut the specific phase area with FIB technology which make the cutting area length was 30~60 μm. Figure 6a presents the cross section of the sample is sliced by FIB technique. Since part of the sample was cut with FIB on the surface, it is easy to find the section position to be cut. The sample was cut into steps, originally, and a slice thickness of 0.1 μm was ultimately prepared, as shown in Figure 6b. Figure 6d presents the TEM image and selected area diffraction pattern (SADP) of the amorphous phase, in which amorphous circular halos are not distinctly visible, and a poor crystallinity is shown, although few spots of electron diffraction exist. This may be due to the small size of the amorphous phase in the current TEM sample or the slight oxidation of the Mg-RE alloy sheet after cutting by FIB technology.

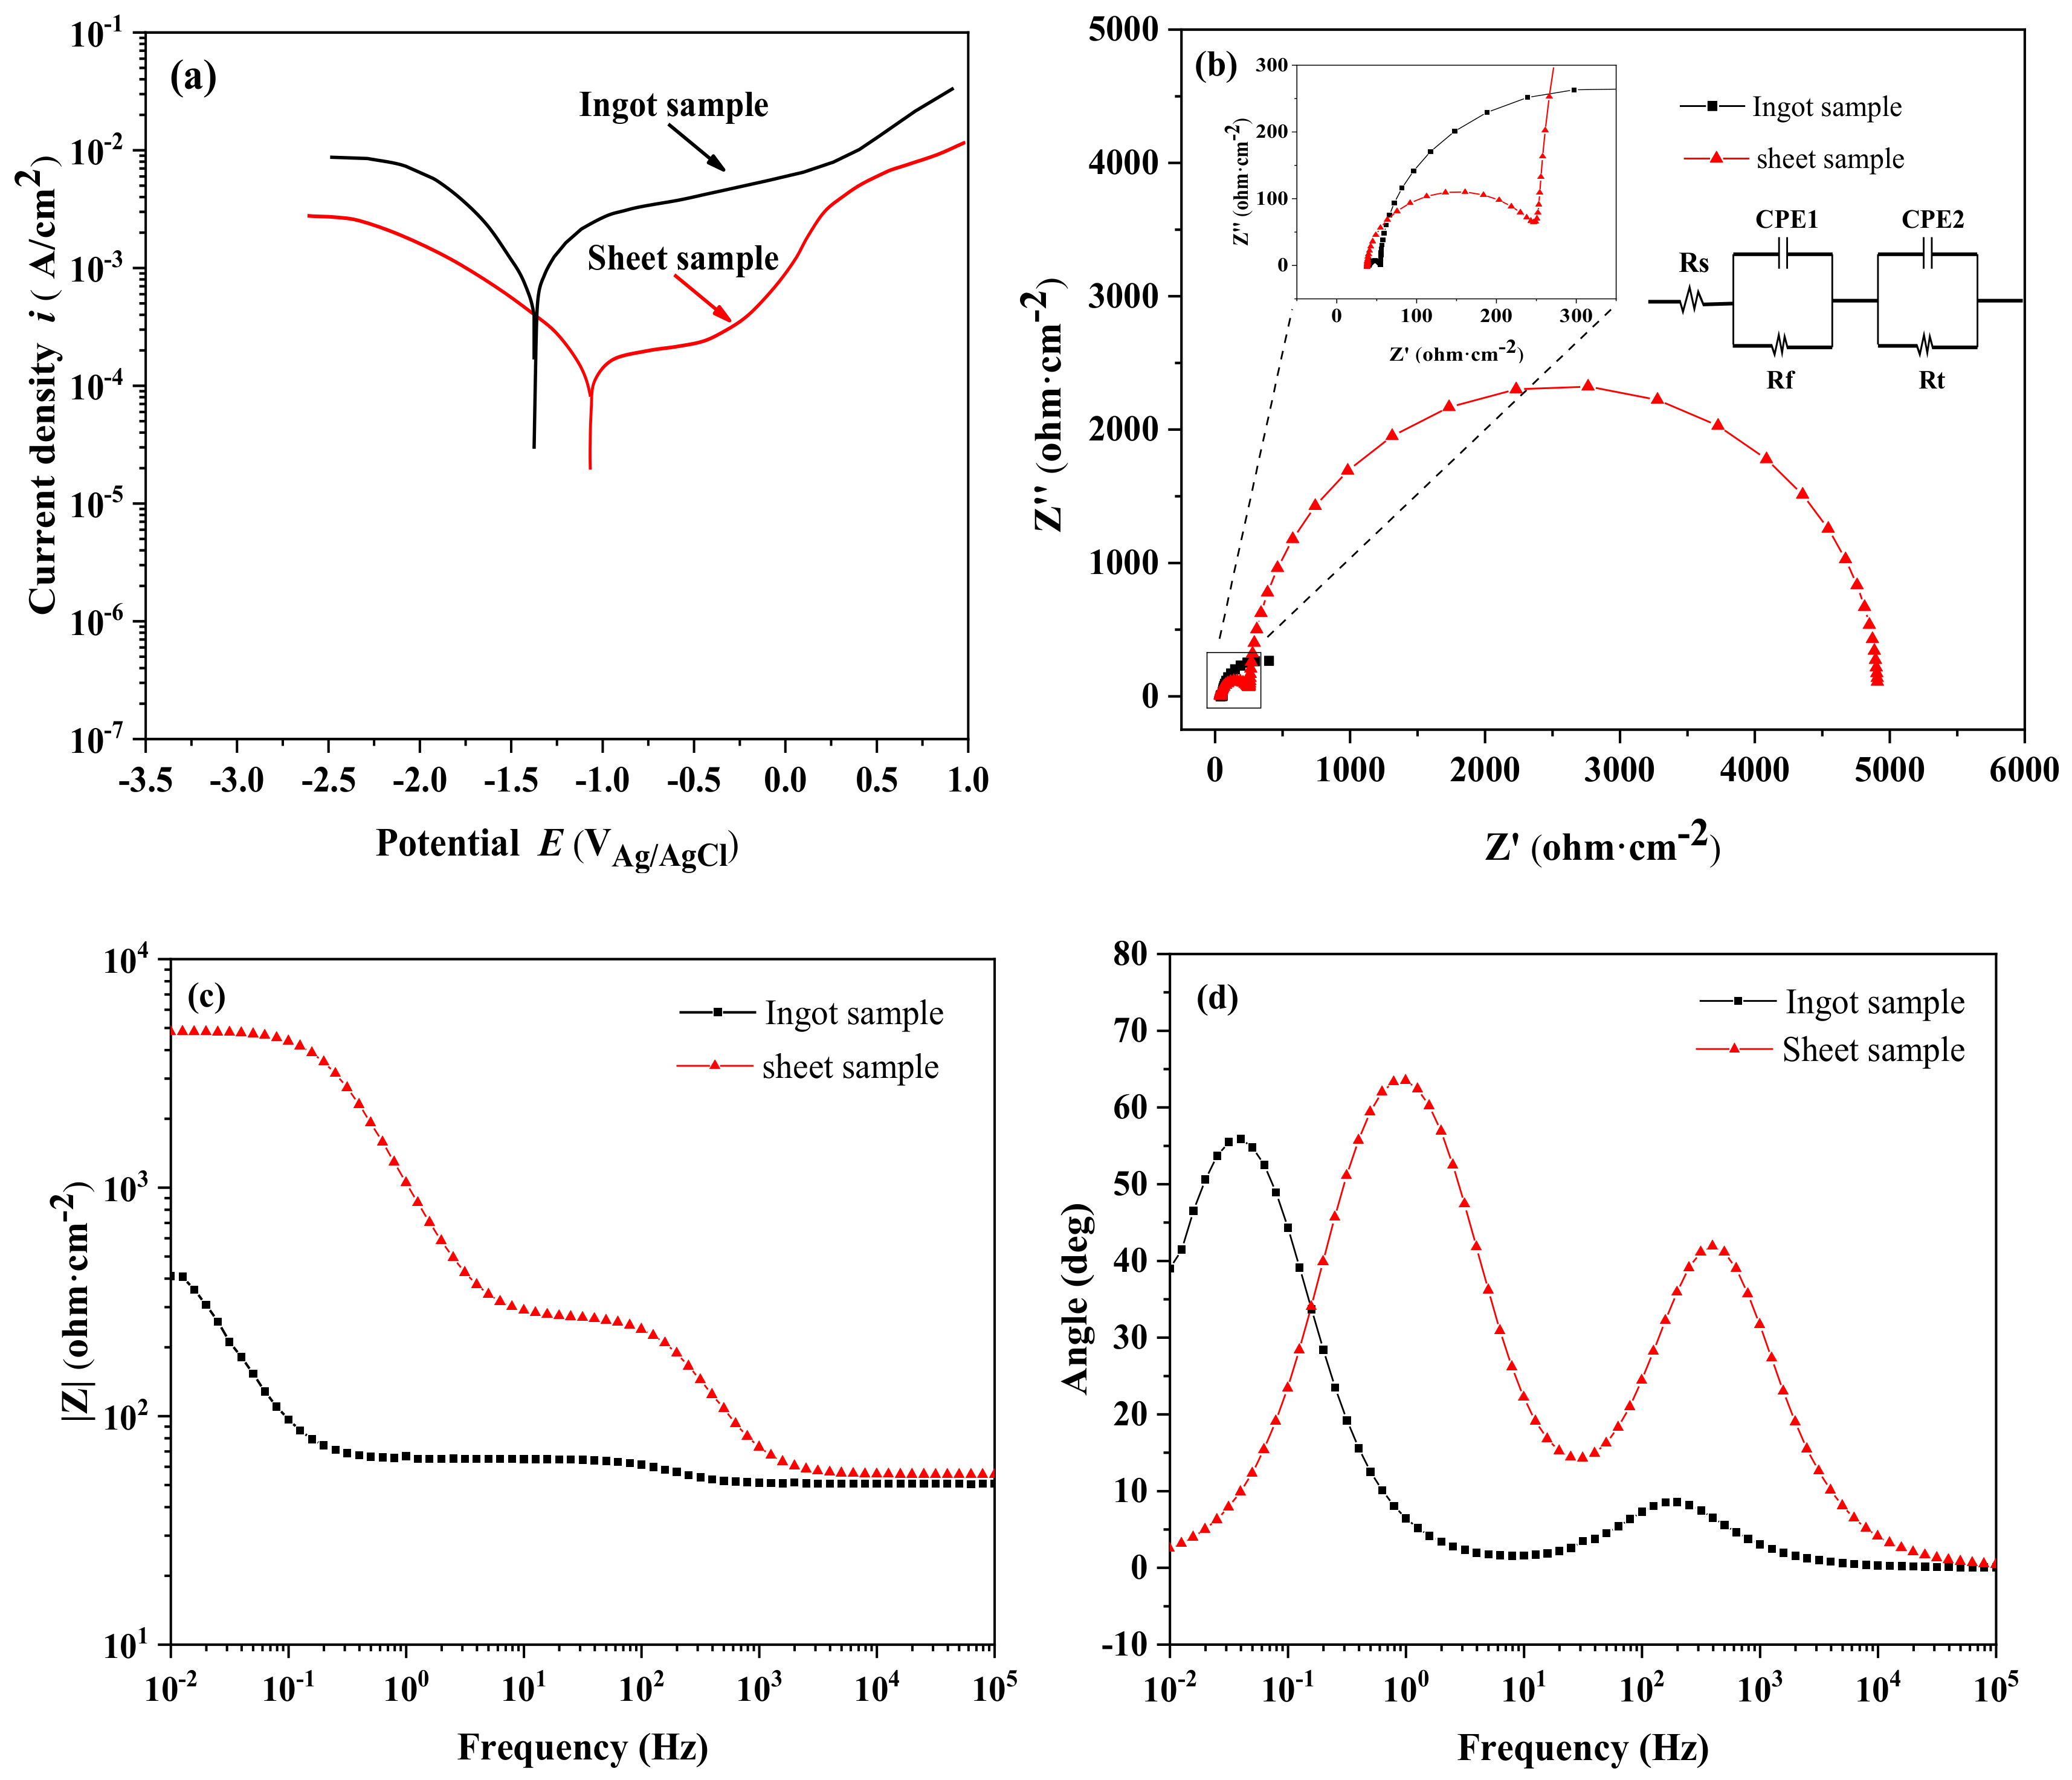
3.2. Electrochemical Measurements
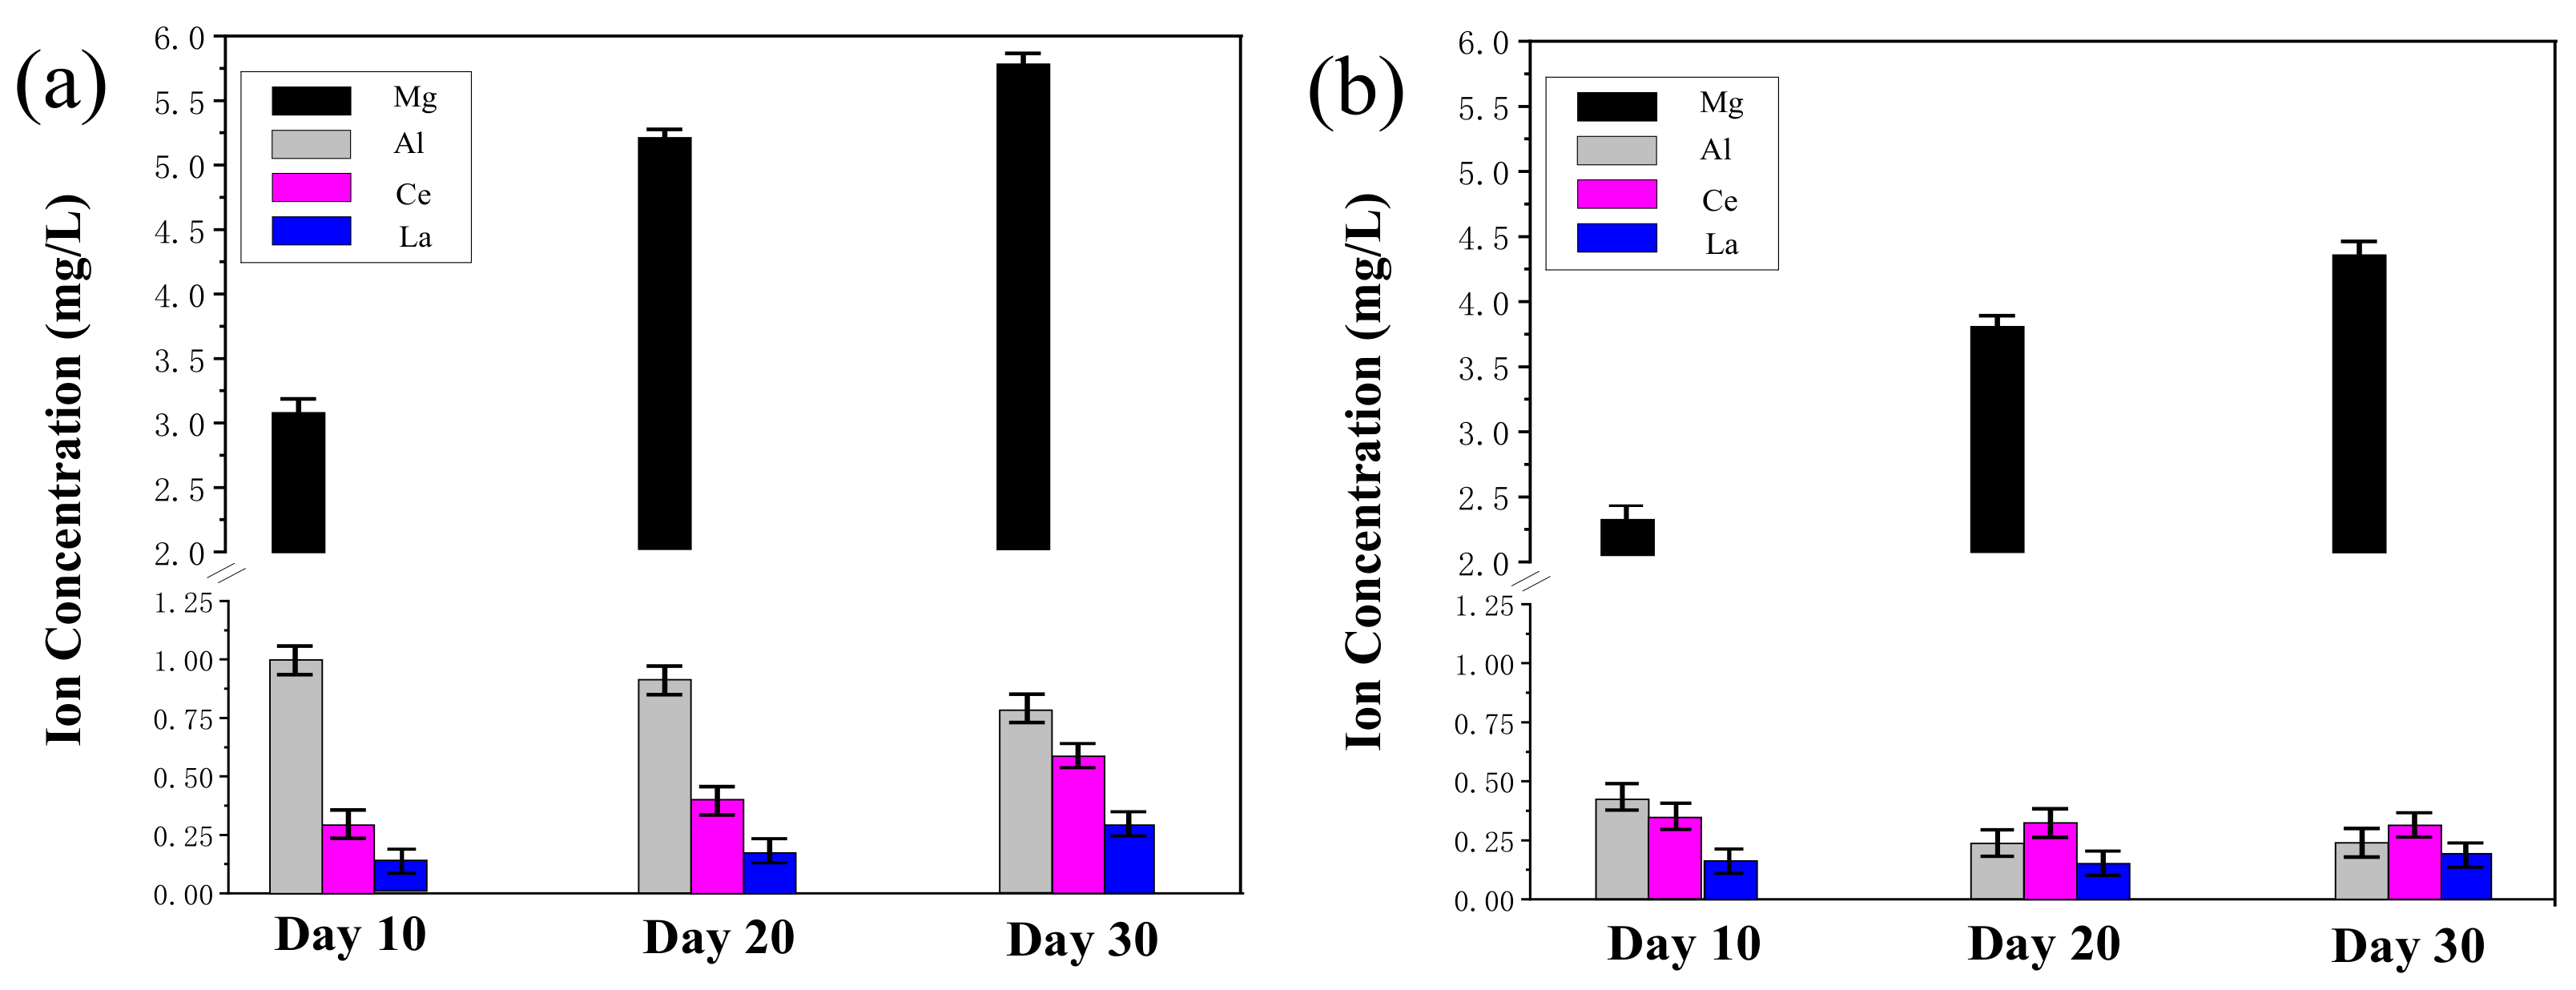
Figure 7 shows the electrochemical behaviors of the prepared Mg-RE alloy ingot sample and the sheet with TRC sample in PBS solution at 310 K. In addition, the fitting results are summarized in Table 3. As stated above, after the two-roll casting process, the Mg-RE alloy sheet presented a more positive potential (−1.08 VAg/AgCl), with comparable potentials to the Mg-RE alloy ingot (−1.37 VAg/AgCl). Based on electrochemical theory, in the process of electrode reaction, the ions in the solution were mainly in charge of conveying the transformation to the surface of the electrode. In the cathode area, the Mg-RE alloy dissolves into metal cation. Because the metal cation ion concentration is too high, the charge exchange process cannot be carried out as soon as possible. The cloud of ions blocks the electrodes’ ability to charge, which is called polarization resistance (Rp). In general, the larger the Rp of the metal materials, the larger the ion cloud on the electrode surface, thus preventing charge exchange. The corrosion potential (Ecorr) of the samples is mainly determined by the relative size between anode and cathode reaction rates, which reflects the reaction trend [31]. Furthermore, the corrosion current density (Icorr) shows a decreasing trend: Mg-RE sheet with TRC sample (1.51 × 10⁻⁴ μA) < Mg-RE ingot sample (1.74 × 10⁻³ μA). Lower Icorr indicates better corrosion resistance. Therefore, it is demonstrated that the Mg-RE sheet sample with TRC possesses a higher corrosion potential, a smaller current density, and a better corrosion resistance. Due to the influence of part of the amorphous phase being formed in the Mg-RE alloy after rapid cooling solidification by two-roll casting, the corrosion resistance was enhanced.
The electrochemical impedance data were determined for the corrosion potential in PBS and presented in Nyquist plots (Figure 7b, and Bode plots (Figure 7c). The equivalent circuit for electrochemical impedance is shown in Figure 7b. Rs, Rt, and Rf represent the solution resistance between the reference electrode and the working alloy sample, the resistance of charge transfer and the resistance of the corrosion product layer on the surface of the sample, respectively. Additionally, CPE1 and CPE2 illustrate the capacitance of the corrosion product layers and charge separation at the positions where hydrogen evolution increases. In the Nyquist plots shown in Figure 7b, the magnitude of the radius curvature has different values, showing a decreasing trend: Mg-RE ingot sample < Mg-RE sheet with TRC sample, which is also illustrated by the decreasing impedance modulus trend of the Mg-RE alloys in the curves in Figure 7c. It is well known that the size of the Nyquist curve is an important parameter that reflects corrosion resistance. That is to say, better corrosion resistance and behavior of the metal and alloy matrix is related to higher |Z| modulus at lower frequency, which is inversely proportional to the corrosion rate of the alloy. The Bode phase plot is shown in Figure 6d, and it can be found that the phase angles corresponding to high frequency are in a decreasing order as follows: Mg-RE sheet with TRC sample > Mg-RE ingot sample, which could be attributed to the protective properties of the surface film layers.

3.3. Immersion Test

Figure 8 presents the cross-sectional SEM micrographs of corrosion morphology of the Mg-RE alloy ingot sample and the sheet with the TRC sample in PBS solution at 310 K for 10 days. It can be observed from Figure 8a that the corrosion layer covered the Mg-RE ingot sample surface, which extended to the inside of the matrix with crack features. In addition, the maximum length of the corrosion cracks extending to the interior of the matrix was 30 μm, and they were distributed unevenly along the cross section of the Mg-RE ingot sample. The improved corrosion-resistance properties of the Mg-RE alloy with TRC are reflected in Figure 8b, in that the corrosion layer is thinner and more uniform. The results of the energy spectrum analysis indicate that the content of elements in different location of Mg-RE alloy ingot is dissimilar, which is mainly connected with the corrosion behavior of the alloy in PBS solution. The mechanism of corrosion analysis is as described below.
The multiple layers of Mg-RE alloy ingot primarily consisted of C, O, Mg, Al, Ce and other elements during the immersion test in PBS solution. Mg transformed into the stable Mg2+ ion in the initial stages. Meanwhile, the cathodic reaction occurred on account of the galvanic corrosion between the matrix and the secondary phase, accompanied by the hydrogen evolution [32]. The cathode reaction formed a heterogeneous thin porous layer which was predominantly magnesium hydrate on the surface of the Mg-RE alloy. This prevented contact of the solution and the substrate, resulting in a decrease in the corrosion rate [33]. Moreover, the chloride ions in the PBS solution were able to easily penetrate the membrane and react with the magnesium hydrate compounds. Therefore, magnesium hydrate compounds were converted into magnesium chloride compounds, which are more likely to dissolve into magnesium ions and chloride ions [34]. The dissolution of the compound leads to a decrease in the magnesium hydrated compounds around the protective layer, leading to further dissolution of the matrix.
Magnesium hydrated films constituted on the surface of magnesium are generally referred to as crystals. Previous studies have found that the composition and structure of magnesium and magnesium alloy surface films can be changed using a rapid solidification process. The conversion of magnesium hydrated films from a crystal form into an amorphous film structure improves the corrosion resistance. Amorphous films have better protection than crystalline films, and films without grain boundaries are better able to resist ion motion than crystalline films [35]. The Mg-RE alloy sheet obtained by the TRC process has a unique structure due to its crystal structure surrounding the amorphous structure, which may be the reason for the improvement of the corrosion resistance of the magnesium hydrated film.
Figure 9 presents the Mg, Al, Ce and La metallic ion concentrations of the solution for (a) the Mg-RE alloy ingot sample and (b) the sheet with the TRC sample at day 10, day 20 and day 30 under immersion testing in PBS solution at a temperature of 310 K. Specifically, both alloys showed a general trend of increasing Mg ion concentration in the PBS solution with increasing immersion time from day 10, day 20 and day 30. In contrast, for Al ion concentration, both alloys showed a decreasing trend. Generally, the Mg-RE alloy ingot sample showed greater average Mg and Al ion concentration in the PBS solution at each time point—day 10, day 20 and day 30. From day 10 to day 20 after immersion, the magnesium ion concentration for the sheet sample was obviously less than the ingot sample after 10, 20 and 30 days. This may be caused by the rapid corrosion of alloys in the initial corrosion stage and then the beginning of passivation to slow down the corrosion. The decrease of aluminum in the corrosive solution may have resulted from the formation of corrosion products on the surface of the sample.
Figure 9a,b also shows that throughout the entire 30 day culture period, the Mg-RE with TRC sample group showed significantly lower release rates of Ce and La ions than the Mg-RE alloy ingot sample, and the group showed a general trend of increasing Ce and La ion concentration with increasing immersion time, but no significant change for the Mg-RE with TRC sample group. Overall, the content of metallic ions concentrations in the corrosion solution of the Mg-RE alloy sheet produced by rapid solidification TRC method less than that of Mg-RE alloy ingot sample within the same amount of immersion time. Which is probably induced by the special microstructure formed under rapid cooling and exhibits an improved corrosion resistance.

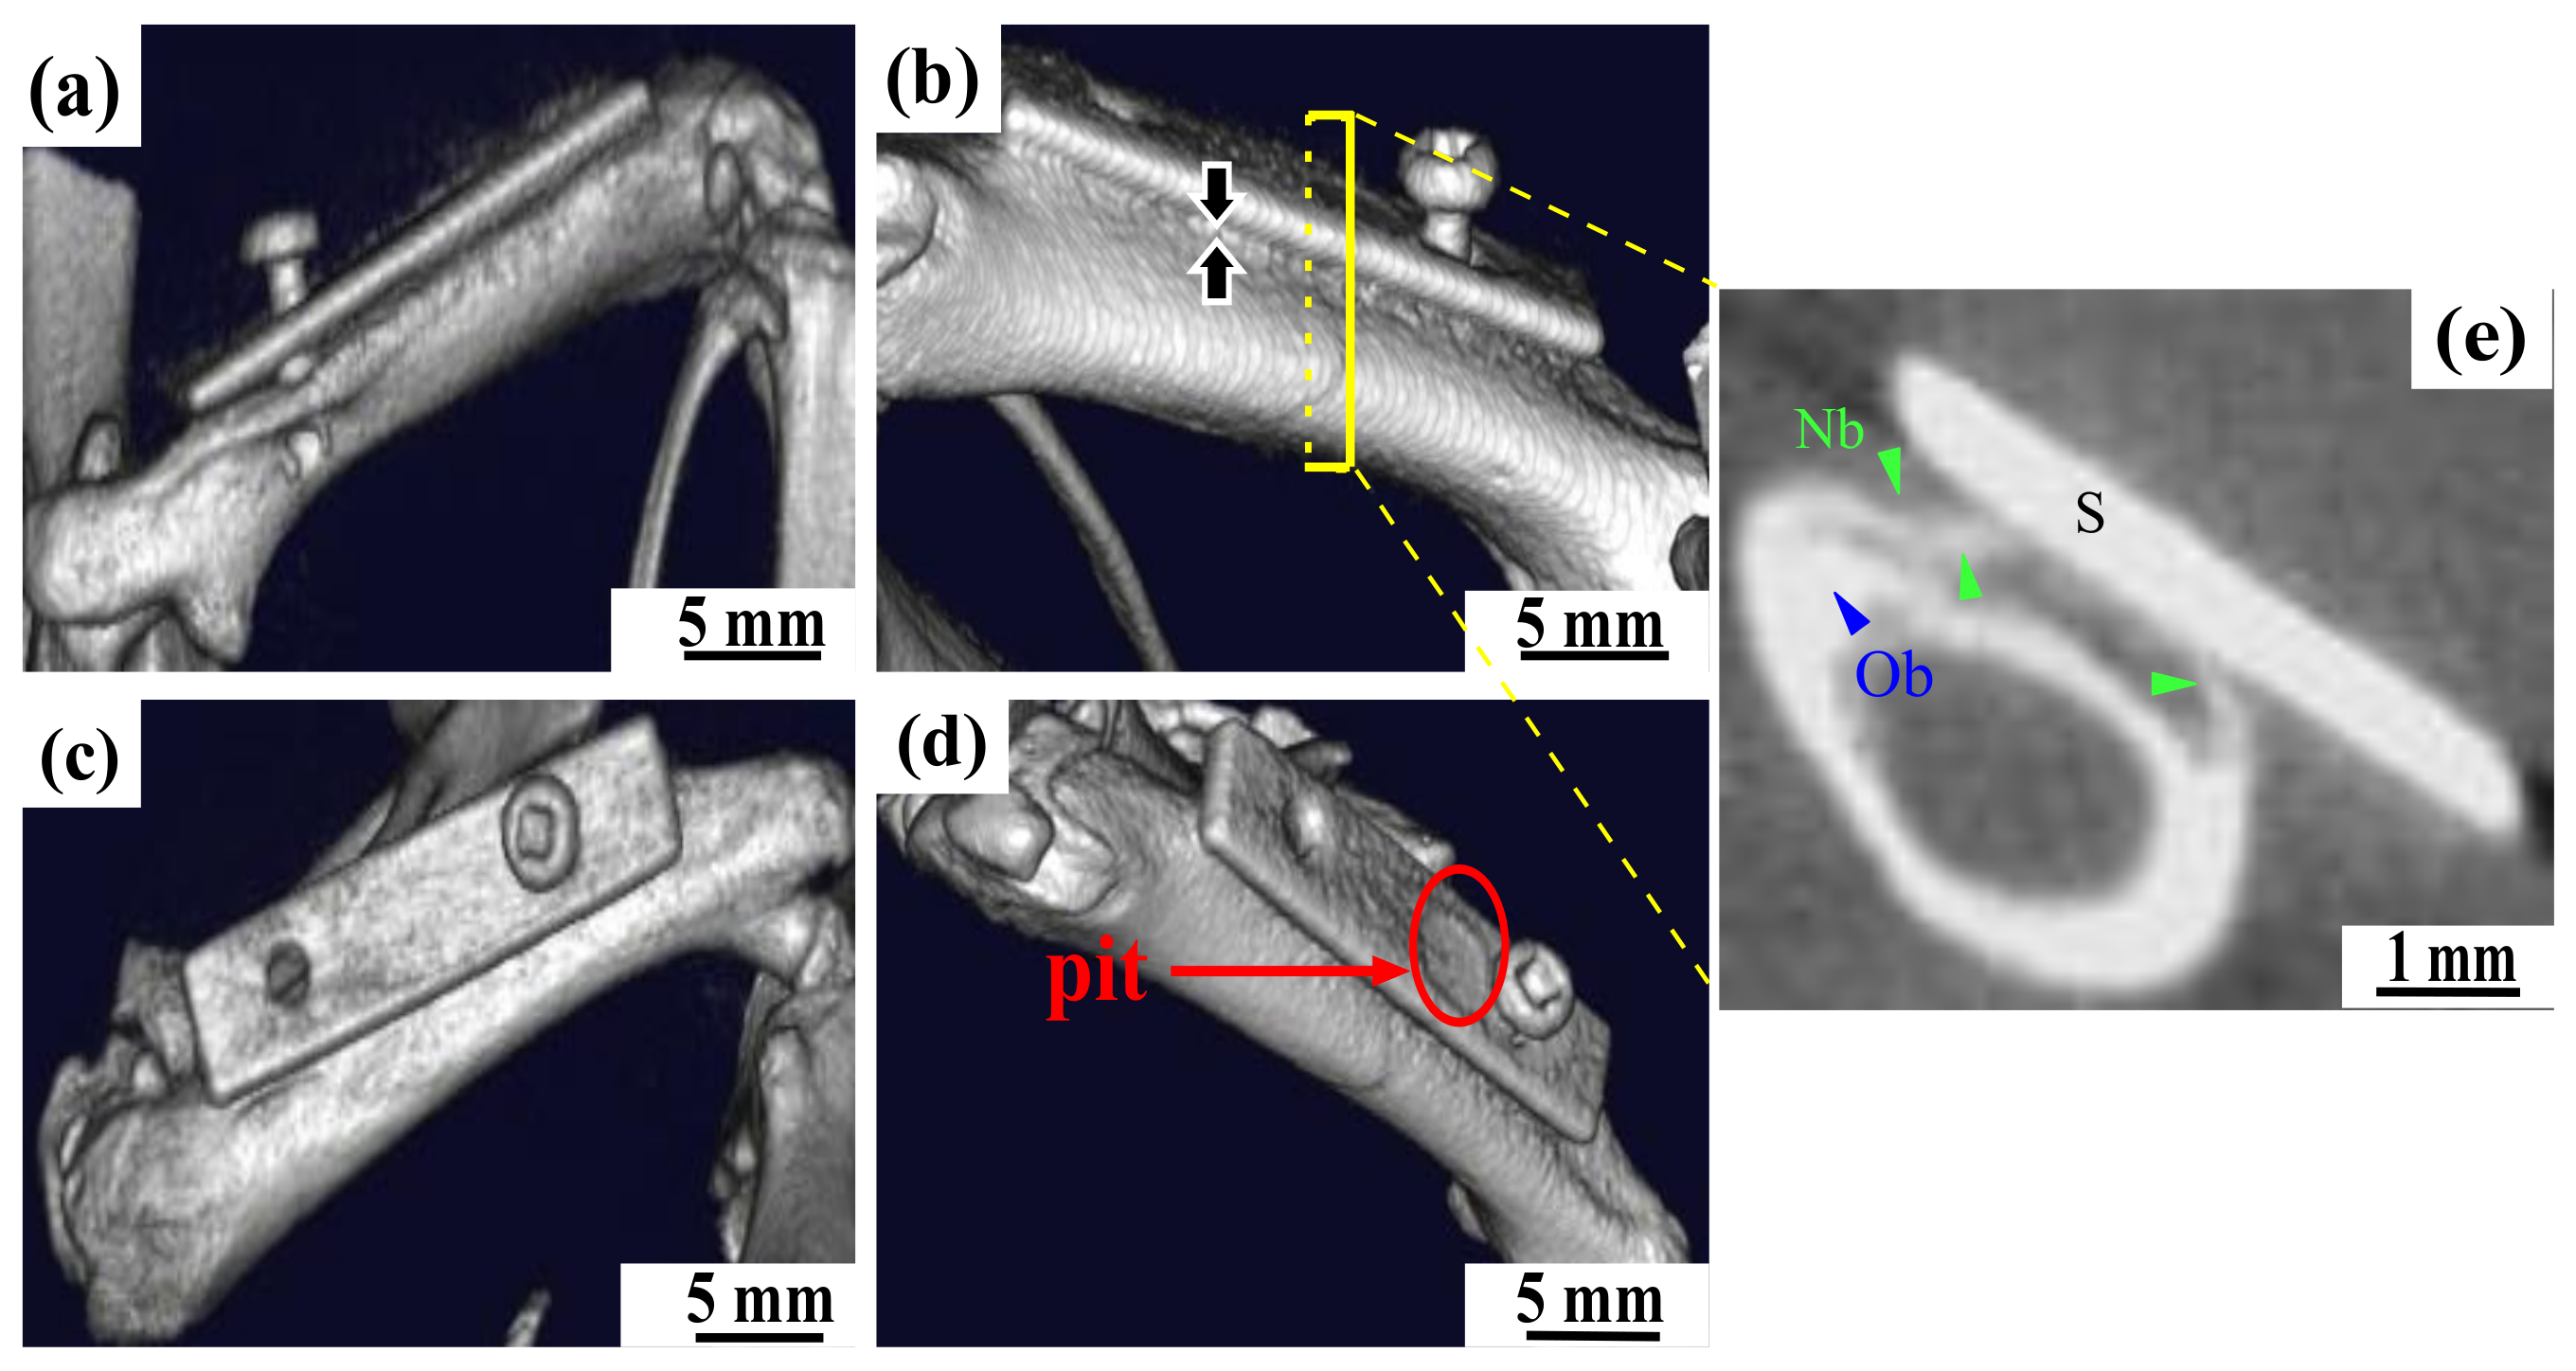
3.4. In Vivo Implantation

The Mg-RE sheet with TRC samples was successfully inserted into the subcutaneous tissue of the rat thigh and attached to the femur with an AZ31 screw during surgery, despite the slight mismatches between the Mg-RE sheet and femur owing to manual surgical placement and the fact that there is only one screw to fix the femur and alloy sheet. Slight skin swelling was observed in the hind limbs of the rats during the visual examination of the rats during the study period. The bulge disappeared after a few days.
Figure 10 reveals the surface volume of the degrading Mg-RE alloy sheet and bone growth changes, depicted using MicroCT 3D rendering after various implantation times. As can be seen from Figure 10a,c, two weeks after surgery, no new bone production was found around the Mg-RE alloy sheet and femur, and the screw between them was clearly visible. There are no obvious corrosion pits on the surface of magnesium alloy sheet. Figure 10b,d, six weeks after the surgery, new bone was formed between the Mg-RE alloy sheet and the femur. Figure 10e presents on the cross section of the bone–alloy joint, the new bone is generated and surrounds the original femur. The sheets are attached to the femur by new bone, which appears to be relatively stable in living organisms. In the red area shown in Figure 10, corrosion pits began to appear on the surface of magnesium alloy sheet after six weeks of surgery. This indicates that the films with improved corrosion resistance of Mg-RE alloy sheet began to degrade in vivo after 6 weeks.
Mg-RE sheet degradation and femoral change were assessed by volume quantification in MicroCT 3D rendering separately as shown in Figure 11. Before surgery, the volume of self-made Mg-RE alloy bone sheet was 94.79 mm3. The Mg-RE sheet corroded, resulting in 9.32 ± 0.86 mm3 volume loss after 6 weeks. With regard to the changes in the femur, the volume of the femur did not change significantly during the two weeks following the surgery. In fact, for some time after the surgery, the rat lost significantly more weight, the reason for this being that it took some time for the body to adapt the a foreign body. After about five days, the rats returned to their normal mental state and began to eat normally. By 6 weeks, as new bone had formed between the sheet and the femur, a noticeable change in bone volume was observed from 2 to 6 weeks. The rat showed no abnormal physical or physiological responses during subsequent breeding.
Uniquely, magnesium alloy application has the potential to enhance bone formation. Several previous studies have shown that the potential performance, presenting increased bone mass, mineral apposition, and bone mineral density around magnesium alloy implants in bone [36,37,38,39]. In our present study, new bone appears in the area where the femur contacts the alloy sheet, which confirmed our findings that the Mg-RE alloy with TRC degradation can lead to the promotion of bone formation. The new bone formation is not common in absorbable polymers or permanent metal devices, thus emphasizing the unique advantages of magnesium fixtures. In this way, the degraded fixture will be gradually replaced in the future.

4. Conclusions

(1)
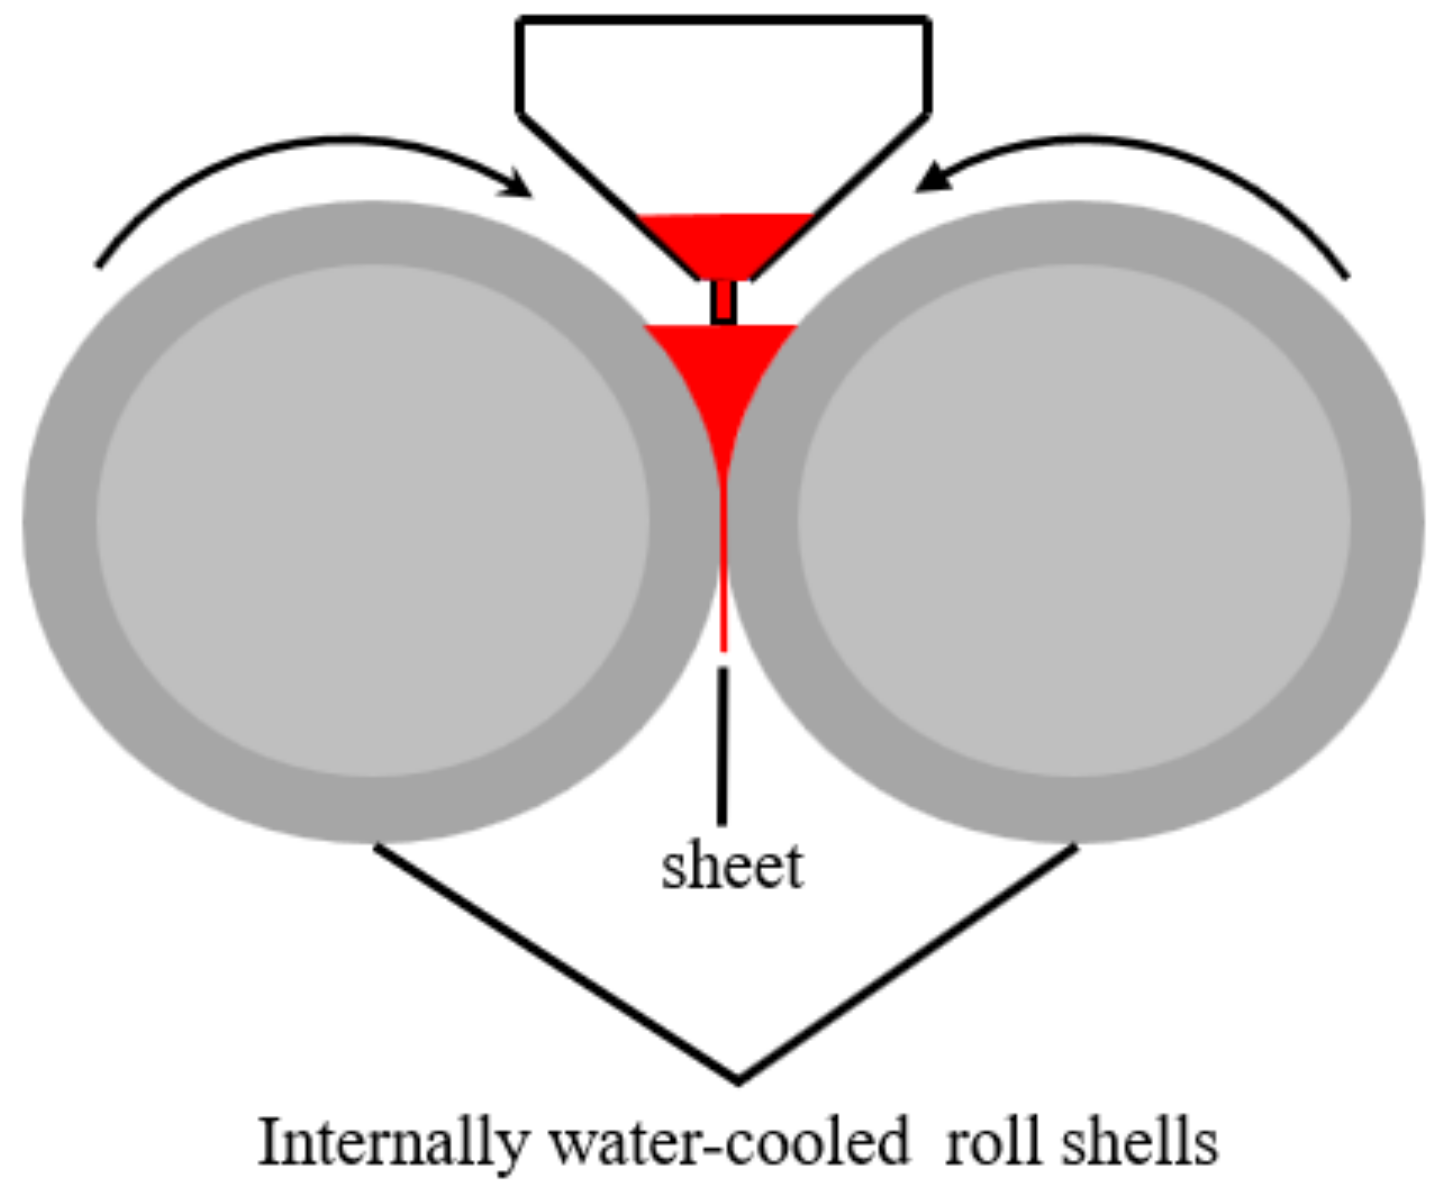
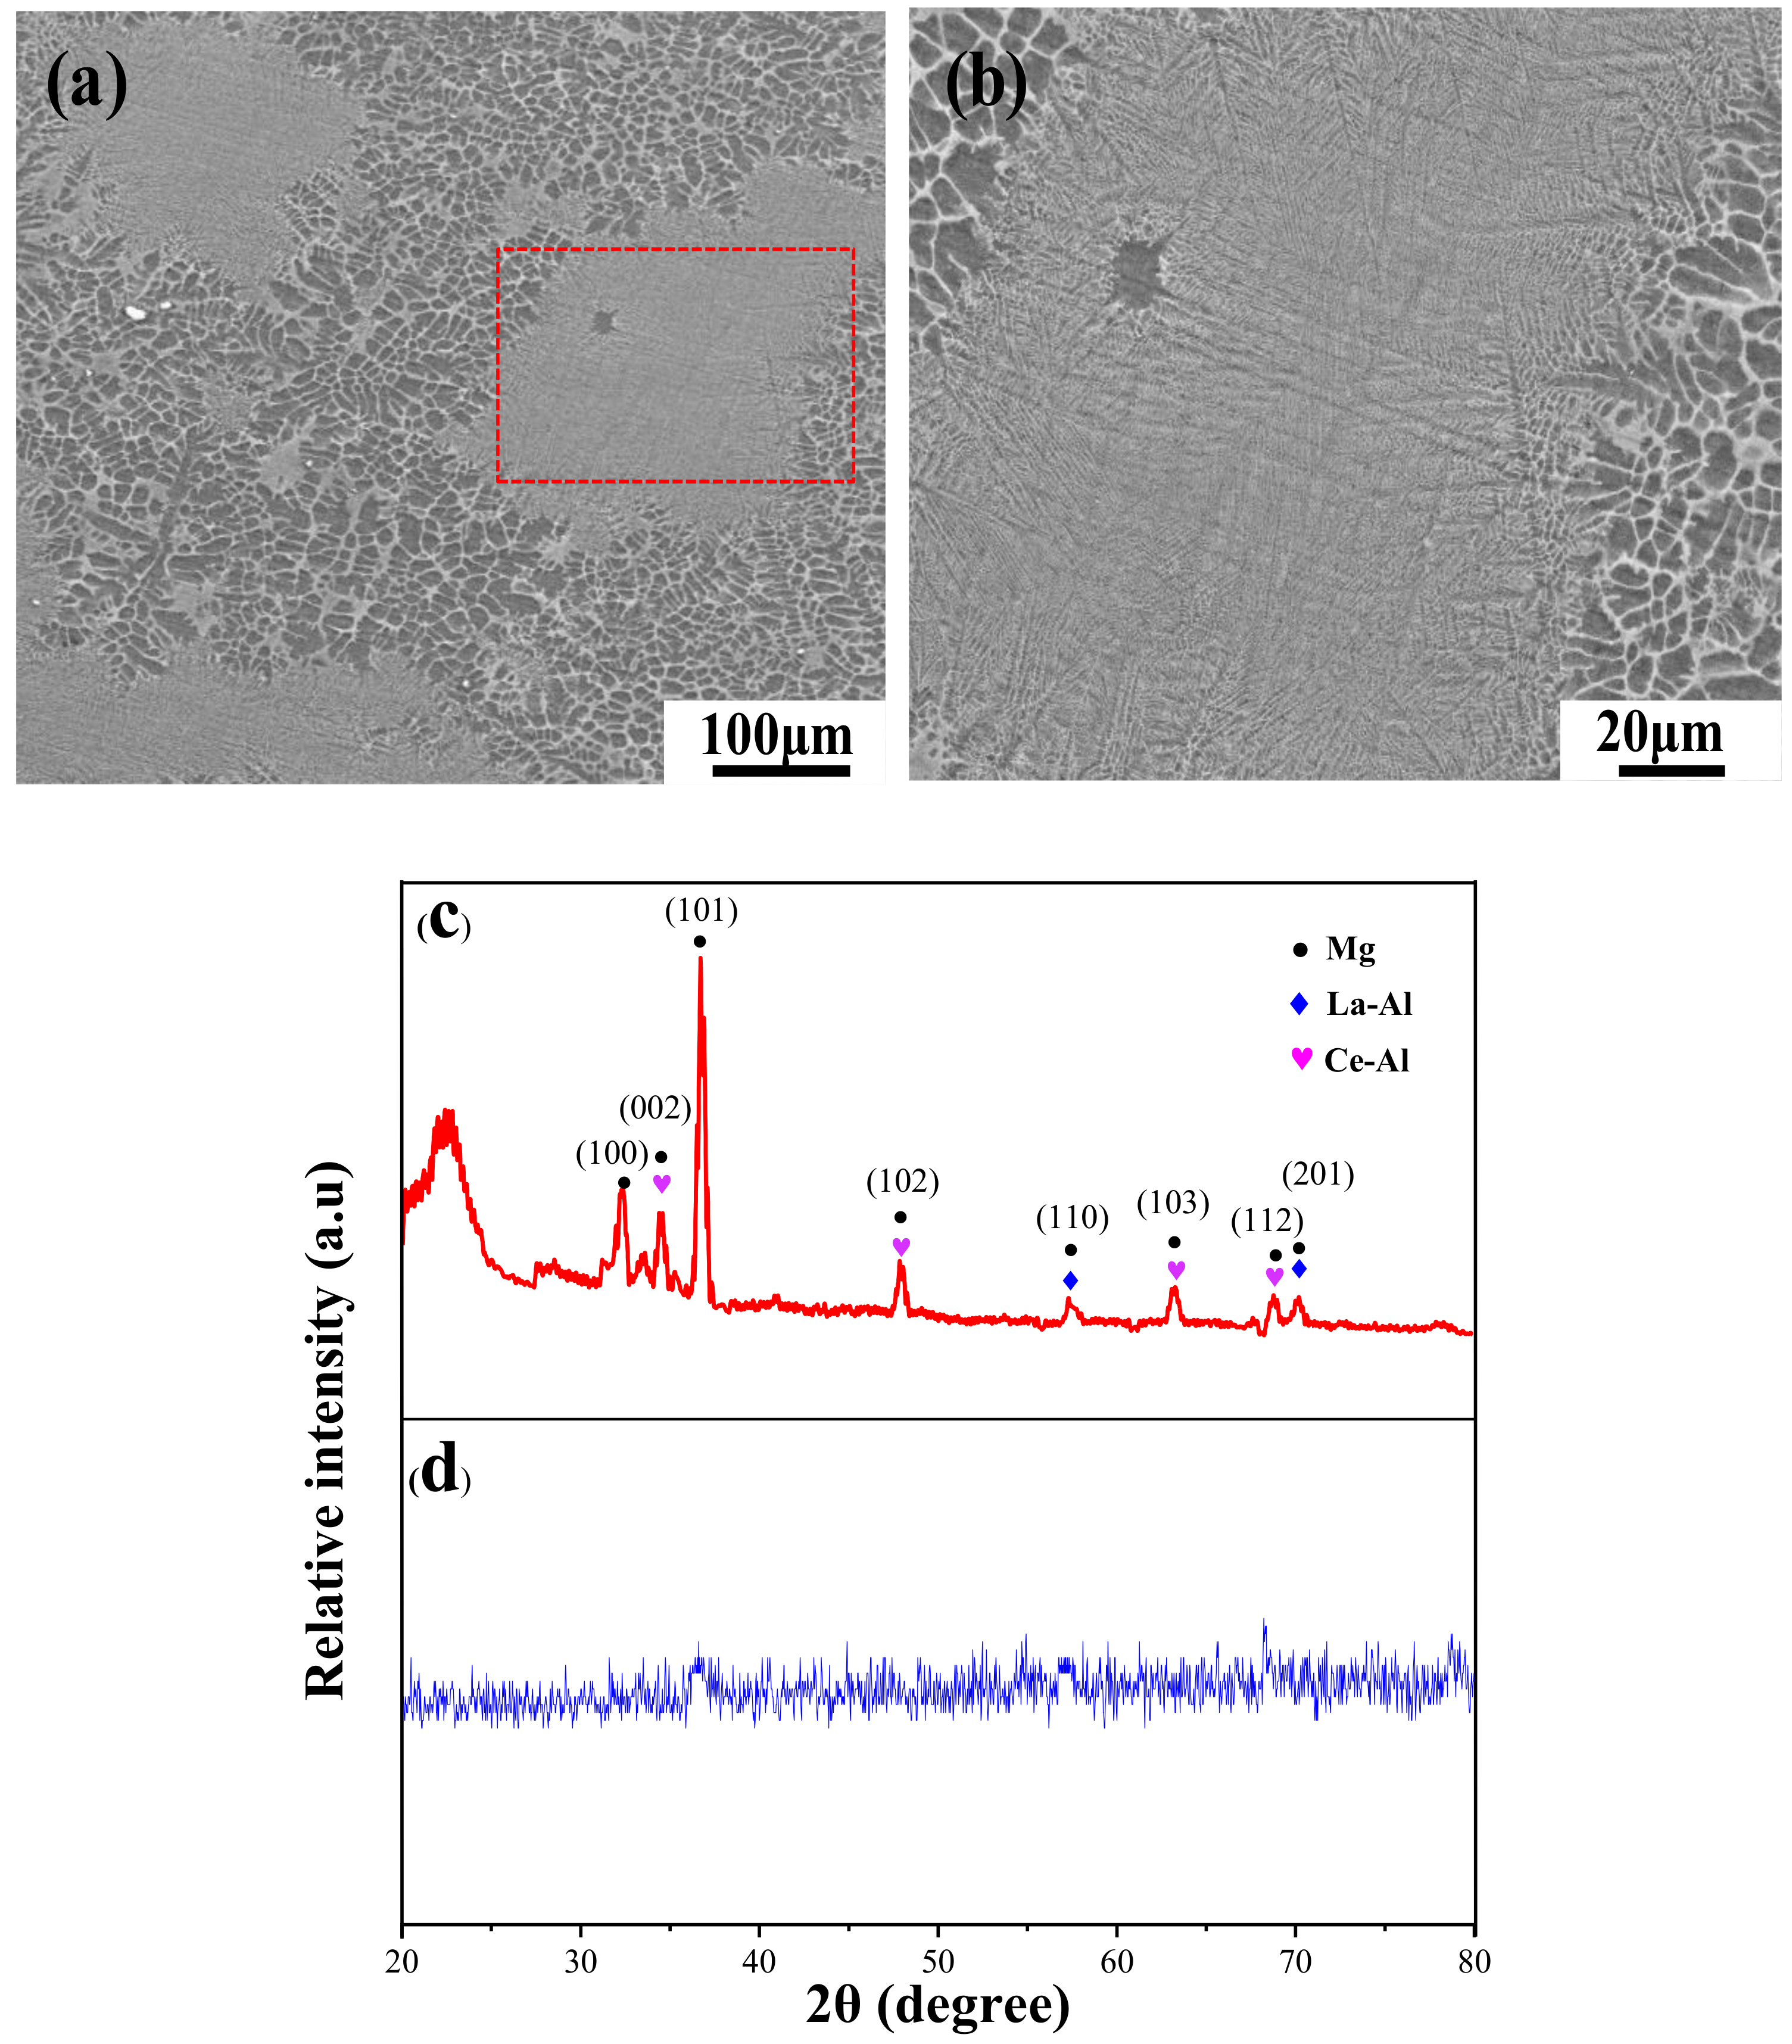
The Mg-RE alloy sheet was prepared using a vertical-type twin-roll caster method. Its microscopic characterization experiments show that the crystal structure is crystalline phase containing amorphous phase.
(2)
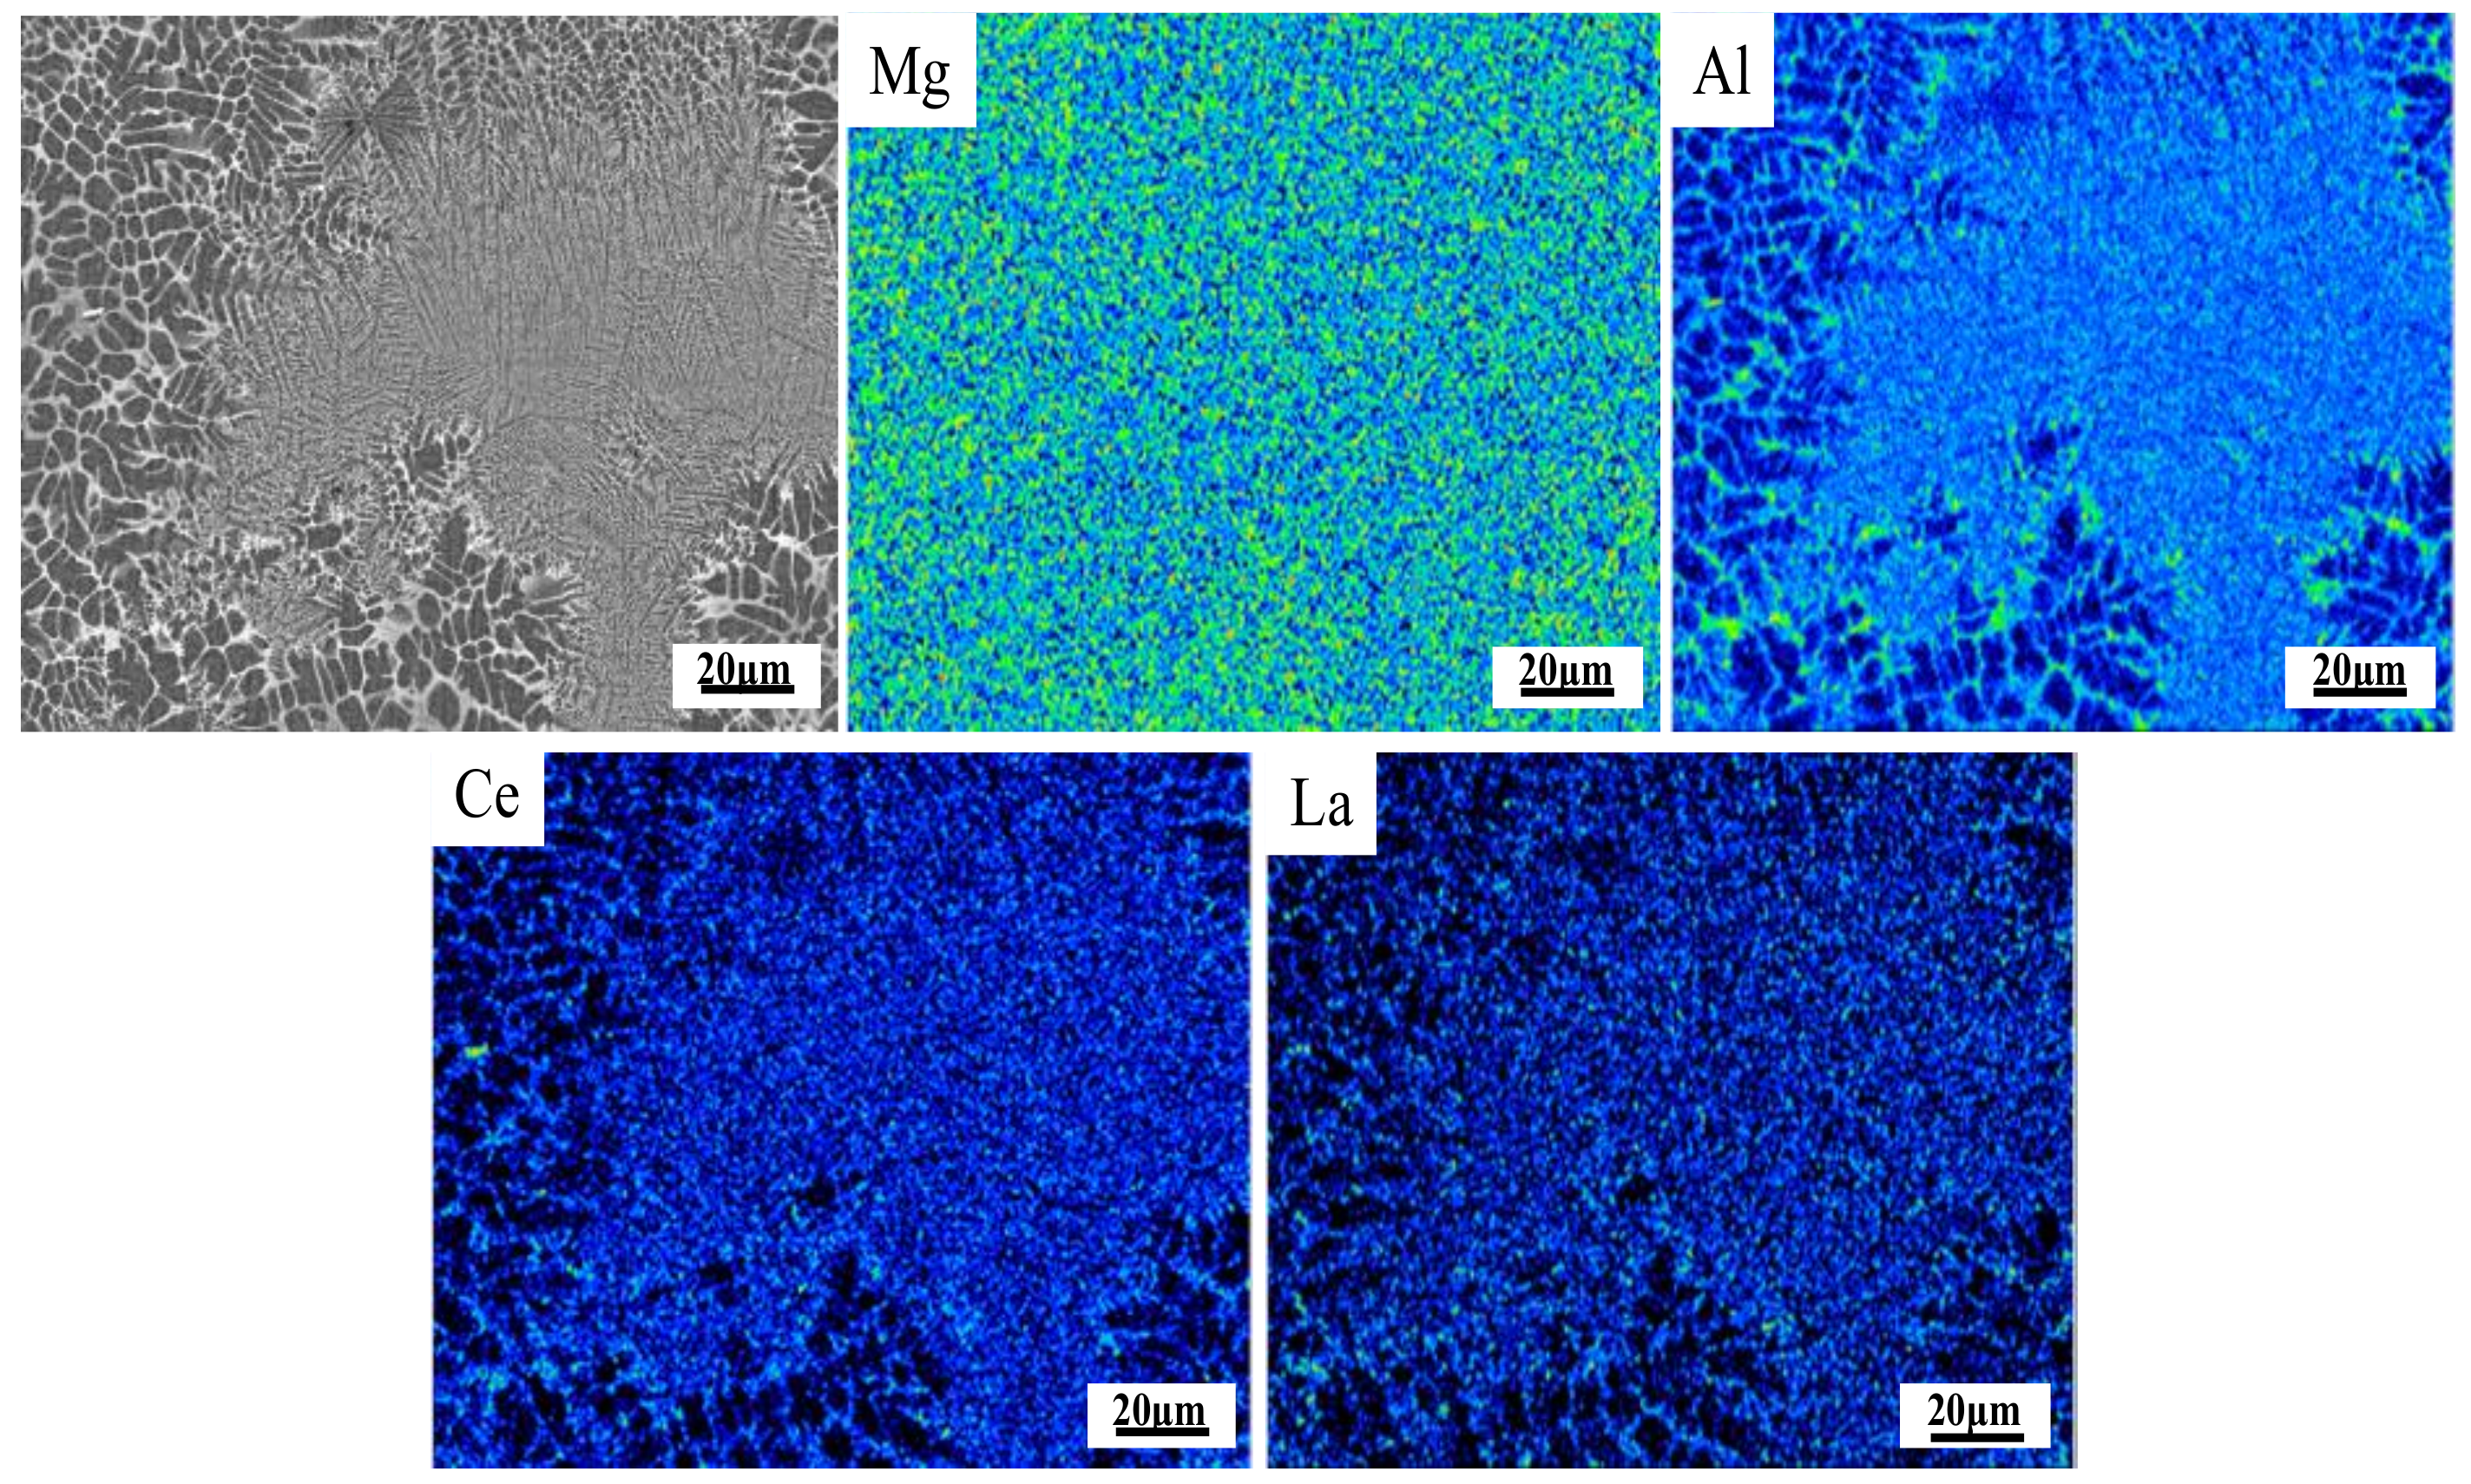
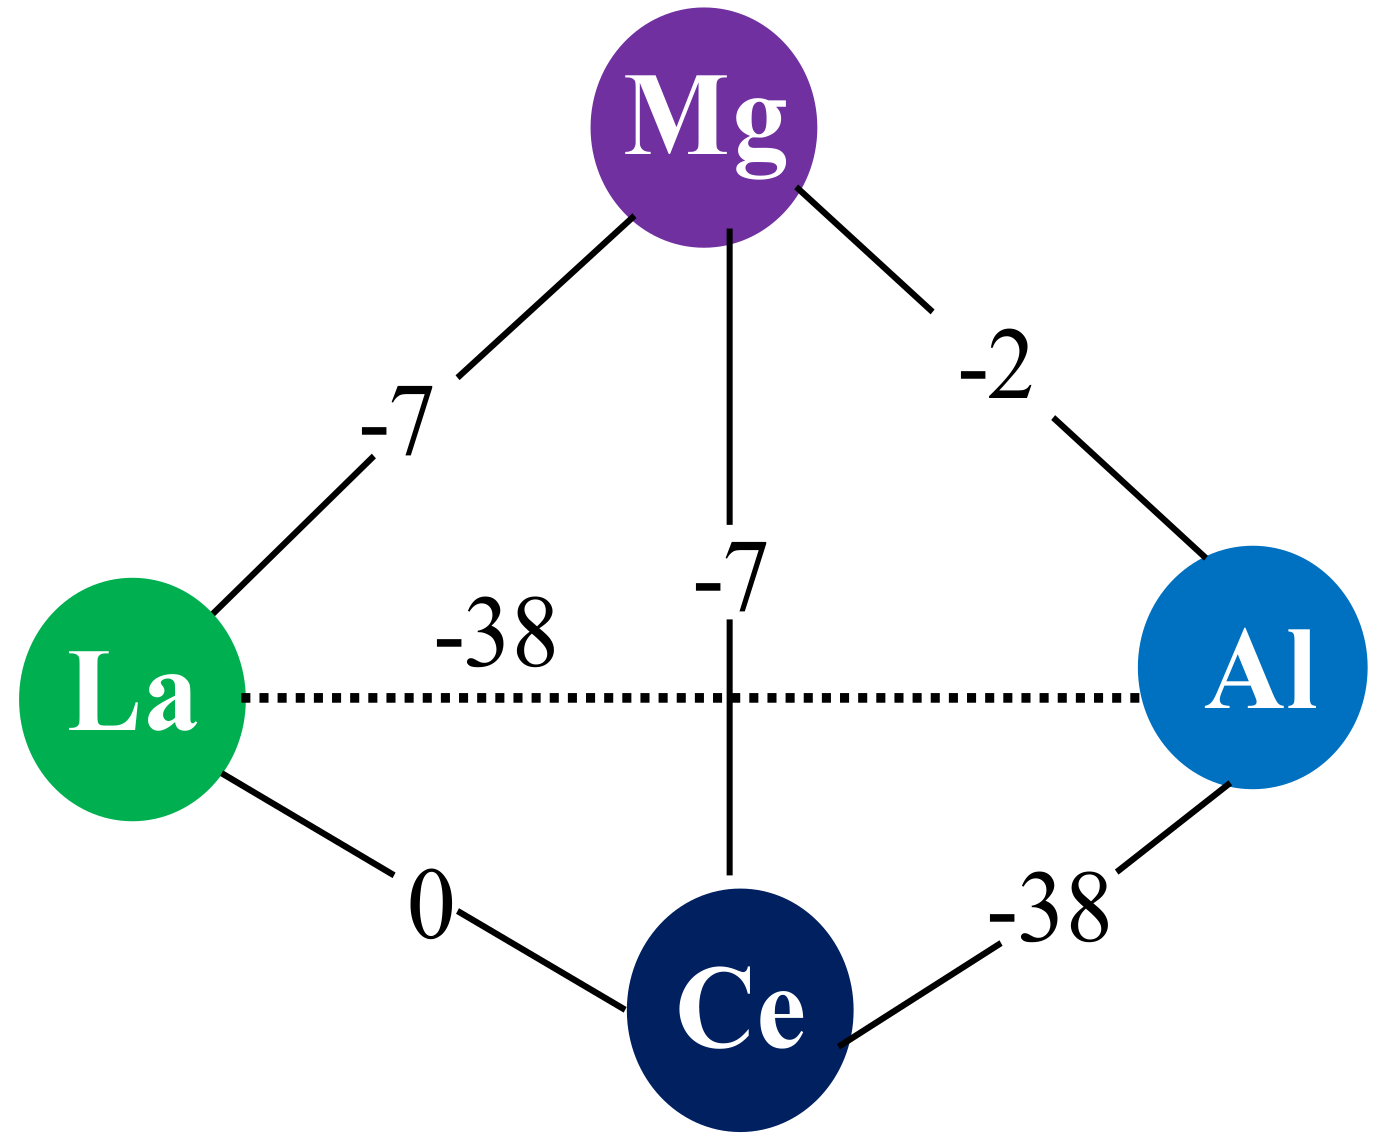
EPMA experiments show that Al, La and Ce elements are enriched in the amorphous phase region and the grain boundary region. However, Mg is evenly distributed throughout the microscopic region. This shows that segregation is more likely to affect Al, La and Ce elements.
(3)
Electrochemical tests and immersion test results revealed that Mg-RE sheet with TRC has a better corrosion resistance than master alloy, and a uniform corrosion layer on the surface.
(4)
In vivo, as an implant material, the tests show that Mg-RE alloys sheets were safe with respect to rat physical fitness and induced new bone formation; thus, they were promising for utilization as implant materials in the future.

Author Contributions

H.W. (Haijian Wang) and D.J. conceived and designed the experiments; H.W. (Haijian Wang) and H.W. (Haiwei Wang) performed the experiments; H.W. (Haijian Wang) and D.J. analyzed the data; and H.W. (Haijian Wang) wrote the paper.

Funding

This research received no external funding.

Acknowledgments

This research receives support from the High-Tech Research Center and Nano-technology Project at Saitama Institute of Technology. All animal experimental protocols were conducted in compliance with the Guiding Principles for the Care and Use of Animals in the Field of Physiological Sciences approved by the council of the Physiological Society of Japan, and were permitted by the Animal Institutional Review Board of Saitama Institute of Technology in accordance with the guidelines of the U.S. National Institutes of Health.

Conflicts of Interest

The authors declare no conflict of interest.

References

  1. Green, A.L.; Ma, E. Bulk Metallic Glasses: At the Cutting Edge of Metals Research. MRS Bull. 2007, 32, 611–619. [Google Scholar] [Green Version]
  2. Chen, Q.Z.; Thouas, G.A. Metallic implant biomaterials. Mater. Sci. R 2015, 87, 1–57. [Google Scholar] [CrossRef]
  3. Wise, D.L.; Trantolo, D.J.; Altobelli, D.E.; Yaszemsk, M.J.; Grasser, J.D. Human Biomaterials Application; Humana Press: Totowa, NJ, USA, 1996. [Google Scholar]
  4. Yaszemsk, M.J.; Trantolo, D.J.; Lewandrowski, K.U.; Hasirci, V.; Altobelli, D.E.; Wise, D.L. Biomaterials in Orthopedics; Marcel Dekker Inc.: New York, NY, USA, 2004. [Google Scholar]
  5. Matusiewicz, H. Potential release of in vivo trace metals from metallic medical implants in the human body: From ions to nanoparticles—a systematic analytical review. Acta Biomater. 2014, 10, 2379–2403. [Google Scholar] [CrossRef] [PubMed]
  6. Heary, R.F.; Parvathreddy, N.; Sampath, S.; Agarwal, N. Elastic modulus in the se-lection of interbody implants. J. Spine Surg. 2017, 3, 163–167. [Google Scholar] [CrossRef] [PubMed]
  7. Andreas, A.K.; Jörg, F.L.; Florian, H.D.T. Rapid Solidification and Bulk Metallic Glasses—Processing and Properties. In Materials Processing Handbook; CRC Press: Boca Raton, FL, USA, 2007; pp. 17-1–17-44. [Google Scholar]
  8. Masumoto, T.; Maddin, R. The mechanical properties of palladium 20 a/o silicon alloy quenched from the liquid state. Acta Metall. 1971, 19, 725–741. [Google Scholar] [CrossRef]
  9. Liebermann, H.; Graham, C. Production of amorphous alloy ribbons and effects of apparatus parameters on ribbon dimensions. IEEE Trans. Magn. 1976, 12, 921–923. [Google Scholar] [CrossRef]
  10. Narasimhan, M.C. Continuous casting method for metallic strips. U.S. Patent 4,142,571, 22 October 1979. [Google Scholar]
  11. Inoue, A.; Nakamura, T.; Sugita, T.; Zhang, T.; Masumoto, T. Bulky La-Al-TM (TM=Transition Metal) Amorphous Alloys with High Tensile Strength Produced by a High-Pressure Die Casting Method. Mater. Trans. JIM 1993, 34, 351–358. [Google Scholar] [CrossRef]
  12. Barekar, N.S.; Dhindaw, B.K. Twin-roll casting of Aluminum alloys—An overview. Mater. Manuf. Process. 2014, 29, 651–661. [Google Scholar] [CrossRef]
  13. Chen, H.S.; Miller, C.E. A Rapid Quenching Technique for the Preparation of Thin Uniform Films of Amorphous Solids. Rev. Sci. Instrum. 1970, 41, 1237–1238. [Google Scholar] [CrossRef]
  14. East, D.R.; Kellam, M.; Gibson, M.A.; Seeber, A.; Liang, D.; Nie, J.F. Amorphous magnesium sheet produced by twin roll casting. Mater. Sci. Forum 2010, 654, 1078–1081. [Google Scholar] [CrossRef]
  15. Lee, J.G.; Park, S.S.; Lee, S.B.; Chung, H.T.; Kim, N.J. Sheet fabrication of bulk amorphous alloys by twin-roll strip casting. Scr. Mater. 2005, 53, 693–697. [Google Scholar] [CrossRef]
  16. Oh, Y.S.; Lee, H.; Lee, J.G.; Kim, N.J. Twin-Roll Strip Casting of Iron-Base Amorphous Alloys. Mater. Trans. 2007, 48, 1584–1588. [Google Scholar] [CrossRef] [Green Version]
  17. Urata, A.; Nishiyama, N.; Amiya, K.; Inoue, A. Continuous casting of thick Fe-base glassy plates by twin-roller melt-spinning. Mater. Sci. Eng. A 2007, 449, 269–272. [Google Scholar] [CrossRef]
  18. Suzuki, T.; Anthony, A.M. Rapid quenching on the binary systems of high temperature oxides. Mater. Res. Bull. 1974, 9, 745–753. [Google Scholar] [CrossRef]
  19. Lee, J.G.; Lee, H.; Oh, Y.S.; Lee, S.; Kim, N.J. Continuous fabrication of bulk amorphous alloy sheets by twin-roll strip casting. Intermetallics 2006, 14, 987–993. [Google Scholar] [CrossRef]
  20. Hofmann, D.C.; Roberts, S.N.; Johnson, W.L. Twin Roll Sheet Casting of Bulk Metallic Glasses and Composites in an Inert Environment. U.S. Patent 20130025746 A1, 31 January 2013. [Google Scholar]
  21. Ding, P.-D.; Pan, F.-S.; Jiang, B.; Wang, J.; Li, H.-L.; Wu, J.-C.; Xu, Y.-W.; Wen, Y. Twin-roll strip casting of magnesium alloys in China. Trans. Nonferrous Metals Soc. China 2008, 18, s7–s11. [Google Scholar] [CrossRef]
  22. Hu, X.; Ju, D.; Zhao, H. Thermal flow simulation of twin-roll casting magnesium alloy. J. Shanghai Jiaotong Univ. 2012, 17, 479–483. [Google Scholar] [CrossRef]
  23. Luo, L.T.; Gong, X.B.; Li, J.Z.; Kang, S.B.; Cho, J.H. Microstructure and Mechanical Properties of Severely Deformed Mg-4.5Al-1.0Zn Alloy Processed by Asymmetric Rolling on Ingot and Twin Roll Cast Strip. Mater. Res. 2016, 19, 207–214. [Google Scholar] [CrossRef] [Green Version]
  24. Park, S.S.; Park, W.J.; Kim, C.H.; You, B.S.; Kim, N.J. The Twin-Roll Casting of Magnesium Alloys. JOM 2009, 61, 14–18. [Google Scholar] [CrossRef]
  25. Pei, Z.P.; Ju, D.Y.; Li, X. Simulation of critical cooling rate and process conditions for metallic glasses in vertical type twin-roll casting. Trans. Nonferrous Met. Soc. China 2017, 27, 2406–2414. [Google Scholar] [CrossRef]
  26. Holzwarth, U.; Gibson, N. The Scherrer equation versus the ‘Debye-Scherrer equation’. Nat. Nanotechnol. 2011, 6, 534. [Google Scholar] [CrossRef] [PubMed]
  27. Pecharsky, V.K.; Zavalij, P.Y. Properties, Sources, and Detection of Radiation. In Fundamentals of Powder Diffraction and Structural Characterization of Materials; Springer: Boston, MA, USA, 2009; pp. 107–132. [Google Scholar]
  28. Jung, I.-H.; Sanjari, M.; Kim, J.; Yue, S. Role of RE in the deformation and recrystallization of Mg alloy and a new alloy design concept for Mg–RE alloys. Scr. Mater. 2015, 102, 1–6. [Google Scholar] [CrossRef]
  29. Takeuchi, A.; Inoue, A. Calculations of mixing enthalpy and mismatch entropy for ternary amorphous alloy. Mater. Trans. JIM 2000, 41, 1372–1378. [Google Scholar] [CrossRef]
  30. Inoue, A. Stabilization of metallic supercooled liquid and bulk amorphous alloys. Acta Mater. 2000, 48, 279–306. [Google Scholar] [CrossRef]
  31. Anawati, A.; Asoh, H.; Ono, S. Effects of alloying element Ca on the corrosion behavior and bioactivity of anodic films formed on AM60 Mg alloys. Materials 2017, 10, 11. [Google Scholar] [CrossRef] [PubMed]
  32. Song, Y.; Han, E.; Shan, D.; Yim, C.D.; You, B.S. Effect of hydrogen on the corrosion behavior of the Mg–xZn alloys. Corros. Sci. 2012, 60, 238–245. [Google Scholar]
  33. Zhang, B.; Hou, Y.; Wang, X.; Wang, Y.; Geng, L. Effects of solidification cooling rate on the corrosion resistance of Mg–Zn–Ca alloy. Mater. Sci. Eng. C 2011, 31, 1667–1673. [Google Scholar] [CrossRef]
  34. Bakhsheshi-Rad, R.; Abdul-Kadir, M.R.; Idris, M.H.; Farahany, S. Relationship between the corrosion behavior and the thermal characteristics and microstructure of Mg–0.5Ca–xZn alloys. Corros. Sci. 2012, 64, 184–197. [Google Scholar]
  35. Makar, G.L.; Kruger, J. Corrosion of magnesium. Intern. Mater. Rev. 1993, 38, 138–153. [Google Scholar] [CrossRef]
  36. Witte, F.; Kaese, V.; Haferkamp, H.; Switzer, E.; Meyer-Lindenberg, A.; Wirth, C.J.; Windhagen, H. In vivo corrosion of four magnesium alloys and the associated bone response. Biomaterials 2005, 26, 3557–3563. [Google Scholar] [CrossRef]
  37. Janning, C.; Willbold, E.; Vogt, C.; Nellesen, J.; Meyer-Lindenberg, A.; Windhagen, H.; Windhagen, F.; Thorey, F.W. Magnesium hydroxide temporarily enhancing osteoblast activity and decreasing the osteoclast number in peri-implant bone remodelling. Acta Biomater. 2010, 6, 1861–1868. [Google Scholar] [CrossRef] [PubMed]
  38. Yang, J.X.; Cui, F.Z.; Lee, I.S.; Zhang, Y.; Yin, Q.S.; Xia, H.; Yang, S.X. In vivo biocompatibility and degradation behavior of Mg alloy coated by calcium phosphate in a rabbit model. J. Biomater. Appl. 2012, 27, 153–164. [Google Scholar] [CrossRef] [PubMed]
  39. Yoshizawa, S.; Brown, A.; Barchowsky, A.; Sfeir, C. Magnesium ion stimulation of bone marrow stromal cells enhances osteogenic activity, simulating the effect of magnesium alloy degradation. Acta Biomater. 2014, 10, 2834–2842. [Google Scholar] [CrossRef] [PubMed]
Figure 1. Schematic diagram of the manufacturing process for magnesium alloy sheets.
Metals 09 01075 g001
Figure 2. SEM morphologies (a) and the precipitation by EDS analysis (b) of as-cast Mg-RE alloy ingot.
Metals 09 01075 g002
Figure 3. The SEM micrographs and X-ray diffractometry (XRD) patterns of as-cast Mg-RE sheet: (a,c) SEM micrographs and XRD of the Mg-RE sheets. (b,d) SEM micrograph and μ-XRD of local amorphous region.
Metals 09 01075 g003
Figure 4. The major element distribution of the Mg-RE alloy sheet with TRC samples.
Metals 09 01075 g004
Figure 5. The values of ∆ H [ A B ] m i x (KJ/mol) calculated by Miedma’s model for atomic pairs between major elements of Mg-RE sheet samples.
Metals 09 01075 g005
Figure 6. (a,b) TEM specimen by FIB technique of Mg-RE sheet with TRC; (c) SEM and FIB processing area on the Mg-RE sheet surface; (d) TEM image and high-resolution morphology.
Metals 09 01075 g006
Figure 7. Electrochemical behaviors of the Mg-RE alloy ingot sample and the sheet with TRC sample in PBS solution: (a) polarization curves; (b) equivalent circuit and Nyquist plots of the real part Z′ vs. the imaginary part Z″; (c) Bode plots of |Z| vs. frequency; and (d) Bode plots of phase angle vs. frequency.
Metals 09 01075 g007
Figure 8. Cross-sectional SEM micrographs of corrosion morphology of (a) the Mg-RE alloy ingot sample and (b) the sheet with TRC sample in the PBS solution at 310 K for 10 days.
Metals 09 01075 g008
Figure 9. Metallic ion concentrations of the PBS solution at 310 K with (a) Mg-RE alloy ingot sample and (b) sheet with TRC sample at day 10, day 20 and day 30 under immersion testing.
Metals 09 01075 g009
Figure 10. Determination of the volume of the degrading Mg-RE alloy sheet and bone growth changes, depicted in MicroCT 3D rendering after implantation times of 2 weeks (a,c) and 6 weeks (b,d). A cross section slice of femoral-sheet contact area observed after 6 weeks (e) shows that the new bone (Nb is represented in green) was formed between the Mg-RE alloy sheet (S) and the original bone (Ob is represented in blue).
Metals 09 01075 g010
Figure 11. Mg-RE sheet degradation after 6 weeks was estimated by the volume of quantification. This shows a sheet volume loss of 9.32 ± 0.86 mm3 after 6 weeks. MicroCT 3D rendering after 2 weeks shows there was no obvious change in bone growth around the degrading Mg-RE sheet. By 6 weeks, as new bone formed between the sheet and the bone, a notable change in bone volume was observed from 2 to 6 weeks.
Metals 09 01075 g011
Table 1. Composition and the atomic radius of the Mg-RE alloy (atomic radius difference between Mg (Al) and other elements is symbolized by ARDMg (ARDAl).
ElementsMgAlSiMnCuFeZnLaCe
at%95.2533.4600.1450.1320.0400.0410.0530.2970.579
wt%90.7703.6600.1600.2840.1010.0900.1361.6183.181
Radius/nm0.1600.1430.1340.1320.1280.1260.1390.1870.182
ARDMg/%-10.6316.2517.5020.0021.2513.1316.8713.75
ARDAl/%11.88-6.297.6910.5011.882.7830.7727.27
Table 2. Crystallite sizes of the Mg-RE alloy sheet, calculated by Scherrer equation.
(hkl)(100)(002)(101)(102)(110)(103)
Dhkl/nm5.114.27.810.616.617.9
Table 3. Result of the electrochemical polarization tests in PBS solution.
SampleEcorr
(V)
Icorr
(μA)
Rs
(Ω·cm−2)
Rf
(Ω·cm−2)
CPE1
(F)
CPE2
(F)
Rt
(Ω·cm−2)
Rp
(Ω·cm−2)
Ingot−1.371.74 × 10−350.7322.727.1 × 10−52.60 × 10−2528.37410.12
Sheet−1.081.51 × 10−456.61216.184.03 × 10−61.57 × 10−44655.124920.25

