The Effect of Soaking on Segregation and Primary-Carbide Dissolution in Ingot-Cast Bearing Steel


Division of Processes, Department of Materials Science and Engineering, KTH Royal Institute of Technology, Brinellvägen 23, 100 44 Stockholm, Sweden
Metals 2018, 8(10), 800; https://doi.org/10.3390/met8100800
Submission received: 18 September 2018
/
Revised: 1 October 2018
/
Accepted: 2 October 2018
/
Published: 6 October 2018
Abstract
:In this work, segregation in the cast and hot worked structure, as well as the effects of soaking on macro and micro segregation, in hypereutectoid bearing steel produced by ingot casting were studied. Samples were selected from ingots that where either as cast or soaked for twenty hours. Two similar bearing steel grades were used for this investigation. For the as cast ingot, samples were selected from both A-segregation channel regions and the matrix region. Samples were also selected from hot-worked bars originating from ingots that had been soaked for four hours or twenty hours. Micro and macro examinations of the microstructures were conducted and compared. In addition, a segregation analysis of the substitutional solute elements was performed using EDX equipment mounted on a Scanning Electron Microscope (SEM). EMPA mapping of the composition pattern in the bulk, as well as the carbides, was conducted. Precipitation of M3C, M2C, and M6C was observed. The carbides at A-segregation channels were found to have a different morphology to those precipitated in the bulk matrix. After soaking at 1200 °C for 4 h, all the primary carbides are dissolved.
1. Introduction
The steel used for the fabrication of ball bearings needs to endure severe cyclic and static loads to operate reliably in hostile environments. Bearings produced from this material include parts such as balls, bars, tubes, and rings. The steel used for bearings undergoes very large reductions in the plastic range, as it is formed from ingots into billets or blooms. Soaking is applied prior to hot working to reduce segregation that occurs as a result of solidification.
Two types of steel are used for producing most bearings: soft core steel with a hard surface, produced through case hardening or induction hardening, and steel hardened throughout the body due to the presence of martensitic or bainitic structures [1]. The bearing steel market has been historically dominated by steel possessing a 0.8–1.1 wt% C content and less than 3 wt% solute content [2]. The focus of this work is on two bearing steel grades, 100CrMnMoSi8-4-6 and 100CrMnSi6-4. Th100CrMnMoSi8-4-6 has high hardenability and is used for larger sections.
Bearing steel is usually cast using two methods: ingot casting and continuous bloom casting. The ingots cast by uphill casting undergo large forging or rolling reductions to achieve the required final quality. After solidification, the ingots are removed from the mold and sent to a soaking pit, where they are kept at a suitable temperature, known as the soaking temperature, for a certain time, known as the soaking time, before any initial rolling processes [3].
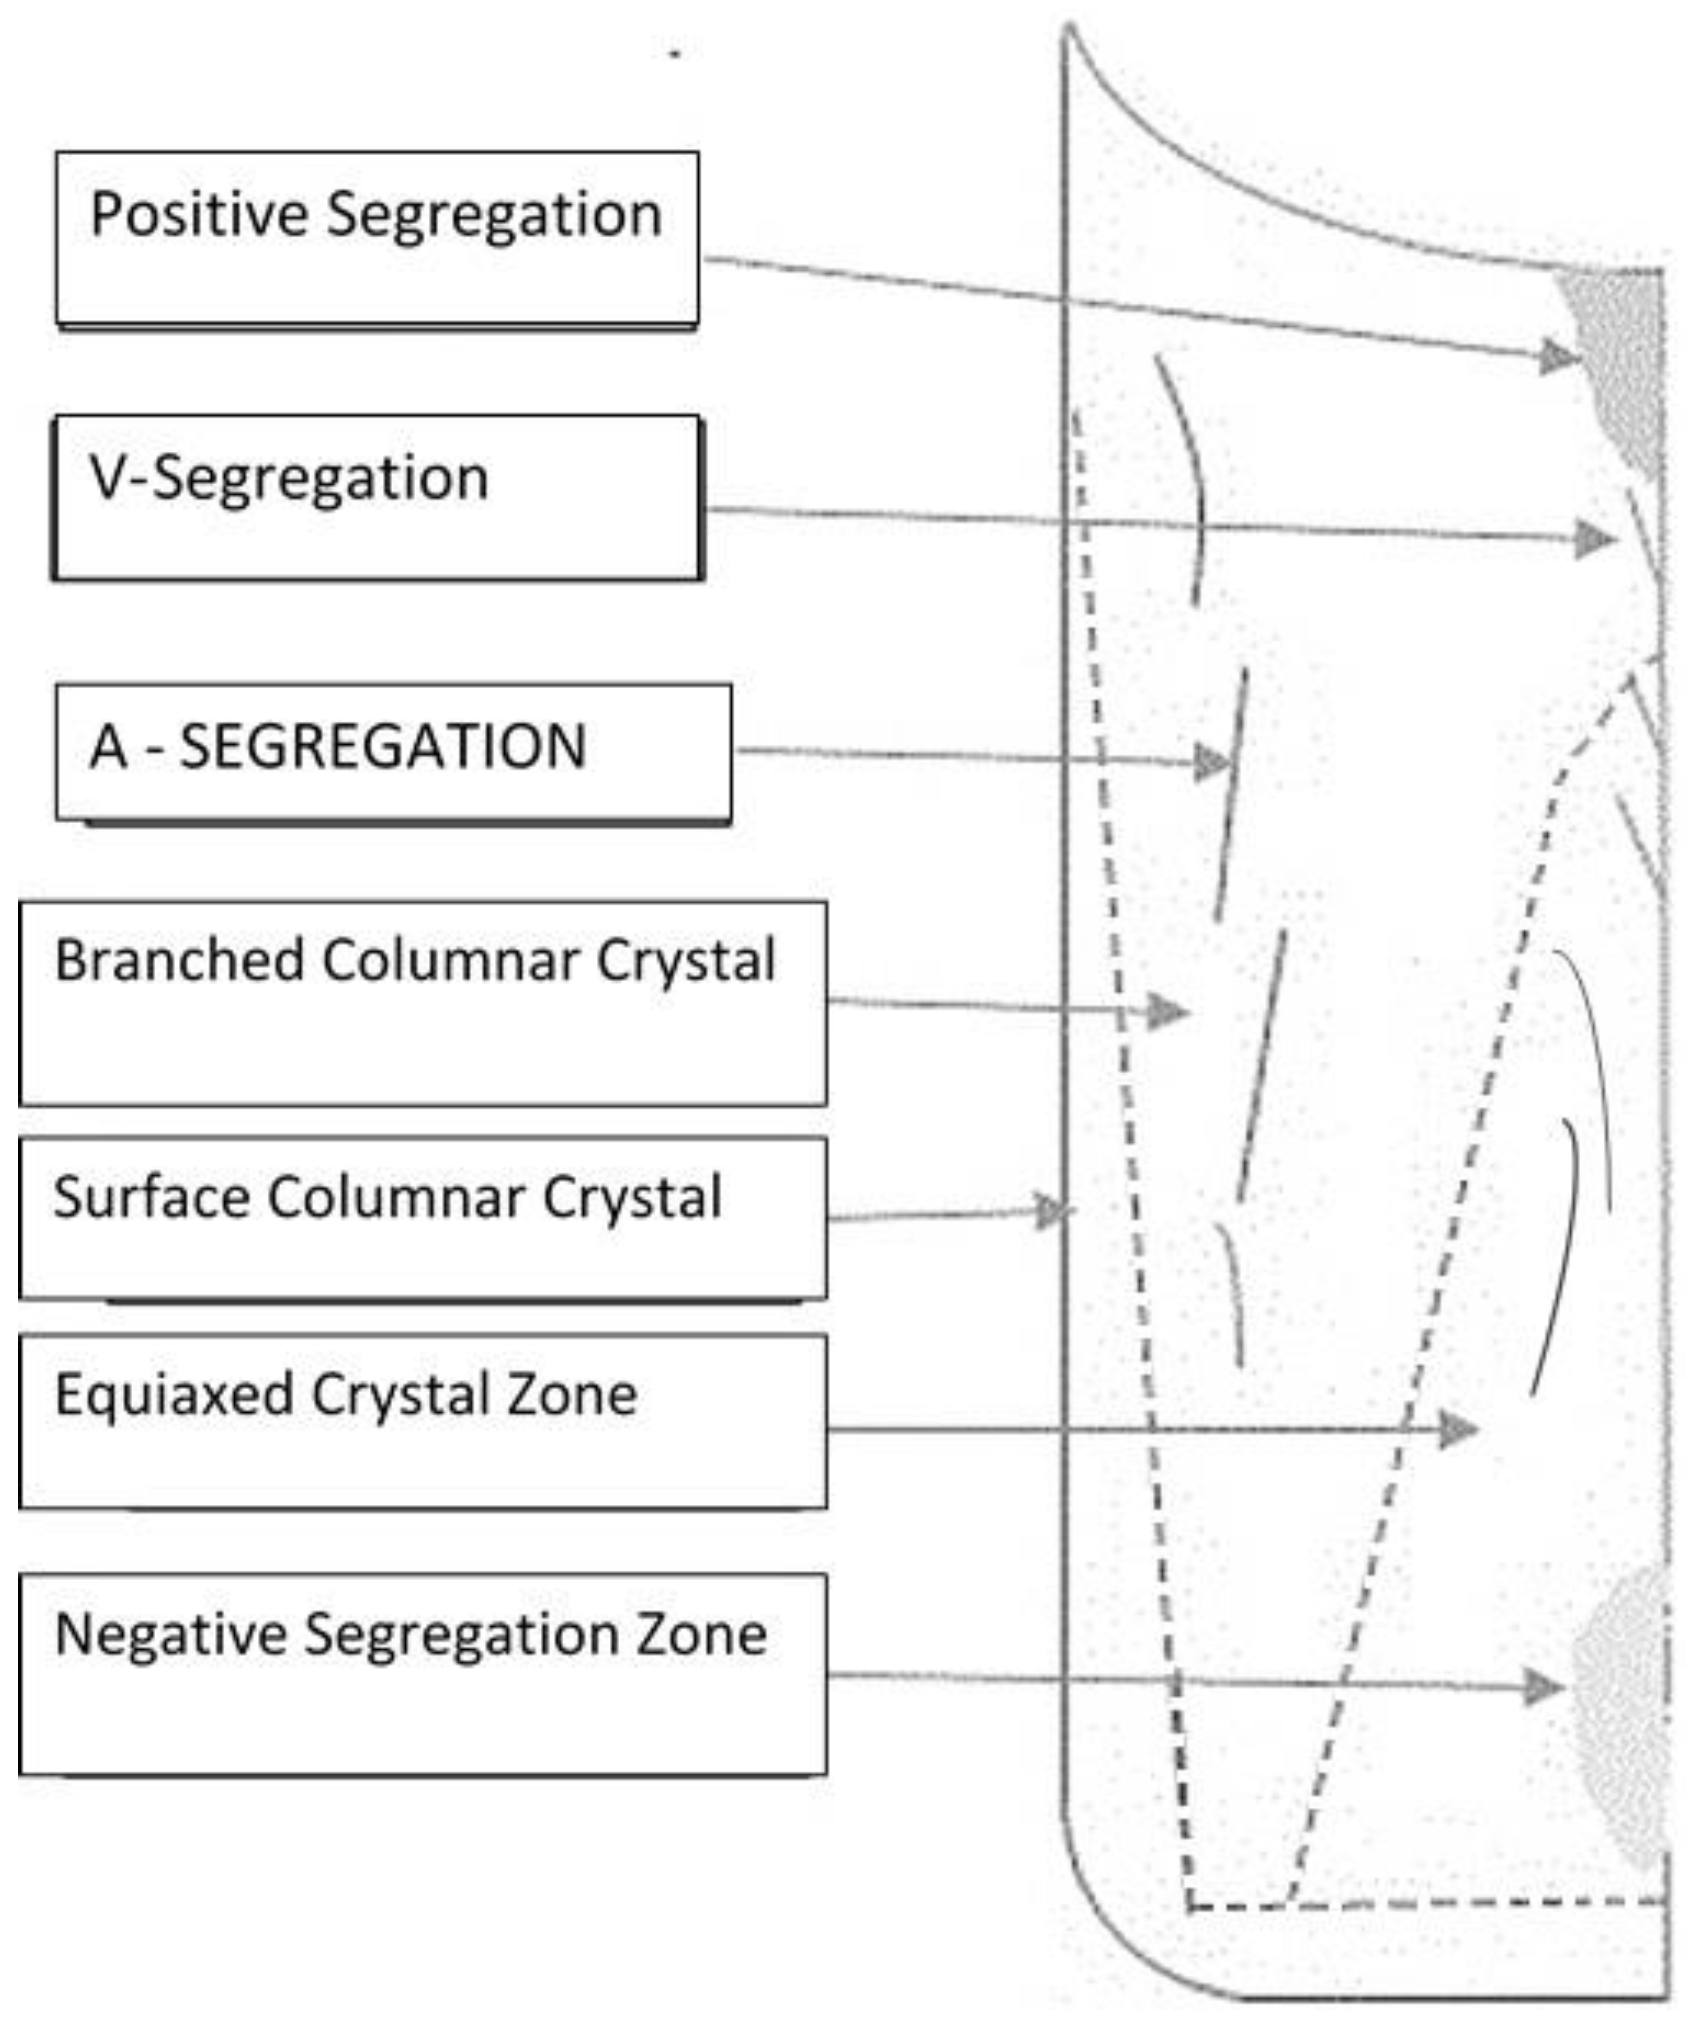
Several types of segregation take place in an ingot, as shown schematically in Figure 1, all of which are due to the same fundamental phenomena. The basic reason for the occurrence of these types of segregation is the natural convection due to thermal gradients, density differences in the liquid, and solidification shrinkage during solidification [4,5,6].
In the positive segregation areas, the solute concentration is higher than the mean concentration of solute, and in the negative segregation areas the solute concentration is less than the mean concentration of solute. The negative segregation area at the bottom part of the ingot is caused by sedimentation of free crystals.
A-segregation is characterized by pencil-like channels, which contain a very high solute concentration and are caused by upward flow of liquid that has a lower density than the bulk liquid. V-segregation is formed due to thermal contraction during solidification [4]. In addition to these, interdendritic segregation is also present, which adversely affects the mechanical properties of the material.
Interdendritic segregation or micro segregation is a result of the uneven distribution of alloying elements over short distances. If the partition constant between solid and liquid is less than 1, the solute elements become enriched in the remaining liquid. Also, if the diffusion rates of these elements are low in the solid state, the last solidified liquid present between the dendrite arms becomes even more enriched with solute elements [4].
In ball bearing steel, the alloying elements Cr and Mo will segregate to the interdendritic areas. The elements Cr and Mo have a strong affinity for carbon [1], and the melt finally precipitates primary carbides. This may result in the formation of large eutectic carbides. Some of these carbides become fragmented during mechanical working, but the particles remain coarse. These coarse carbide particles can serve as fatigue initiation sites and adversely affect the formability [1].
To counter the segregation and primary carbide precipitation caused during solidification, the ingots usually undergo soaking. Soaking or homogenization treatment has the same objective as a solution treatment and is carried out at a typical rolling temperature of 1200 °C, to homogenize the substitutional alloying elements in the austenitic region, as well as to make the distributions of other alloying elements more uniform [7]. The homogenization process is isothermal, and the diffusion has both short- and long-range controlling factors.
The diffusion process follows the Hume-Rothery rules [8] and occurs in the FCC-austenitic single phase field. However, this can also happen in the multiphase regime. The degree of homogenization achieved during soaking depends on several factors, including the soaking temperature and time, dendritic arm spacing, the diffusion coefficient of the diffusing element, and any chemical inhomogeneity [4]. Beswick [9] observed that for hypereutectoid steel, Cr influences carbide stability, and the diffusion of carbon is reduced at the carbide–matrix interface due to the slow diffusion of Cr. Beswick also observed growth of (FeCr)3C phase during soaking and concluded that, for an extended soaking time, the matrix becomes diluted of chromium, which reduces the hardenability of the matrix. In addition, when we relate the carbide dissolution during soaking to the Cr composition in the carbide and matrix, an equilibrium balance is observed between the composition of the chromium and carbon in the matrix, which is independent of the soaking condition. Kim et al. [10] concluded that the soaking time and temperature are dependent on the diameter of the largest carbide particle precipitated and calculated that the soaking time is dependent on Cr diffusivity. Reger et al. [11] summarized that the carbon concentration gradient acts as the driving force for solid state diffusion. Additionally, as the carbon composition difference decreases, the driving force decreases, and the homogenization process stops when the concentration difference is approximately 0.05–0.1 wt% carbon. Elements possessing a low diffusion coefficient react very sluggishly to the homogenization effect induced by hot working [12]. Fisher et al. [13] observed that, for a 300-μm dendrite arm spacing, to reduce the substitutional element segregation by 50%, a total of 35 h of soaking time is required at a soaking temperature of 1250 °C.
In the present work, the solidification structure and segregations in ingot cast ball bearing steel, as well as the structure and segregations in hot worked and soaked material, were investigated. Different etching techniques, as well as SEM EDX (Hitachi, Japan) measurements, were used to determine different types of primary carbide precipitations. Initially, calculations were carried out using the computational thermodynamic and kinetic tool, Thermo-Calc (2017b), to obtain guidance regarding the solidification mode with primary carbide precipitations and solid-state phase transformations [13,14,15].
2. Calculation of the Solidification Evolution by Means of Thermo-Calc
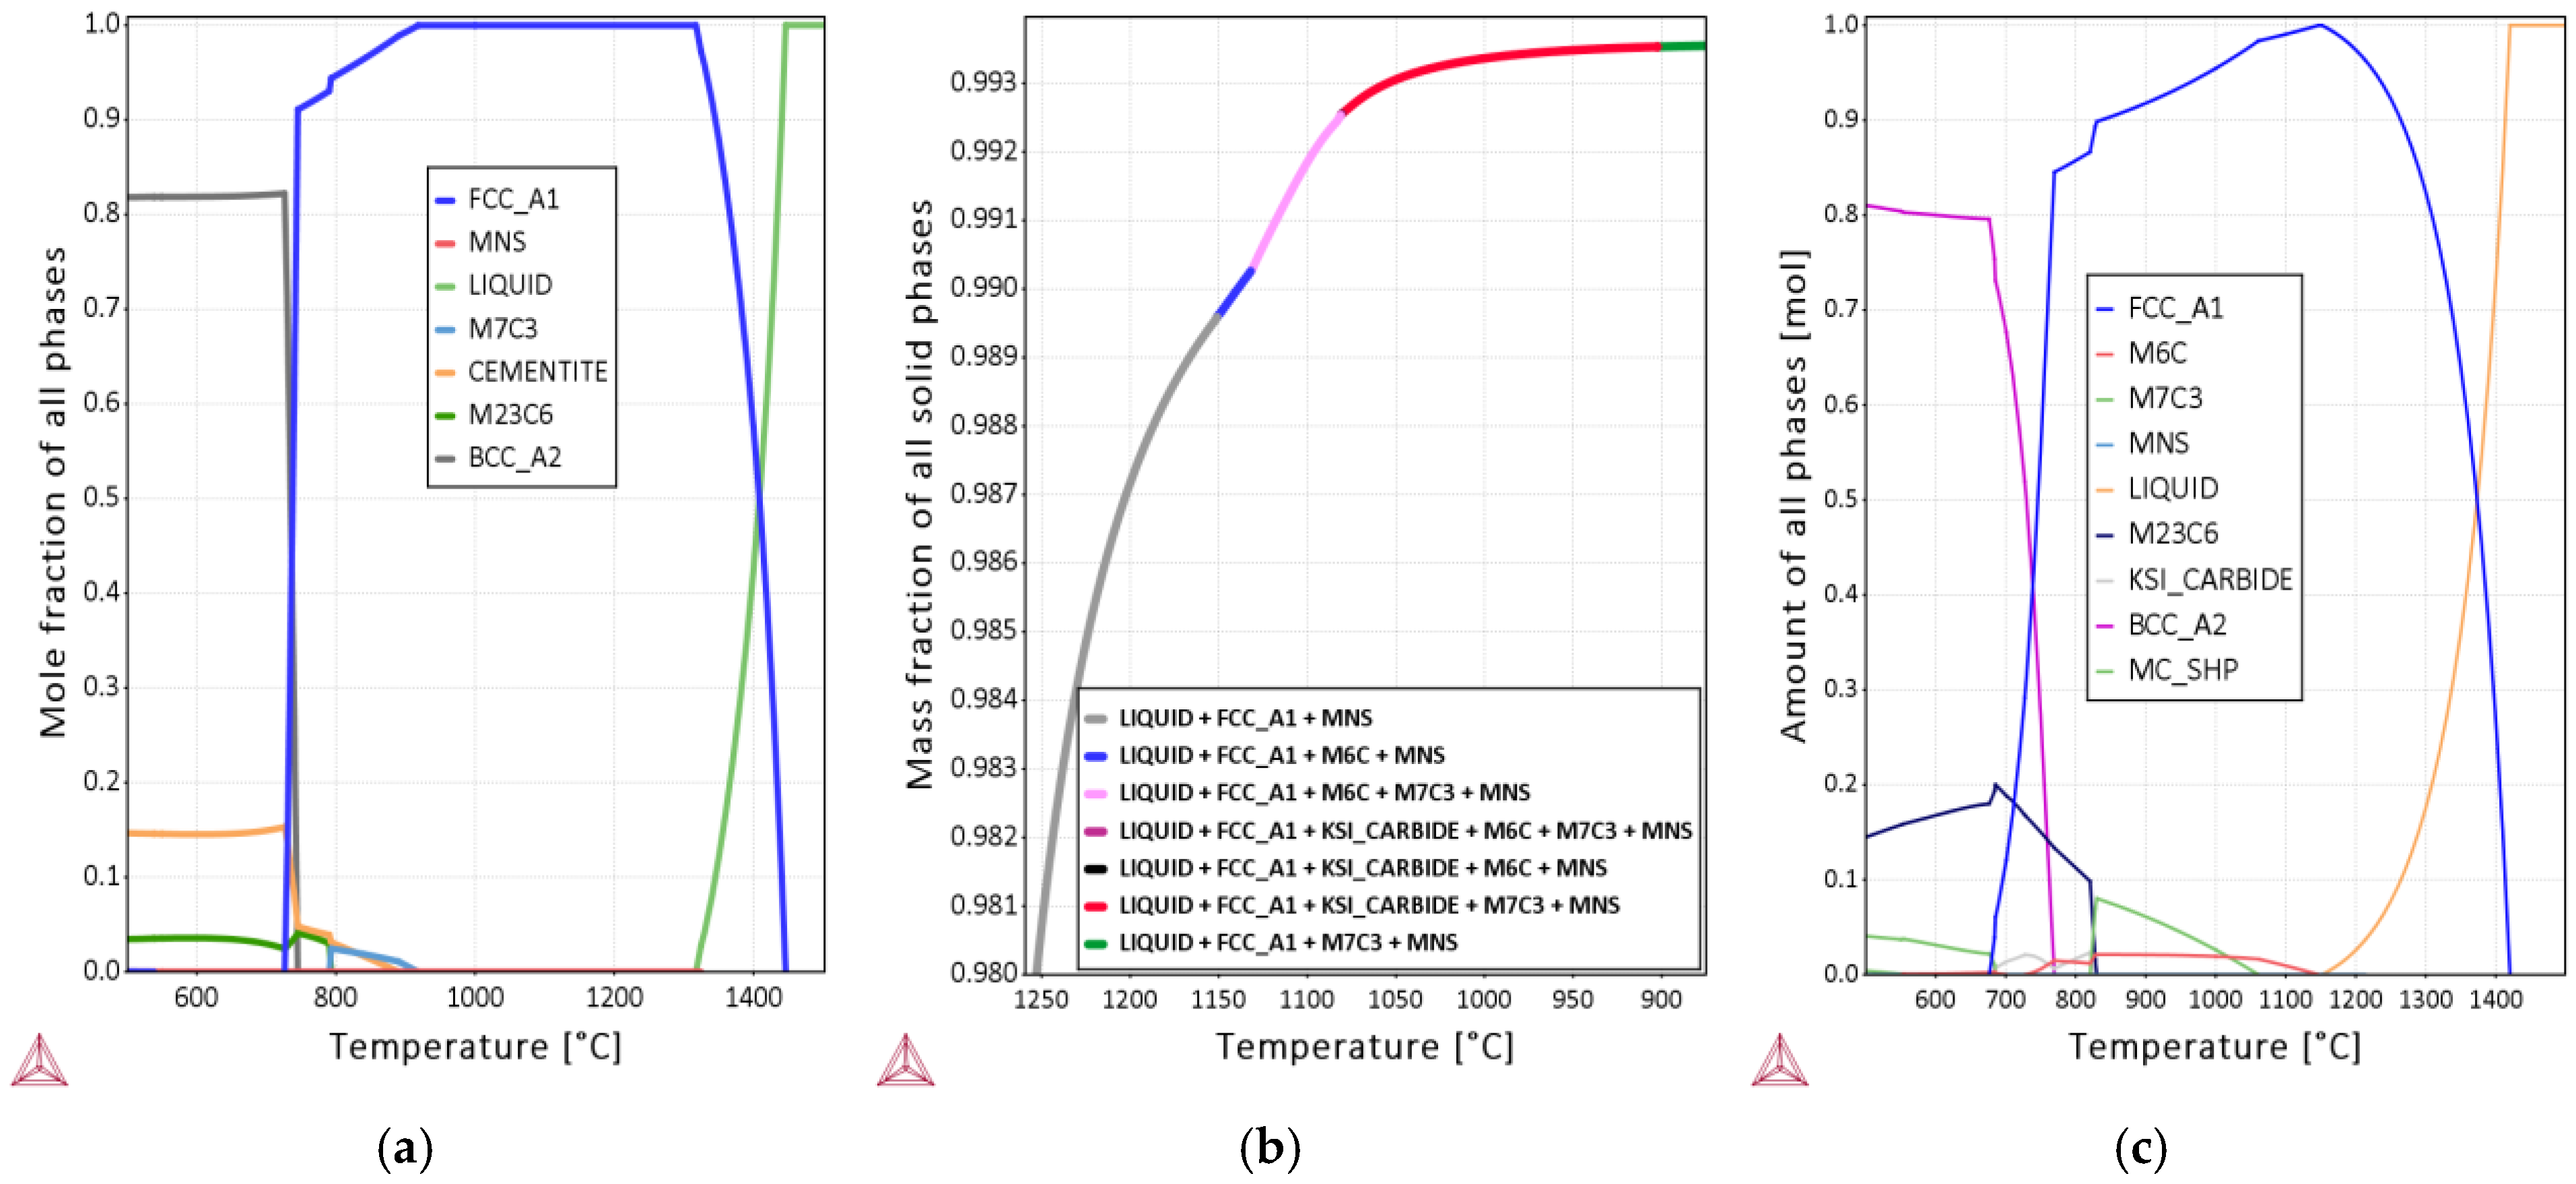
Thermo-Calc was used to model and predict the solidification evolution of the investigated alloy1, with composition presented in Table 1. First, equilibrium conditions were assumed with infinite diffusion rate. Figure 2a shows calculated fraction of phase versus temperature for all phases. The phase transformations with descending temperature can be expressed as follows:
| • | Solidification of austenite, | , starts at 1445 °C. |
| • | Manganese sulphide, | MnS, starts to precipitate at 1325 °C. Full solidification occurs at 1317 °C. |
| • | M7C3 | Carbide starts to precipitate at 915 °C. |
| • | Cementite, M3 C, starts to precipitate at 885 °C. | |
| • | M23C6 carbide starts to precipitate at 793 °C. | |
| • | Ferrite, α, starts to precipitate at 745 °C. |
It can be noted that the Thermo-Calc calculations show no primary carbides precipitating during solidification at equilibrium conditions.
Output from the Thermo-Calc calculations also gives concentrations of Cr and Mo in the secondary carbides. This information is helpful when determining the type of carbide present in the investigated alloy. The carbide composition varies with temperature. The compositions in Table 2 were evaluated at the maximum temperature in the temperature interval where the carbide exists.
From the Scheil equation,
in which is the concentration in the solid, is the mean concentration, and is the partition coefficient between solid and liquid; it is possible to calculate the micro-segregation of Cr and Mo in γ-phase under the assumption of no diffusion in the solid.
Thermo-Calc has also the option to calculate solidification according to the Scheil equation with the choice of no solid diffusion or equilibrium conditions for each element. The partition coefficient between solid and liquid will not be a constant but will vary in accordance with equilibrium conditions. The determined conditions hold for all precipitated phases during solidification until a singular point is reached where all the phases solidify at equilibrium.
The calculations were done with the conditions of no back diffusion for all alloying elements except for carbon, which was assumed to diffuse faster and be in equilibrium. Figure 2b shows the results from calculations of weight fraction of all phases versus temperature. The solidification sequence can be expressed as follows:
| • | Solidification of austenite, | γ, starts at 1445 °C. |
| • | Manganese sulphide, starts to precipitate at 1311 °C when the fraction of = 0.939. | |
| • | M6C starts to precipitate as 1148 °C, when = 0.990 and fraction of MnS, = 0.00018. | |
| • | M7C3 starts to precipitate at 1130 °C, in which 0.990, = 0.00018. | |
| • | KSI_Carbide starts to precipitate at 1081 °C, when = 5.7% and = 14% in liquid. |
Scheil-equation calculations show that primary precipitation of carbides occurs during solidification, but at a low temperature. It is worth mentioning that the results indicate that liquid is present at temperatures as low as 1081 °C, which is not to be expected in reality. Due to the steep concentration gradients in the solid, the back diffusion will disable such high liquid concentration peaks. The solidus temperature is therefore expected to be higher than 1081 °C. Most probably, no primary carbides will precipitate for this alloy if back diffusion calculations are taken into account.
Table 3 summarizes the concentration of Cr and Mo in primary carbides. In comparison with the compositions given in Table 1, the Mo content is higher for the Scheil calculation.
The alloy concentration in the phase, at the point where primary carbides start to precipitate, is higher than the concentration from the heat analysis due to the micro segregation as shown in Table 4. During cooling, that material will undergo phase transformations that differ from the case displayed in Figure 2a and about which it is of interest to know more. Thermo-Calc was therefore used to calculate the amount of each phase versus temperature for this higher concentration at equilibrium, and the results are displayed in Figure 2c.
The solidification sequence of equilibrium calculation with the input composition given in Table 3 can be expressed as follows:
| • | Solidification of starts at 1420 °C. | |
| • | MnS starts to precipitate at 1212 °C. Full solidification occurs at 1152 °C. | |
| • | M6C carbide start to precipitate at 1146 °C. | |
| • | M7C3 starts to precipitate at 1058 °C. | |
| • | M23C6 and KSI_Carbide starts to precipitate at 825 °C. |
Concentrations of Cr and Mo in the carbides are given in Table 5.
3. Experimental Work
Two similar bearing steel grades were used in this investigation, which are commercially available through hardening bearing steels. These are low-alloyed carbon steels that have a hypereutectoid composition; the compositions are given in Table 1. The alloy1 was in as cast and soaked form, and alloy2 was in soaked and hot rolled form. The experimentally determined liquidus temperature for alloy1, i.e., the temperature at which solidification starts is 1460 °C.
The alloys were melted in an electric arc furnace, treated in a ladle furnace, vacuum degassed and then cast into 4.2-ton ingots by uphill casting. Once solidified, the ingots were removed from the molds and soaked at 1200 °C in the soaking pits to homogenize the segregated areas.
For alloy1 samples were taken from as cast ingot and ingot soaked for 20 h. Cross section samples were cut off from a position of half the ingot height at the central part of the ingot. Sample designations, soaking times, and hot working conditions are presented in Table 6.
For alloy2, the soaking times were 4 h and 20 h, respectively. The ingots were then hot worked to size 147X147 mm, corresponding to an elongation factor of 16. Cross section samples from alloy2 were cut at a position corresponding to half of the ingot height.
After grinding and cleaning, the cross section samples were macro-etched in a solution of 38% HCl and 12% H2SO4 in water.
After meticulous visual observations of the macro-etched samples, several representative areas were selected, and micro-samples were cut from these selected areas. From the as cast macro-sample, micro-samples were selected from the bulk, 0SB, and from the areas containing A-segregation channels, 0SA. Caution was taken to cut the samples from similar areas over the cross section to enable a comparison. The samples marked SOA20h were taken from the ingots, which were soaked for 20 h, and the samples marked as HW4h and HW20h were taken from ingots, which were soaked for 4 h and 20 h, respectively, and then hot rolled. In addition, in order to carefully study the soaking effect on the cast structure in A-segregates and the bulk, soaking was performed on micro samples, 0SA, and OSB in a lab furnace at 1200 °C for 4 h. The soaked sample has the designation SOA4h and SOB4h, respectively, in Table 6.
The micro-samples were progressively ground. After grinding and cleaning, the samples were polished using a 3-micron and then a 1-micron diamond suspension polish. For optical microscopy and SEM imaging, the samples were etched with 2% Nital.
To differentiate between different groups of carbides, selective etching was conducted. Samples were etched with Groesbeck’s reagent [16,17]. The MC carbides are not attacked and appear in pink color; M2C are colored dark brown; M6C are outlined and colored blue or yellow; M7C3 are faintly attacked and colored; and M3C is not affected. To verify the results, the samples were also etched with Murakami reagent, which gives similar etching effects [16].
After conducting the microscopic observations, specific areas of interest were marked for EDX and EMPA analysis equipment mounted on Hitachi SEM. The samples were then re-polished, as the analysis of the etched sample does not provide the true results, because the etchant depletes or reacts with certain phases and changes the composition. After re-polishing, quantitative and qualitative composition analyses were performed for the matrix and the carbide precipitation.
The secondary arm spacing was measured in the bulk and in A-segregated areas. Hardness testing was performed in order to distinguish between matrix and carbide in interdendritic regions. The area fraction of primary carbides in interdendritic regions in the bulk of as cast samples was evaluated using the Leica QWin Stadard (V 3.5.1 2008, Switzerland).
4. Results
4.1. Macrosegregation
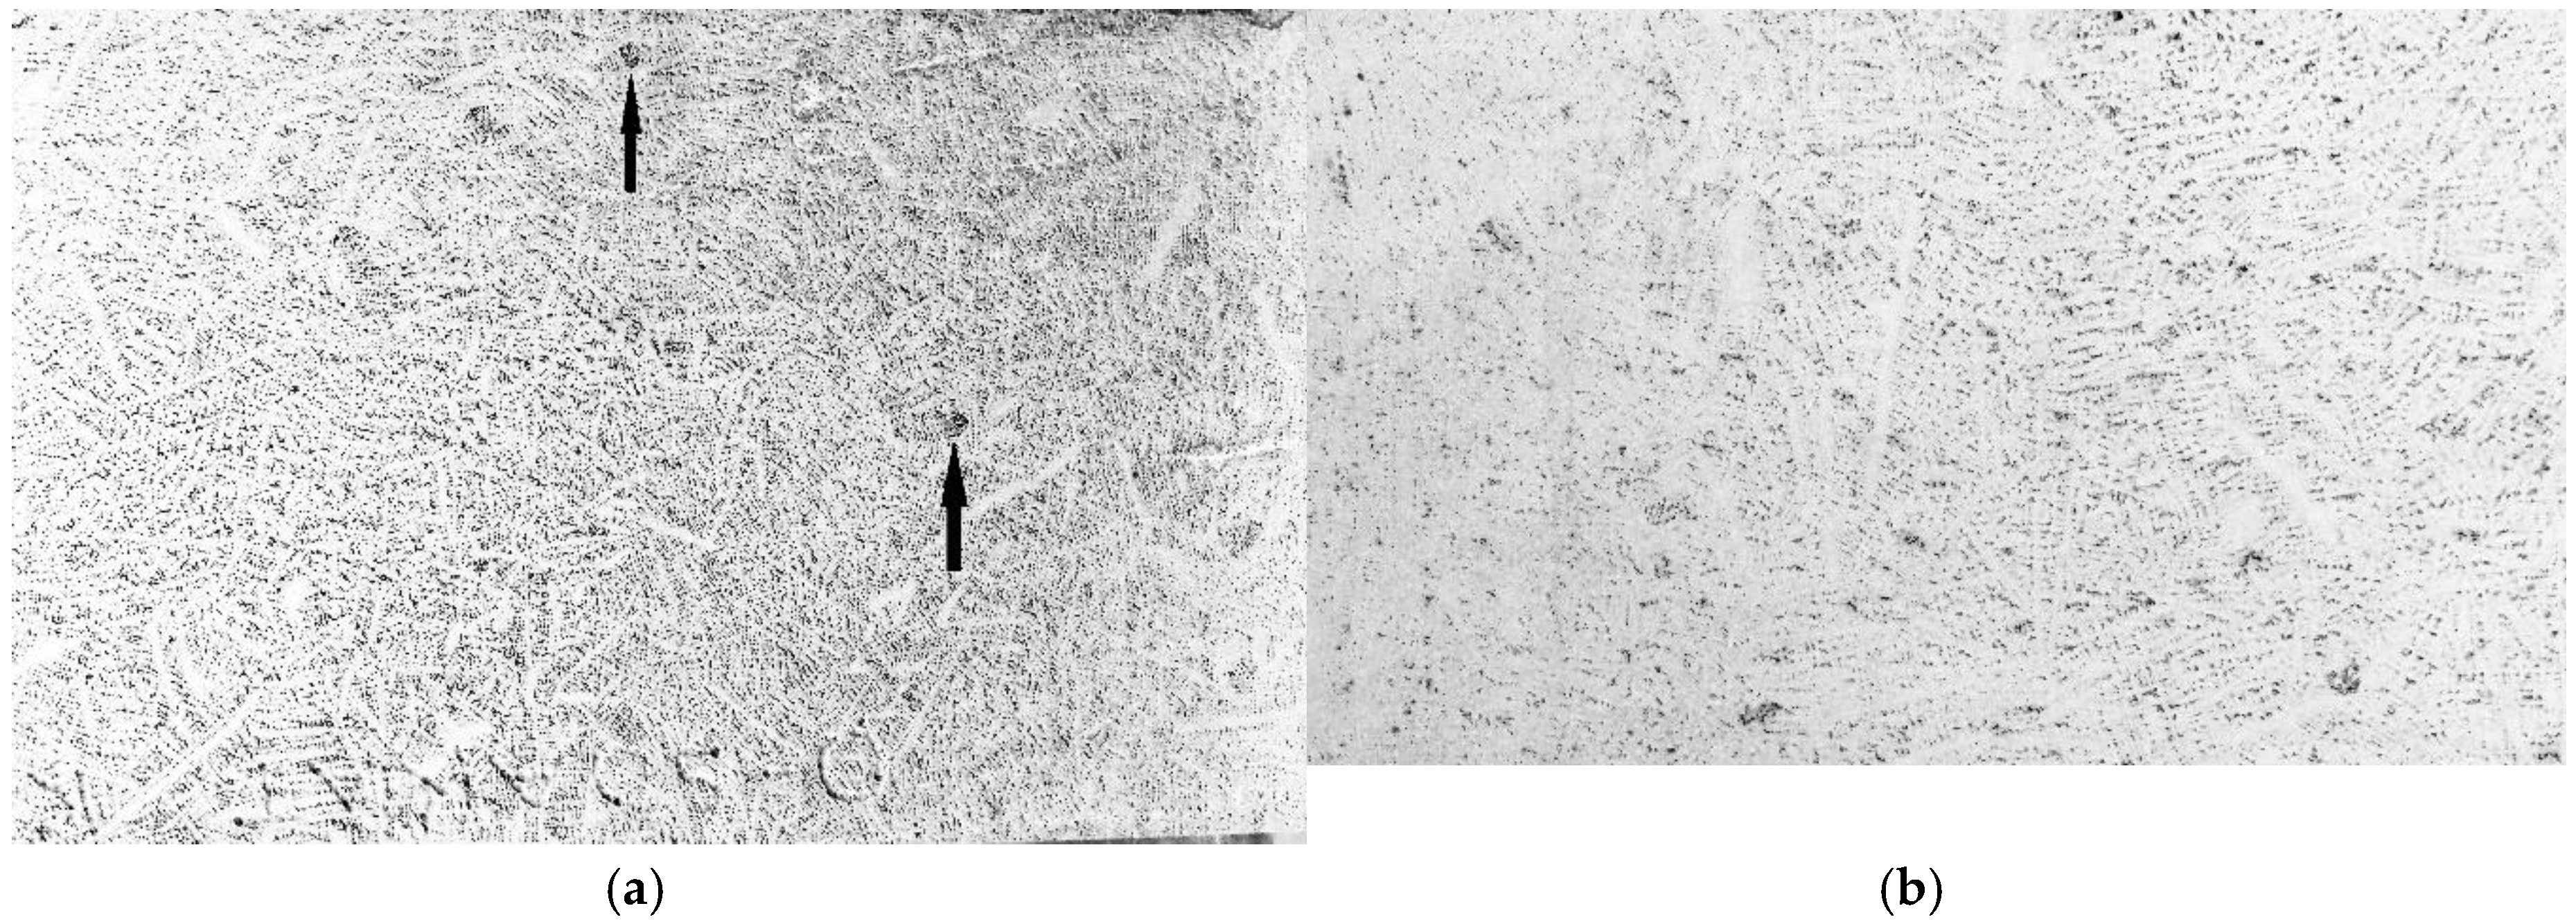
Randomly orientated dendrites were seen after the macro-etching on the unsoaked and soaked samples, as seen in Figure 3a,b respectively. These randomly orientated dendritic structures are typically representative of an equiaxed crystal zone. The areas exhibiting darker shades correspond to regions with high segregation [14]. The dendritic structure is not clearly visible in the soaked sample due to the homogenization of solute elements. The rounded dark areas marked by arrows in Figure 3a represent A-segregation channels. The diameters of the A-segregation spots are 3 mm on average.
4.2. Microstructure in the Bulk of as Cast Sample
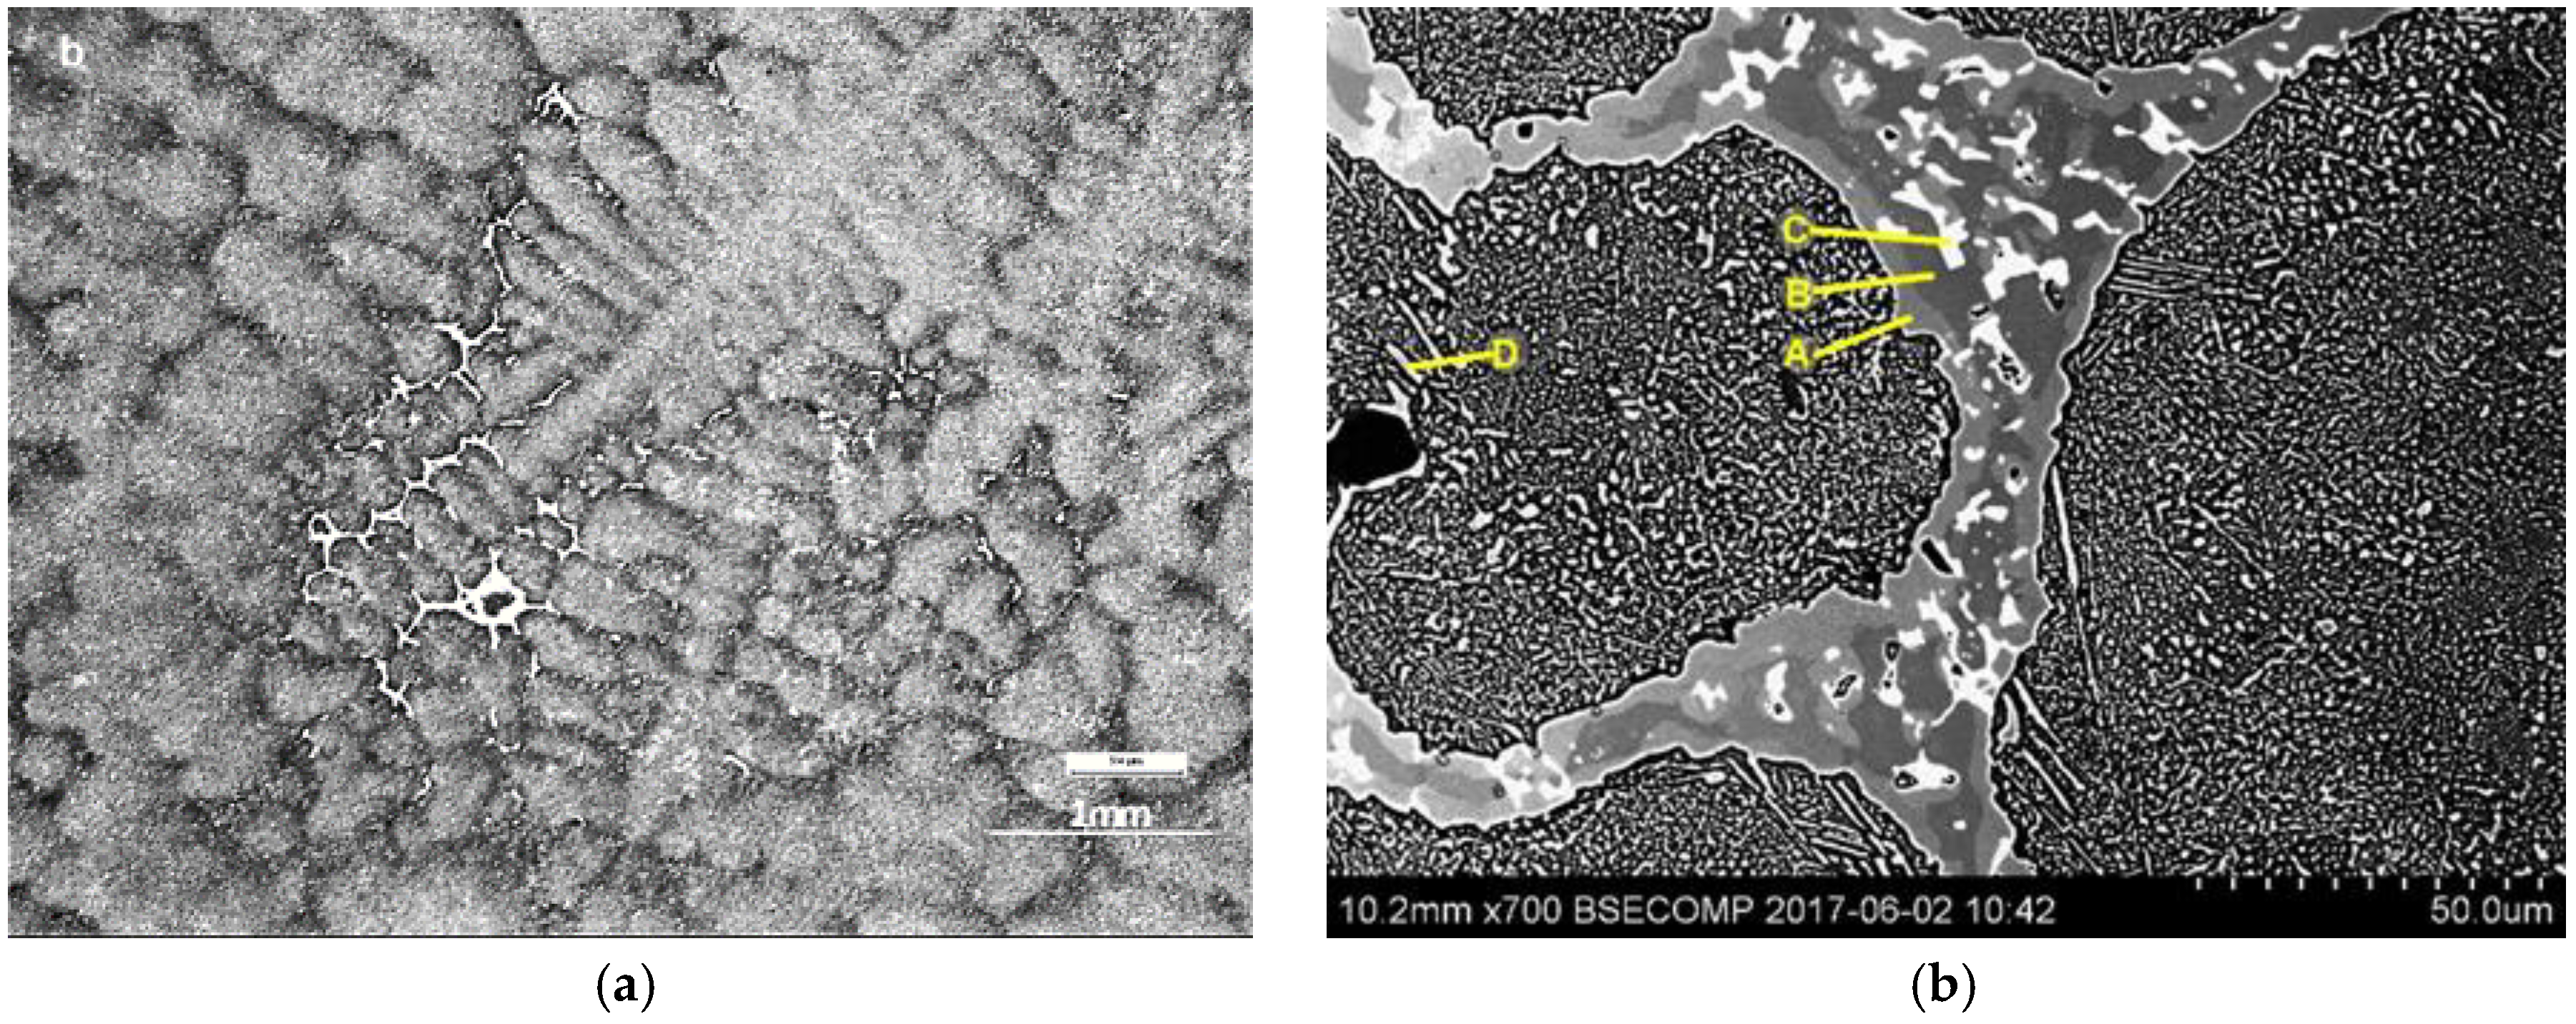
The microstructure in the bulk can be seen in Figure 4a. The etching has revealed the dendrite structure. The secondary arm spacing was measured as 270 μm ± 41 μm. Precipitation of a white phase of primary carbides occurs at certain interdendritic regions and is marked by arrows. The area fraction of primary carbide was measured to be 0.0011. This value can be compared to the Scheil calculations that indicate a fraction of liquid, 0.01, at the start precipitation of M6C at 1148 °C. Assuming that all remaining liquid would solidify to primary carbide, there is a big difference between the calculated and measured results.
Figure 4b shows a SEM back scattered micrograph of the bulk matrix of the unsoaked as cast sample. A gray phase of carbide exists in the interdendritic region with precipitation of MnS and a white phase. The matrix has a lamellar structure.
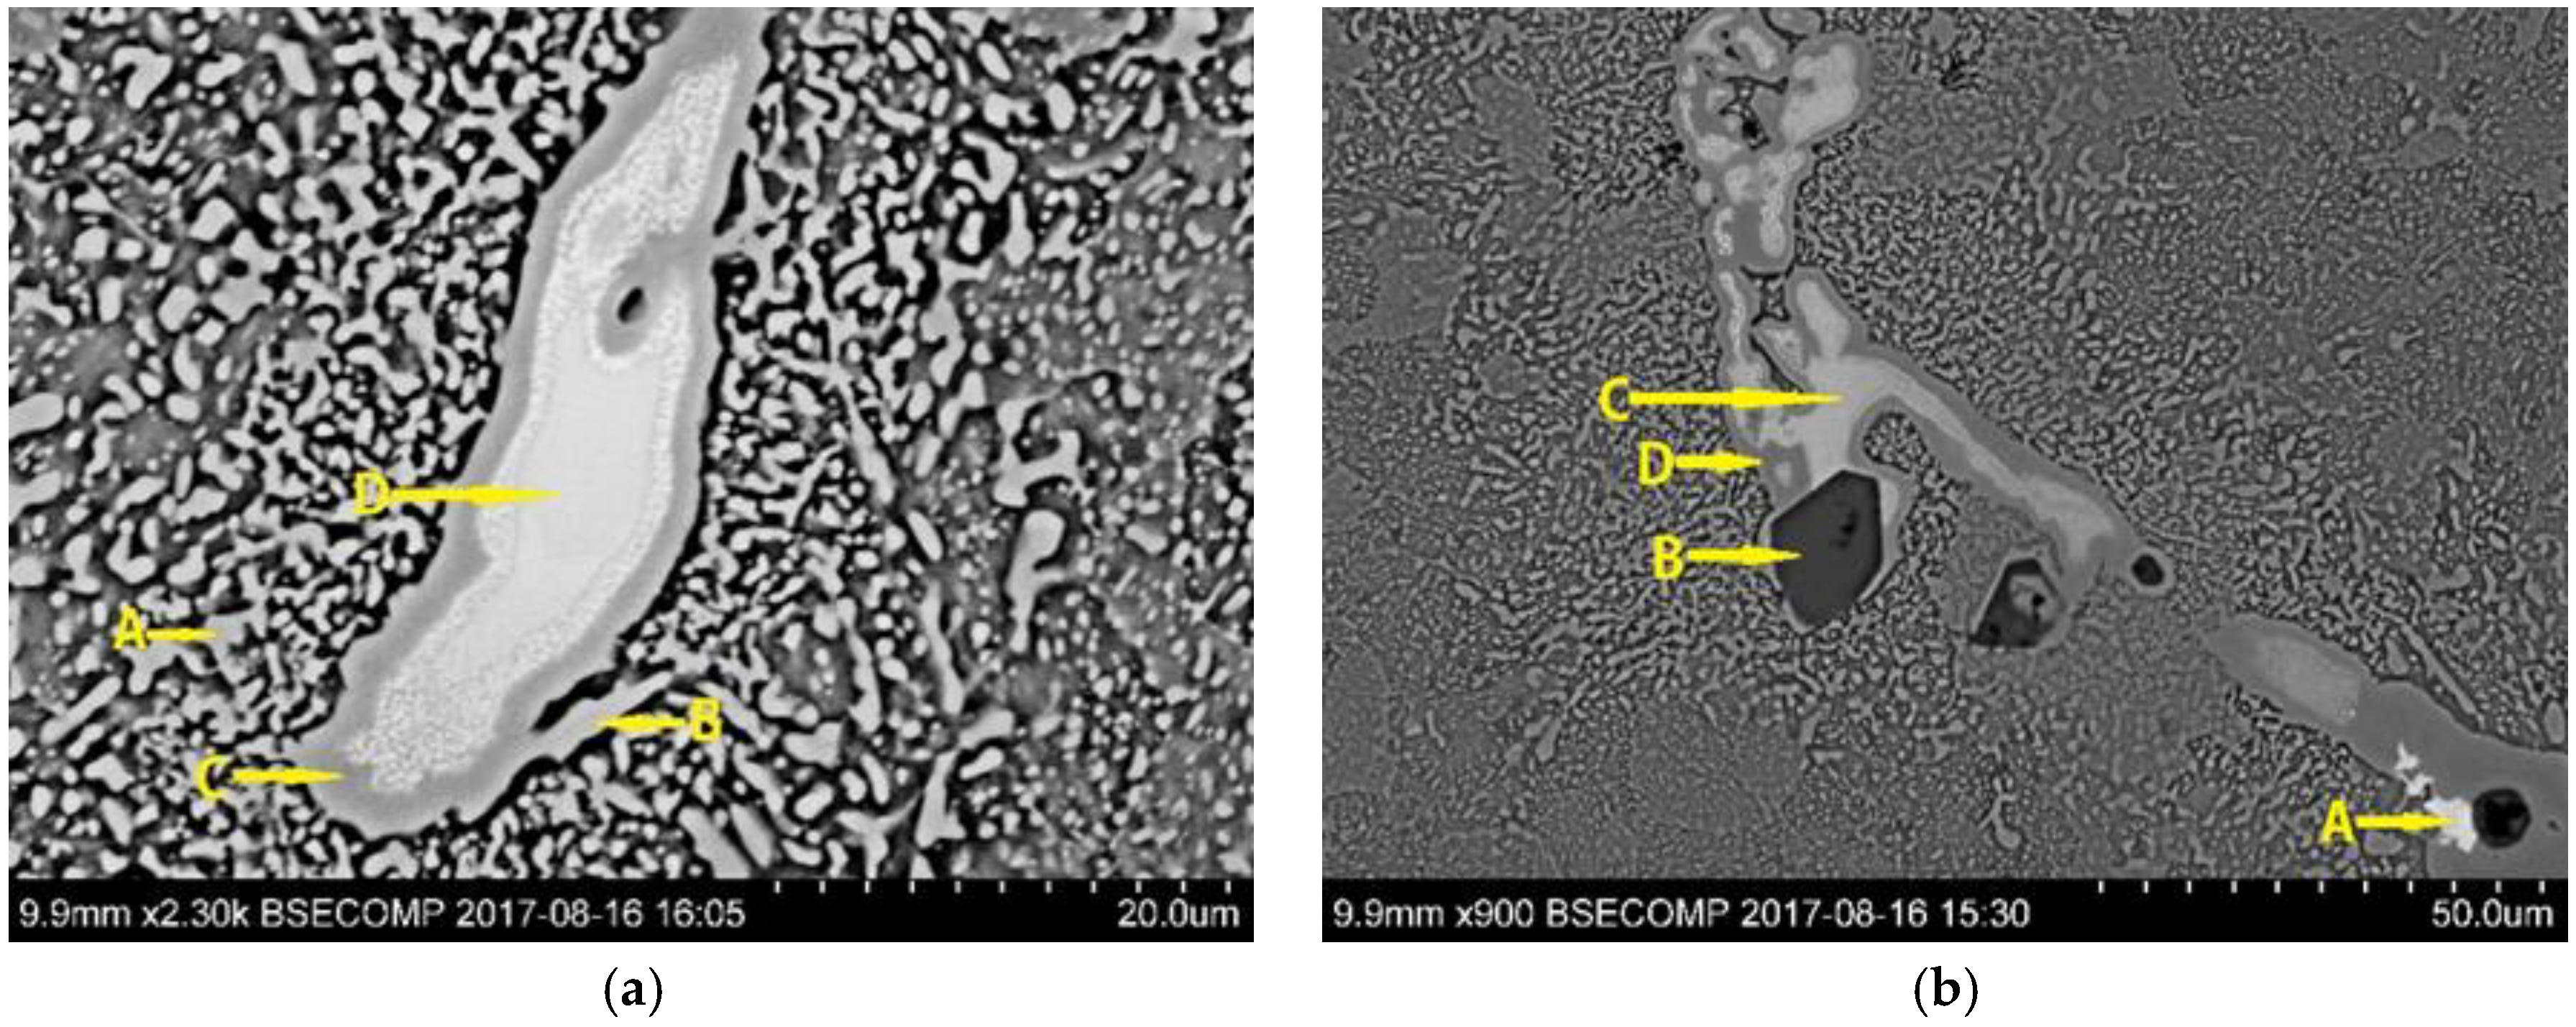
The SEM images exhibited in Figure 5a,b were recorded with back-scattered electron (BSE) imaging and show the carbides precipitated in the bulk matrix of unsoaked as cast sample. The composition of Mo and Cr in the carbide at the points marked A, B, C, and D was selected for chemical analysis. In Figure 5a, analysis of the light gray carbide compositions at locations A and B in the matrix is in the range of 5–8% Cr and 3–4% Mo. The gray border carbide, marked by C, surrounding the light silver carbide, shows compositions of approximately 12.4% Cr and 7.5% Mo. The light silver carbide in the center, marked by D, has as high values as 20.5%Cr and 53.5% Mo.
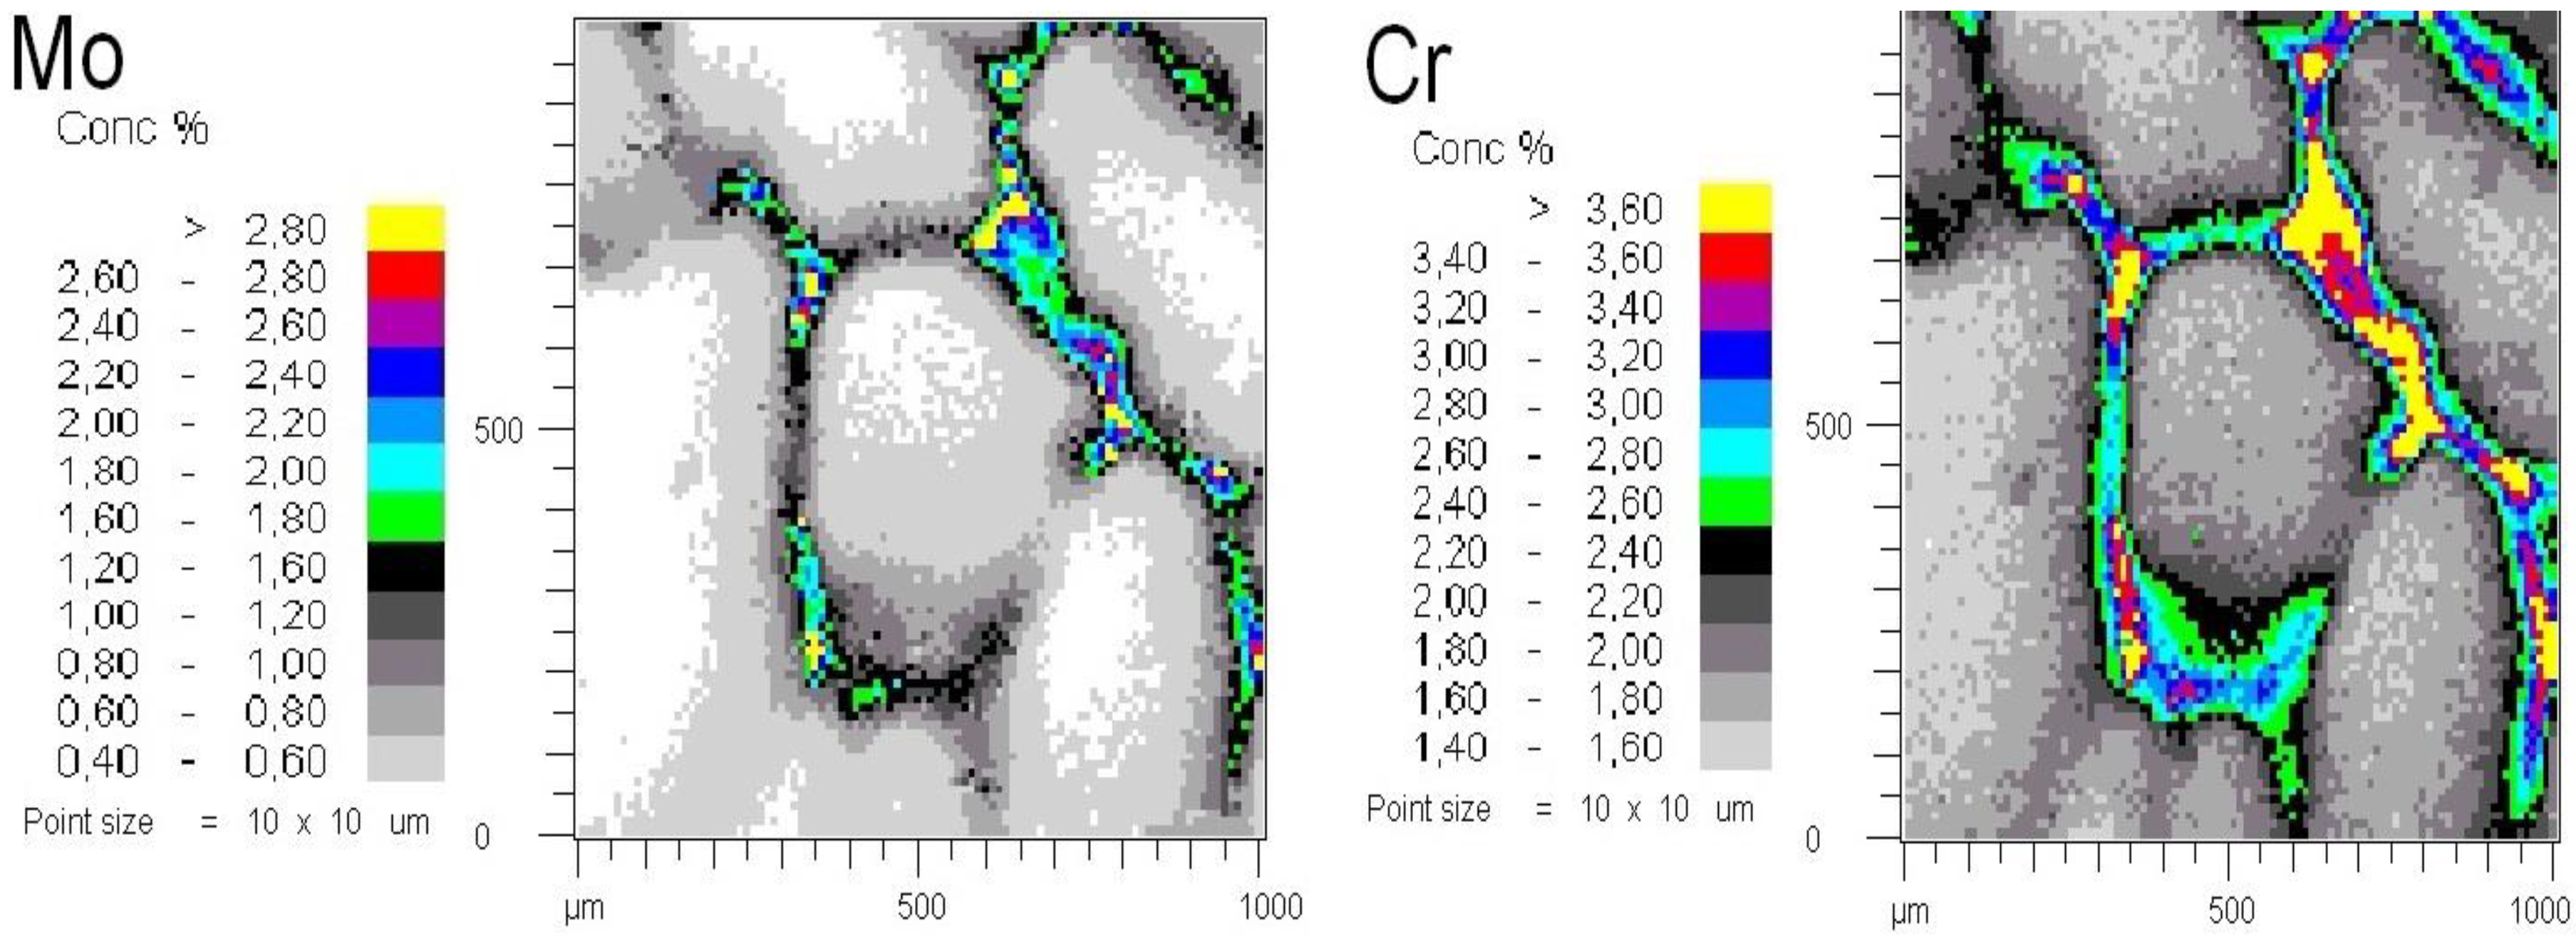
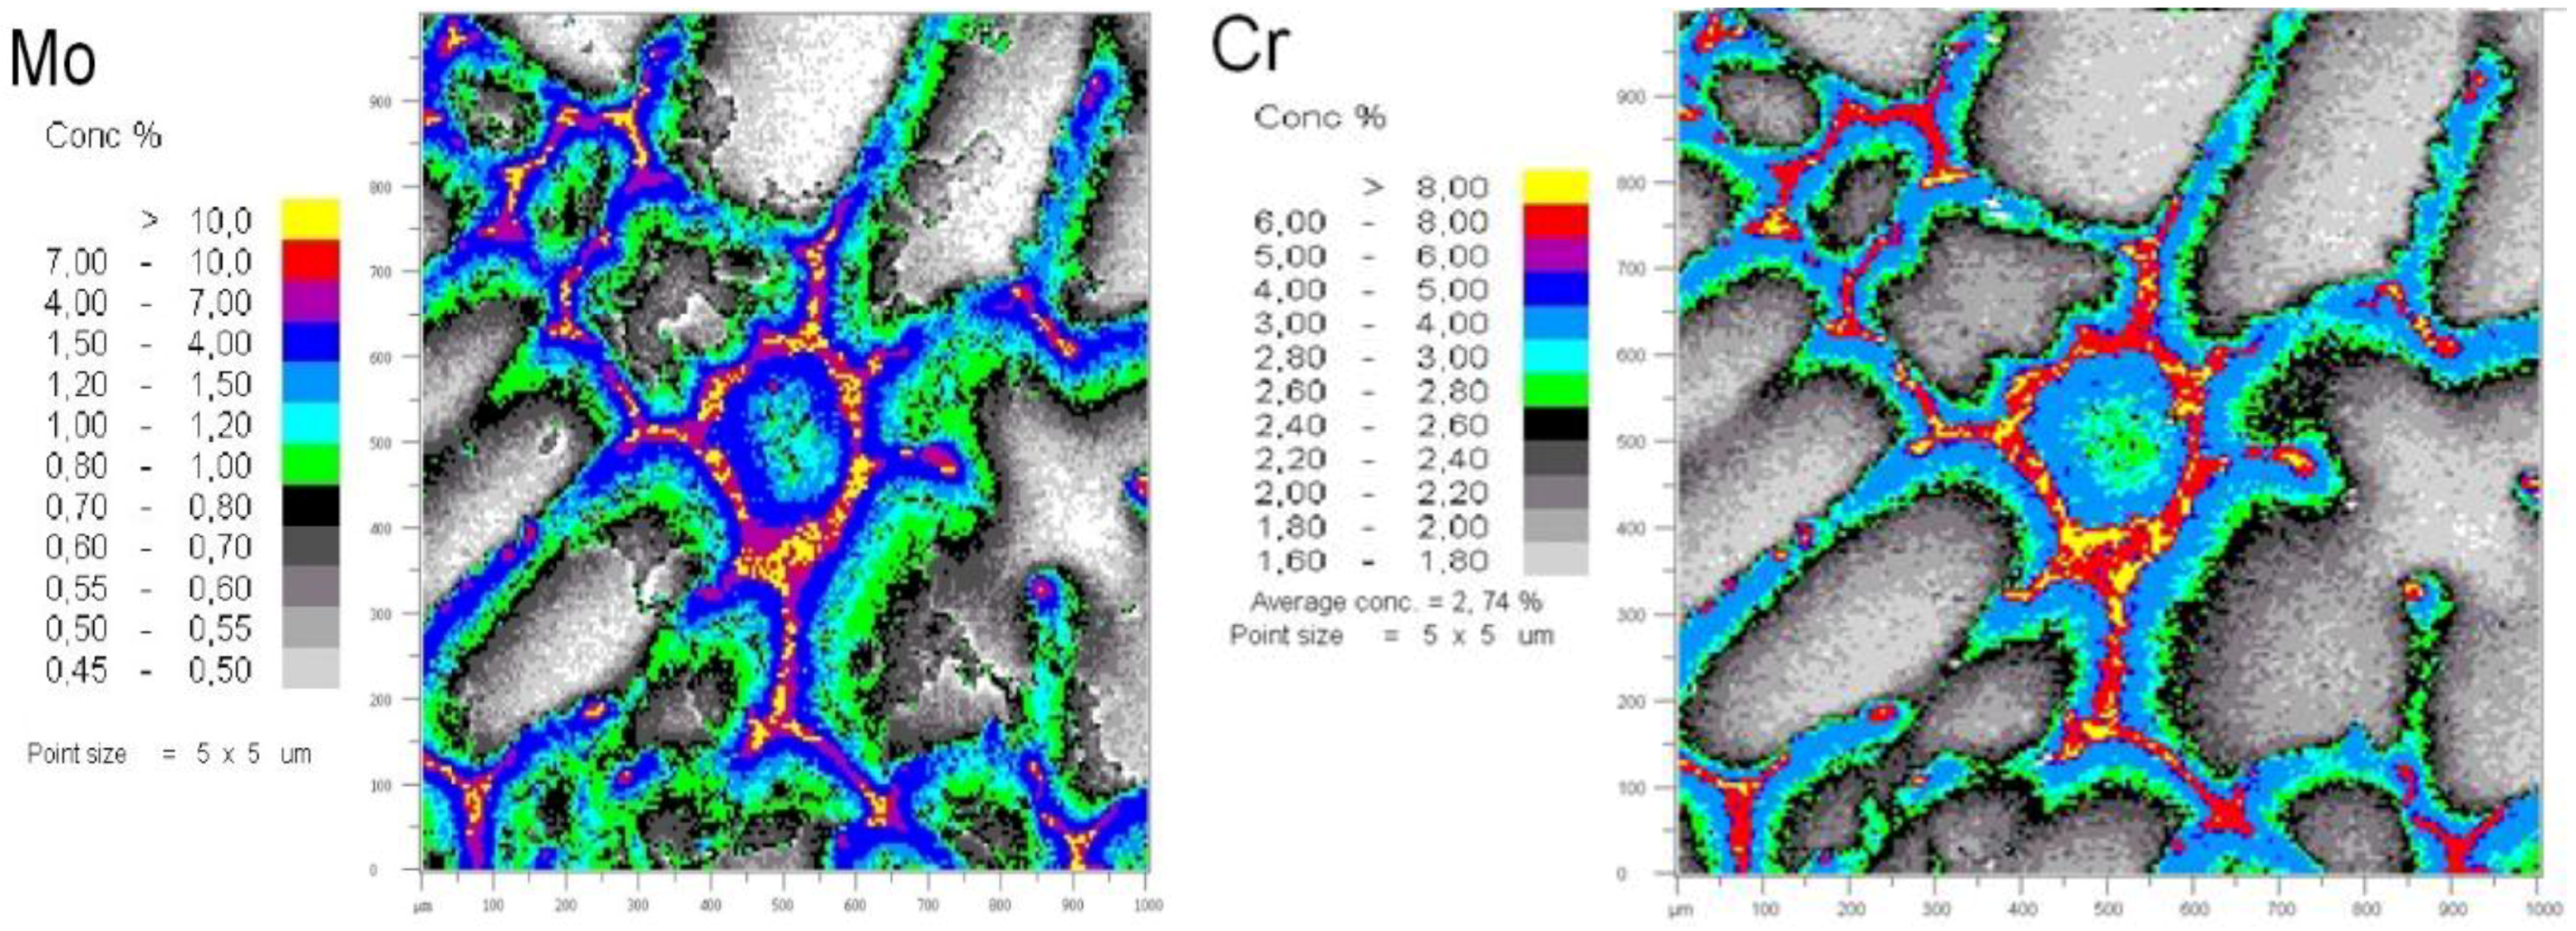
In Figure 5b, the white carbide, marked A, contains 5.3% Cr and 51.5% Mo. The light silver carbide, marked C, contains 27.7% Cr and 50.1% Mo. The gray border carbide, surrounding the light silver carbide, marked D, contains 7.7% Cr and 5.8% Mo. In the last solidified region MnS, type III has precipitated, which is marked by B and contains high concentrations of Mn and S. The micro segregations of Cr and Mo in the bulk matrix of unsoaked as cast samples were mapped by EMPA. The results are presented in Figure 6. The concentrations in the interdendritic areas are quite high with spots of very high concentrations, which seem to originate from primary carbides. In the center of the dendrites, the concentration is more even.
The map also shows that the elements are not evenly distributed along the interdendritic regions but vary substantially. The segregation index, defined as the concentration in the interdendritic matrix divided by the concentration in the center of the dendrites, is roughly 3.4%/1.4% = 2.4 for Cr, and 1.8%/0.4% = 4.5 for Mo. The micro segregation is higher for Mo than for Cr.
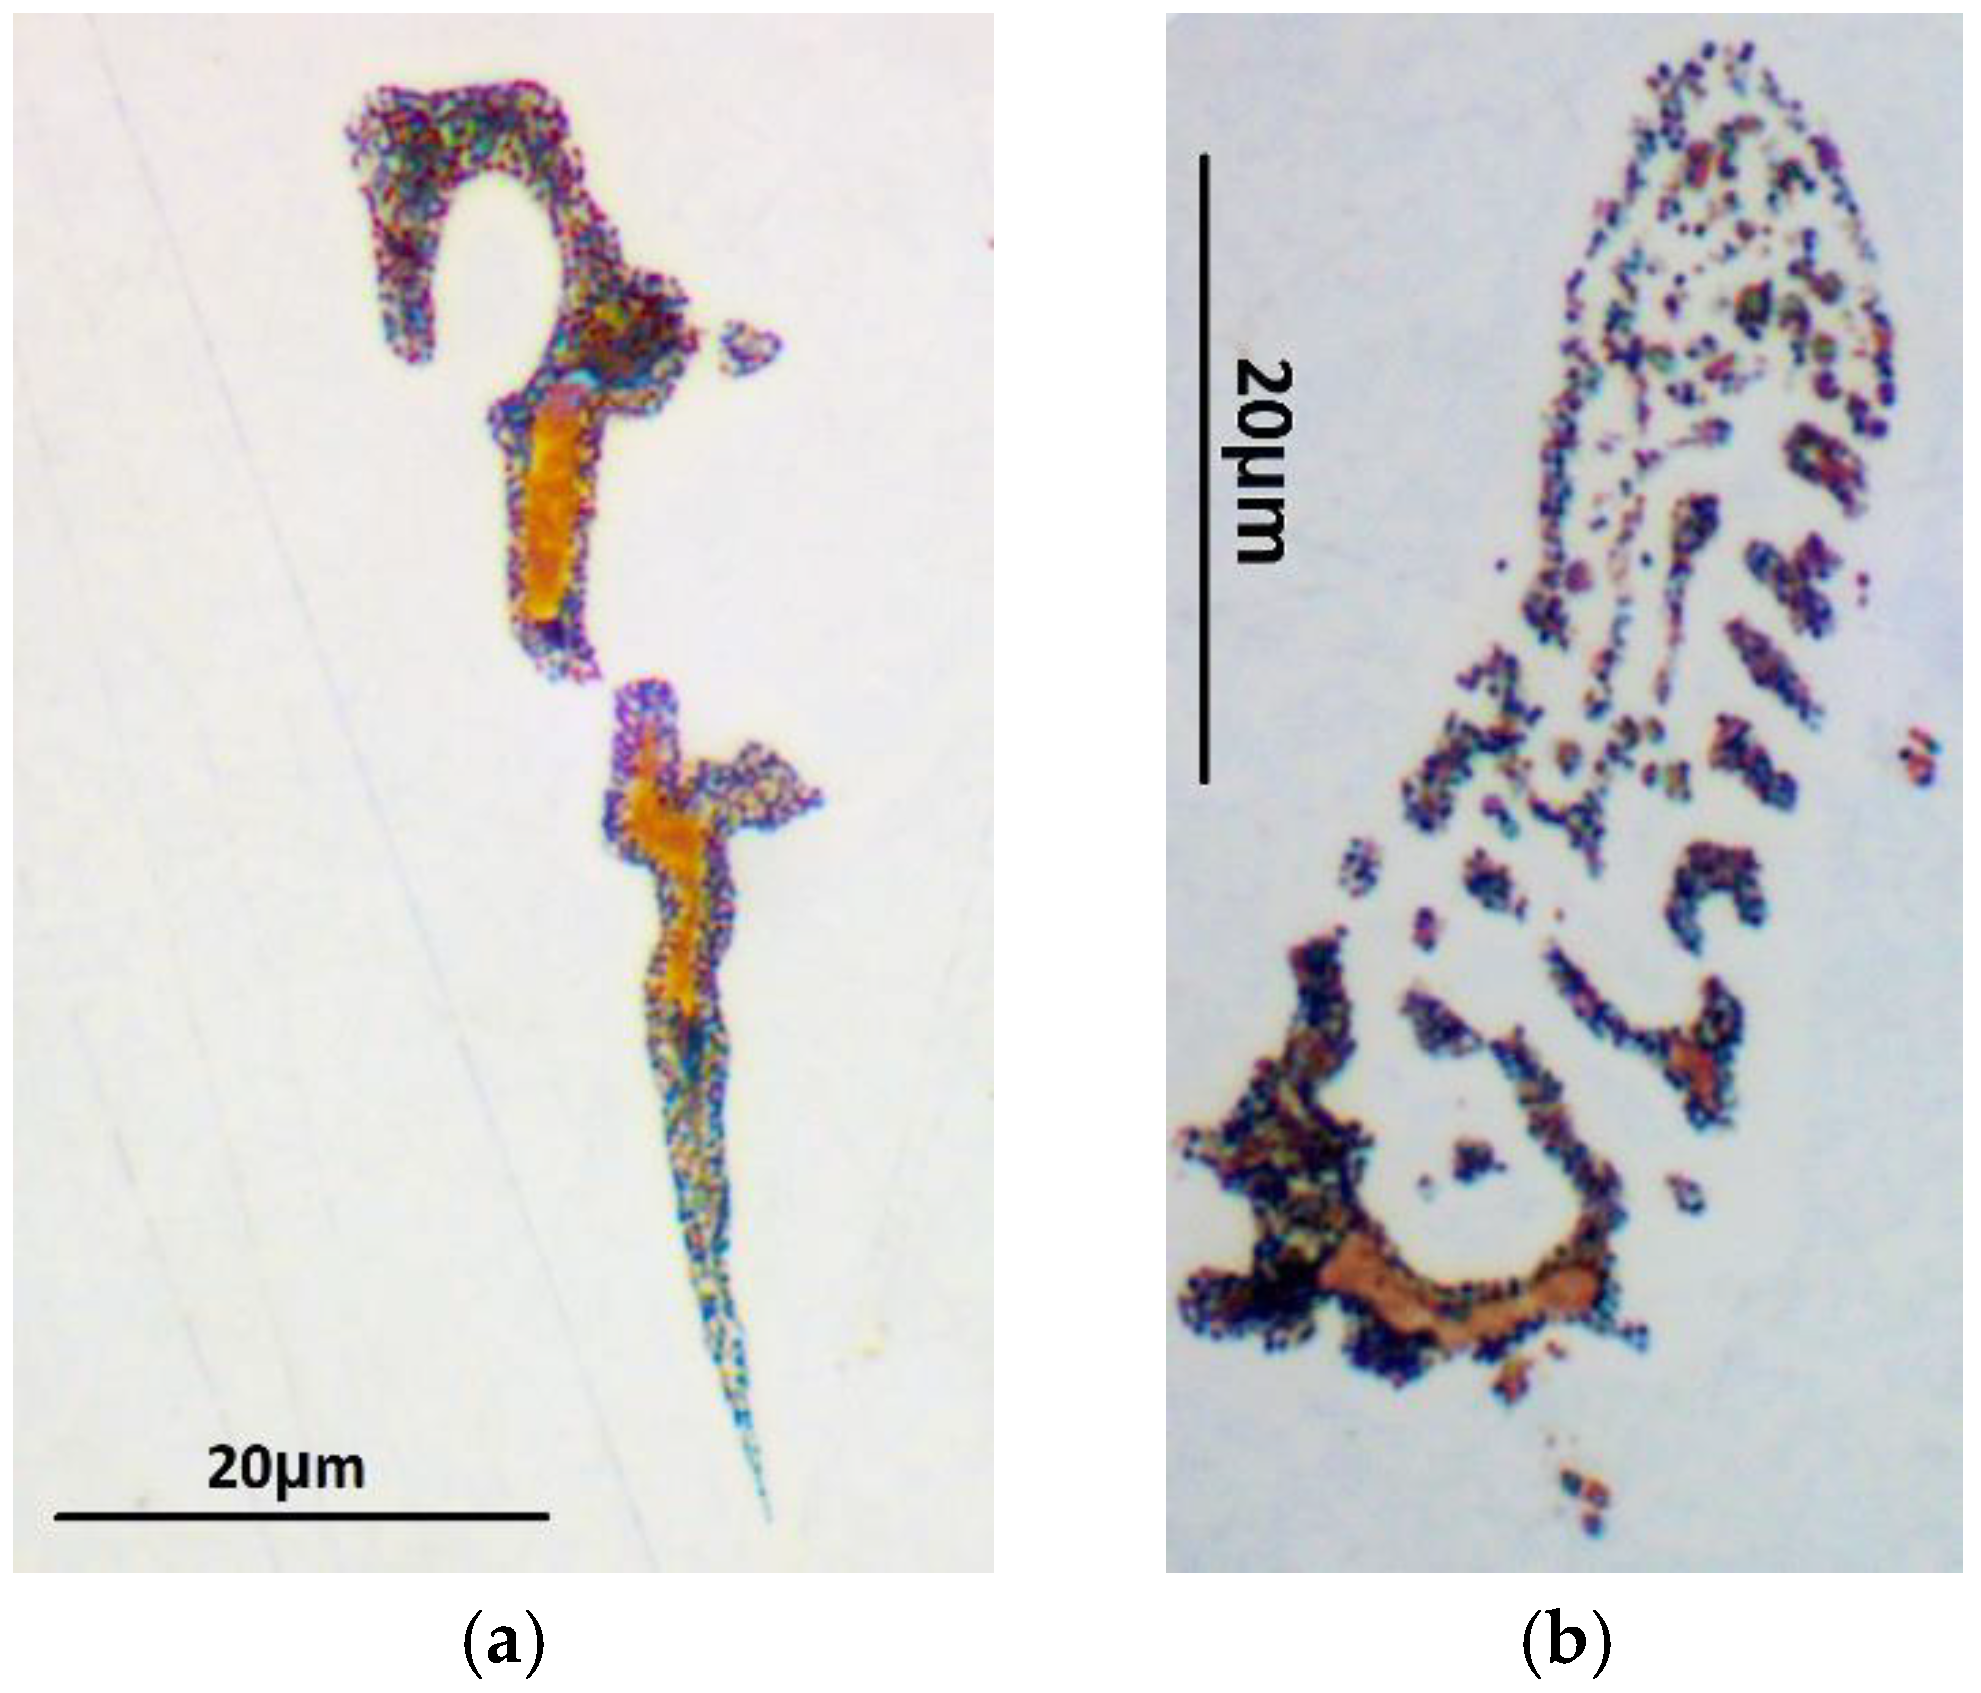
By color etching, it was possible to reveal more details about the primary carbides and especially the white carbides, as seen in Figure 7a,b. According to [16,18], M2C is colored brown, M6C is outlined and colored blue, and M7C3 is faintly colored. Cementite is not affected by the etch reagent.
Both Figure 7a,b show a eutectic structure of carbides with M2C as brown phase and M6C as blue phase appearing, especially at the borders between the brown and white phase. These carbides are precipitated in a matrix of uncolored white phase in contrast to the matrix, which is shifting in a slightly gray tone. This white phase seems to correspond to the gray phase in Figure 4b and Figure 5a.
Hardness measurements were carried out in order to try to distinguish between different carbides. In the center of the dendrite, the hardness was about 210 HV. In the primary carbide precipitation, the hardness varied between 900–1200 HV, depending on the amount of gray carbon phase and silver/white phase present. One conclusion is that the white phase in Figure 7a,b is carbide and not retained austenite.
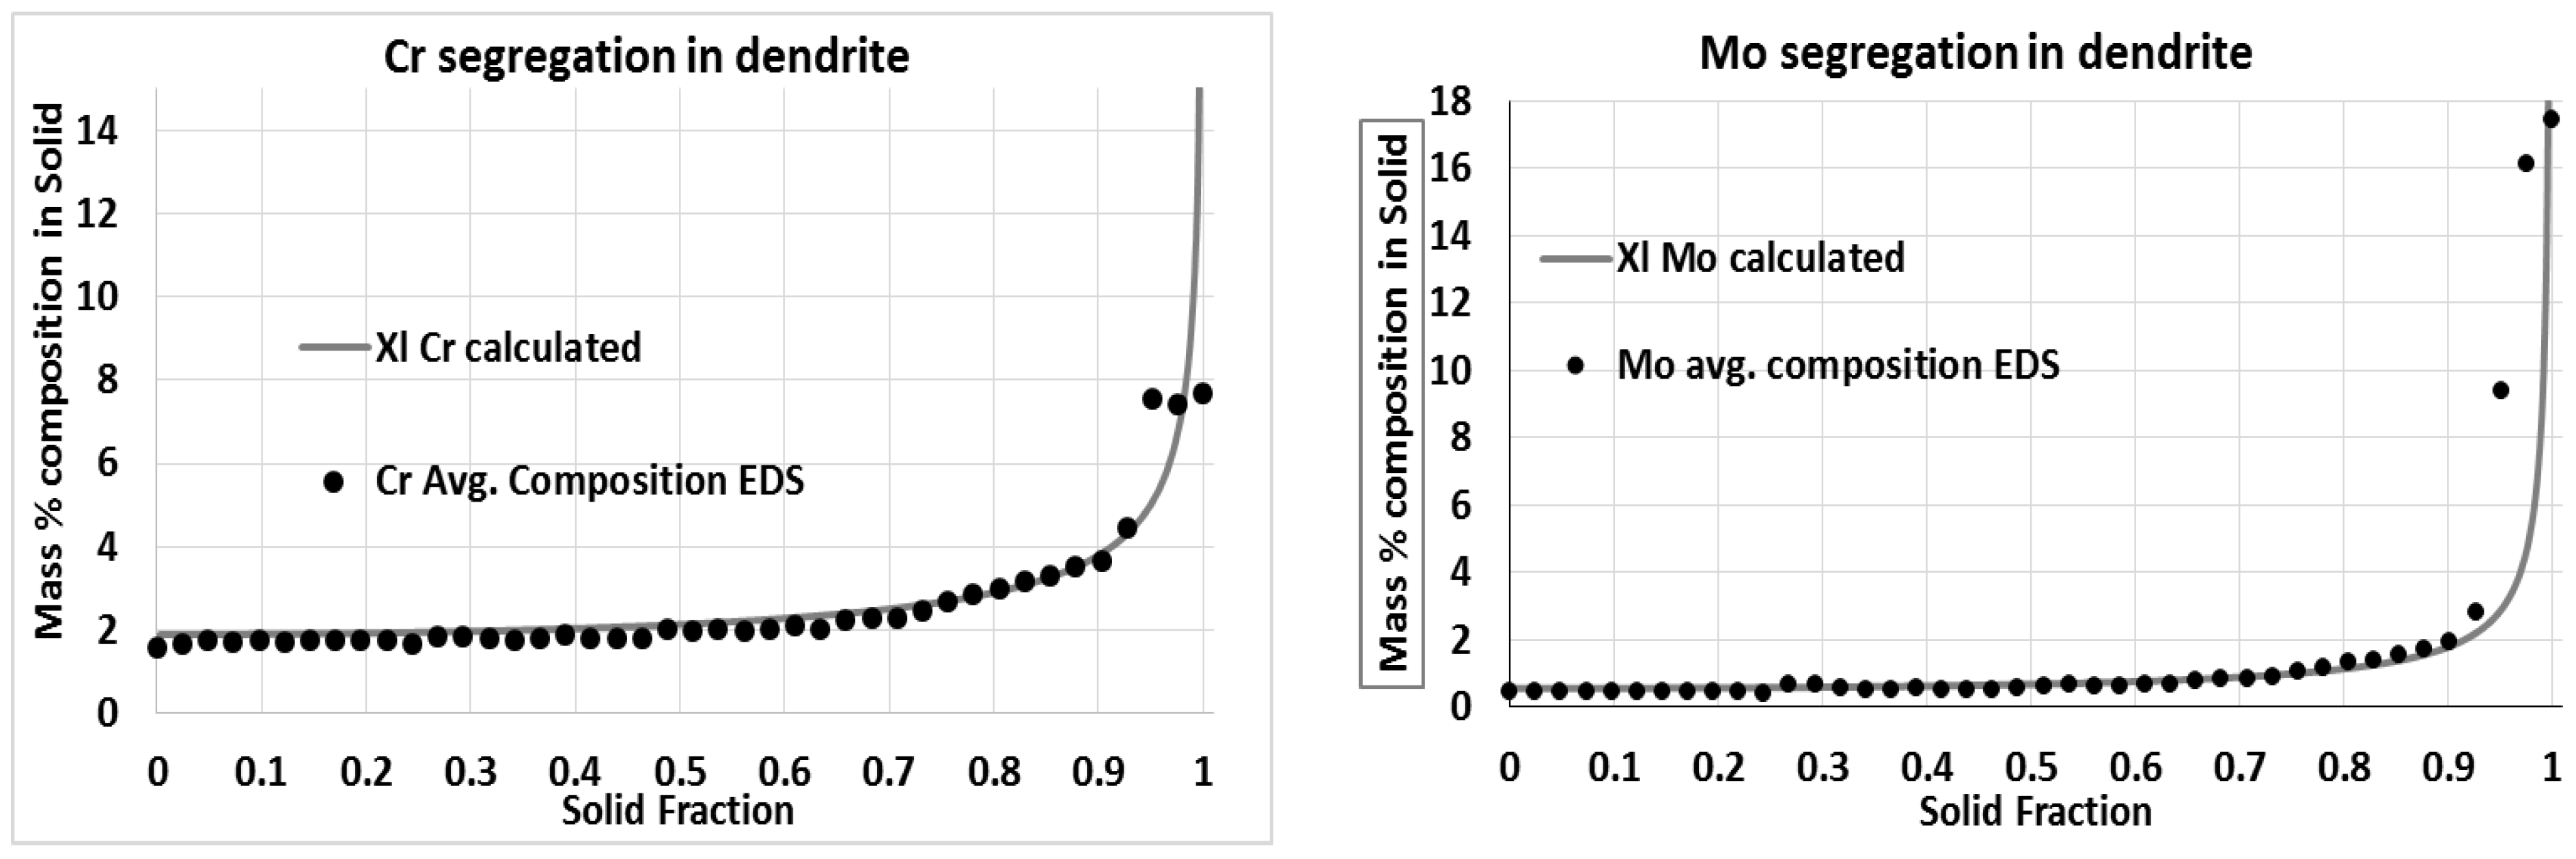
An EDS analysis in SEM was carried out to evaluate how the Cr and Mo concentration decreases from the center of the dendrite to the interdendritic region. The results are presented in Figure 8 as dotted lines. Every dot is a measurement point. In the same diagram, the results from calculating the micro-segregation profiles by the Scheil equation, Equation (1), are plotted as solid lines, with = 0.58 and = 0.31. The k-values were evaluated from the Thermo-Calc Scheil calculation at the stage when the first M6C was precipitated. There is good agreement between the measured and calculated concentrations until ~ 0.93. The measurement values for 0.93 originate mainly from the gray carbide.
4.3. Microstructure in A-Segregates, as Cast Samples
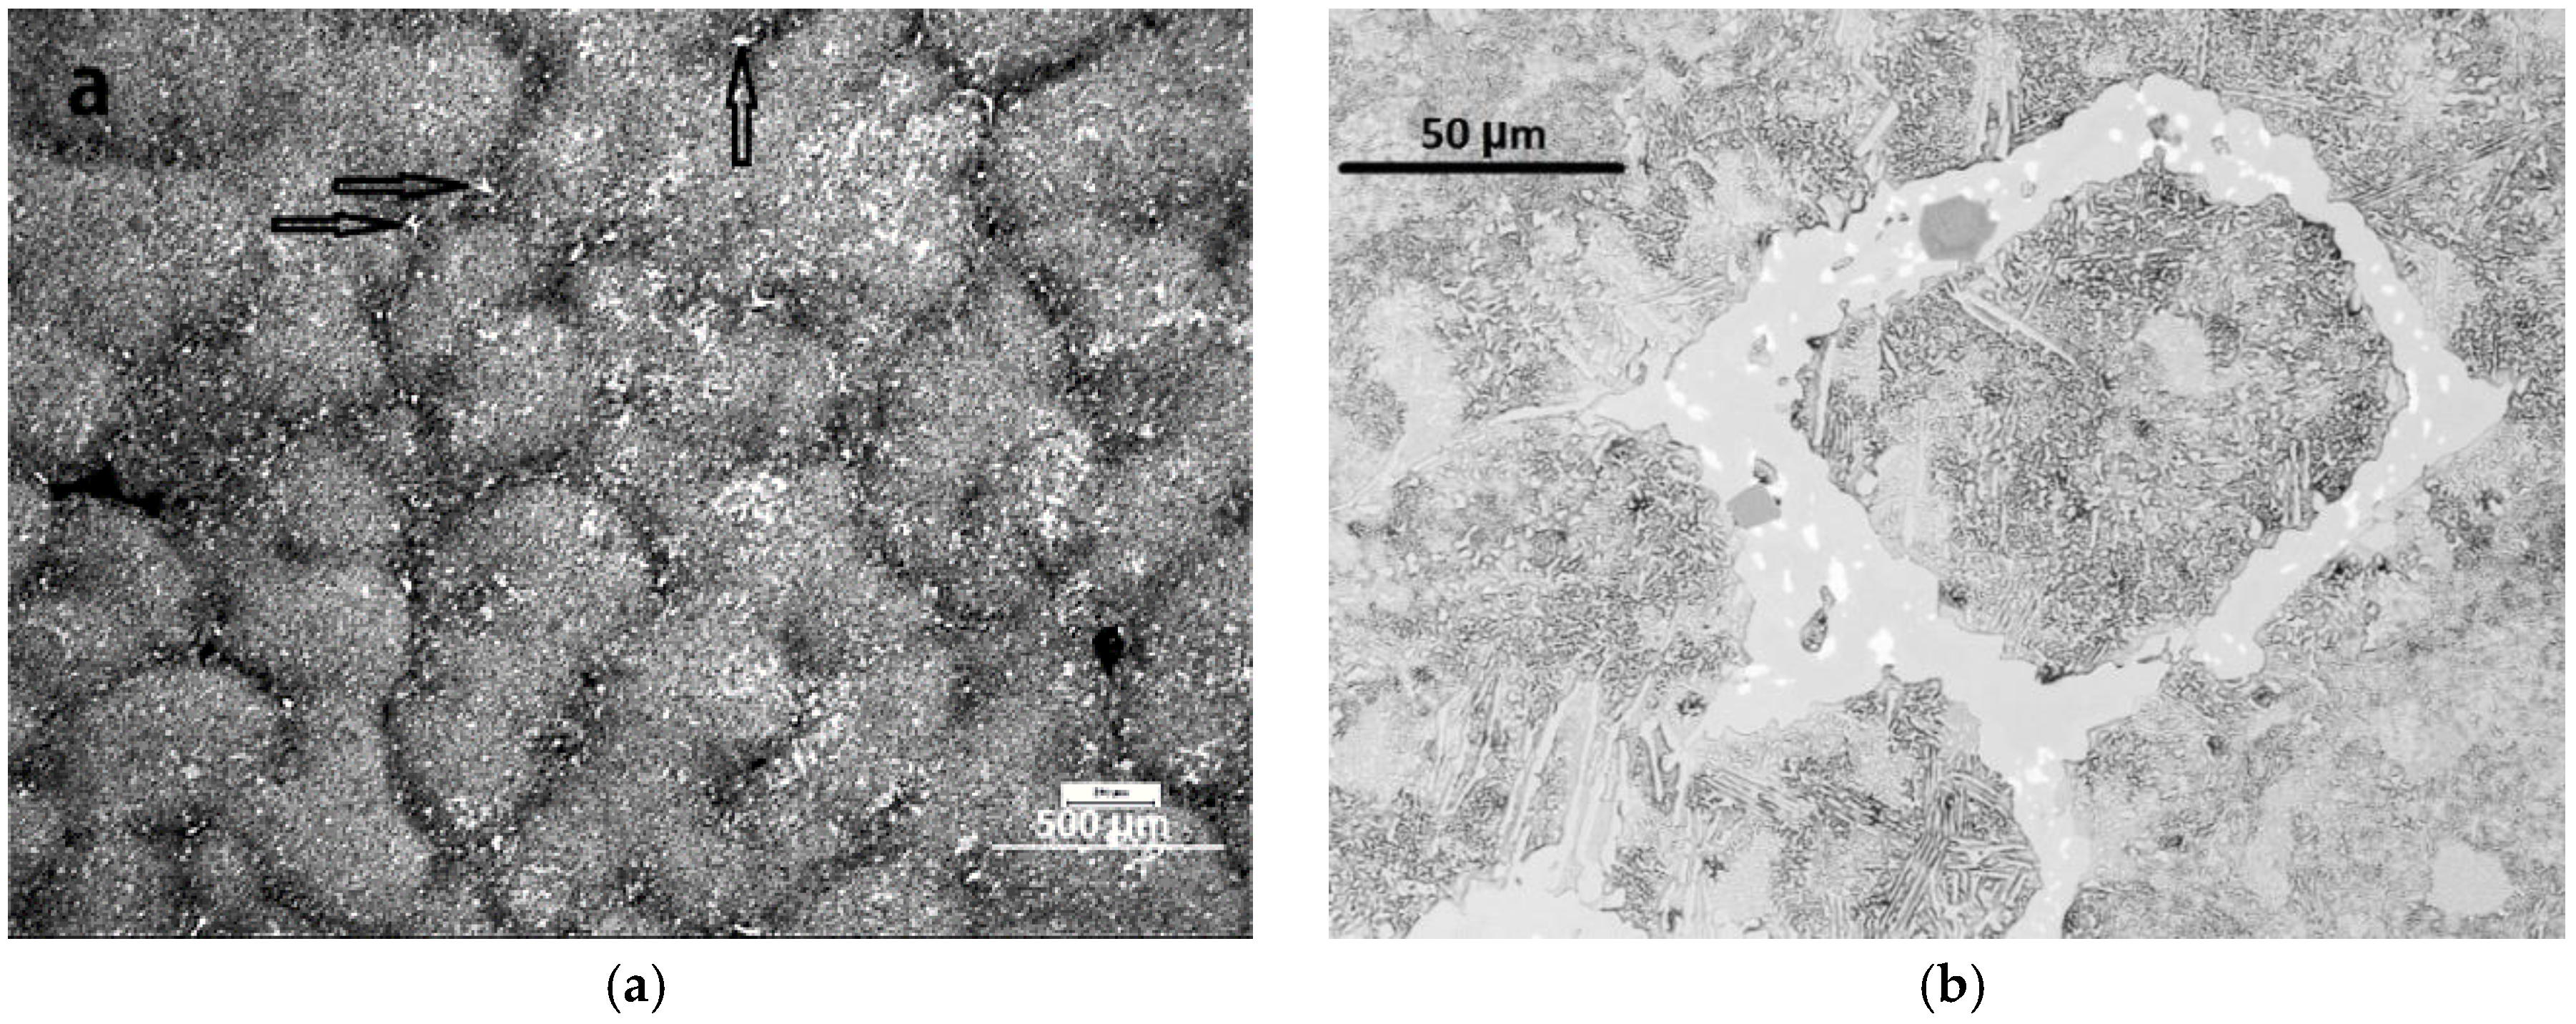
Figure 9a shows the dendrite structure in the A-segregated channels. The secondary arm spacing is smaller compared to that in the bulk to the left in the figure. In the A-segregated area, the secondary arm spacing was measured as 183 μm ± 29 μm, compared to the average value of 270 μm in the bulk. Additionally, large primary carbide network was observed in the A-Segregation channel. The area fraction of carbide in this region was 0.0027, i.e., twice that in the bulk. Figure 9b shows the SEM image of interdendritic regions and carbides with indications of point analyses by aid of EDS, marked by A, B, C, and D. The gray border carbide, marked by A and darker carbide phase, marked by B, has the composition 10–12% Cr and 5–6% Mo. The white carbide phase, marked C, has the composition 2.8% Cr and 49% Mo. Secondary plate-like carbide in the matrix, marked by D, has the composition 9% Cr and 4% Mo. Presence of type III MnS was also noted within the vicinity of the carbides.
The EMPA map given in Figure 10 shows the composition distribution of Mo and Cr in the A-segregate channel. The interdendritic segregated regions are wider compared to those in the bulk in Figure 6. There are some small areas at the center that have a comparatively very high concentration of these elements. The segregation index in this case is roughly 4%/1.6% = 2.5 for Cr and 4%/0.5% = 8 for Mo. The micro segregation is higher in the A-segregated channel for Mo but the same for Cr in comparison with the segregation index in the bulk.
Examples of color etching of the carbides in the A-segregated interdendritic areas are shown in Figure 11a,b. A eutectic precipitation of white carbon phase and brown M2C dominates. Hardness measurements gave values in the range of 500–800 HV, with some values up to 1140 HV. The lower hardness of the carbides in A-segregate could be attributed to larger areas of dark gray carbides.
4.4. Microstructure in as Cast-Soaked Samples
No primary carbides in bulk were seen in the interdendritic regions of the sample SO20h soaked for 20 h; see Figure 12a. The contrast between the center of the dendrite and the interdendritic region has decreased, which shows that the composition difference of alloying elements has decreased in these areas compared to the unsoaked sample in Figure 4a.
To enable a comparison with the unsoaked condition, an EDS analysis in SEM was carried out to evaluate how the Cr and Mo concentration decreases from the interdendritic region to the center of the dendrite after soaking. The results are presented in Figure 12b. An evaluation of the segregation index gives 2.6%/1.5% = 1.7 for Cr and 1.25%/0.4% = 3.1 for Mo. In comparison with the unsoaked samples, the index has decreased mainly due to decreased concentrations in the interdendritic areas.
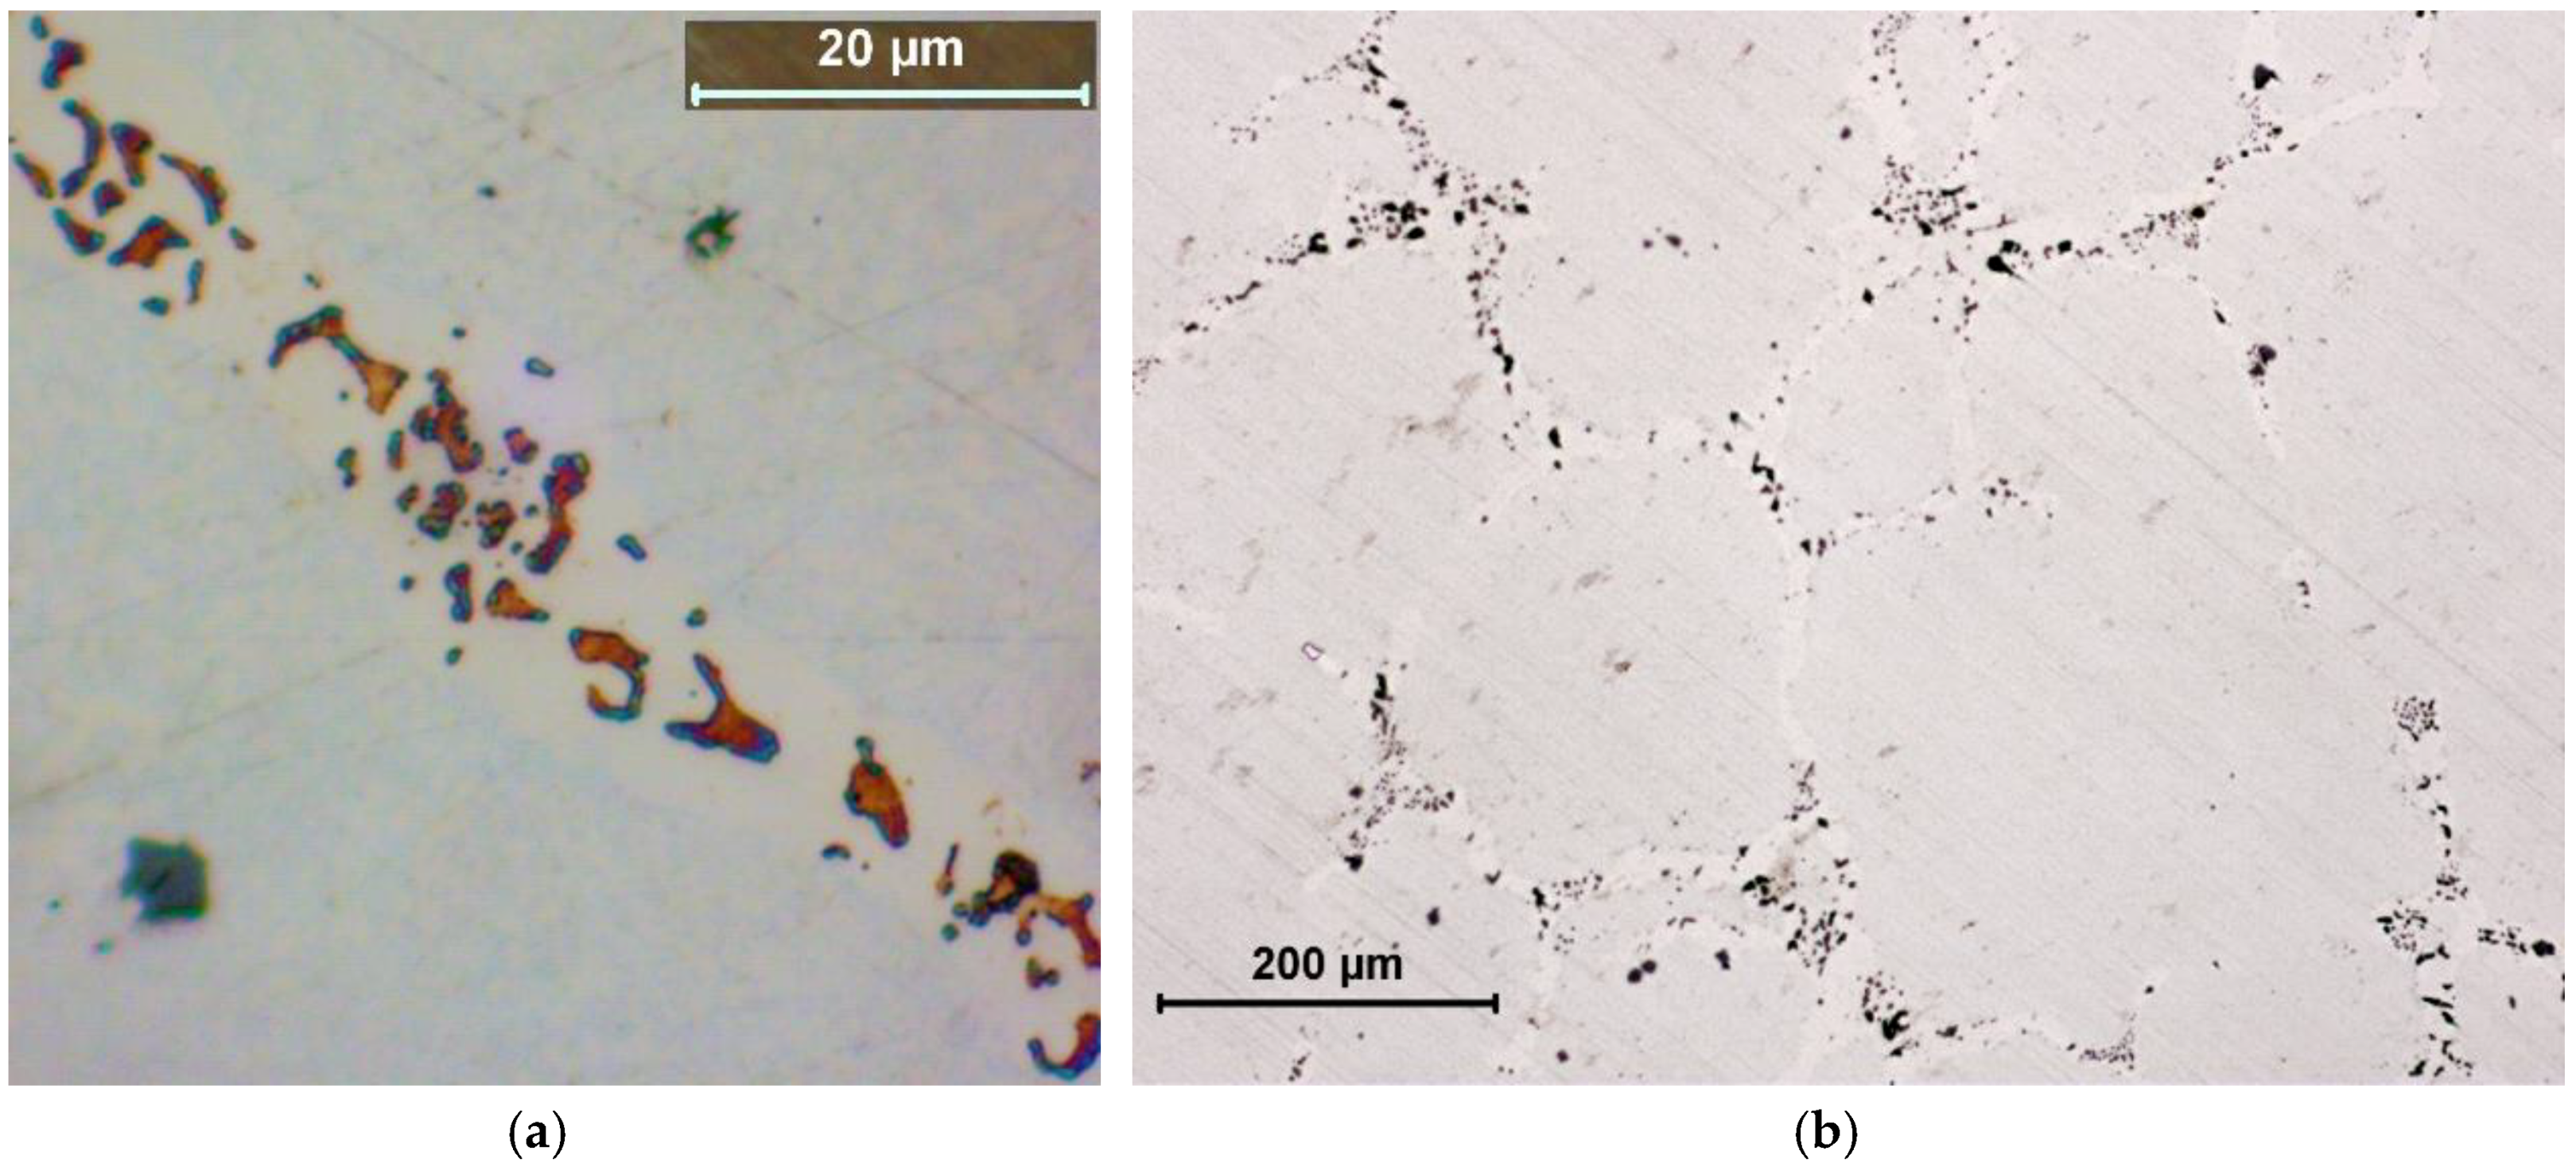
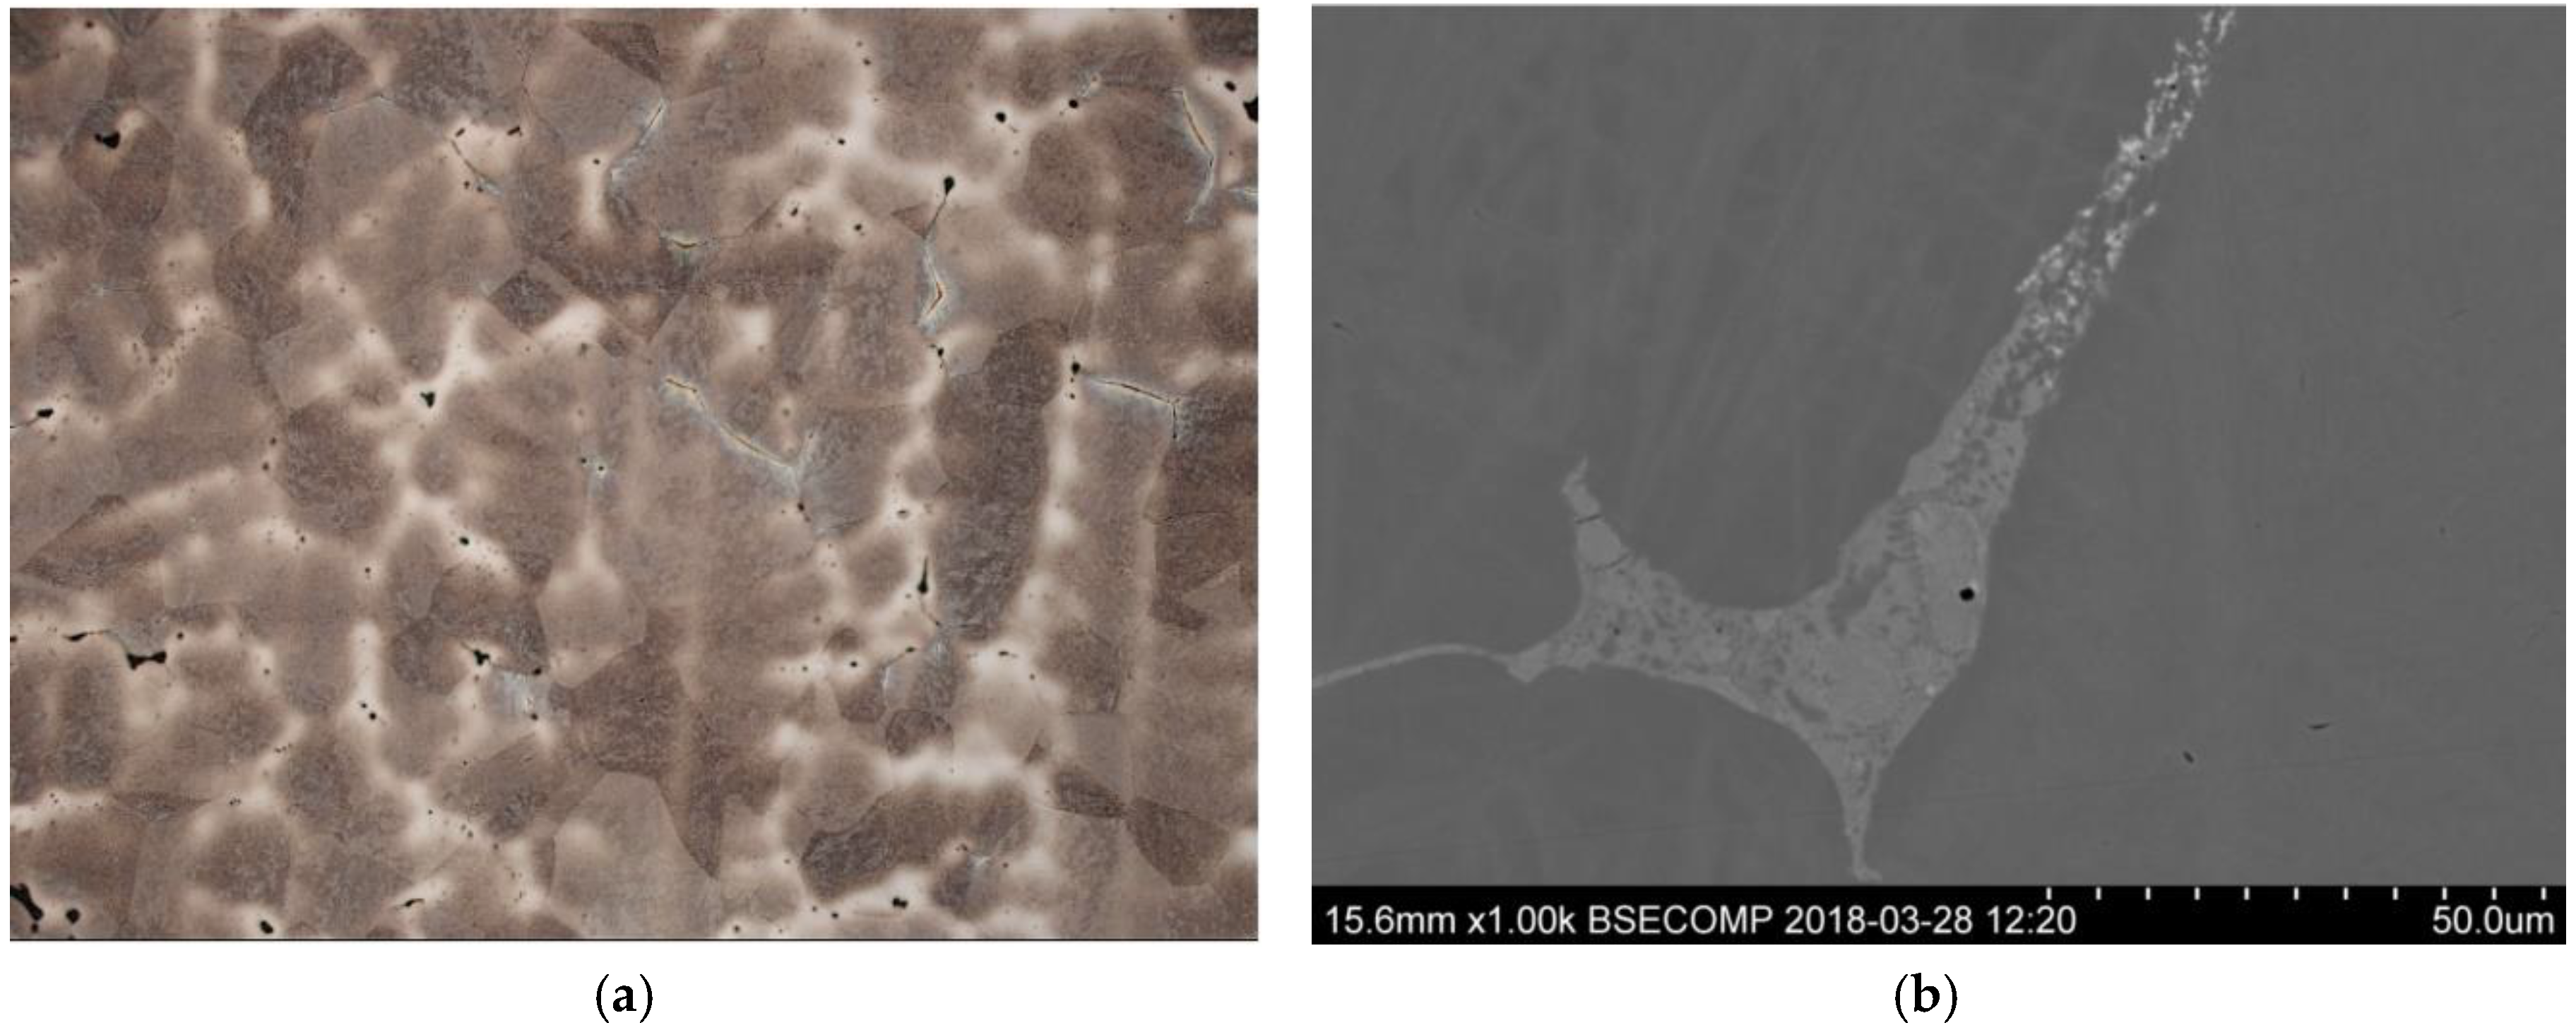
In the micro-sample, SOB4h, soaked for 4 hours, all primary carbides were dissolved in the bulk. In the micro-sample SOA4h, a few tiny carbides remained in the A-segregates. Figure 13a shows the soaked structure with a dendritic appearance, grain boundary cracks can also be seen. It seems that the grain boundary cracks have developed due to the soaking. One example of remaining carbide is shown in Figure 13b. The results indicate that only 4 h of soaking are needed to dissolve all primary carbides in the bulk, but longer soaking times are needed to dissolve primary carbides in the A-segregates, with thicker carbides.
4.5. Results on Soaked and Hot Worked Material
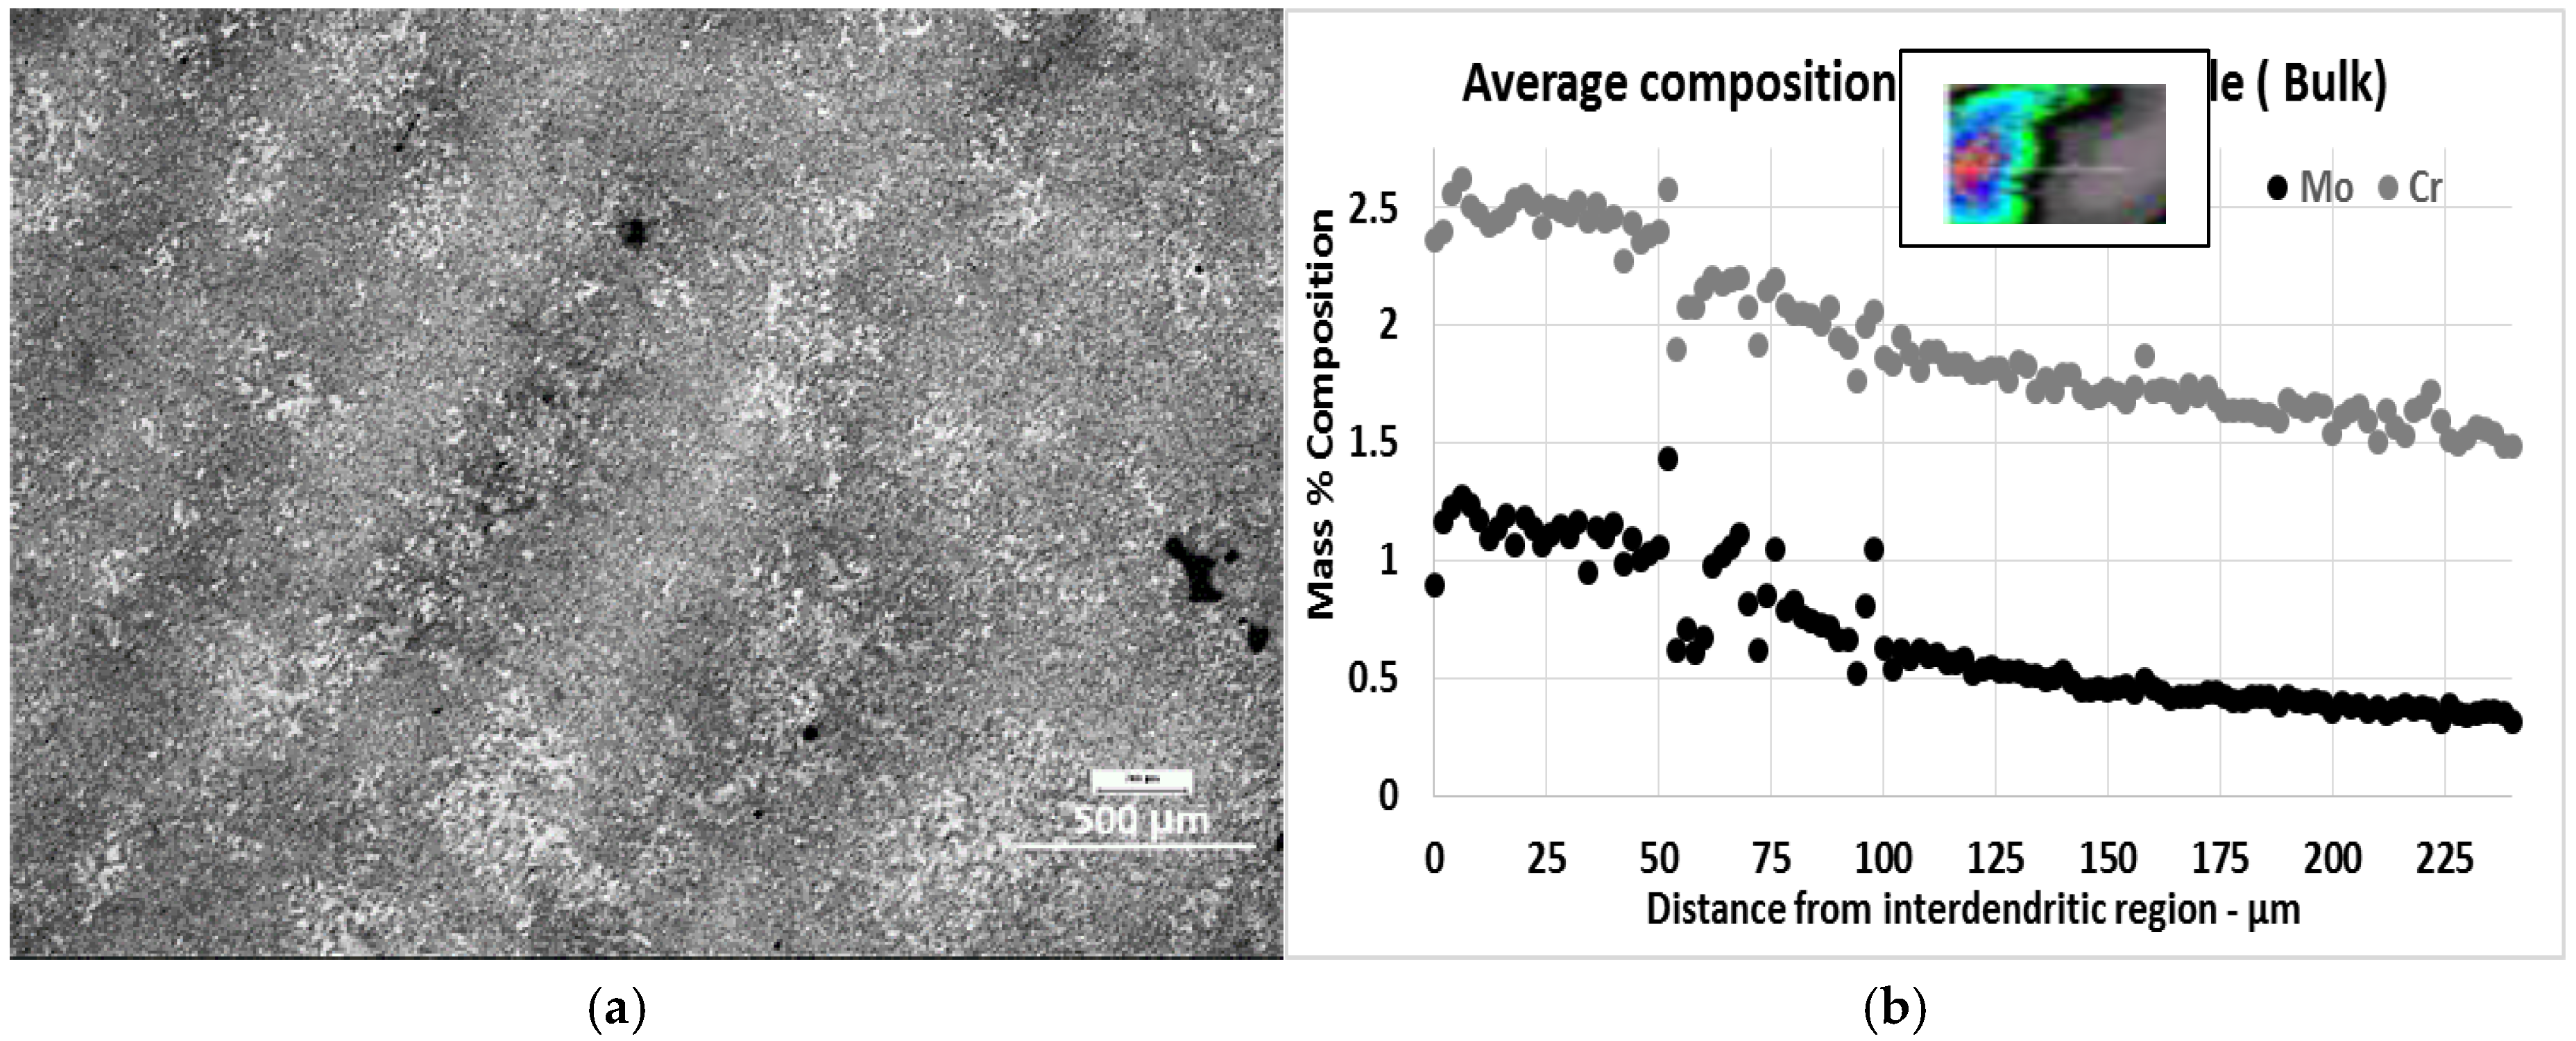
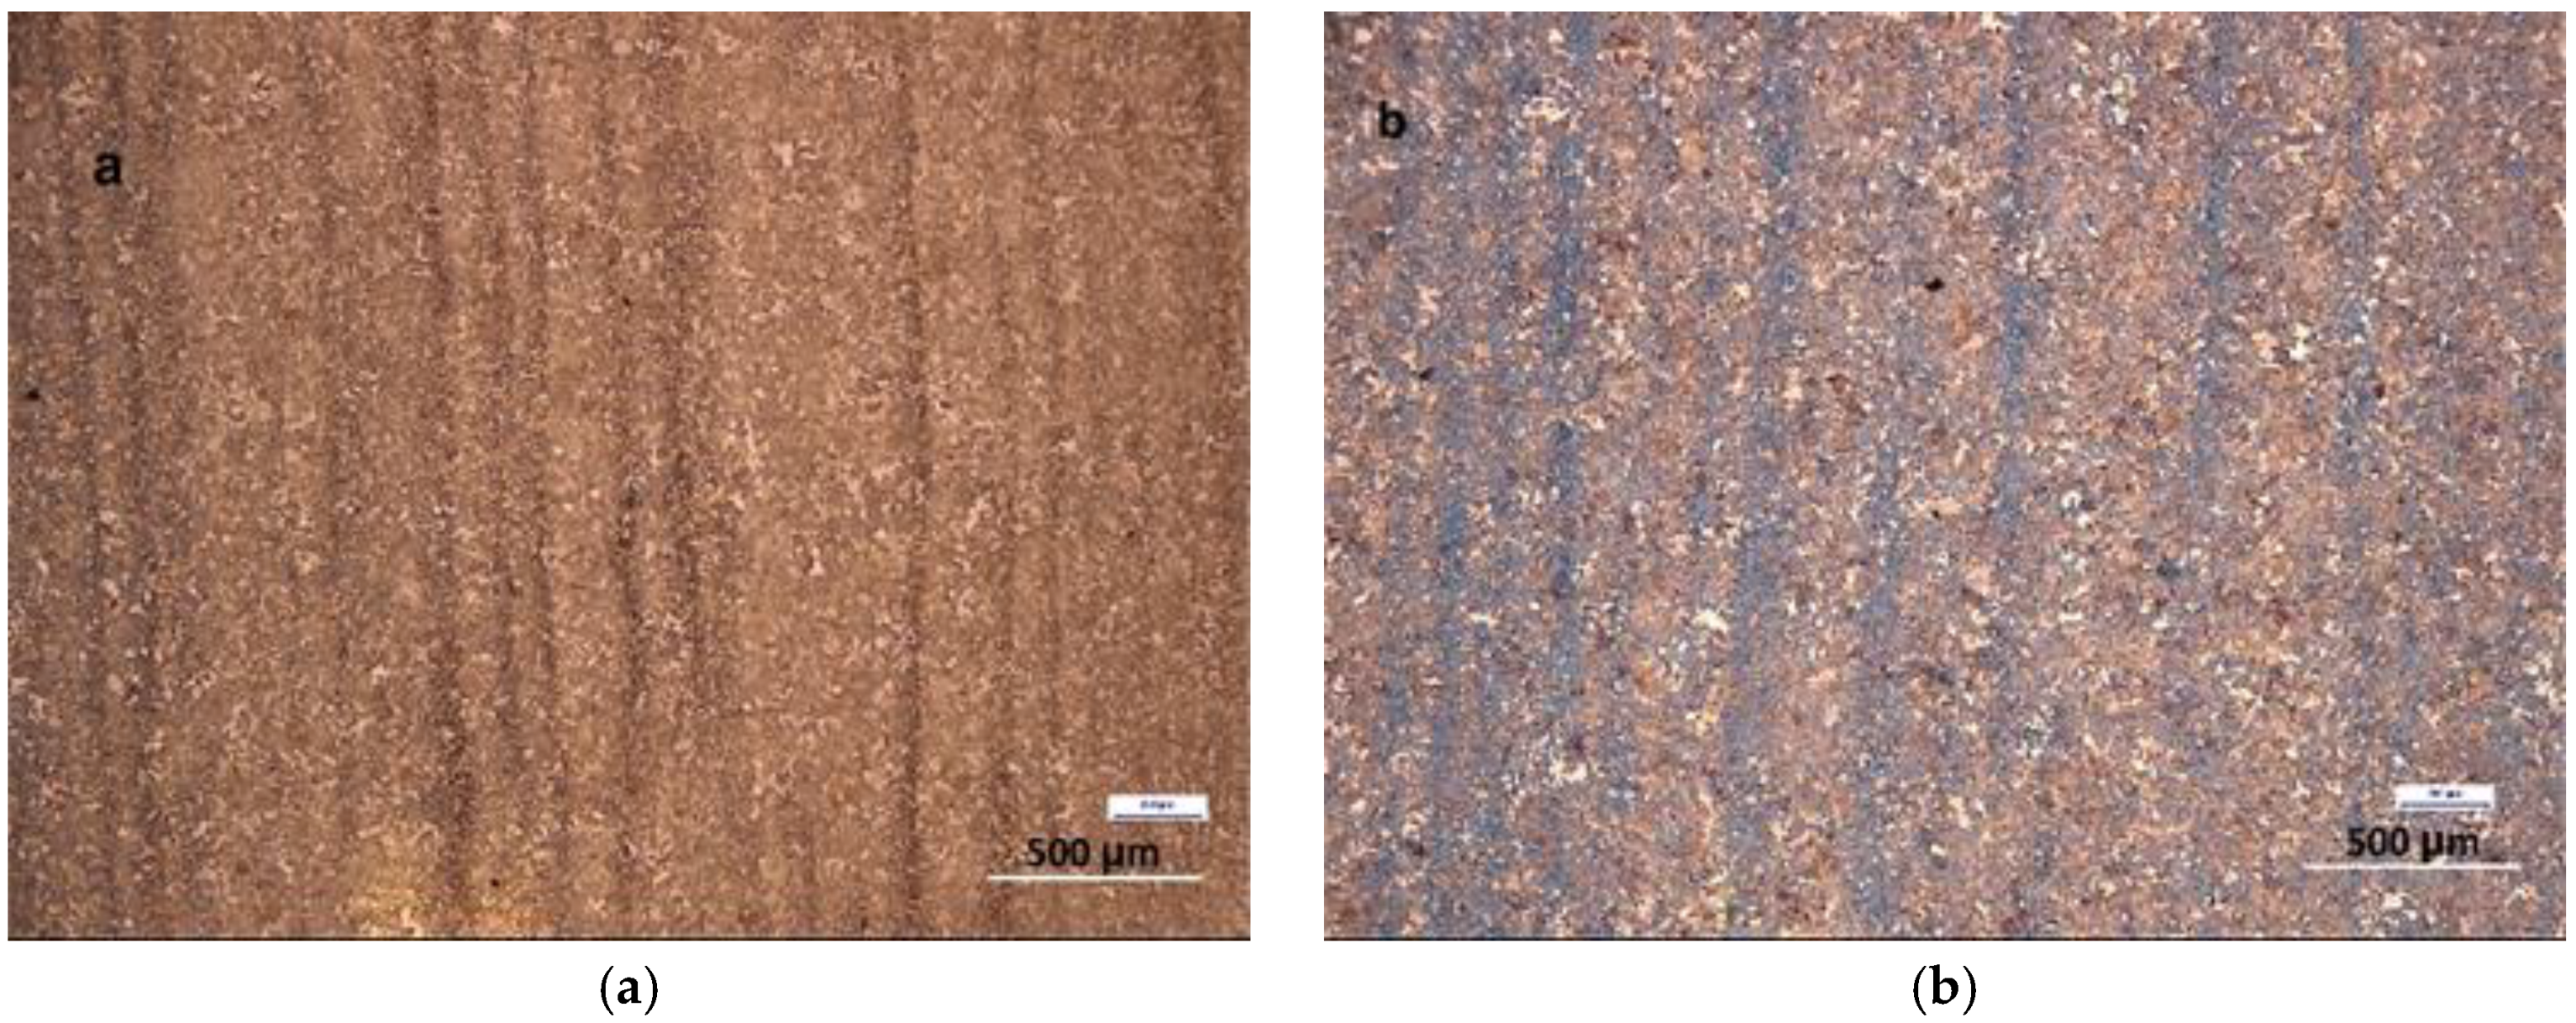
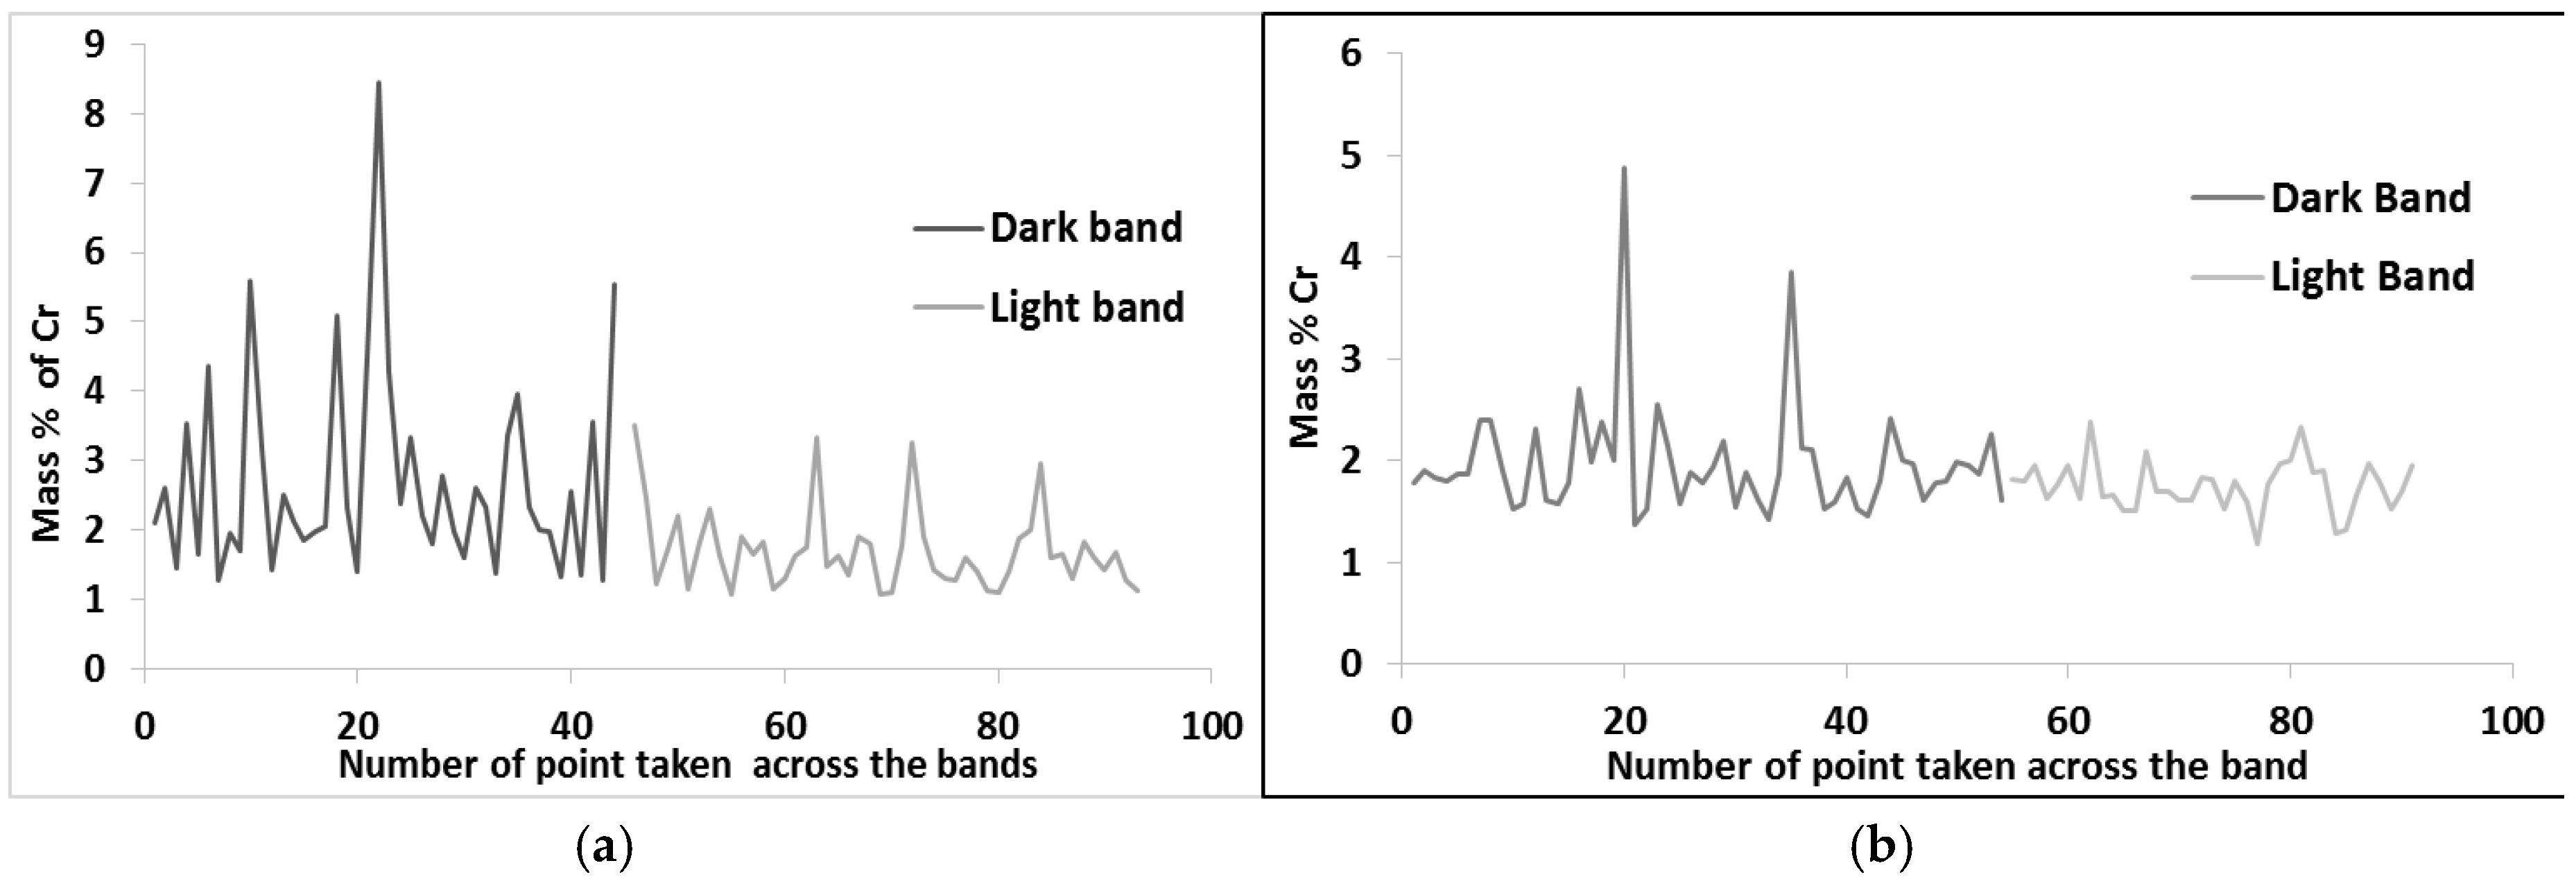
A banded structure was observed in the hot worked samples. These bands were aligned in the hot working direction. The segregation bands were very distinctive in the samples heat treated for 4 h (HW4h) and then deformed, as shown in Figure 14a, whereas for the ingot heat treated for 20 h and then deformed, the bands are weaker with low levels of contrast between the bands, as shown in Figure 14b. A high degree of segregation of the alloying elements in the darker areas of these bands was noted. The fraction of secondary carbides was also high in these dark bands, and some of the carbides were observed to be surrounding the elongated MnS. The average distance between the darker bands is about 230 μm in Figure 14. This distance can be compared with the recalculated average dendrite arm spacing of around 70 μm after hot working with an elongation factor of 16. This shows that it is only the most segregated interdendritic areas in the cast structure that give rise to the bands. Linear analyses by EDS were carried out across the banded structure in Figure 14a,b. The results are presented in Figure 15a,b. The results show variations in concentrations with high peaks due to the presence of carbides.
However, it is interesting to note that the average differences between dark and light band decreases with soaking time.
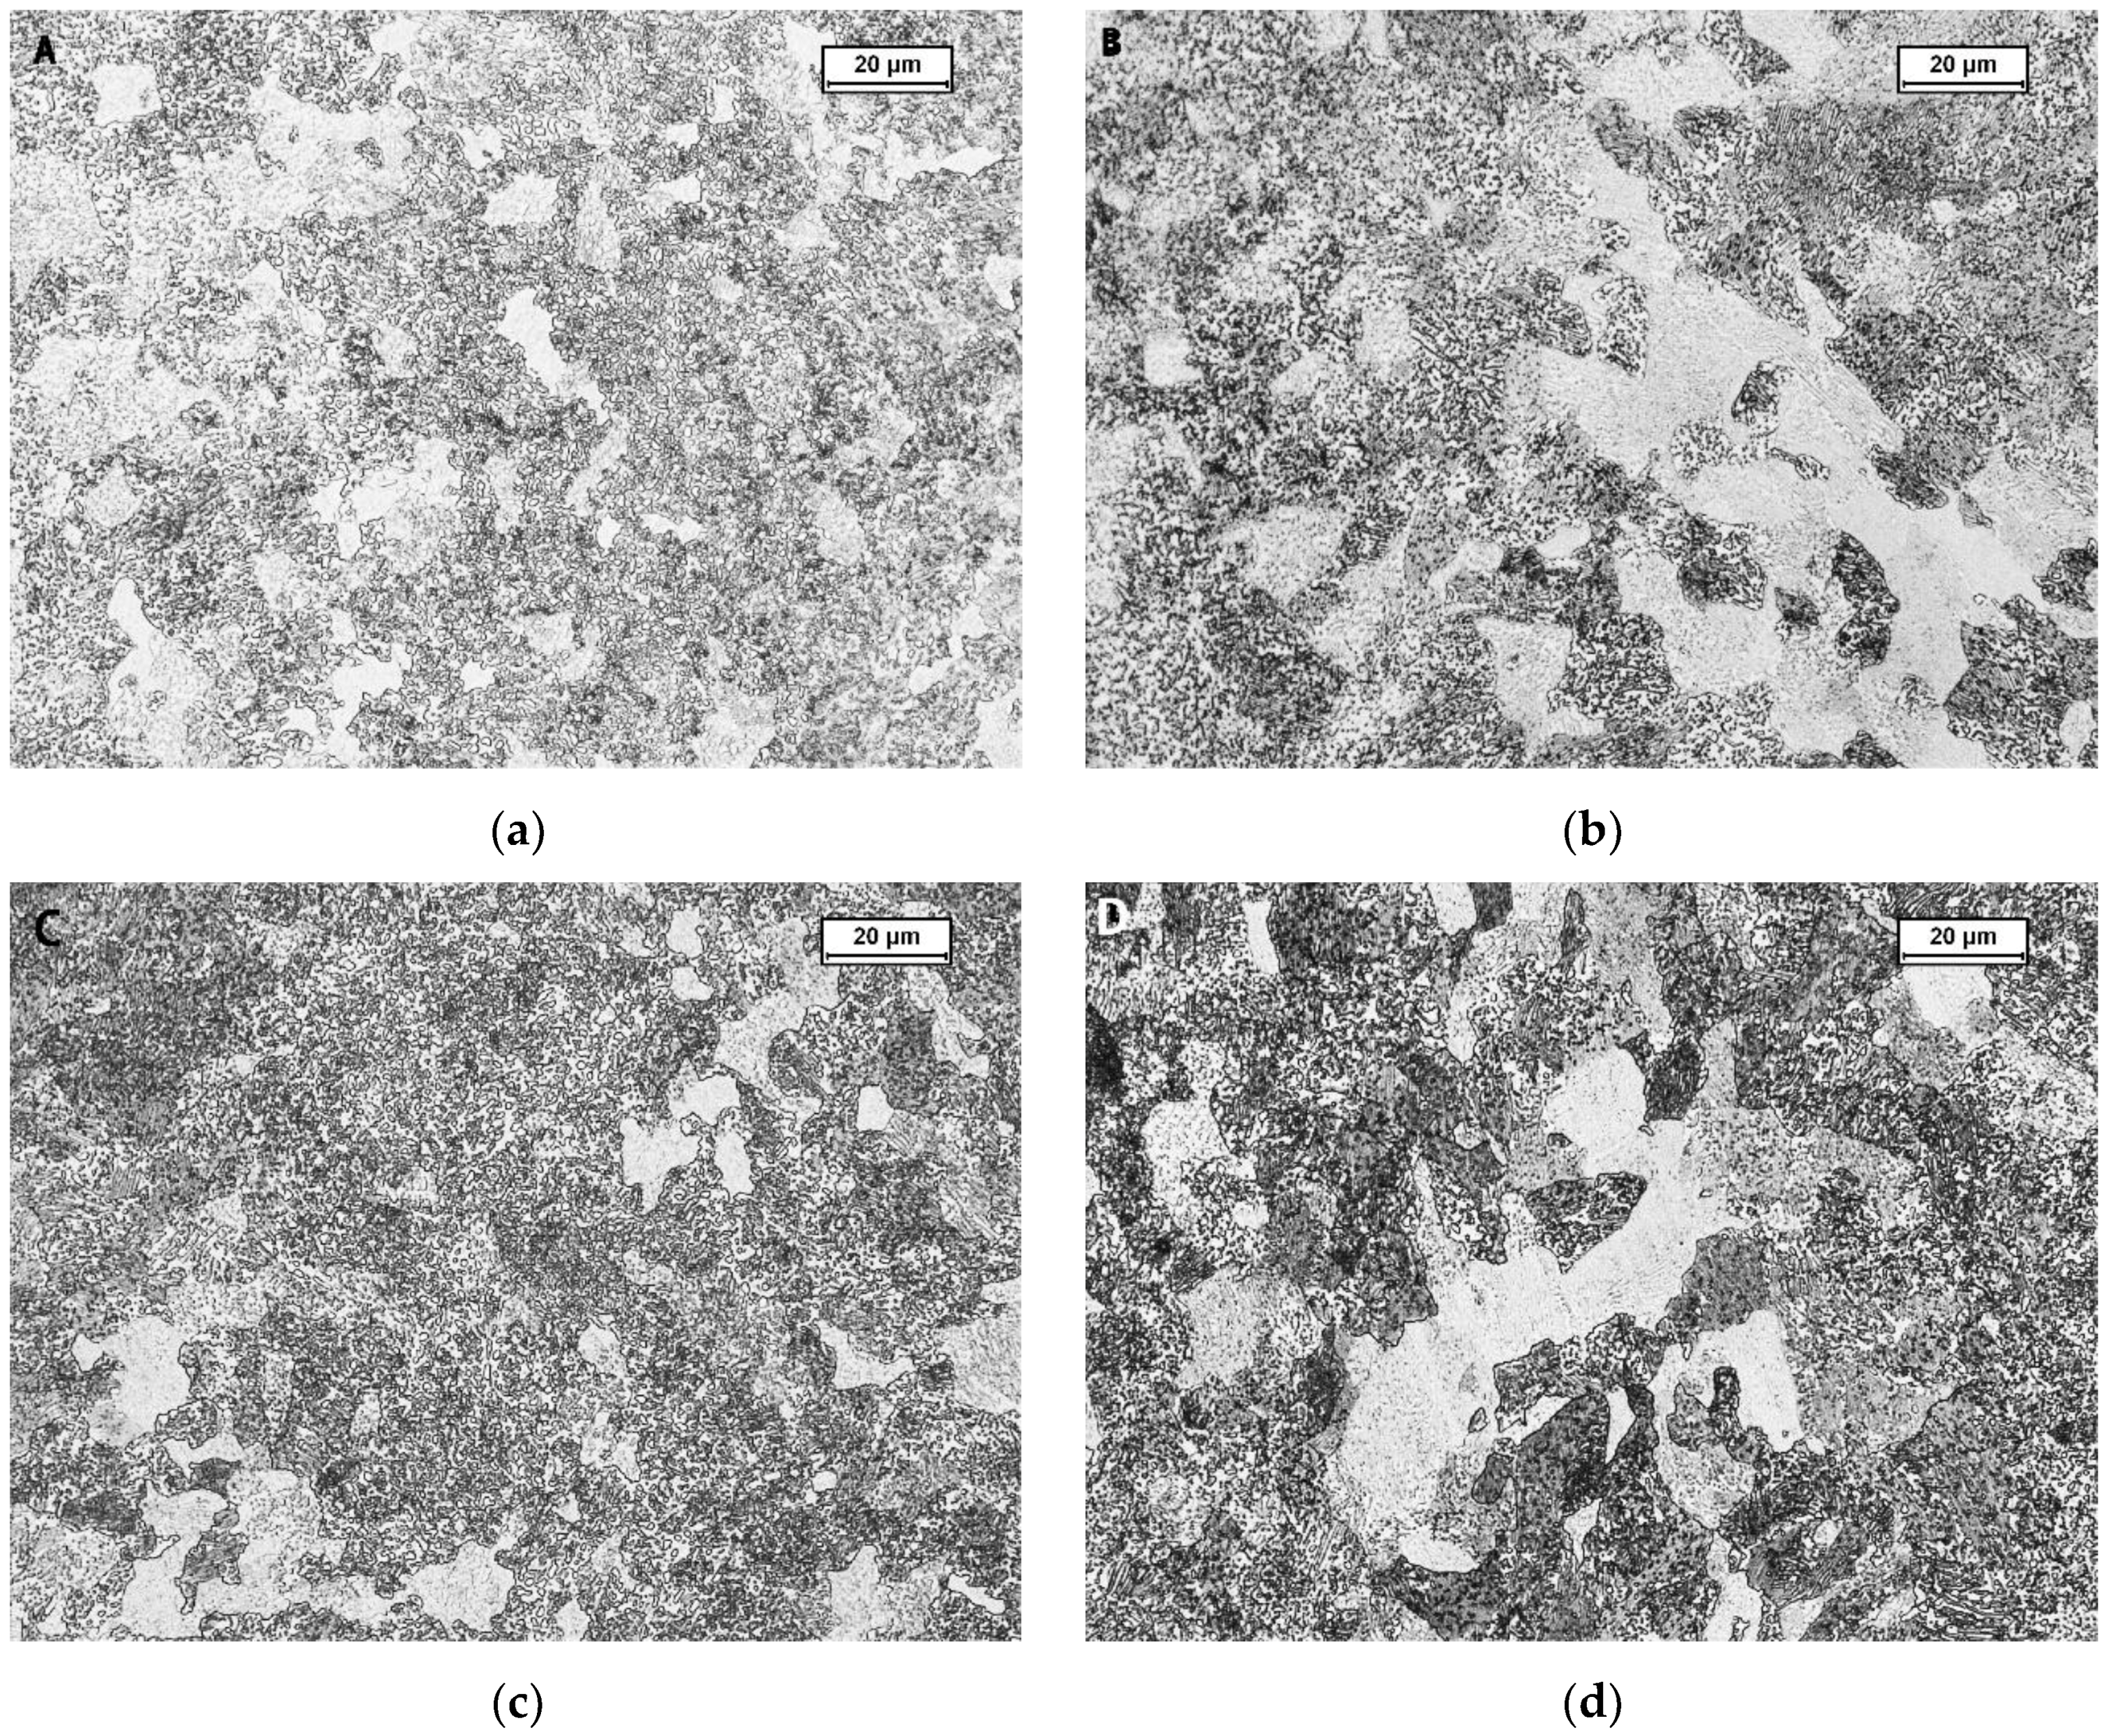
Figure 16 shows micrographs of both dark and light bands in sample HW4h, which was soaked for 4 h and deformed, and sample HW20h, which was soaked for 20 h and deformed. Both the samples are equally strained. Figure 16a shows the dark band with high alloying element concentration, with the structure consisting of completely spheroidized carbides within the ferrite matrix. No lamellar cementite is visible. Figure 16b shows the lighter band with a lower composition of alloying elements. The sample has a mixture of spheroidized carbides and lamellar pearlite scattered around. Fraction of pearlite phase is high; in some areas, secondary carbides are seen nestled in the pearlitic matrix. Figure 16c exhibits a darker band within the sample that was soaked for 20 h and deformed, yielding large spheroidized regions with comparatively finer carbides that are mixed with a small pearlitic region containing a pearlite lamella. Figure 16d shows a lighter area in the banded structure, which exhibits a structure similar to that in Figure 16b, but with a region containing a higher fraction of lamellar pearlite. It is obvious that the soaking time and concentration differences influence the matrix structure.
5. Discussion
In Figure 4a, it can be seen that the primary carbides precipitate only at certain interdendritic areas. Consequently, the alloy concentration varies from one area to another. However, the Scheil equation predicts a continuous precipitation of primary carbides in interdendritic regions. The measured area fraction of carbide was = 0.0011. The Scheil calculation shows that carbide M6C starts to precipitate at = 0.01. Assuming that all of the remaining liquid solidifies to carbide, the total primary precipitation of carbide should be 10 times that of the measured fraction. It is obvious that the Scheil equation does not predict the amount of primary carbide precipitation for the bearing steel studied.
The average distance between the segregation lines in the hot worked samples in Figure 14 is, on average, 230 μm. This corresponds to a distance of 920 μm in the as cast samples, which can be compared with the average measured secondary arm spacing of 270 μm. From this, it clear that the concentrations in the interdendritic areas vary from region to region, producing peaks of high concentration that cause precipitation of primary carbides. A hypothesis to explain this is that the concentration peaks arise due to redistribution of enriched liquid by fluid flow caused by solidification shrinkage.
The measured micro segregation levels of Cr and Mo in as cast samples are presented in Table 7. Soaking for 20 h decreases the Cr concentration significantly in interdendritic areas, but not in the dendrite center. The explanation is that the concentration gradient is steeper closer interdendritic areas and hence the back diffusion rate will be higher. In A-segregate channels, the mean compositions of Cr and Mo are higher compared to those in the bulk. This explains why the fraction of interdendritic carbides is higher in A-segregation channels, 0.0027, in comparison with the bulk, 0.0011.
A summary of the compositions in dark and light areas in the hot worked samples is shown in Table 8. As expected, longer soaking time decreases the segregation of Cr, and the measured values are in agreement with those in Table 7.
In Table 9, a summary of different appearance of carbides with measured compositions is presented. The phases light gray, gray, and dark gray have more or less the same composition range. In comparison with the different carbide compositions, calculated by Thermo-Calc, the closest carbide type is cementite, M3C in Table 2. The result from the color etching also supports that these phases are M3C carbides. It could also be possible that the gray and dark gray phases are M23C6. The white phase in the bulk samples corresponds to M6C given in Table 5 with high content of Mo. The measured composition of the light silver phase in the bulk sample could be a mix of different carbides, for example, M7C3 and M6C. Figure 7 and Figure 11b which shows the color etched phases, reveals that the white carbide in Figure 4b is M2C (brown color), with M6C, blue colored, appearing at the border of cementite. This also indicates that M6C precipitated during cooling, and not during solidification. Primary carbides in A-segregated areas shown in Figure 11 seem to be a cooperated precipitation of cementite and M2C. This difference in carbide appearance in comparison to the bulk could be attributed to higher level of the carbide forming elements Cr, Mo, and C.
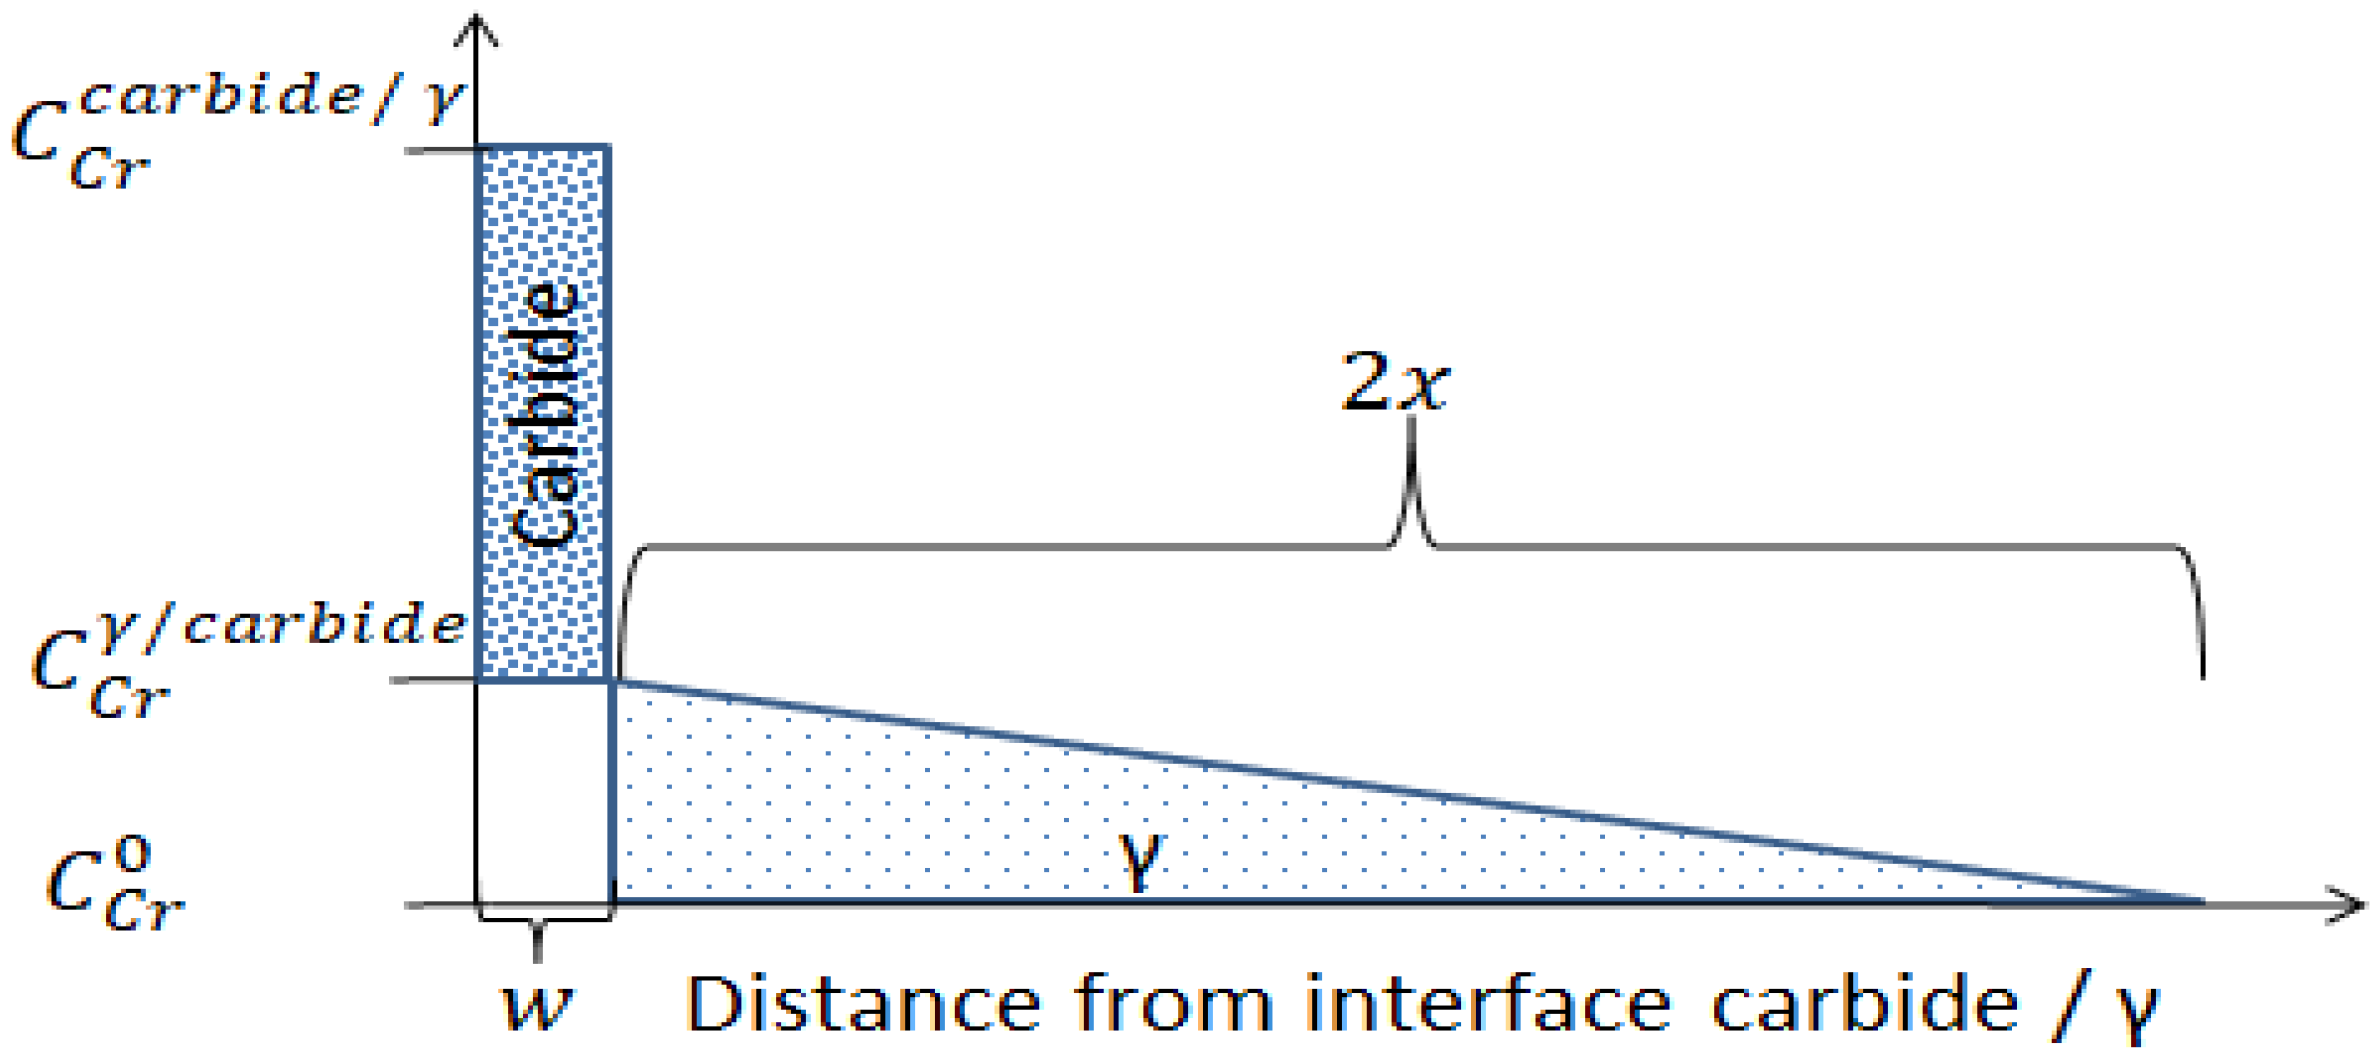
To get an idea of the dissolution time of the primary carbides, a simple model was developed with the following assumptions:
- Diffusion of Cr in γ is the rate determining step for carbide dissolution.
- The density of the carbide and the γ phases is the same.
- The phase boundary between dissolving carbide and γ does not move.
A mass balance for Cr between carbide and γ gives
in which is Cr-concentration in the carbide, is the thickness of dissolved carbide, is the Cr-concentration in γ in contact with carbide, is the concentration in the center of the dendrite, D is the diffusion constant of Cr, and t is time; Figure 16 indicates how Equation (2) is calculated. The diffusion distance, x, is determined from the erf solution of Fick’s second law at = 0.5.
Input data to Equations (2) and (3) are given in Table 10 and Table 11 for calculations of concentration gradients and dissolved carbide thickness.
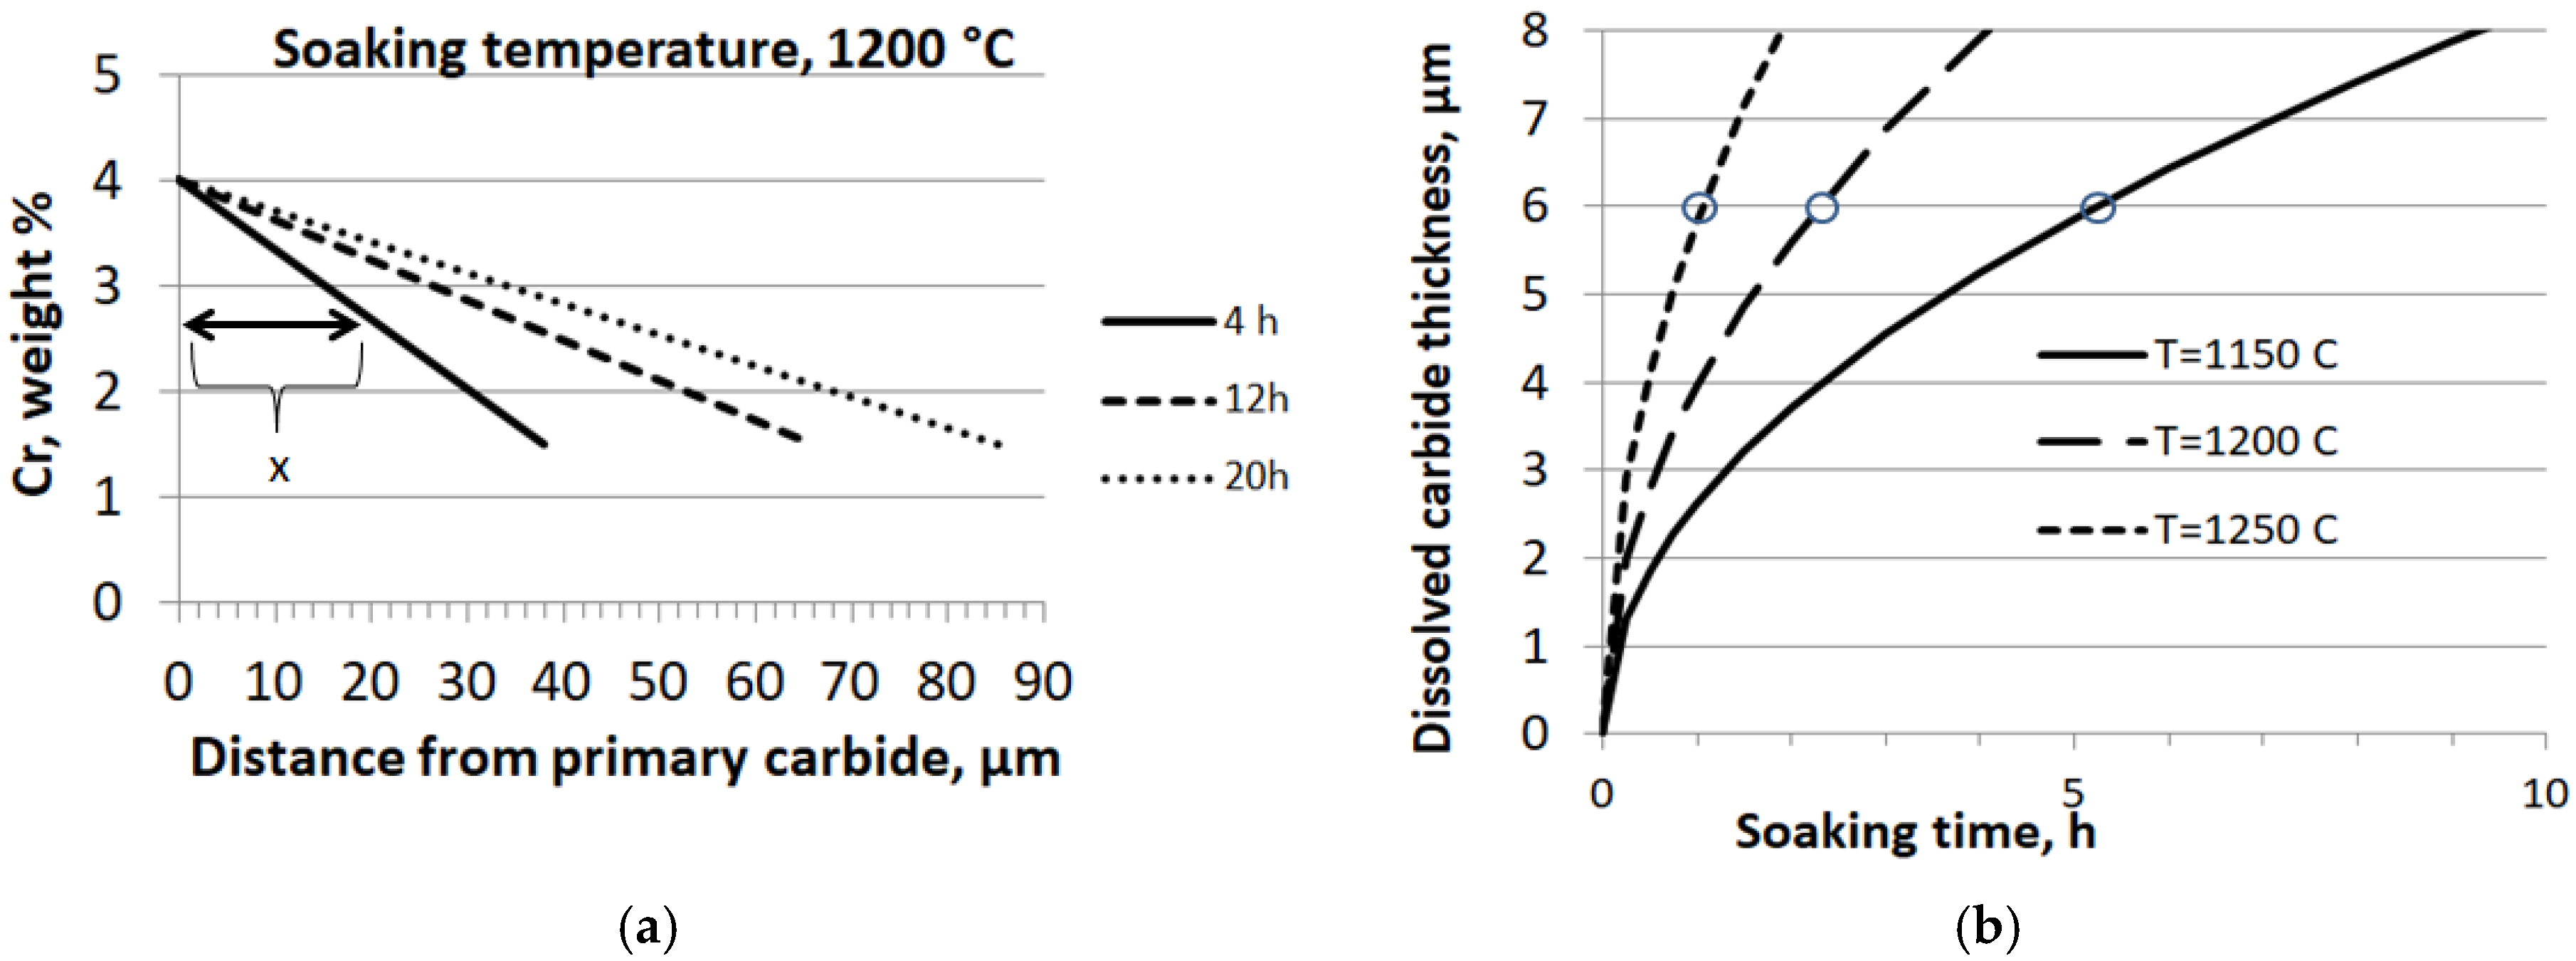
Figure 18b shows the results of calculated carbide thickness versus soaking time for three different soaking temperatures. From Figure 4b and Figure 9b, it is possible to estimate the thickness of the primary carbides to be about 12 μm. The circles indicate half the carbide thickness, and the results indicate that the primary carbides are dissolved before 4 hours soaking at the temperatures 1200 °C and 1250 °C but not for the lower temperature 1150 °C. This is in agreement with the measurement results of carbides on the soaked samples.
The detailed mapping of the remaining primary carbides in the soaked sample SOA4h showed a few primary carbides left in the A-segregated area. It indicates that there exist areas in the ingot that have quite high segregation levels in the interdendritic regions. To meet the requirement of having no primary carbides in the final product by setting a sufficient soaking time and temperature will not be an easy task. For example, selecting a soaking time of 10 h would, most probably, dissolve all of the carbides. However, it would be very difficult to prove this from a practical point of view, since a huge number of micro-samples would need to be taken from different positions in the ingot for evaluation, in order to have a reliable statistical basis.
6. Conclusions
The main conclusions, as regards the experimental work, can be summarized as follows:
- During solidification, primary carbides precipitate in the interdendritic regions for the bearing grade, 100CrMnMoSi8-4-6.
- The analysis shows that the main part of the primary carbides contains ~10 wt% Cr and 5 wt% Mo and is probably cementite.
- The color etching reveals that M2C carbide precipitates in cooperation with cementite during solidification.
- A-segregated channels contain about double the amount of primary carbides compared to the bulk due to the higher concentrations of carbide stabilizing elements Cr and Mo.
- The primary carbides in the bulk are dissolved after 4 h of soaking at 1200 °C, but longer soaking time is needed to dissolve all the carbides in the A-segregate region.
- It is the most interdendritic segregated areas in the bulk that give rise to a banding structure in the hot worked material.
However, it is also worth highlighting the reliability, or otherwise, of Thermo-Calc in providing information on the solidification characteristics of this particular alloy:
- It was found that Thermo-Calc underestimated the liquidus temperature of this alloy by around 15 °C.
- It was limited in its ability to predict, at realistic temperatures, the formation of primary carbides that were observed experimentally.
Funding
Jernkontoret, Hugo Carlsson foundation
Acknowledgments
I would like to thank my distinguished and learned supervisors Professor Hasse Fredriksson Docent Michael Vynnycky, and Professor Bo Rogberg for their valuable advises, critical comments, and guidance. The valuable comments given by Sven-Olof Ericsson at Ovako Steel were also very appreciable. Financial and material support provided by Ovako steel and Jernkontoret, Hugo Carlsson foundation, was of immense importance in completing this work.
Conflicts of Interest
There are no conflicts of interest.
References
- Bhadeshia, H.K.D.H. Steels for Bearings. Prog. Mater. Sci. 2012, 57, 268–435. [Google Scholar] [CrossRef]
- Cappel, J.; Weinberg, M.; Flender, R. The metallurgy of roller-bearing steels. Ball Bear. J 2004, 2, 261–268. [Google Scholar]
- Cemil, H.G.; Jiansheng, P. Handbook of Thermal Process Modeling Steels; CPC Press: Boca Raton, FL, USA, 2009; ISBN 9780849350191. [Google Scholar]
- Fredriksson, H.; Åkerlind, U. Materials Processing during Casting; Wiley: West Sussex, UK, 2006. [Google Scholar]
- Flemings, M.C.; Nereo, G.E. Macrosegregation part 3. Trans. Metall. Soc. AIME 1968, 242, 50–55. [Google Scholar]
- Hollomon, J.H.; Jaffe, L.D. Castings, Steel, Homogenization of Steel Castings; 632/G; Watertown Arsenal: Watertown, MA, USA, 1942. [Google Scholar]
- Thomas, L.; Malcolm, B. Steel Casting Hand Book; ASM International: Almere, The Netherlands, 1995; ISBN 9781615032426. [Google Scholar]
- Hume-Rothery, W.; Coles, B.R. Atomic Theory for Students of Metallurgy; Institute of Metals: London, UK, 1969. [Google Scholar]
- Beswick, J.M. The effect of chromium in high carbon bearing steel. Metall. Mater. Trans. A 1987, 18, 1897–1906. [Google Scholar] [CrossRef]
- Kim, K.-H.; Park, S.-D.; Bae, C.-M. New Approach to the Soaking Condition of 100Cr6 High-Carbon Chromium Bearing Steel. Met. Mater. Int. 2014, 20, 207–213. [Google Scholar] [CrossRef]
- Reger, M.; Vero, B.; Kardos, I.; Varga, P. The Effect of Heat Treatment on the Stability of Centerline Segregation. J. Mech. Eng. 2010, 56, 143–149. [Google Scholar]
- Fisher, R.M.; Speich, G.R.; Cuddy, L.J.; Hu, H. Phase transformations during steel production. In Proceedings of the Darken Conference “Physical Chemistry in Metallurgy”, Monroeville, PA, USA, 23–25 August 1976; pp. 463–488. [Google Scholar]
- Andersson, J.O.; Helander, T.; Höglund, L.; Shi, P.; Sundman, B. Thermo-Calc and DICTRA, Computational tools for materials science. Calphad 2002, 26, 273–312. [Google Scholar] [CrossRef]
- Jin, S.; Chen, Q.; Bratberg, J. Thermodynamic Calculations and Precipitation Simulations of HSLA Steels. In HSLA Steels 2015, Microalloying 2015 & Offshore Engineering Steels 2015; Springer: Berlin, Germany, 2015. [Google Scholar] [CrossRef]
- Erişir, E.; Bilir, O.G.; Gezmişoğlu, A.E. A study of carbide dissolution in bearing steels using computational thermodynamics and kinetics. In Proceedings of the 4th International Conference Recent Trends in Structural Materials, Pilsen, Czech Republic, 9–11 November 2016. [Google Scholar]
- Voort, V.G.; Manilova, E.; Michael, J.R. A Study of Selective Etching of Carbides in Steel. Microsc. Microanal. 2004, 10, 76–77. [Google Scholar] [CrossRef]
- Vander Voort, G.F. ASM Handbook, Volume 09—Metallography and Microstructures; ASM International: Novelty, OH, USA, 2004; p. 257. [Google Scholar]
- De Colnet, L.; Pirard, E.; Tchuindjang, J.T.; Lecomte-Beckers, J.; Gfhiri, R.; Boeraeve, P.; Cescotto, S. Quantitative description of MC, M2C, M6C and M7C3 carbides in high speed steel rolls. In Proceedings of the 3rd International Conference on Material structure & Micromechanics of Fracture, Brno, Czech Republic, 27–29 June 2001; pp. 710–717. [Google Scholar]
- Bowen, A.W.; Leak, G.M. Solute diffusion in alpha- and gamma-iron. Met. Trans. 1970, 1, 1695–1700. [Google Scholar] [CrossRef]
Figure 1.
A rough illustration of the crystal structure and macro segregation occurring during solidification of large ingots. The dashes delineate the extents of the different crystal zones.
Figure 1.
A rough illustration of the crystal structure and macro segregation occurring during solidification of large ingots. The dashes delineate the extents of the different crystal zones.

Figure 2.
(a) Phase equilibrium. Mole fraction of all phases versus temperature for the steel grade investigated; (b) Scheil equation. Weight fraction of all phases versus temperature for the steel grade investigated; (c) phase equilibrium. Mol fraction of all phases versus temperature for the composition in γ in contact with carbide.

Figure 3.
(a) Cross section of macro etched as cast unsoaked sample of alloy1. A-segregation channels are marked with arrows. Equiaxed crystals are visible. (b) Cross section of macro etched, as-cast soaked sample for 20 h, alloy1. Dendritic structure is not clearly visible due to homogenization of solute elements.

Figure 4.
(a) LOM micrograph of as cast sample 0SB. Carbide precipitation marked by arrows can be seen in interdendritic regions. Some ferritic crystalline growth can be seen in the center of dendrites. (b) SEM back scattered micrograph of as cast sample 0SB, showing the distribution of carbides and MnS along the interdendritic region. Some lamellar precipitate can be observed in the pearlitic matrix.

Figure 5.
(a) Composition analysis of a carbide in the bulk matrix of an unsoaked sample. The mass percentage composition at area marked by (A) 5.5 Cr, 3.1 Mo; (B) 7.8 Cr, 4.3 Mo; (C) 12.43 Cr, 7.5 Mo; and (D) 20.5 Cr, 53.5 Mo. (b) EDS analysis of a carbide in the bulk matrix of an unsoaked sample. The mass percentage composition at area marked by (A) 5.3 Cr, 51.53 Mo; (B) 29.7 S, 61.7 Mn; (C) 22.7 Cr, 50.1 Mo; and (D) 7.7 Cr, 5.8 Mo.

Figure 6.
EMPA report of sample 0SB, showing the distribution of Mo and Cr in the bulk matrix. Uneven distribution of alloying elements along the interdendritic region was observed, with high concentration spots.
Figure 6.
EMPA report of sample 0SB, showing the distribution of Mo and Cr in the bulk matrix. Uneven distribution of alloying elements along the interdendritic region was observed, with high concentration spots.

Figure 7.
(a) Matrix of the colored etched sample 0SB. M2C is colored brown, M6C is outlined and colored blue, and M7C3 is faintly colored. (b) Matrix of the colored etched sample 0SB. M2C is colored brown, M6C is outlined and colored blue, and M7C3 is faintly colored.
Figure 7.
(a) Matrix of the colored etched sample 0SB. M2C is colored brown, M6C is outlined and colored blue, and M7C3 is faintly colored. (b) Matrix of the colored etched sample 0SB. M2C is colored brown, M6C is outlined and colored blue, and M7C3 is faintly colored.

Figure 8.
Comparison between calculated and experimental values of Mo and Cr segregation along the dendrite. It can be seen that precipitation of carbides starts earlier than predicted by the Scheil calculation.
Figure 8.
Comparison between calculated and experimental values of Mo and Cr segregation along the dendrite. It can be seen that precipitation of carbides starts earlier than predicted by the Scheil calculation.

Figure 9.
(a) A-segregation channel; large primary carbide network precipitation at the tip of the dendrite in the interdendritic region was observed, along with the precipitation of type III MnS. (b) Composition analysis of the carbide in the bulk matrix of an unsoaked sample. The mass percentage composition at area marked by (A) 10.52 Cr, 6.07 Mo; (B) 11.83 Cr, 5.87 Mo; (C) 2.84 Cr, 49.00 Mo; and (D) 9.01 Cr, 4.04 Mo.

Figure 10.
EMPA report of sample OSA, showing the distribution of Mo and Cr in an A-segregate channel. High concentration areas in the middle of the carbide can be seen.
Figure 10.
EMPA report of sample OSA, showing the distribution of Mo and Cr in an A-segregate channel. High concentration areas in the middle of the carbide can be seen.

Figure 11.
(a) Color etching of primary carbides in A-segregate. The eutectic consists mainly of M2C, brown color, and white carbide phase. Some M6C exists at the border. (b) Color etching of primary carbides in an A-segregation channel at lower magnification.
Figure 11.
(a) Color etching of primary carbides in A-segregate. The eutectic consists mainly of M2C, brown color, and white carbide phase. Some M6C exists at the border. (b) Color etching of primary carbides in an A-segregation channel at lower magnification.

Figure 12.
(a) Microstructure of the sample SO20h. No primary carbides are visible in LOM. Less intense solute segregation. (b) SEM picture of sample SO20h, exhibiting secondary carbide precipitated along the inter-crystalline region. It also shows the pattern of EDS analysis.
Figure 12.
(a) Microstructure of the sample SO20h. No primary carbides are visible in LOM. Less intense solute segregation. (b) SEM picture of sample SO20h, exhibiting secondary carbide precipitated along the inter-crystalline region. It also shows the pattern of EDS analysis.

Figure 13.
(a) Micro structure in sample SOA4h from the bulk region, showing a dendrite structure with no primary carbides, as well as grain boundary cracks in the inter-granular regions. (b) SEM photo showing a remaining primary carbide in the A-segregated area.
Figure 13.
(a) Micro structure in sample SOA4h from the bulk region, showing a dendrite structure with no primary carbides, as well as grain boundary cracks in the inter-granular regions. (b) SEM photo showing a remaining primary carbide in the A-segregated area.

Figure 14.
(a) LOM image of the banded structure of sample HW4h. The band lines are sharp and narrower. High contrast. (b) LOM image of the banded structure of sample HW20h. Band lines are blunt and wider. Low contrast.
Figure 14.
(a) LOM image of the banded structure of sample HW4h. The band lines are sharp and narrower. High contrast. (b) LOM image of the banded structure of sample HW20h. Band lines are blunt and wider. Low contrast.

Figure 15.
(a) Line analysis of sample HW4h, showing the distribution of Cr along the bands. (b) Line analysis sample HW20h, showing the distribution of Cr along the bands.
Figure 15.
(a) Line analysis of sample HW4h, showing the distribution of Cr along the bands. (b) Line analysis sample HW20h, showing the distribution of Cr along the bands.

Figure 16.
Micrographs of the hot worked samples etched with Nital: (a) sample HW4h, exhibits a dark band region; (b) sample HW4h, shows a lighter region; (c) sample HW20h, exhibits a darker region; and (d) sample HW20h, showing lighter region, of the banded structure.
Figure 16.
Micrographs of the hot worked samples etched with Nital: (a) sample HW4h, exhibits a dark band region; (b) sample HW4h, shows a lighter region; (c) sample HW20h, exhibits a darker region; and (d) sample HW20h, showing lighter region, of the banded structure.

Figure 17.
Schematic showing, diffusion distance, x, carbide thickness, w, and how the mass balance, Equation (2), is calculated.
Figure 17.
Schematic showing, diffusion distance, x, carbide thickness, w, and how the mass balance, Equation (2), is calculated.

Figure 18.
(a) Cr concentration in γ versus distance from the primary carbide for different soaking times. The diffusion distance, x, in Equation (3) is marked out; (b) dissolved primary carbide versus soaking time at different soaking temperatures. The vertical axis indicates half the thicknesss, and horizontal line gives the corresponding time for complete dissolution.


Table 1.
Composition of the alloys investigated, in wt%.
| Alloy | C | Si | Mn | P | S | Cr | Ni | Mo | Cu |
|---|---|---|---|---|---|---|---|---|---|
| Aloy1 | 0.98 | 0.52 | 0.97 | 0.012 | 0.005 | 1.89 | 0.14 | 0.56 | 0.128 |
| Alloy2 | 0.94 | 0.63 | 1.03 | 0.009 | 0.004 | 1.94 | 0.17 | 0.04 | 0.144 |
Table 2.
Concentration of Cr and Mo in secondary carbides from Thermo-Calc calculations at maximum temperature with equilibrium conditions.
Table 2.
Concentration of Cr and Mo in secondary carbides from Thermo-Calc calculations at maximum temperature with equilibrium conditions.
| Type of Carbide | Cr wt% | Mo wt% | Temperature, °C |
|---|---|---|---|
| 24.3 | 10.0 | 917 | |
| 13.6 | 9.8 | 793 | |
| 12.7 | 1.7 | 885 |
Table 3.
Concentration of Cr and Mo in primary carbides from Thermo-Calc calculations with the Scheil equation.
Table 3.
Concentration of Cr and Mo in primary carbides from Thermo-Calc calculations with the Scheil equation.
| Carbides | Cr wt% | Mo wt% | Temperature, °C |
|---|---|---|---|
| M6C | 2.82 | 51.9 | 1148 |
| M7C3 | 26.2 | 18.9 | 1130 |
| KSI_Carbide | 8.2 | 39.8 | 1081 |
Table 4.
Alloy composition in at the start of the precipitation of primary carbides from the Scheil equation. Values in wt%.
Table 4.
Alloy composition in at the start of the precipitation of primary carbides from the Scheil equation. Values in wt%.
| Mo | Cr | Mn | Si | Cu | Ni | S | P |
|---|---|---|---|---|---|---|---|
| 3.6 | 4.04 | 2.13 | 0.52 | 0.13 | 019 | 0.001 | 0.15 |
Table 5.
Concentration of Cr and Mo in carbides. Equilibrium Thermo-Calc calculations performed with alloy compositions given in Table 3.
Table 5.
Concentration of Cr and Mo in carbides. Equilibrium Thermo-Calc calculations performed with alloy compositions given in Table 3.
| Carbides | Cr wt% | Mo wt% | Temperature, °C |
|---|---|---|---|
| M6C | 3.36 | 52.3 | 1146 |
| M7C3 | 29.6 | 25.7 | 1058 |
| KSI _Carbide | 8.1 | 38.4 | 825 |
| M23C6 | 23.7 | 14 | 825 |
Table 6.
Designation of samples investigated.
| Sample Designation | Alloy | Soaking Time | Hot Working |
|---|---|---|---|
| 0SB | Alloy1 | No/As Cast | No |
| 0SA | Alloy1 | No/As Cast | No |
| SOA4h | Alloy1 | 4 h | No |
| SOB4h | Alloy1 | 4 h | No |
| SO20h | Alloy1 | 20 | No |
| HW4h | Alloy2 | 4 h | Yes—Rolled |
| HW20h | Alloy2 | 20 h | Yes—Rolled |
Table 7.
Mean segregation before and after soaking.
| Sample/Region | Alloying Element | Mean of Dendrite Center | Mean of Interdendritic Area |
|---|---|---|---|
| 0SB Unsoaked–Bulk | Cr% | 1.5 | 2.85 |
| Mo% | 0.4 | 1.2 | |
| SO20h-Soaked 20 h | Cr% | 1.6 | 2.3 |
| 0SA A-Segregation Channel | Cr% | 1.90 | 3.6 |
| Mo% | 0.43 | 1.93 |
Table 8.
Composition analysis of the dark and light areas in the soaked and deformed samples.
| Sample No. | Area Analysed | Cr wt% |
|---|---|---|
| HW4h-Soaked for 4 h & then deformed | Dark Area | 2.23 |
| Light Area | 1.48 | |
| HW20h-Soaked for 20 h & then deformed | Dark Area | 1.97 |
| Light Area | 1.67 |
Table 9.
Summary of appearance of carbides and corresponding measured compositions.
| Shade of the Carbide | Composition of Cr. wt% | Composition of Mo. wt% | ||
|---|---|---|---|---|
| Bulk | A-Segr | Bulk | A-Segr | |
| Light gray phase in matrix | 5.5–9.0 | 9 | 3.1–4.4 | 4.4 |
| Gray phase | 7.7–12.4 | 10.5 | 5.8–7.5 | 6.1 |
| Dark gray phase | 11.8 | 5.9 | ||
| Light silver | 20.5–22.7 | 50.1–53.5 | ||
| White | 5.3 | 2.8 | 51.5 | 49 |
Table 10.
Input data to Equations (2) and (3), with a note on where the values are chosen from.
| Cr, wt% | Note | |
|---|---|---|
| 10 | Table 9 | |
| 4 | Table 3 | |
| 1.5 | Table 7 |
Table 11.
Gives the diffusion constant of Cr at different temperature [19].
© 2018 by the author. Licensee MDPI, Basel, Switzerland. This article is an open access article distributed under the terms and conditions of the Creative Commons Attribution (CC BY) license (http://creativecommons.org/licenses/by/4.0/).
Share and Cite
MDPI and ACS Style
Khan, F.A. The Effect of Soaking on Segregation and Primary-Carbide Dissolution in Ingot-Cast Bearing Steel. Metals 2018, 8, 800. https://doi.org/10.3390/met8100800
AMA Style
Khan FA. The Effect of Soaking on Segregation and Primary-Carbide Dissolution in Ingot-Cast Bearing Steel. Metals. 2018; 8(10):800. https://doi.org/10.3390/met8100800
Chicago/Turabian StyleKhan, Fareed Ashraf. 2018. "The Effect of Soaking on Segregation and Primary-Carbide Dissolution in Ingot-Cast Bearing Steel" Metals 8, no. 10: 800. https://doi.org/10.3390/met8100800
Note that from the first issue of 2016, this journal uses article numbers instead of page numbers. See further details here.