Experimental and Numerical Investigations of a Novel Laser Impact Liquid Flexible Microforming Process


School of Mechanical Engineering, Jiangsu University, Zhenjiang 212013, China
*
Author to whom correspondence should be addressed.
Metals 2018, 8(8), 599; https://doi.org/10.3390/met8080599
Submission received: 26 June 2018
/
Revised: 23 July 2018
/
Accepted: 27 July 2018
/
Published: 31 July 2018
(This article belongs to the Special Issue Metal Micro-forming)
Abstract
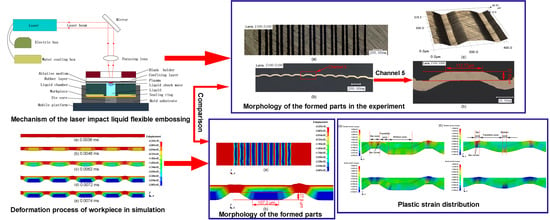
:A novel high strain rate microforming technique, laser impact liquid flexible embossing (LILFE), which uses laser induced shock waves as an energy source, and liquid as a force transmission medium, is proposed by this paper in order to emboss three-dimensional large area micro arrays on metallic foils and to overcome some of the defects of laser direct shock microembossing technology. The influences of laser energy and workpiece thickness on the deformation characteristics of the pure copper foils with the LILFE process were investigated through experiments and numerical simulation. A finite element model was built to further understand the typical stages of deformation, and the results of the numerical simulation are consistent with those achieved from the experiments. The experimental and simulation results show that the forming accuracy and depth of the embossed parts increases with the increase in laser energy and decrease in workpiece thickness. The thickness thinning rate of the embossed parts increases with the decrease of the workpiece thickness, and the severest thickness thinning occurs at the bar corner region. The experimental results also show that the LILFE process can protect the workpiece surface from being ablated and damaged, and can ensure the surface quality of the formed parts. Besides, the numerical simulation studies reveal the plastic strain distribution of embossed microfeatures under different laser energy.
1. Introduction
With the continuously increasing applications of the parts with microscale structures in many fields, including the chemical field [1], medical devices [2], microelectronics [3], and so on, the demand for developing the micro manufacture technologies has rapidly grown in the past few decades.
The current technologies that are used to machine the three-dimensional microstructures of the MEMS (Micro-Electro-Mechanical System) components, such as electrochemical micromachining (ECMM), show a good application prospect. ECMM provides new abilities for modern micromachining technologies because of its advantages, such as the capability of machining complicated three-dimensional structures, short machining time, and better processing precision [4]. However, some properties of the parts fabricated by ECMM should be improved by controlling and optimizing the various parameters of the ECMM process, including the surface quality and material removal. The lithography (LIGA) based technology is also one of the promising technologies to fabricate the microscale structure [5]. However, most lithography (LIGA) based technologies are mainly used to machine quasi three-dimensional shapes without irregular and complex curvilinear three-dimensional (3-D) structures or high aspect ratio micro components. The increasing complex structures of the micro parts in the MEMS field, and so forth, have posed a challenge to lithography (LIGA) based technologies. Meanwhile, these technologies are time consuming and expensive. Therefore, a new 3-D micromachining technique must be developed in order to produce micro parts with complex 3-D curved surfaces at high efficiency, high quality, and low cost.
Microembossing, developed from macro forming technology, shows promise for fabricating 3-D microscale structures on materials with low cost and less material loss. However, due to the decreasing size of the die and the formed parts, the macroembossing mechanism cannot be treated the same as the micro-formed part, and some of the process parameters and the like cannot be reduced proportionally to be used in the microembossing [6]. Meanwhile, when the conventional microembossing is applied for metals, this technology will have some limitations, such as the poor formability of metals, because of the size effect [7]; difficulty in the alignments of the micro-die and punch; life length of micro-die and punch, because of the friction and wear; and the difficulty of micro punch manufacture. As a result, high speed forming techniques such as explosive forming [8], electrohydraulic forming [9], and electromagnetic forming [10] have been developed to be used for embossing. In recent years, a novel micro high speed forming technique, laser shock microforming based on micro-die, for microembossing, has aroused widespread attention. Zhou et al. [11] proposed the laser micro forming process to emboss large area three-dimensional microstructures on aluminium foils by single laser pulse. The results showed that the replications cost is unrelated with the microfeatures intricacy, and this technology is a low-cost, high-efficiency microforming process with wide industrial application prospect. Gao and Cheng [12] verified successfully the feasibility of microscale laser dynamic forming (μLDF) in machining three-dimensional microstructures of a high aspect ratio on polycrystalline aluminium thin films with different micro-moulds, through a series of experiments. Gao et al. [13] conducted a range of numerical simulations to research the influences of the fillet ratio, aspect ratio of the mould cavity, and laser processing parameters on the deformation characteristic of copper thin foils during the μLDF process. Li et al. [14] researched forming limits and the fracture behaviour of aluminium foils during the μLDF process through experiments and numerical simulation. They revealed that the formability of aluminium foils is much higher in μLDF than that in other forming processes through forming limit diagrams because of the ultrahigh strain rate of the μLDF process. Ye and Cheng [15] fabricated patterned microstructures on the NiTi (nickel-titanium) shape memory alloy surface using mask material with various sizes through laser shock assisted direct imprinting. They thought that this process had a good application potential to machine complex microstructures on functional materials and instruments. Ehrhardt et al. [16,17] investigated the micron and submicron embossing of the metal substrates by the laser embossing process. The micro- and submicro-meter structures can be embossed into the surfaces of solid copper foils using a laser microembossing process based on laser scanning. They also investigated the effects of laser fluence and laser pulse number on the heights of the replicated structures. Liu et al. [18] successfully fabricated circularity microchannels on a metallic foil surface using laser shock embossing technology. They studied the laser shock embossing process through simulation and experiments. They demonstrated that complex 3-D microstructures can be fabricated directly by this technique with only single pulse, and that the shape of the embossed microchannel can be properly achieved in the numerical simulation with the verified finite element model. Shen et al. [19] revealed that micro rectangular array features can be formed on the metal foil surface through overlapping the laser shock embossing, which showed the feasibility of replicating a large area of 3-D array features on metal foils using overlapping laser shock embossing. There are a lot of advantages of laser microembossing (LME) compared to the conventional microembossing technologies. Firstly, it can be widely used for various materials, is not limited to superplastic materials and amorphous [12]. Secondly, the formability of the LME technology with the ultrahigh strain rate, around 106–107 s–1 [13], is much better than the conventional microembossing process with a low strain rate. The necking or even failure of the workpiece can be delayed because of the inertia effects during the high strain rate forming process [20]. Thirdly, LMF can reduce the experimental cost, because it only requires one side of the rigid tool to form the foils. Of course, this process can also solve the problem of punch-die alignment, because the diameter and position of the laser spot can be controlled and adjusted easily by a laser system and three-dimensional working platform. Finally, the laser energy is more precisely controllable and more localized, so the LMF can easily realize 3-D forming for parts with complex shapes at the meso-, micro-, and nano-scales.
However, the present LME technique still has several problems. Firstly, if the laser radiates directly on the workpiece surface with high energy, the surface of the workpiece would be melted or ablated, thereby destroying the surface quality of the workpiece and causing defects in the microsystems. However, if the ablative medium is applied on the workpiece surface to improve the absorption rate of the laser and to protect the workpiece surface from being damaged, the remaining ablative medium may adhere to the surface of the workpiece and is difficult to remove, which will not only need the cleaning process, extra cost, and extra working time, but will also have an adverse influence on the use of the workpiece. Secondly, the laser induced shock wave directly acting on the workpiece may easily lead to an uneven load on the samples, and the local stress concentration will cause the fracture and failure of the workpiece. In order to solve these problems, it is necessary to introduce the force transmission medium during the LME process, which not only inherits the advantages of the LME technique, but also protects the workpiece surface from being damaged, and makes the workpiece bear pressure evenly so as to improve the quality of the embossed workpiece.
Liquid impact forming technology is an advanced manufacturing technology with a high strain rate, which uses a liquid shock wave induced from different energy sources to achieve an elastic-plastic forming of parts. The methods of using liquid as the force transmission medium to achieve the high-speed impact forming are mainly divided into explosive forming, electrohydraulic forming, and liquid impact forming with a high-speed punch. These energy sources are mainly achieved from the chemical energy of the explosive, the electrical energy of the electric capacity, and the kinetic energy of a high-speed punch or hammer. Regarding the explosive forming, Samardzic et al. [21,22] investigated the application of high-speed liquid projectiles that were accelerated by the powder explosion in a launcher (a water cannon) for parts forming. They constructed an experimental setup for water projectiles generation and a series of experiments, involving the forming of grooves; stamping; extrusion; and punching of the macro-, meso-, and micro-scale, on the metal surfaces were performed. The results showed that the application of the liquid impact for the metal forming is feasible and effective, and that the shapes of the formed parts have agreement with the geometry of the dies. Meanwhile, they found that the liquid impact has no adverse influence on the surface quality of the formed parts, or that it can even can improve the topography of them. However, using powder explosion is not better for control, and is dangerous in contrast to using a high-speed punch or electrical energy as an energy source. Regarding electrohydraulic forming, Golovashchenko et al. [9] carried out the formability testing of dual phase steels during the electrohydraulic forming (EHF) process, and put forward an explanation of the formability improvement according to an analysis of the experimental results, as well as numerical modeling involving an analysis of all stages of the process. Woo et al. [23] compared the formability of electrohydroforming and electromagnetic forming through experimental research and numerical simulation. This comparison showed that electrohydraulic forming can overcome the bouncing effect and deform sheets into complex shapes, compared to electromagnetic forming. Regarding liquid impact forming with a high-speed punch, Skews et al. [24] investigated the forming of circular disks and cylindrical tubes through the liquid shock wave pressure generated in a vertical water shock tube, including free-forming, metal forming with dies, and detail imprinting. Meanwhile, the impact of the liquid shock wave that was generated by the piston during the high velocity deformation process was researched using a high-speed video camera. They concluded that this process has the prospect to be developed as the manufacture process, because of its safety and repeatability. Marai et al. [25] combined the experiments and finite element simulation to investigate the innovative hybrid impact hydroforming (IHF) technology that introduces the liquid impact forming technology into the traditional hydroforming to improve some disadvantages of the traditional hydroforming. This process is beneficial for forming complex parts with small features, and the possibility of fracture is reduced mainly because of the inertia factor. Wang et al. [26] showed the theory of liquid shock wave and performed some experiments regarding punching on metal sheets, using IHF technology. They demonstrated that using liquid as a punch has some advantages, including improving the forming quality of complicated products, avoiding the precise of the die, and solving the difficulty of punch-die alignment. Through studying the three types of liquid impact forming technologies, using liquid as the force transmission medium has several advantages. (1) Using liquid as the force transmission medium can improve the forming accuracy of the workpiece shape and dimension. Moreover, it can make the workpiece reduce the bouncing off the die. This is because water acts as a medium to propagate the forming pressure, which can make the workpiece bear pressure relatively evenly and retain the forming pressure during the deformation process. Meanwhile, the fluidity of liquid is good, which makes the material better flow into the cavity of the die. (2) The liquid acting on the workpiece can avoid the damage of explosive powder or a punch on the surface of the workpiece, and protect or even improve the quality of the formed workpiece surface.
In this paper, a novel micro high-speed forming technique, laser impact liquid flexible embossing (LILFE), is proposed combined with the advantages of laser microembossing (LME) and liquid impact forming technology. This process is used to overcome some of the defects of laser direct shock microembossing technology, and can emboss metallic foils into 3-D large area micro arrays under the high speed condition. In this process, the laser induced shock wave is used as the energy source, and the liquid is used as the force transmission medium that is placed into the liquid chamber. The LILFE uses the liquid shock wave to form the metal foil rather than the direct impact of the laser, thus protecting the metal foil surface from being ablated and damaged. Also, LILFE employs liquid as the force transmission medium to propagate the forming pressure, which retains the forming pressure during the forming process and makes the workpiece bear load relatively evenly compared to the laser induced shock wave directly acting on the workpiece.
The aim of this paper is to show that the fabrication of microscale structures on metallic foils is feasible with the LILFE process, and can overcome some defects of the laser direct shock microembossing technology. There are the mechanism analysis, experimental research, and numerical simulation in this study. The influences of the laser pulse energy and the workpiece thickness on the forming characteristics of the pure copper foils with the LILFE process were researched through the experiments and the numerical simulation. The experiments were performed with a concave micro-die of array features on copper foils. Then, the morphology of the processed samples was observed, and the forming accuracy, depth, surface quality, and thickness variation of the formed parts were measured to evaluate the quality of the formed parts. In addition, the numerical simulations were conducted to further understand the deformation process of the workpiece. Meanwhile, the results of the numerical simulations were compared with those of the experiments. Numerical simulation studies also revealed the axial and radial plastic strain distribution of the embossed parts.
2. Experiments
2.1. Principal of Laser Impact Liquid Flexible Embossing Process
Figure 1 shows the schematic of the LILFE process. It includes a Spitlight 2000 Nd:YAG laser, optical system, experiment mobile platform, workpiece assembly, electric box, and water cooling system. It can be seen in Figure 1 that the workpiece assembly from the top to the bottom consists of the blank holder, a confining layer, ablative medium, polyurethane rubber layer, liquid chamber, liquid, sealing ring, workpiece, micro-die core, and mould substrate. Firstly, when a high-energy focused and pulsed laser beam penetrates through the transparent confining layer and irradiates on the ablative medium, the laser energy is absorbed by the ablative medium and then instantaneously vaporizes into high-temperature and high-pressure plasma. After further absorption of the laser energy, the plasma rapidly expands a strong shock wave in the limited space between the rubber layer and the confining layer under the restraint of the confining layer and the blank holder. The high-tenacity rubber layer rapidly produces a large deformation and occupies the volume of the liquid in the liquid chamber. Then, with the rubber layer impacting on the water surface at an ultrahigh strain rate, high pressure in the form of a water shock wave is generated because the water is hard to be compressed. The high water shock wave pressure propagates downward through the water in the liquid chamber and introduces impact energy onto the workpiece. As the distance increases, the liquid shock wave pressure gradually attenuates and the duration of the action on the workpiece increases. Finally, under the shock wave pressure and the restraint of the fixed micro-die, the workpiece generates a plastic deformation to reproduce the cavity shape of the micro-die at a high strain rate, as a result of the liquid shock wave pressure greatly exceeding the plastic deformation resistance.
2.2. Experiment Instruments and Preparation
2.2.1. Laser Processing Conditions
A Spitlight 2000 Nd:YAG Laser that was manufactured by the German InnoLas Company (Munich, Germany) was applied in the experiments, and its maximum pulse energy is 1900 mJ/pulse. The energy distribution of the laser is the Gaussian distribution. The laser wavelength is 1064 nm, and the laser pulse width is about 8 ns. To ensure the forming accuracy of the micro-parts in the laser impact liquid flexible embossing process, the laser spot diameter was adjusted to 3 mm, which is large enough to cover the liquid chamber with the diameter of 2.6 mm. The beam diameter could be adjusted by the height of the focusing lens and micro-die. It was measured by photosensitive paper, which can record the size of the beam spot in the experiments. In the experiments, the laser pulse energy can be adjusted by the laser control system.
2.2.2. Materials and Micro-Die
In the experiments, the pure copper foils were selected as the specimen because of their relatively good properties and wide application in micro-parts. Pure copper foils with the thicknesses of 30 μm and 20 μm were cut into squares of 10 mm × 10 mm, in order to prepare for the experiments. Polyurethane rubber layers with the thicknesses of 200 μm, coated with the ablative medium (black paint) were also cut into square pieces of 10 mm × 10 mm. Both of the specimen and polyurethane rubber layers should be cleaned on the surface by anhydrous alcohol before the experiments. The transparent confining layer of the organic glass (PMMA) with a side length of 45 mm and thickness of 3 mm was applied to keep the plasma from moving upward. The blank holder with about 12 N was used to press on the confining layer to restrain the expansion of the plasma. The liquid chamber with a height of 13 mm and a diameter of 2.6 mm was used to hold the liquid (water) and propagate the water shock wave pressure. Table 1 gives the detailed experimental parameters of the LILFE.
The 100# copper grating micro-die was used to investigate the deformation characteristics of LILFE. The two-dimensional (2-D) morphology of the 100# copper grating micro-die observed by the KEYENCE VHX-1000C digital microscope, is shown in Figure 2a. Figure 2 also shows the two-dimensional image, sectional view, and the main geometric dimensions of the single cavity of the micro-die.
2.2.3. Characterization Methods
After the experiments, the KEYENCE VHX-1000C digital microscope (KEYENCE Corporation, Osaka, Japan) was used to observe the two-dimensional, three-dimensional, and cross-section morphology, as well as for measuring the accuracy, depth, and thickness distribution of the formed features. The cross-section morphology was observed and the related parameters were measured along the cross section, after the formed parts were mounted by a low viscosity epoxy, then ground by 80# to 3000# sandpapers, and polished by a polishing machine. To investigate the surface morphology and surface quality of the formed parts, the roughness of the workpiece was measured by a high resolution true colour confocal microscope (Axio CSM 700, Carl Zeiss, Oberkochen, Germany).
3. Modelling and Finite Element Simulation
In this study, a numerical simulation was performed to examine the results of the LILFE experiments in detail. The numerical modeling, meshing, sets of material parameters and laser shock wave pressure, and so on, were conducted in the Hypermesh software (17.0, Altair Engineering Inc., Troy, MI, USA), while the post-processing analysis of the forming characteristics of the pure copper foils with the LILFE process could be realized in software LS-DYNA (15.0, ANSYS Inc., Canonsburg, PA, USA). The numerical model of LILFE is composed of the rubber layer, a liquid chamber, liquid, a metal foil, and a forming micro-die. The micro-die is positioned below the workpiece, and the workpiece is placed between the micro-die and the liquid chamber, as shown in Figure 3. The laser induced shock wave exerts on the surface of the high-tenacity polyurethane rubber layer. Then, with the rubber layer impacting on the water surface at an ultrahigh strain rate, high pressure in the form of a water shock wave is generated. The high water shock wave pressure propagates downward through the water in the liquid chamber and introduces an impact energy onto the workpiece. In this study, in order to ensure accuracy and completeness, a full model needed to be employed to perform the numerical simulation.
3.1. Loading
In order to simulate the LILFE successfully, the spatial and temporal distribution of the shock wave pressure induced by the laser beam should be obtained. Fabbro et al. [27] built a mathematical model to demonstrate the relation between the peak pressure of the laser shock wave in the confined mode and the laser pulse intensity, which can be defined by Equation (1), as follows:
where is the peak pressure of the shock wave induced by the laser, is the efficiency of the interaction ( = 0.1 in this study [28]), where contributes to the pressure increase, and is devoted to the generation and ionization of the plasma, and is the absorbed laser energy. is the incident laser power density and is the shock impedance, which can be calculated by Equation (2), as follows:
where is the confining layer (PMMA) impedance, is the polyurethane rubber impedance, and = 0.32 × 10⁶ g/(cm2·s), = 0.47 × 10⁶ g/(cm2·s) [29]. Because the distribution of the laser beam generated by the Spitlight 2000 Nd:YAG laser in the experiments is the Gaussian distribution, the incident laser power density can be calculated by Equation (3) [30], as follows:
where is the single pulse energy of the incident laser beam, is the laser spot diameter, and is the laser pulse width (8 ns). It is remarkable that the maximum laser power density is calculated as 3.18 GW/cm2 by this formula, through the maximum laser energy used in this study of 1800 mJ. Thus, the maximum laser power density in this study is below the laser breakdown in the air. According to Peyre and Fabbro [31], the loading time of the laser induced shock wave pressure in the confined mode lasted two to three times longer than the laser pulse width () when the glass was used as the confining medium. Wang et al. [32] revealed that the loading time is taken as three times of the laser pulse duration, because of the use of the constraint mode. Thus, in this paper, the loading time of the shock wave pressure is adopted as 24 ns, which is three times of the laser pulse width () of 8 ns (which is the full width at half-maximum peak pressure). Therefore, the curve of laser induced shock wave pressure changing with the time in the simulation is plotted in Figure 4. However, as the diameter of the laser spot is 3 mm and the distribution of laser beam is Gaussian distribution in this study, it is necessary to take the spatial distribution of the shock wave pressure into consideration during the numerical simulation of the LILFE, in order to reach an agreement with the actual experiment condition. Zhang et al. [33] built the modification model that the laser induced shock wave pressure changes in the radial direction of the laser beam spot, which is based on the mathematical model built by Fabbro et al. The modification model built by Zhang et al. can be expressed by Equation (4), as follows:
where is the radial distance from the centre of the laser beam, is the radius of laser beam, and is the shock wave pressure distribution changing with the time. The spatial distribution of the laser shock wave pressure is shown in Figure 5. Therefore, the spatial and temporal distribution of the laser induced shock wave pressure can be achieved by combining Figure 4 and Figure 5. In the simulation, the loading region is discretized along the radial direction of the laser spot into a plurality of equidistant annular regions, shown in Figure 5, and then a time-varying and Gaussian-distributed load based on Equation (4) is applied to each region. Therefore, the laser induced shock wave pressure can change in the radial direction of the laser beam spot, and the pressure gradually decreases from the centre region to the edge region of the laser beam spot. Meanwhile, the pressure of the same divided region is uniformly loaded at each particular moment. In general, the smaller the division of the loading region, the closer it is to the actual loading condition. When the distance of the radial direction of the divided region tends to zero, the pressure distribution of the entire laser beam spot region is uniform Gaussian distribution. In the simulation of this paper, the loading area with a radius of 1.5 mm is divided into 25 annular regions to calculate the uniform load in each region, according to Equation (4), after comprehensively considering the time, efficiency, and accuracy of the solution.
3.2. Constitutive Model of the Structural Components
Structural components are composed of the liquid chamber, micro-die, rubber layer, and metal foil. The liquid chamber and micro-die are defined as rigid bodies—material model *MAT_RIGID (Material 20 in Hypermesh notation)—and they are discretized by eight-node solid hexahedron elements (SOLID 164 solid element) with the Lagrangian formulation of Hughes–Liu (elform = 1 in Hypermesh notation). The definitions of other components are as follows.
3.2.1. Metal Foil Materials Constitutive Model
Four-node shell elements (SHELL 163 shell element) are employed to define the copper foil, and the element formulation is Belytschko–Tsay (elform = 2 in Hypermesh notation), which is usually applied in a structure analysis.
The type of contact between the workpiece and the die in the numerical simulation is the keyword *CONTACT_AUTOMATIC_SURFACE_TO_SURFACE. This is a recommended contact type for the numerical models, which bears a large impact at a high strain rate. This type of contact can prevent the penetration of 2-D shell elements and external faces of 2-D continuum elements by penalty forces. Meanwhile, the parts of the slave part set can be checked whether they contact with parts of the master part set, and self contact can be checked for any part in both of the sets. The type of contact between the workpiece and the liquid chamber in the numerical simulation is also the keyword *CONTACT_AUTOMATIC_SURFACE_TO_SURFACE.
In order to achieve precise and valid results during the forming processes at a high strain rate, the constitutive model of copper foil material must be chosen properly. In the LILFE process, the copper foils are impacted by the water shock wave pressure at a high strain rate. When the metal foil is formed under the dynamic loading during the LILFE process, the inertia effect and the stress wave propagation are of great importance, because the properties of the material generate extreme change according to the grade of the strain rate and temperature [34]. The multi-axial stress state of the metal is generally defined according to the Von Mises stress, the plastic strain , plastic strain rate and temperature are applied to express this stress in many constitutive models, as follows:
Johnson and Cook [35] developed the constitutive formulation of Johnson–Cook model that is applicable for the deformation of most metals at a high strain rate. Thus, this numerical simulation chooses the Johnson–Cook model to express the flow stress of the material in terms of strain, strain rate, strain hardening, and temperature. On the basis of the Johnson–Cook model, the Von Mises flow stress can be defined by Equation (6), as follows:
where , , , , and are the material constants measured at or below the transition temperature; is the initial yield stress at (Pa), is the strain hardening coefficient (Pa), is the strain rate-hardening coefficient, is the strain hardening exponent, is the thermal softening exponent. is the equivalent plastic strain, is the equivalent plastic strain rate, is the reference strain rate under quasi-static loading, is the present temperature of the workpiece, and and are the room and melting temperatures, respectively. The related constitutive model parameters of copper are given in Table 2 [35,36]. In this study, the liquid is used to protect the metal foils from being influenced by the thermal field, so this deformation process can be regarded as the adiabatic process, where the deformation of the workpiece is entirely attributed to the liquid shock wave pressure induced by the laser energy function without any thermodynamics effect. The thermal effect need not be taken into account in this study. Therefore, the constitutive model can be simplified as Equation (7), as follows:
3.2.2. Hyperelastic Material Constitutive Model for Polyurethane Rubber Material
During the LILFE process, the high-tenacity polyurethane rubber layer is used to act on the liquid surface at an ultrahigh strain rate, thus generating a high water shock wave pressure. Eight-node solid hexahedron elements (SOLID 164 solid element) are employed to define the rubber layer, and the element formulation is the Hughes–Liu (elform = 1 in Hypermesh notation).
The type of contact between the rubber layer and the liquid chamber in the numerical simulation is the keyword *CONTACT_AUTOMATIC_SURFACE_TO_SURFACE.
The polyurethane rubber can generate large deformation under the strong shock wave pressure in the LILFE and it has nonlinear stress-strain characteristics under this condition, thus the polyurethane rubber material is defined as the Hyperelastic theory (Mooney–Rivlin model) [37], as follows:
where is the strain energy per unit of reference volume, , , and are the strain invariants, and is the bulk modulus. The polyurethane rubber is incompressible, thus setting = 1. is the hyperelastic constant, which determines the material response. Two Mooney–Rivlin parameters of and are usually used for describing the deformation behaviour of the hyperelastic rubber material. Table 3 gives the mechanical property parameters of the polyurethane rubber material.
3.3. Models for Fluid Components
In this study, the fluid components are composed of the water and void, as shown in Figure 6. When the liquid component is built, it is necessary to build a void component in the fluid components, which can allow the liquid elements to flow inside the liquid chamber and interact with the workpiece to flow into the cavity of the micro-die. In the calculation, the constitutive properties of the fluid material employed as the void must be the same as those of the material filling the voided elements. The *INTIAL_VOID card in the Hypermesh is used to define the initial voided part set ID or part numbers, and the void component it defines will not affect other components.
During the LILFE process, the fluid in the liquid chamber undergoes too large deformation, thus, the pure Lagrangian algorithm or Eulerian algorithm cannot solve this problem well. For this reason, the arbitrary Lagrangian–Eulerian (ALE) formulation, that the motion of mesh is independent of the material motion being analysed, is selected for the treatment of the fluid. The ALE method combines the advantages of the Lagrangian and Eulerian methods, which allows the mesh of the fluid domain to move in an arbitrary way, although the mesh velocity must still satisfy the boundary conditions. The ALE method requires an automatic and continuous re-zoning of the mesh and usually this is done in such a way that the mesh displacement is dependent on the displacement of the moving body [38,39]. It can improve the accuracy of the simulation under large deformation conditions, and can make the free surface of the material flow automatically without mesh distortion errors. The mesh motion can be chosen arbitrarily, providing additional flexibility and accuracy. The philosophy of the arbitrary Lagrangian–Eulerian methodology is to exploit this degree of freedom so as to improve the robustness, accuracy, and efficiency of the simulation [40]. Therefore, the simulation of this paper adopts the ALE method. The fluid filled in the liquid chamber is discretized through eight-node solid hexahedron elements (SOLID 164 solid element) with an ALE formulation of the plane stress (elform = 12 in Hypermesh notation).
The response of the structures to the impact loading is of concern in the simulation of the LILFE [41]. In the process, understanding the interaction between the fluid flow and the structural deformation is a technical challenge of vital importance. This interaction significantly affects the results and accuracy of the simulation [42]. Thus, it is pivotal to correctly define the fluid–structure interaction (FSI), including workpiece/fluid, liquid chamber/fluid, and rubber layer/fluid, for building the finite element model of the LILFE process. If the FSI is not applied correctly, the penetration of the fluid material may generate in the structure mesh, and the results will be not accurate and valid. The research of the FSI contains the various behaviors of the solids under the action of the flow field and the influence of the solid deformation or motion on the flow field. An important feature of the FSI is the interaction between the two-phase media, namely the structure deformation or motion under the action of the fluid dynamic loads, and the deformation or motion of the structure in turn affects the flow field, thereby changing the distribution of the fluid loads and size. In general, the fluid–structure interaction problem can be divided into two categories according to the interaction mechanism: one type of characteristic is that the fluid-structure interaction only occurs at the interface of flow and structure, and the interaction on the equation is the balance of the two-phase interaction surface. The other characteristic is that the flow and solid phases are partially or completely overlapped, and the interaction utility is realized by the differential equation describing the problem. The type of interaction involved in this paper is the former one. Therefore, in this study, the *CONSTRAINED_LAGRANGE_IN_SOLID keyword was applied to define the fluid–structure interaction. This command can provide a coupling mechanism for defining the FSI. For this command, the structure can be built from the Lagrangian formulation, and the multi-material fluid is modeled by the ALE formulation. This command can allow the fluid material to flow around the structure, however, the penalty coupling force stops the leakage of the fluid material across the Lagrangian surface. Once a fluid node penetrates the Lagrangian surface, a force of recall is applied to both the fluid and structural node to make the fluid node withdraw to the Lagrangian surface. The penalty coupling force behaves like a spring system and it can avoid the penetration for the fluid material.
The liquid (water) was modeled using the material constitutive model *MAT NULL (Material Type 9 in the Hypermesh notation), which is usually applied to describe the material with a fluid-like behaviour (such as air and water). The null material has no shear stiffness or yield strength and behaves in a fluid-like mode. It can be applied to describe the (deviatoric) viscous of the form, as follows:
where is the Cauchy stress tensor, is the deviatoric strain rate, and is the dynamic viscosity. Moreover, the null material must be applied with an equation-of-state (EOS) in order to describe the relation of the pressure and volume deformation of the material. The equation-of-state of *EOS_GRUNEISEN [43], which is based on a cubic shock velocity ()—particle velocity () is commonly used to represent the water, and it defines the pressure for compressed materials, as follows:
and for expanded the materials, as follows:
where , , and are the coefficients of the slope of the – curve; is the intercept of the – curve, which agrees with the speed of sound on water; is the Gruneisen gamma; is the first order volume correction to ; , in which and are the current and initial densities of the material respectively; is the initial internal energy. The water properties and parameters for the equation-of-state of the Gruneisen are obtained from the investigations of Boyd et al. [44] and Shah [45], and they are given in detail in Table 4.
4. Results and Discussions
4.1. The Typical Morphology of the Formed Parts
The two-dimensional, three-dimensional, and cross-section images of the replicated structures of 30 μm thick pure copper foils after the LILFE process were examined by a KEYENCE VHX-1000C digital microscope. The die of the 100# copper grating arrays with ten channels was used to investigate the capability of this process fabricating the microscale structures.
Figure 7 and Figure 8 show the two-dimensional, three-dimensional, and cross-section images of the micro-features of the formed samples with the thickness of 30 μm, after the LILFE at the experimental condition where the laser energy was 1800 mJ and the number of the pulse was one. In Figure 7, the two-dimensional and cross-section images of the workpiece indicate that the die of the 100# copper grating arrays with ten channels was embossed into the metal foils surface. It can be seen that the ten array channels can be obtained by this process. The three-dimensional morphology and cross-section morphology of the one microchannel (channel 5) at the middle position of the workpiece are clearly shown in Figure 8. The deformation depth is about 27.63 μm. The two-dimensional, three-dimensional, and cross-section morphology of the formed parts show that the amount and shape of the formed features generally have an agreement with the micro-die. Meanwhile, the dimension and shape of each feature of the same workpiece essentially keep consistent with each other. Each feature can be formed evenly and smoothly without any fracture or failure, because this process uses liquid as the force transmission medium. The fluidity of liquid is fine, which makes the material better flow into the cavity of the die. Meanwhile, the liquid acting as a medium to propagate the forming pressure makes the workpiece bear pressure evenly, so the shape of each formed feature is smooth and symmetrical.
4.2. Finite Element Model Verification
The deformation process of the workpiece with the thickness of 30 μm under the laser energy of 1800 mJ can be achieved in the numerical simulation, as shown in Figure 9. From 0.0036 ms to 0.0048 ms, the liquid shock wave pressure has propagated to the surface of the workpiece in the liquid chamber, and the workpiece begins to occur a bending deformation. At 0.0062 ms, the workpiece achieves further deformation due to the high water shock wave pressure continuing to transfer downward, however, it still does not reach the bottom of the die. During the time from 0.0062 ms to 0.0074 ms, the workpiece generates a greater deformation, then it collides with the bottom of the cavity and the material is forced to flow transversely toward the bottom corner of the cavity under the water shock wave pressure and the restriction of the fixed micro-die.
Figure 8b and Figure 10 present the cross-section morphology and cross-section curve of one microchannel (channel 5) located in the middle region of the specimen under the laser pulse energy of 1800 mJ in the experiment. It is obvious that the width of the flat bottom region of the microchannel is about 112.77 μm and the depth reaches approximately 27.63 μm. Figure 10 and Figure 11 show the surface morphology of the workpiece with the thickness of 30 μm, as well as the cross-section morphology and cross-section curve of one microchannel (channel 5) under the laser energy of 1800 mJ and at the time when the forming process has finished in the numerical simulation. It can be found that the deformation depth of the channel is 27.9 μm, 0.98% larger than the experimental value, and the width of the flat bottom region is 107.2 μm, 4.9% smaller than the experimental value. The error between the experiment and numerical simulation is in the acceptance range in the practical application of engineering. In general, the result of the numerical simulation is approximately consistent with that achieved from the experiments. Thus, the finite element model built in this study is useful and valid.
4.3. Forming Accuracy
4.3.1. Effect of the Foil Thickness on the Forming Accuracy
The forming accuracy of the workpiece is of great importance to evaluate the forming quality, and it can measure whether the workpiece can achieve the reproduction of the rigid micro-die during the forming process. To study the effect of the foil thickness on the forming accuracy, the copper foils with the thickness of 20 μm and 30 μm were formed using the grating meshes micro-die of 100#. It can be seen from Figure 12 and Figure 13 the 3-D morphologies and cross-section morphologies of the microchannel (channel 5) of the formed parts under different laser energy parameters of 565 mJ, 1200 mJ, and 1800 mJ are analysed. The section curve comparison of the formed parts with the thickness of 20 μm and 30 μm under each laser energy is shown in Figure 14. The width of the flat bottom region of the formed microchannels under different laser energy is depicted in Figure 15. From Figure 12, Figure 13, Figure 14 and Figure 15, it can be seen that the forming accuracy of the formed parts in a thickness of 20 μm is much better than that of the formed parts in thickness of 30 μm under the same laser energy. When the workpiece in the thickness of 30 μm is formed by the laser energy of 565 mJ, it is deformed into the cavity with a smooth dome shape from a cross-sectional perspective. This is because the water wave pressure is too low to make the workpiece flow into the bottom of the micro-die cavity. When the workpiece in thickness of 30 μm is formed by the laser energy of 1200 mJ and 1800 mJ respectively, they can be deformed with the flat bottom region that is owing to the collision with the cavity bottom. However, the forming depth of the workpiece in thickness of 30 μm formed by the laser energy of 1200 mJ and 1800 mJ is less than the depth of micro-die with 29.07 μm, which can be explained by the workpiece that may generate a spring back during the forming process. The spring back behaviour will be introduced in detail in Section 4.4. In addition, the surface layer model [46] can be used to explain the phenomenon that the forming accuracy of the workpiece in the thickness of 20 μm is much better than that of the workpiece in the thickness of 30 μm under the same laser energy for the polycrystalline material. It is defined as the overall material flow stress that is jointly determined by the flow stress in the internal grains and surface layer grains of the workpiece. It can be defined as Equation (13), as follows:
where the is the overall material flow stress, and are the volume fraction and flow stress of the internal grains respectively, and and are the volume fraction and flow stress of the surface layer grains, respectively. This model demonstrates that the volume fraction of the surface layer grains increases with the thickness of the workpiece decreasing. The surface layer grains are constrained less and the flow stress of the surface layer grains is smaller than that of the internal grains, so the surface layer grains are easier to generate the rotation of grains and slip deformation of the grain boundaries. Therefore, the flow stress of the thinner foils is smaller, and the thinner foils can flow into the micro-die cavity more easily under the same laser energy. Copper foils with the thickness of 30 μm would require much higher laser intensities to achieve a more accurate reproduction of the die cavity.
The numerical simulation results regarding the width of the flat bottom region of the formed channel (channel 5) with different thicknesses are illustrated in Figure 15. It can be seen from Figure 15 that the trend of the width of the flat bottom region changing with the workpiece thickness in the numerical simulation is in good accordance with the experimental results.
From Figure 12 and Figure 13, it is interesting to observe that the strip structures were embossed on the bottom surface of the formed workpiece, which is face-to-face with the micro-die. This may be attributed to the following reason: the surface quality of the micro-die bottom is not great and some machining marks exist. The workpiece replicates the machining marks during the forming process, which causes the workpiece bottom surface that is face-to-face with the micro-die to not be smooth. This phenomenon will be studied in Section 4.5 in detail.
4.3.2. Effect of the Laser Energy on the Forming Accuracy
Pure copper foils with the thickness of 20 μm were formed using the grating meshes micro-die of 100# under different laser energy. The magnified 3-D morphology and cross-section morphology of the microchannel (channel 5) located in the middle region of the formed parts under different laser energy parameters of 565 mJ, 1200 mJ, and 1800 mJ are shown in Figure 12. It can be seen in Figure 12 that with the increase of the laser energy, the metal foil generates more deformation and the shapes of the replicated feature and the die are in better agreement. For further study clearly, the sectional curves of the replicated features under different laser energy were investigated to research the forming fitability and accuracy in Figure 16. Meanwhile, the width of the flat bottom region of the formed parts under different laser energy was measured to further estimate the forming accuracy, as shown in Figure 15. It is obvious that the width of the flat bottom region increases with the laser energy increasing from 565 mJ to 1800 mJ. By comparing the replicated structures of the samples under different laser energy with the shape of the micro-die, it shows obviously that the forming accuracy of the replicated feature under the laser energy of 1800 mJ is much better than that of the formed parts under the laser energy of 565 mJ and 1200 mJ. This phenomenon can be explained as follows, that with the increase of the laser energy, more plasma induced by a laser pulse would be generated. Then, the pressure induced by the water shock wave also gradually increases, and the higher pressure can transmit more momentum to the workpiece and increase its initial velocity. The higher momentum can make the workpiece collide the bottom of the cavity more severely, and more material can be forced to flow transversely toward the corner of the cavity under the higher water shock wave pressure and the restraint of the fixed micro-die. Thus, the higher laser energy can increase the flat bottom region of the formed parts, which makes the workpiece replicate the micro-die cavity shape better. Furthermore, it can be seen from Figure 15 that the trend of the width of the flat bottom region of the formed parts changing with the laser energy in the numerical simulation is in good agreement with the experimental results.
However, some adverse phenomena exist in the experiments when the laser energy increases to a certain extent. Firstly, the micro-die may be damaged by the strong pressure, and it may influence the forming quality and precision of the sample. Secondly, it is possible for the micro-die to be stuck on the sample, and it is hard to take out from the sample. If the workpiece and the micro-die are forced to separate, they will both suffer destruction, which affects not only the quality of the workpiece, but also the repetitive utilization of the micro-die. Therefore, the laser energy should be neither too low nor too high for the good reproduction of the samples.
4.3.3. Effect of the Impact Location on the Forming Accuracy
The replicated structures of the samples with the thickness of 30 μm were embossed by the micro-die of the copper grating arrays under the laser energy of 1800 mJ, in order to study whether the forming accuracy of each feature located in the different regions of the workpiece can keep consistence. Figure 17 indicates the cross-section morphologies of the whole ten array channels. As ten array microchannels can be embossed using the liquid as the soft punch during the LILFE process, in order to understand whether the water shock pressure induced by the laser with the Gaussian distribution makes the middle region of the workpiece bear more pressure and then generate more deformation, it is necessary to understand the forming accuracy of each channel on one workpiece.
To compare the forming accuracy of each channel more intuitively, the width of the flat bottom region of each channel in the same section under the laser energy of 1800 mJ is described clearly in Figure 18. It can be seen from Figure 18 that there are a few changes in the forming accuracy. It can be found that the width of the channels located at the edge region is relatively shorter than that of the channels located at the middle region, thus, the forming accuracy of the channels located at the edge region is lower than that of the channels located at the middle region. However, the difference between the forming accuracy of the channels at the edge region and at the middle region is not very large. This phenomenon can be explained by the following, that the laser with the Gaussian distribution causes the water shock wave pressure to increase from the edge region to the center region gradually, which makes different regions of the workpiece subject to different forces, and then generate different deformation. Meanwhile, using the water as the force transmission medium can weaken the Gaussian distribution to a certain extent, and make the distribution of the pressure on the entire workpiece relatively uniform. This phenomenon was further explained by the numerical simulation. As shown in Figure 17, the cross-section image of the workpiece under the laser energy of 1800 mJ in the numerical simulation is depicted. It is clear that the width of the flat bottom region of the channels located at the edge region is relatively shorter than that of the channels located at the middle region. To compare the results of the experiment and simulation, and to illustrate this phenomenon more intuitively, the width of the flat bottom region of each channel in the experiments and the numerical simulation is shown in Figure 18. It can be seen that the trend of the results in the simulation has a good agreement with that in the experiments. The deviation is mainly attributed to the difference between the actual laser induced shock wave pressure and the ideal pressure calculated by the constructed model in the simulation.
4.4. Deformation Depth
The copper foils with the thickness of 20 μm and 30 μm were deformed under different laser energy parameters of 565 mJ and 1800 mJ, respectively, so as to study the effects of laser pulse energy and the workpiece thickness on the forming depth of the replicated features, and to compare them with the results of the numerical simulation. To reveal the influence of the specimen thickness and the laser energy on the deformation depth of the formed parts, the cross section of the microchannel (channel 5) at the middle location of the specimen (shown in Figure 7) was measured through the KEYENCE VHX-1000C digital microscope. The forming depth of the microchannel (channel 5) of the formed parts was measured, as shown in Figure 19. Meanwhile, the cross-section curves of the microchannels with different thicknesses and under different laser energy in the experiments are obviously presented in Figure 20. It is clear that the forming depth of the microchannel increases, with the laser energy rising when the workpiece thickness is 30 μm. The formed parts in the thickness of 30 μm reach the depth of 27.63 μm under the laser energy of 1800 mJ. This behaviour is attributed to the increase in the water shock pressure for the increase in the laser pulse energy, which makes the workpiece generate more deformation. However, the depth of the replicated channel under the highest laser energy is still less than the depth of the micro-die with 29.07 μm. The reason is that the copper foil may generate a spring back. The spring back was also found by Liu et al. [47]. They thought that a pressure that was too high would make the workpiece generate a violent collision with the rigid die bottom, and then rebound forces were generated, which caused a spring back of the formed parts. Meanwhile, Ehrhardt et al. [48] also found the spring back after laser embossing when they investigated the submicron patterning of the metal substrates by laser embossing process. They considered that the elastoplastic properties of the metals caused this phenomenon. A spring back occurred because of the elasticity of the nickel and copper foils after the laser embossing. In addition, Zhang et al. [49] also found the spring back in the simulation during the laser shock forming (LSF) process. They revealed that the workpiece will spring back to release the stored elastic energy and it acquires kinetic energy again. After several energy exchanges, the elastically stored energy gradually exhausts and then reaches the static state finally. The spring back phenomenon was further studied in the numerical simulation. Figure 21 shows the curve of the Z-displacement for the element (S1015600) at the bottom surface of the flat bottom region of the microchannel (channel 5) with the thickness of 30 μm changing with the time when the laser pulse energy is 1800 mJ. It is obvious that the workpiece generates a spring back when it reaches to the rigid die bottom, then the forming depth occurs a little fluctuation and finally reaches a certain value.
It can also be found from the Figure 19 and Figure 20 that the depth of the microchannel also increases with the workpiece thickness decreasing under the same laser energy. The workpiece with the thickness of 20 μm can reach the depth of about 29 μm under the laser energy of 565 mJ, which is almost the same as the depth of the micro-die, while the forming depth of the workpiece with the thickness of 30 μm is only about 21.4 μm. This can be explicated by the surface layer model, which has been introduced in detail in Section 4.3.1.
Meanwhile, the forming depth of the microchannel (channel 5) of the formed parts in the experiments and the numerical simulation is compared, as shown in Figure 19. Through comparing the results of the experiment and the numerical simulation, it can be found that the simulation results show a good agreement with those of the experiments, yet some errors exist.
4.5. Surface Quality
The surface quality of the formed workpiece is related to the surface quality of the raw material and micro-die, as well as the process method. It also significantly affects the mechanical properties of the formed parts, such as the friction, lubricating property, abrasion resistance, corrosion resistance, and fatigue strength. Hence, it plays a significant role on the performance and durability of the MEMS or other instruments during the actual working conditions. Meanwhile, it has been put forward, in Section 4.3.1, that the bottom surface of the embossed features may replicate the machining marks of the micro-die, which may have an influence on the bottom surface smoothness of the embossed features. Therefore, the surface quality of the samples before and after the LILFE process needs to be investigated.
In order to research the surface quality of the samples under different conditions, and to compare the surface quality of the samples before and after LILFE, pure copper foils of 30 μm in thickness used as the target material were embossed under the laser energy of 565 mJ and 1800 mJ. The high resolution true colour confocal microscope was used to observe the surface morphology of the samples before and after the LILFE and the micro-die. In order to quantitatively compare the surface quality, the arithmetical mean deviation of the profile (Ra) was measured and used in this study to indicate the surface roughness. To ensure the accuracy of the roughness measurement results, the surface roughness of the die and the samples was measured at least three times, respectively, and the average values of the measurement results were adopted in the experiment.
The surface roughness measurements were performed at the bar and bottom region of the microchannel (channel 5), located in the middle region of the formed parts, as shown in Figure 22. Figure 23 and Figure 24 show the local magnified surface morphology at the bar and bottom region of the microchannel, which is face-to-face with the die and the liquid under the laser energy of 1800 mJ, respectively. The local magnified surface topography of the bar and bottom region of the micro-die is presented in Figure 25. The surface roughness values of the corresponding regions of the formed channel under the laser energy of 1800 mJ and the micro-die are presented in Figure 26. It is clearly seen from Figure 25 and Figure 26 that some machining marks exist on the bottom of the micro-die, so the roughness value of the micro-die cavity bottom (about 0.265 μm) is higher than that of the micro-die cavity bar (approximately 0.065 μm). As shown in Figure 23b, the similar features (machining marks) on the surface of the micro-die cavity bottom are also found on the surface of the microchannel bottom embossed under the laser energy of 1800 mJ, which is face-to-face with the die. The machining marks, the width of which is less than 1 μm, can be successfully embossed on the workpiece surface. This can demonstrate that the LILFE process can realize the embossing of the sub-micro scale features at the same time that the larger dimension features (such as micro scale) are embossed on the workpiece. However, the surface roughness of the microchannel bottom (about 0.178 μm) becomes larger because of embossing the machining marks from the micro-die compared with the initial roughness value of the raw material (about 0.124 μm). Meanwhile, embossing the machining marks can also demonstrate that the copper foil of 30 μm can reach to the micro-die cavity bottom under the laser energy of 1800 mJ; however, the final depth is less than the depth of the micro-die cavity, because the workpiece generates a spring back, which has been explained in Section 4.4. To illustrate the increase in the surface roughness of the microchannel bottom region mainly resulting from the machining marks’ embossing, the surface roughness of the microchannel bottom that is face-to-face with the die embossed under the laser energy of 565 mJ was measured to make a comparison. From Figure 27, it can be found that the microchannel bottom does not replicate the machining marks of the micro-die, because the microchannel cannot reach to the micro-die bottom under the laser energy of 565 mJ, which has been depicted in Section 4.3.1. The Ra value measured from the surface of the microchannel bottom embossed under the laser energy of 565 mJ (about 0.120 μm) is roughly same as that of the raw material, so the increase in the surface roughness of the microchannel bottom that is face-to-face with the die under the laser energy of 1800 mJ can be considered to result from the machining marks.
The Ra value at the microchannel bar region that is face-to-face with the die (about 0.105 μm), in Figure 26, is lower than that of the raw material and higher than that of the micro-die cavity bar, which illustrates that the high quality of the die surface has a smooth influence on the surface of the formed workpiece; thus, it can reduce the surface roughness of the workpiece. The defects of the residual rolled traces and some contaminations of the foil surface result in the Ra value of the microchannel bar being higher than that of the micro-die cavity bar.
Meanwhile, the local magnified surface topography of the rear side surface of the copper foil (which is face-to-face with the liquid) at the microchannel bottom and bar region is shown in Figure 24. The Ra values of the microchannel bottom and bar region are approximately 0.123 μm and 0.126 μm, respectively, which are almost the same as the initial roughness value of the raw material. This can indicate that this process will not cause any damage to the surface of the formed parts. No laser induced thermal damage is observed on the microchannel surface at the rear side, which is face-to-face with the liquid. This can be mainly attributed to a great specific heat of water (4.2 × 10³ ), which can absorb most of the heat induced by the laser. The thermal impact of the laser induced on the copper foil penetrating the water can be neglected because it is far below the melting temperature of the metal. Simultaneously, the liquid acting as the force transmission medium can completely avoid the friction and wear damage to the workpiece surface, which may be caused by some rigid dies or the punch. Thus, the LILFE process can protect the workpiece surface from being ablated and damaged, and can ensure the surface quality of the formed parts.
The standard deviation distribution of the surface roughness is also shown in Figure 26. It can be seen from the Figure 26 that the largest standard deviation (about 0.012) of the surface roughness of the formed microchannel occurs at the microchannel bottom that is face-to-face with the die. This is because the surface quality of the micro-die cavity bottom is relatively poor and the standard deviation of its surface roughness is also relatively large (about 0.01), which causes the surface roughness of the formed microchannel bottom that is face-to-face with the die to be less uniform.
4.6. Thickness Distribution
The thickness distribution of the formed parts is one of the important characterizations during the LILFE process, because an uneven thickness distribution will cause irregular stress levels and an excessive localised thickness reduction or even fracture. In order to study the thickness variation of the samples, pure copper foils with the thickness of 20 μm and 30 μm were embossed under the laser energy of 1800 mJ. Then, the formed parts were cold-mounted with the epoxy, ground with 80# to 3000# sand papers, and polished to prepare for being examined in a cross-sectional view. The morphology and thickness distribution along the cross section of the formed parts were characterized by the KEYENCE VHX-1000C digital microscope. Twenty-two positions along the cross section of the microchannel (channel 5) located in the middle region of the formed parts were selected to characterise the thickness distribution. The measurement method of the thickness and the several positions that were measured are shown in Figure 28. It is obvious, in Figure 28, that the thickness reduction of the formed area exists and that the degree of the thickness reduction at different positions is different. To clearly and precisely reveal the thickness reduction in different points along the cross section of the formed area, the thickness thinning rate was introduced to characterize the degree of thickness thinning. It is defined as follows:
where is the thickness of the initial copper foil before the LILFE, and is the thickness of the different positions of the formed region.
The thickness thinning rate distributions of the microchannel (channel 5) at the middle position of the formed workpiece under the laser energy of 1800 mJ are shown in Figure 28. As illustrated in Figure 28, the severest necking of thickness all occurs at the bar corner, regardless of the foil thickness, while the thickness thinning at the centre position of the bar is relatively slight. For example, the thickness thinning rate of 30 μm thick copper foil at the bar corner is approximately 16.3% with a thickness of about 25.11 μm under the laser energy of 1800 mJ, while the thickness thinning at the centre position of the bar is relatively slight with the thickness thinning rate of 3% and the thickness of 29.10 μm. This can be attributed to the following reasons: (1) The bar corner of the micro-die is not fabricated fillet. (2) The forming process in which the foil is firstly deformed at the bar corner, then the material of the bar corner gradually flows into the cavity to complete the whole plastic deformation. In addition, the thickness thinning of the channel bottom is more significant than that of the bottom corner and the transition region. This is because the bottom region of the microchannel impacts on the die cavity bottom with the fast speed, however, the transition region of the channel is drawn slightly. The serious impact squeezes the material to flow transversely toward the corner of the cavity bottom and the transition region under the high water shock wave pressure and the restriction of the fixed micro-die. Thus, the thickness thinning of the channel bottom is more severe.
Also, the thinning increases with the decrease in the workpiece thickness. The severest thickness thinning of the 30 μm thick and 20 μm thick copper foils are approximately 16.3% and 49.3%, respectively, under the laser pulse energy of 1800 mJ. This result is consistent with the result and explanation of Section 4.3.1. The reason is that the thinner foils can flow into the micro-die cavity more easily and can generate more deformation under the same laser energy, which leads to a larger thickness thinning rate for the thinner copper foil. Furthermore, although the severe thickness thinning (49.3%) of 20 μm thick copper foils occurs at the bar corner region in the LILFE process, it still keeps without fracture and shows high formability. This behaviour was also found by Gao and Cheng [12]. They considered that the superplastic mechanical behaviour in the LDF was mainly owing to the mechanisms of inertial effects, changed constitutive model of material at high strain rates, and grain size. Thus, during LILFE, the flow stress and strain rate sensitivity of the materials can accordingly increase with the high strain rate, which is beneficial to improve the formability, and the failure of the formed samples can be delayed when the inertial forces are relatively large.
Figure 29 reveals the thickness thinning rate distribution of the microchannel under the laser energy of 1800 mJ in the numerical simulation. The maximum thinning rate in the simulation is smaller than that in the experiments. The deviation is mainly due to the meshing in the numerical simulation and the measurement error. However, the trend of the numerical simulation results is in accordance with that of the experimental results.
4.7. Strain Distribution
Figure 30 shows the contours of the axial and radial plastic strain distribution on the embossed microchannel with the thickness of 30 μm, under the laser energy of 565 mJ and 1800 mJ. It can be seen that most regions of the microchannel are subjected to tensile strain in the radial direction (X direction) and compressive strain in the axial direction (Z direction), which is quite similar to the result of Zhang et al. [50]. This is because the material is compressed by the downward water shock wave pressure, and then flows into the micro-die cavity when the liquid shock wave pressure exceeds the material yield strength. Meanwhile, the material outside the die cavity cannot flow into the cavity because it is confined by the blank-holder force, thus the material in the most deformation region is elongated in the radial direction. It can be seen in Figure 30 that the significant strain gradient occurs at the region of the bar corner, because the material at the bar corner of the micro-die cavity generates compression, stretching, and shearing owing to the bar corner of the cavity without fabricating the fillet, and the material at this region stretches into the cavity to complete the plastic deformation. Meanwhile, the compressive strain in the axial direction and tensile strain in the radial direction at the bottom region of the channel exist when the workpiece collides with the micro-die bottom under the laser energy of 1800 mJ. This can be explained by the following, that the material at the bottom region collides with the bottom of the cavity severely, and is then compressed between the high water shock wave pressure and the restraint of the fixed micro-die to flow transversely toward the corner direction of the cavity.
The contours of the axial and radial plastic strain distribution of the microchannel embossed under the laser energy of 565 mJ, without colliding with the cavity bottom, are similar to that of the laser shock micro-bulging forming [51]. It is obvious in Figure 30 that most of the regions of the channel are also subjected to tensile strain in the radial direction and compressive strain in the axial direction when the laser energy is 565 mJ, and the significant plastic strain is at the bar corner and at the bottom region. The plastic strain of the microchannel at the bottom region is larger than that at the transition region, because the material at the bottom of the deformed foil is compressed by the high water shock wave pressure, so as to elongate into the die cavity, while the transition region of the channel is drawn relatively slightly.
Figure 31 shows a group of time-varying curves of the radial strain and axial strain distribution at the bar corner region, under the laser energy of 565 mJ and 1800 mJ. It can be found that both the maximum radial plastic strain and the axial plastic strain increase with the laser energy increasing from 565 mJ to 1800 mJ. This is because the workpiece with the same thickness generates more plastic deformation under the higher laser energy, which has been introduced in the Section 4.3.2.
5. Conclusions
This paper investigated the influences of laser energy and workpiece thickness on the deformation characteristics of pure copper foils embossed with 100# copper grating micro-die by LILFE process, through the experiments and numerical simulation. Good consistency has been achieved between the experiments and the numerical simulation under different conditions. Meanwhile, the plastic strain distribution of the embossed parts and the typical stages of the deformation process were studied in the numerical simulation. The significant results can be obtained as follows:
- The experiments and numerical simulation show that the forming accuracy of the formed parts becomes better with the increase in the laser energy and decrease in the workpiece thickness. However, some adverse phenomena exist in the experiments when the laser energy increases to a certain extent.
- The forming accuracy of the channels located at the edge region is lower than that of the channels located at the middle region, and the trend of the result in the simulation has a good agreement with that in the experiments.
- The experiments and numerical simulations show that the forming depth of the micro embossed channel increases with the decrease in the workpiece thickness and the increase in the laser energy. The formed part generates a spring back during the forming process, which will have an adverse effect on the forming accuracy of the replicated features.
- Through measuring the surface roughness of the formed area, raw material, and micro-die, the surface quality of the formed parts is related to the surface quality of the raw material and micro-die, as well as to the process method. Meanwhile, no laser induced thermal damage is observed on the microchannel surface at the rear side, which is face-to-face with the liquid.
- The experiments and numerical simulations show that the thickness thinning rate of the embossed parts increases with the decrease of the workpiece thickness, and the severest thickness thinning presents at the bar corner region.
- Most regions of the channel are subjected to tensile strain in the radial direction and compressive strain in the axial direction. Both the maximum radial plastic strain and the axial plastic strain at the bar corner region increase with the increase in the laser energy.
6. Future Work
- (1)
- A comprehensive study of the spring back phenomenon should be examined in future research. The detailed study of the spring back effect during the forming process in the numerical simulation with a longer time and a statics analysis of the steps of the spring back will be a worthy supplement for the experimental investigation, and it is useful to explain the forming behaviour of metal foils during the LILFE process.
- (2)
- How to improve the spring back phenomenon is also important for future research. The multiple laser pulses, instead of just a single laser pulse, will be employed in the experiments and the numerical simulation to further investigate whether the spring back can be reduced, and whether the forming accuracy of the formed parts can be improved. Meanwhile, the multi-pulse approach can also be applied to overcoming the difficulty of forming the thicker workpiece.
- (3)
- In addition, besides the process parameters, such as laser energy and workpiece thickness in this study, other parameters, including the number of laser pulse, the height and diameter of liquid chamber, the type of liquid, and workpiece with different materials, will be further researched in our future study, in order to make the research of the LILFE process more complete and systematic.
Author Contributions
F.L., H.L., and X.W. conceived and designed the experiments; F.L. and C.J. performed the experiments and numerical simulation; X.W. and Y.M. analysed the data; F.L., H.L., and X.W. wrote the paper.
Acknowledgments
This work is supported by the National Natural Science Foundation of China (Grant No. 51675243) and the 2017 Innovation Practice Fund of Jiangsu University Industrial Centre (Grant No. ZXJG201772).
Conflicts of Interest
The authors declare no conflict of interest.
References
- Mai, J.M.; Peng, L.F.; Lai, X.M.; Lin, Z.Q. Electrical-assisted embossing process for fabrication of micro-channels on 316l stainless steel plate. J. Mater. Process. Technol. 2013, 213, 314–321. [Google Scholar] [CrossRef]
- Wang, H.M.; Vivek, A.; Wang, Y.L.; Viswanathan, G.; Daehn, G. High strain rate embossing with copper plate. Int. J. Mater. Form. 2017, 10, 697–705. [Google Scholar] [CrossRef]
- Vollertsen, F.; Niehoff, H.S.; Hu, Z. State of the art in micro forming. Int. J. Mach. Tool. Manuf. 2006, 46, 1172–1179. [Google Scholar] [CrossRef]
- Schuster, R.; Kirchner, V.; Allongue, P.; Ertl, G. Electrochemical Micromachining. Science 2000, 289, 98–101. [Google Scholar] [CrossRef] [PubMed]
- Hirata, Y. Liga process—Micromachining technique using synchrotron radiation lithography—and some industrial applications. Nucl. Instrum. Methods Phys. Res. Sect. B Beam Interact. Mater. At. 2003, 208, 21–26. [Google Scholar] [CrossRef]
- Zhang, K.F.; Kun, L. Classification of size effects and similarity evaluating method in micro forming. J. Mater. Process. Technol. 2009, 209, 4949–4953. [Google Scholar] [CrossRef]
- Cheng, G.J.; Pirzada, D.; Zhou, M. Microstructure and mechanical property characterizations of metal foil after microscale laser dynamic forming. J. Appl. Phys. 2007, 101, 063108. [Google Scholar] [CrossRef]
- Zhang, R.; Zhang, T.S. Non-die explosive forming of spherical pressure vessels. J. Mater. Process. Technol. 1994, 41, 341–347. [Google Scholar] [CrossRef]
- Golovashchenko, S.F.; Gillard, A.J.; Mamutov, A.V. Formability of dual phase steels in electrohydraulic forming. J. Mater. Process. Technol. 2013, 213, 1191–1212. [Google Scholar] [CrossRef]
- Li, F.Q.; Zhao, J.; Mo, J.H.; Li, J.J.; Huang, L. Comparative study of the microstructure of Ti-6Al-4V titanium alloy sheets under quasi-static and high-velocity bulging. J. Mech. Sci. Technol. 2017, 31, 1349–1356. [Google Scholar] [CrossRef]
- Zhou, M.; Huang, T.; Cai, L. The novel nanosecond laser micro-manufacturing of three-dimensional metallic structures. Appl. Phys. A 2008, 90, 293–297. [Google Scholar] [CrossRef]
- Gao, H.; Cheng, G.J. Laser Induced High-Strain-Rate Superplastic 3D Micro-Forming of Metallic Thin Film. J. Microelectromech. Syst. 2010, 19, 273–281. [Google Scholar] [CrossRef]
- Gao, H.; Ye, C.; Cheng, G.J. Deformation Behaviors and Critical Parameters in Microscale Laser Dynamic Forming. J. Manuf. Sci. Eng. 2009, 131, 051011. [Google Scholar] [CrossRef]
- Li, J.; Gao, H.; Cheng, G.J. Forming limit and fracture mode of microscale laser dynamic forming. J. Manuf. Sci. Eng. 2010, 132, 061005. [Google Scholar] [CrossRef]
- Ye, C.; Cheng, G.J. Scalable patterning on shape memory alloy by laser shock assisted direct imprinting. Appl. Surf. Sci. 2012, 258, 10042–10046. [Google Scholar] [CrossRef]
- Ehrhardt, M.; Lorenz, P.; Frost, F.; Zimmer, K. Laser Embossing of Micro-and Submicrometer Surface Structures in Copper. Phys. Proced. 2012, 39, 735–742. [Google Scholar] [CrossRef]
- Ehrhardt, M.; Lorenz, P.; Frost, F.; Zimmer, K. Fabrication of sub-microstructures in solid copper surfaces by inverse laser microembossing. Appl. Phys. A 2013, 111, 517–523. [Google Scholar] [CrossRef]
- Liu, H.X.; Shen, Z.B.; Wang, X.; Wang, H.J.; Tao, M.K. Micromould based laser shock embossing of thin metal sheets for MEMS applications. Appl. Surf. Sci. 2010, 256, 4687–4691. [Google Scholar] [CrossRef]
- Shen, Z.B.; Gu, C.X.; Liu, H.X.; Wang, X.; Hu, Y. Fabricating three-dimensional array features on metallic foil surface using overlapping laser shock embossing. Opt. Lasers. Eng. 2013, 51, 973–977. [Google Scholar] [CrossRef]
- Balanethiram, V.S.; Daehn, G.S. Hyperplasticity: Increased forming limits at high workpiece velocity. Scr. Metallurgica Mater. 1994, 30, 515–520. [Google Scholar] [CrossRef]
- Samardzic, V.; Geskin, E.S.; Atanov, G.A.; Semko, A.N.; Kovaliov, A. Liquid Impact Based Material Micro-Forming Technology. J. Mater. Eng. Perform. 2007, 16, 375–389. [Google Scholar] [CrossRef]
- Samardzic, V.; Geskin, E.S.; Atanov, G.A.; Semko, A.N.; Kovaliov, A. Investigation of Liquid Impact-Based Macro-, Meso-, and Microforming Processes. J. Mater. Eng. Perform. 2008, 17, 302–315. [Google Scholar] [CrossRef]
- Woo, M.-A.; Noh, H.G.; An, W.J.; Song, W.J.; Kang, B.S.; Kim, J. Numerical study on electrohydraulic forming process to reduce the bouncing effect in electromagnetic forming. Int. J. Adv. Manuf. Technol. 2017, 89, 1813–1825. [Google Scholar] [CrossRef]
- Skews, B.W.; Kosing, O.E.; Hattingh, R.J. Use of a liquid shock tube as a device for the study of material deformation under impulsive loading conditions. Proc. Inst. Mech. Eng. Part C J. Mech. Eng. Sci. 2004, 218, 39–51. [Google Scholar] [CrossRef]
- Marai, M.; Lang, L.H.; Wang, S.H.; Lin, L.J.; Yang, C.L.; Luo, X. Investigation on the effect of liquid hammer geometry to the pressure distribution of innovative hybrid impact hydroforming. Adv. Mater. Res. 2014, 941–944, 1843–1849. [Google Scholar] [CrossRef]
- Wang, S.H.; Lang, L.H.; Lin, L.J. Investigation on the Punching Quality of Hybrid Impact Hydroforming. Appl. Mech. Mater. 2014, 602–605, 520–523. [Google Scholar] [CrossRef]
- Fabbro, R.; Fournier, J.; Ballard, P.; Devaux, D.; Virmont, J. Physical study of laser-produced plasma in confined geometry. J. Appl. Phys. 1990, 68, 775–784. [Google Scholar] [CrossRef]
- Zheng, C.; Sun, S.; Ji, Z.; Wang, W.; Liu, J. Numerical simulation and experimentation of micro scale laser bulge forming. Int. J. Mach. Tools Manuf. 2010, 50, 1048–1056. [Google Scholar] [CrossRef]
- Zhou, J.Z.; Yang, J.C.; Zhou, M.; Zhang, Y.K.; Guo, D.H.; Wu, H.X. Experimental Study on the Effects of Overlay Properties on Laser-induced Shock Waves. Chin. J. Lasers 2002, 29, 1041–1044. [Google Scholar] [CrossRef]
- Zheng, C.; Ji, Z.; Song, L.B.; Fu, J.; Zhu, Y.H.; Zhang, J.H. Variation of fracture mode in micro-scale laser shock punching. Opt. Lasers Technol. 2015, 72, 25–32. [Google Scholar] [CrossRef]
- Peyre, P.; Fabbro, R. Laser shock processing: A review of the physics and applications. Opt. Quantum Electron. 1995, 27, 1213–1229. [Google Scholar]
- Wang, X.; Du, D.Z.; Zhang, H.; Shen, Z.B.; Liu, H.X.; Zhou, J.Z.; Liu, H.; Hu, Y.; Gu, C.X. Investigation of microscale laser dynamic flexible forming process—Simulation and experiments. Int. J. Mach. Tool. Manuf. 2013, 67, 8–17. [Google Scholar] [CrossRef]
- Zhang, W.W.; Yao, Y.L.; Noyan, I.C. Microscale laser shock peening of thin films, part 1: experiment, modeling and simulation. J. Manuf. Sci. Eng. 2004, 126, 10–17. [Google Scholar] [CrossRef]
- Mangonon, P.L. The Principles of Materials Selection for Engineering Design; Prentice Hall: Upper Saddle River, NJ, USA, 1999; ISBN 0132425955. [Google Scholar]
- Johnson, G.R.; Cook, W.H. A constitutive model and data for metals subjected to large strains, high strain rates and high temperatures. In Proceedings of the 7th International Symposium on Ballistics, Hague, The Netherlands, 19–21 April 1983; pp. 541–547. [Google Scholar]
- Bae, G.; Xiong, Y.M.; Kumar, S.; Kang, K.; Lee, C. General aspects of interface bonding in kinetic sprayed coatings. Acta. Mater. 2008, 56, 4858–4868. [Google Scholar] [CrossRef]
- Dirikolu, M.H.; Akdemir, E. Computer aided modelling of flexible forming process. J. Mater. Process. Technol. 2004, 148, 376–381. [Google Scholar] [CrossRef]
- Takashi, N.; Hughes, T.J.R. An arbitrary Lagrangian-Eulerian finite element method for interaction of fluid and a rigid body. Comput. Methods Appl. Mech. Eng. 1992, 95, 115–138. [Google Scholar] [CrossRef]
- Kjellgren, P.; Hyvärinen, J. An Arbitrary Lagrangian-Eulerian finite element method. Comput. Mech. 1998, 21, 81–90. [Google Scholar] [CrossRef]
- Barlow, A.J.; Maire, P.H.; Rider, W.J.; Rieben, R.N.; Shashkov, M.J. Arbitrary Lagrangian–Eulerian methods for modeling high-speed compressible multimaterial flows. J. Comput. Phys. 2016, 322, 603–665. [Google Scholar] [CrossRef]
- Shams, A.; Lopresto, V.; Porfiri, M. Modeling fluid-structure interactions during impact loading of water-backed panels. Compos. Struct. 2017, 171, 576–590. [Google Scholar] [CrossRef]
- Hou, G.; Wang, J.; Layton, A. Numerical Methods for Fluid-Structure Interaction—A Review. Commun. Comput. Phys. 2012, 12, 337–377. [Google Scholar] [CrossRef]
- Varas, D.; Zaera, R.; López-Puente, J. Numerical modelling of the hydrodynamic ram phenomenon. Int. J. Impact. Eng. 2009, 36, 363–374. [Google Scholar] [CrossRef] [Green Version]
- Boyd, R.; Royles, R.; El-Deeb, K.M.M. Simulation and validation of UNDEX phenom-ena relating to axisymmetric structures. In Proceedings of the sixth international LS-DYNA users conference, Dearborn, MI, USA, 9–11 April 2000. [Google Scholar]
- Shah, S. Water Impact Investigations for Aircraft Ditching Analysis. Master’s Thesis, RMIT University, Melbourne, Australia, 2010. [Google Scholar]
- Engel, U.; Eckstein, R. Microforming-from basic research to its realization. J. Mater. Process. Technol. 2002, 125–126, 35–44. [Google Scholar] [CrossRef]
- Liu, H.X.; Sha, C.F.; Shen, Z.B.; Li, L.Y.; Gao, S.; Li, C.; Sun, X.Q.; Wang, X. Fabrication of Dish-Shaped Micro Parts by Laser Indirect Shocking Compound Process. Micromachines 2016, 7, 105. [Google Scholar] [CrossRef]
- Ehrhardt, M.; Lorenz, P.; Lotnyk, A.; Romanus, H.; Thelander, E.; Zimmer, K. Pattern transfer of sub-micrometre-scaled structures into solid copper by laser embossing. Phys. Proced. 2014, 56, 944–950. [Google Scholar] [CrossRef]
- Zhang, X.Q.; She, J.P.; Li, S.Z.; Duan, S.W.; Zhou, Y.; Yu, X.L.; Zheng, R.; Zhang, B. Simulation on deforming progress and stress evolution during laser shock forming with finite element method. J. Mater. Process. Technol. 2015, 220, 27–35. [Google Scholar] [CrossRef]
- Zhang, X.Q.; Zhang, Y.; Zhang, Y.W.; Pei, S.B.; Huang, Z.L.; Deng, L.; Li, S.Z. Numerical and experimental investigations of laser shock forming aluminum alloy sheet with mold. Int. J. Mater. Form. 2018, 11, 101–112. [Google Scholar] [CrossRef]
- Liu, H.X.; Sun, X.Q.; Shen, Z.B.; Li, L.Y.; Sha, C.F.; Ma, Y.J.; Gau, J.T.; Wang, X. Experimental and Numerical Simulation Investigation on Laser Flexible Shock Micro-Bulging. Metals 2017, 7, 93. [Google Scholar] [CrossRef]
Figure 1.
Schematic of the laser impact liquid flexible embossing process.

Figure 2.
(a) Two-dimensional (2-D) morphology of the whole micro-die, (b) 2-D image of a single cavity of the micro-die, and (c) sectional view and dimension of a single cavity of the micro-die.
Figure 2.
(a) Two-dimensional (2-D) morphology of the whole micro-die, (b) 2-D image of a single cavity of the micro-die, and (c) sectional view and dimension of a single cavity of the micro-die.

Figure 3.
The numerical model of laser impact liquid flexible embossing process.

Figure 4.
The curve of laser induced shock wave pressure changing with the time.

Figure 5.
Spatial distribution of laser induced shock wave pressure.

Figure 6.
The image of the model of fluid components.

Figure 7.
Image of the formed part under the laser energy of 1800 mJ: (a) 2-D morphology of the whole formed part and (b) cross-section morphology of ten array channels.
Figure 7.
Image of the formed part under the laser energy of 1800 mJ: (a) 2-D morphology of the whole formed part and (b) cross-section morphology of ten array channels.


Figure 8.
(a) 3-D morphology of one formed microchannel and (b) cross-section morphology of one microchannel.
Figure 8.
(a) 3-D morphology of one formed microchannel and (b) cross-section morphology of one microchannel.

Figure 9.
Deformation stages of the workpiece in the laser impact liquid flexible embossing process.
Figure 9.
Deformation stages of the workpiece in the laser impact liquid flexible embossing process.

Figure 10.
Cross-section curves of one microchannel under the laser energy of 1800 mJ in the experiments and numerical simulation.
Figure 10.
Cross-section curves of one microchannel under the laser energy of 1800 mJ in the experiments and numerical simulation.

Figure 11.
Image of the formed part under the laser energy of 1800 mJ in the numerical simulation: (a) surface morphology of the whole formed workpiece and (b) cross-section morphology of one microchannel.
Figure 11.
Image of the formed part under the laser energy of 1800 mJ in the numerical simulation: (a) surface morphology of the whole formed workpiece and (b) cross-section morphology of one microchannel.

Figure 12.
The 3-D morphologies and cross-section morphologies of the microchannel (channel 5) of the formed parts with the thickness of 20 μm under different laser energy parameters: (a) under the laser energy of 565 mJ, (b) under the laser energy of 1200 mJ, and (c) under the laser energy of 1800 mJ.

Figure 13.
The 3-D morphologies and cross-section morphologies of the microchannel (channel 5) of the formed parts with the thickness of 30 μm under different laser energy parameters: (a) under the laser energy of 565 mJ, (b) under the laser energy of 1200 mJ, and (c) under the laser energy of 1800 mJ.

Figure 14.
Sectional curves of the formed parts with the thickness of 20 μm and 30 μm under different laser energy: (a) under the laser energy of 565 mJ, (b) under the laser energy of 1200 mJ, and (c) under the laser energy of 1800 mJ.
Figure 14.
Sectional curves of the formed parts with the thickness of 20 μm and 30 μm under different laser energy: (a) under the laser energy of 565 mJ, (b) under the laser energy of 1200 mJ, and (c) under the laser energy of 1800 mJ.

Figure 15.
The width of the flat bottom region of the formed parts with different thicknesses and under different laser energy in the experiments and numerical simulation.
Figure 15.
The width of the flat bottom region of the formed parts with different thicknesses and under different laser energy in the experiments and numerical simulation.

Figure 16.
Sectional curves of the replicated features under different laser energy.

Figure 17.
The cross-section images of the whole ten array channels: (a) experimental result and (b) simulation result.
Figure 17.
The cross-section images of the whole ten array channels: (a) experimental result and (b) simulation result.

Figure 18.
The width of the flat bottom region of each channel in the same section under the laser energy of 1800 mJ.
Figure 18.
The width of the flat bottom region of each channel in the same section under the laser energy of 1800 mJ.

Figure 19.
The forming depth of the embossed microchannel in the experiments and numerical simulation.
Figure 19.
The forming depth of the embossed microchannel in the experiments and numerical simulation.

Figure 20.
The experimental cross-section curves of microchannels with different thicknesses and under different laser energy.
Figure 20.
The experimental cross-section curves of microchannels with different thicknesses and under different laser energy.

Figure 21.
(a) The position chosen to plot the curve of Z-displacement changing with the time and (b) curve of Z-displacement for the workpiece with the thickness of 30 μm changing with the time under the laser pulse energy of 1800 mJ.
Figure 21.
(a) The position chosen to plot the curve of Z-displacement changing with the time and (b) curve of Z-displacement for the workpiece with the thickness of 30 μm changing with the time under the laser pulse energy of 1800 mJ.

Figure 22.
(a) 2-D surface roughness measurement positions and (b) local magnified morphology of roughness measurement positions in 3-D.
Figure 22.
(a) 2-D surface roughness measurement positions and (b) local magnified morphology of roughness measurement positions in 3-D.

Figure 23.
Local magnified surface morphology of three different regions of the microchannel that is face-to-face with the mould under the laser energy of 1800 mJ: (a) surface topography of the original copper foil, (b) surface image at bottom region, and (c) surface topography at the bar region. The arrows represent the rolling direction of the copper foil.

Figure 24.
Local magnified surface topography of the rear side surface of the embossed microchannel (which is face to face with the liquid): (a) Surface image at the bottom region and (b) surface topography at the bar region. The arrows represent the rolling direction of the copper foil.
Figure 24.
Local magnified surface topography of the rear side surface of the embossed microchannel (which is face to face with the liquid): (a) Surface image at the bottom region and (b) surface topography at the bar region. The arrows represent the rolling direction of the copper foil.

Figure 25.
Local magnified surface topography of the micro-die: (a) bar region and (b) bottom region. The arrow represents the machining marks.
Figure 25.
Local magnified surface topography of the micro-die: (a) bar region and (b) bottom region. The arrow represents the machining marks.

Figure 26.
Surface roughness values of the corresponding regions and the micro-die.

Figure 27.
Surface image of the microchannel peak region, which is face-to-face with the mould embossed under the laser energy of 565 mJ. The arrow represents the rolling direction of the copper foil.
Figure 27.
Surface image of the microchannel peak region, which is face-to-face with the mould embossed under the laser energy of 565 mJ. The arrow represents the rolling direction of the copper foil.

Figure 28.
(a) The measurement method and thickness distribution of several locations and (b) the thickness thinning rate distribution of the microchannel with the thickness of 20 μm and 30 μm under the laser energy of 1800 mJ.
Figure 28.
(a) The measurement method and thickness distribution of several locations and (b) the thickness thinning rate distribution of the microchannel with the thickness of 20 μm and 30 μm under the laser energy of 1800 mJ.

Figure 29.
The thickness thinning rate distribution of the microchannel in the numerical simulation.
Figure 29.
The thickness thinning rate distribution of the microchannel in the numerical simulation.

Figure 30.
Plastic strain distribution of embossed microchannel with the thickness of 30 μm: (a) under the laser energy of 1800 mJ and (b) under the laser energy of 565 mJ.
Figure 30.
Plastic strain distribution of embossed microchannel with the thickness of 30 μm: (a) under the laser energy of 1800 mJ and (b) under the laser energy of 565 mJ.

Figure 31.
Time-varying curves of the strain distribution at the bar corner region under the laser energy of 565 mJ and 1800 mJ: (a) radial strain distribution and (b) axial strain distribution.
Figure 31.
Time-varying curves of the strain distribution at the bar corner region under the laser energy of 565 mJ and 1800 mJ: (a) radial strain distribution and (b) axial strain distribution.


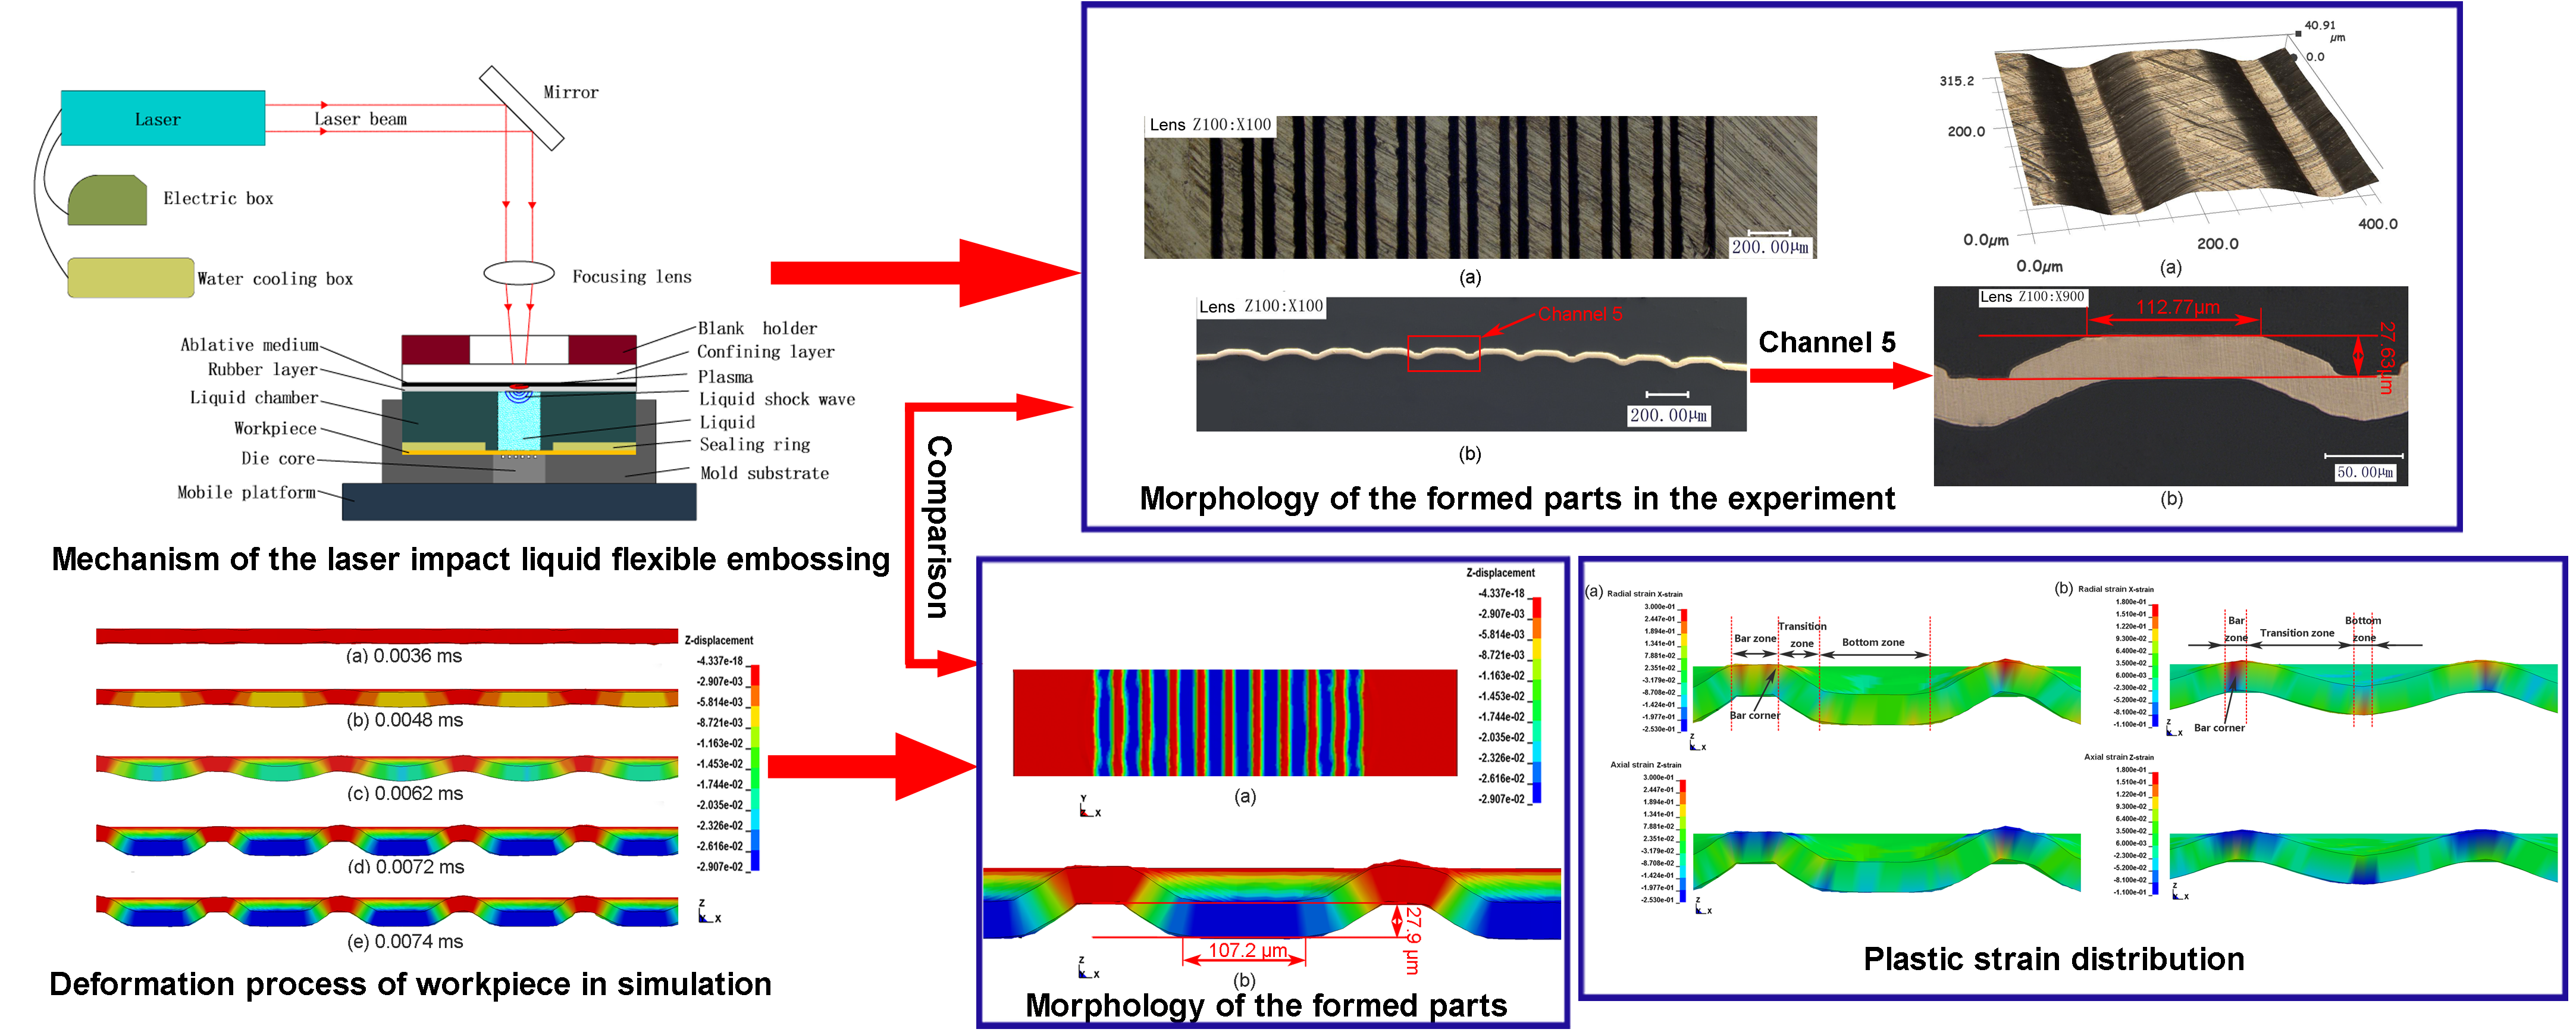
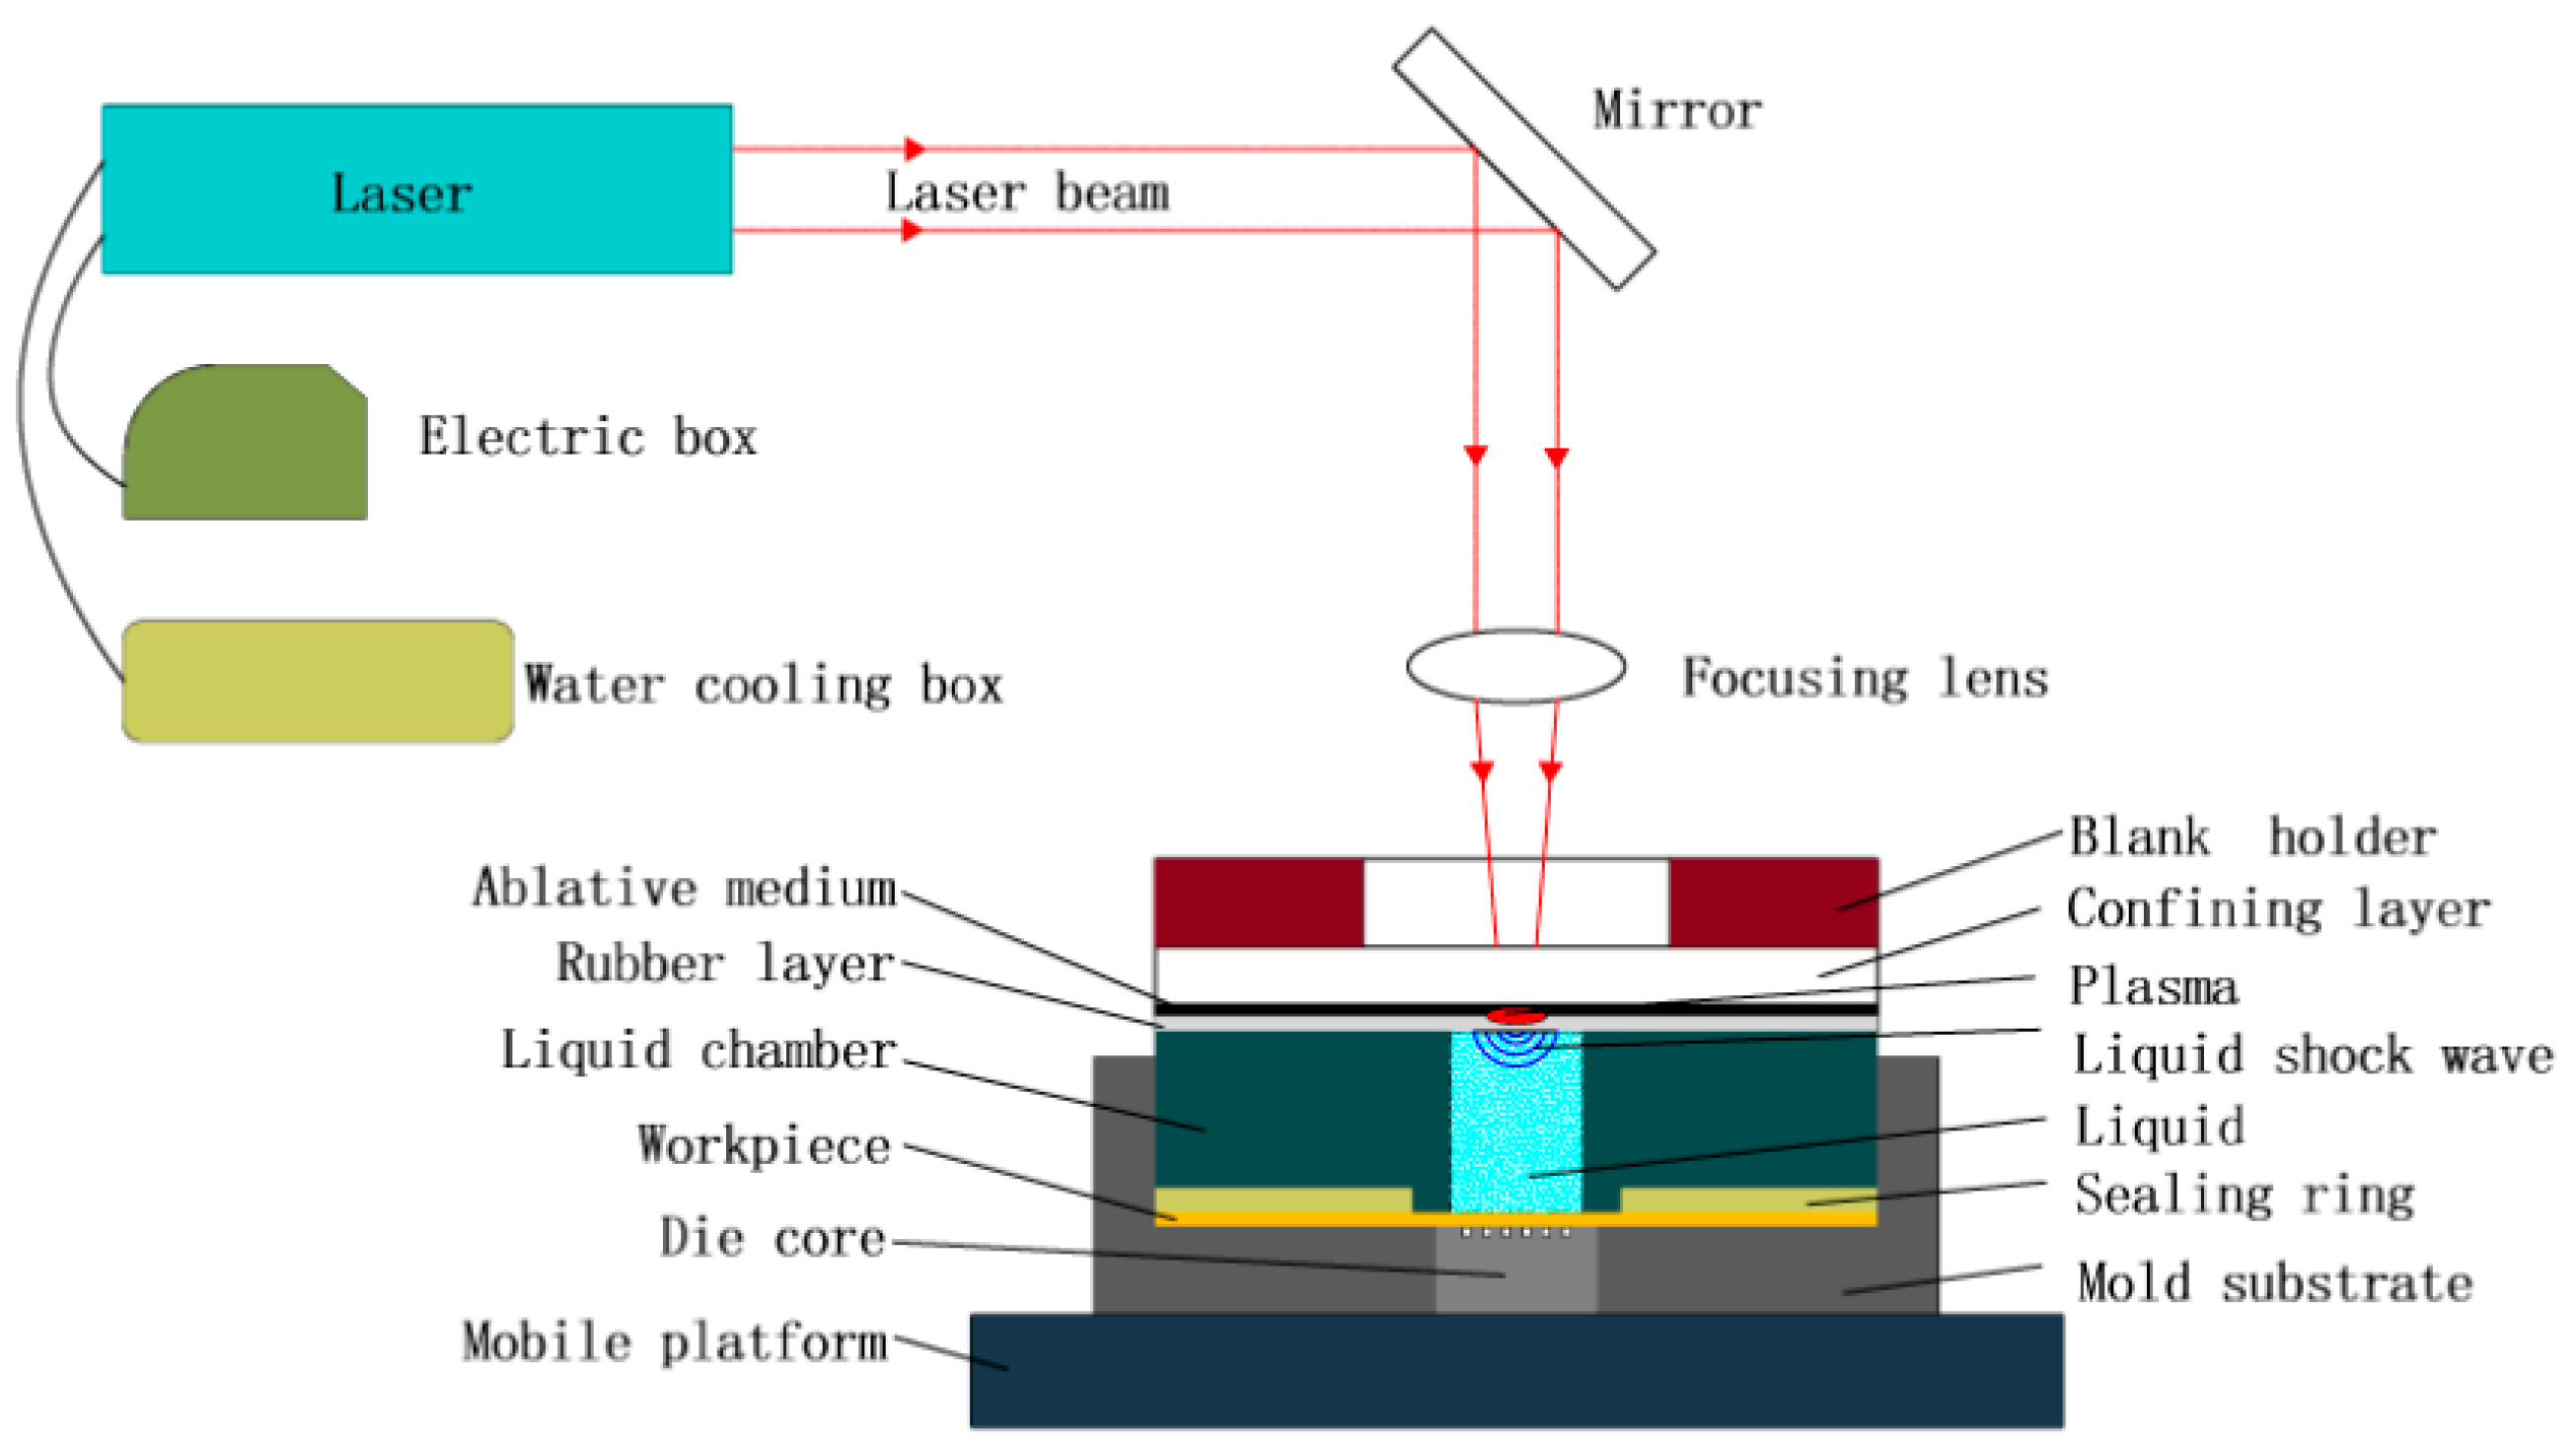
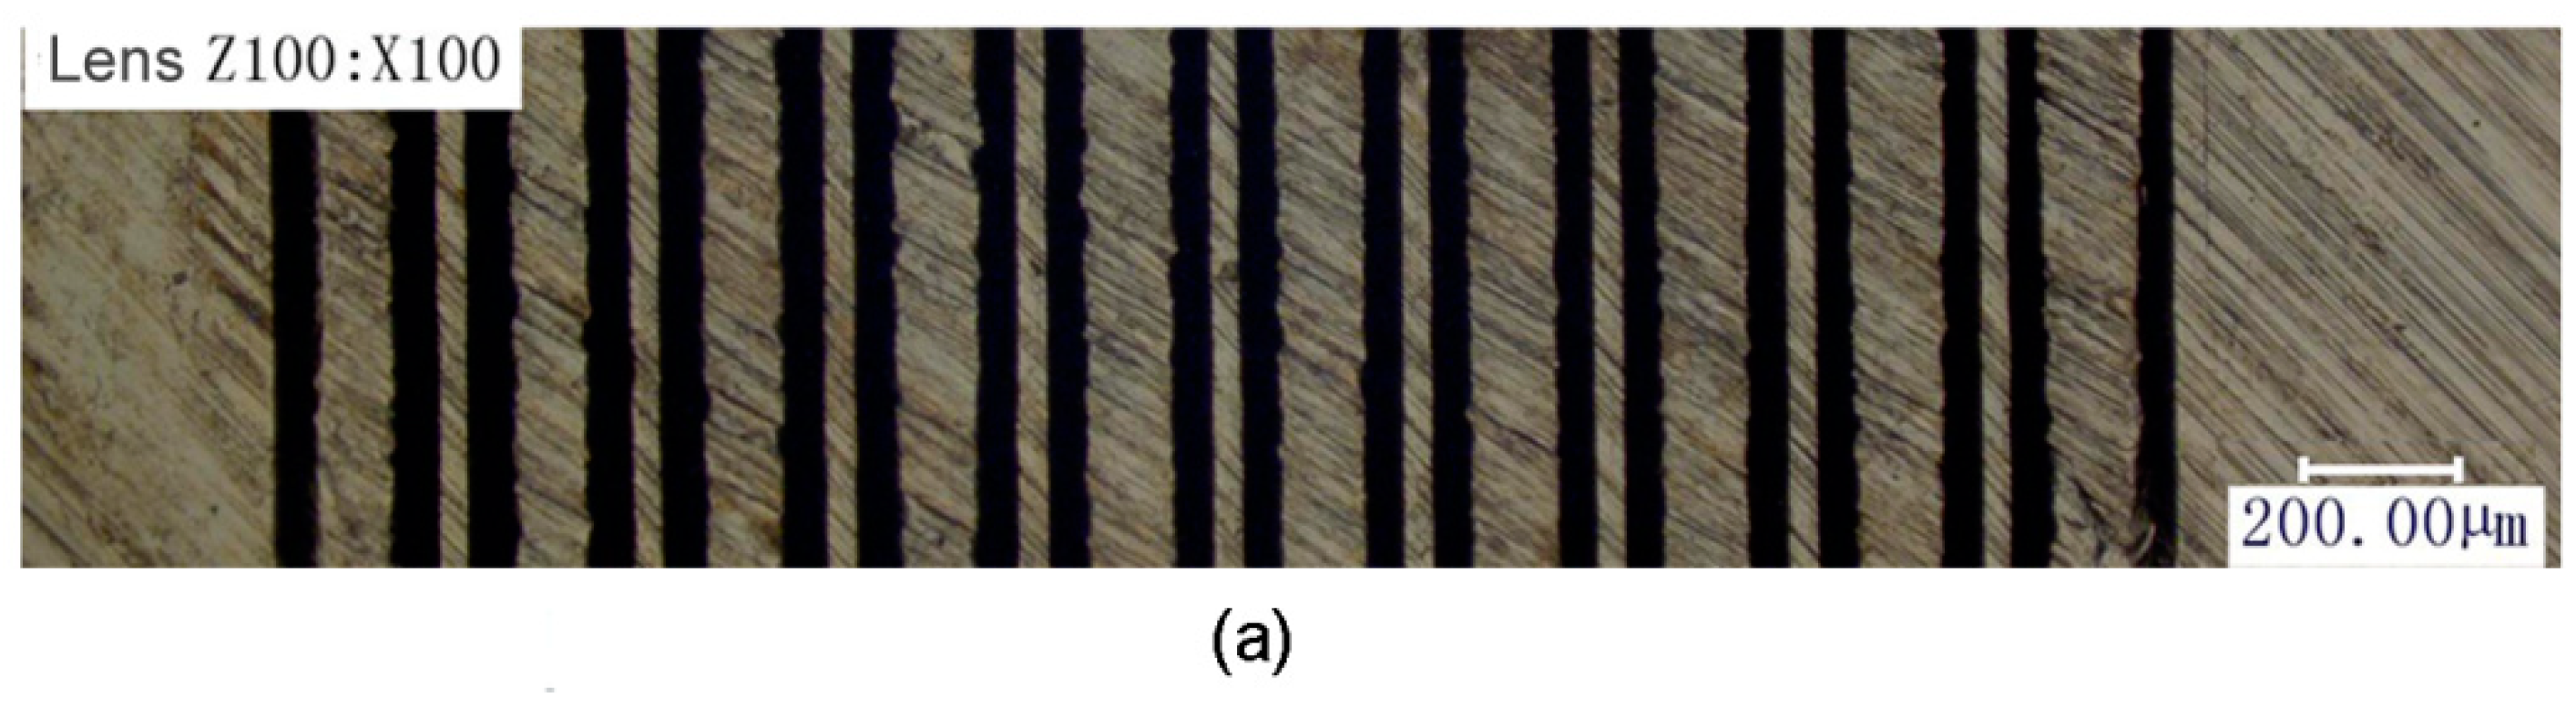
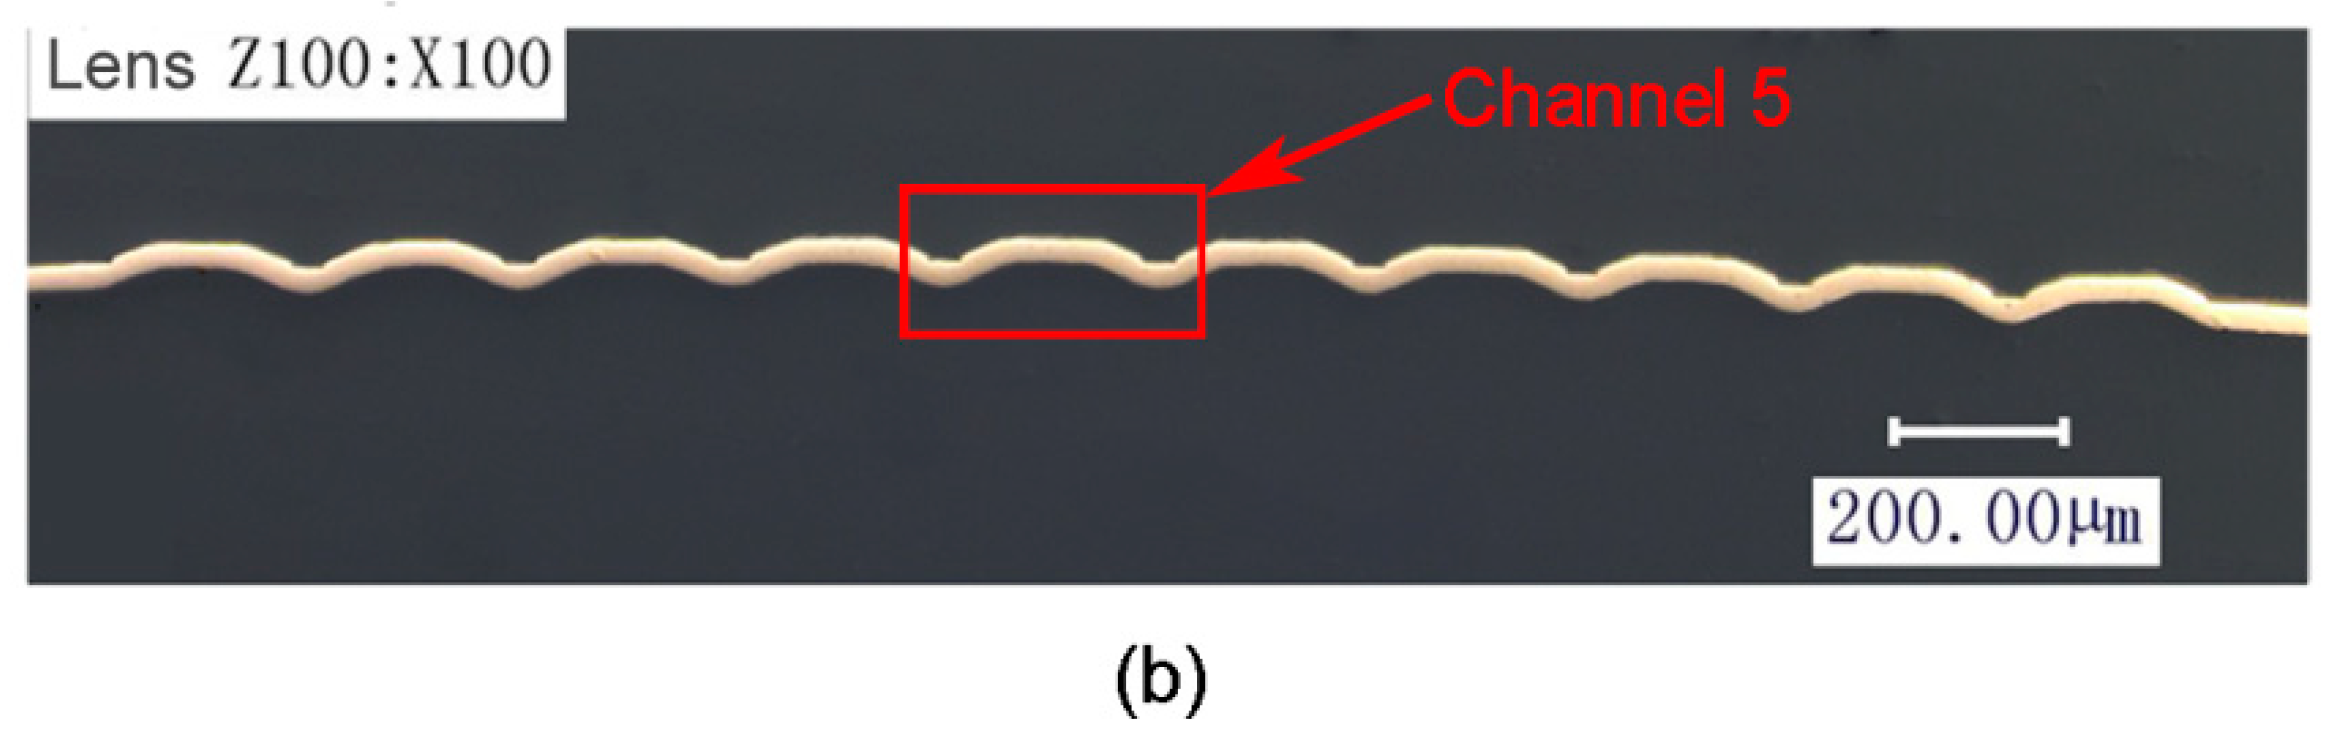
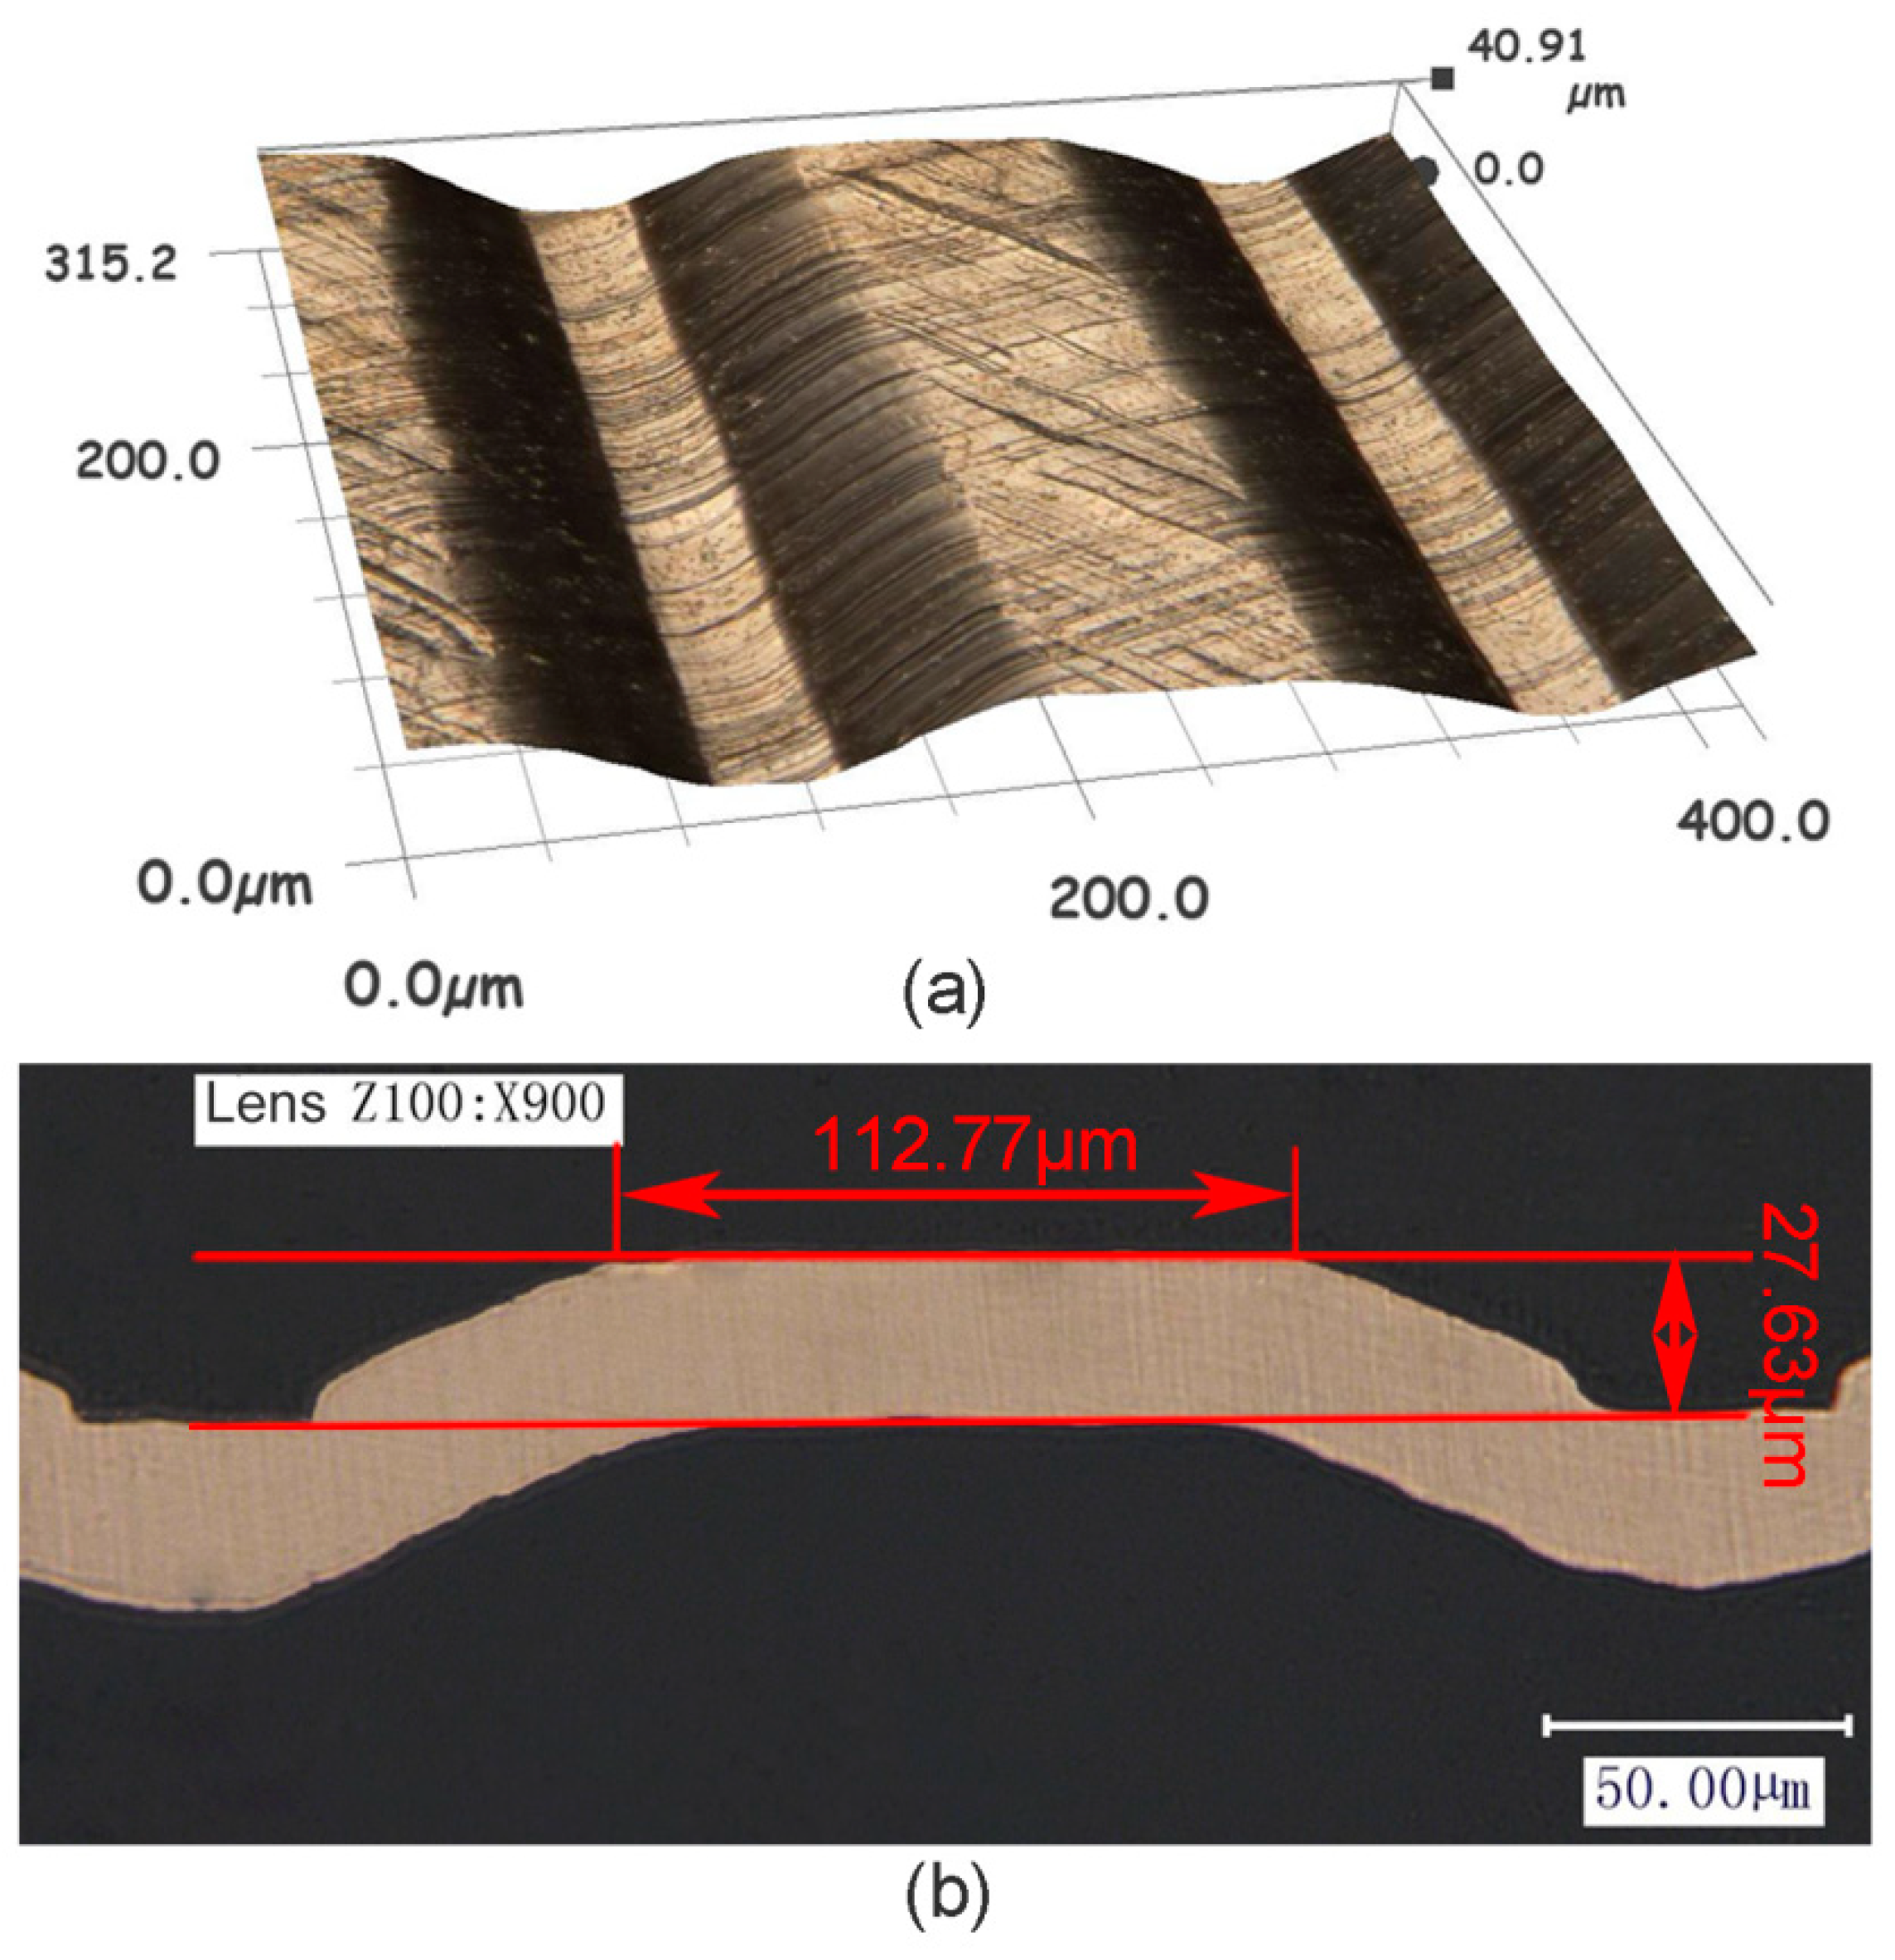
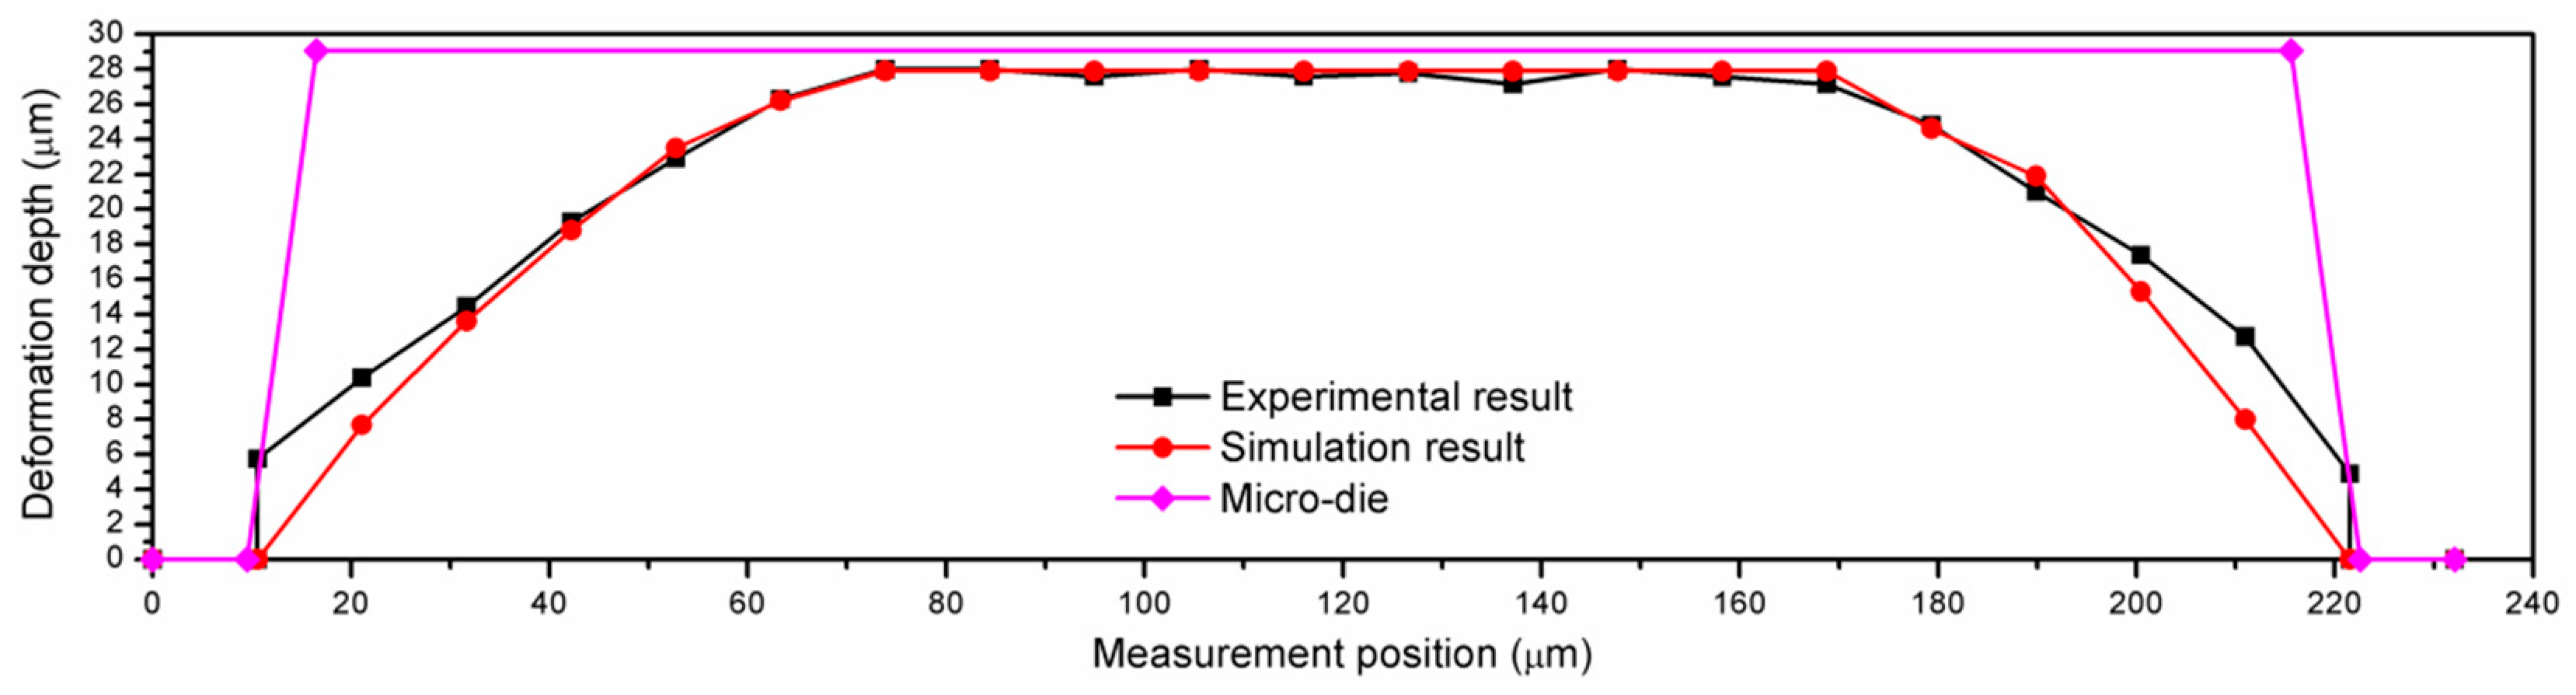
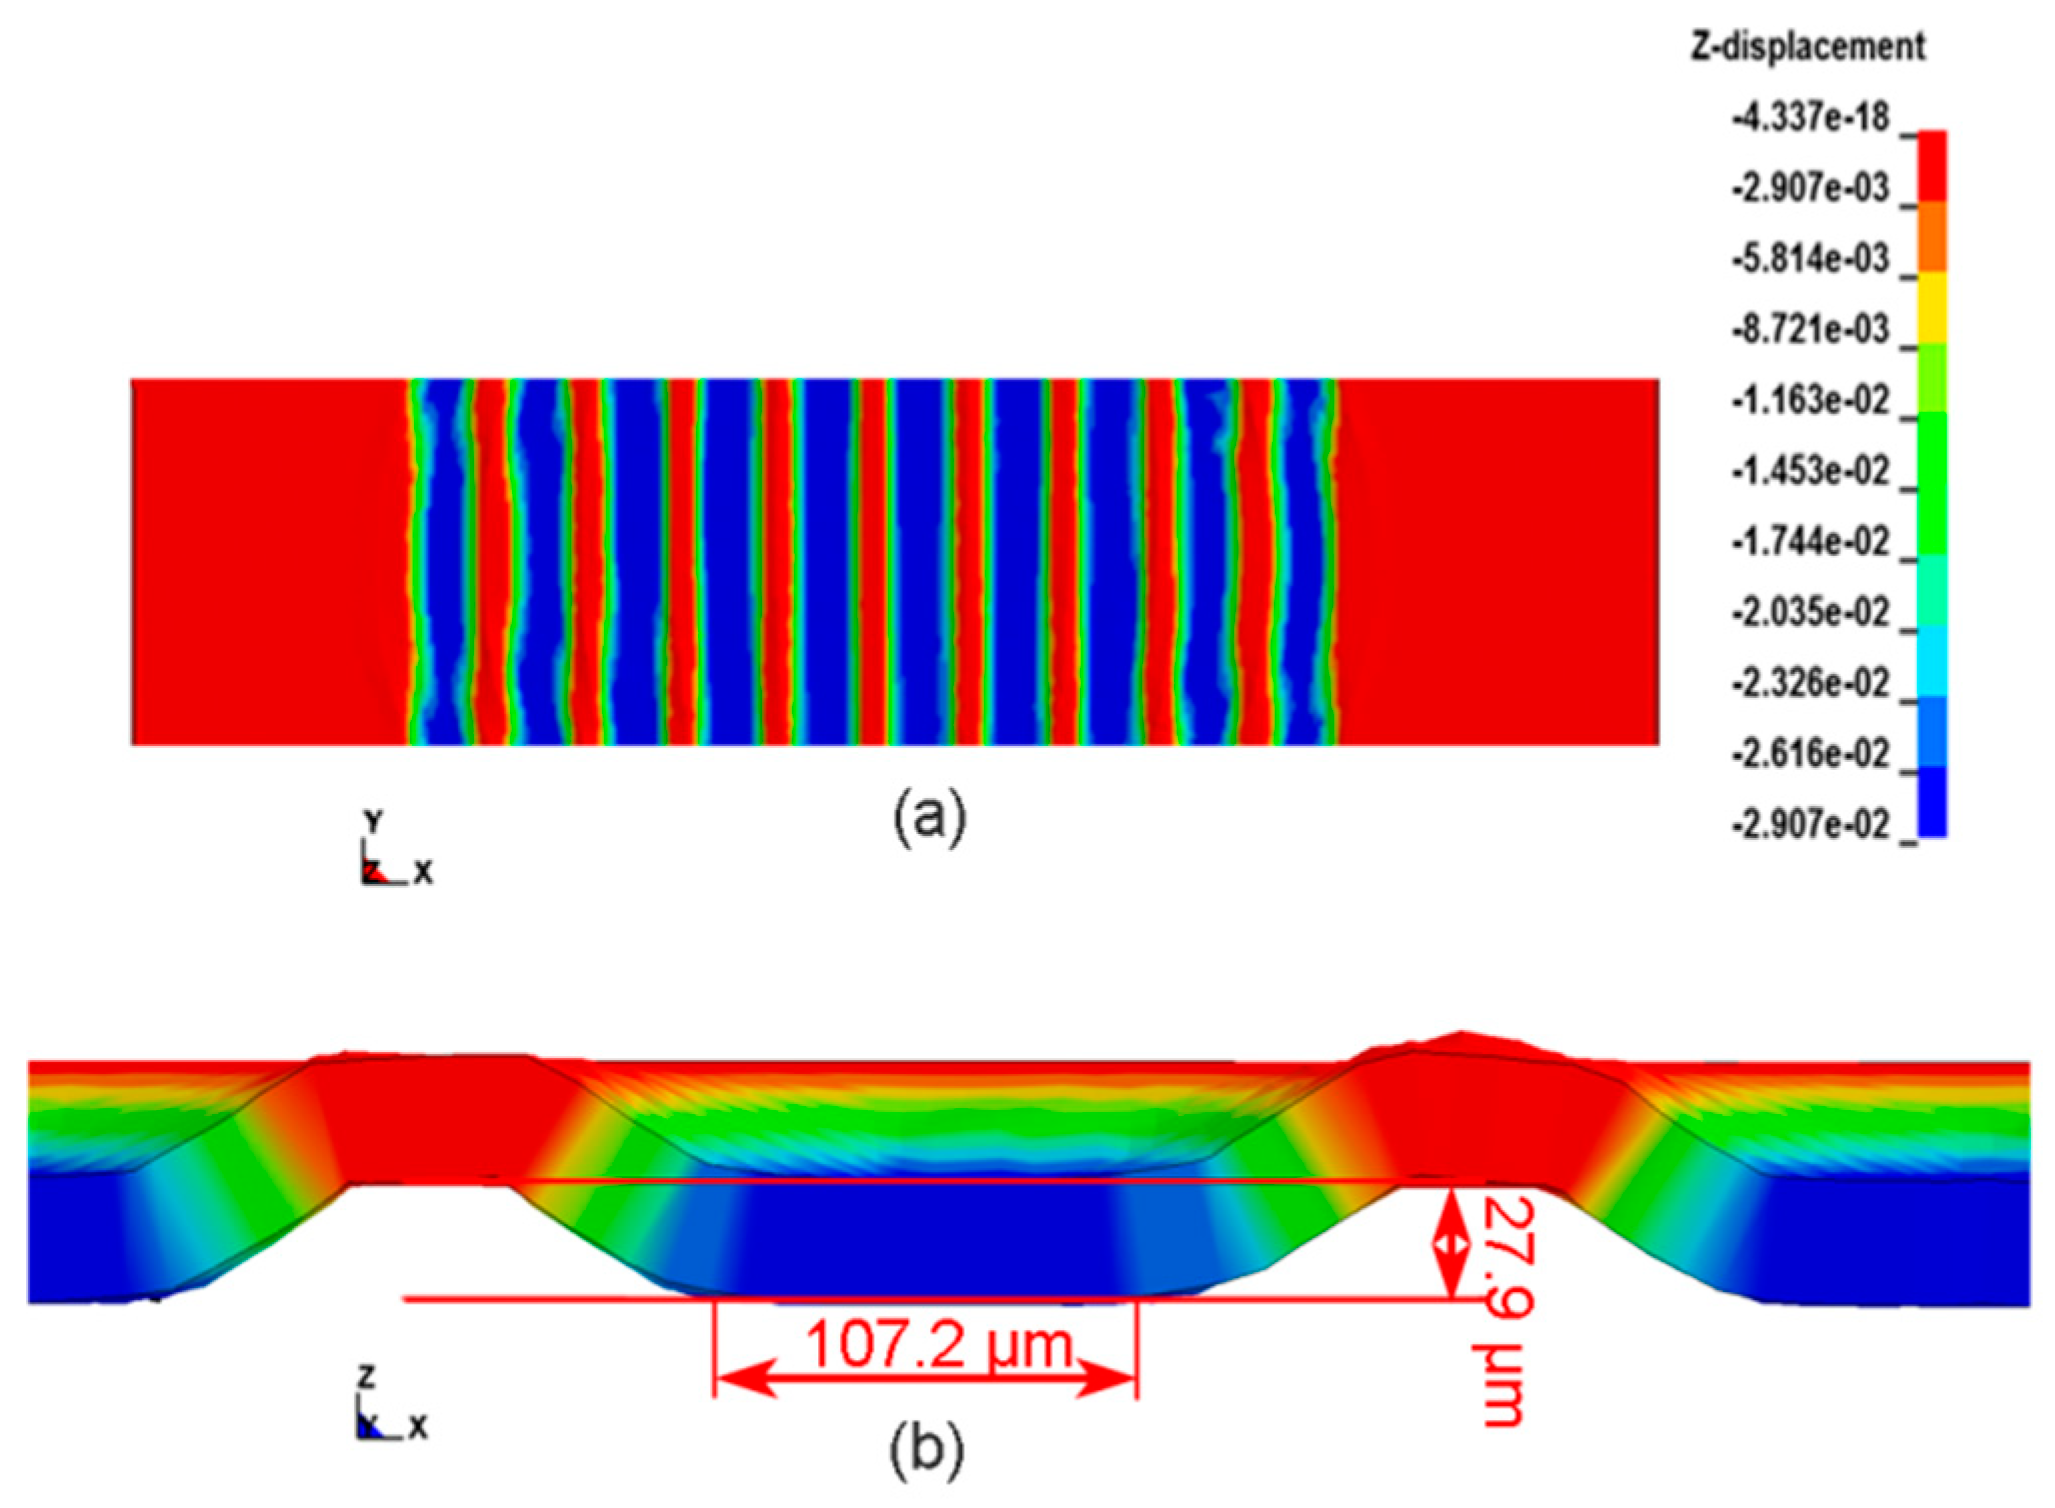
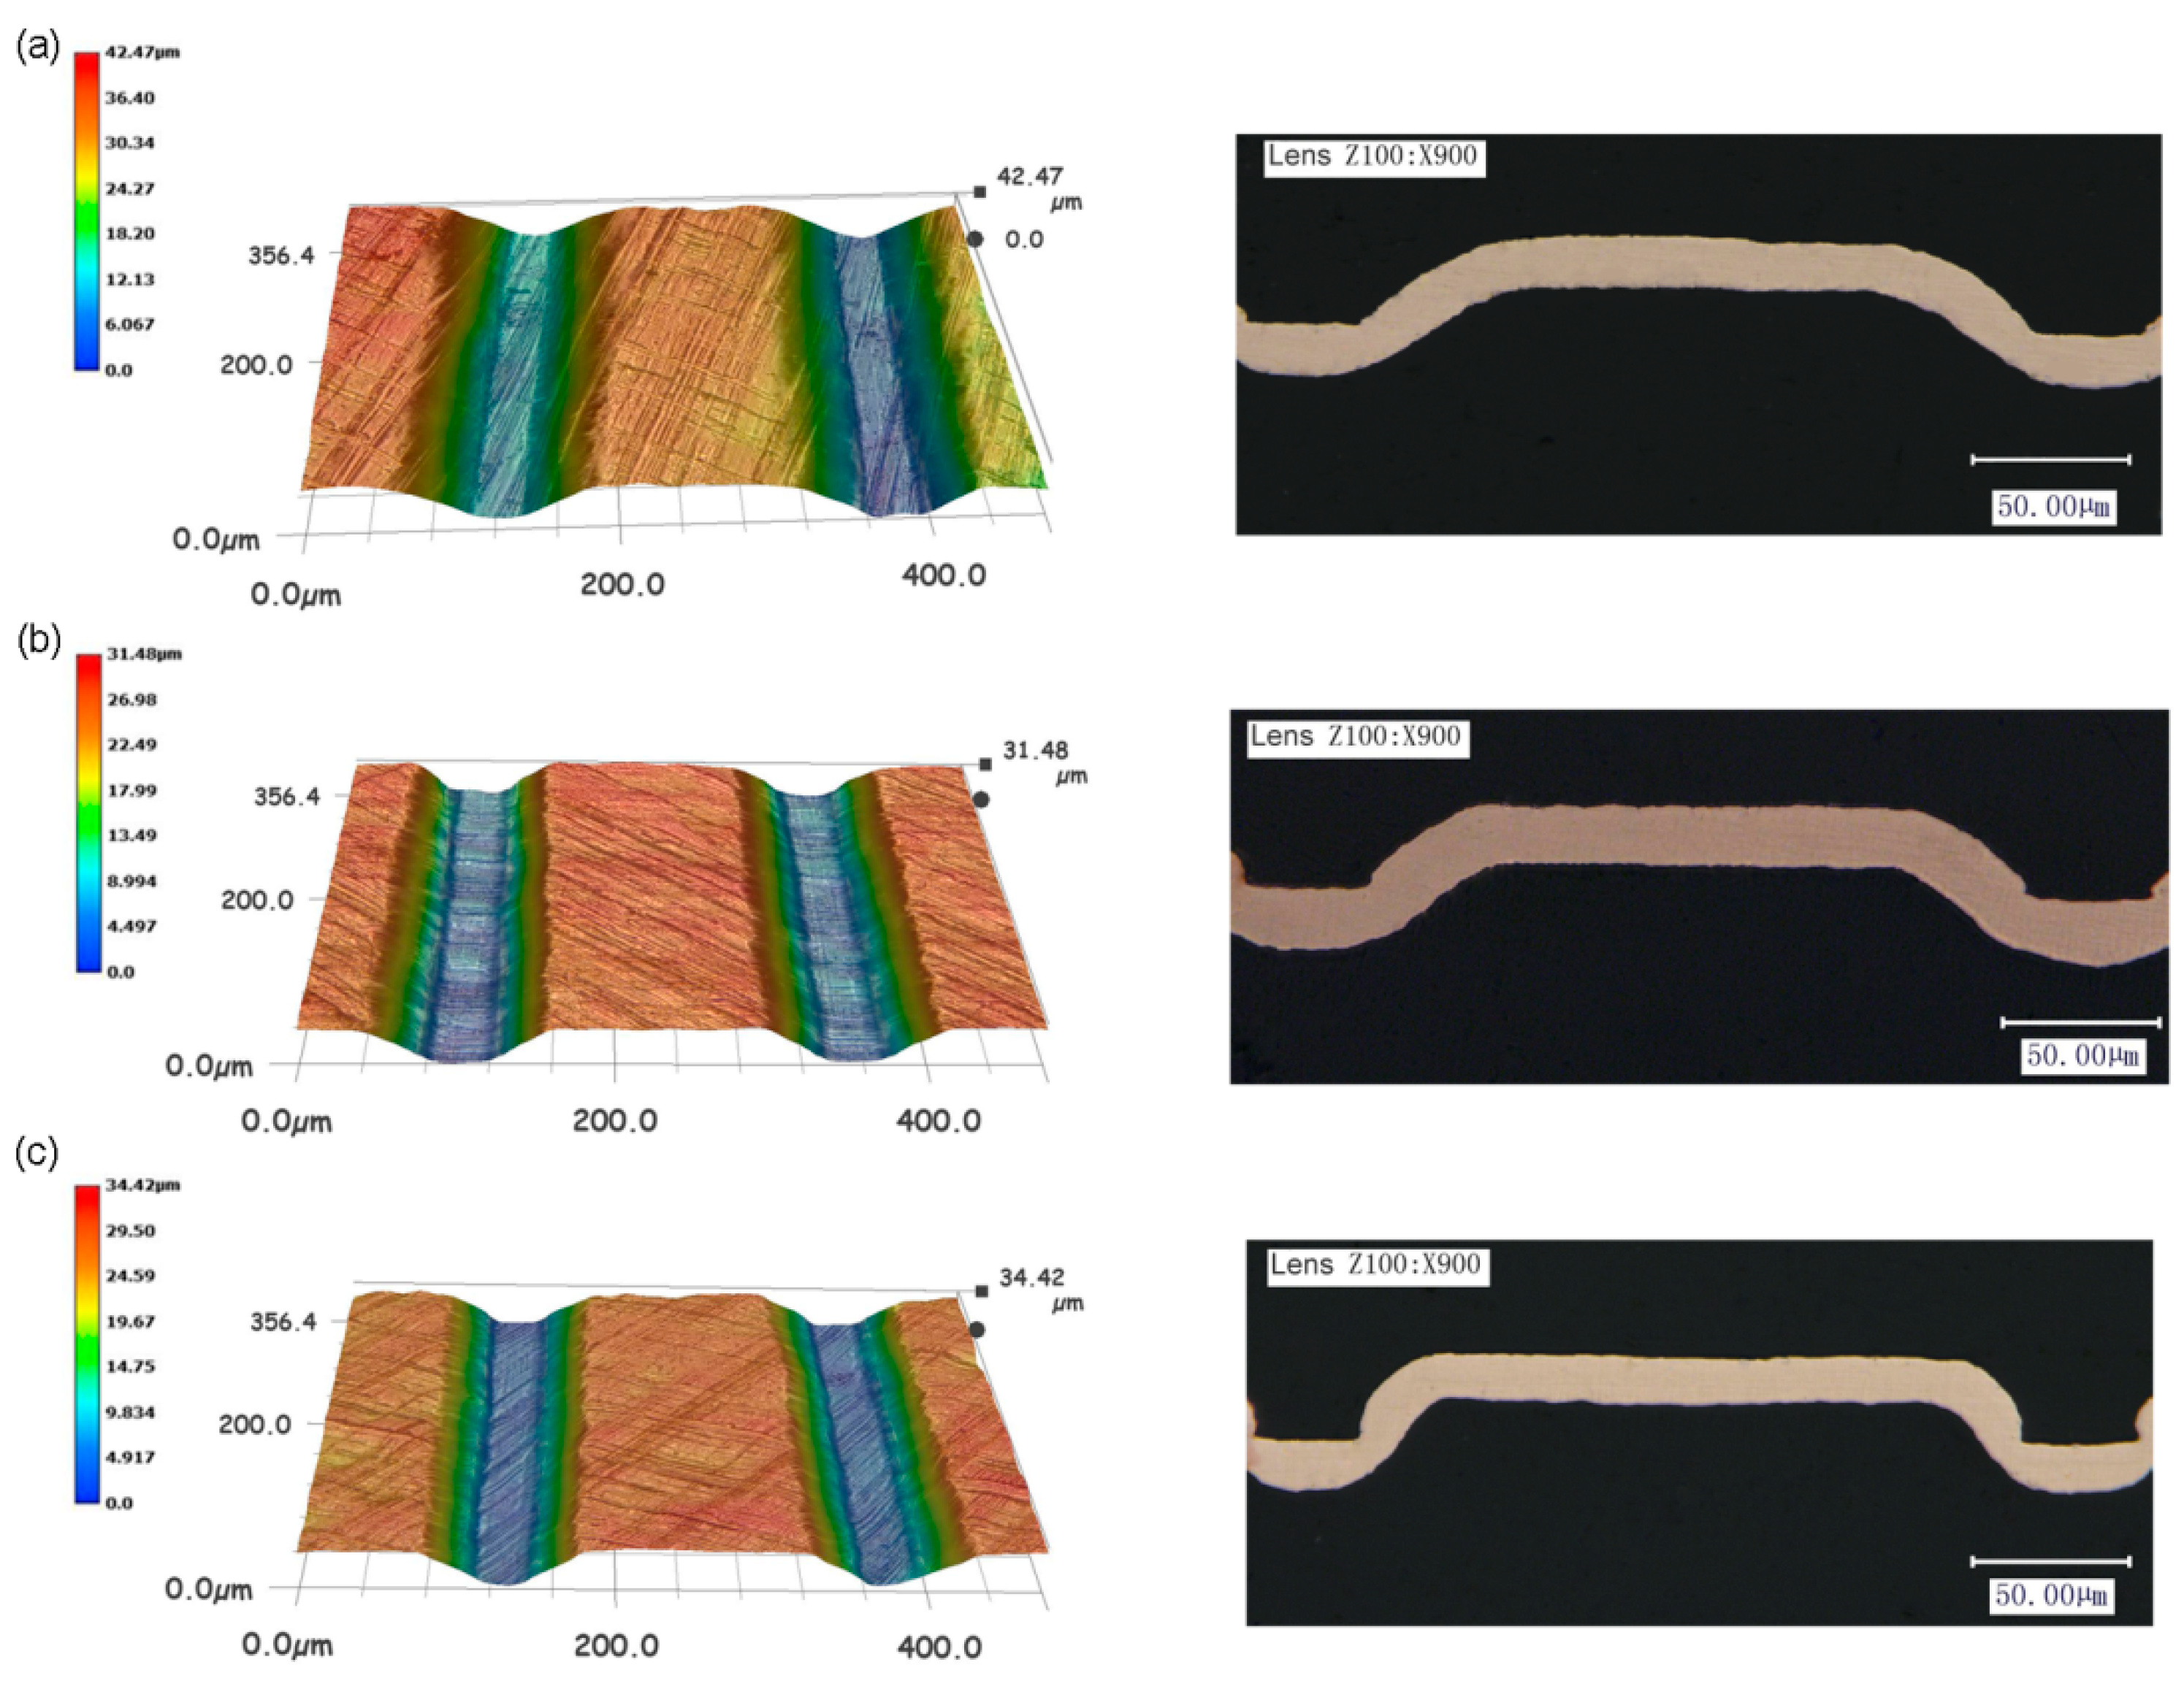
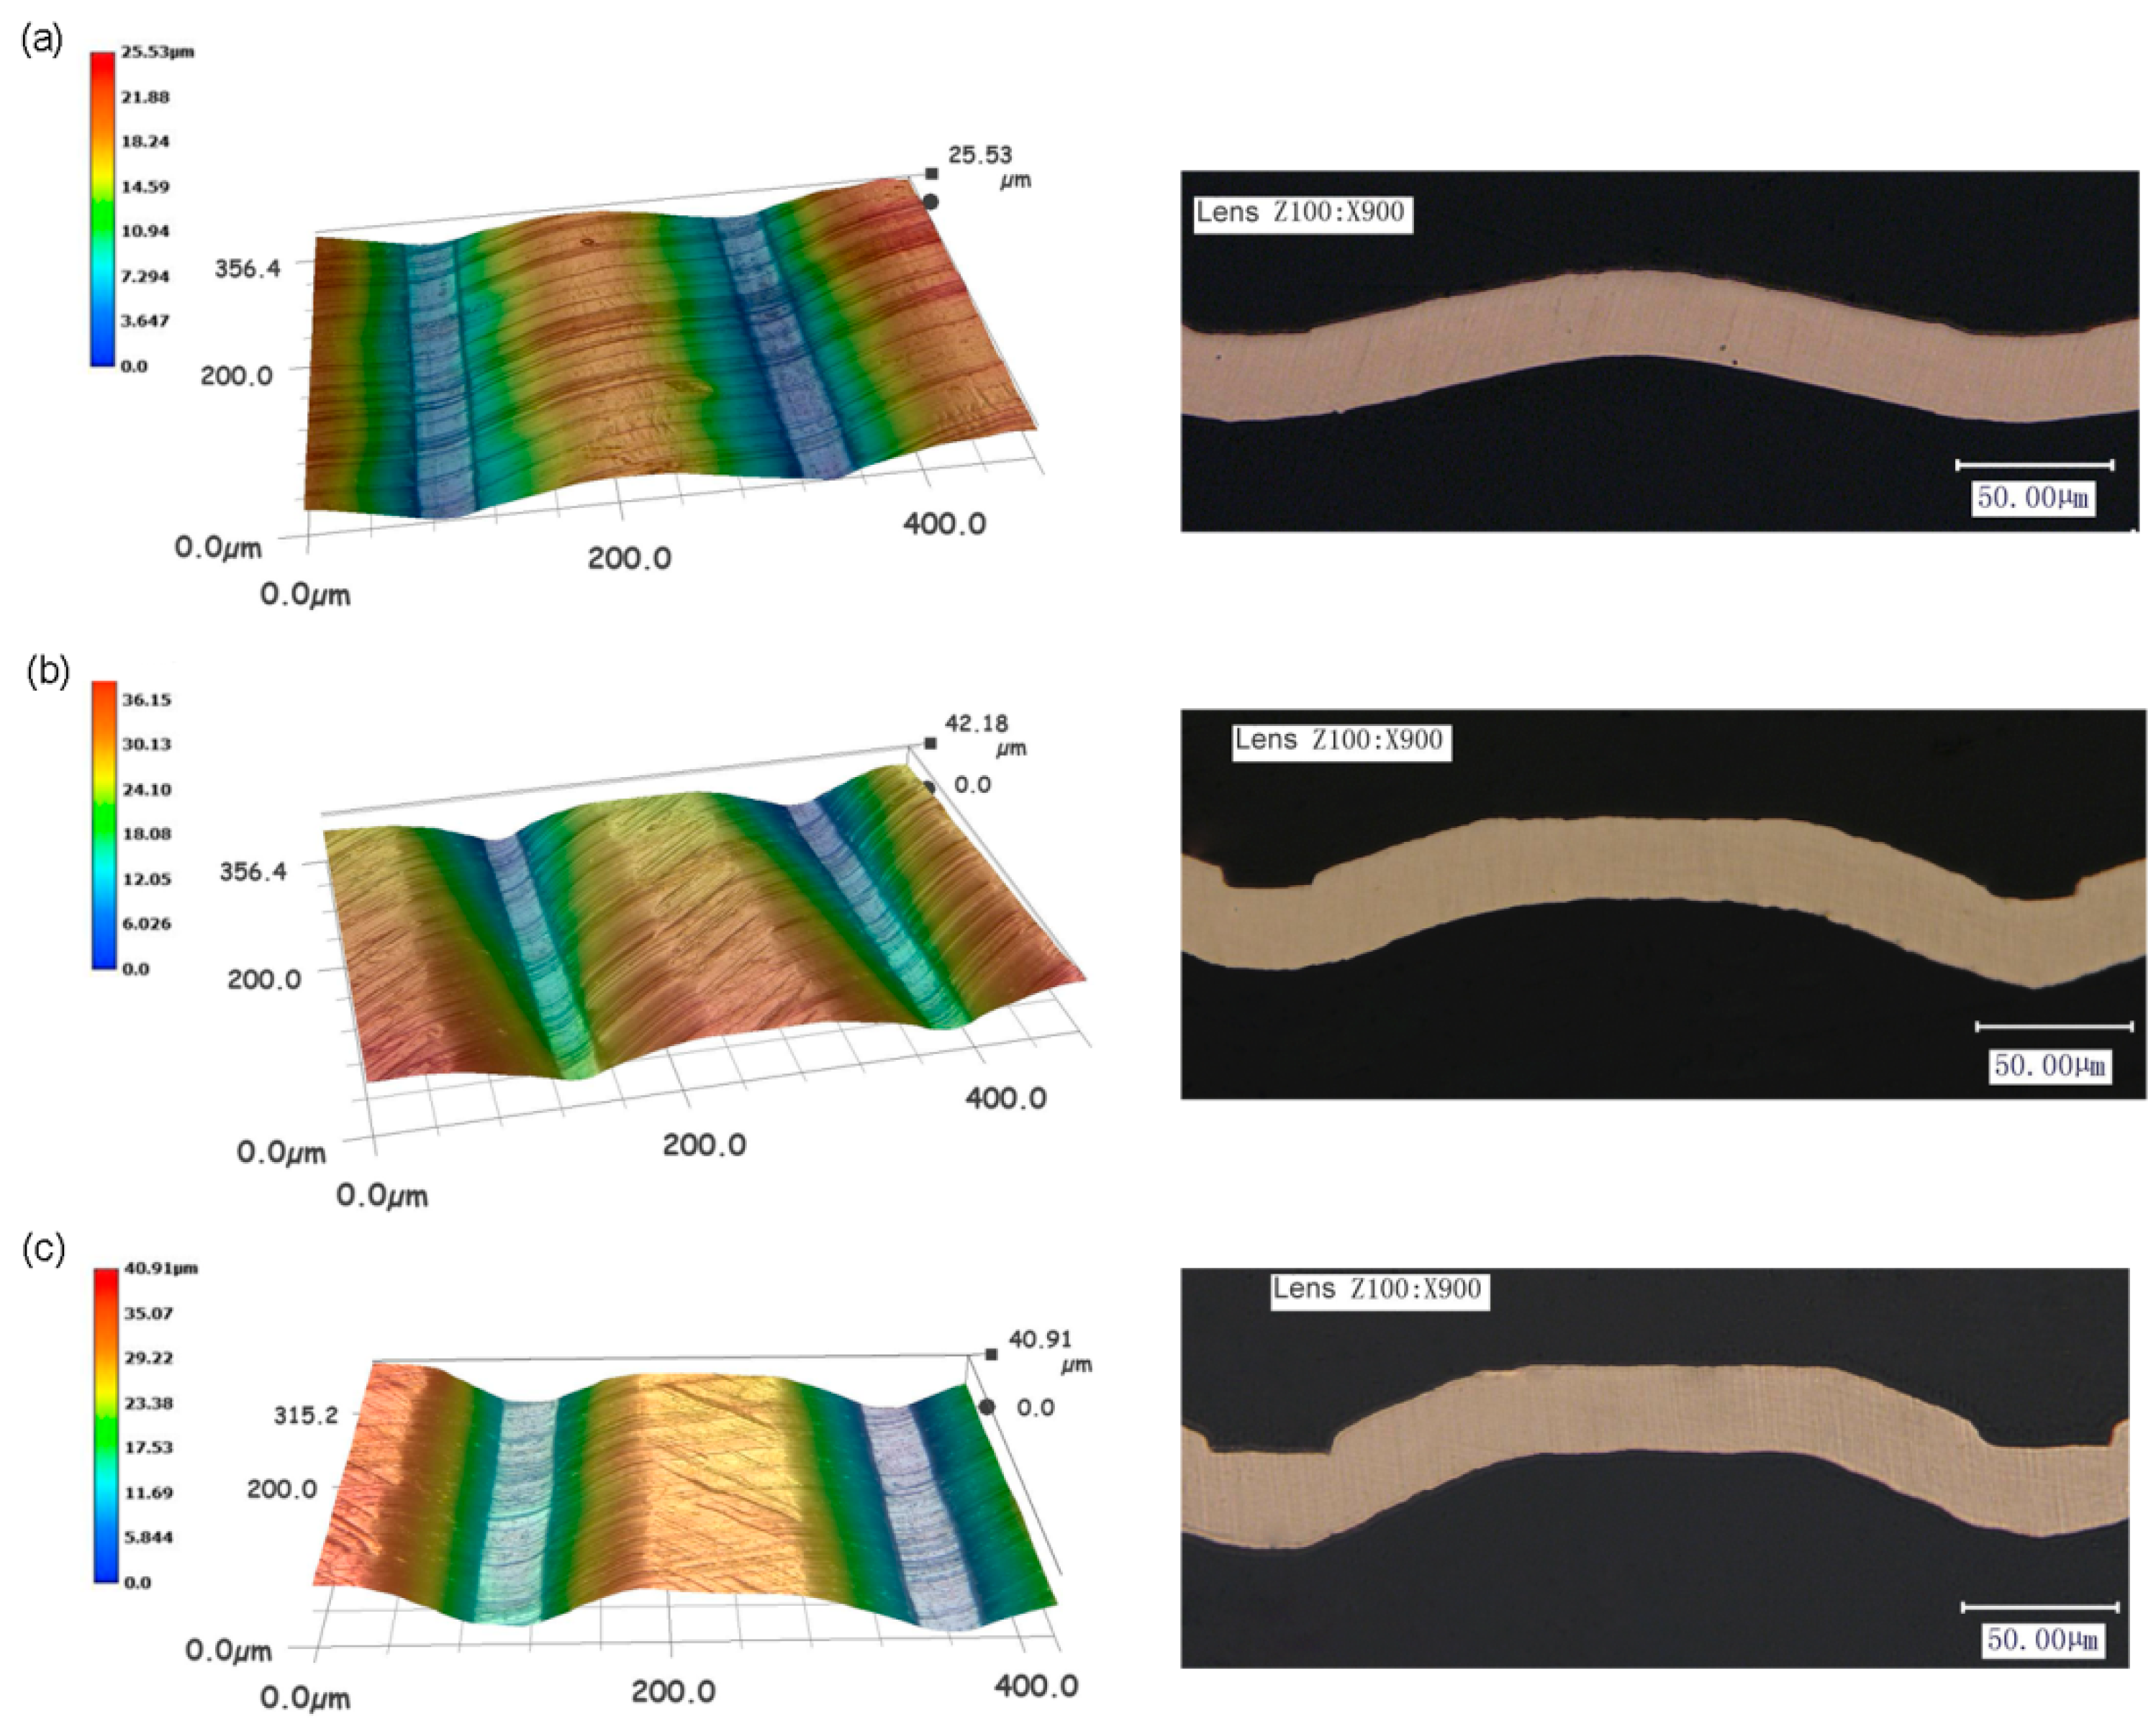
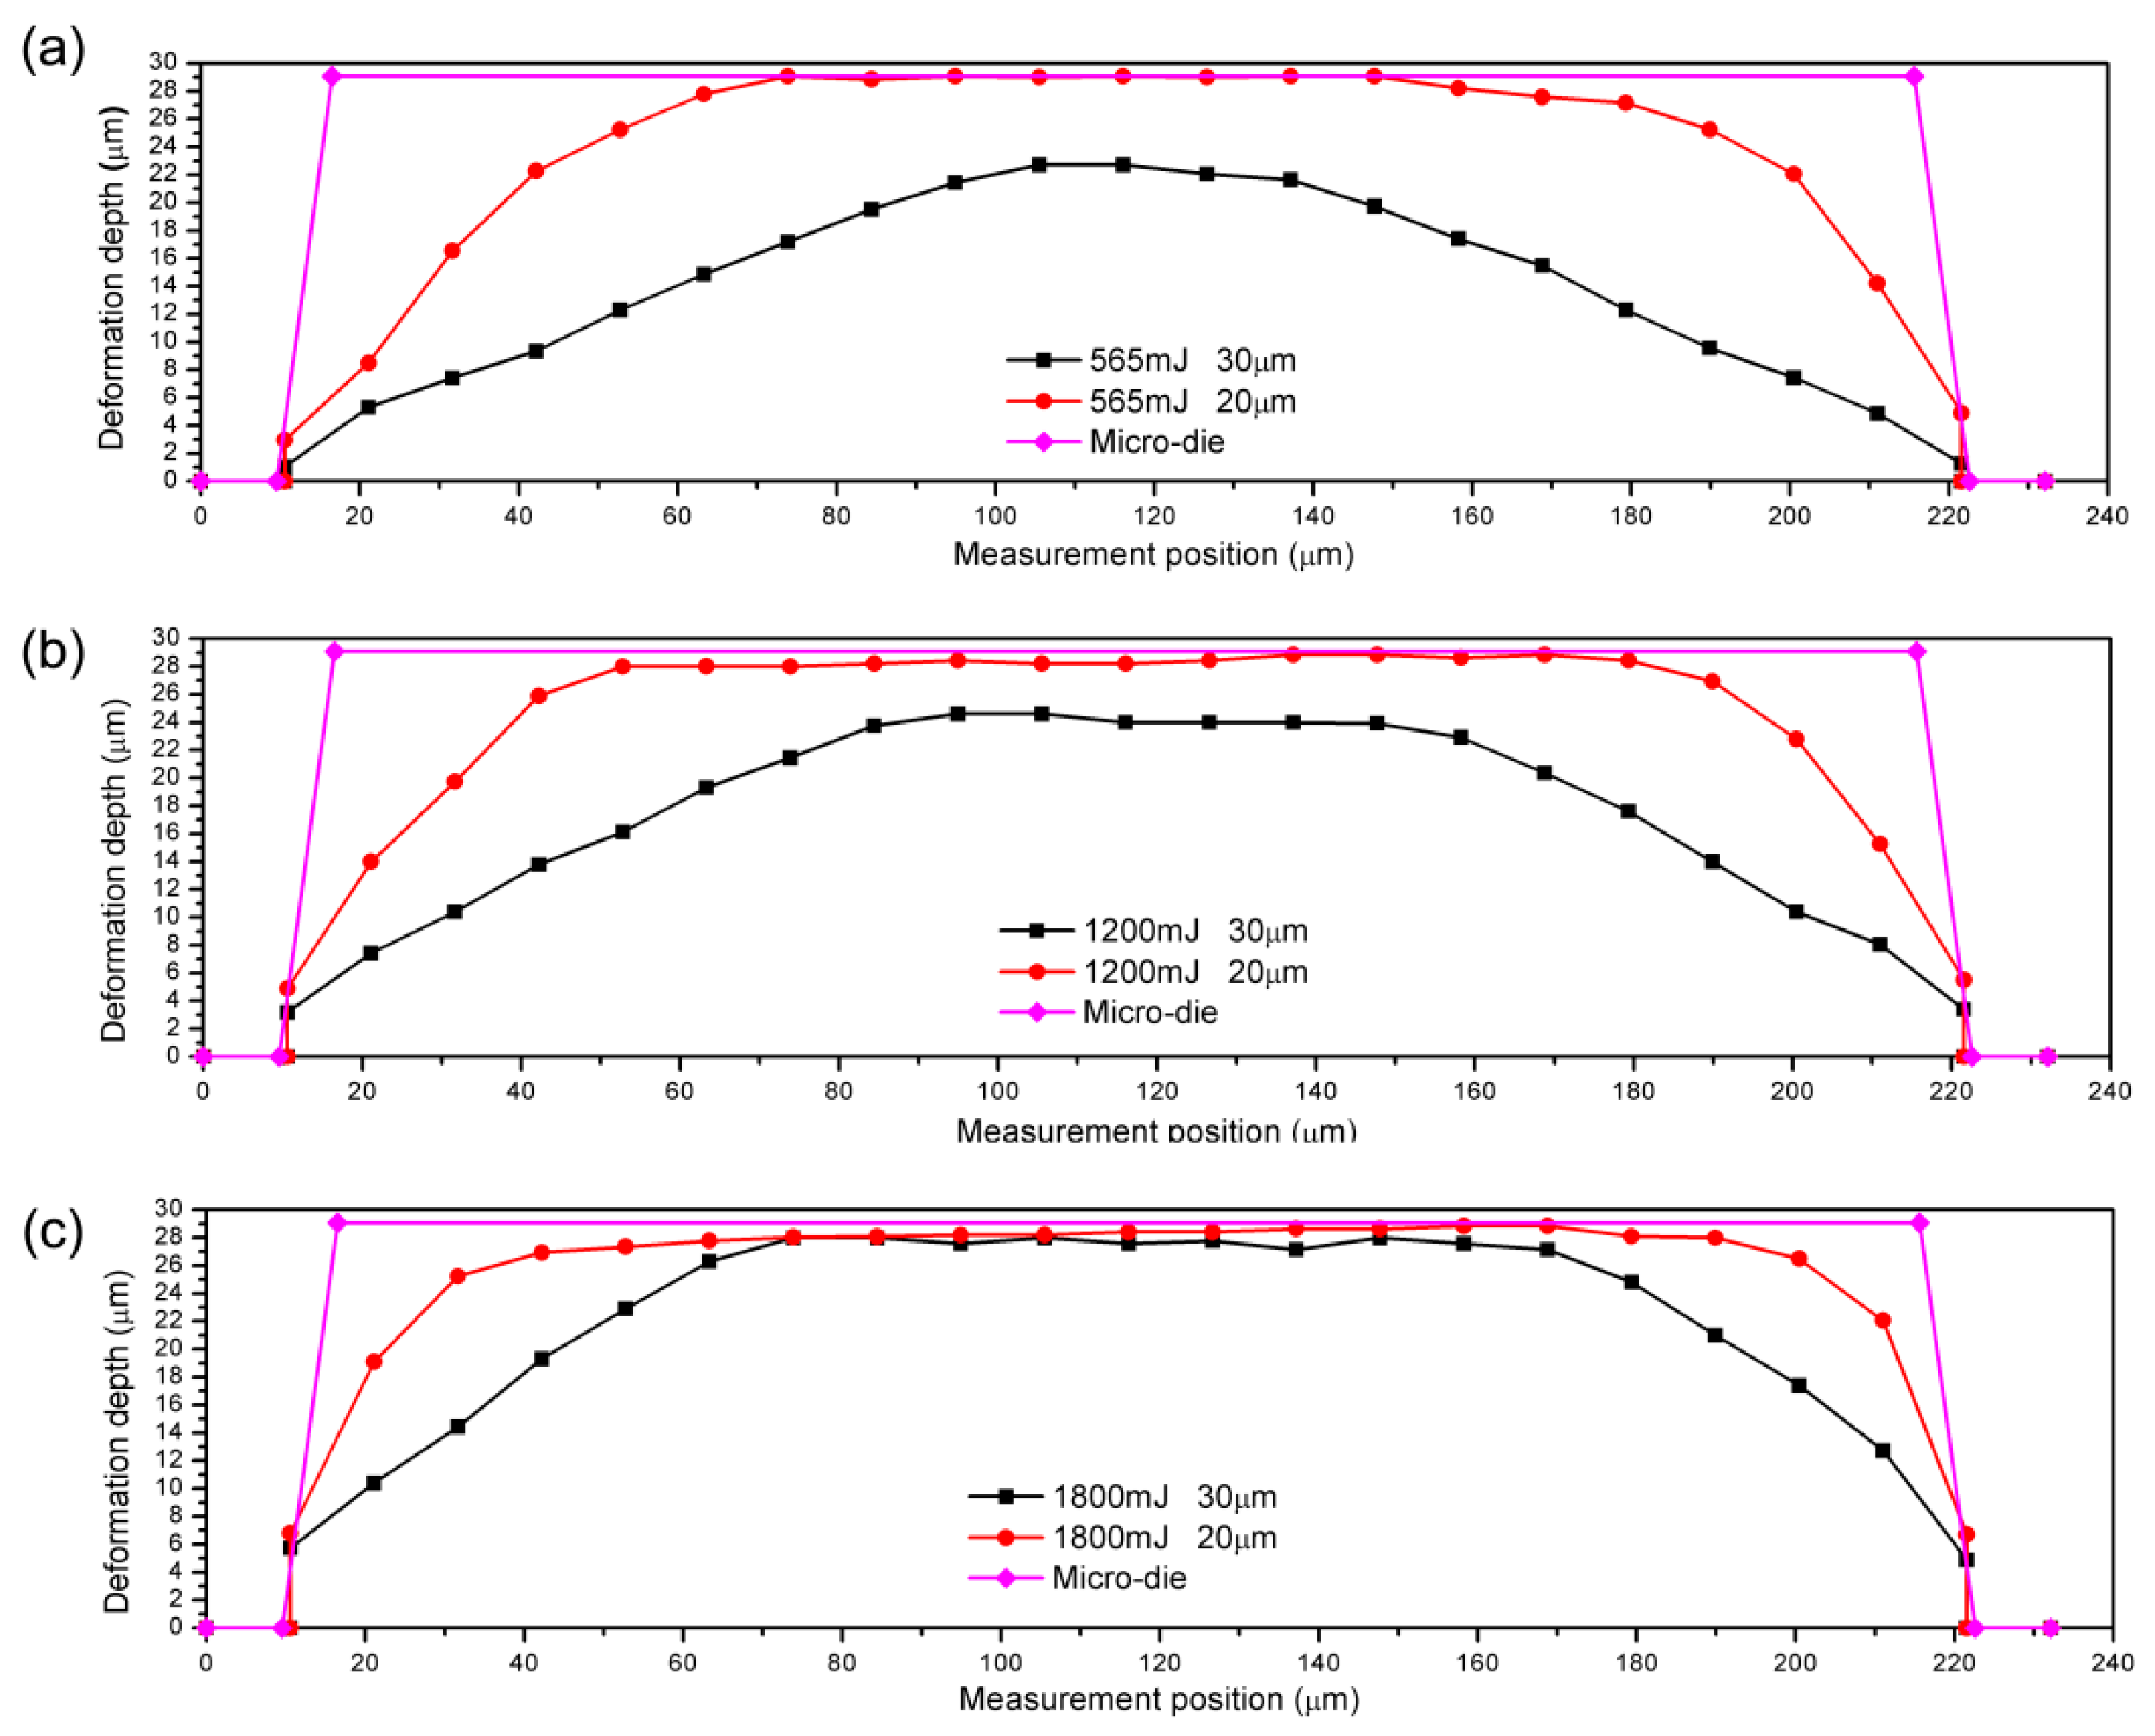
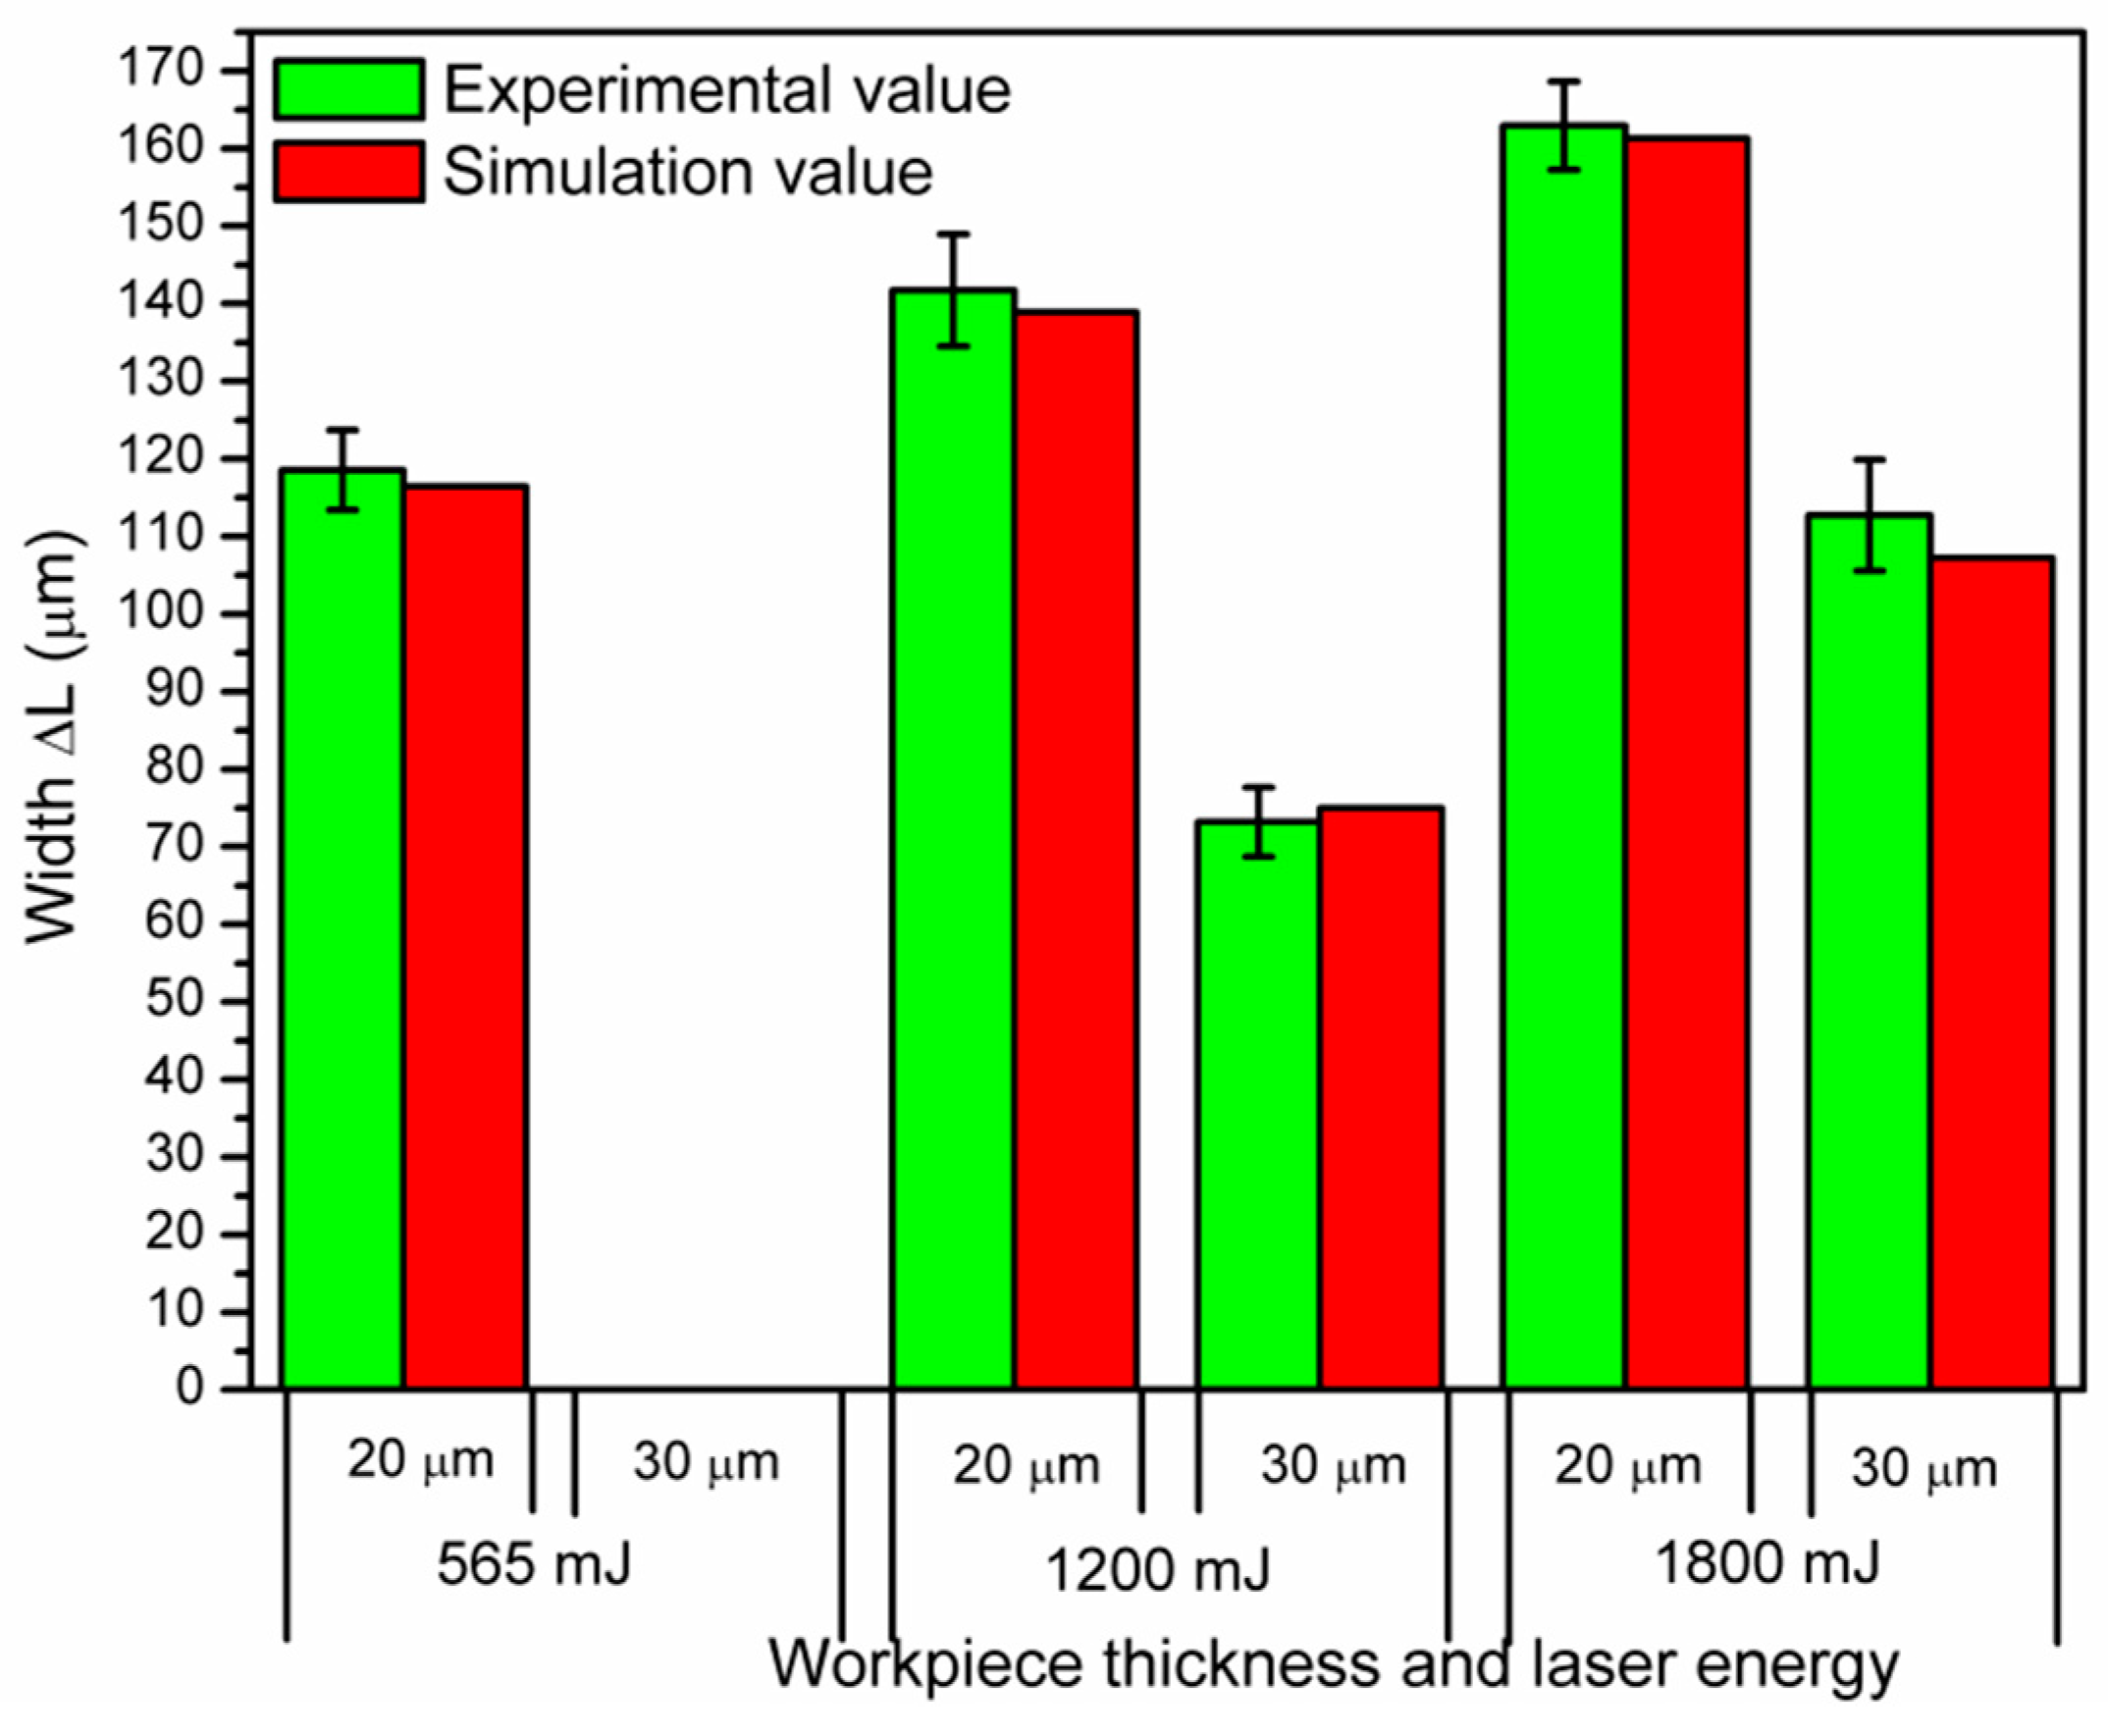
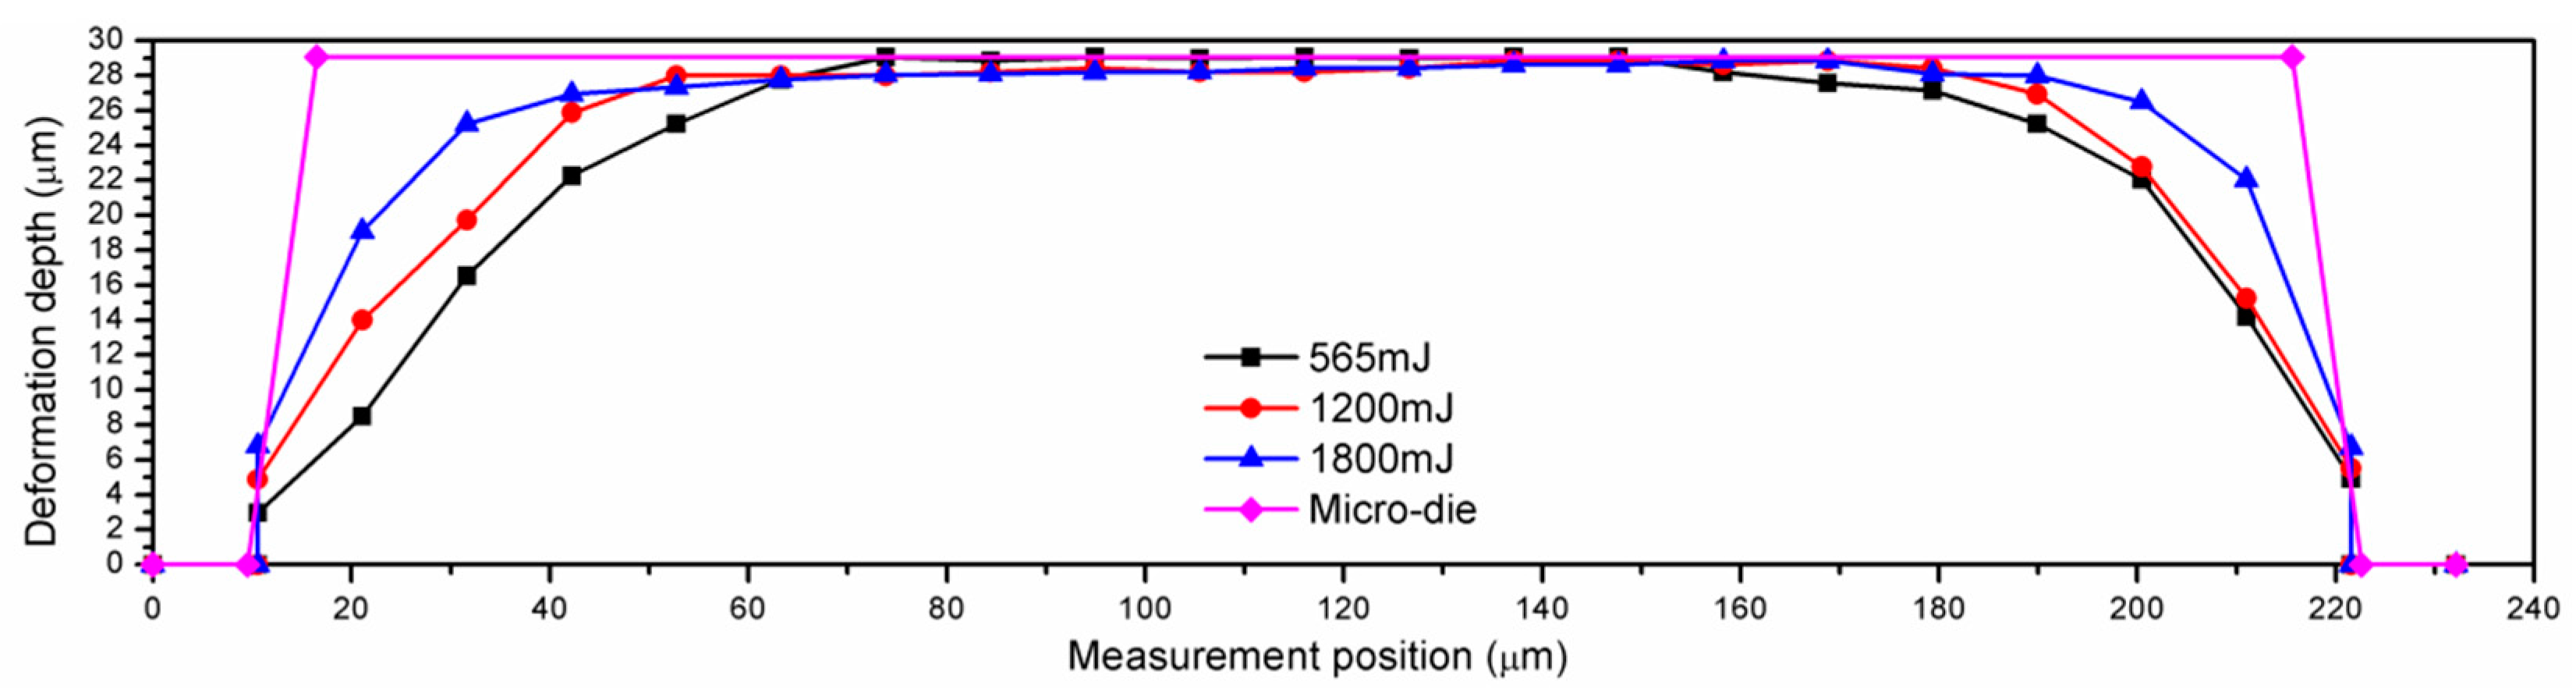
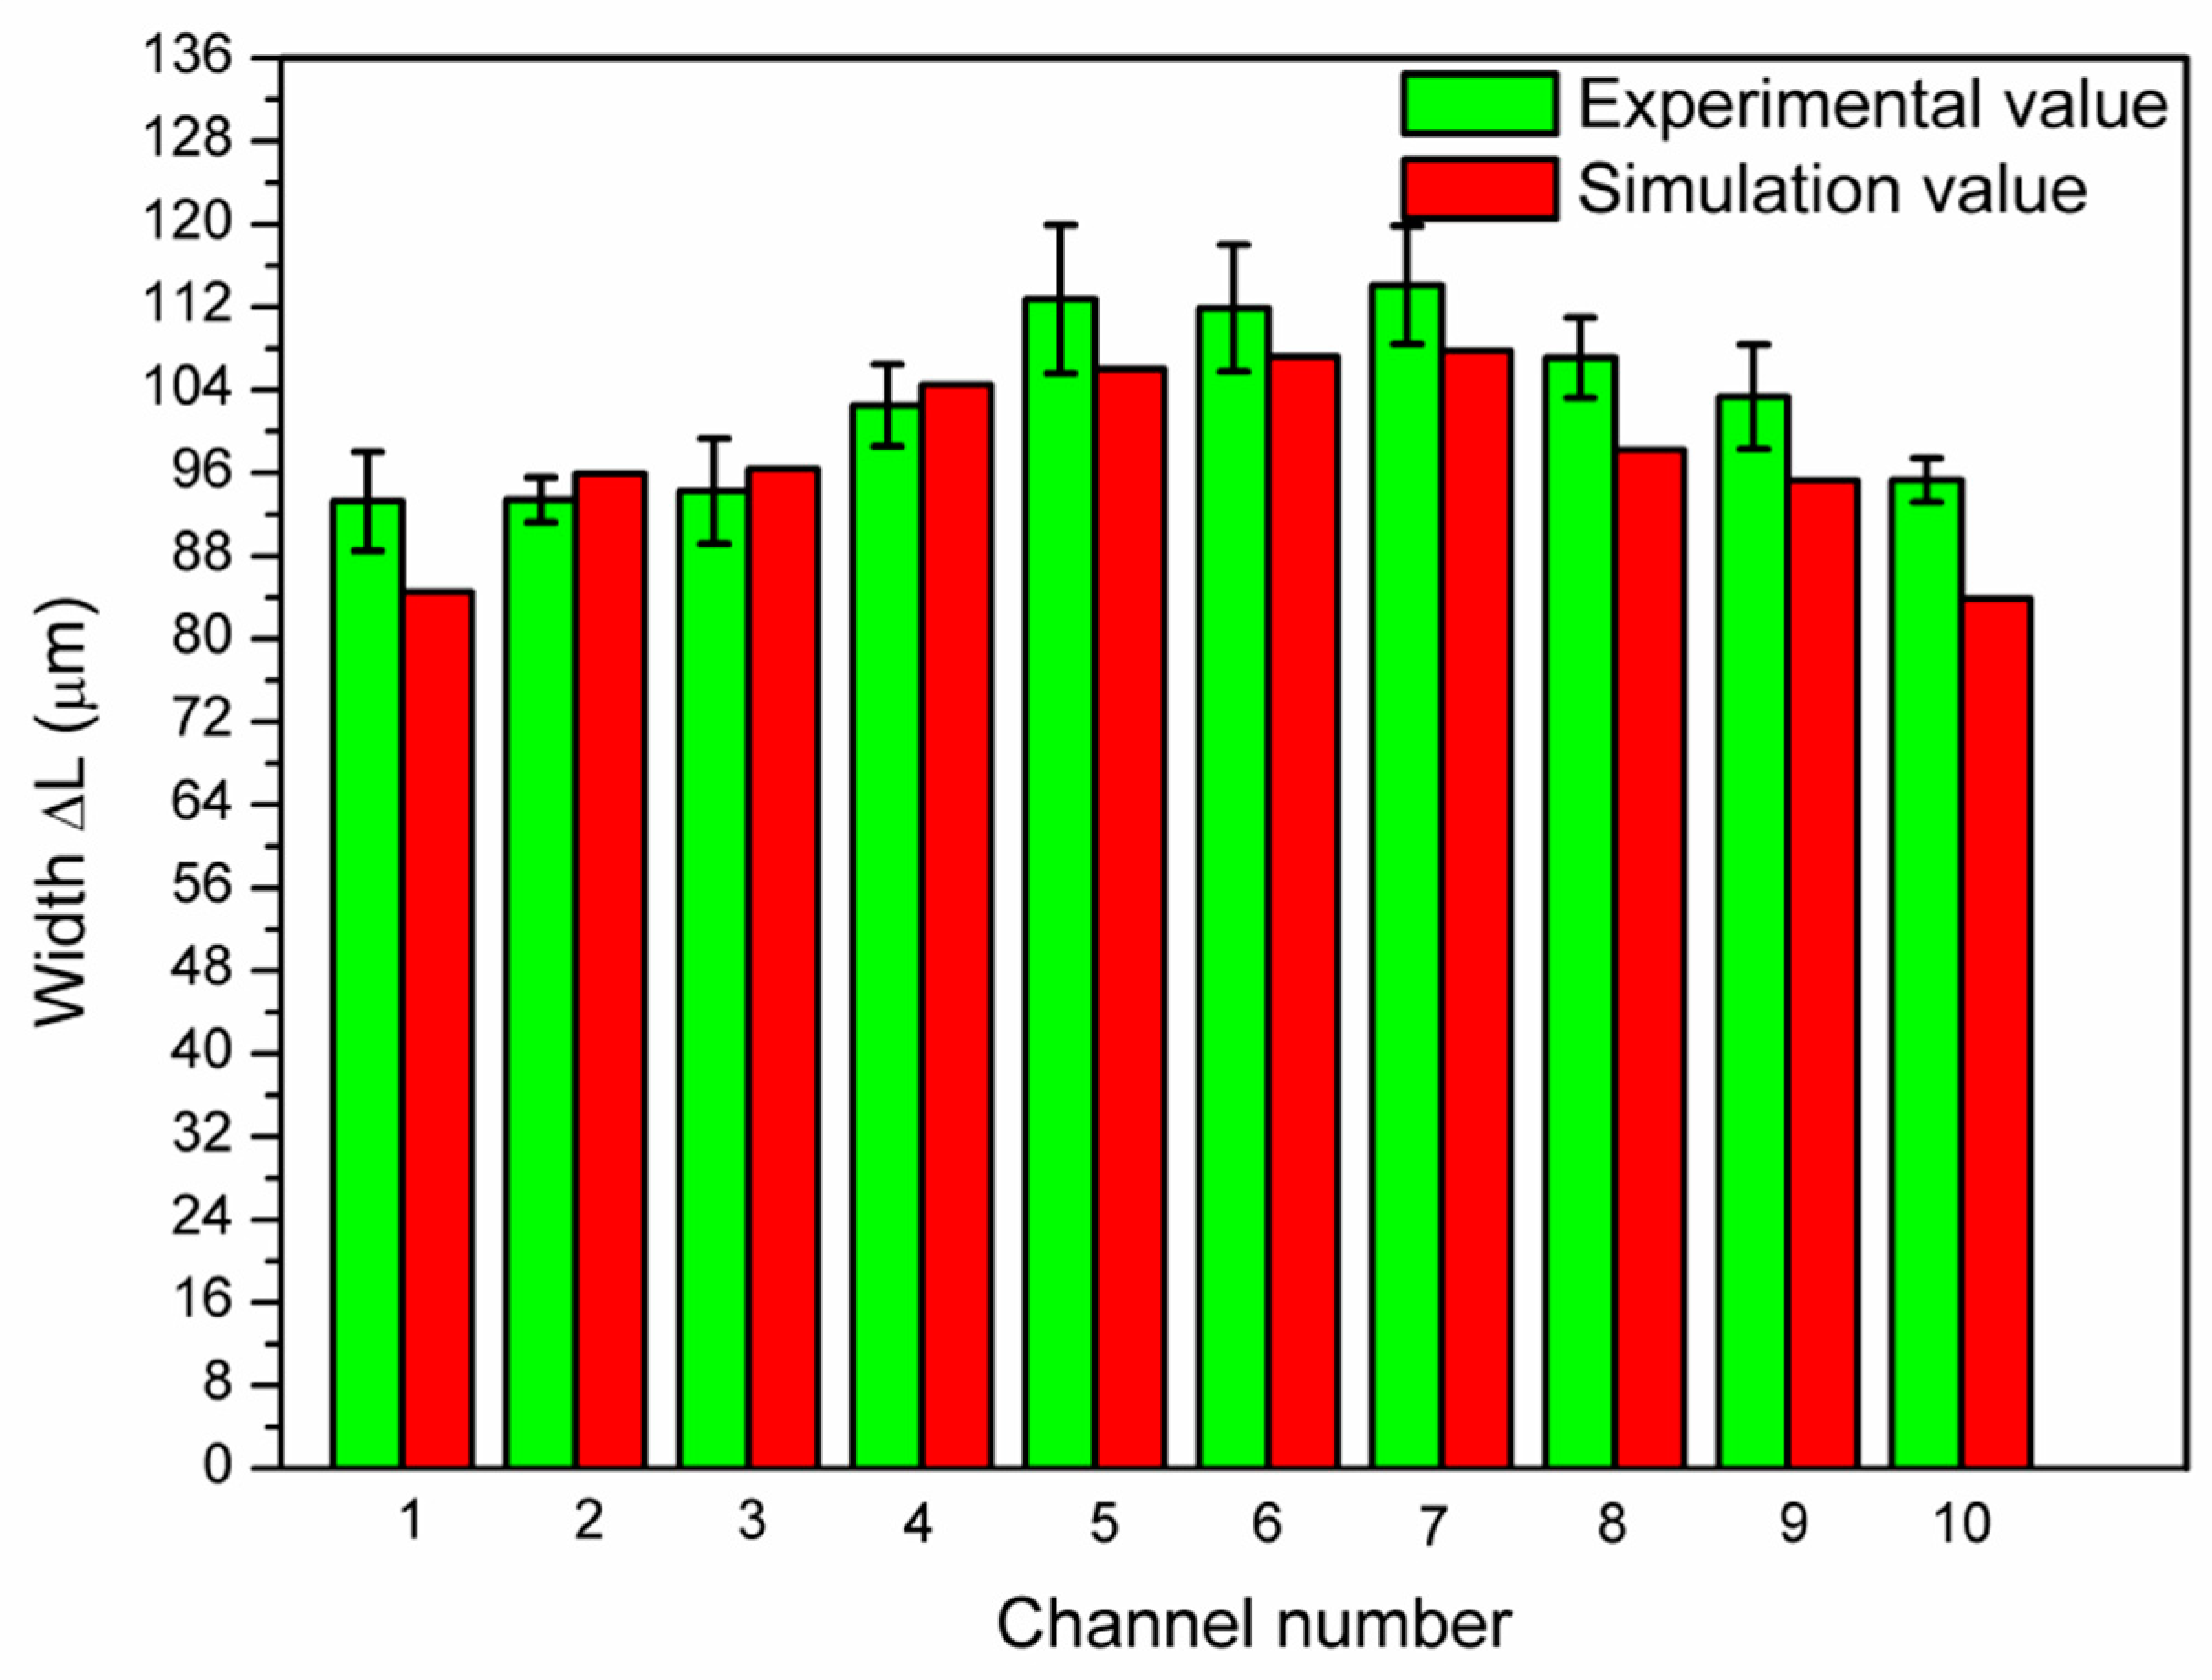
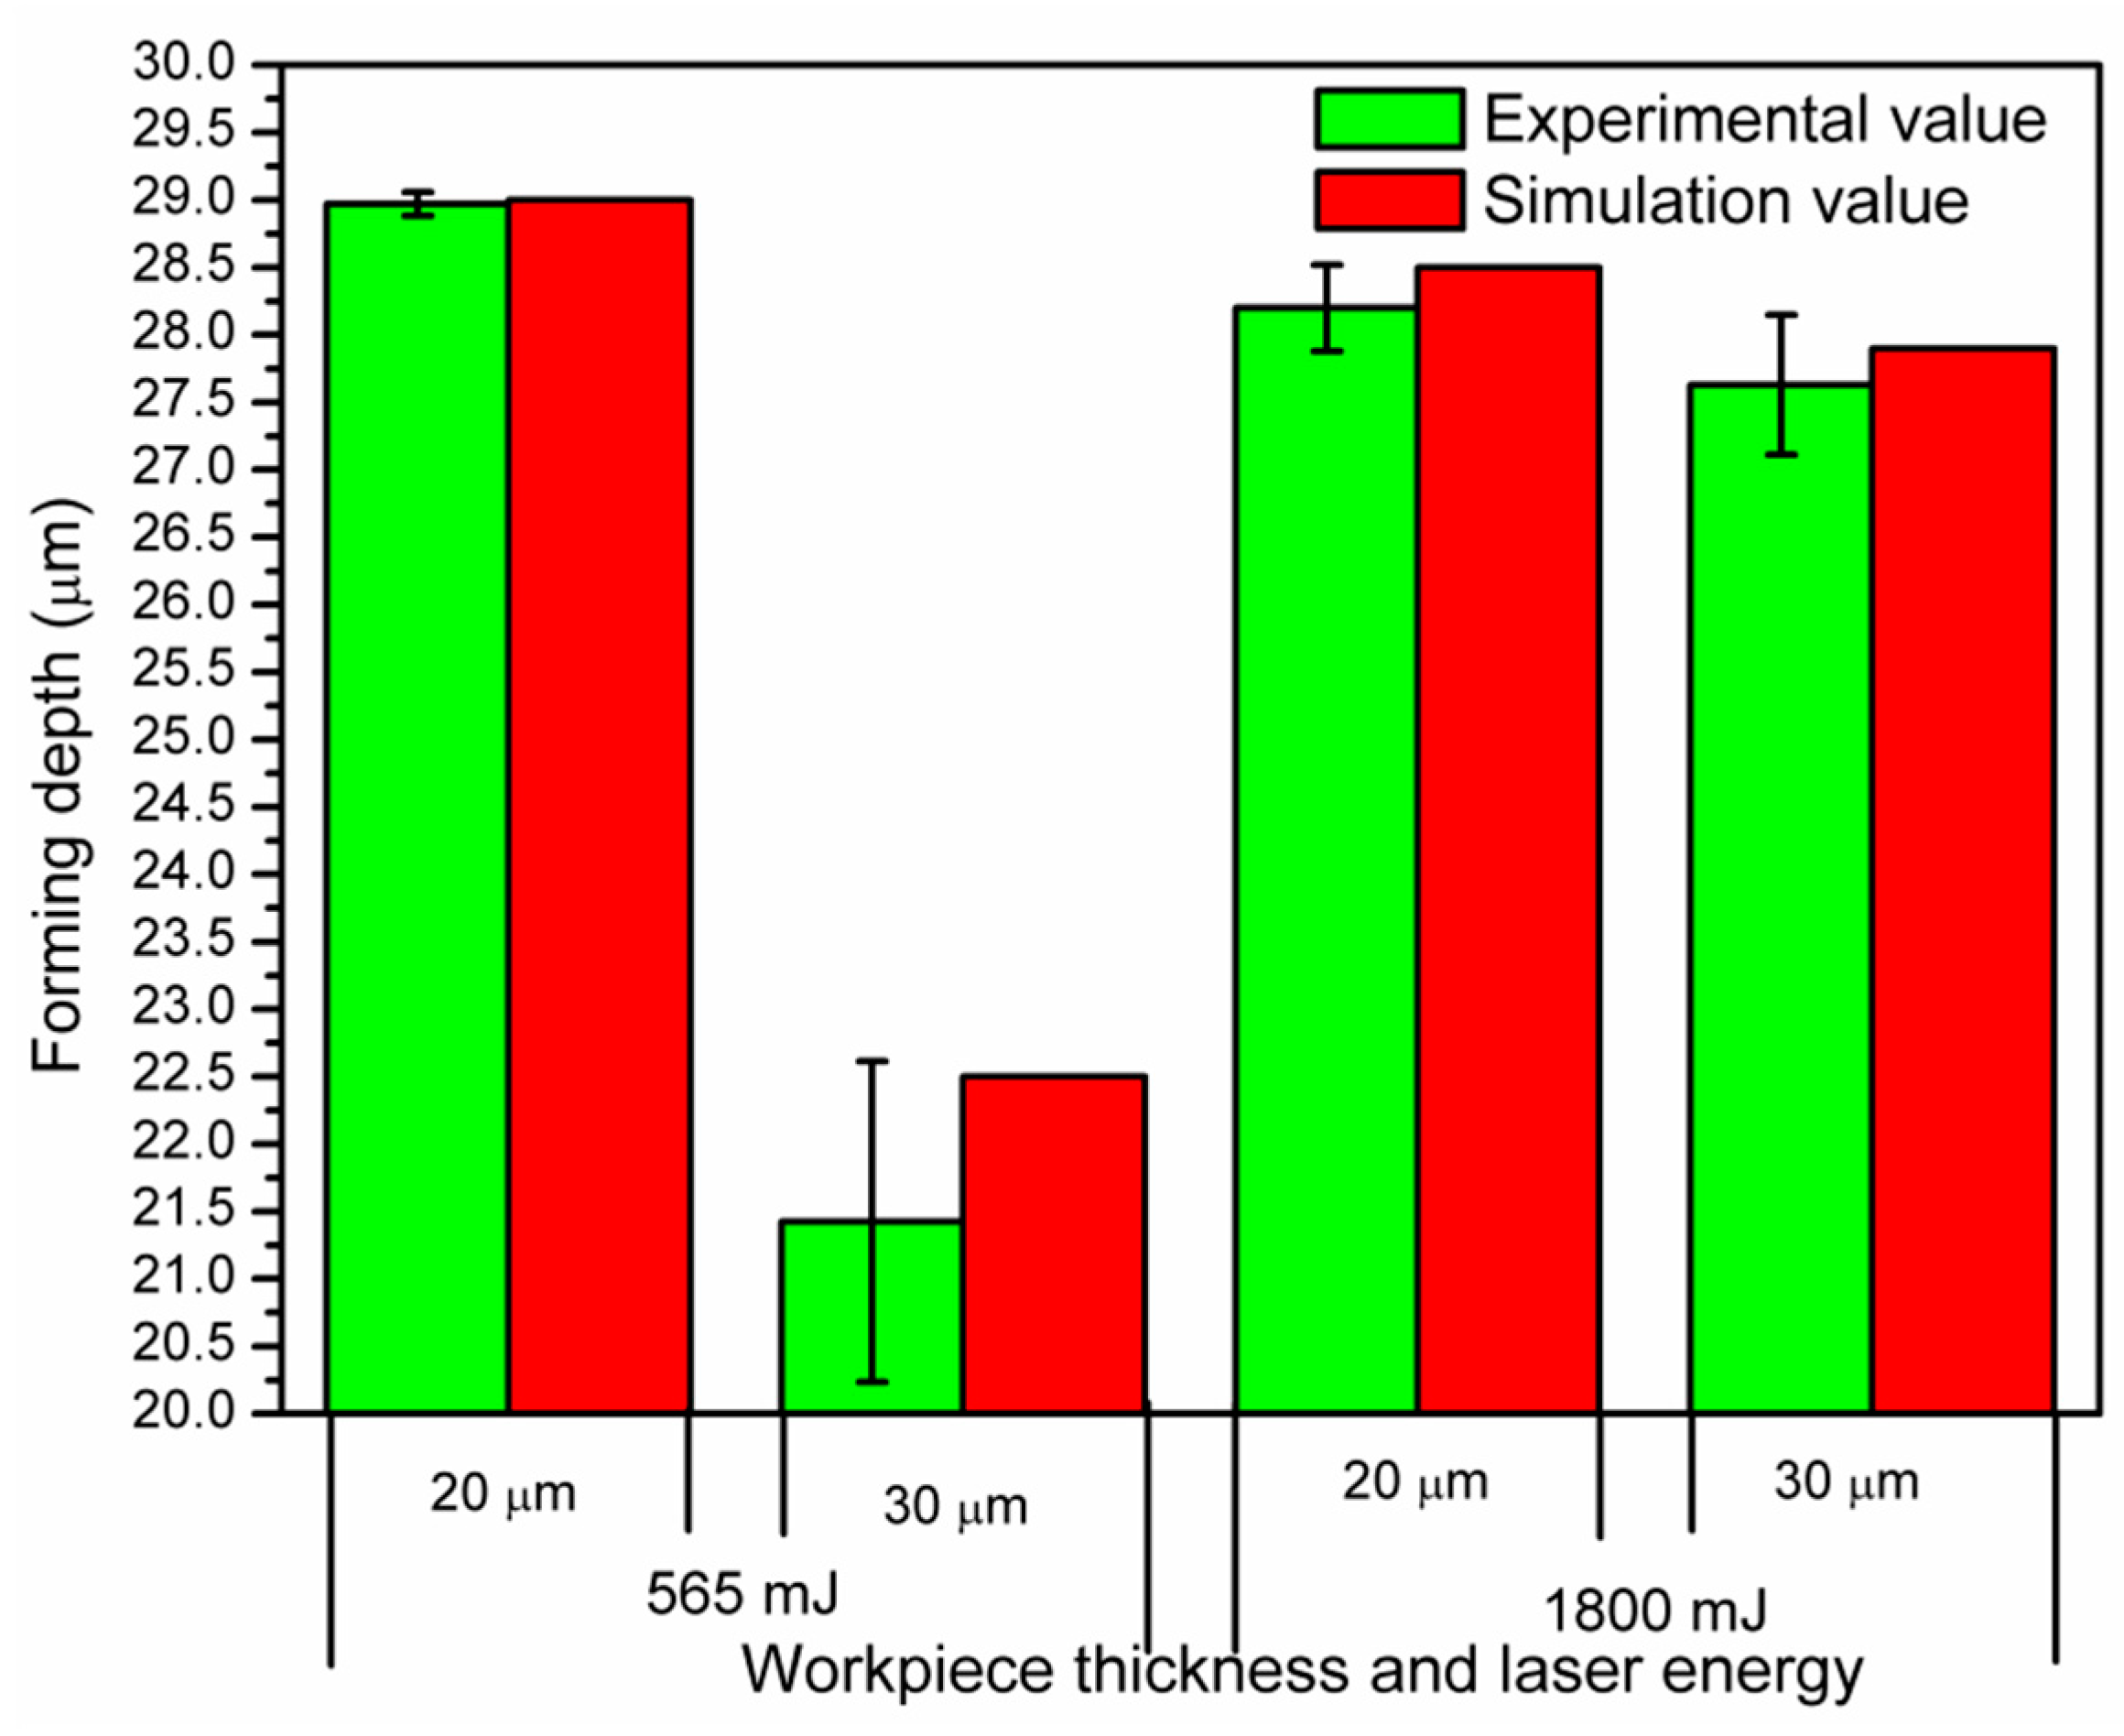
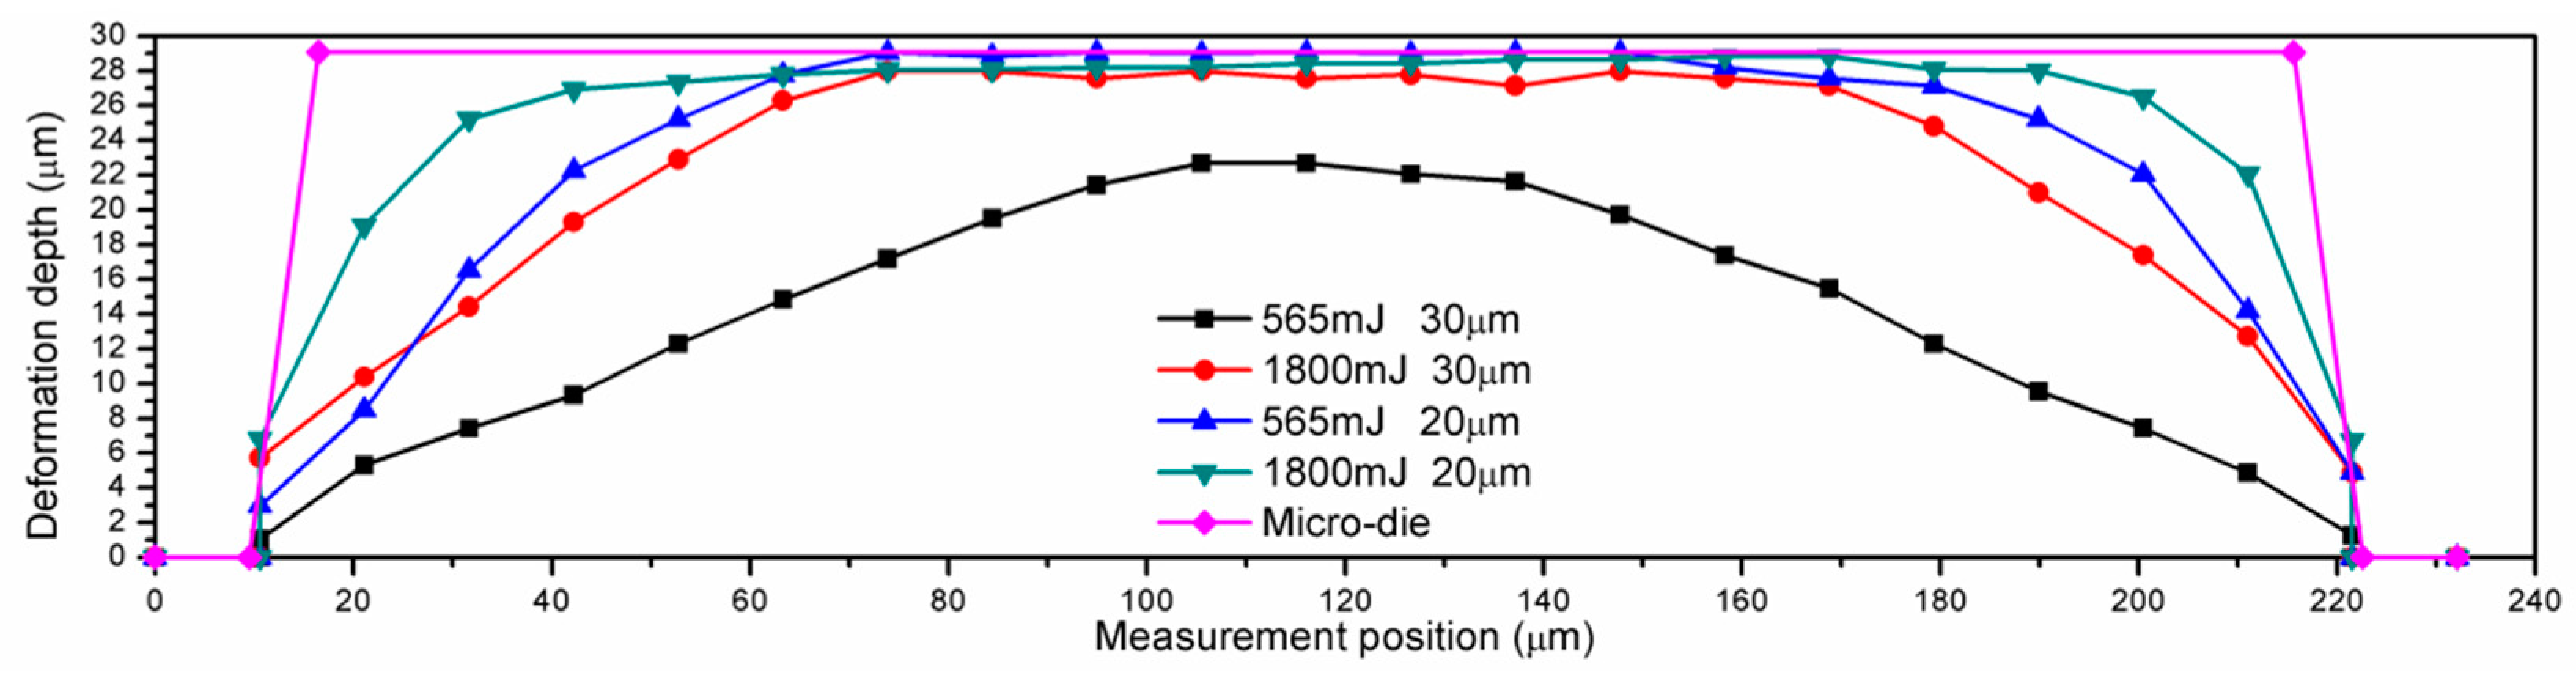
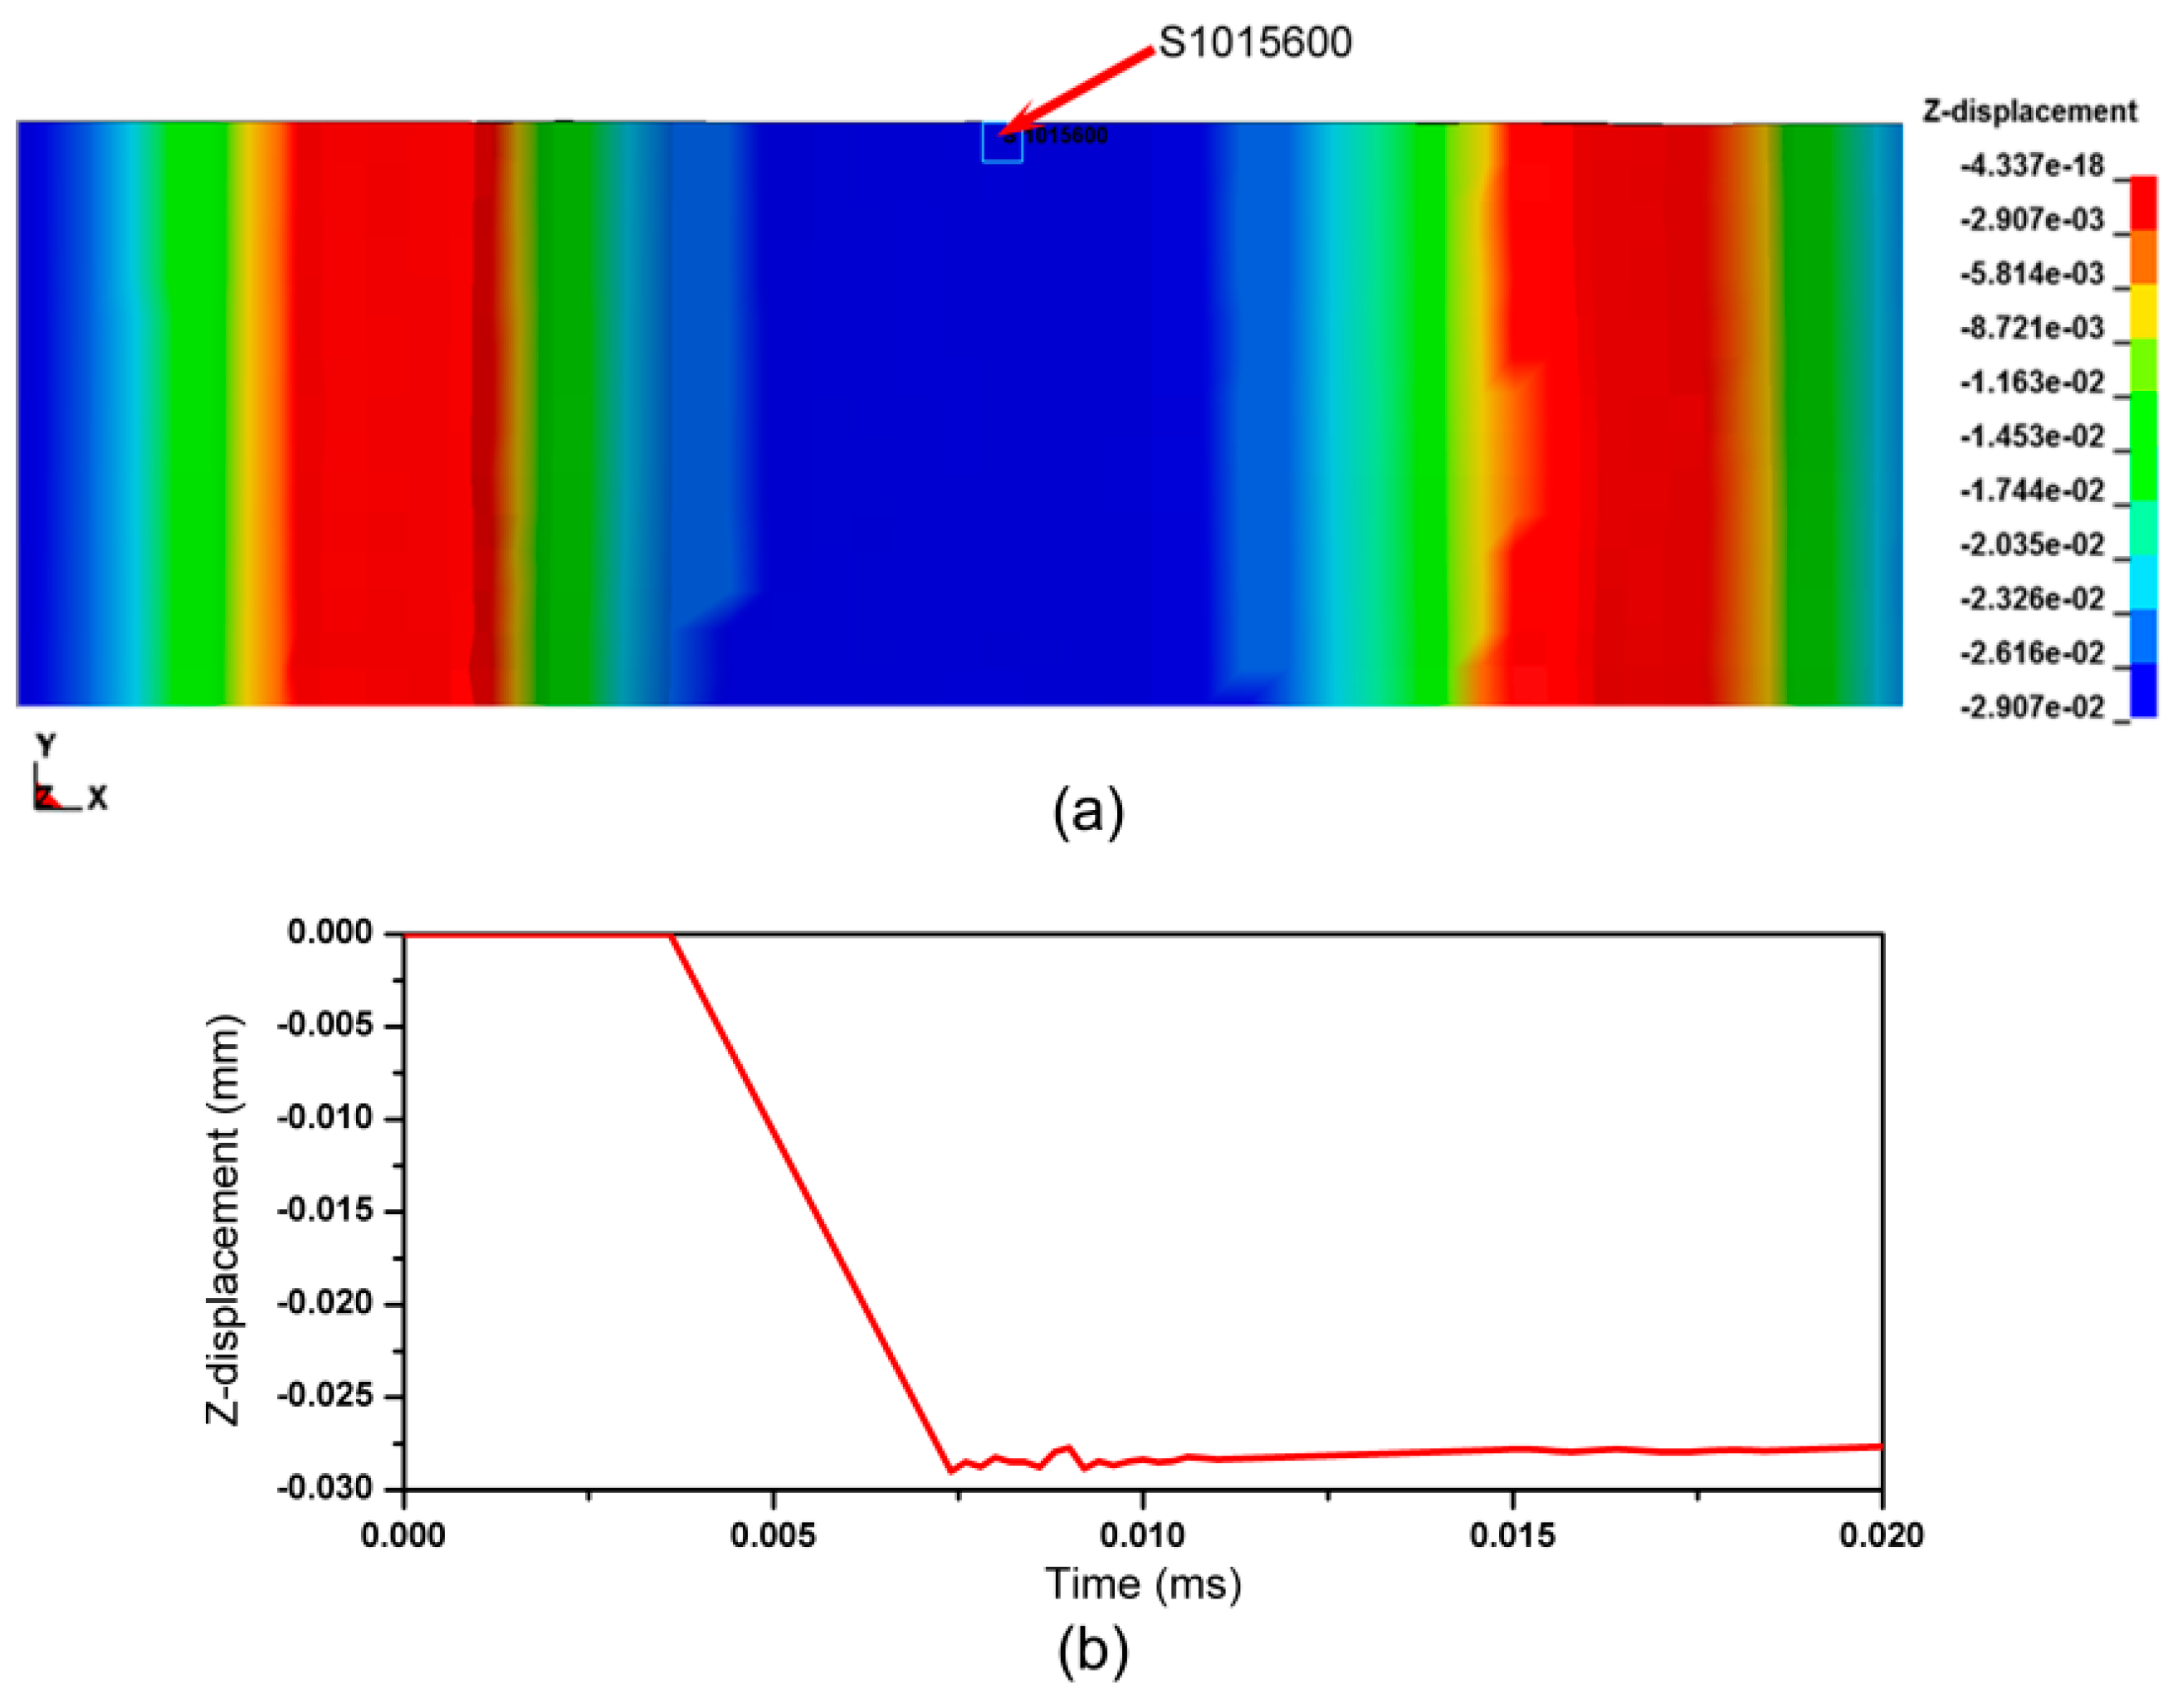
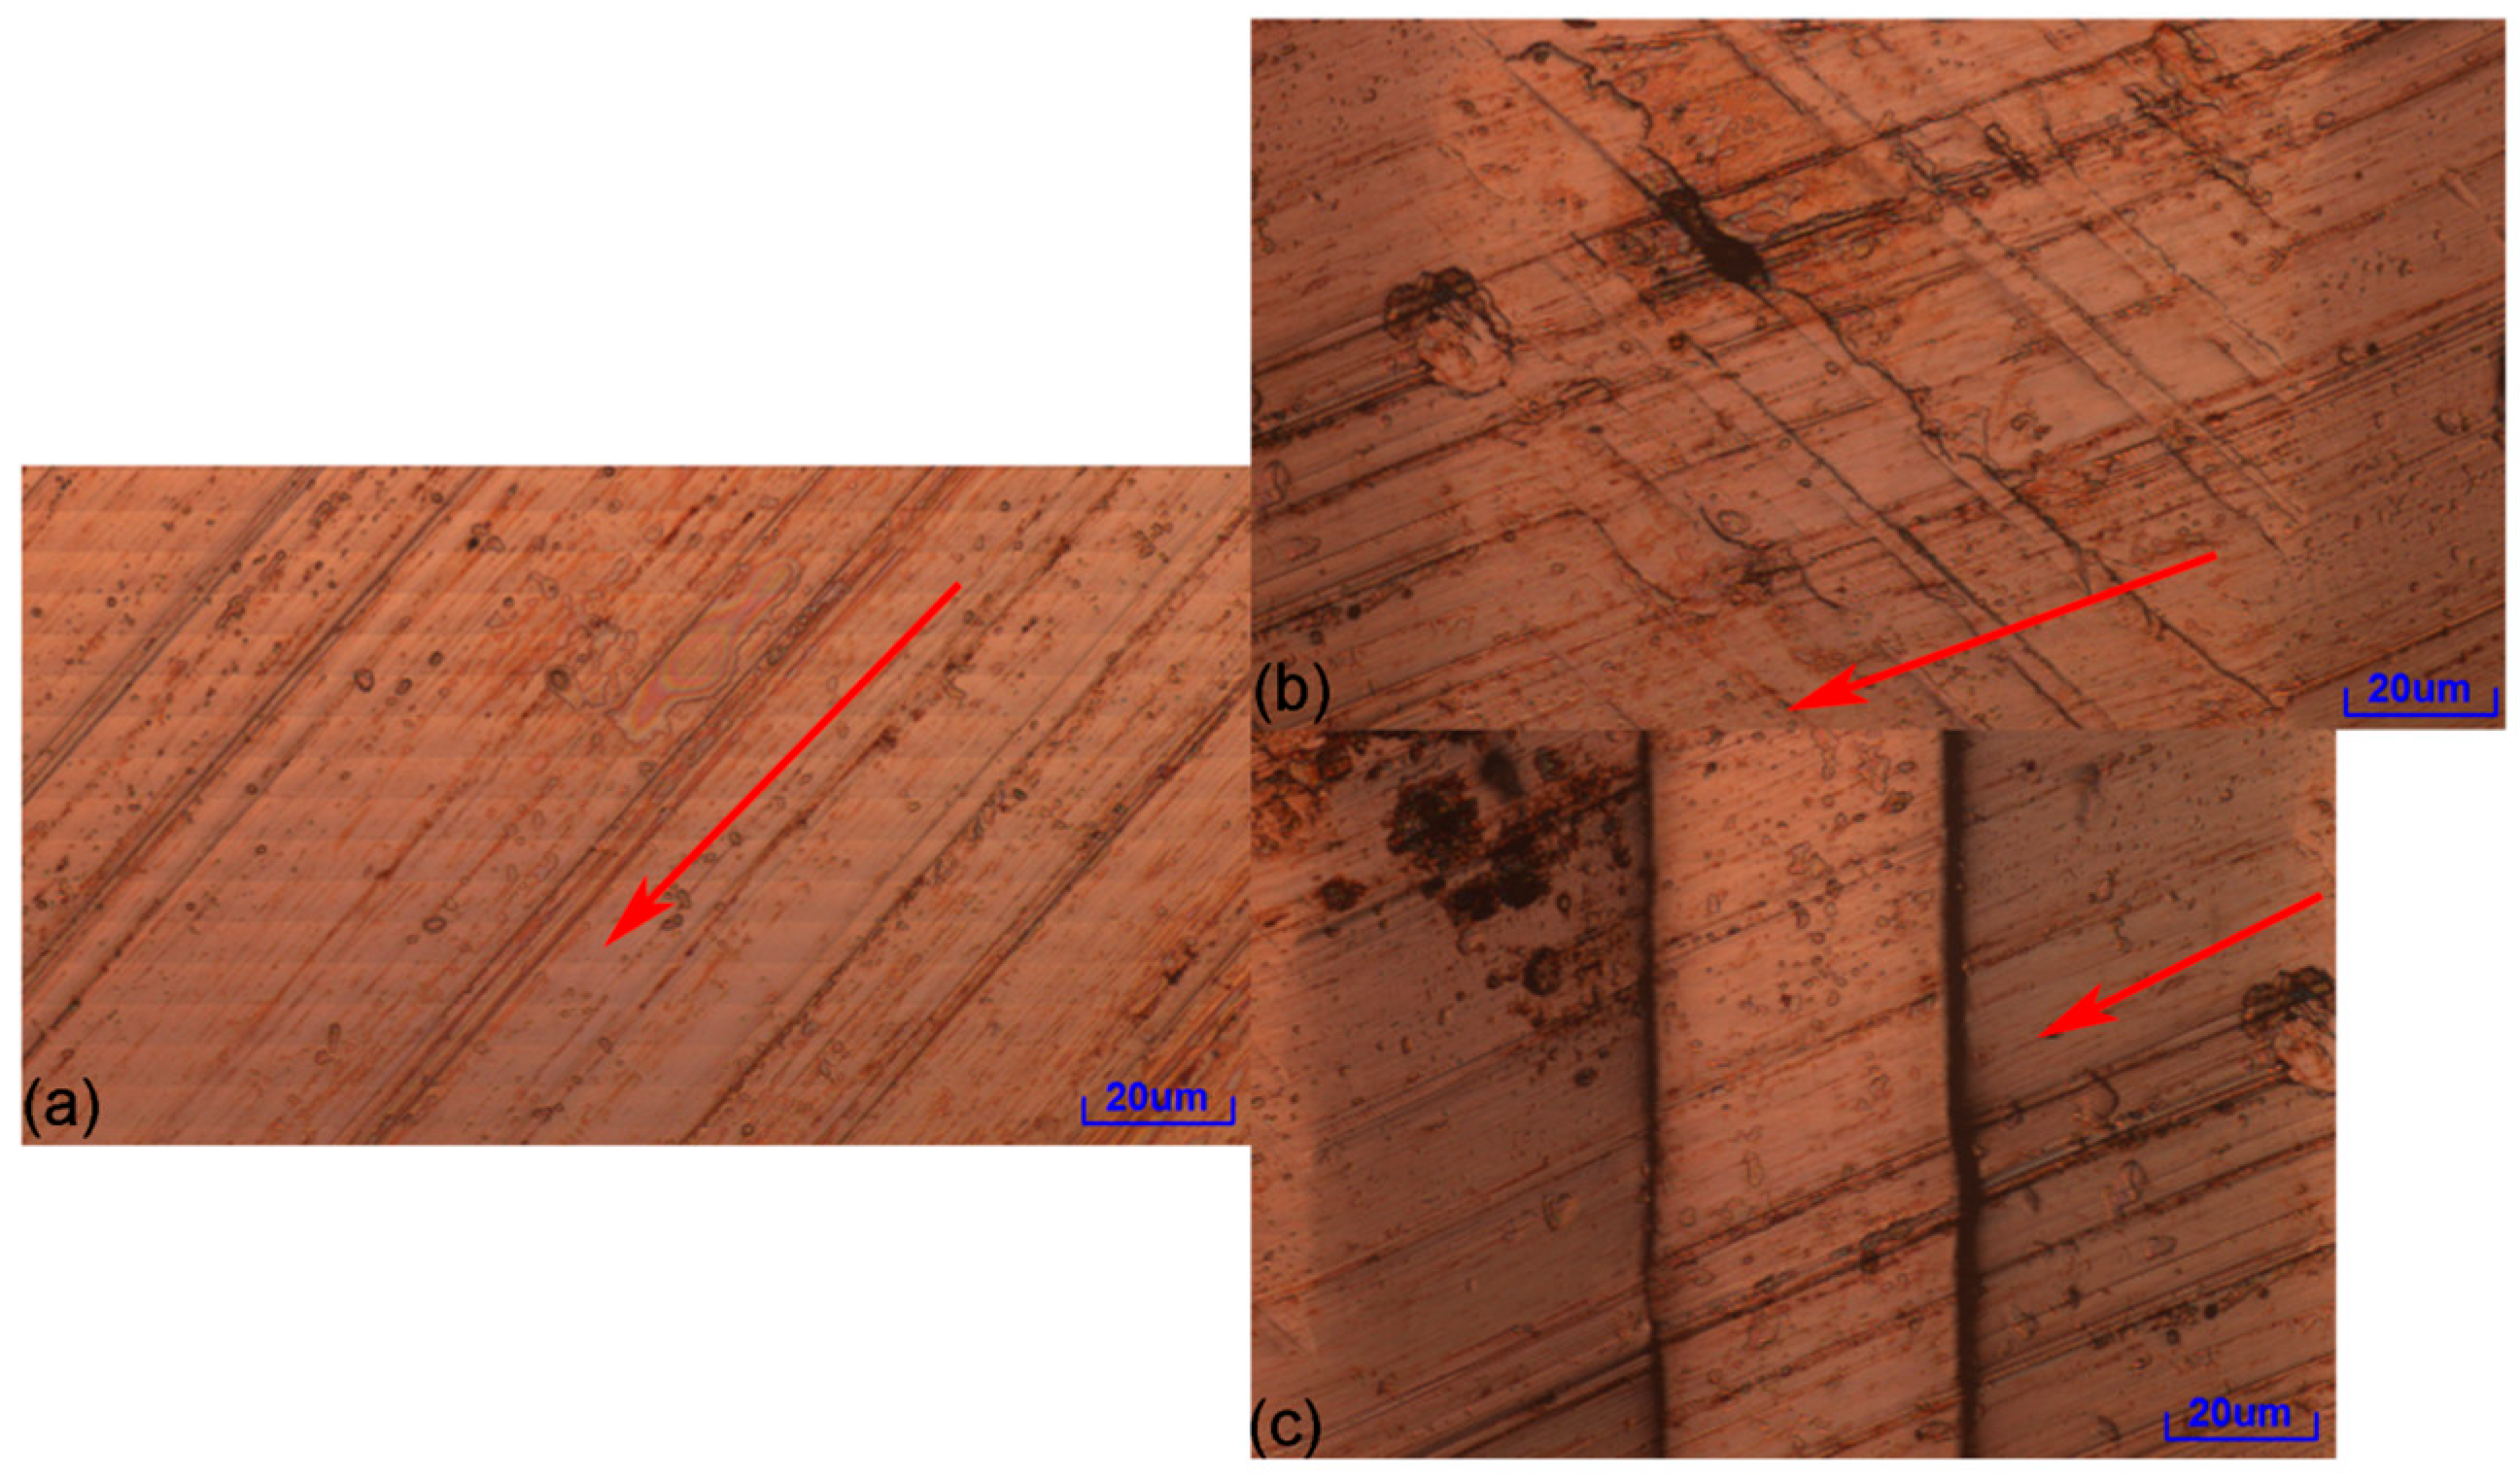
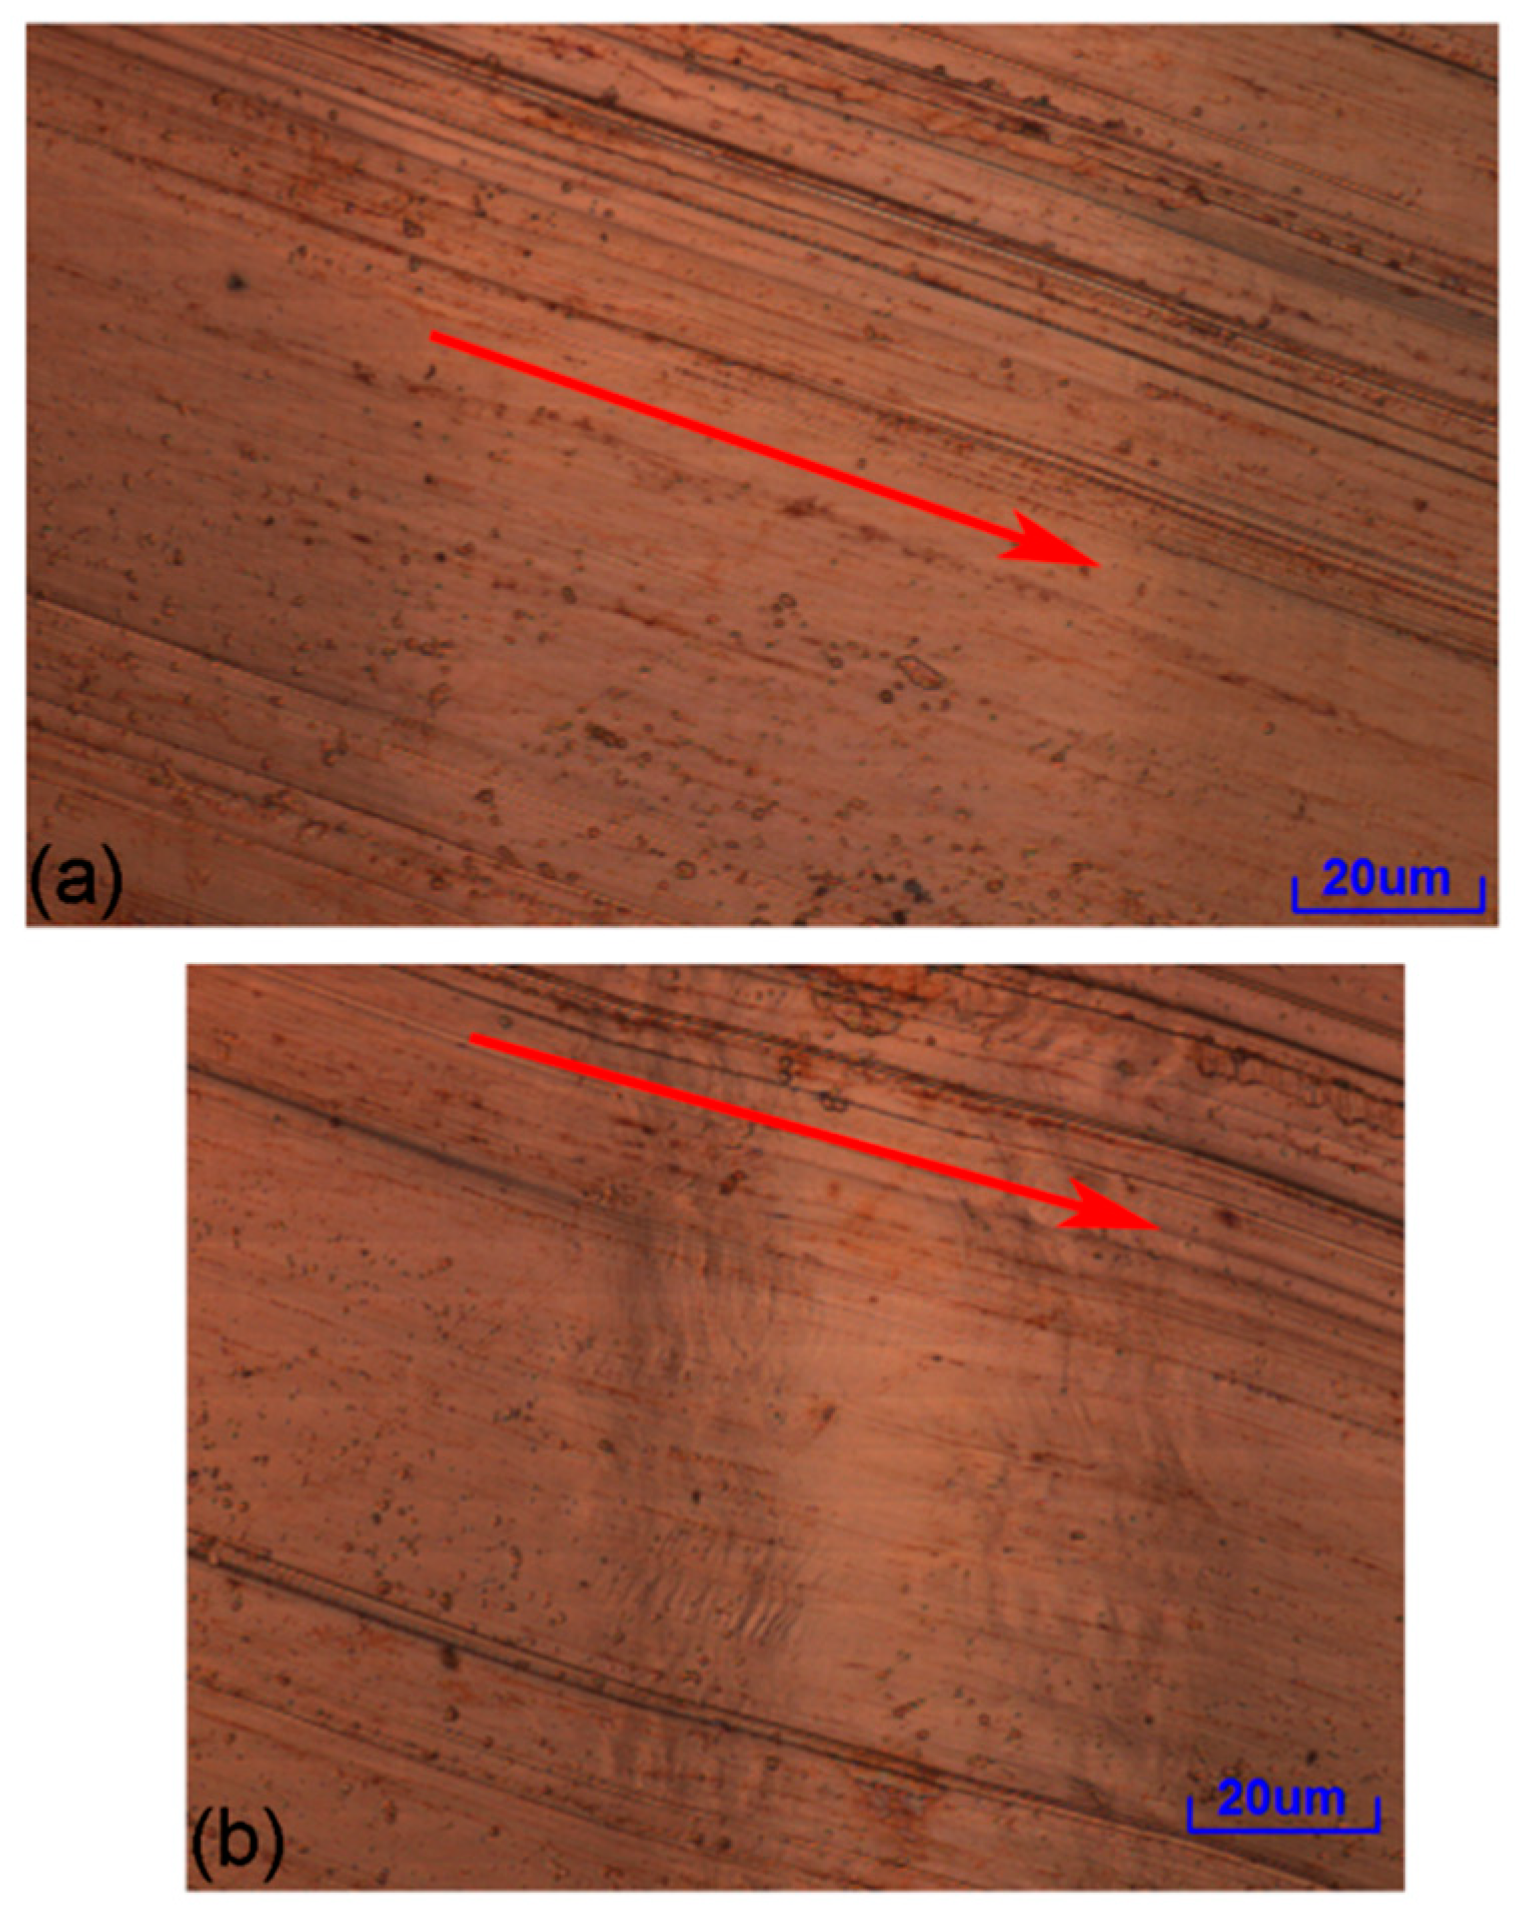
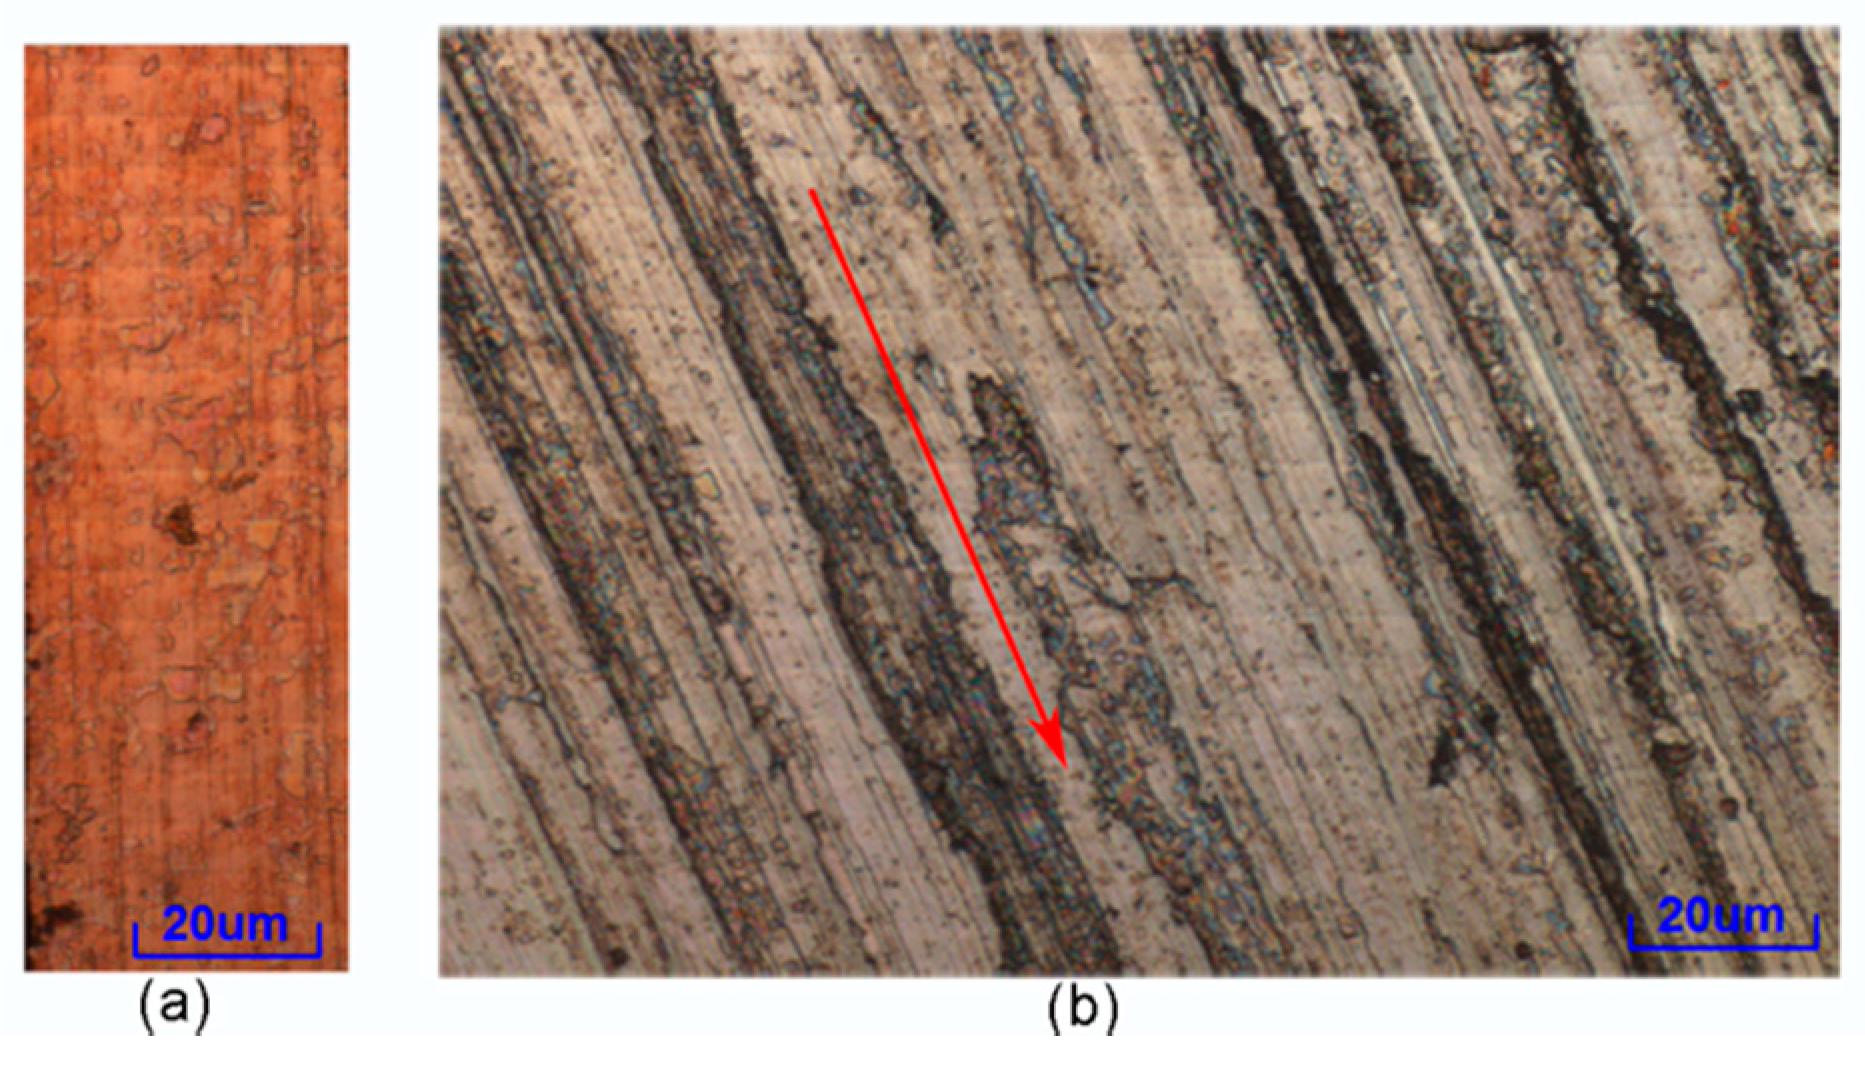
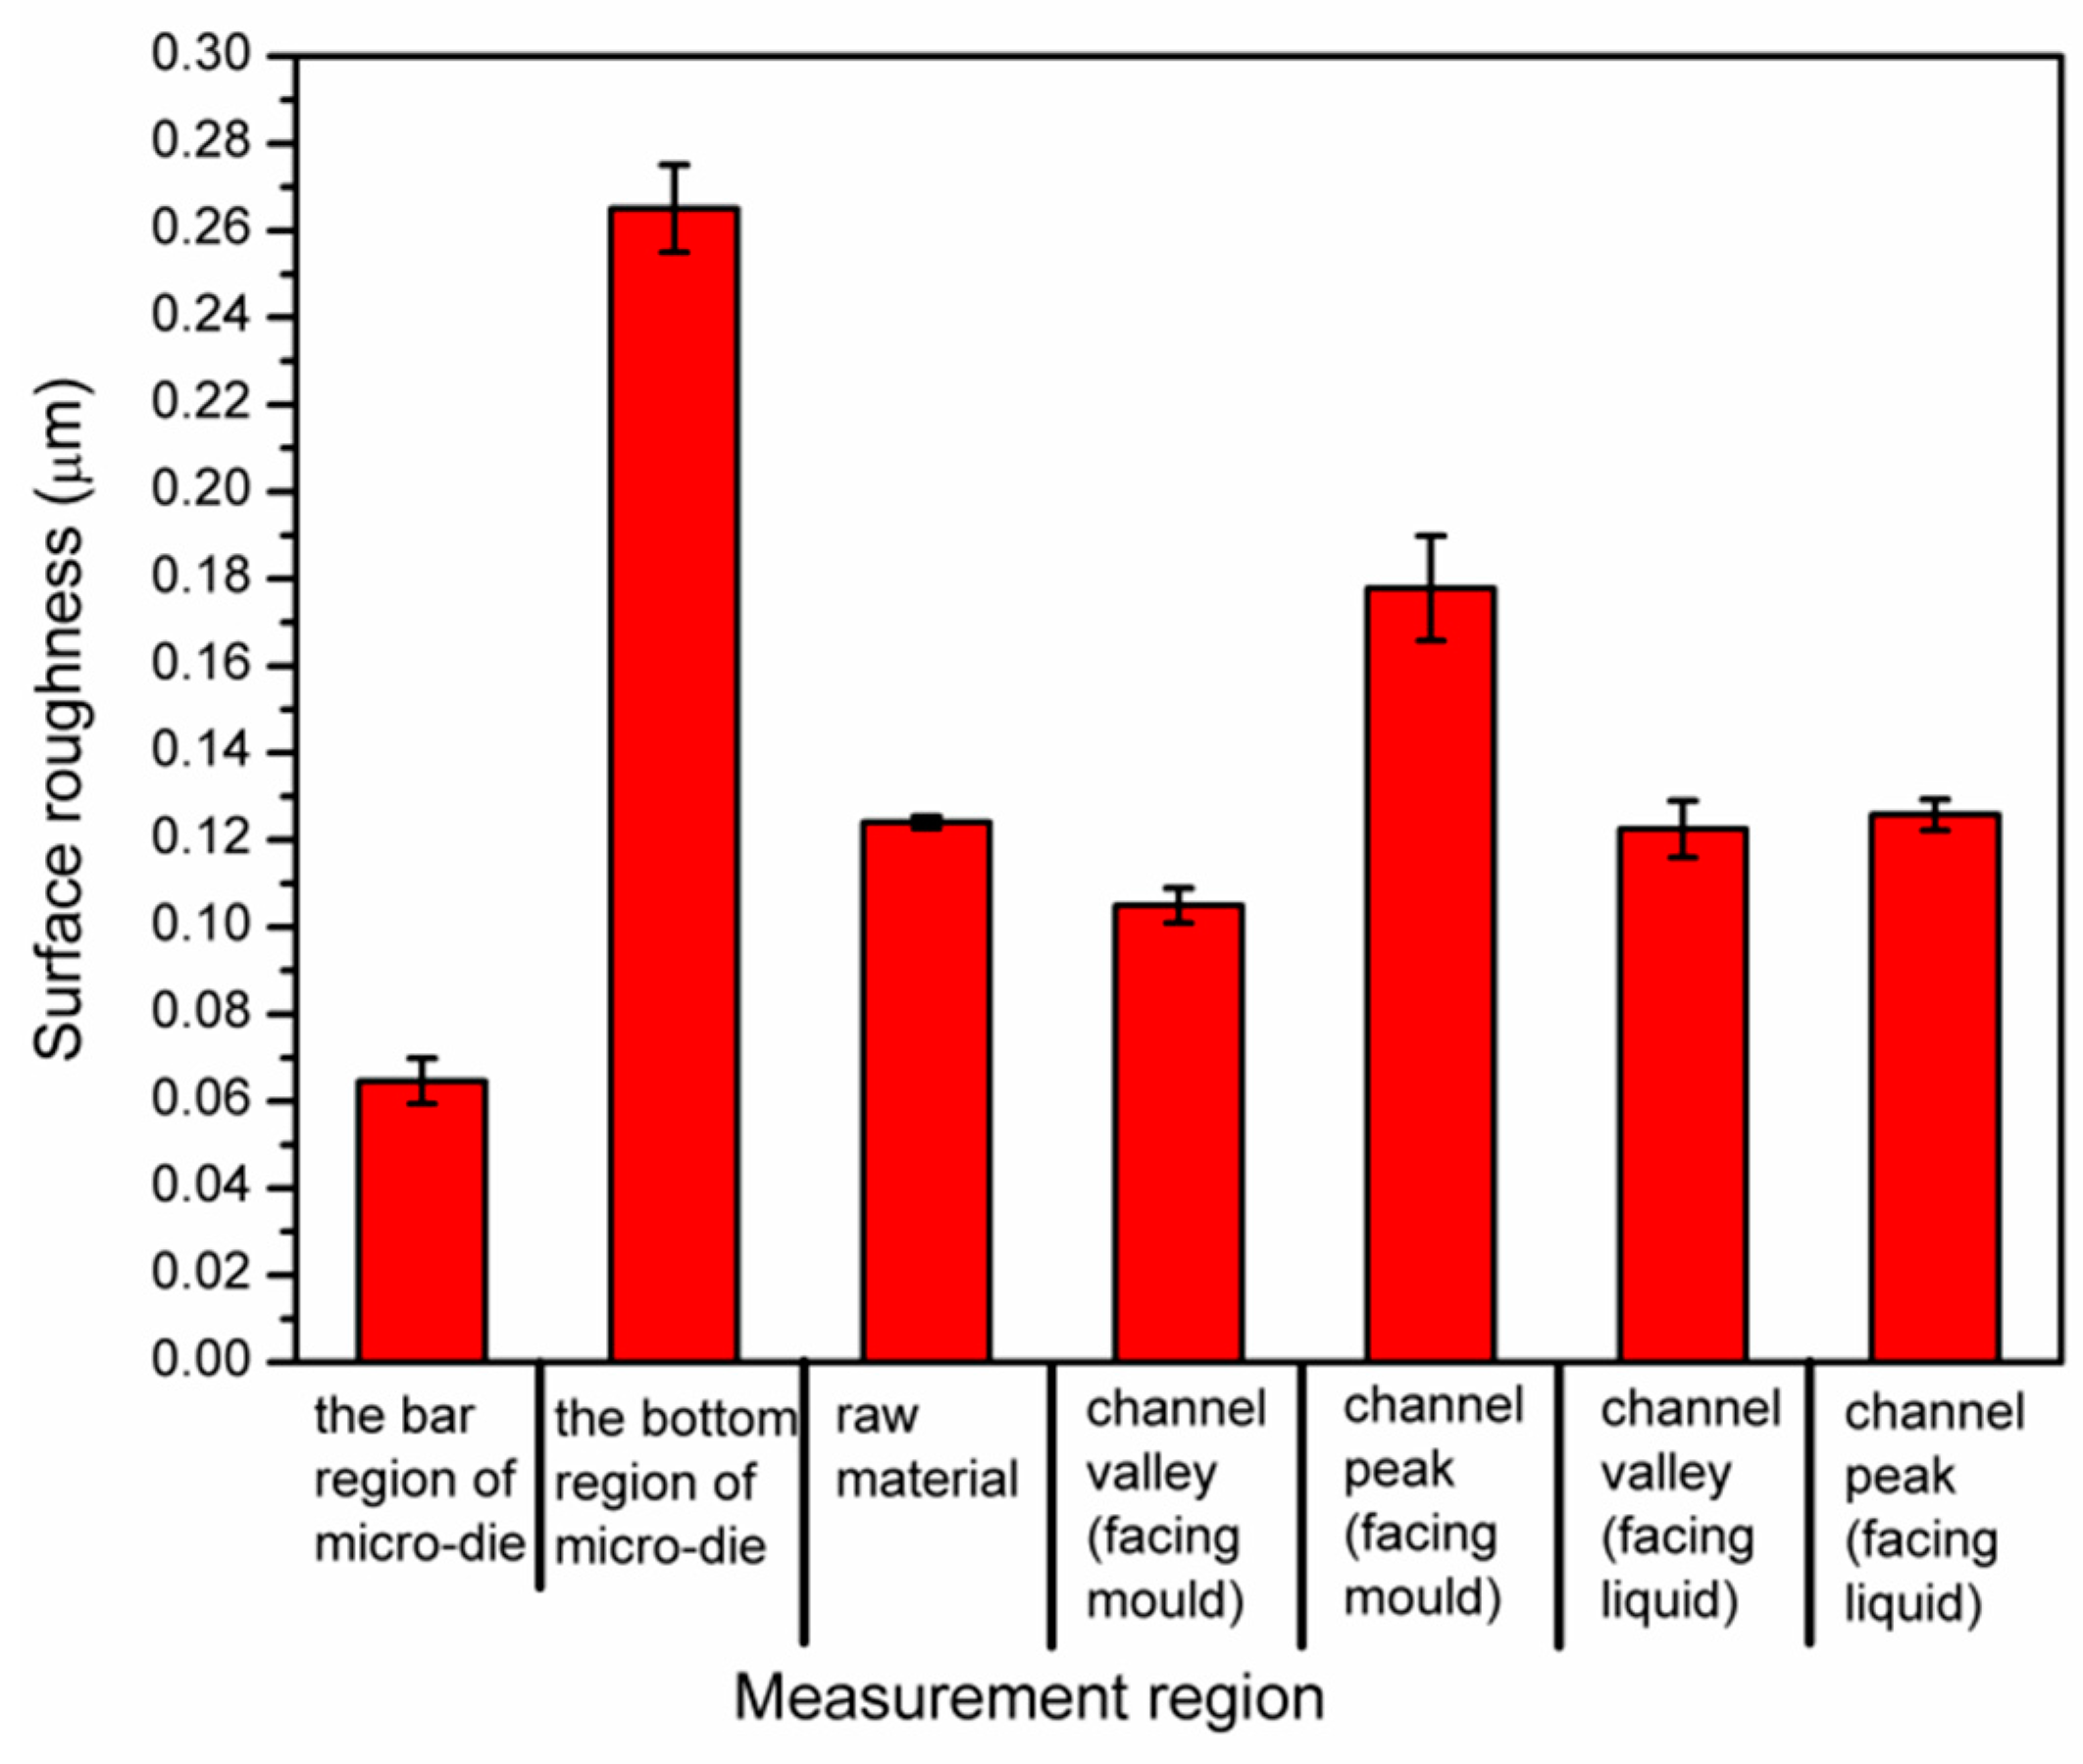
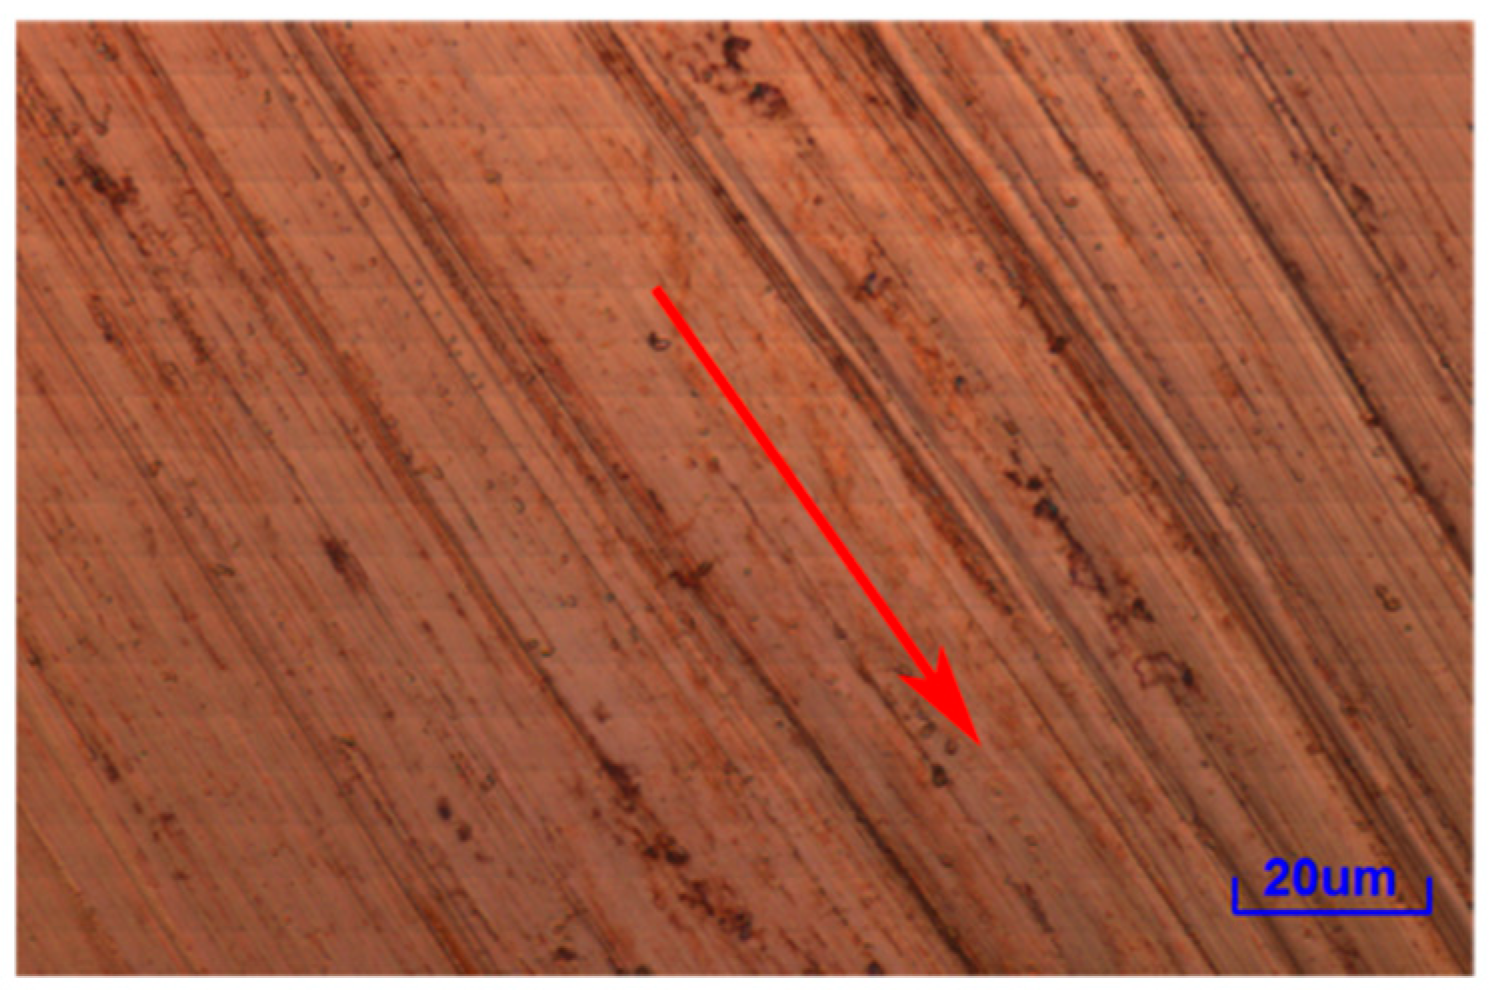
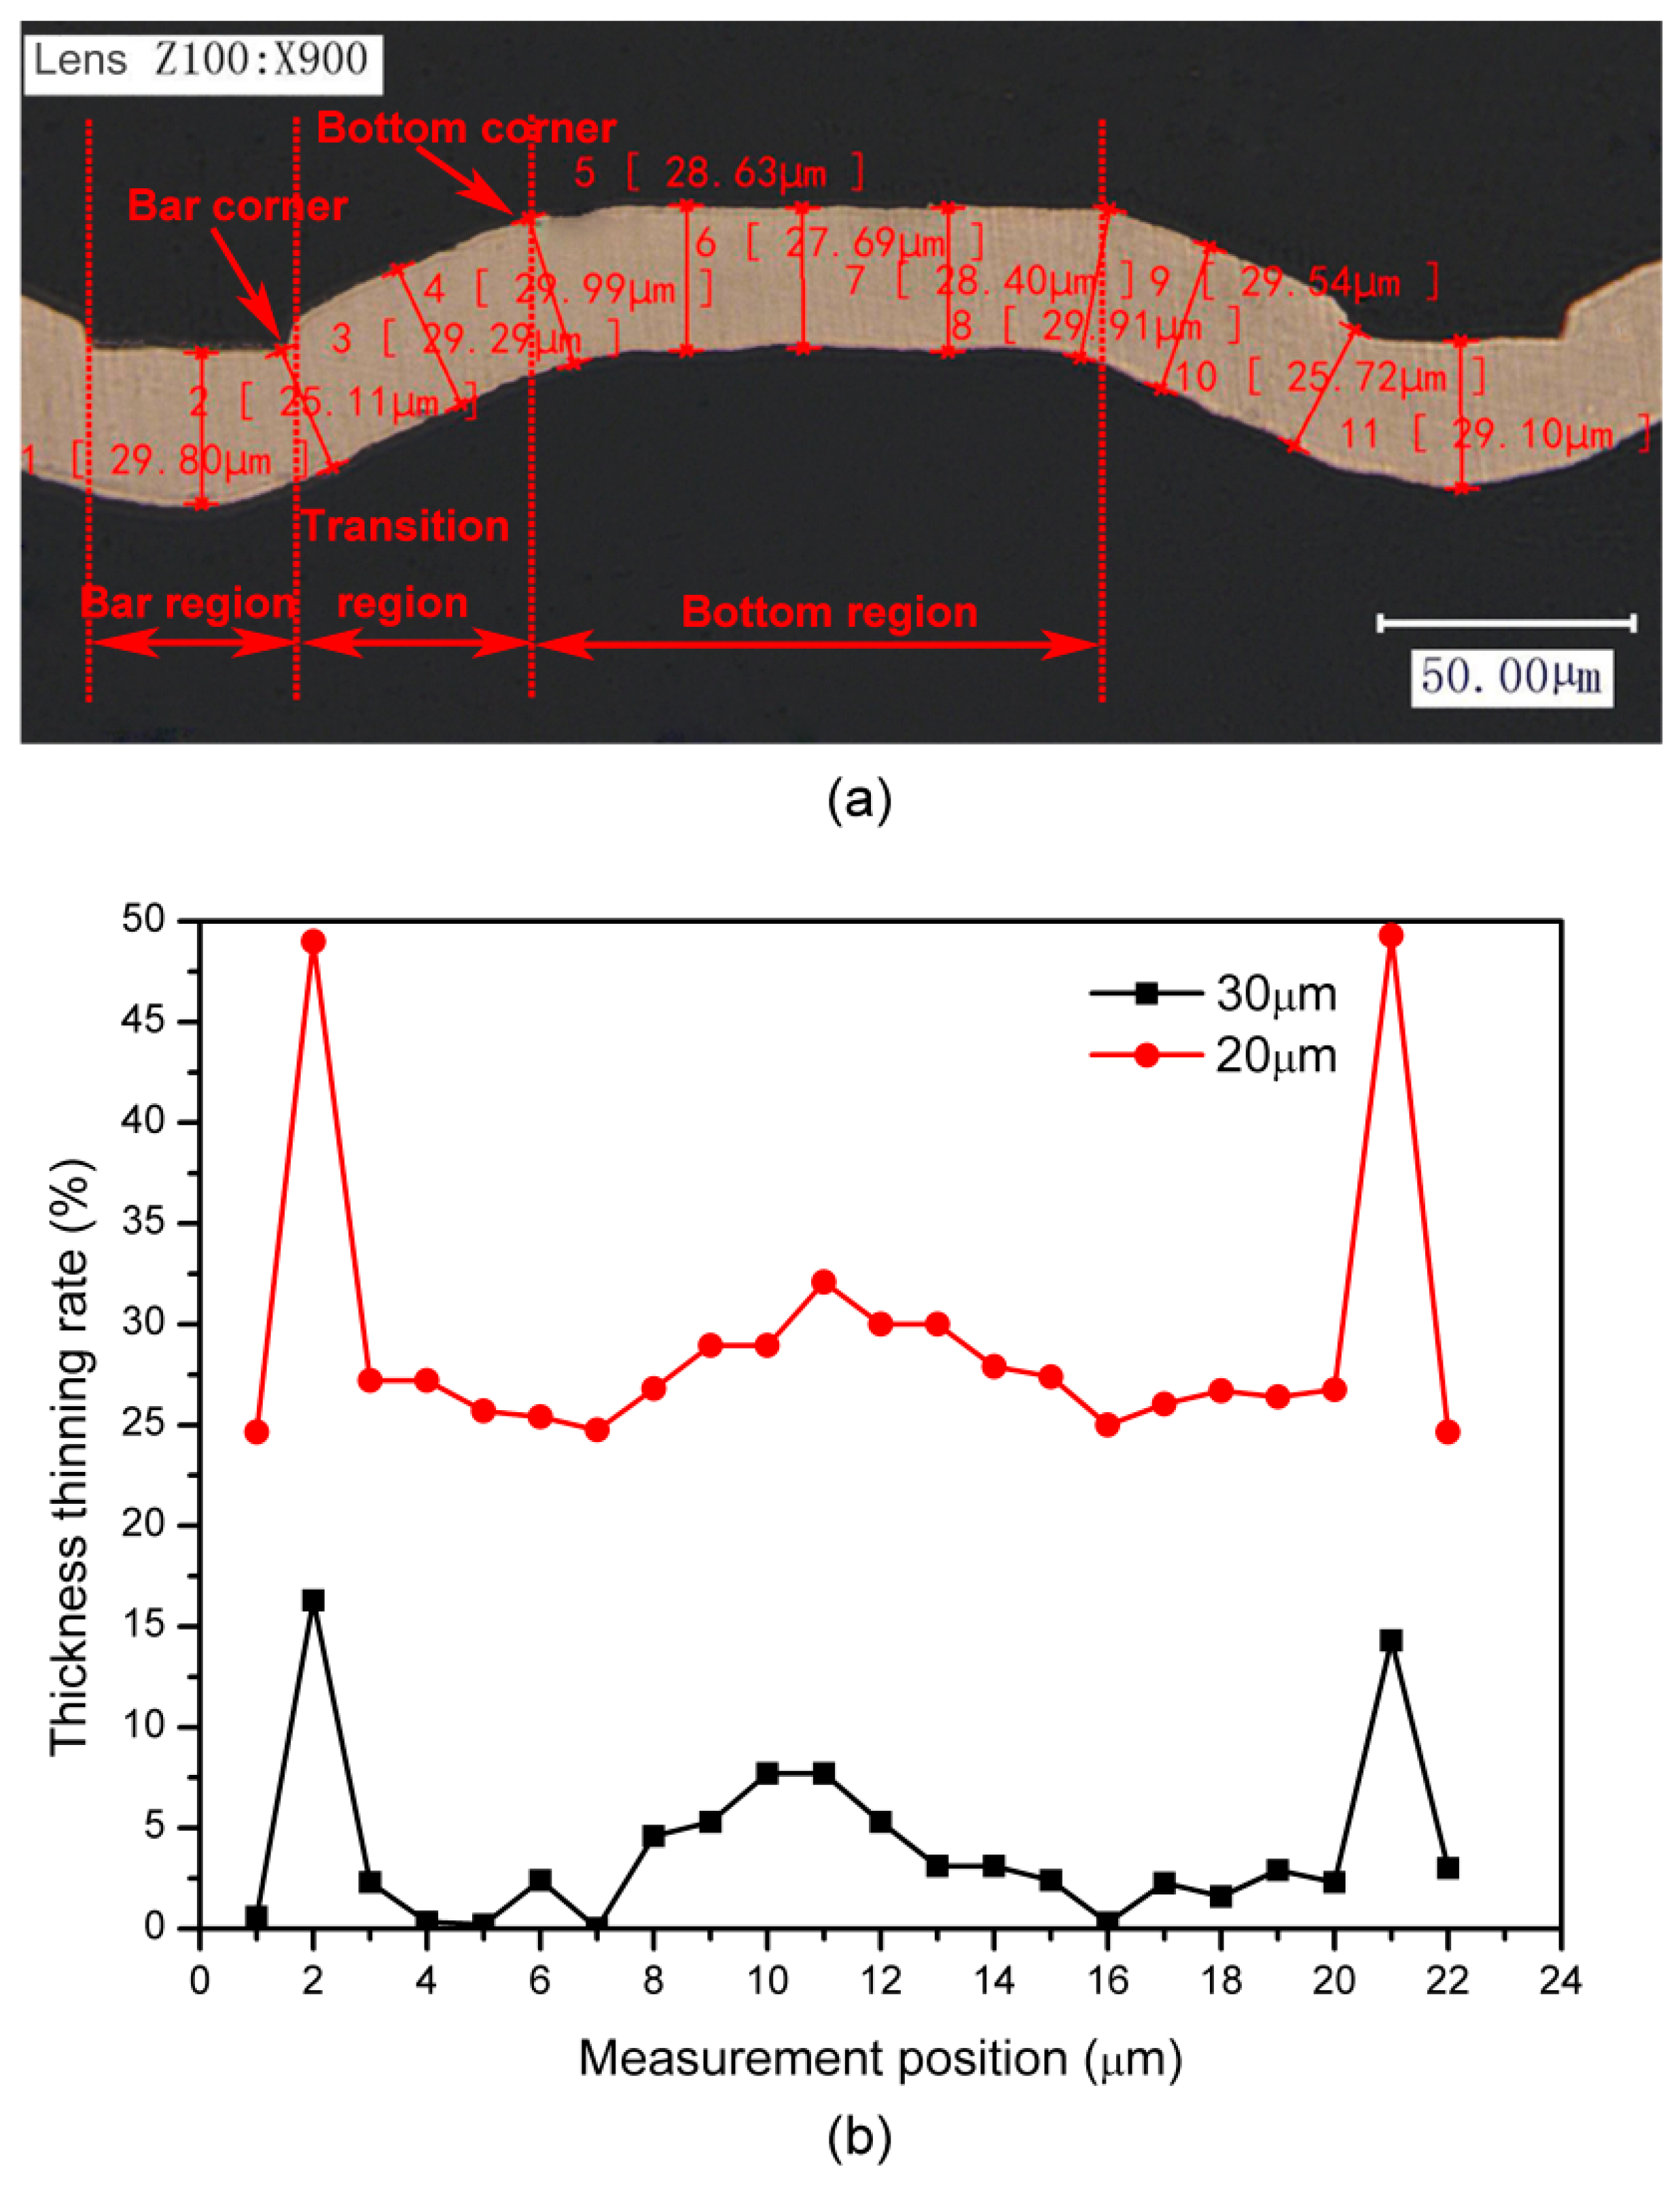
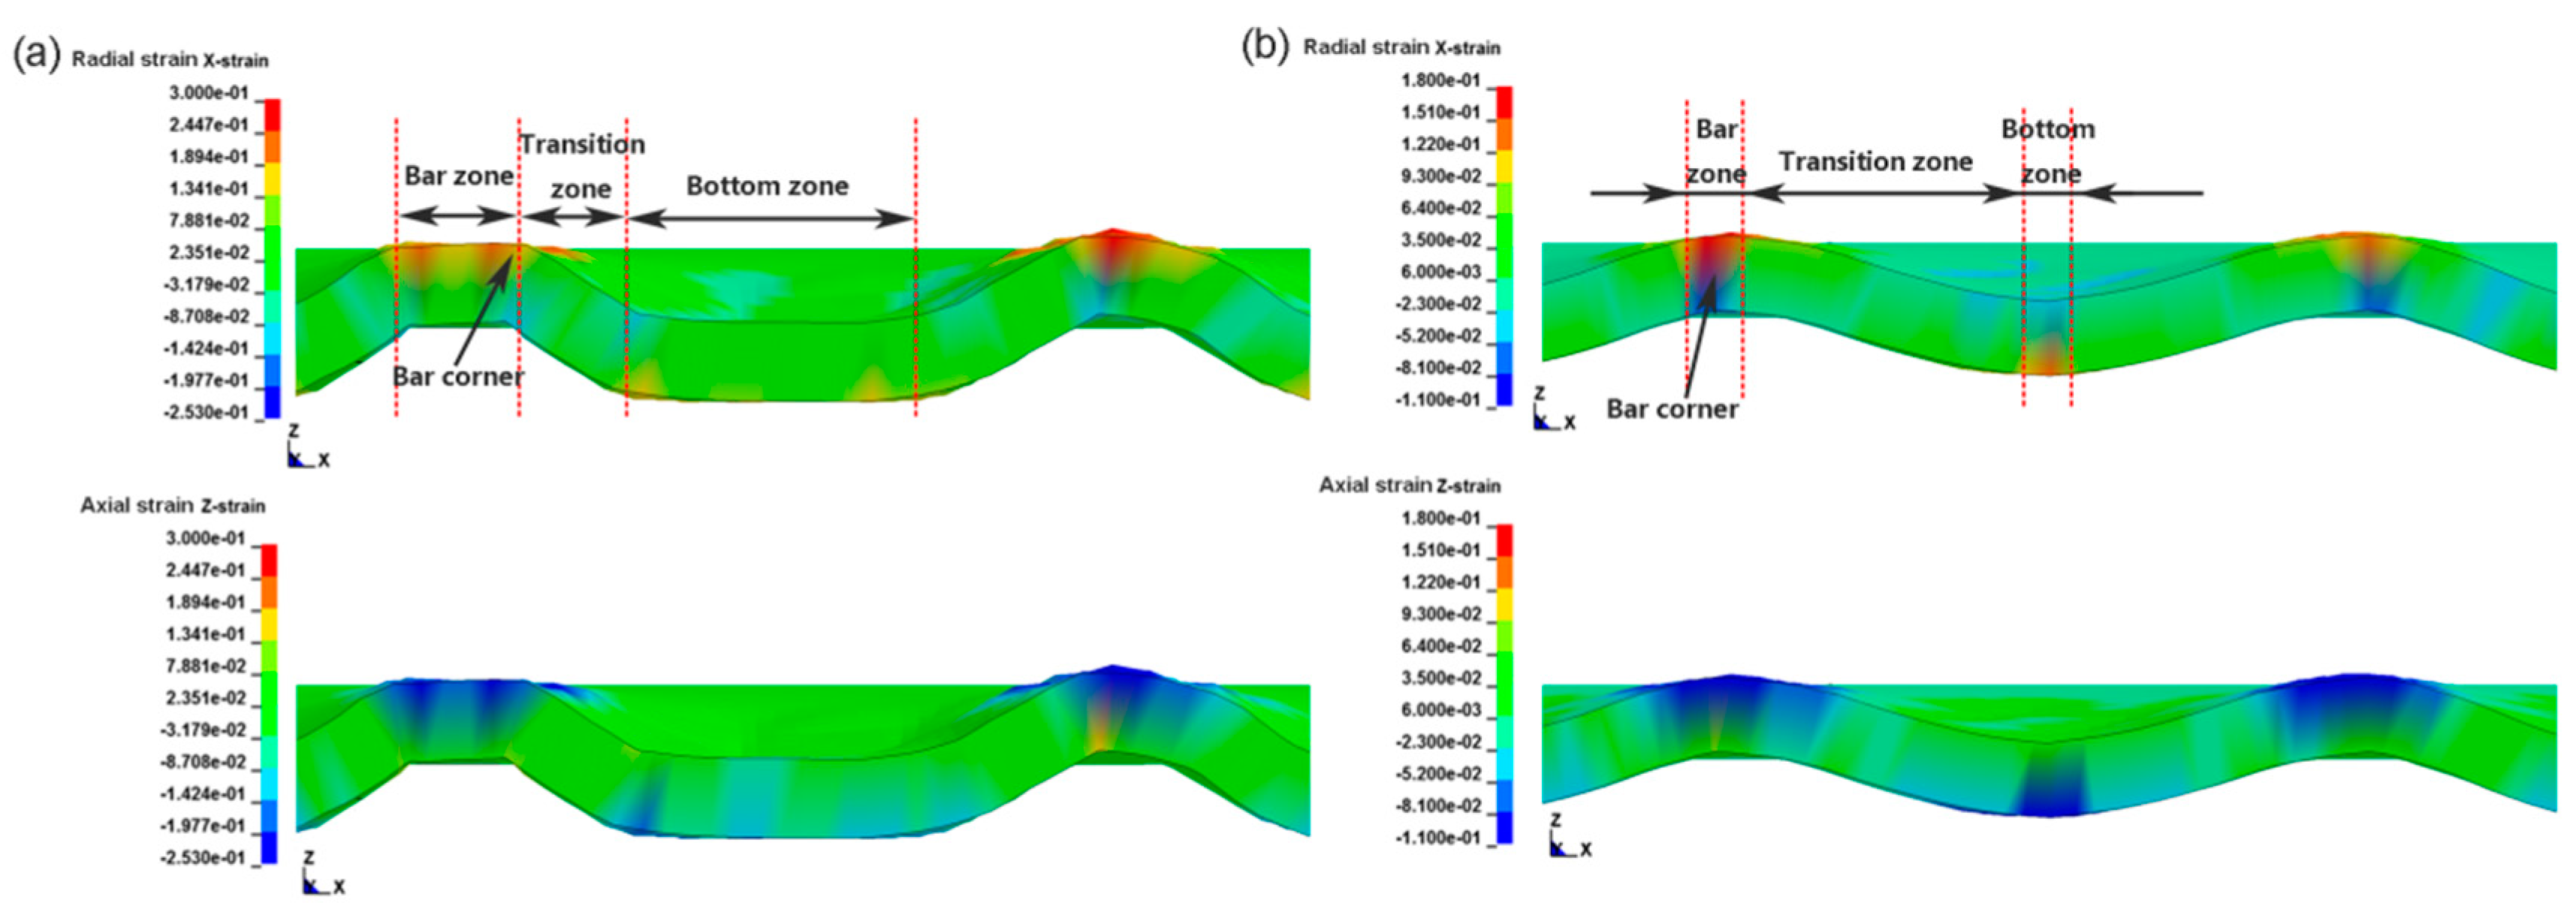
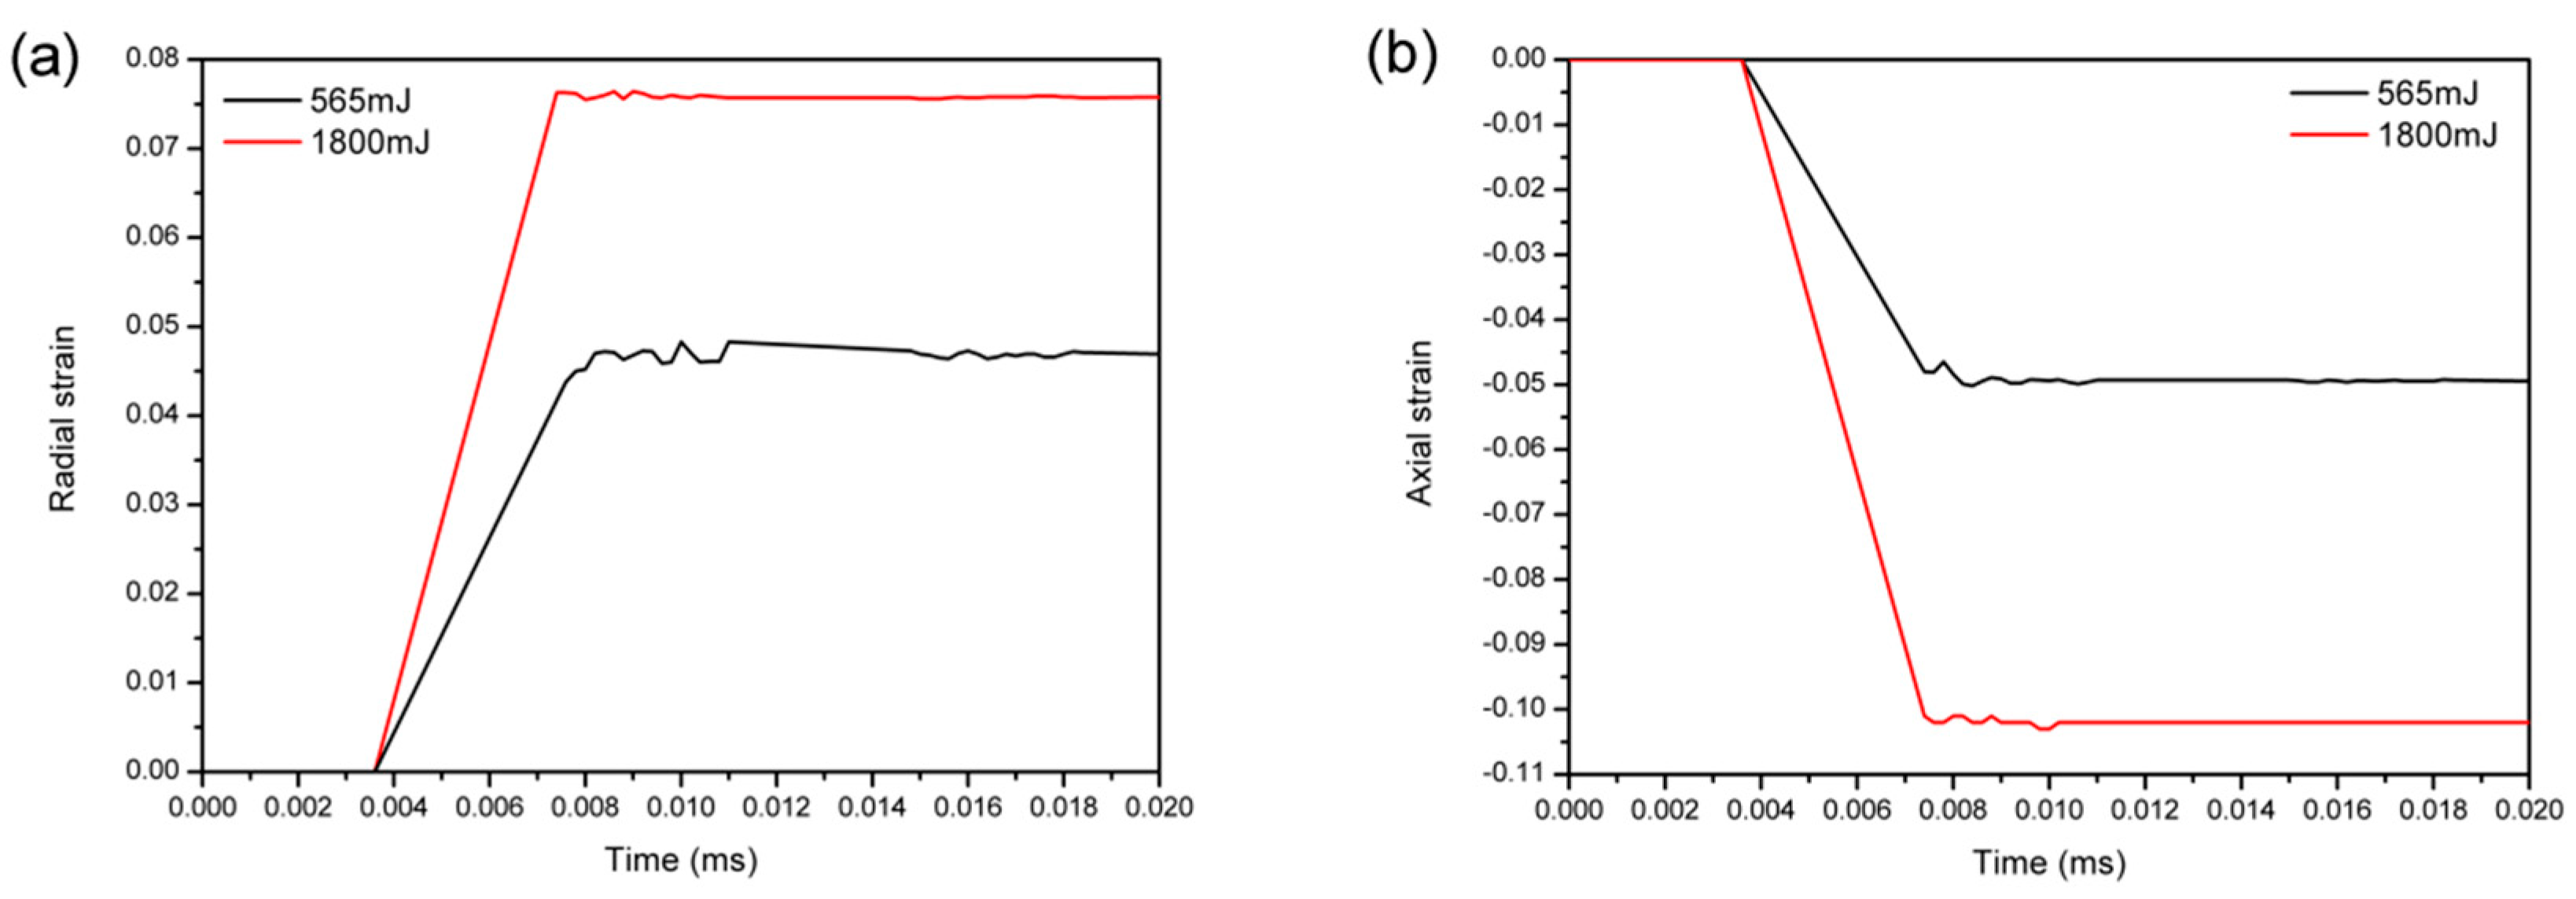
Table 1.
Detailed experimental parameters.
| Parameters | Values |
|---|---|
| Laser Energy | 565–1800 mJ |
| Copper Foil Thickness | 20/30 μm |
| Laser Spot Diameter | 3 mm |
| PMMA Thickness | 3 mm |
| Rubber Layer Thickness | 200 μm |
| Ablative Medium Thickness | 10 μm |
| Blank Holder Force | 12 N |
| Material | ||||||||
|---|---|---|---|---|---|---|---|---|
| Copper | 90 | 292 | 0.025 | 0.31 | 1.09 | 298 | 1356 | 1.0 |
Table 3.
Mechanical property parameters of polyurethane rubber material.
| Material | Hardness | M–R Constant | M–R Constant | Poisson’s ( |
|---|---|---|---|---|
| Polyurethane Rubber | 70 | 0.736 | 0.184 | 0.49997 |
Table 4.
Water properties and parameters.
| Material | |||||||||
|---|---|---|---|---|---|---|---|---|---|
| Water | 1000 | 1.002 × 10⁻³ | 1484 | 1.979 | 0 | 0 | 0.11 | 0 | 0 |
© 2018 by the authors. Licensee MDPI, Basel, Switzerland. This article is an open access article distributed under the terms and conditions of the Creative Commons Attribution (CC BY) license (http://creativecommons.org/licenses/by/4.0/).
Share and Cite
MDPI and ACS Style
Liu, F.; Liu, H.; Jiang, C.; Ma, Y.; Wang, X. Experimental and Numerical Investigations of a Novel Laser Impact Liquid Flexible Microforming Process. Metals 2018, 8, 599. https://doi.org/10.3390/met8080599
AMA Style
Liu F, Liu H, Jiang C, Ma Y, Wang X. Experimental and Numerical Investigations of a Novel Laser Impact Liquid Flexible Microforming Process. Metals. 2018; 8(8):599. https://doi.org/10.3390/met8080599
Chicago/Turabian StyleLiu, Fei, Huixia Liu, Chenkun Jiang, Youjuan Ma, and Xiao Wang. 2018. "Experimental and Numerical Investigations of a Novel Laser Impact Liquid Flexible Microforming Process" Metals 8, no. 8: 599. https://doi.org/10.3390/met8080599
Note that from the first issue of 2016, this journal uses article numbers instead of page numbers. See further details here.