

Investigation on the Metal Transfer and Cavity Evolution during Submerged Arc Welding with X-ray Imaging Technology

1
MOE Key Lab for Liquid-Solid Structure Evolution and Materials Processing, Institute of Materials Joining, Shandong University, Jinan 250061, China
2
E.O. Paton Electrical Welding Institute, National Academy of Sciences of Ukraine (NASU), 03680 Kyiv, Ukraine
*
Author to whom correspondence should be addressed.
Metals 2023, 13(11), 1865; https://doi.org/10.3390/met13111865
Submission received: 6 September 2023
/
Revised: 30 October 2023
/
Accepted: 5 November 2023
/
Published: 9 November 2023
(This article belongs to the Section Welding and Joining)
Abstract
:The physical phenomena of submerged arc welding (SAW) conducted with a 1.6 mm flux-cored wire were investigated using X-ray imaging technique. Three kinds of metal transfer modes were confirmed in this paper, namely the front flux wall-guided droplet transfer, back flux wall-guided droplet transfer, and repelled droplet transfer, of which the corresponding percentages were 47.65%, 45.29%, and 7.06%, respectively. Although the average sizes of the droplets for SAW and FCAW (flux-cored wire welding) were 2.0 mm and 1.9 mm with an average droplet transfer time of 90.3 ms, it required 36.4% more time for the droplet of SAW to finish one metal transfer than it did in FCAW. In addition, the volume of the cavity was not constant but repeated a cycle mode of “expansion and contraction” during the whole process. Thus, the dynamics of the cavity and viscous resistance caused by the flux collectively slowed down the velocity of the droplets from the wire to the weld pool in SAW. Compared with FCAW, a smoother weld without pits and pores was manufactured during the SAW process. Due to the compression effect of the flux, the 14.5 mm average weld width of SAW was 2.9 mm shorter than that of the FCAW. Furthermore, the thickness of slag with a porous structure in SAW was 2.7 times of that in FCAW, indicating that it could provide better protection to the weld of SAW.
1. Introduction
With the advantages of high efficiency and automation, low smoke, and spatters, submerged arc welding (SAW) has become one of the most promising arc-welding methods. It is widely used in the construction of offshore platforms, bridges, pressure vessels, wind towers, energy pipelines, shipbuilding, and other industrial sectors [1,2,3,4]. Usually, solid wires are employed in the SAW process to produce weld metal that does not require high comprehensive mechanical properties. However, the solid wire can be hardened during the drawing process due to the work-hardening effect, while a significant number of alloy components must be added to improve the quality of weld metal. Then, worn dies and broken wire appear frequently. In addition, if the wire is hardened, it is not easy to straighten it. This can cause the groove center to decenter and the joining quality to deteriorate [5]. Compared with the solid wire, the adjustability of the alloy system of the flux-cored wire is more flexible, and a perfect weld can be obtained thanks to the combined protection effect of slag and gas. In addition, the flux-cored wire has a higher deposition rate than solid wire with the same diameter due to the increased current density. Thus, SAW with the flux-cored wire has been extensively applied in various industries [6,7,8].
The obvious characteristic of the SAW process is that the arc burns under the cover of the flux, so the physical phenomenon that occurs under the flux cannot be directly observed from the outside. This makes it hard to understand the exact physical mechanisms of SAW, including the metal-transfer process. However, metal transfers in other welding processes can be easily investigated because the target is not blocked, such as the gas metal arc welding (GMAW) [9,10,11,12,13]. According to the current literature, there are mainly two methods available for the observation of the SAW process: the X-ray and optical imaging techniques, respectively. In 1947, Ostapenko and Medovar [14] first employed X-ray photography to investigate the cavity formation of SAW, though the imaging quality was low compared to current standards. Shortly after that, Grebelnik [15] adopted a similar system to observe that the arc length did not drastically change as the type of flux varied. Komen et al. [16] suggested that the welding zone of SAW could be divided into four regions, and that the slag was pushed backward once it approached the wire around which the arc plasma existed. In addition, the droplet transfer was more similar to spray transfer because the diameter of the droplet was smaller than that of the wire, although the positional relationship between the arc and the droplet was similar to that of the globular transfer. Abe et al. [17] proposed that under the condition with a welding current of 600 A, an EN ratio of 0.5, and an arc voltage of 33 V, the droplet transfer mode of SAW was the spray transfer. Then, with the EN ratio increased, the droplet diameter increased while the transfer frequency decreased. Finally, it became globular transfer as the EN ratio increased to 1.0. Recently, Zhang et al. [18] observed the metal transfer characteristics of SAW with the X-ray in situ imaging system and claimed that the droplet geometry and transfer mode could be affected by the supporting force and viscous resistance caused by the flux wall. Han et al. [19] even successfully investigated the metal transfer dynamics of underwater submerged arc welding with the X-ray imaging method.
Moreover, optical imaging techniques have been reported to reveal the physical process of SAW, too. The earliest attempt at optical high-speed photography of metal transfers in SAW was conducted by Tybus [20] in 1957. In order to observe the cavity, a glass plate was placed on the longitudinal section of the weld during the process. Then, in 1965, Franz [21] conducted an innovative experiment by penetrating the flux with a ceramic tube to observe the phenomenon occurring inside the cavity of SAW and suggested that the influence of flux composition on the droplet transfer is minimal. However, Adrichem [22] employed a similar device to Franz’s to draw the conclusion that the droplet transfer frequency increased with the increase of flux activity. Mendez et al. [23] confirmed the chaotic and nonaxial globular metal transfer in SAW by inserting a thin steel tunnel perpendicular to the welding direction with a high-speed imaging system. Based on the analysis of spatially resolved spectroscopy, Gött et al. [24] suggested that the main components of the cavity atmosphere could be iron vapor and dissociated flux components. Li et al. [25] reported that the arc burned in SAW with high short-circuit current, which did not occur in GMAW. Sengupta and Mendez [26,27] reported that, between a welding current range of 600 A and 1000 A, the molten metal detached from the tip of electrode like a “whipping tail” was caused by the electromagnetic kink instability in SAW regardless whether DCEP or AC polarity was employed.
Due to the melting and evaporation of the tube or glass, the shape of the cavity and gas composition inside of it may be changed, while the captured films can be different from the actual phenomena that occur in SAW. Therefore, further research is needed to confirm the effectiveness of the optical imaging technique presented in the literature. However, with the employment of X-ray observation, the metal-transfer process can be easily obtained in SAW without damaging the integrity of the cavity. In this investigation, the X-ray imaging technique was applied to reveal the dynamics of the droplet, flux, cavity, and weld pool in the SAW process. The metal transfer was divided into three basic modes, the mechanisms of which were discussed from the perspective of force analysis. In addition, the cavity evolution and weld formation were also examined.
2. Materials and Methods
Bead-on-plate welding was conducted on the widely applied high-strength low-carbon marine steel CCS–EH40 with the dimensions of L250 × W35 × H14 mm. The basic mechanical properties of the base metal are shown in Table 1 after being tested on an SHT4505 (MTS, Eden Prairie, MN, USA) mechanical testing machine with a loading speed of 1 mm/min. A rutile-type flux-cored wire was specially designed and manufactured in this investigation to be the filler metal with a final diameter of 1.6 mm. Both the chemical compositions of the base metal and filler metal are shown in Table 2 with the measurement conducted by a spark direct reading spectrometer LAB12 (SPECTRO, Kleve, Germany).
Commercial melting type flux HJ431 was employed in this research, and the chemical composition of it is shown in Table 3. Then, the Direct Current Electrode Positive (DCEP) welding was conducted with a digital power source of Pulse MIG–500 (Aotai, Jinan, China) under the constant voltage mode. In addition, other main welding parameters include: wire feeding speed 3 m/min, traveling speed 120 mm/min, welding voltage 30 V, and wire extension 15 mm. For a comparative investigation, both flux-cored wire arc welding (FCAW) and submerged arc welding (SAW) were conducted in air, respectively. In the process of FCAW, the arc burns directly in air once it ignites between the tip of the wire and the surface of the base metal. Before welding in the process of USAW, flux HJ431 was shifted onto the surface of welding zone with an approximate thickness of 25 mm. Meanwhile, an aluminum alloy box with a wall thickness of 1 mm was fixed around the flux to prevent it from dispersing easily.
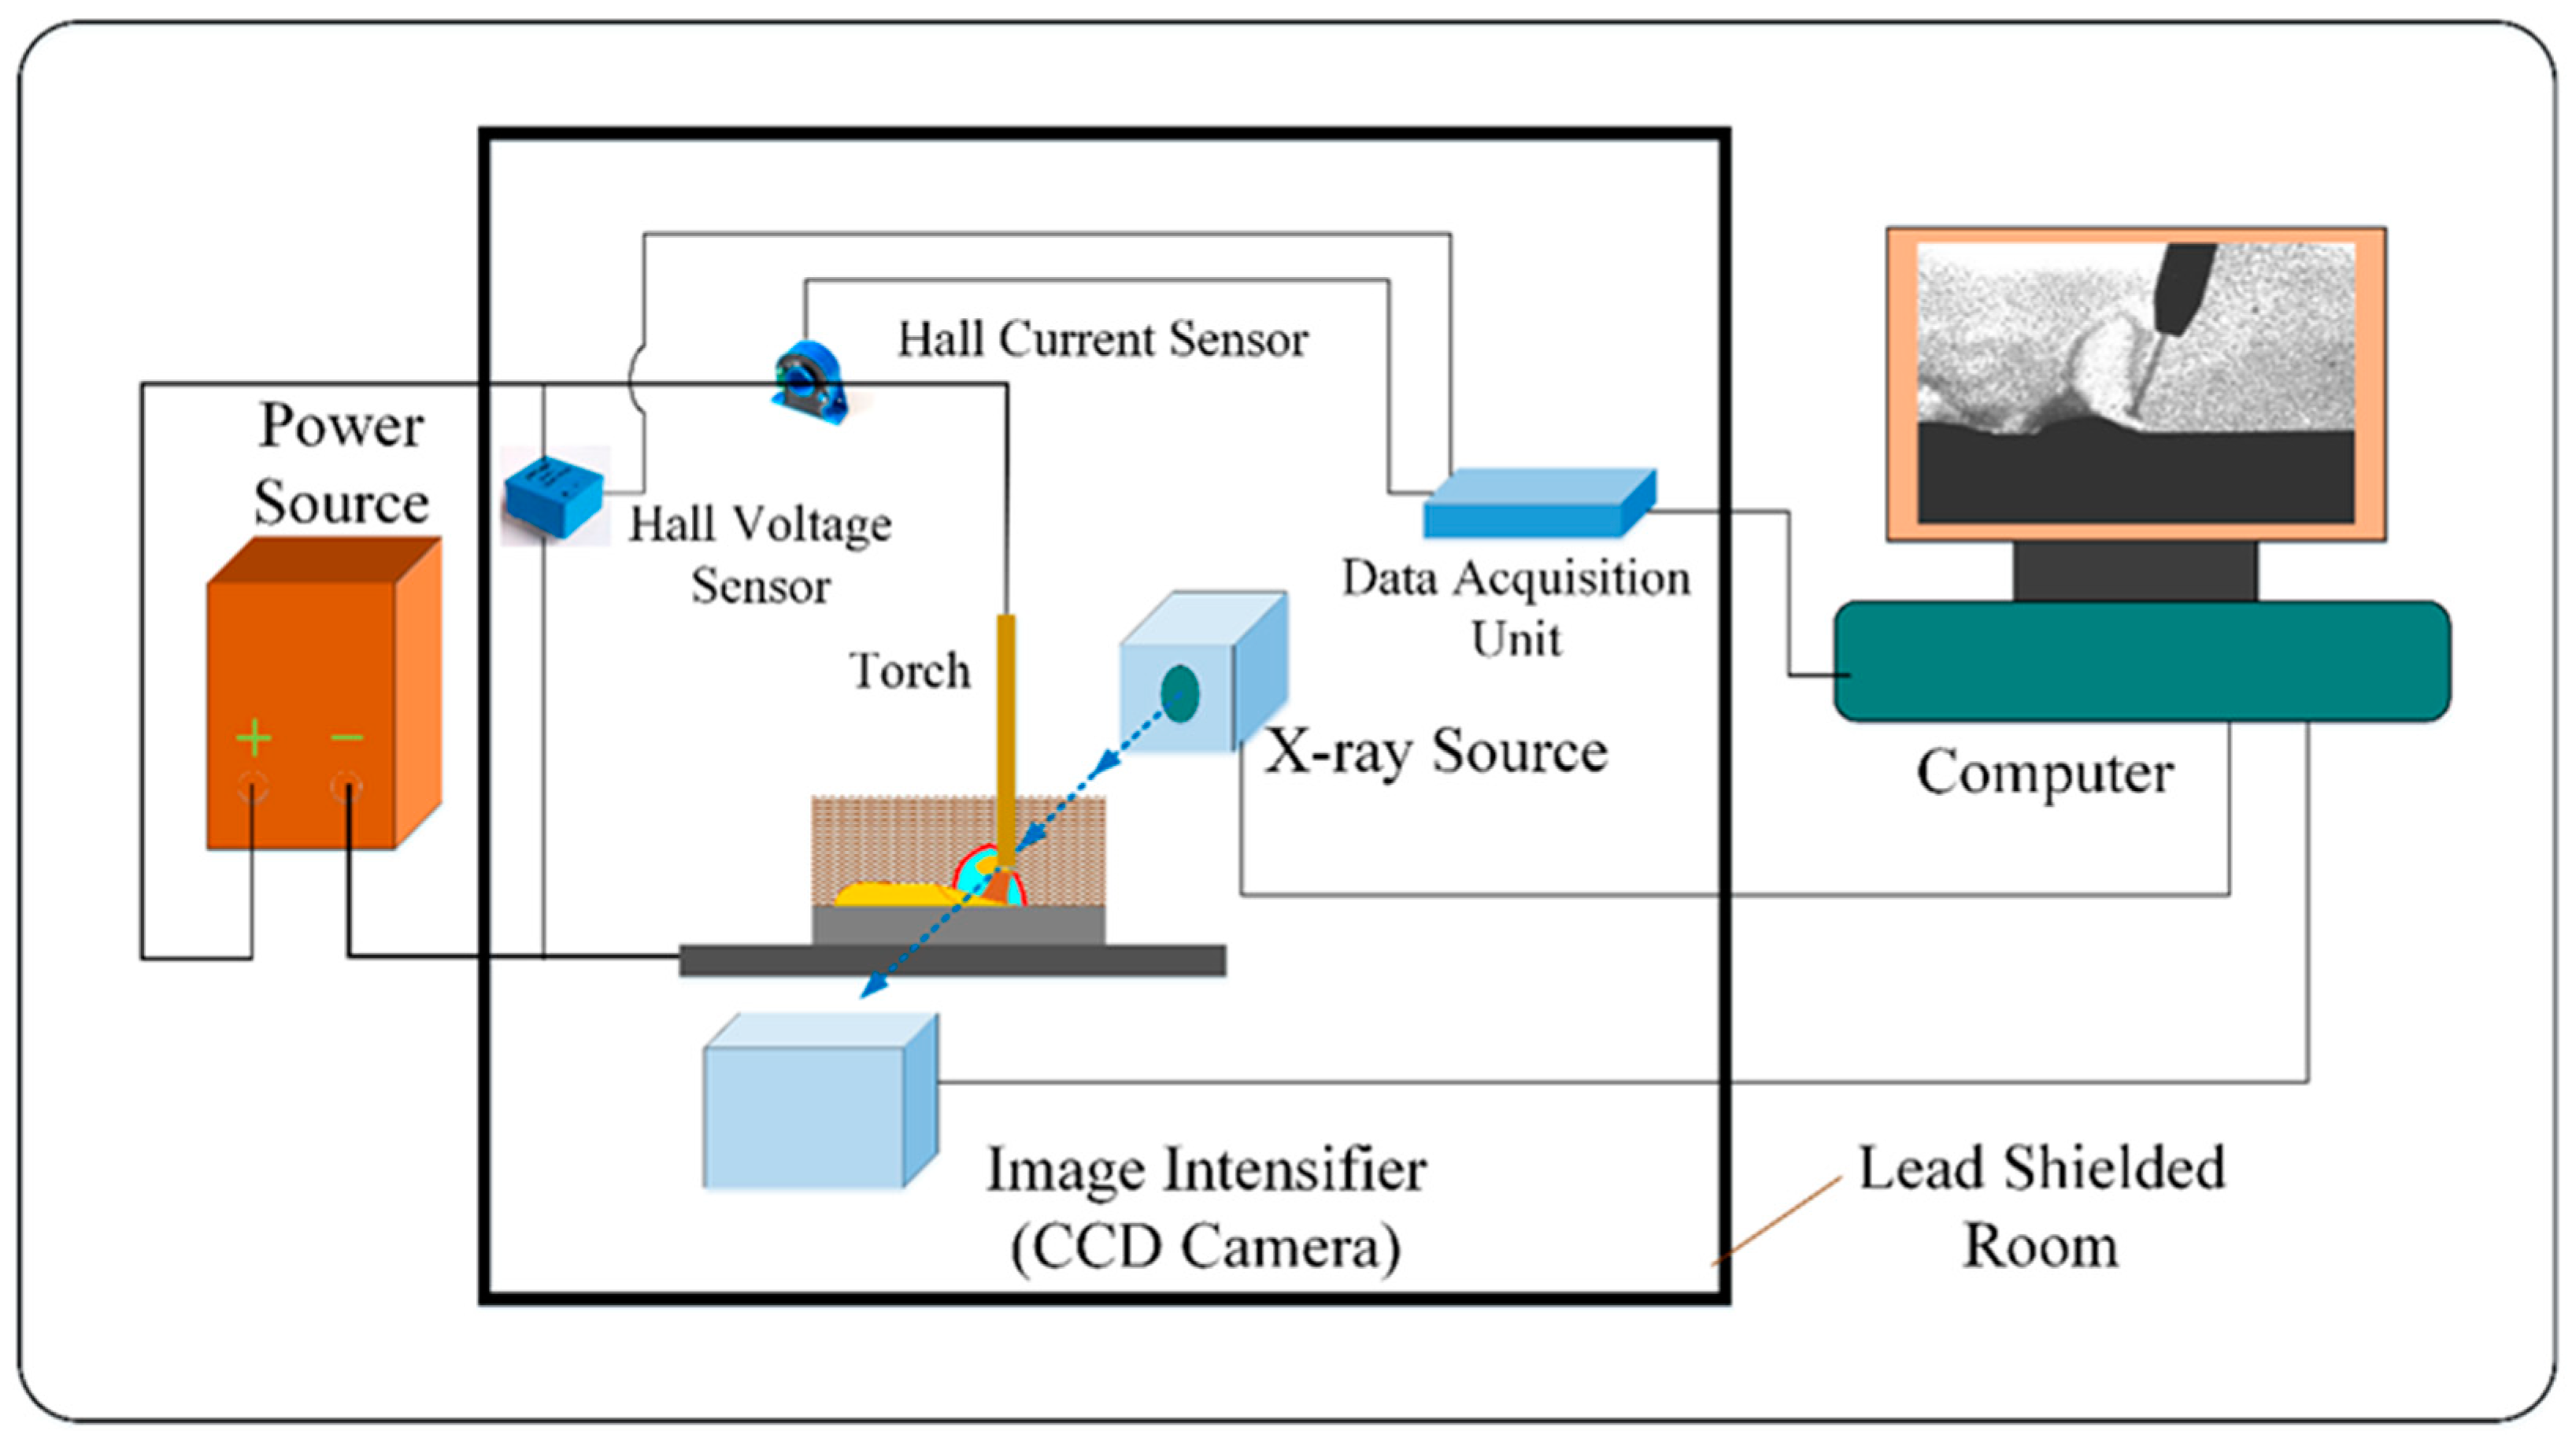
The X-ray imaging system used in this trial is schematically shown in Figure 1. As it displays that the whole system is mainly composed of the welding platform (including the power source, welding torch, and base metal), the X-ray source HPX225 (Varex, Salt Lake City, UT, USA), image intensifier, and camera 1313DX (Varex, Lake City, UT, USA), of which the latter is placed parallel on both sides of the welding zone to film the process features, while the torch remains stationary to the camara. After preliminary testing, the specific parameters for the X-ray imaging system were set to be a tube voltage of 135 kV, a tube current of 2 mA, a resolution ratio of 512 × 512 pixels, and a frame rate of 90 fps. Synchronous electrical signals of real-time welding current and arc voltage information were collected by a data-acquisition unit, which was connected to the Hall units in the welding circuit. The sampling frequency was set as 2000 Hz. Both electrical and X-ray visual signals could be simultaneously acquired through a program based on the software Lab View. All tests must be conducted in a lead-shielded room with a video monitor so the X-ray radiation to personnel and equipment can be avoided.
3. Results and Discussion
3.1. Observation Results of the Welding Process
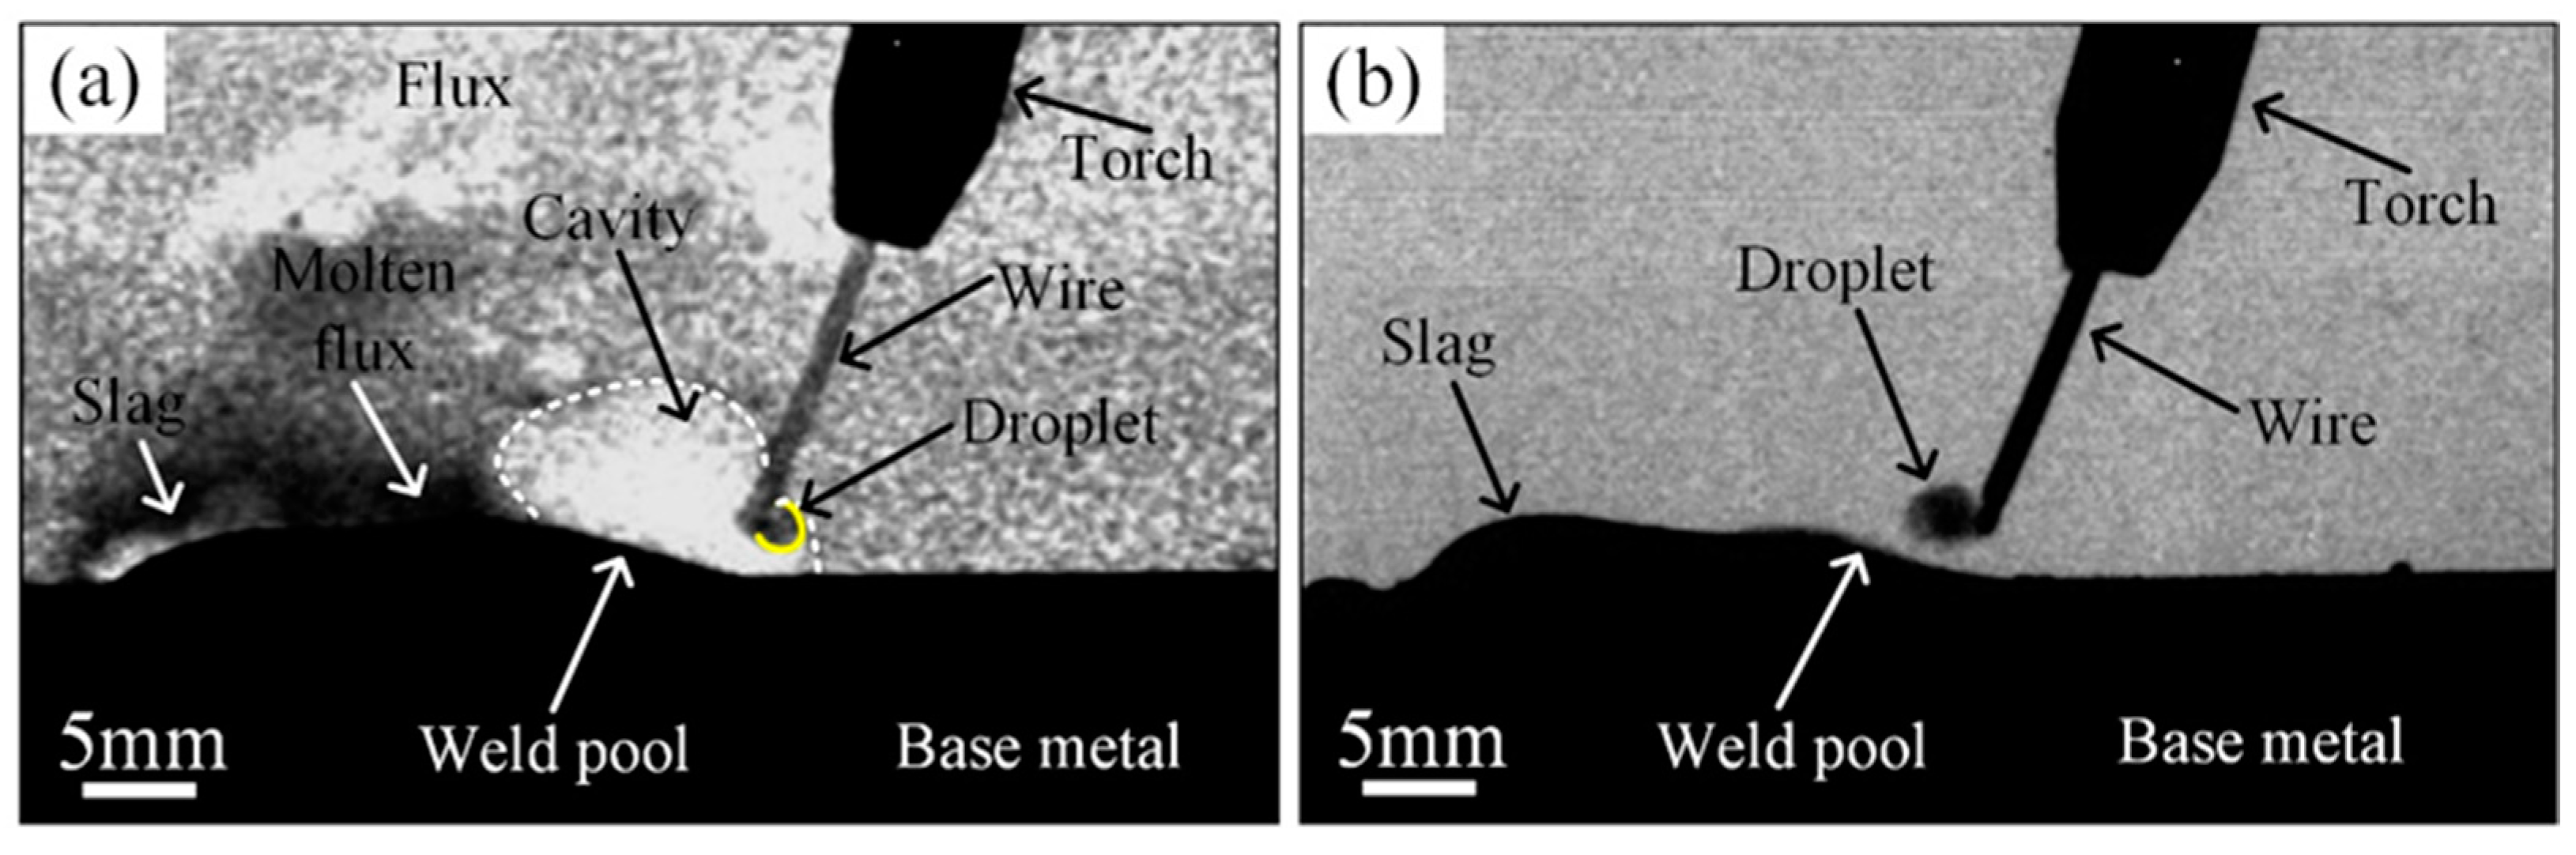
The X-ray observation results of SAW and FCAW in air are shown in Figure 2. It can be clearly seen that the SAW process occurs in a cavity that is composed of gases released from the decomposition of wire core powder, flux, and metal vapor, although the arc seems invisible due to the nature of the X-ray. While most parts of the cavity are located at the back of the wire, the rest of it occupies the space around the front of the wire. Inside of the cavity, the droplet hangs on the tip of wire but swings to one side of it. In addition, the molten flux covers the back of the weld pool while the liquid metal flows far behind and solidifies there as weld with slag on top, as shown in Figure 2a. Unlike the process of SAW, there is no visible cavity around the welding zone in FCAW conducted in air, although the droplet attaches to one side of the wire, too. The liquid metal in the weld pool moves calmly to the back and finally solidifies under the cover of slag, as shown in Figure 2b.
3.2. Metal Transfer
3.2.1. Repelled Droplet Transfer in FCAW
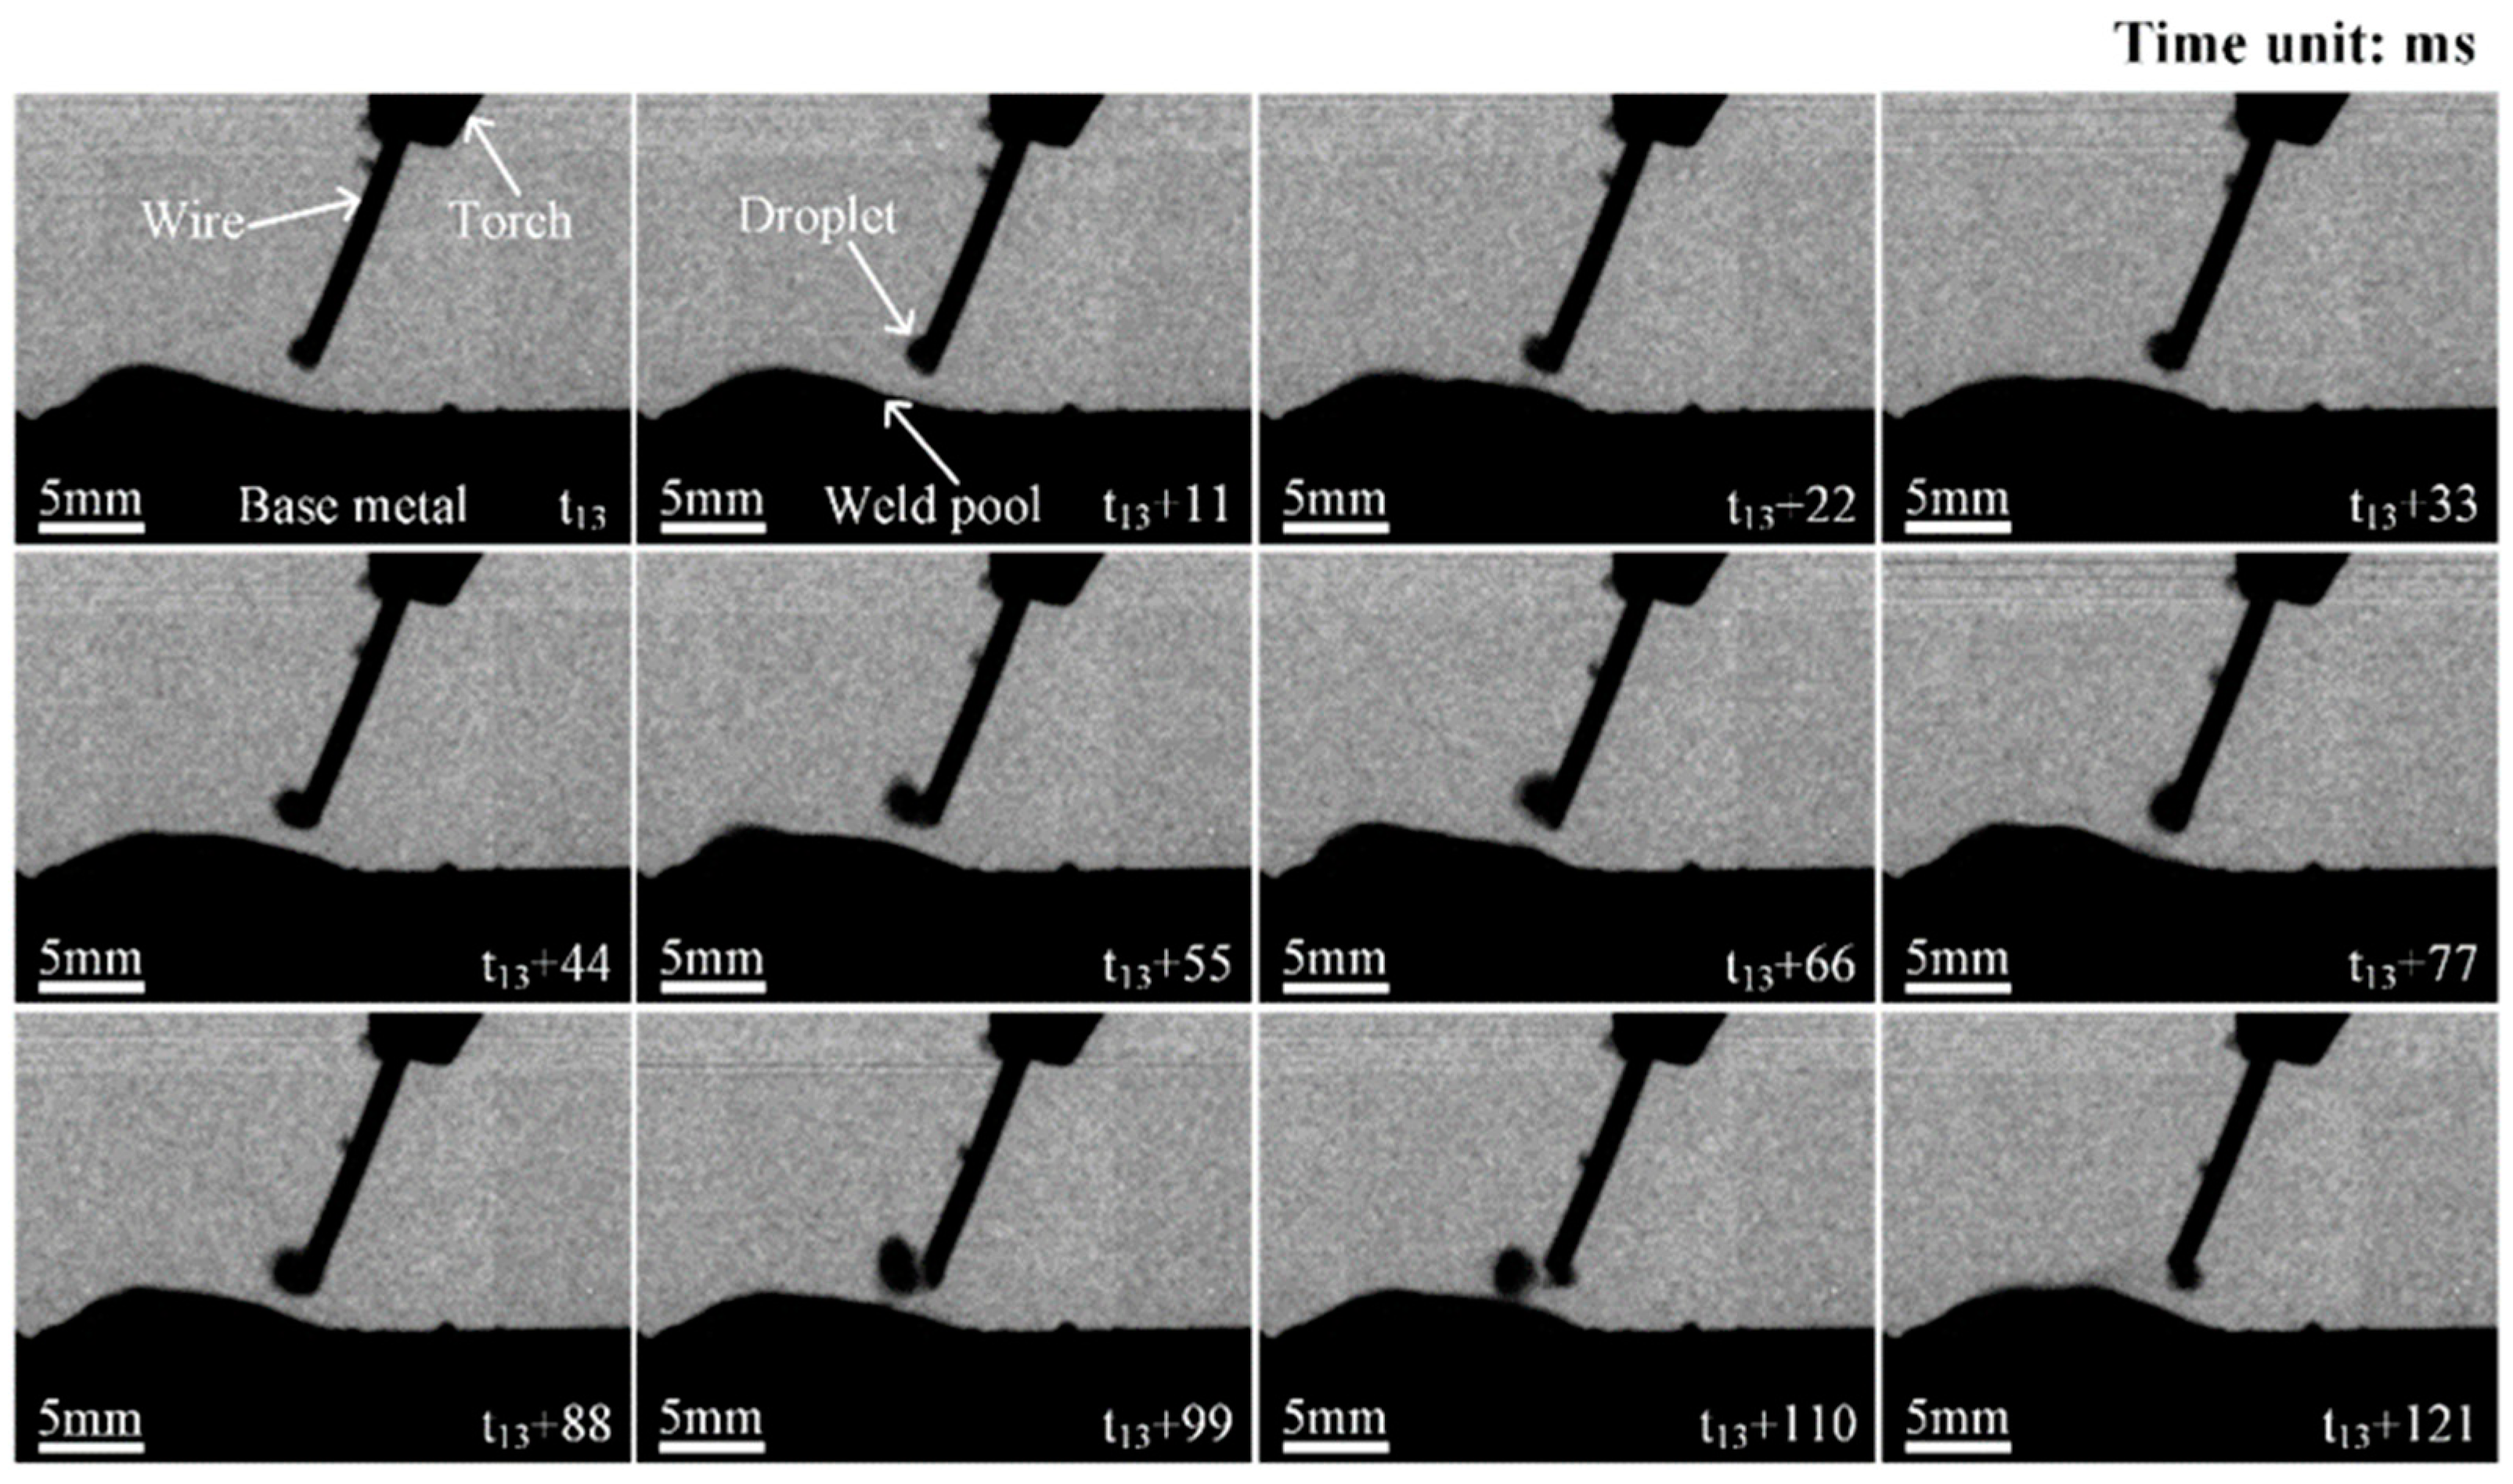
The metal transfer mode of FCAW conducted in air is basically confirmed to be a repelled droplet transfer, as shown in Figure 3. Since there is no gas cavity or bubble around the droplet, the dynamic behavior of it is mainly determined by the process characteristics of the self-protected flux-cored wire welding. At the initial stage of one transfer cycle, the newly formed small droplet often attaches to one side of the wire with a small angle, as shown in t13 + 11. (Here, the 13 stands for the beginning of the timeline, while 11 represents the time interval between this figure and the initial one, which is 11 ms). As the conductivity of the powder inside of the flux-cored wire is far weaker than that of the outer steel strip, the welding current channel will be established between the strip and the surface of the base metal to form an arc. Under the repulsion of a electromagnetic force and other resistances, the droplet will deviate from the axis of the wire and swing to one side of it. With the continuous melting of the wire, the volume of the droplet gradually increases to a level that the gravity of it should be strong enough to promote the droplet to break away from the tip of wire and fall into the weld pool, as shown in t13 + 110. It is worth noting that during the period of droplet attachment to the tip of wire, the angle between the droplet and the wire does not change much, indicating that the process is steady in FCAW.
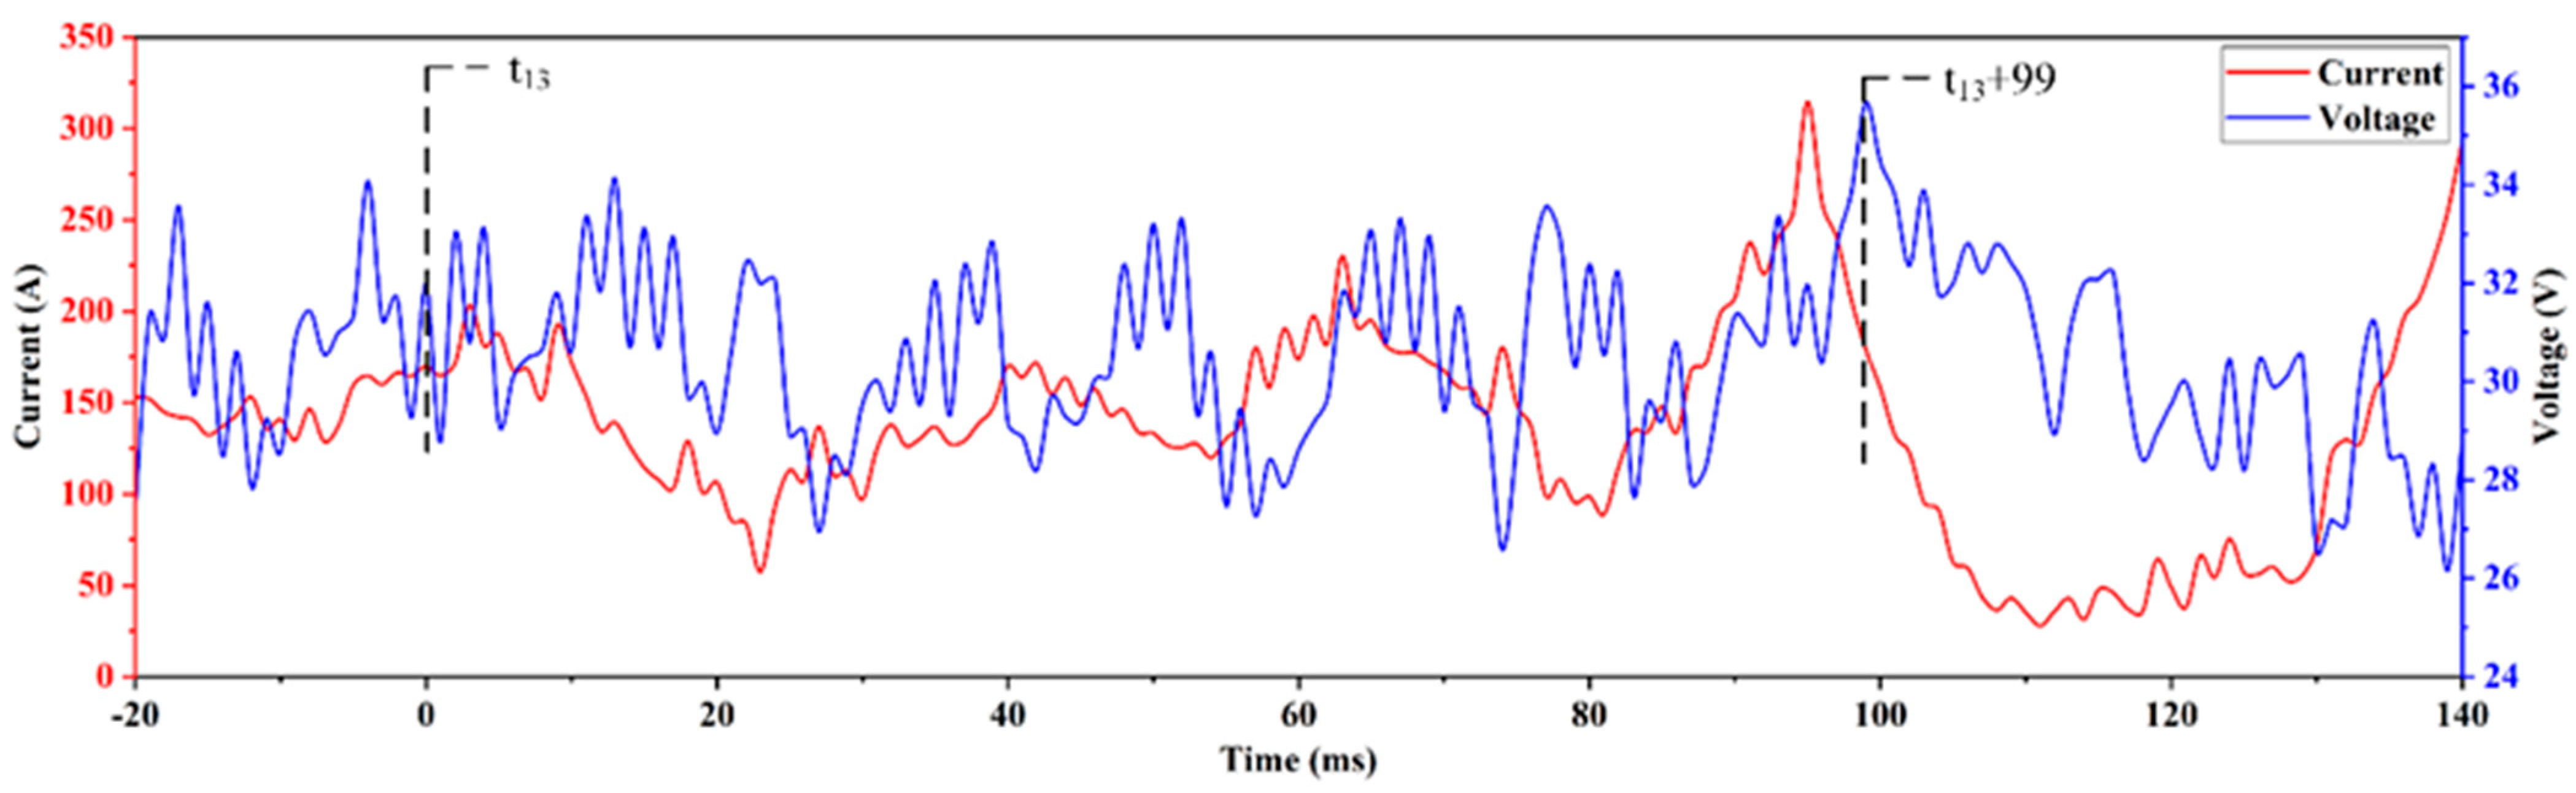
The synchronous electrical signal of the repelled droplet transfer in FCAW is shown in Figure 4. It shows that the electrical signal does not greatly fluctuate during the whole droplet-transfer process, and no obvious arc break or short circuit occurs. Although the arc voltage rises to 35.7 V the moment when the droplet breaks away from the wire, it quickly drops back to the normal value of 30 V as a new droplet forms at the tip of wire. Therefore, the characteristics of electrical signal prove that the dynamic behavior of the droplet is not complicated and that the process stability is maintained on a high level.
3.2.2. Front Flux Wall-Guided Droplet Transfer in SAW
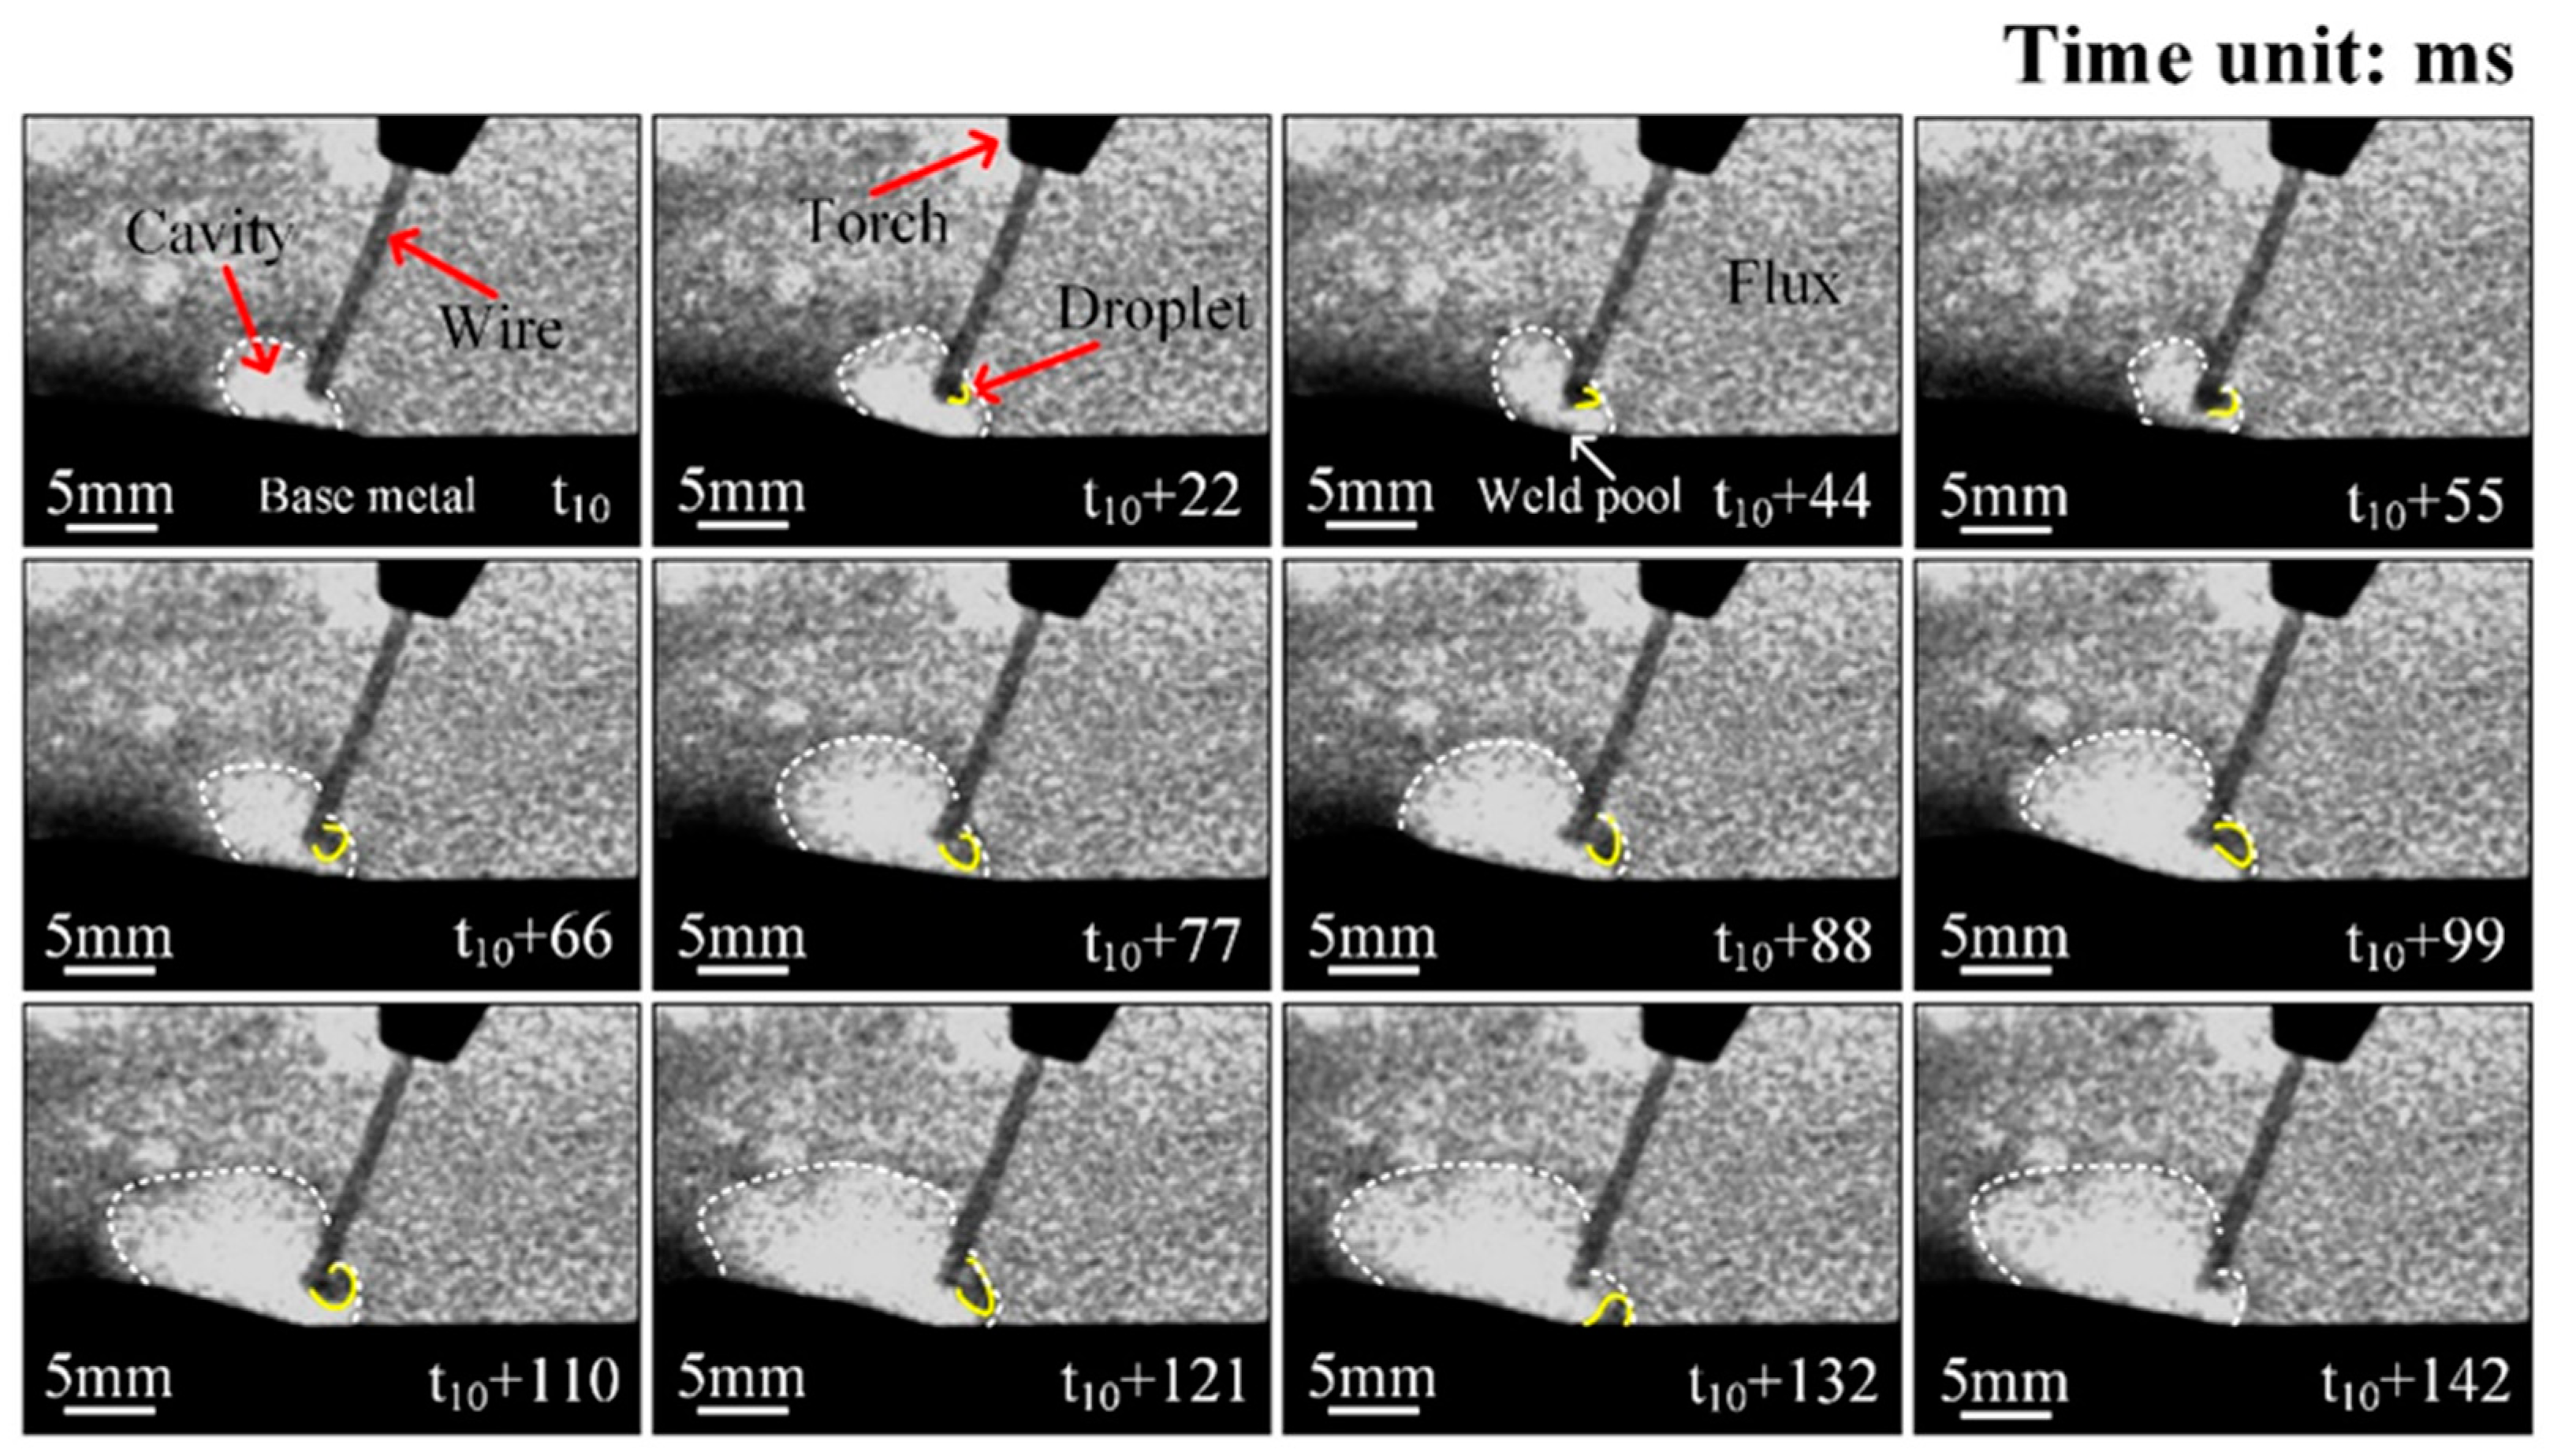
Through a full investigation of the X-ray observation images of the SAW process, three fundamental metal transfer modes are confirmed: the front flux wall-guided droplet transfer mode, the back flux wall-guided droplet transfer mode, and the repelled droplet transfer mode, respectively. The typical front flux wall-guided droplet transfer mode is shown in Figure 5. Just as in FCAW, the small droplet at the tip of wire also swings to one side in the initial phase of one transfer cycle, as shown in t10 + 22. With its volume increases, the droplet gradually touches with the inner wall of the cavity on the front side, as it shows in t10 + 55. Once it contacts the flux wall, surface tension forms at the interface between the droplet and the wall. Under the action of surface tension, the droplet is pulled to break away from the wire as contacting area between it and the flux wall continues to expand. Finally, it detaches from the tip of wire and transfers into the weld pool guided by the flux as shown from t10 + 66 to t10 + 132. Due to the whole transfer mainly occurs at the front side of cavity, it is defined as the front flux wall-guided droplet transfer.
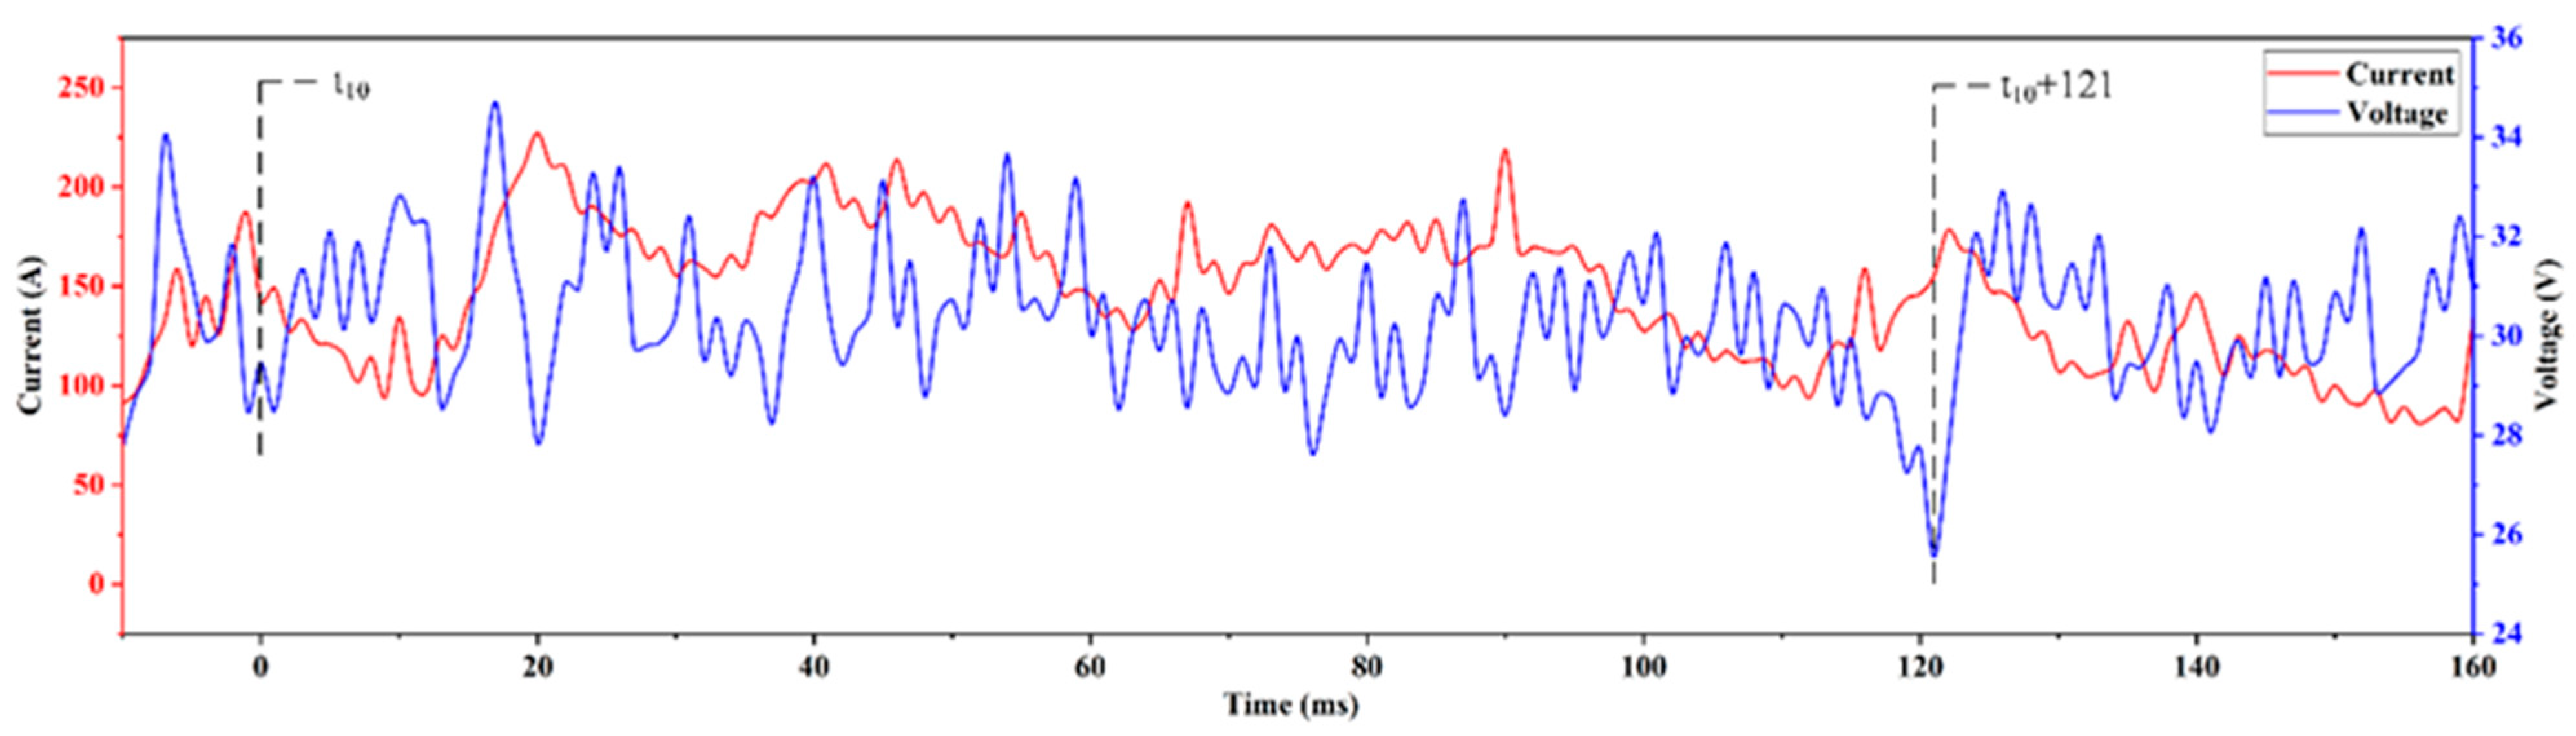
The synchronous electrical signal of the front flux wall-guided droplet transfer mode in process of SAW is shown in Figure 6. Due to the arc voltage is proportional to its length, it can reflect the stability of the welding process. Obviously, the arc voltage stays around the preset value of 30 V during whole transfer cycle. Although it drops to 25.5 V when the droplet is stretched downward by the surface tension and is about to be separated from the wire, and then it quickly rises to the normal value. In addition, short circuit does not happen even when the droplet touches with the flux due to the low conductivity of it, demonstrating the stability of SAW process is basically not affected by the droplet dynamics.
3.2.3. Back Flux Wall-Guided Droplet Transfer in SAW
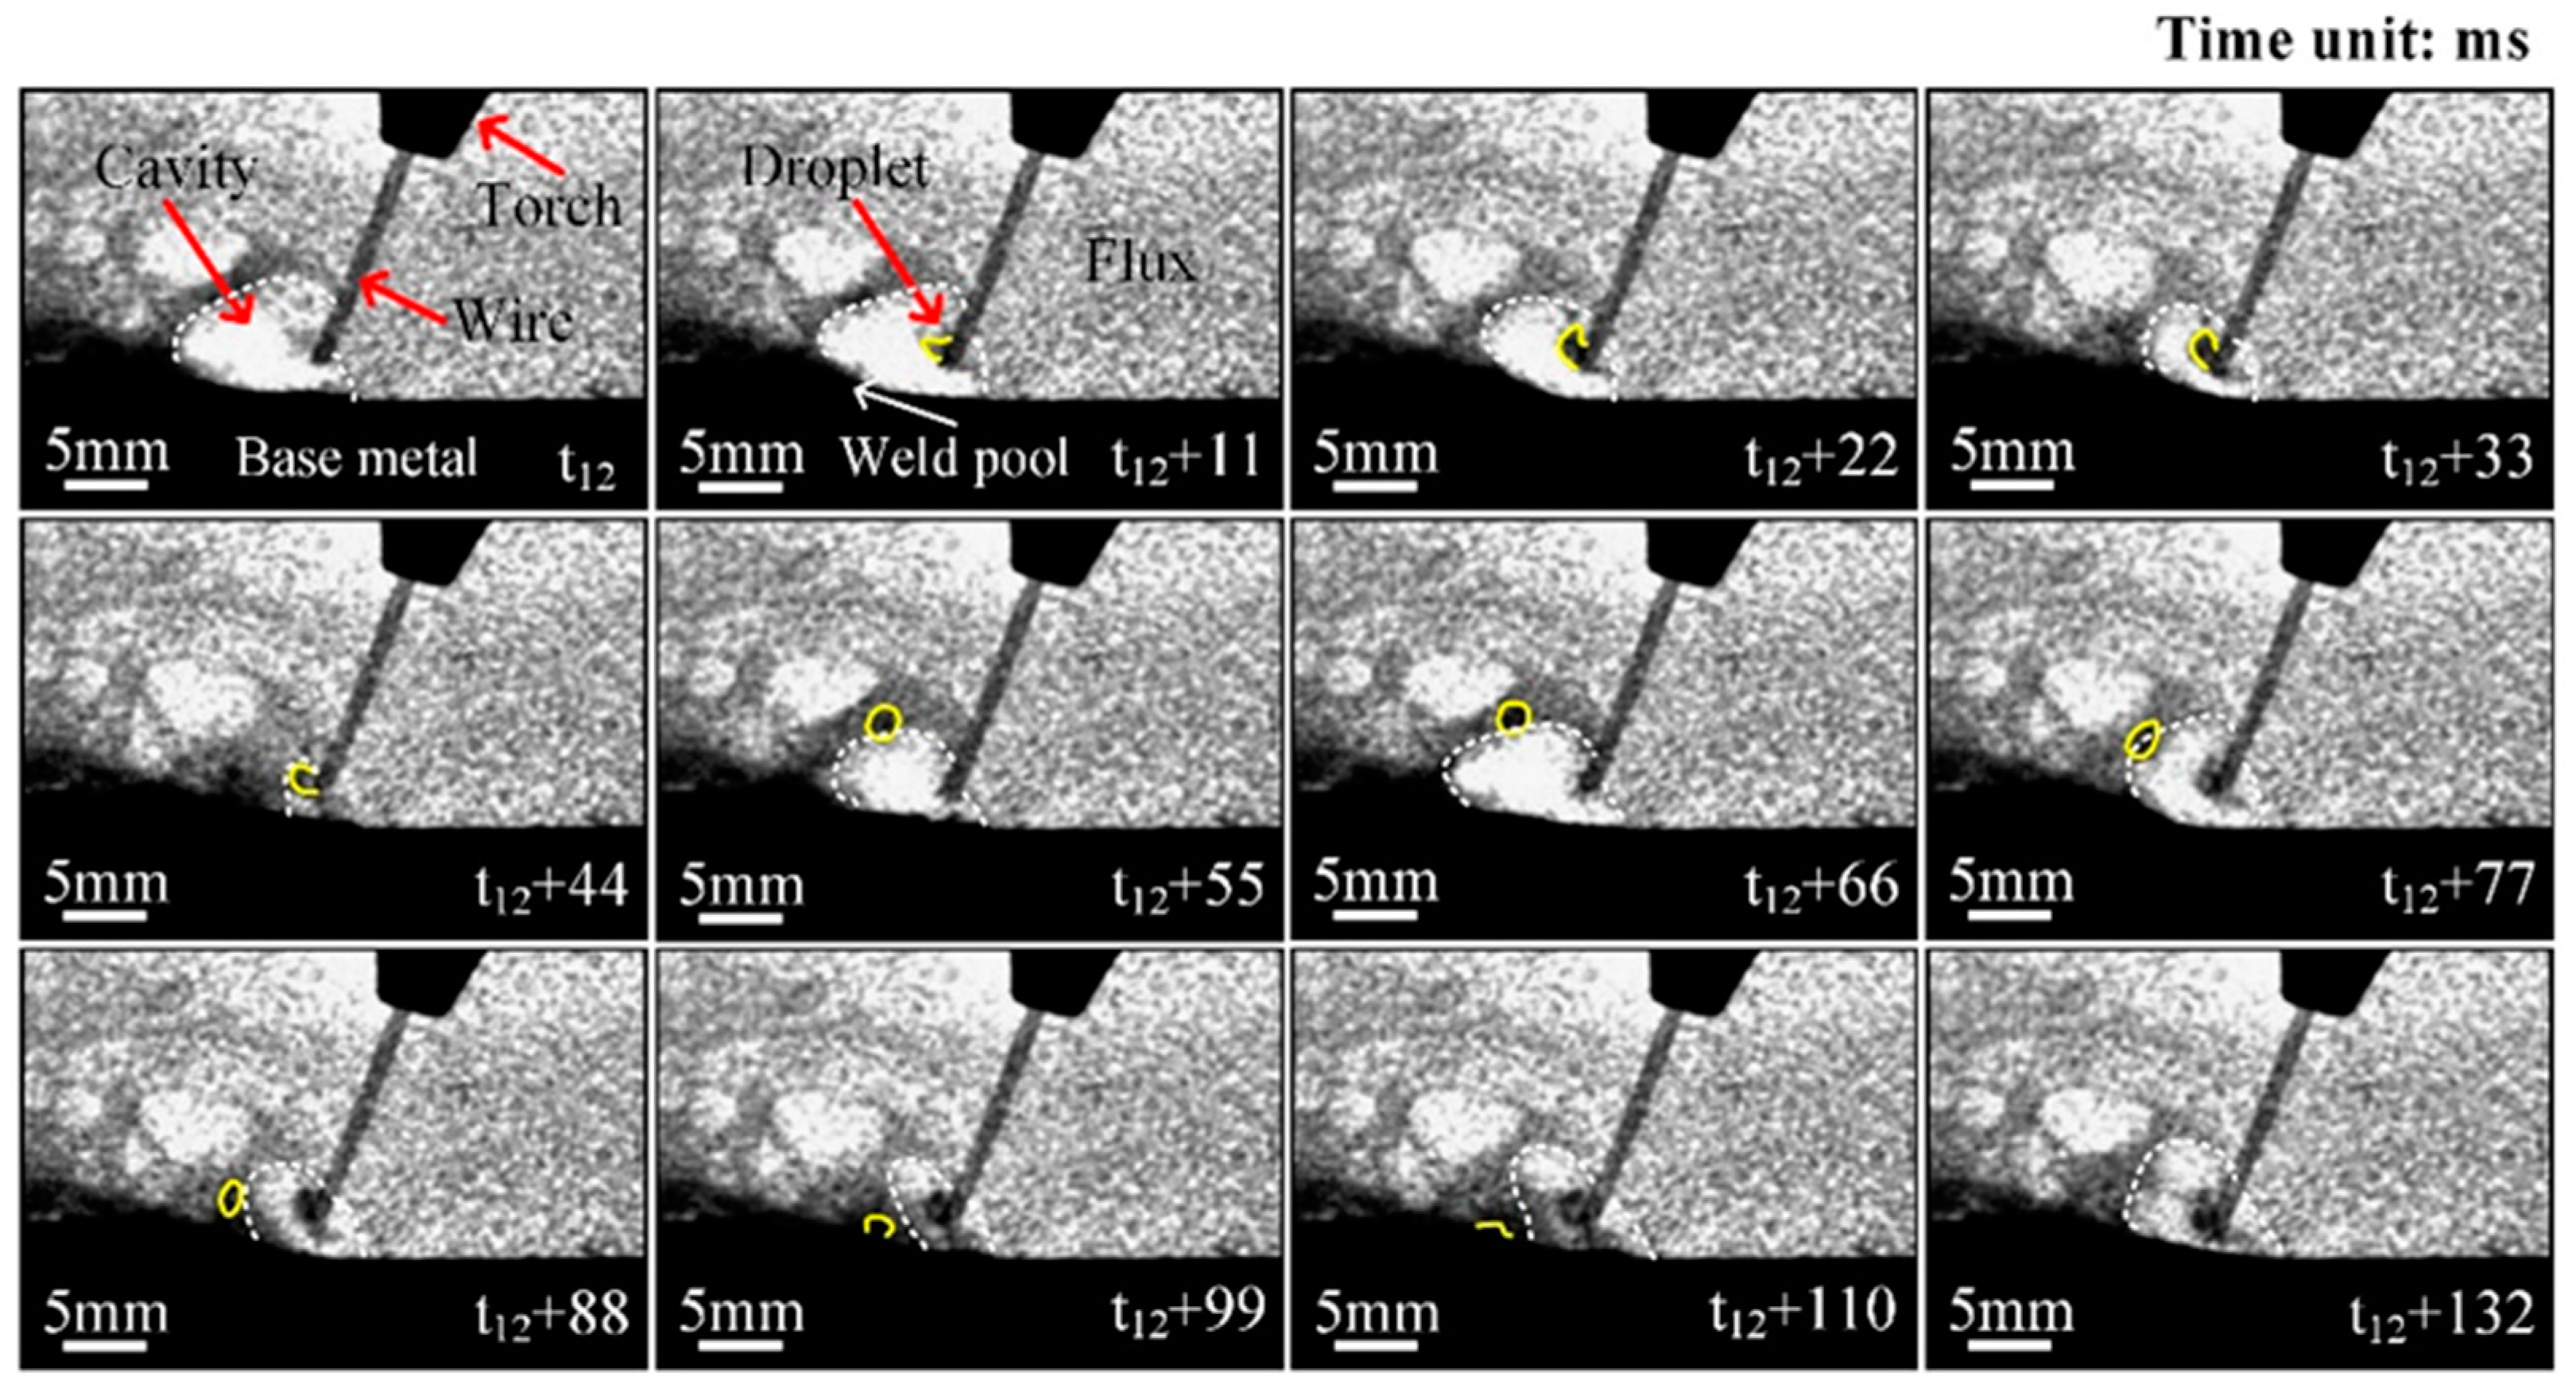
The back flux wall-guided droplet transfer mode of SAW process is shown in Figure 7. At the beginning of this transfer mode, the newly formed small droplet stays at the back side of wire tip with a dynamic angle. With the wire melts continuously, the volume of droplet increases gradually, meanwhile, the cavity keeps to shrink as the gas inside of it leaks out. When the volume of the cavity decreases to the minimum level, the droplet touches with the inner wall easily due to the distance between them is quite short, as shown in t12 + 44. Then the cavity starts to expand and the droplet is pulled to break away from the wire and rises as itself adhering to the inner wall of cavity, as shown in t12 + 55. After the cavity reaches the maximum size, it begins to contract again and the droplet falls back along the inner wall simultaneously. Finally, it squeezes into the weld pool through the molten flux to finish one transfer cycle. Due to this kind of transfer occurs in the back of cavity, it is defined as the back flux wall-guided droplet transfer in this paper.
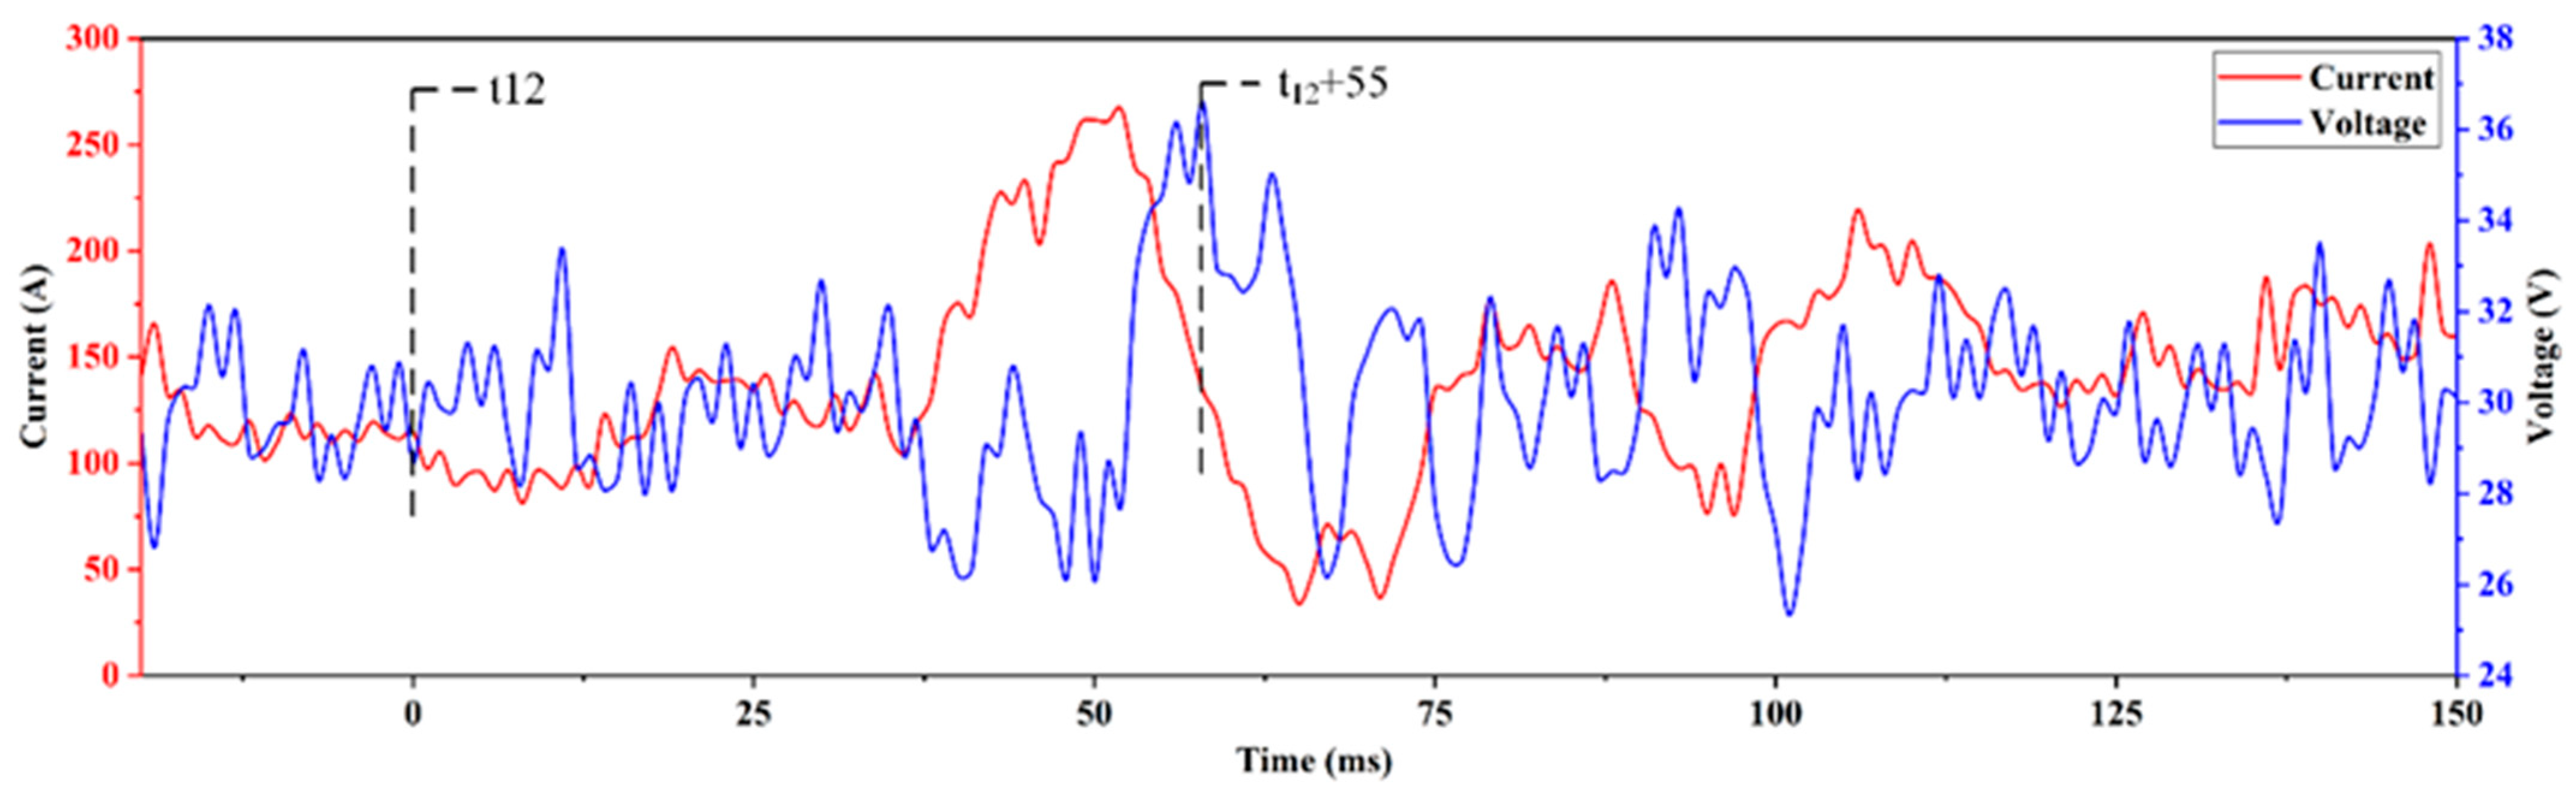
The synchronous electrical signal of the back flux wall-guided droplet transfer mode as mentioned above is shown in Figure 8. It is evident that during most time of the transfer cycle, the arc voltage fluctuates in a small range around the normal value of 30 V, though it slightly rises to 36.6 V when the droplet breaks away from the wire under the action of expanding flux wall. After that, the arc voltage turns back to the level of preset value in a very short period, which indicating its excellent ability to stabilize the welding process.
3.2.4. Repelled Droplet Transfer in SAW
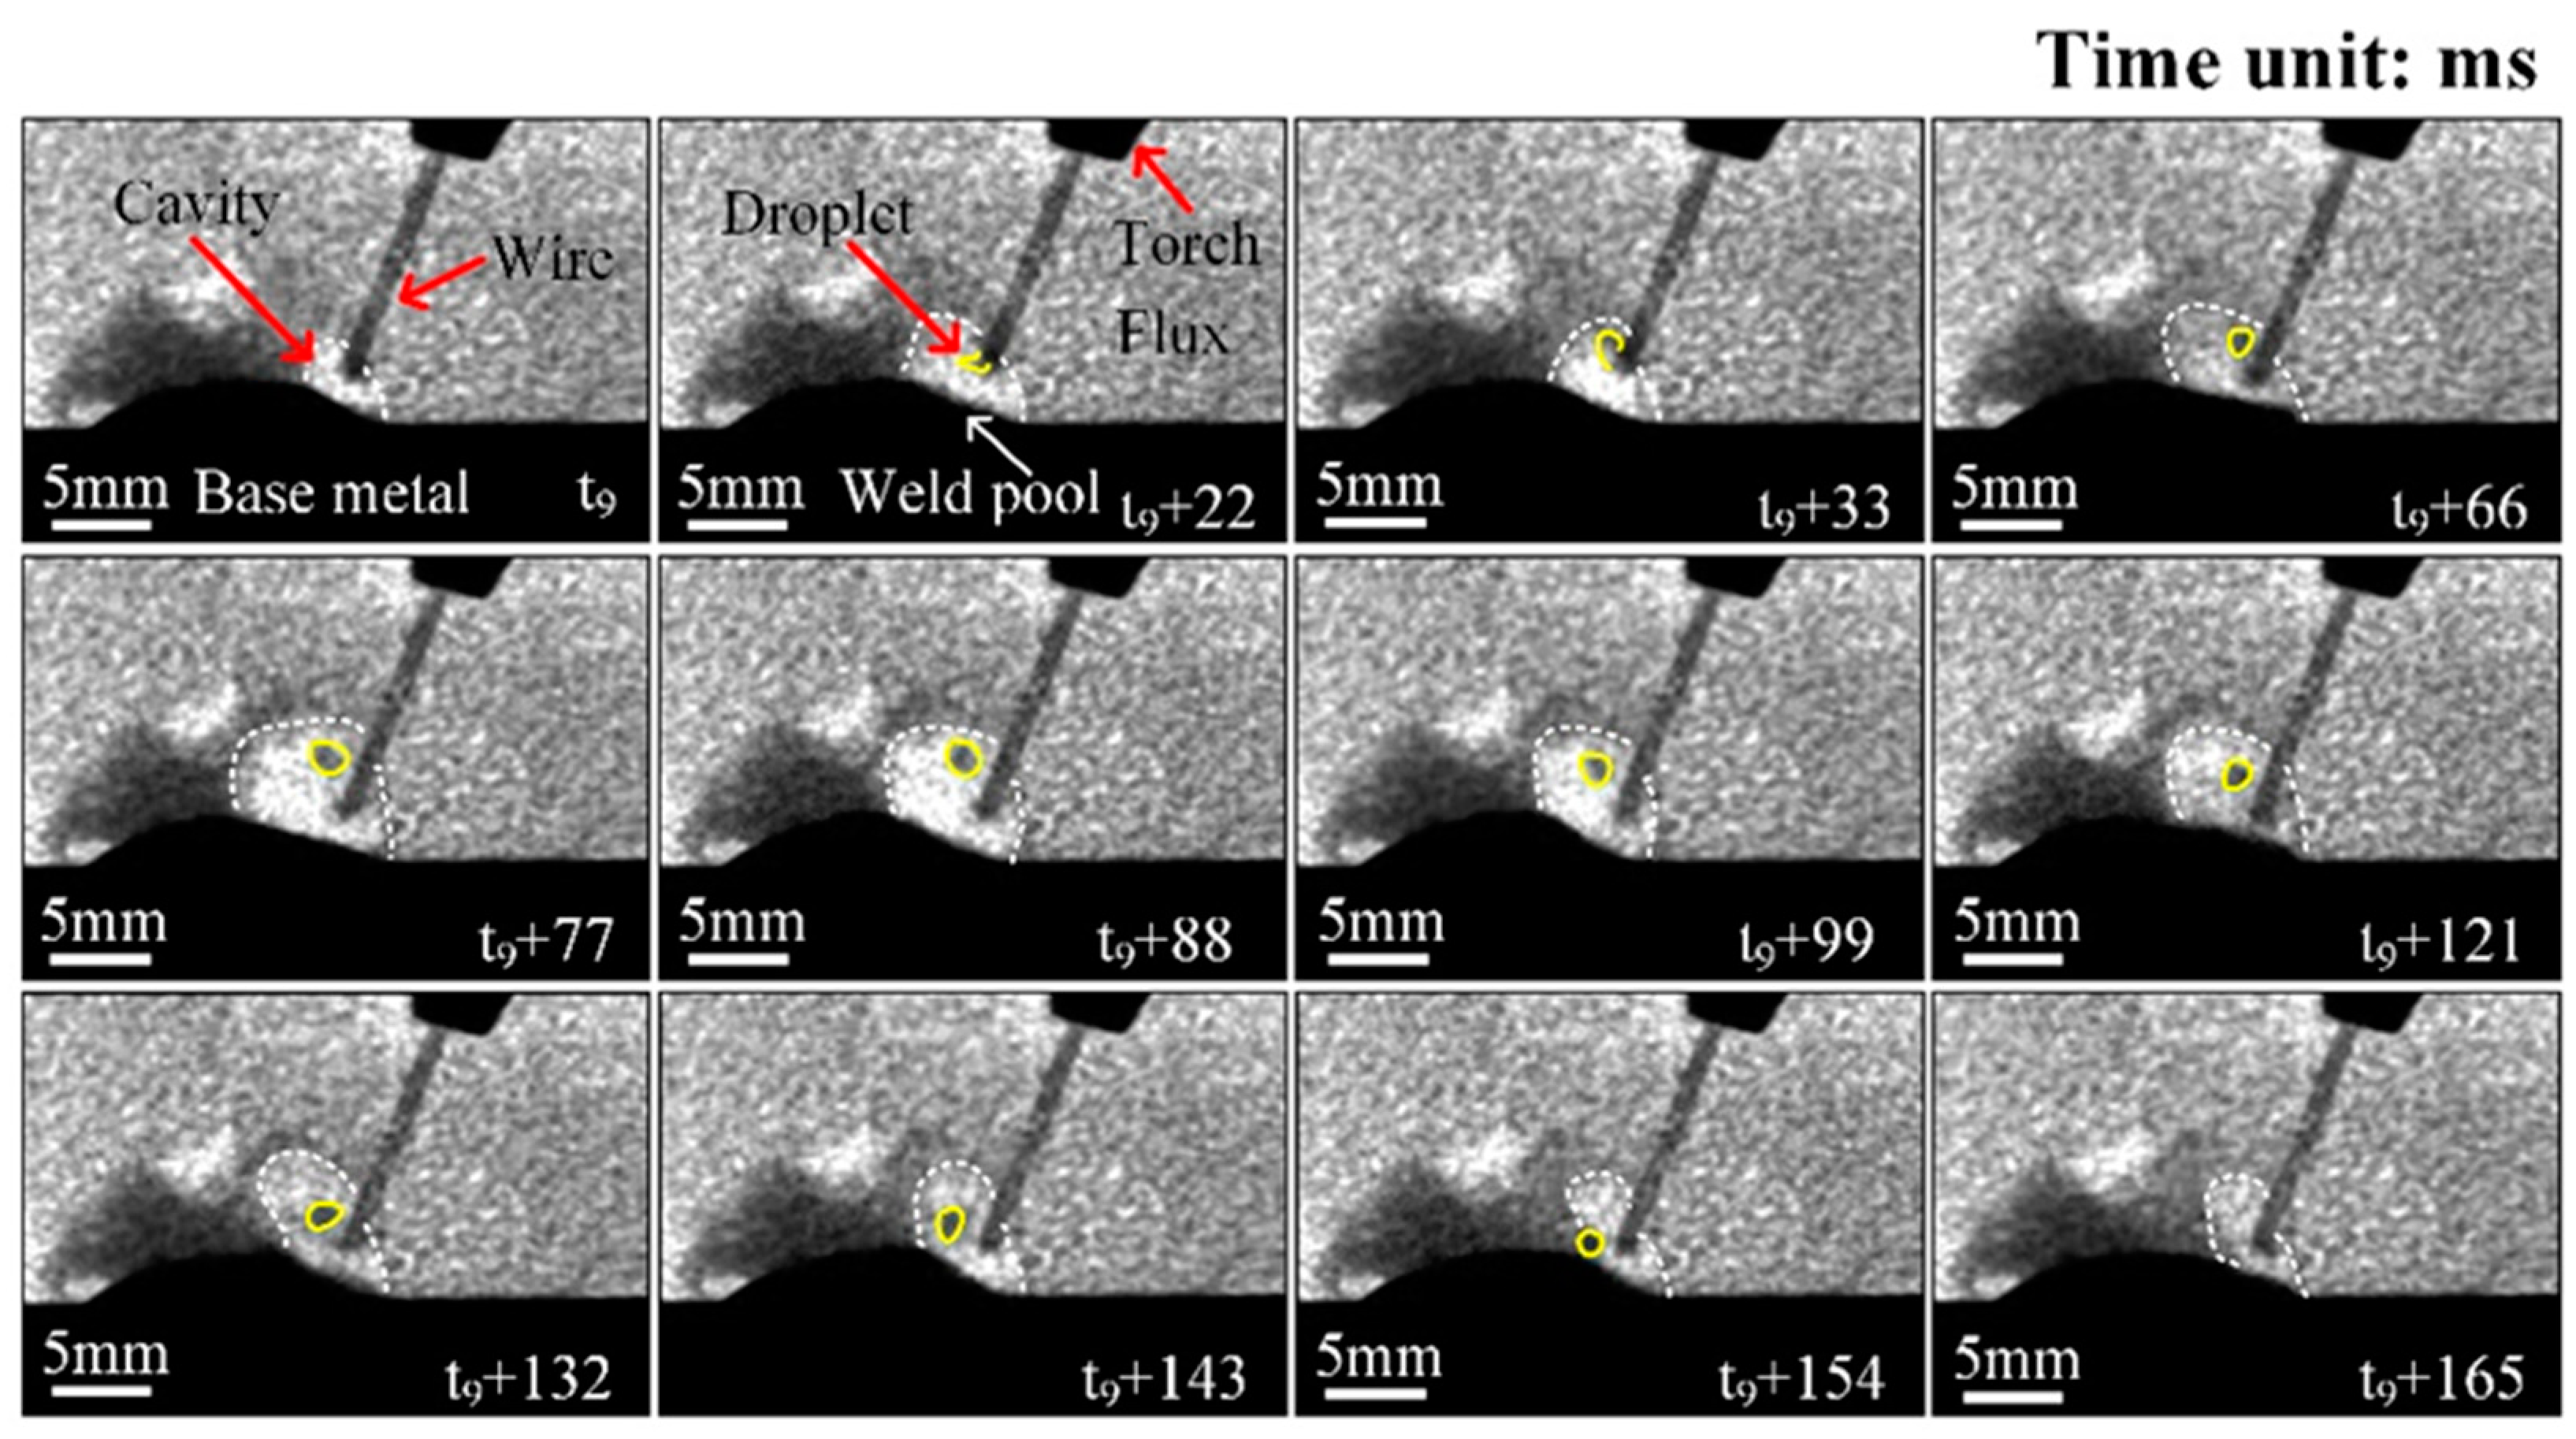
The typical repelled droplet transfer mode in SAW process is shown in Figure 9. Partially like it in the flux wall-guided transfer, the droplet also turns to one side of the wire once it forms at the tip in the beginning of repelled transfer, as shown in t9 + 22. Since the cavity is filled with flowing gas, thus, according to the theory of fluid mechanics, dragging force can act on the droplet and push it to swing up around the wire tip, as shown in t9 + 33. Under the combined action of gas flow dragging force and other repulsive forces, the droplet detaches from the wire at the moment of t9 + 66 and moves up to some point, then it turns to fall and finally enters the weld pool to complete one transfer. It should be noted that although the droplet may touch with the inner wall of cavity before detachment, it is the repulsive forces including the gas flow dragging force acting on the droplet promote its separation from the wire, not the flux of the cavity wall. Specifically, the droplet moves upward instead of downward after the detachment, although it is repelled into the flowing flux as the cavity shrinks to the minimum size. Then the droplet turns to move down through the flux and falls into the expanding cavity, completely disconnecting from contact with the flux. Therefore, repelled transfer is confirmed to be a new metal transfer mode which is different from the flux wall-guided transfers.
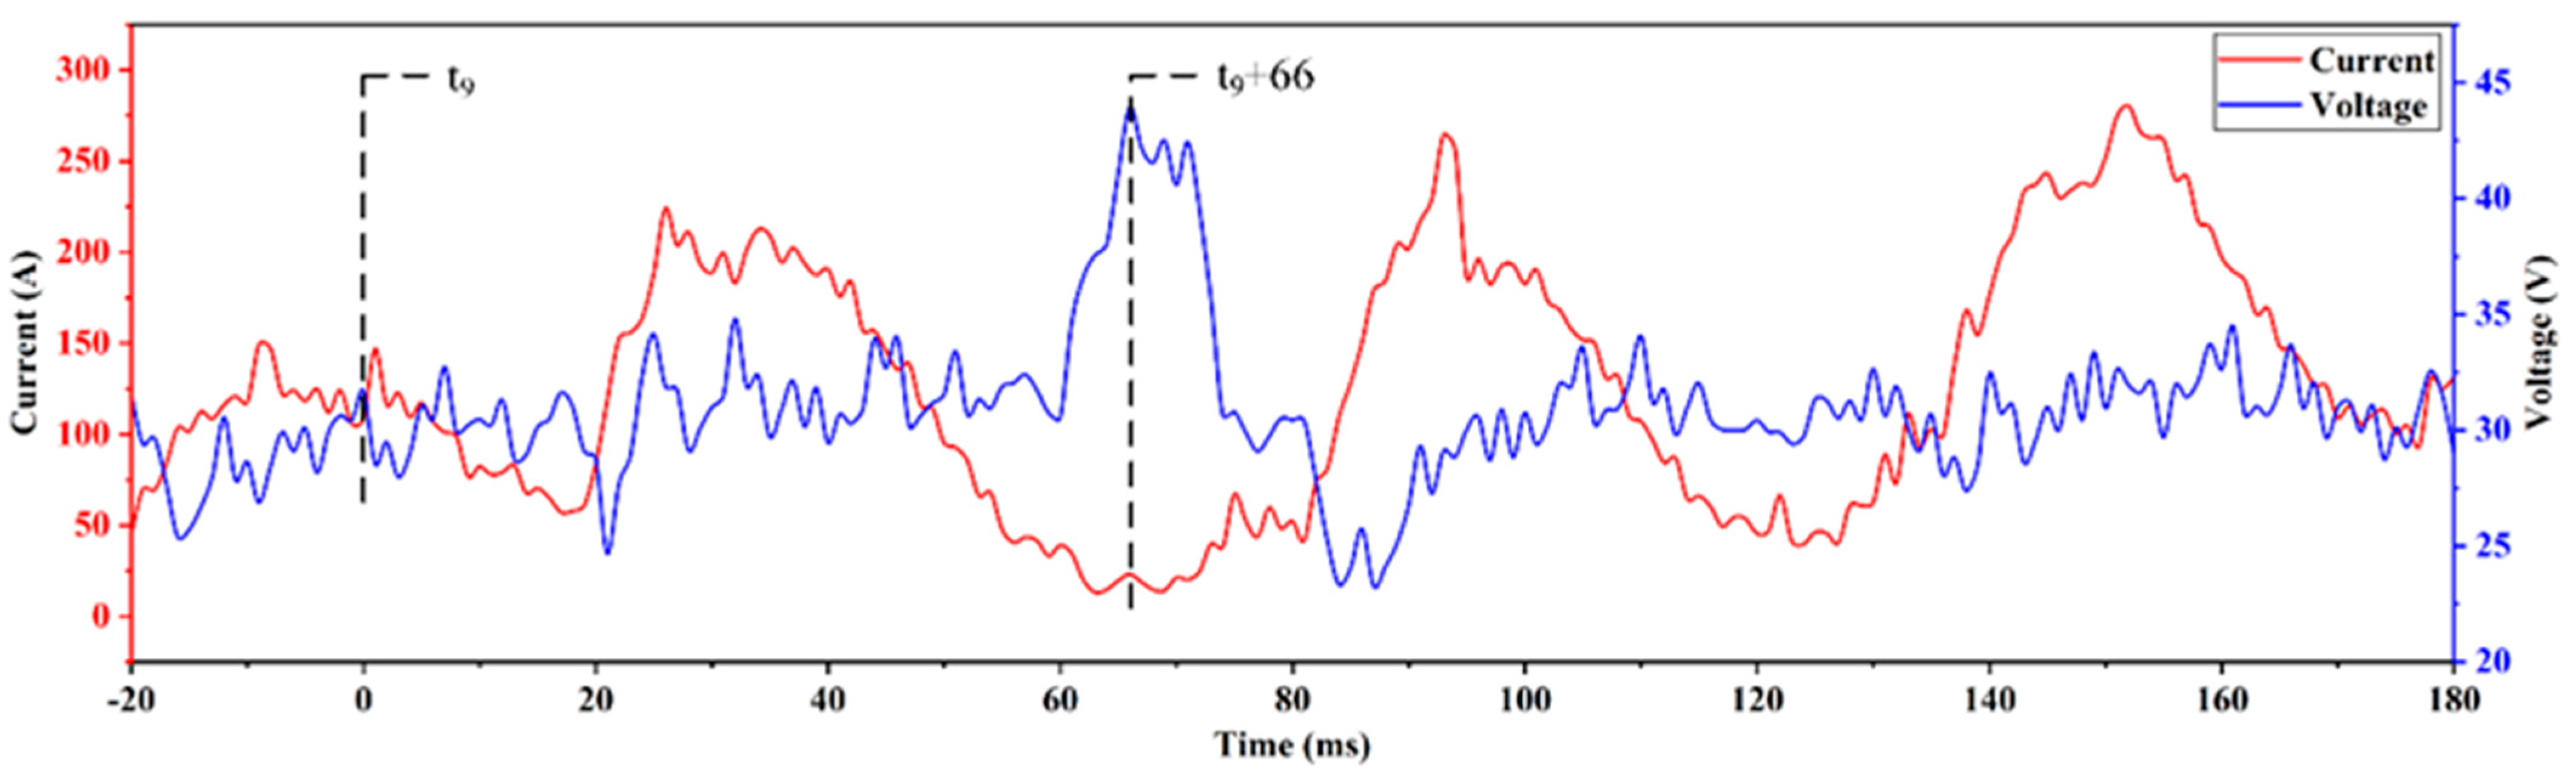
Figure 10 shows the corresponding synchronous electrical signals of the repelled droplet transfer mode in SAW. Although the arc voltage rises to a relatively high value of 43.9 V, it drops to the normal range quickly after that. It is generally believed that arc break often happens if the arc voltage exceeds the critical value of 45 V, so the arc does not burn out as the droplet is repelled to detach from the tip of wire. In addition, it seems that the arc is almost totally covered by the flux as the cavity shrinks to its minimum size, however, it still burns there according to the electrical signal analysis. Thus, the process stability has not been significantly deteriorated and weld with high quality should be achieved.
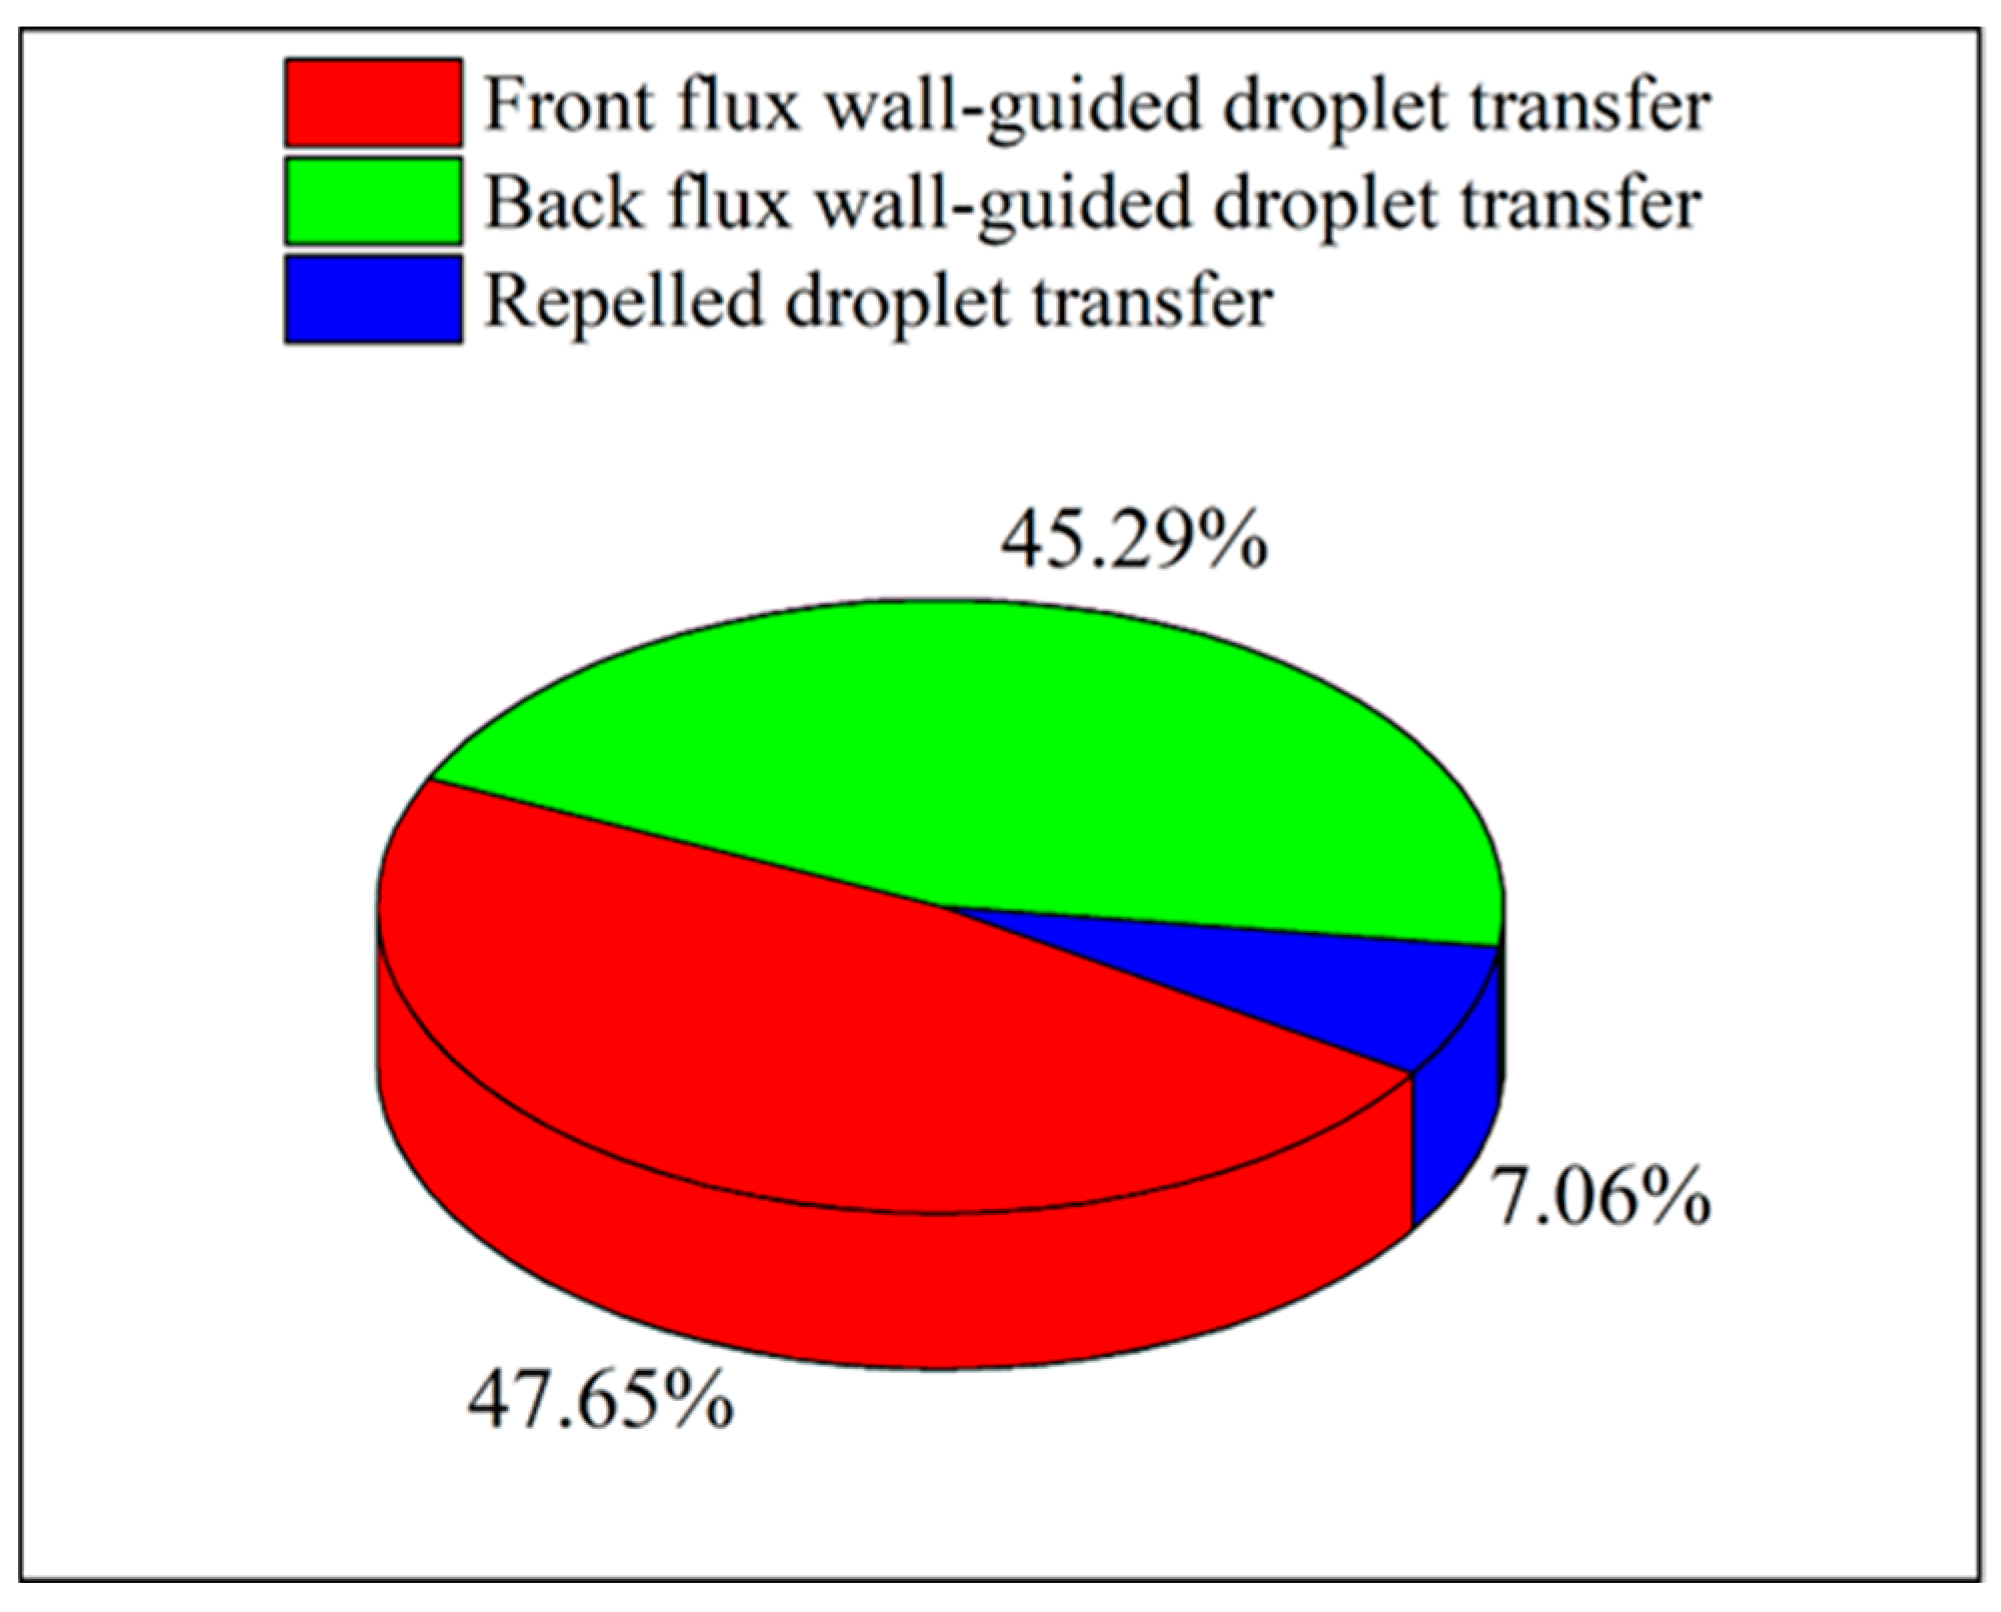
Since there are three types of metal transfer modes in the process of SAW, it is necessary to find out the proportion of each mode to the selected continuous process. At least 30 s of the captured X-ray video for SAW is analyzed and the statistics results are shown in Figure 11. It can be found that the proportions of the three different droplet transfer mode are 47.65%, 45.29% and 7.06%, respectively. Obviously, the repelled droplet transfer occurs much less frequent than the other two. And the proportion of front flux wall-guided droplet transfer is merely 2.36% more than that of the back flux wall-guided droplet transfer, indicating the flux wall-guided transfer is the leading form of droplet transition in SAW.
3.3. Statistics Analysis of the Metal Transfer for FCAW and SAW
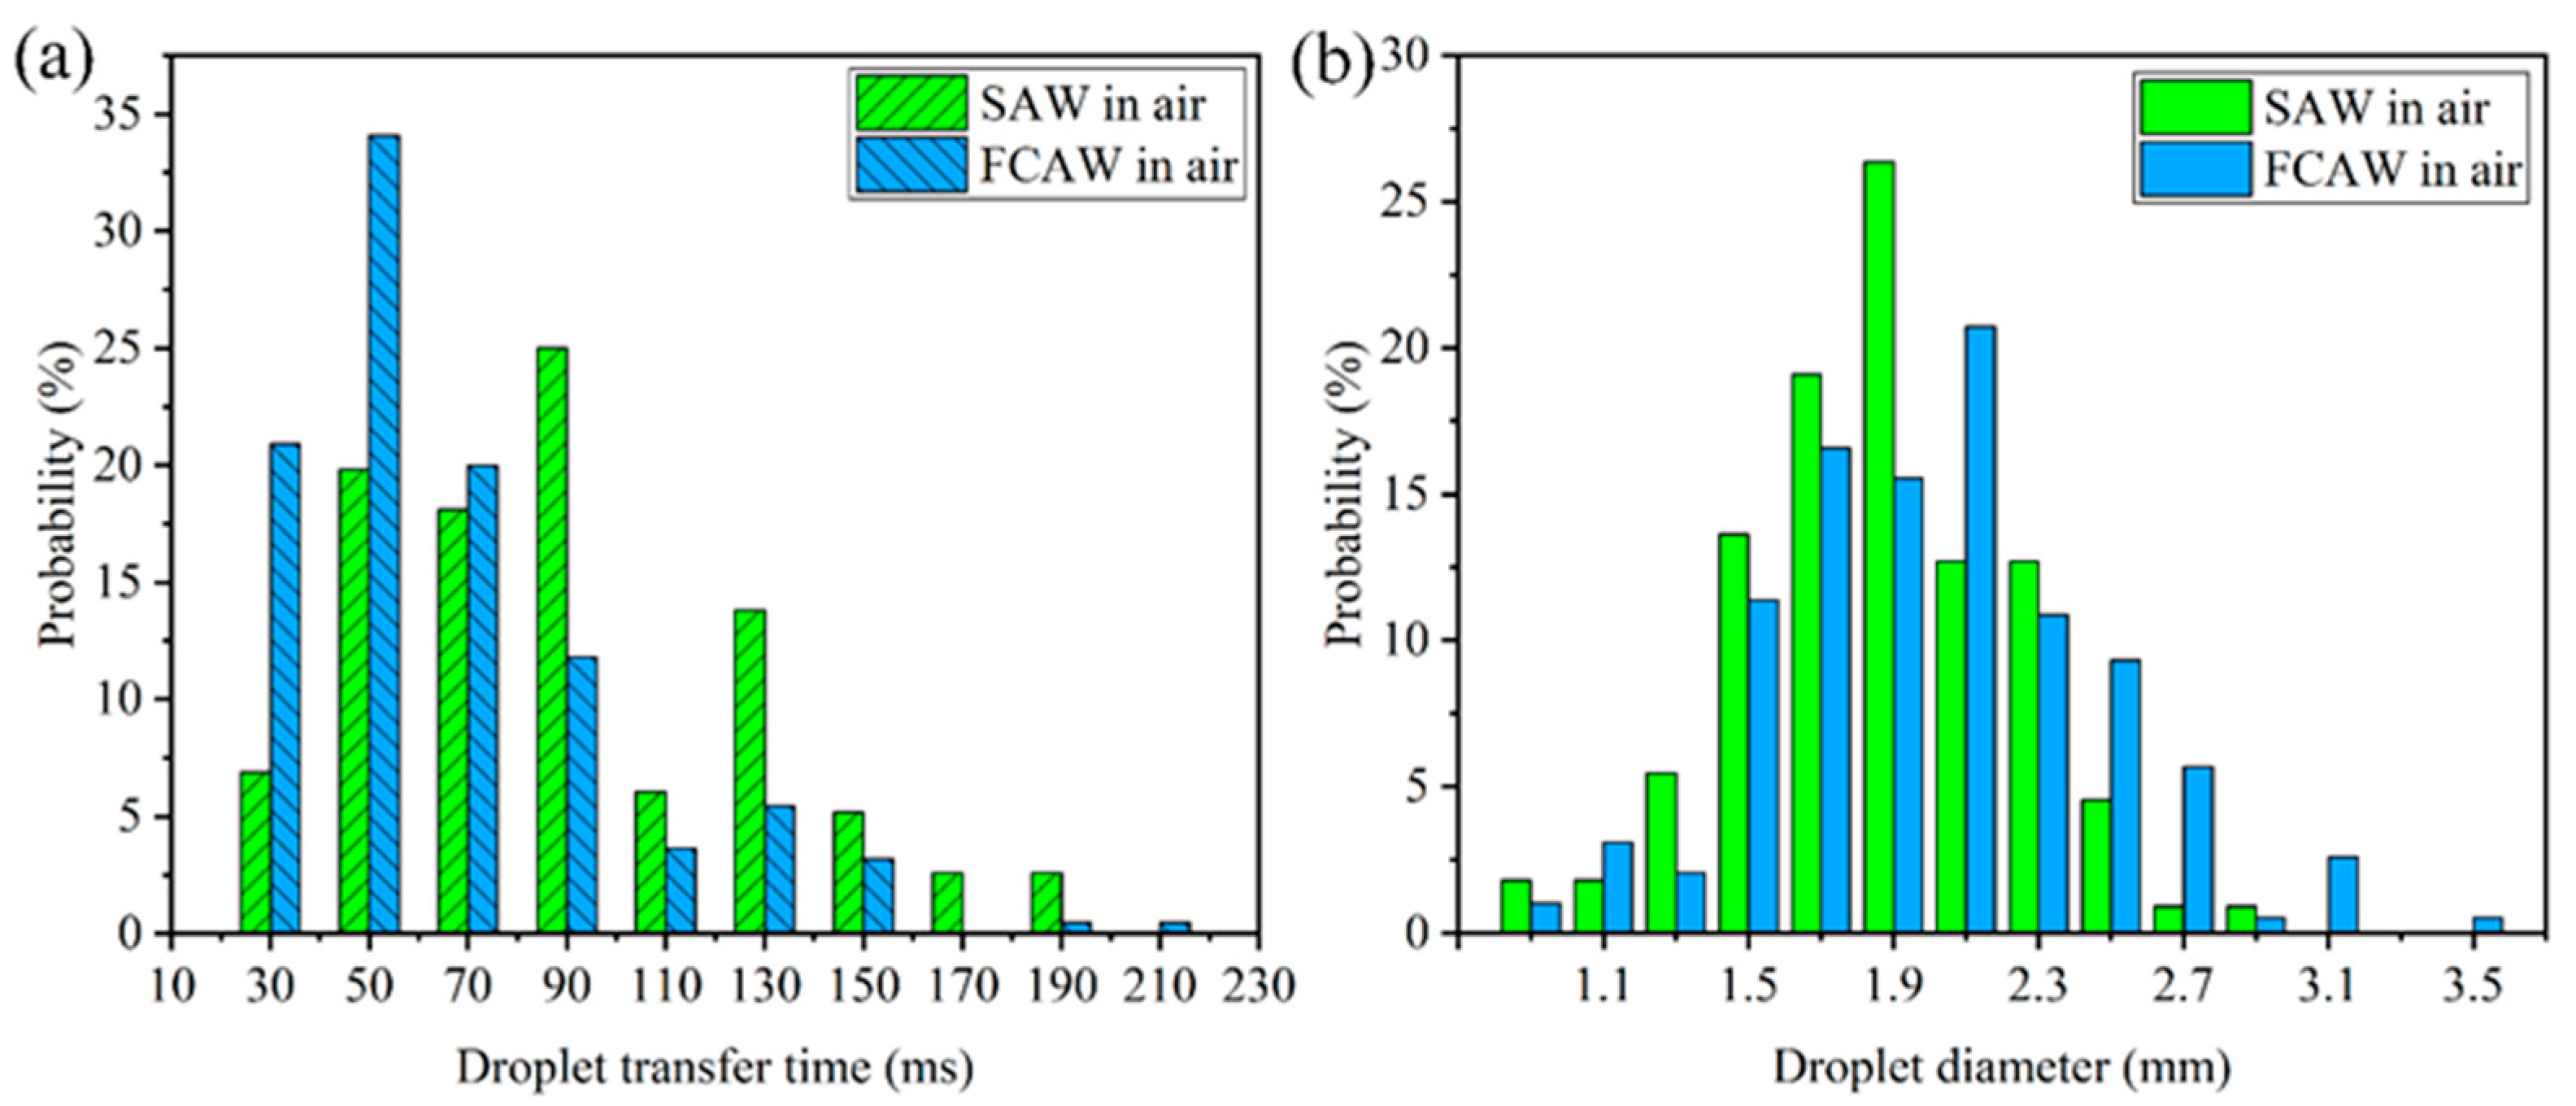
Both the droplet transfer time and corresponding diameter of droplet for FCAW and SAW are statistically analyzed to better understand the metal transfer mechanisms of the two processes, and the results are shown in Figure 12. The droplet transfer time is defined as the duration from the moment the droplet just forms at the tip of wire to the time it finally enters the weld pool. And the horizontal dimension of the droplet is chosen as its diameter when the droplet separates from the tip of wire. It can be found that the droplet transfer times for FCAW and SAW mainly distribute in ranges of 30~90 ms and 50~130 ms, respectively, as shown in Figure 12a). Obviously, the transfer time of FCAW scatters in a narrower range than that of the SAW does. Moreover, the average values of the droplet transfer time for FCAW and SAW are 66.2 ms and 90.3 ms, respectively. The former is just 73.3% of the latter, indicating that it takes more time for the droplet to finish one transfer cycle in SAW process. In addition, the droplet diameters of FCAW and SAW concentrates in the ranges of 1.5~2.5 mm and 1.7~2.3 mm, respectively, as shown in Figure 12b. There is not much difference between the droplet size of the two processes, due to the average values of them are 1.9 mm and 2.0 mm.
As mentioned above, although the average values of droplet diameter for the two welding methods are almost the same, it takes less time for the droplet of FCAW to finish one complete transfer cycle. Due to the droplets have the same size before detachment in the two processes, the reason for the time difference should be related to the dynamics of the droplet after it breaks away from the tip of wire. Furthermore, there is a strong correlation between the dynamics of droplet and its force state as Yang et al. [28] and Yu et al. [29] reported. Thus, force state analysis is conducted for the droplet of the two processes in order to clarify the mechanisms of the physical phenomenon discussed in this paper.
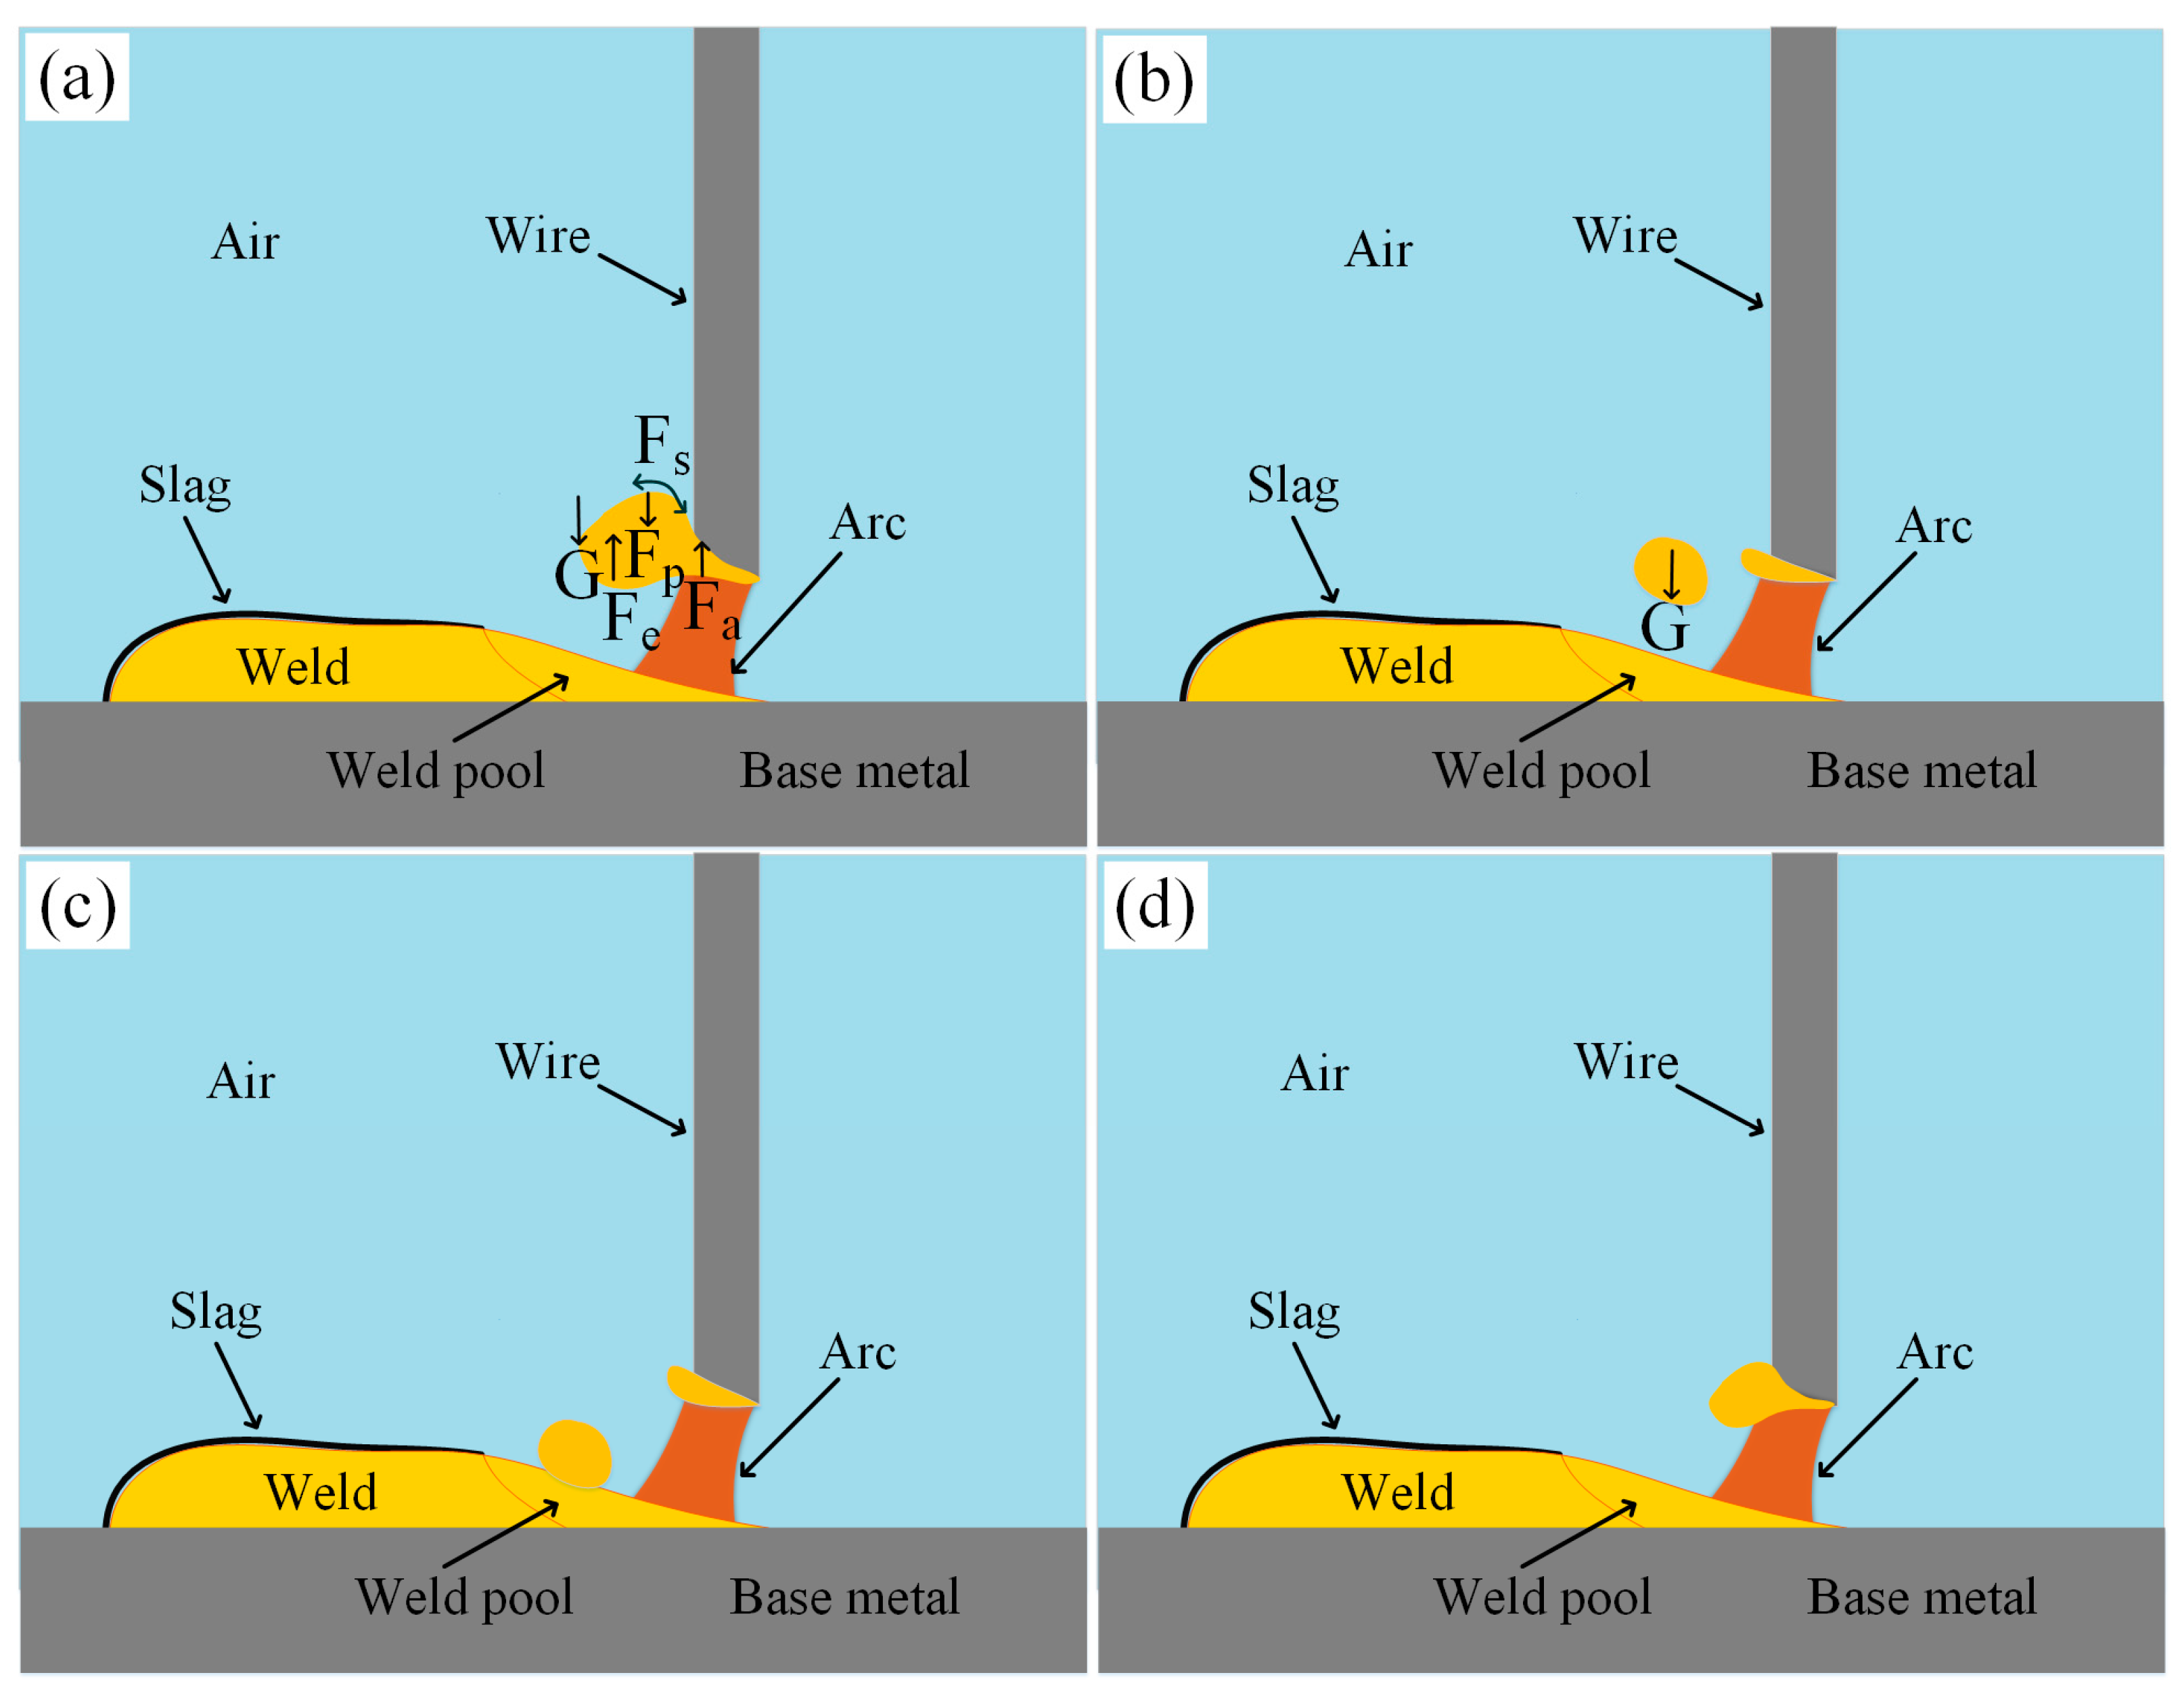
According to the static force balance theory (SFBT), there are mainly five types of forces acting on the droplet of FCAW, namely the electromagnetic force Fe, spot pressure Fa, gravity G, plasma dragging force Fp and surface tension Fs, as shown in Figure 13. Before detaching from the wire, the droplet is repelled to stay at one side of the wire under the action of repulsive forces, such as the electromagnetic force Fe and spot pressure Fa, as shown in Figure 13a. When the volume of droplet increases to a level that the gravity G of it is strong enough to break the droplet away from the wire, it just detaches from the wire tip and directly falls into the weld pool under the influence of gravity alone, as shown from Figure 13b–d.
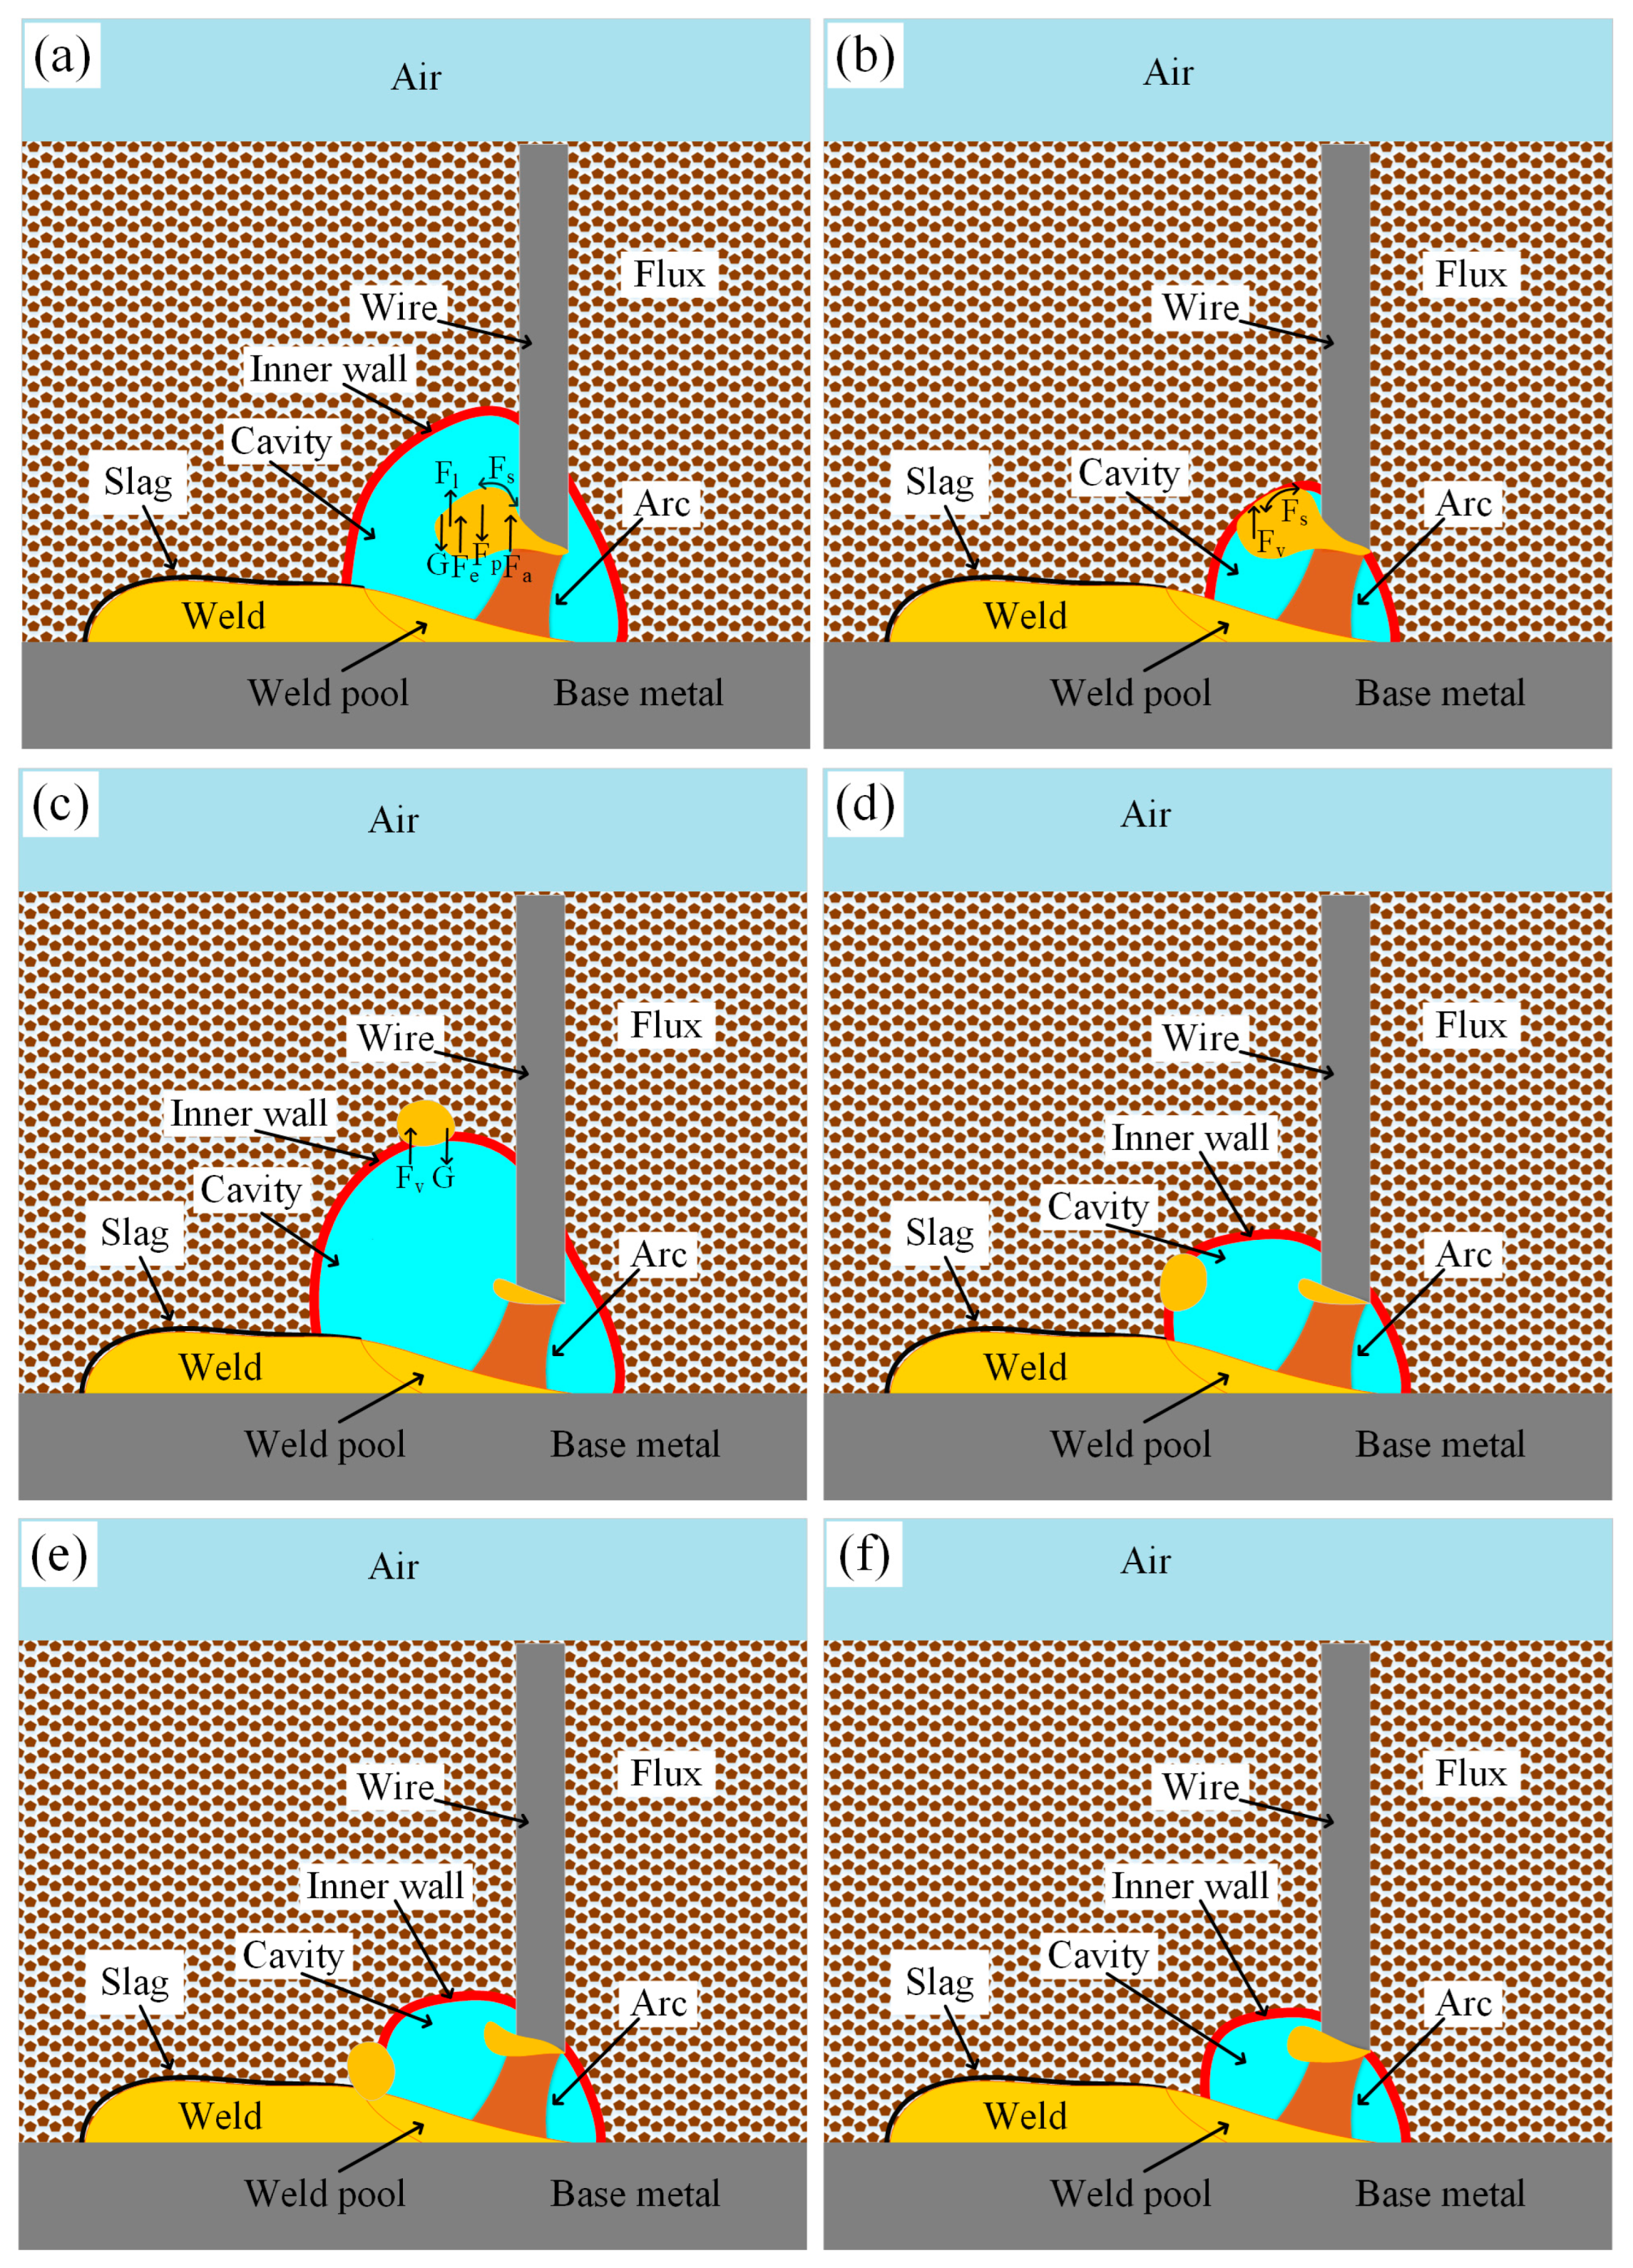
Compared with FCAW, the force state of droplet in SAW is more complicated. To better explain it, the dynamics of droplet with force state in the back flux wall-guided transfer mode is schematically shown in Figure 14. Due to the flowing gas inside of the cavity, there is another force caused by it acting on the droplet, namely the gas flow dragging force Fl, as shown in Figure 14a, which should be similar to the computational result of Komen’s et al. [30]. Like it in FCAW, the droplet also swings to one side of the wire under the combined action of repulsive forces, including the gas flow dragging force Fl, electromagnetic force Fe and spot pressure Fa. As the cavity shrinks to some level that the droplet can touch with the inner wall of it, surface tension Fs and viscous resistance Fv appear at the interface of the wall and droplet, which pulls the droplet to the flux and stops it from falling, respectively, as shown in Figure 14b. Shortly after that, the droplet breaks away from the wire and partially squeezes into the flux, rising with the cavity expansion, as shown in Figure 14c. As discussed in Section 3.2.3, until the cavity expands to the maximum size, the droplet basically stays in the flux under the action of viscous resistance Fv. Then it begins to move down as the cavity shrinks again and gradually transfers into the weld pool, as shown from Figure 14d–f. In sum, the droplet of FCAW will directly fall into the weld pool under the action gravity after the detachment, due to the viscous resistance acting on it, the droplet of SAW will firstly rise with the cavity expansion and then move down with the cavity contraction to finish the metal transfer. This is the main reason that it takes longer time for the droplet to complete one transfer cycle in SAW than it does in FCAW, while the diameters of droplet are closely the same in the two processes.
3.4. Characteristics of the Cavity for SAW
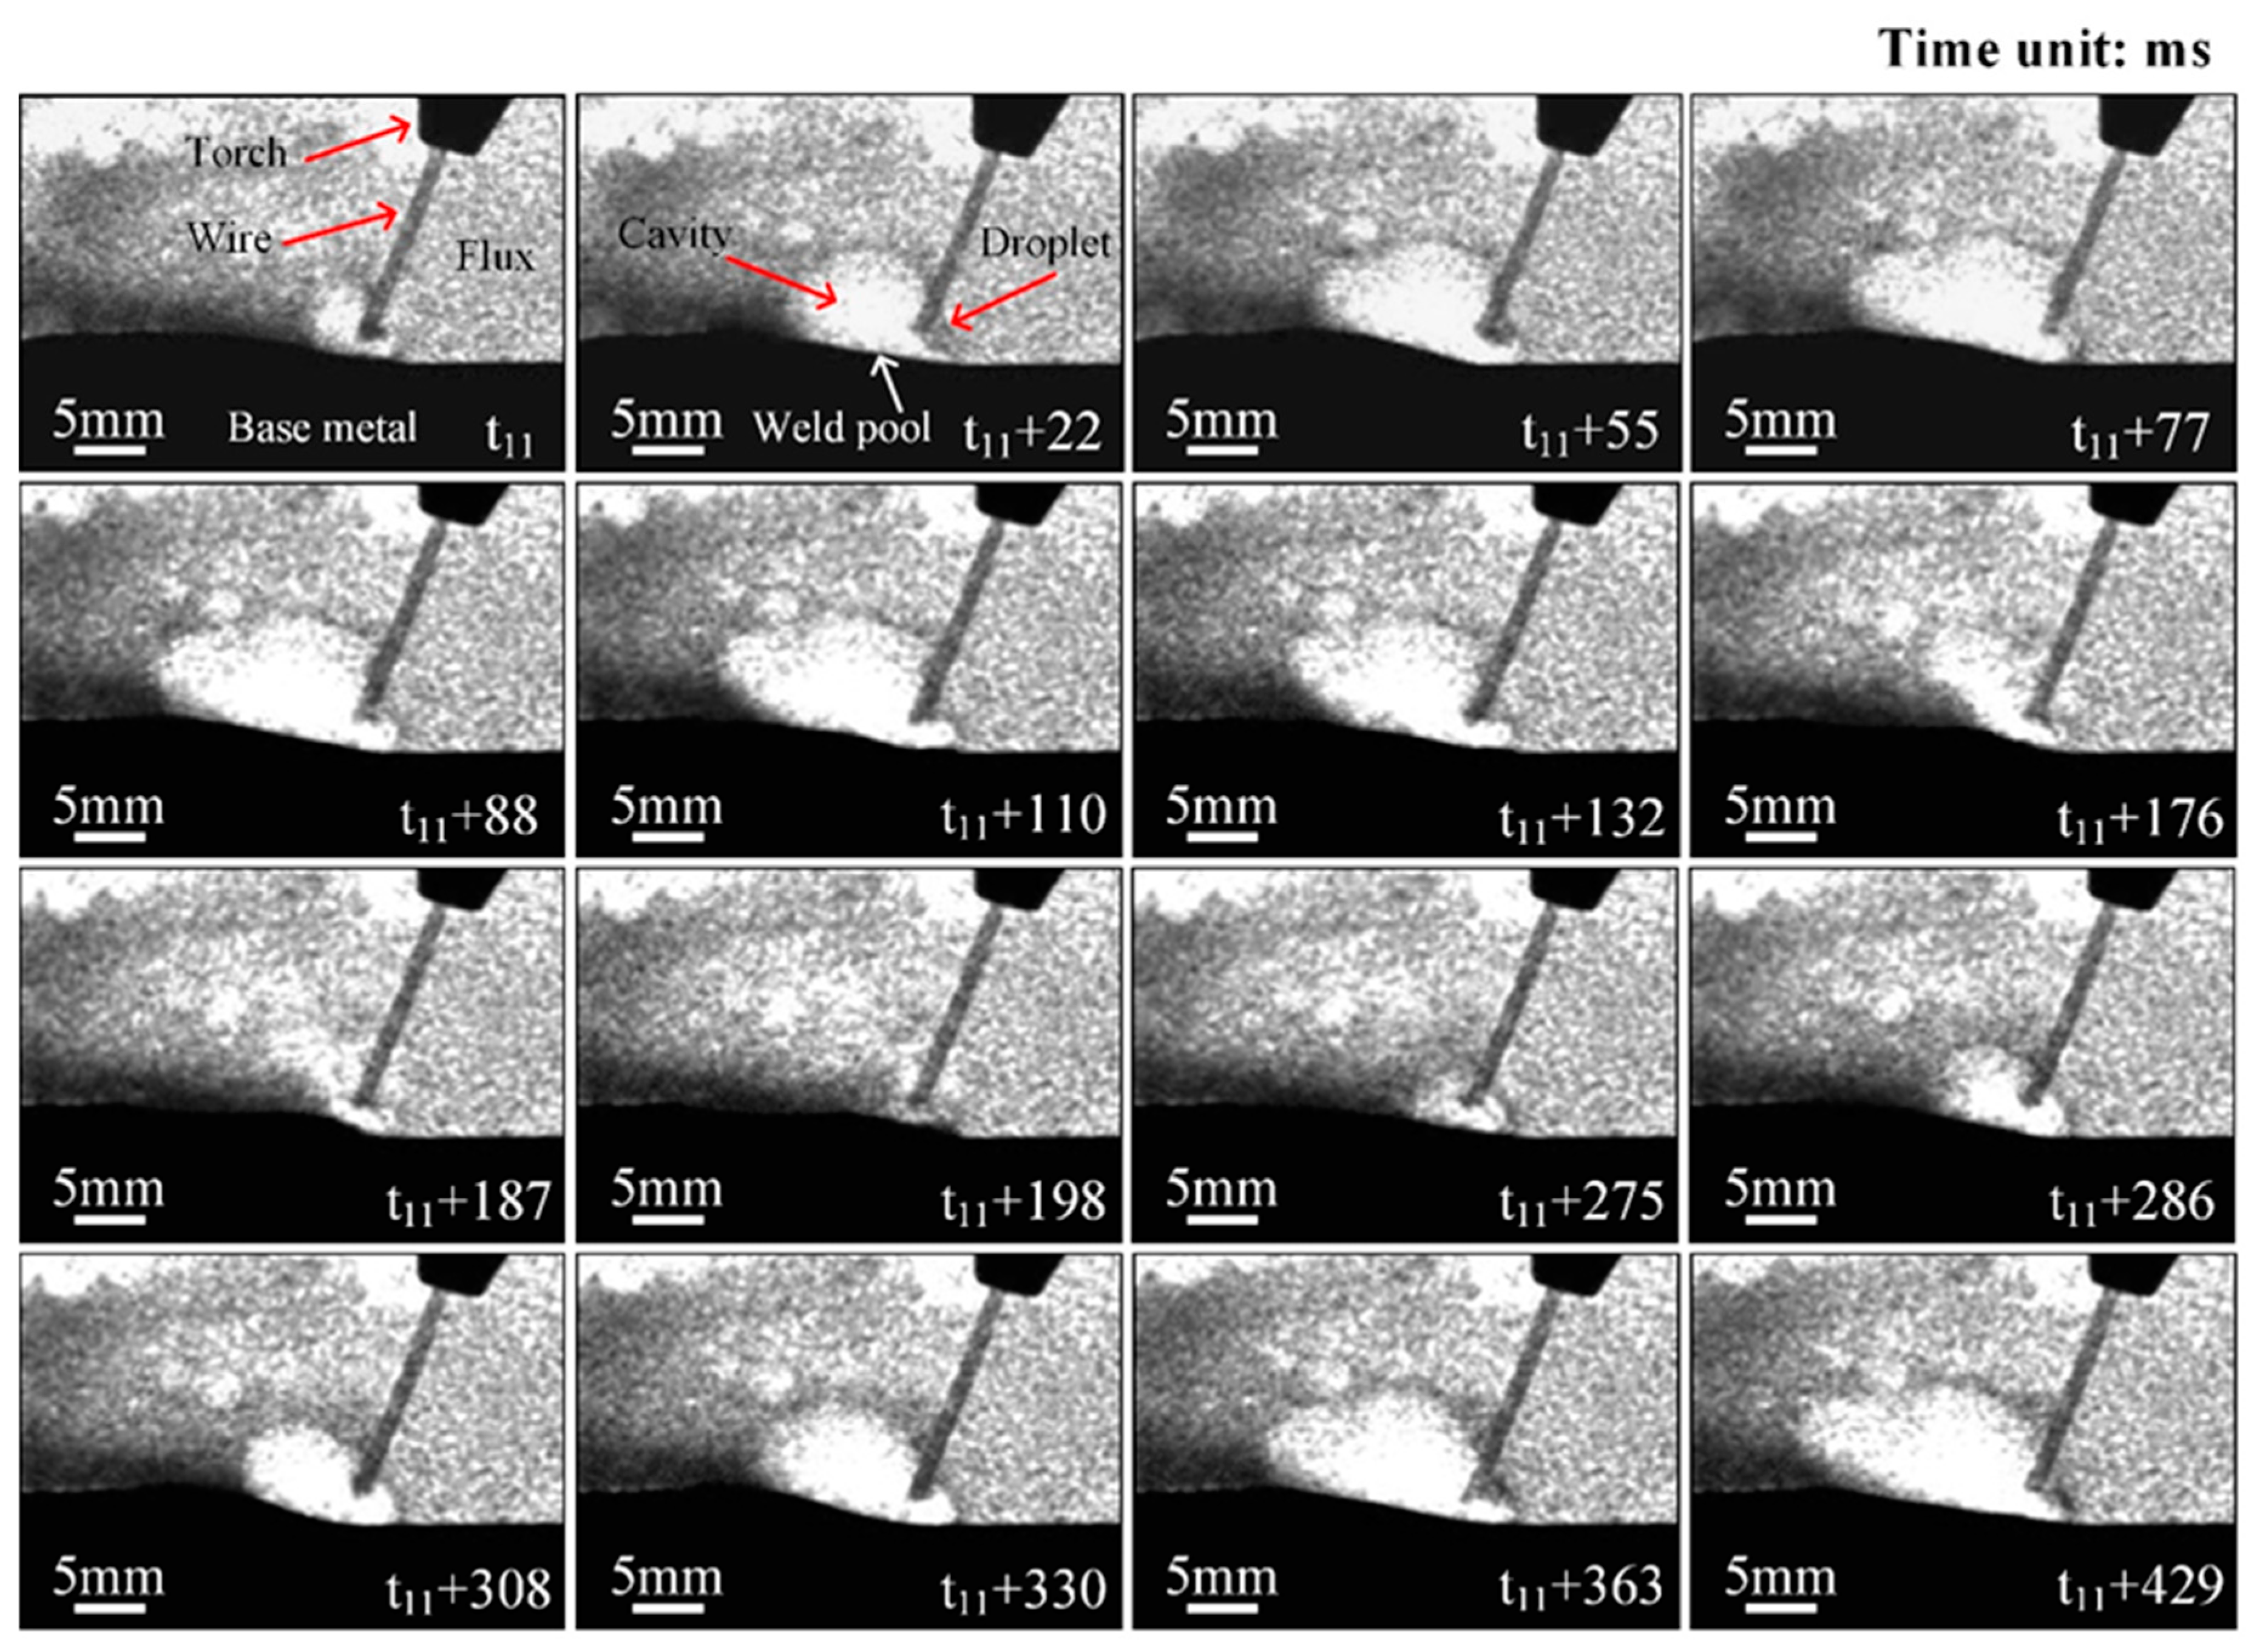
To better understand the phenomena occurs in the process of SAW, the dynamics of cavity is carefully investigated and the results are shown in Figure 15. Generally, the cavity expands and shrinks repeatedly throughout the entire welding process. When cavity shrinks to some level with a relative minimum volume, the pressure inside of it temporarily reaches a balance with the external pressure, as shown in t11. Meanwhile, as the continuous melting of wire and flux, a large amount of gas will be released from the decomposition of flux and evaporation of metal. Thus, the internal pressure will gradually increase with the gas accumulation inside of the cavity, promoting the volume of it to expand simultaneously. However, some of the gas can escape from the cavity into the air through the flux during the expansion, and the cavity volume may reach the maximum size once the internal and external pressure is in equilibrium temporarily, as shown from t11 + 22 to t11 + 88. Then more gas may leak from the cavity since the interface between the cavity and flux reaches the maximum the moment when the cavity volume expands to the largest. For this reason, the pressure balance inside and outside the cavity is disrupted, and the cavity starts to shrink, as shown in t11 + 110. As the volume of the cavity decreases, the flux is getting closer to the tip of wire and covering more surface of the weld pool. Until the cavity shrinks to the minimum size, the flux occupies nearly the entire space around the arc, as shown in t11 + 198. Though the arc does not break out as discussed in Section 3.2.3. Shortly after that, the cavity begins to expand once more and reaches the maximum again at the moment of t11 + 429. It is worth noting that the volume expansion and contraction basically occurs at the back of the cavity, while the front of it does not change much except for the moment the cavity reaches the minimum size. This may make it easier for the droplet to touch with the front inner wall of the cavity.
In the process of flux-cored wire submerged arc welding, with the expansion of the cavity, the internal gas will pass through the inner wall of the cavity and enter the external space. Hence, the volume of cavity may reach the maximum once the internal pressure equals to eternal pressure temporarily. But this state will not last long due to more gas leaks into the outer space if the cavity expands too big. Then cavity begins to shrink until its volume gets the minimum size. Soon after that, it starts to expand again and the mode of “expansion and contraction” is repeatedly observed during the whole process. The dynamics of cavity makes it easy for the droplet to touch with the flux and break away from the wire under the action of surface tension.
3.5. Weld Formation for FCAW and SAW
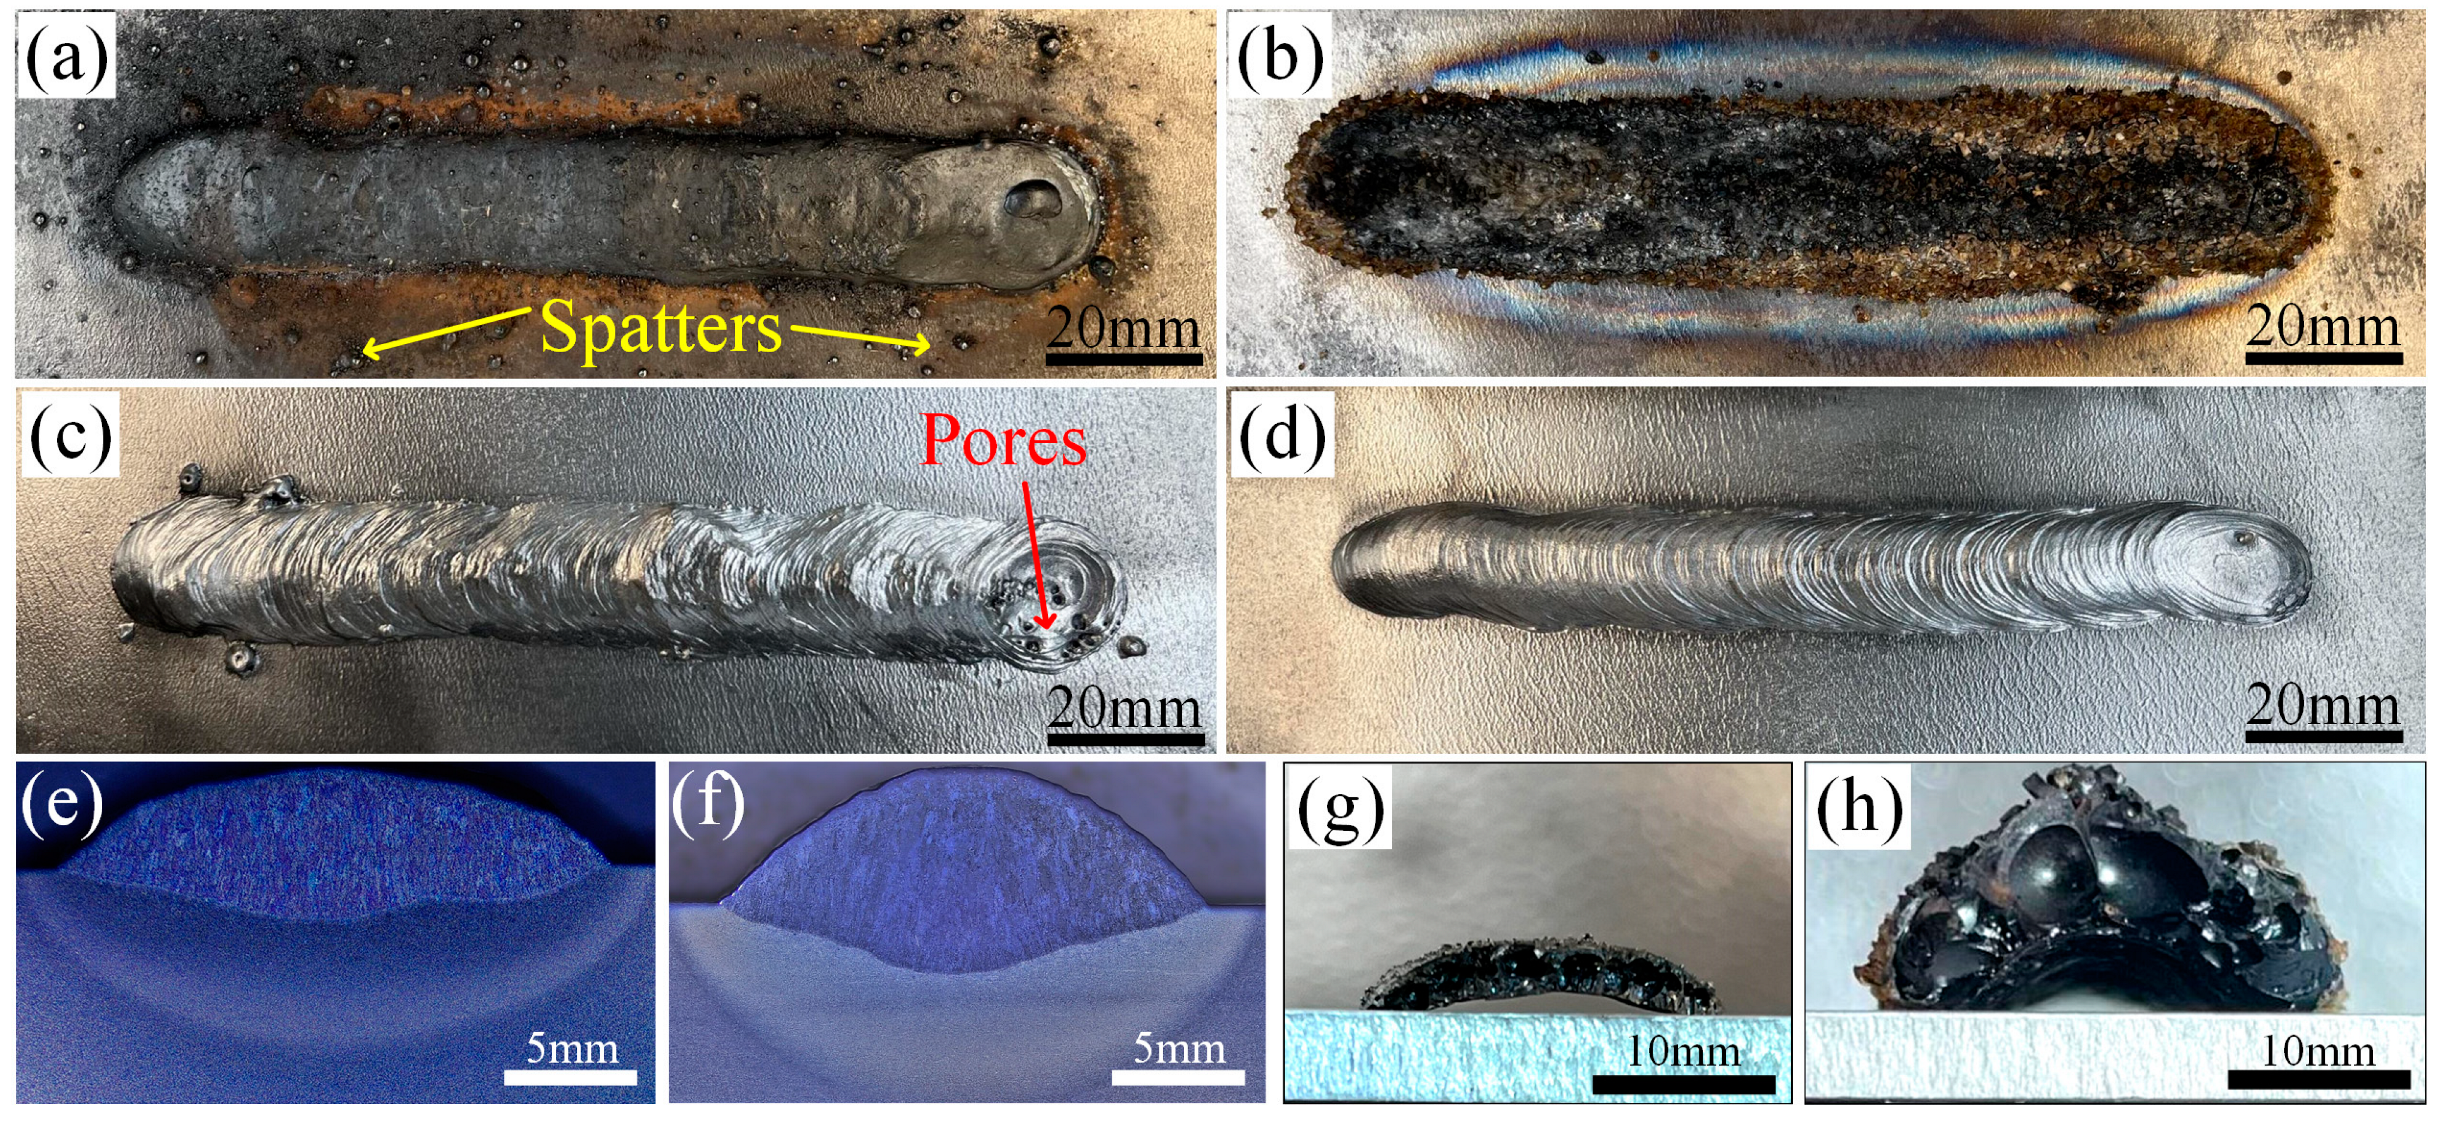
The weld formation and slag morphology for the FCAW and SAW processes are shown in Figure 16. A lot of spatters scatter around the slag covered weld of FCAW, though spatter rarely appears near the weld of SAW, as shown in Figure 16a,b. Imperfections such as pits and pores exist in the weld of FCAW after the slag is removed off there, compared with it, the weld of SAW is more uniform without obvious defects, as shown in Figure 16c,d. In addition, the heat affected zone of the joint produced with FCAW is thinner than that of the SAW, as shown in Figure 16e,f. Cross section results demonstrate that both the slags of the two processes have the similar porous structure, which is the gas rising channel during the weld solidification, as shown in Figure 16g,h. The approximate slag thicknesses of FCAW and SAW are 2.5 mm and 6.8 mm, respectively. Apparently, the latter is 2.7 times that of the former, indicating that the weld in SAW can be better protected by the slag than the weld in FCAW. This should be one reason why there are many pores in the weld of FCAW. It is worth noting that the average values of weld width for FCAW and SAW are 17.4 mm and 14.5 mm, respectively. Due to the compression effect of flux in SAW, the weld width of it is 2.9 mm shorter than that of FCAW.
4. Conclusions
In this paper, the characteristics of metal transfer and cavity evolution in flux-cored wire SAW were observed with X-ray imaging technique. The main conclusions are as follows:
- It is confirmed that a cavity forms mainly at the back of the wire tip in SAW process. Inside of the cavity, the droplet hangs on the tip of wire, and the molten flux covers the back of weld pool while liquid metal flows to the far behind and solidifies there with the coverage of slag.
- Partially like that in FCAW, the droplet usually swings to one side of the wire before detachment in SAW. Three different droplet transfer modes are observed, namely the front flux wall-guided droplet transfer, back flux wall-guided droplet transfer and repelled droplet transfer. Flux wall-guided transfer is the leading metal transfer mode since the percentages of the three 47.65%, 45.29% and 7.06%, respectively.
- The volume of cavity does not maintain constant but follows a cycle mode of “expansion and contraction” during the whole process. Due to the dynamic of cavity and viscous resistance caused by the flux, it takes 36.4% more time for the droplet of SAW to finish one metal transfer than it does in FCAW.
- Compared with FCAW, regular and smooth weld without pits and pores is manufactured during SAW process. The average weld width of SAW is 14.5 mm, which is 2.9 mm shorter than that of the FCAW due to the compression effect of flux. The thickness of slag with porous structure in SAW is 2.7 times of that in FCAW, indicating that it could provide better protection to the weld of SAW. The results obtained in this paper may provide a potential alternative to enhance the joining quality of key components in the industrial sector.
Author Contributions
Conceptualization, Y.H., C.H. and M.Z.; methodology, Y.H., C.J. and C.W.; software, Y.H. and M.Z.; validation, Y.H., C.H., M.Z., C.J., S.M. and C.W.; formal analysis, Y.H. and C.J.; investigation, Y.H., C.H. and M.Z.; resources, C.J.; data curation, Y.H., C.H. and C.J.; visualization, Y.H., C.H. and M.Z.; writing—original draft preparation, Y.H. and C.J.; writing—review and editing, Y.H., C.H., M.Z., C.J., S.M. and C.W.; supervision, C.J., S.M. and C.W.; project administration, C.J. and C.W.; funding acquisition, C.J. All authors have read and agreed to the published version of the manuscript.
Funding
This research received funding from the National Natural Science Foundation of China (Grant No. 51675310), National Key Research and Development Program of China (Grant No. 2023YFE0201300), Shandong Provincial Science Foundation for Distinguished Young Scholars (Grant No. ZR2023JQ018) and Cyrus Chung Ying Tang Foundation.
Data Availability Statement
Data are contained within the article.
Conflicts of Interest
The authors declare no conflict of interest.
References
- Ribeiro, R.A.; Dos Santos, E.B.F.; Assunção, P.D.C.; Braga, E.M.; Gerlich, A.P. Cold Wire Gas Metal Arc Welding: Droplet Transfer and Geometry. Weld. J. 2019, 98, 135S–149S. [Google Scholar]
- Sharma, L.; Chhibber, R. Investigations of Thermophysical Properties of Submerged Arc Welding Slag Using a Rutile-Acidic Flux System. CIRP J. Manuf. Sci. Technol. 2020, 31, 322–333. [Google Scholar] [CrossRef]
- Coetsee, T.; Mostert, R.J.; Pistorius, P.G.H.; Pistorius, P.C. The Effect of Flux Chemistry on Element Transfer in Submerged Arc Welding: Application of Thermochemical Modelling. J. Mater. Res. Technol. 2021, 11, 2021–2036. [Google Scholar] [CrossRef]
- Singh, A.B.; Singh, S.; Dangayach, G.S.; Meena, M.L.; Kumar, M. Comparative Study of SAW and ASAW Process on ASTM A709 Grade 36 Steel Welds. Mater. Today Proc. 2023. [Google Scholar] [CrossRef]
- Patel, D.; Soman, S.N. Develop a Flux Cored Wire for Submerged Arc Welding of Ni-Mo Low Alloy Steel. Sādhanā 2020, 45, 127. [Google Scholar] [CrossRef]
- Grum, J.; Kejžar, R.; Slabe, J.M. Submerged Arc Surfacing of Ni–Co–Mo Alloys Similar to Maraging Steels on a Structural Steel. J. Mater. Process. Technol. 2004, 155, 2011–2018. [Google Scholar] [CrossRef]
- Fang, C.; Chen, Y.; Yang, Z.; Wang, J.; Wu, M.; Qi, K. Cable-Type Welding Wire Submerged Arc Surfacing. J. Mater. Process. Technol. 2017, 249, 25–31. [Google Scholar] [CrossRef]
- Mortazavian, E.; Wang, Z.; Teng, H. Repair of Light Rail Track through Restoration of the Worn Part of the Railhead Using Submerged Arc Welding Process. Int. J. Adv. Manuf. Technol. 2020, 107, 3315–3332. [Google Scholar] [CrossRef]
- Kim, Y.S.; Eagar, T.W. Analysis of Metal Transfer in Gas Metal Arc Welding. Weld. J. N. Y. 1993, 72, 269-s. [Google Scholar]
- Zheng, S.M.; Gao, H.M.; Liu, X. Metal Transfer Characteristics of GMAW with Strip Electrode. Sci. Technol. Weld. Join. 2011, 16, 586–591. [Google Scholar] [CrossRef]
- Fan, C.; Xie, W.; Yang, C.; Lin, S.; Fan, Y. Process Stability of Ultrasonic-Wave-Assisted Gas Metal Arc Welding. Metall. Mater. Trans. A 2017, 48, 4615–4621. [Google Scholar] [CrossRef]
- Zheng, H.; Qi, B.; Yang, M. Dynamic Analysis of the Ultrasonic-Frequency Pulsed GMAW Metal Transfer Process. J. Manuf. Process. 2021, 62, 283–290. [Google Scholar] [CrossRef]
- Pérez, I.G.; Meruane, V.; Mendez, P.F. Deep-Learning Based Analysis of Metal-Transfer Images in GMAW Process. J. Manuf. Process. 2023, 85, 9–20. [Google Scholar] [CrossRef]
- Ostapenko, N.G.; Medovar, B.I. X-ray Analysis of Submerged Arc Zone. Avtog. Delo 1947, 11, 16–20. [Google Scholar]
- Grebelnik, P.G. X-ray Study of the Process of Automatic Welding Submerged Arc Welding. Avtomatich. Svarka 1950, 6, 18. [Google Scholar]
- Komen, H.; Abe, Y.; Fujimoto, T.; Shigeta, M.; Nakatani, M.; Tanaka, M. Visualization of Submerged Arc Welding Phenomena by X-Ray Observation and Direct Observation. Q. J. Jpn. Weld. Soc. 2018, 36, 9WL–12WL. [Google Scholar] [CrossRef]
- Abe, Y.; Fujimoto, T.; Nakatani, M.; Komen, H.; Tanaka, M. High Speed X-ray Observation of Digital Controlled Submerged Arc Welding Phenomena. Sci. Technol. Weld. Join. 2021, 26, 332–340. [Google Scholar] [CrossRef]
- Zhang, X.; Guo, N.; Xue, Z.; Ding, Y.; Cheng, Q.; Fu, Y.; He, J. Key Mechanism of Metal Transfer and Characteristic of Cavity Evolution during SAW Using In-Situ X-ray Imaging Method. J. Mater. Process. Technol. 2023, 319, 118057. [Google Scholar] [CrossRef]
- Han, Y.; Jia, C.; Zhang, M.; He, C.; Maksymov, S.; Wu, C. Key Mechanisms and Process Features of the Metal Transfer and Cavity Evolution during Underwater Submerged Arc Welding. J. Mater. Process. Technol. 2023, 319, 118053. [Google Scholar] [CrossRef]
- Tybus, G. Farbige Zeitlupenaufnahmen Zur Beobachtung Des Schweißbades Beim UP-Schwhweißen. Schweisstechnik 1957, 3, 68–71. [Google Scholar]
- Franz, U. Vorgänge in der Kaverne Beim UP-Schweißen. Ph.D. Thesis, Technische Hochschule Otto von Guericke Magdeburg, Fakultät für Maschinenbau, Magdeburg, Germany, 1965. [Google Scholar]
- Adrichem, V. Metal Transfer in Submerged-Arc Welding; International Institute of Welding Document: Nijmegen, The Netherlands, 1966. [Google Scholar]
- Mendez, P.F.; Goett, G.; Guest, S.D. High-Speed Video of Metal Transfer in Submerged Arc Welding. Weld. J. 2015, 94, 326s–333s. [Google Scholar]
- Gött, G.; Gericke, A.; Henkel, K.M.; Uhrlandt, D. Optical and Spectroscopic Study of a Submerged Arc Welding Cavern. Weld. J. 2016, 95, 491s. [Google Scholar]
- Li, K.; Wu, Z.; Zhu, Y.; Liu, C. Metal Transfer in Submerged Arc Welding. J. Mater. Process. Technol. 2017, 244, 314–319. [Google Scholar] [CrossRef]
- Sengupta, V.; Mendez, P.F. Effect of Current on Metal Transfer in SAW Part 1: DCEP. Weld. J. 2017, 96, 241–249. [Google Scholar]
- Sengupta, V.; Mendez, P.F. Effect of Current on Metal Transfer in SAW Part 2: AC. Weld. J. 2017, 96, 271–278. [Google Scholar]
- Yang, J.; Xu, S.; Jia, C.; Han, Y.; Maksymov, S.; Wu, C. A Novel 3D Numerical Model Coupling Droplet Transfer and Arc Behaviors for Underwater FCAW. Int. J. Therm. Sci. 2023, 184, 107906. [Google Scholar] [CrossRef]
- Yu, J.; Cai, C.; Xie, J.; Huang, J.; Liu, Y.; Chen, H. Weld Formation, Arc Behavior, and Droplet Transfer in Narrow-Gap Laser-Arc Hybrid Welding of Titanium Alloy. J. Manuf. Process. 2023, 91, 44–52. [Google Scholar] [CrossRef]
- Komen, H.; Morimoto, K.; Tanaka, M.; Terasaki, H. Two-Dimensional Particle Simulation of Flux- Wall Guid Ed Transfer in Submerged Arc Welding. J. Intell. Process Soc. 2023, 12, 91–96. [Google Scholar] [CrossRef]
Figure 1.
Schematic diagram of the X-ray imaging system (the yellow color represents the weld, and the orange color represents the arc).
Figure 1.
Schematic diagram of the X-ray imaging system (the yellow color represents the weld, and the orange color represents the arc).

Figure 2.
X-ray observation results of different welding processes: (a) SAW, (b) FCAW in air.

Figure 3.
X-ray images of the repelled droplet transfer mode in FCAW.

Figure 4.
Synchronous electrical signals of the repelled droplet-transfer mode in FCAW.

Figure 5.
X-ray images of the front flux wall-guided droplet transfer mode in SAW (the yellow color represents the outline of droplet and the dotted line represents the inner wall of the cavity).
Figure 5.
X-ray images of the front flux wall-guided droplet transfer mode in SAW (the yellow color represents the outline of droplet and the dotted line represents the inner wall of the cavity).

Figure 6.
Synchronous electrical signals of the front flux wall-guided droplet transfer mode in SAW.
Figure 6.
Synchronous electrical signals of the front flux wall-guided droplet transfer mode in SAW.

Figure 7.
X-ray images of the back flux wall-guided droplet transfer mode in SAW (the yellow color represents the outline of droplet and the dotted line represents the inner wall of the cavity).
Figure 7.
X-ray images of the back flux wall-guided droplet transfer mode in SAW (the yellow color represents the outline of droplet and the dotted line represents the inner wall of the cavity).

Figure 8.
Synchronous electrical signals of the back flux wall-guided droplet transfer mode in SAW.

Figure 9.
X-ray images of the repelled droplet transfer mode in SAW (the yellow color represents the outline of droplet and the dotted line represents the inner wall of the cavity).
Figure 9.
X-ray images of the repelled droplet transfer mode in SAW (the yellow color represents the outline of droplet and the dotted line represents the inner wall of the cavity).

Figure 10.
Synchronous electrical signals of the repelled droplet transfer mode in SAW.

Figure 11.
Statistics of different transfer modes captured with X-ray in SAW.

Figure 12.
Probability distribution of droplet transfer time and diameter in SAW and FCAW.

Figure 13.
Schematic diagram of the repelled droplet transfer in FCAW: where Fe is the electromagnetic force, Fa is the spot pressure, G is the gravity, Fp is the plasma dragging force and Fs is the surface tension (a) represents the stage before droplet detachment, and (b–d) represent the stage after droplet detachment).

Figure 14.
Schematic diagram of the back flux wall-guided droplet transfer in SAW: where Fe is the electromagnetic force, Fa is the spot pressure, G is the gravity, Fp is the plasma dragging force, Fs is the surface tension, Fl is the gas flow dragging force and Fv is the viscous resistance (a,b) represent the shrinking stage of cavity, (c) the expansion stage of cavity, and (d–f) another shrinking stage of cavity).

Figure 15.
Cavity dynamics of the submerged arc welding in air imaged with X-ray.

Figure 16.
Macroscopic morphology of weld and slag for FCAW and SAW: (a,b) weld formation of FCAW and SAW before slag detachment; (c,d) weld formation of FCAW and SAW after slag detachment; (e,f) cross section of joints for FCAW and SAW; (g,h) cross section of slag for FCAW and SAW.
Figure 16.
Macroscopic morphology of weld and slag for FCAW and SAW: (a,b) weld formation of FCAW and SAW before slag detachment; (c,d) weld formation of FCAW and SAW after slag detachment; (e,f) cross section of joints for FCAW and SAW; (g,h) cross section of slag for FCAW and SAW.


Table 1.
Mechanical properties of the base metal CCS–EH40.
| Base Metal | Yield Point ReH/MPa | Tensile Strength Rm/MPa | Elongation A/% |
|---|---|---|---|
| CCS–EH40 | 420 | 580 | 22 |
Table 2.
Chemical composition of the filler metal (only steel sheath) and base metal (wt.%).
| Material | C | Si | Mn | S | P | Ni | Mo | Cu | V | Fe |
|---|---|---|---|---|---|---|---|---|---|---|
| Filler metal | 0.03 | 0.01 | 0.29 | 0.006 | 0.01 | - | - | 0.015 | 0.001 | Bal. |
| CCS–EH40 | 0.17 | 0.24 | 1.37 | 0.01 | 0.02 | 0.01 | 0.002 | 0.04 | 0.004 | Bal. |
Table 3.
Chemical composition of the flux HJ431 (wt.%).
| Compounds | SiO2 | FeO + MnO | CaO + MgO | CaF2 | Al2O3 + TiO2 |
|---|---|---|---|---|---|
| HJ431 | 40~50 | 30~40 | 5~15 | 3~10 | 2~10 |
Disclaimer/Publisher’s Note: The statements, opinions and data contained in all publications are solely those of the individual author(s) and contributor(s) and not of MDPI and/or the editor(s). MDPI and/or the editor(s) disclaim responsibility for any injury to people or property resulting from any ideas, methods, instructions or products referred to in the content. |
© 2023 by the authors. Licensee MDPI, Basel, Switzerland. This article is an open access article distributed under the terms and conditions of the Creative Commons Attribution (CC BY) license (https://creativecommons.org/licenses/by/4.0/).
Share and Cite
MDPI and ACS Style
Han, Y.; Jia, C.; He, C.; Zhang, M.; Maksymov, S.; Wu, C. Investigation on the Metal Transfer and Cavity Evolution during Submerged Arc Welding with X-ray Imaging Technology. Metals 2023, 13, 1865. https://doi.org/10.3390/met13111865
AMA Style
Han Y, Jia C, He C, Zhang M, Maksymov S, Wu C. Investigation on the Metal Transfer and Cavity Evolution during Submerged Arc Welding with X-ray Imaging Technology. Metals. 2023; 13(11):1865. https://doi.org/10.3390/met13111865
Chicago/Turabian StyleHan, Yanfei, Chuanbao Jia, Chen He, Maofu Zhang, Sergii Maksymov, and Chuansong Wu. 2023. "Investigation on the Metal Transfer and Cavity Evolution during Submerged Arc Welding with X-ray Imaging Technology" Metals 13, no. 11: 1865. https://doi.org/10.3390/met13111865
Note that from the first issue of 2016, this journal uses article numbers instead of page numbers. See further details here.