Article

Influence of Structural Disorder on the Magnetic Order in FeRhCr Alloys

by
Aleksei S. Komlev
1,*,
Gabriela F. Cabeza
2,*,
Alisa M. Chirkova
3,4,
Neven Ukrainczyk
3,
Elena A. Sherstobitova
5,
Vladimir I. Zverev
1,
Radel Gimaev
1,
Nikolai V. Baranov
5 and
Nikolai S. Perov
1
1
Faculty of Physics, M.V. Lomonosov Moscow State University, 119991 Moscow, Russia
2
Departamento de Física, IFISUR (UNS-CONICET), Universidad Nacional del Sur, Bahía Blanca 8000, Argentina
3
Institute for Materials Science, TU Darmstadt, 64287 Darmstadt, Germany
4
Faculty of Engineering and Mathematics, Hochschule Bielefeld University of Applied Sciences and Arts, 33619 Bielefeld, Germany
5
M.N. Mikheev Institute of Metal Physics, Ural Branch of the Russian Academy of Science, 620108 Ekaterinburg, Russia
*
Authors to whom correspondence should be addressed.
Metals 2023, 13(10), 1650; https://doi.org/10.3390/met13101650
Submission received: 1 August 2023 / Revised: 30 August 2023 / Accepted: 20 September 2023 / Published: 26 September 2023
(This article belongs to the Special Issue Advances in Magnetic Alloys)

Abstract

:
Magnetic phase transitions in alloys are highly influenced by the sample preparation techniques. In the present research, electronic and magnetic properties of Fe48Cr3Rh49 alloys with varying cooling rates were studied, both experimentally and theoretically. The degree of crystalline ordering was found to depend on the cooling rate employed after annealing the alloy. Modeling of alloy structures with different degrees of crystalline ordering was carried out via strategic selection of substitution positions and distances between chromium atoms. Theoretical calculations revealed significant changes in magnetic and electronic properties of the alloy with different substitutions. A comprehensive analysis of the calculated and experimental data established correlations between structural characteristics and parameters governing the magnetic phase transition. In this study, we also developed a method for evaluating the magnetic properties of the alloys obtained under different heat treatments. The proposed approach integrates atom substitution and heat treatment parameters, offering precise control over alloy manufacturing to effectively tune their essential magnetic properties.

1. Introduction

Understanding magneto-structural phase transitions is a captivating challenge in materials science. Over the past decade, research has demonstrated the potential of materials exhibiting first-order magnetic phase transition in diverse applications such as cryogenic devices [1], actuators [2], new-generation hard drives [3,4,5,6], and targeted drug delivery implants [7]. These functional materials have the capacity to drive technological advancements, enhancing energy efficiency and environmental sustainability. To realize their practical potential, it is imperative to explore the mechanisms influencing magneto-structural phase transition in low-cost alloys, which possess the desired phase transition parameters.
The characterization of a first-order phase transition relies on crucial parameters such as the phase transition temperature, temperature hysteresis width, and magnetocaloric effect. These parameters are influenced by factors such as elemental composition, crystal ordering, structural defects, and mechanical stresses [8,9]. FeRh-based alloys offer a compelling avenue for studying magneto-structural first-order phase transition due to their binary elemental composition, preservation of crystal structure symmetry during the phase transition, and the remarkable magnetocaloric effect (−7–8 K) [10,11] near room temperature under a magnetic field of up to 2 T. Leveraging these unique attributes allows us to construct a straightforward descriptive model of a first-order magnetic phase transition. Extensive research on iron–rhodium alloys has resulted in comprehensive understanding of their properties [12]. Previous studies have revealed that the phase transition behavior in this class of compounds is significantly influenced by the synthesis technique and the type and quantity of the alloying element [13]. Such work demonstrates that even slight alterations in the crystal structure due to the cooling rate after annealing can impact the magnetic properties.
In terms of theoretical results, there is an agreement regarding the crystalline cubic (bcc) structure during ferromagnetic ordering [14,15]. However, regarding antiferromagnetic ordering, two possible structure types, namely type I and type II, have been proposed in the literature. For type I, antiferromagnetic coupling occurs between successive layers of (001) iron phases, whereas for type II, it takes place between successive layers of (111). The prevailing consensus in the literature suggests that the minimum energy state corresponds to an isostructural magnetic phase transformation with antiferromagnetic type II configuration [16]. However, the appearance of metastable structures with marginal energy difference has led to debates on this. More recently, orthorhombic [17,18] and tetragonal antiferromagnetic structures [19,20] have been proposed as more stable configurations (than the cubic type II), with energy differences in the order of a few meV/atom.
There is an abundance of information available on the physical properties of magnetocaloric materials synthesized using various techniques. Typically, bulk alloys are produced through arc or induction melting, followed by additional annealing. The properties of these alloys can undergo significant changes depending on the annealing temperature, duration, and cooling rate. Rapidly cooled (RC) and slowly cooled (SC) samples exhibit notable variations in their properties. Table 1 provides physical property values for different RC and SC magnetocaloric materials. It becomes apparent that the cooling rate after annealing affects materials with first-order transition differently than those with second-order transition. In materials with a first-order transition, the phase transition temperature decreases with rapid quenching, whereas the opposite trend is observed in materials with a second-order transition. However, no clear correlation between the cooling rate and the temperature hysteresis of the phase transition has been identified. It is presumed that the type of sample-cutting technique plays a significant role in the formation of mechanical stresses, which, in turn, influence the phase formation process. Further in-depth research is necessary to understand this phenomenon better.
Another interesting observation is the dependence of magnetization change ( M T m a x ) on the cooling rate after annealing. The non-single-phase samples shown in Table 1 exhibit an increase in M T m a x with rapid cooling. Maxwell’s equations establish a correlation between entropy change and magnetization. However, an inadequate number of experimental data points on temperature or field curves of magnetization can lead to inaccuracies in calculating M T m a x . We believe that this may be one of the reasons for the data inconsistency.
The above analysis of the experimental results reveals a clear dependence of the structural and magnetic properties of the samples on the synthesis technology. Notably, materials with a first-order phase transition, which have an additional crystallographic phase, exhibit the most significant changes in magnetocaloric properties (depending on the cooling rate), according to our observations. Therefore, the objective of this study was to elucidate the mechanisms responsible for the alterations in the magnetic and structural properties of (Fe, Cr)Rh pseudo-binary alloys. Currently, there is limited information available in the literature regarding the properties of FeRhCr alloys [29,30]. Preliminary calculations have indicated that chromium doping induces prominent modifications in the magnetic properties of FeRh-based alloys. However, the underlying mechanisms behind this phenomenon remain elusive.
This study establishes correlations between the structural and magnetic properties of rapidly cooled and slowly cooled FeRhCr alloys. The information provided enables the identification of the most probable crystallographic substitution positions and their relationship with phase transition parameters. The aim of this study was to determine the causes of significant differences in physical properties in alloys with different heat treatments.

2. Materials and Methods

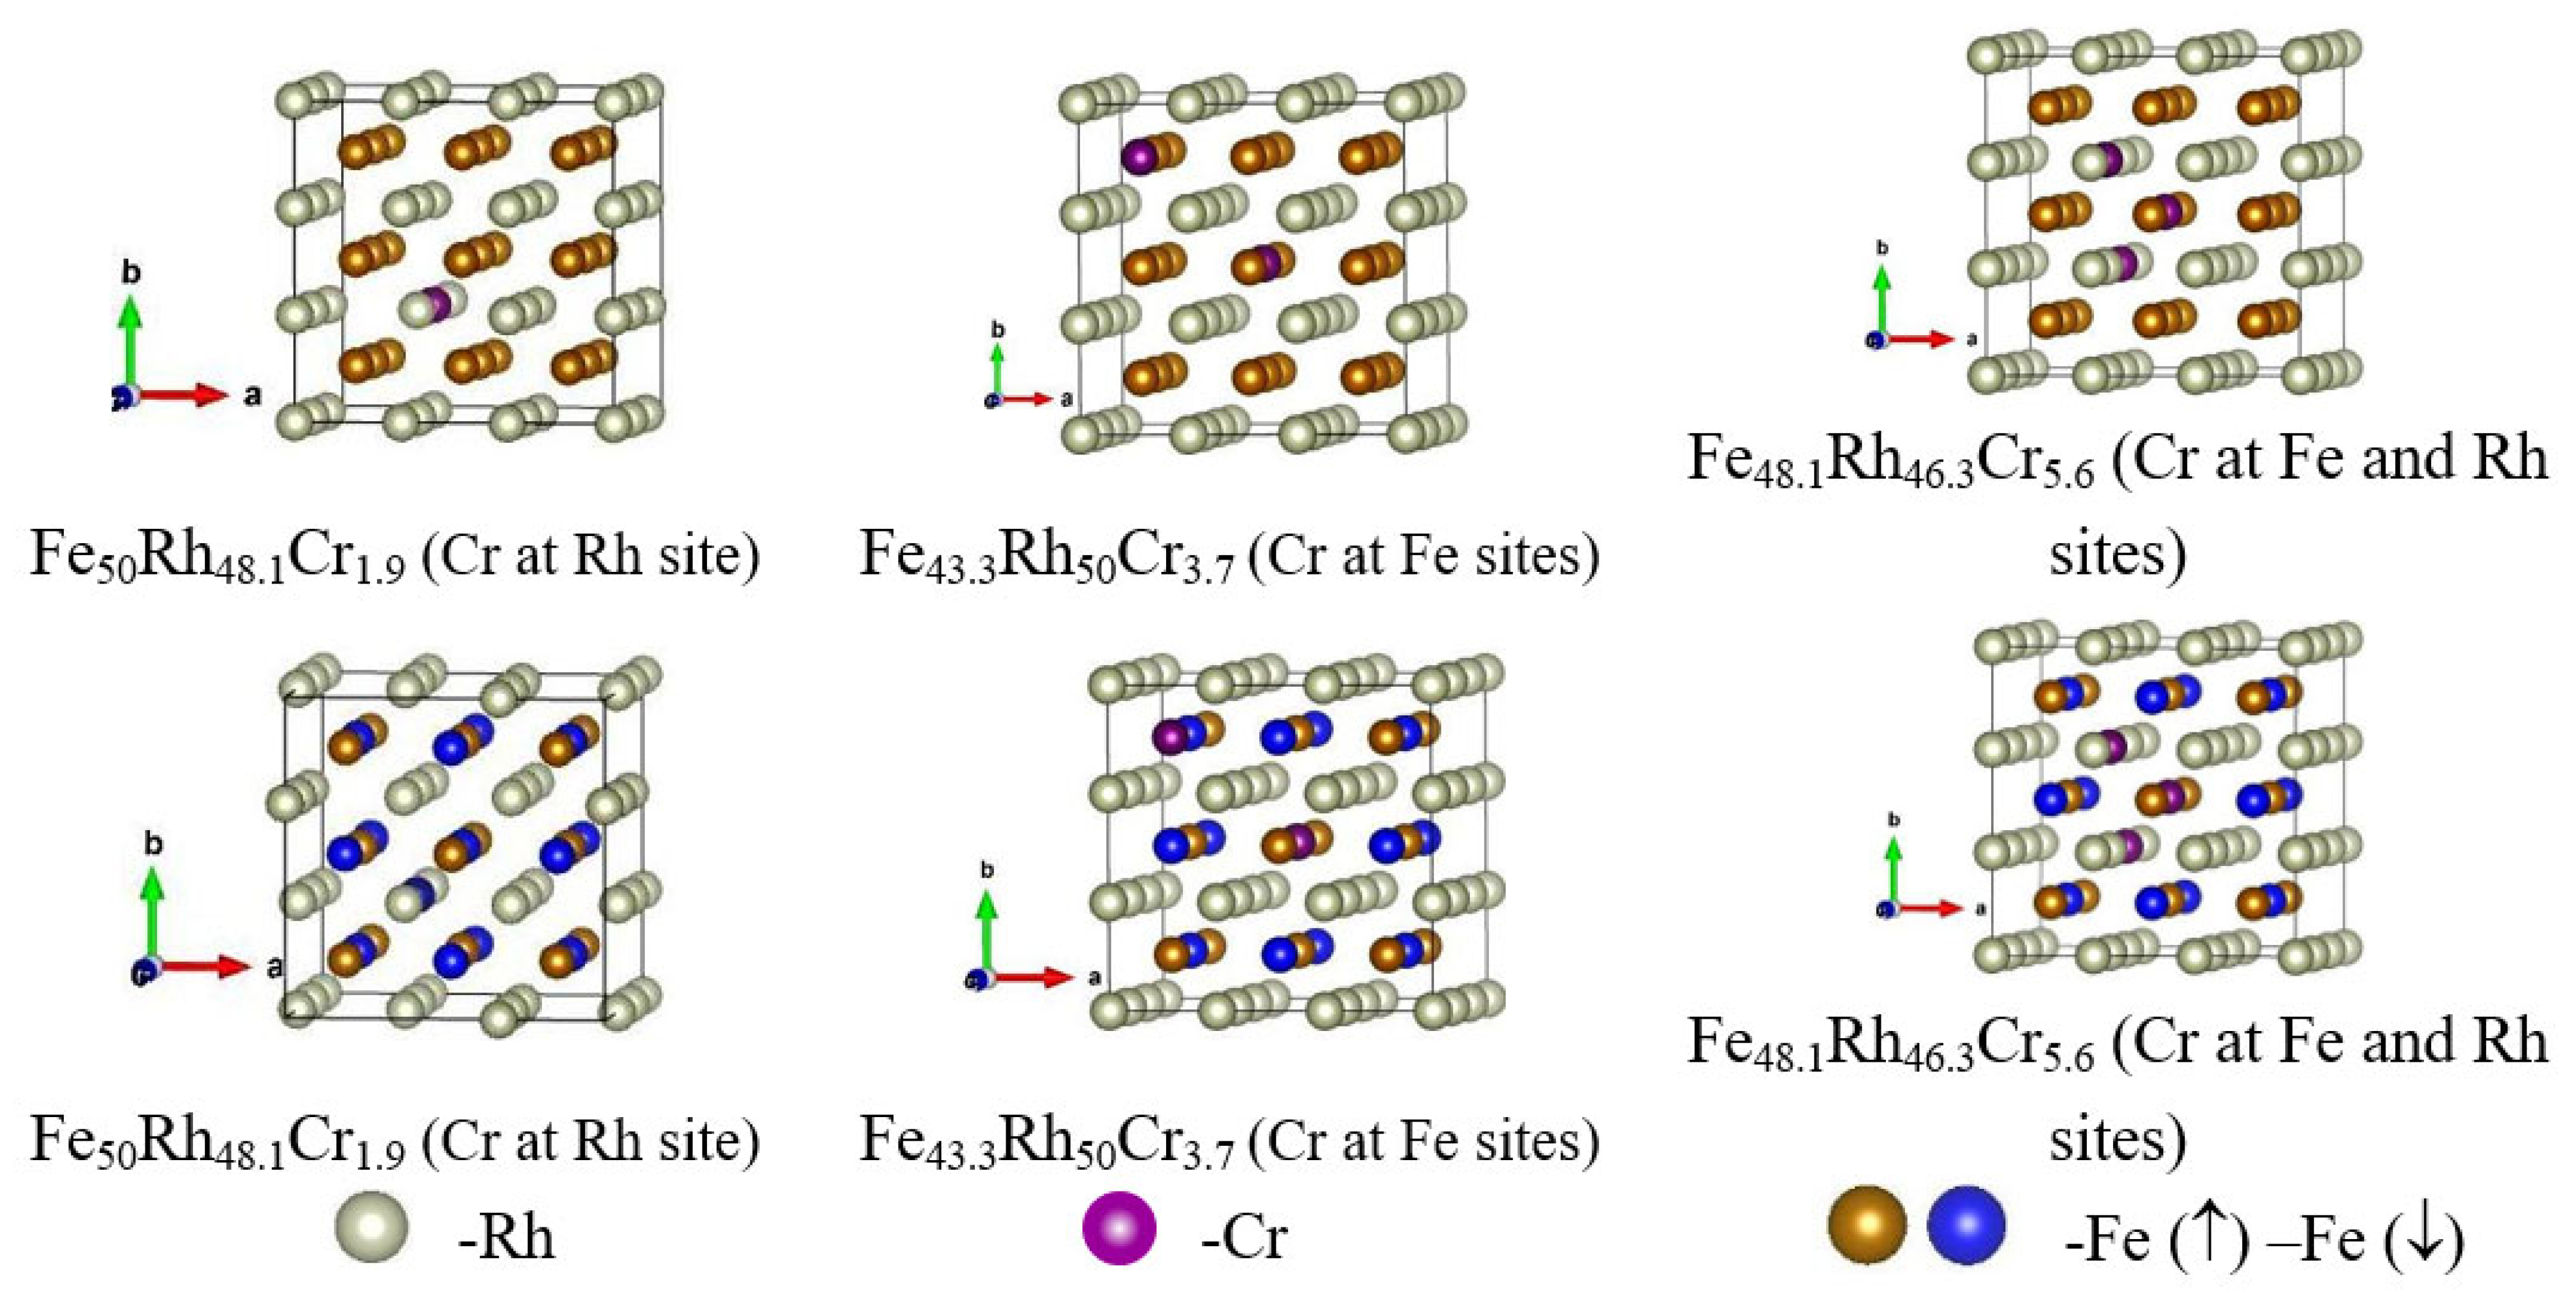
2.1. Computational Details and Models

In this study, spin-polarized calculations were performed using the VASP (Vienna Ab-Initio Simulation Package) code [31,32,33] based on the density functional theory (DFT) formalism. In the standard mode, VASP performs a fully relativistic calculation for the core electrons and treats valence electrons in a scalar relativistic approximation [34]. The energy convergence criterion used was 0.1 meV. The kinetic energy cut-off for the plane wave expansion of the Kohn–Sham electronic wave function is 400 eV. The plane wave basis was generated considering 8 valence electrons for Fe (3d74s1), 9 valence electrons for Rh (4d85s1) and 6 valence electrons for Cr (3d54s1). The Projector Augmented-Wave (PAW) method [35] is used to reproduce the atomic core effects in the electronic density of the valence electrons. The exchange and correlation energies are calculated with the Generalized Gradient Approximation developed by Perdew, Burke and Ernzerhof [36].
We assumed a cubic crystal structure of B2 CsCl type, as has been reported in the literature for FeRh and FeRhPd at low Pd concentrations [37] and as previously studied by our group [38]. Both ferromagnetic (FM) and antiferromagnetic (AFM) spin configurations were considered. In order to facilitate comparison with experimental results, the alloy was represented using a (3 × 3 × 3) supercell formed by 54 atoms to obtain Cr concentrations close to the experimental values of 3.17% (for rapidly cooled alloy) and 3.23% (for slowly cooled alloy). Half of them correspond to Fe atoms and the other half consists of Rh atoms where some Rh or Fe sites are replaced by Cr atoms depending on the concentration (x = 0, 1.9, 3.7 and 5.6). In principle, there is evidence that the dopant would be located in Rh sites [39,40]. However, in order to be able to compare with experimental results, both an ordered and a defective crystal lattice were considered, locating the Cr atoms in both sites simultaneously. The different Cr doping options aim to exemplify possible samples obtained with either RC (rapidly cooled—higher-disorder structure) or SC (slowly cooled—lower-disorder structure). The nomenclature used to represent the different systems under study is Fe50Rh50−xCrx (x = 0, 1.9, 3.7 and 5.6) or Fe50−xRh50Crx depending on the replacement site. The study was complemented by the case of two (x = 3.7) or three (x = 5.6) Cr atoms in both sites (Fe48.1(Rh50−xCrx)). Some of the configurations are shown in Figure 1. The procedure followed for the modeling of the ferromagnetic and antiferromagnetic configurations for the CsCl-type case was recently published by our group for other Pd concentrations [38].
The corresponding density of states (DOS) and local density of orbital states (LDOS) were computed [41]. The corresponding magnetic moments for the atom (μ in μB) were obtained to complete the analysis.

2.2. Experiment

Alloys with the nominal composition Fe48Cr3Rh49 were synthesized through arc melting in an argon atmosphere. Subsequently, annealing was conducted in an argon atmosphere at 1000 °C for 72 h using a quartz tube. After annealing, the rapidly cooled (RC) sample was quenched in cold water, while the other sample was slowly cooled (SC) at a rate of 1 °C/min. The ingots were cut using a non-destructive wire saw method.
Structural characterization was performed using X-ray diffraction (XRD) with a Bruker D2 Phaser and scanning electron microscopy (SEM) using a Vega Tescan with EDX. The XRD setup was equipped with a linear LynxEye detector (USA) (5-degrees opening) and CuK α 1,2 radiation (40 kV and 10 mA). All samples were measured with a 0.02° two-theta step size, and each step had a measurement time of 4 s. The temperature and magnetic field dependences of the magnetization were measured using PPMS-14 (Quantum Design, USA) and VSM 7407 Series (LakeShore, LA, USA). The calculation of the magnetization value was made taking into account the volume fraction of the gamma phase, as detailed in [41].

3. Theoretical Results and Discussion

We investigated the behavior of the structural, magnetic and electronic properties of various crystal structures with the elemental composition detailed above. Consideration of such structures allowed us to simulate crystals in which chromium atoms replace the positions of rhodium or iron atoms, or where the replacement of iron and rhodium occurs simultaneously. We assumed that the differences in rapidly cooled and slowly cooled alloys lie in the degree of crystalline ordering. It was expected that various substitutions (different positions) of chromium atoms can occur in a rapidly cooled alloy, while a more ordered structure should be observed in a slowly cooled alloy. In addition, we considered crystal lattices in which chromium atoms were located in different coordination spheres relative to each other. A table describing the simulated crystal lattices can be found in the Supplementary Materials (Table S1).

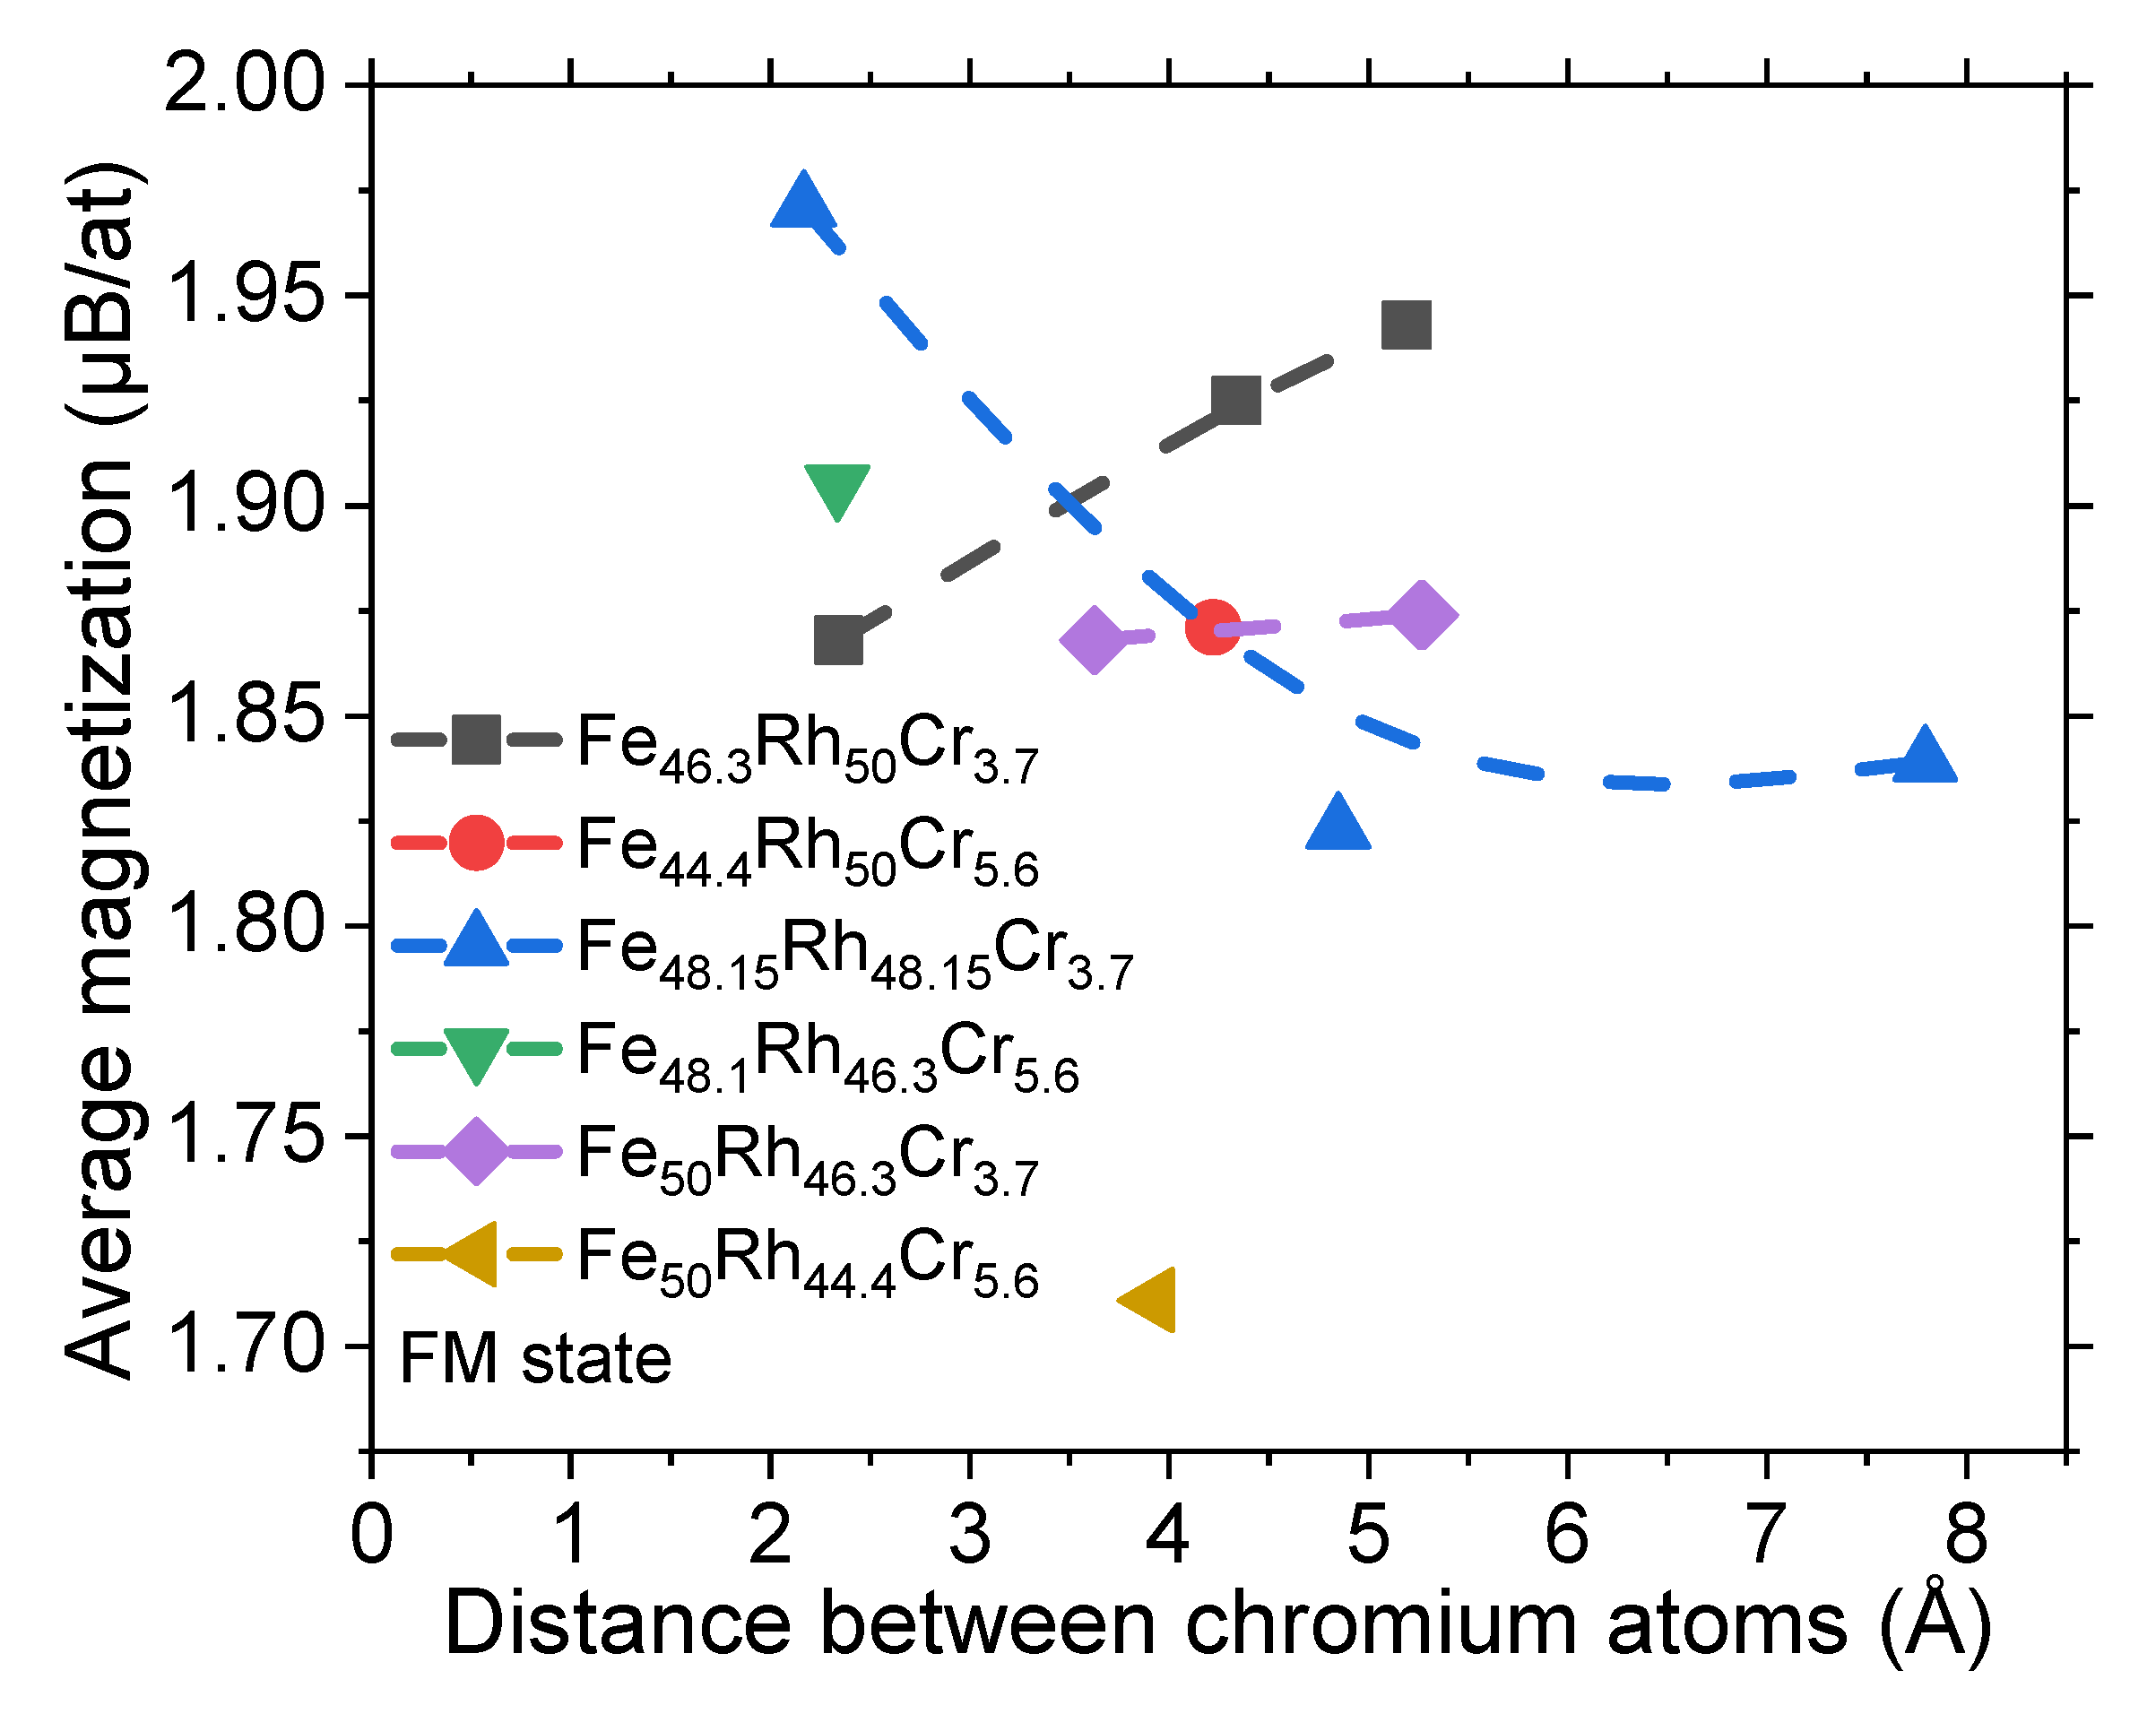
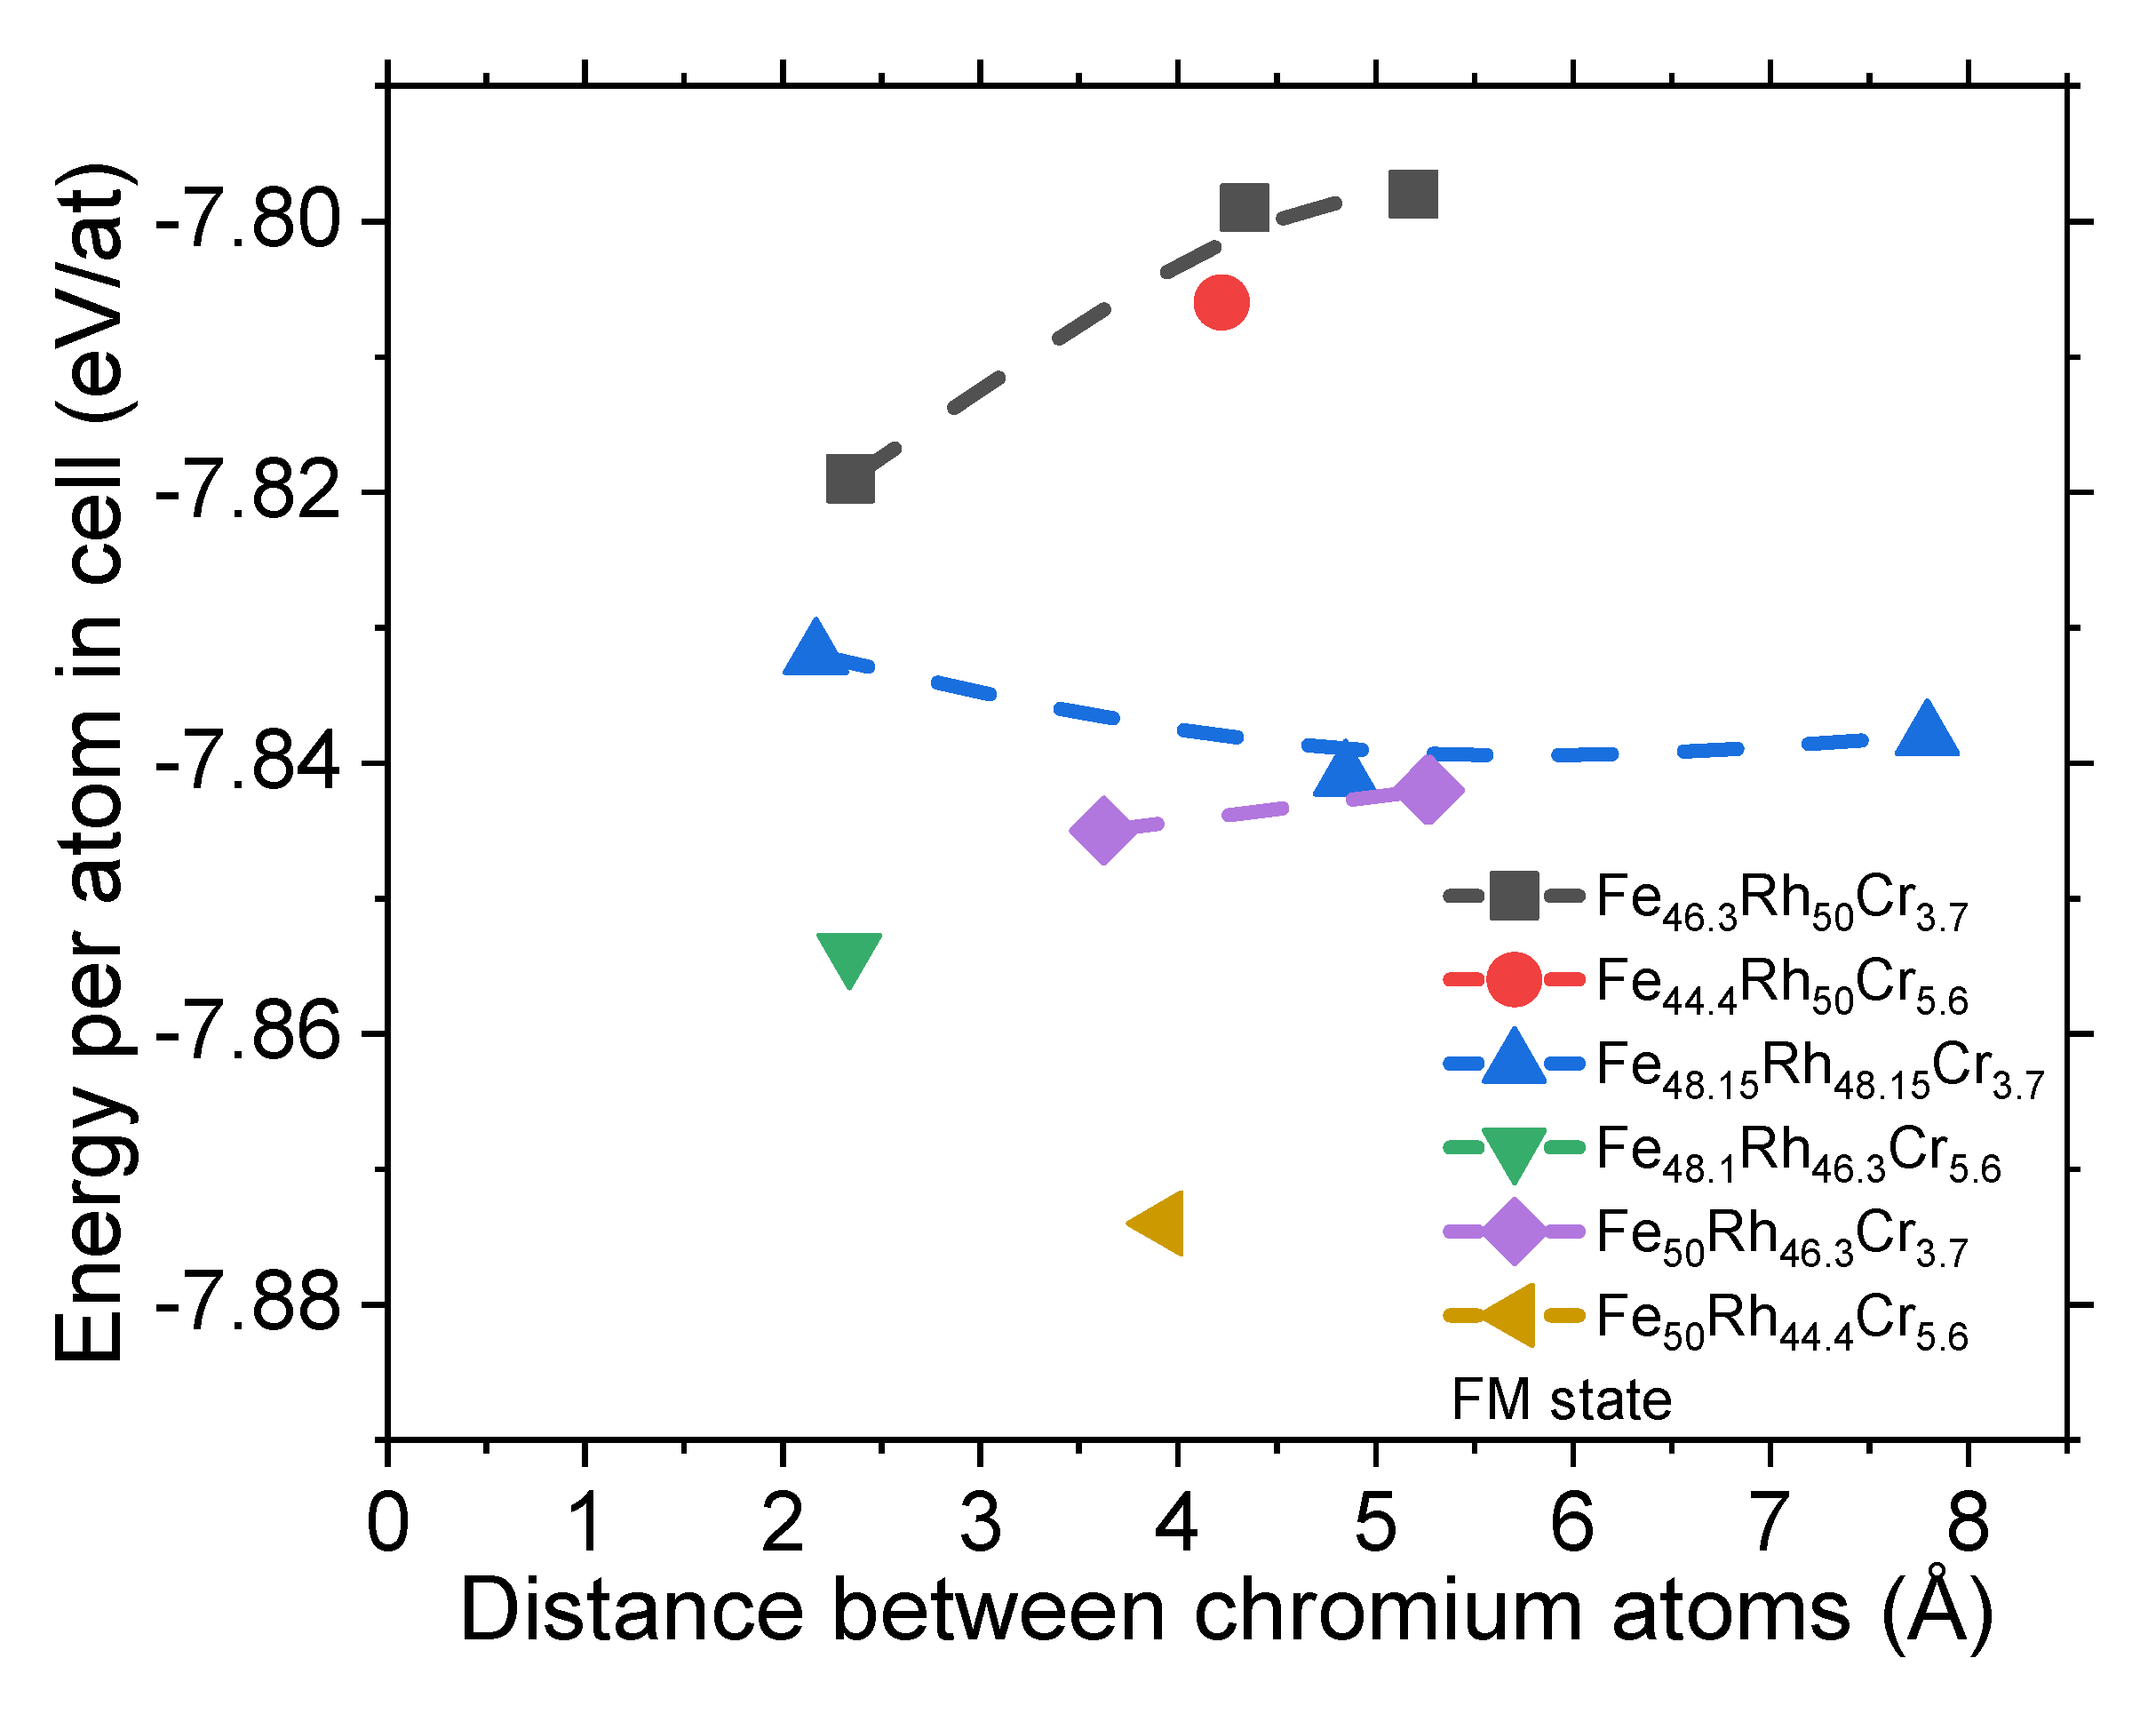
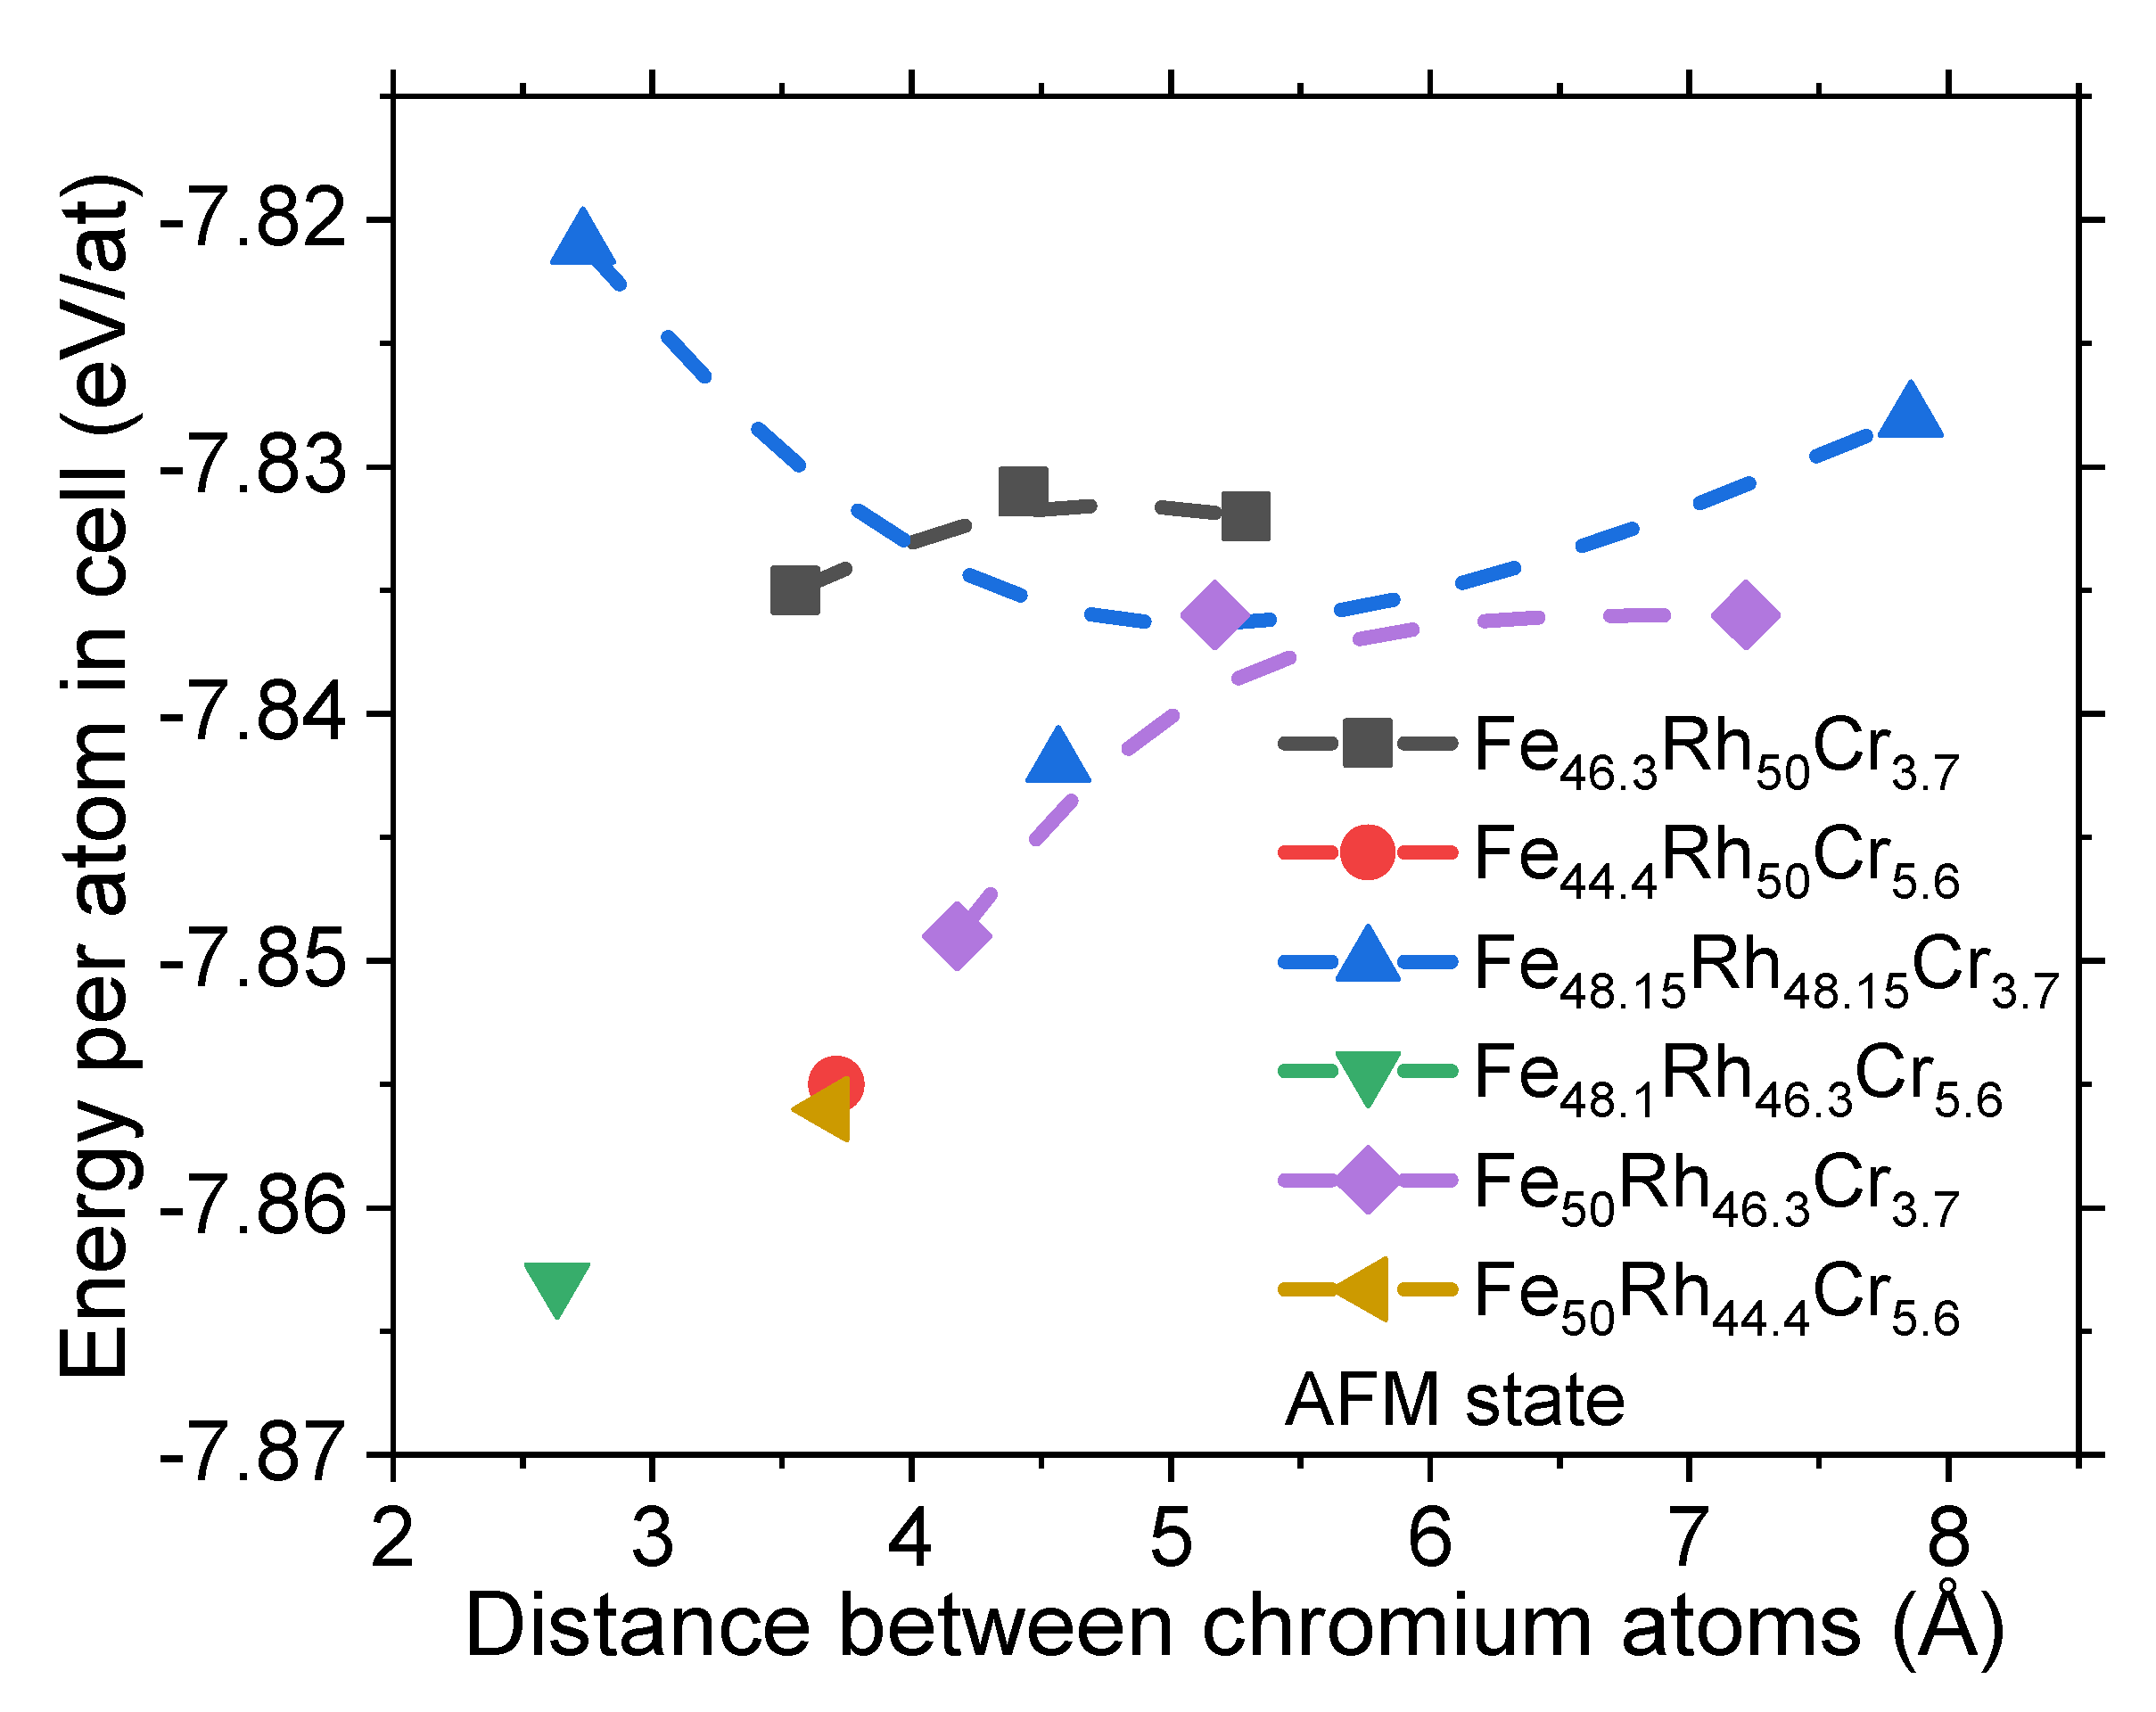
3.1. Structural and Magnetic Properties

The unit cell constants, the volume of the cell, the distances between chromium atoms (if the structure contains more than one chromium atom), and the magnetic moment values on the atoms of iron, rhodium, and chromium were determined for each simulated crystal structure. All the listed values were calculated for structures with ferromagnetic ordering (Table 2) and antiferromagnetic ordering (Table 3).
It was possible to identify some trends between the structural and magnetic properties in the ferromagnetic state from the analysis of the presented results (Table 2). An increase in the chromium concentration due to iron atoms’ substitution in the structure (Fe50−xCrx)Rh50 (where x = 1.9, 3.7, 5.6) leads to a decrease in the volume of the crystal lattice and its tetragonalization (Table 2). Moreover, the magnetic moment values on the iron and rhodium atoms decrease with an increase in the concentration of chromium in the crystal lattice. A decrease in the magnetic moment values of iron and rhodium atoms leads to a decrease in the average magnetic moment in the lattice. As can be seen from Table 1, the saturation magnetization of the binary alloy is greater than that of the chromium-doped one. Therefore, the calculated results correlate with the experimental ones taking into account the gamma phase. This issue will be discussed in more detail below. The replacement of rhodium atoms by chromium leads to similar trends in the behavior of structural and magnetic properties. An increase in the chromium concentration contributes to a decrease in the crystal cell volume. If we compare the percentage decreases in crystal cell volume caused by the replacement of one or three Cr atoms, we observe that when the Rh sites are occupied, this percentage (0.89%) is twice as high than when the Fe sites (0.46%) are occupied. However, lattice tetragonalization is not observed in this case. This fact can be explained by the significant difference between the ionic radii of the chromium and rhodium atoms. A less dense packing of atoms in the crystal structure is realized when the alloy is slightly doped with chromium. Therefore, chromium atoms may occupy crystallographic positions without disturbing the symmetry of the crystal. There is also a tendency for the magnetic moment values to decrease on the rhodium and iron atoms in the case of substitution of rhodium positions. It is noteworthy that when chromium atoms are localized at rhodium positions, then a large magnetic moment (~3 μ B ) is induced on them.
The direction of magnetic moments on chromium atoms is opposite to the magnetic moments of the iron atom sublattice. The magnetic moments on rhodium atoms are induced due to the hybridization of iron 3d electrons and rhodium 4d electrons in the ferromagnetic state. Slight doping with chromium atoms preserves intracrystalline fields in the alloy. However, the hybridization of the electronic structure leads to the appearance of a magnetic moment on chromium atoms. We suspect that this may be due to the fact that the chromium atoms are greater than the magnetic moment on rhodium atoms. Despite this, the opposite directions of the chromium and iron magnetic moments lead to a decrease in the average magnetization in the structure. A more interesting situation is realized in the case of simultaneous substitution of rhodium and iron positions in the crystal lattice. In this case, the trend towards a decrease in the unit cell constants and the magnetic moment values on the rhodium and iron atoms is preserved, as in the previous considered situations. It should be noted that the magnetic moment values on chromium atoms are determined not only by the crystallographic position but also by the distance between each other.
For a more detailed study of this issue, we plotted the dependences of the average magnetic moment on the distance between chromium atoms for various substitution options (Figure 2). There is an obvious tendency for the average magnetic moment to increase with an increase in the distance between chromium atoms at iron sites. This result may be explained by a decrease in the magnetic moment value on chromium atoms as they move away from each other. We did not find obvious differences in the magnetic moment values on chromium atoms depending on the distance between them in the case of substitution of rhodium positions. As discussed earlier, this result may be explained by the constancy of the intracrystalline field in the rhodium sites with slight doping. Summarizing all the presented results, it can be argued that the average magnetic moment has a minimum in case of replacing rhodium atoms, which are close to each other. The maximum value of the average magnetic moment is achieved due to the substitution of iron positions at a large distance between neighboring chromium atoms. A complex and nonmonotonic dependence of the average magnetic moment on the distance between chromium atoms is observed in the case of simultaneous substitution of iron and rhodium sites. It is necessary to study structures that include more atoms than considered here to unambiguously interpret this behavior.
We analyzed the free energy values of different structures in order to find out which of the considered structures is the most preferable. Figure 3 demonstrates the dependences of the free energy per atom on the distance between chromium atoms. The general trend is that clustering (close atom proximity to each other) of chromium atoms at rhodium positions leads to a decrease in the free energy. Therefore, such structures are the most energetically favorable. On the contrary, the substitution of iron positions with an increase in the distance between chromium atoms leads to an increase in free energy. However, from the point of view of the experiment results (discussed below), we assume that the chromium atoms are uniformly distributed over the lattice, with no clustering (it is possible that clustering of iron atoms is achievable with a significant change in the alloy cooling rate). This issue requires further clarification using the TEM or EXAFS methods. The most probable cases are the simultaneous substitution of iron and rhodium positions or the substitution of only rhodium sites (blue and purple dots in Figure 3). It is difficult to distinguish the most favorable one between these two structures since they have similar free energies (−7.83 and −7.85 eV/at). It can be assumed that chromium atoms predominantly occupy rhodium positions, but some of the atoms are located at iron sites. This conclusion follows from the free energy value (−7.854 eV/at) for a high concentration of chromium atoms (green dot in Figure 3), in case two atoms occupy the positions of rhodium and one of the iron positions.
Note that the family of FeRh-based near-equiatomic alloys may exhibit an antiferromagnetic order. Therefore, we investigated the structural and magnetic properties of antiferromagnetic ordering. The summary results are presented in Table 3. The behaviors of the structural properties of a crystal in the ferromagnetic and antiferromagnetic states are similar. The difference is that the unit cell constant in the antiferromagnetic state is much smaller than in the ferromagnetic state, causing a contraction in the cell volume (see Table S1 in Supplementary Material). This fact has been well-studied theoretically and experimentally [12,38]. However, the magnetic properties show a number of features depending on the chromium atoms’ arrangement in the lattice. For example, the magnetic moments on chromium atoms are similar to iron magnetic moments in case of iron sites’ substitution. There are also some other interesting patterns to be noted. The chromium magnetic moment values are around 1 µB/at (for rhodium, these values are less) in case the chromium atoms are in the rhodium sites. The appearance of a magnetic moment on chromium atoms occurs due to hybridization with neighboring atoms. Their magnetic moments change with an increase in the distance between chromium atoms (more than 7 Å) in the crystal structure: +0.6 µB/at and −1.8 µB/at. This fact may indicate that hybridization takes into account not only the electronic states of nearby atoms but also those following them.
We also analyzed in detail the free energy values per atom for each of the structures in the antiferromagnetic state (Figure 4). No significant difference is observed between the crystal structures if chromium atoms on iron sites are located at different distances from each other (black color). The free energy value varies around −7.832 eV/at for such substitution. However, an increase in the chromium concentration on iron positions reduces the free energy value. The most energetically favorable structure of the crystal lattice is realized if chromium atoms replace rhodium and iron simultaneously (2 rhodium atoms and 1 iron atom). There is also a tendency for the crystal structure free energy value to increase with an increase in the distance between chromium atoms. The free energy of the crystal structure does not change if the chromium atoms are separated from each other by more than 5 Å (approximately equal to −7.83 eV/at). We should note that this result does not depend on the type of substitution.

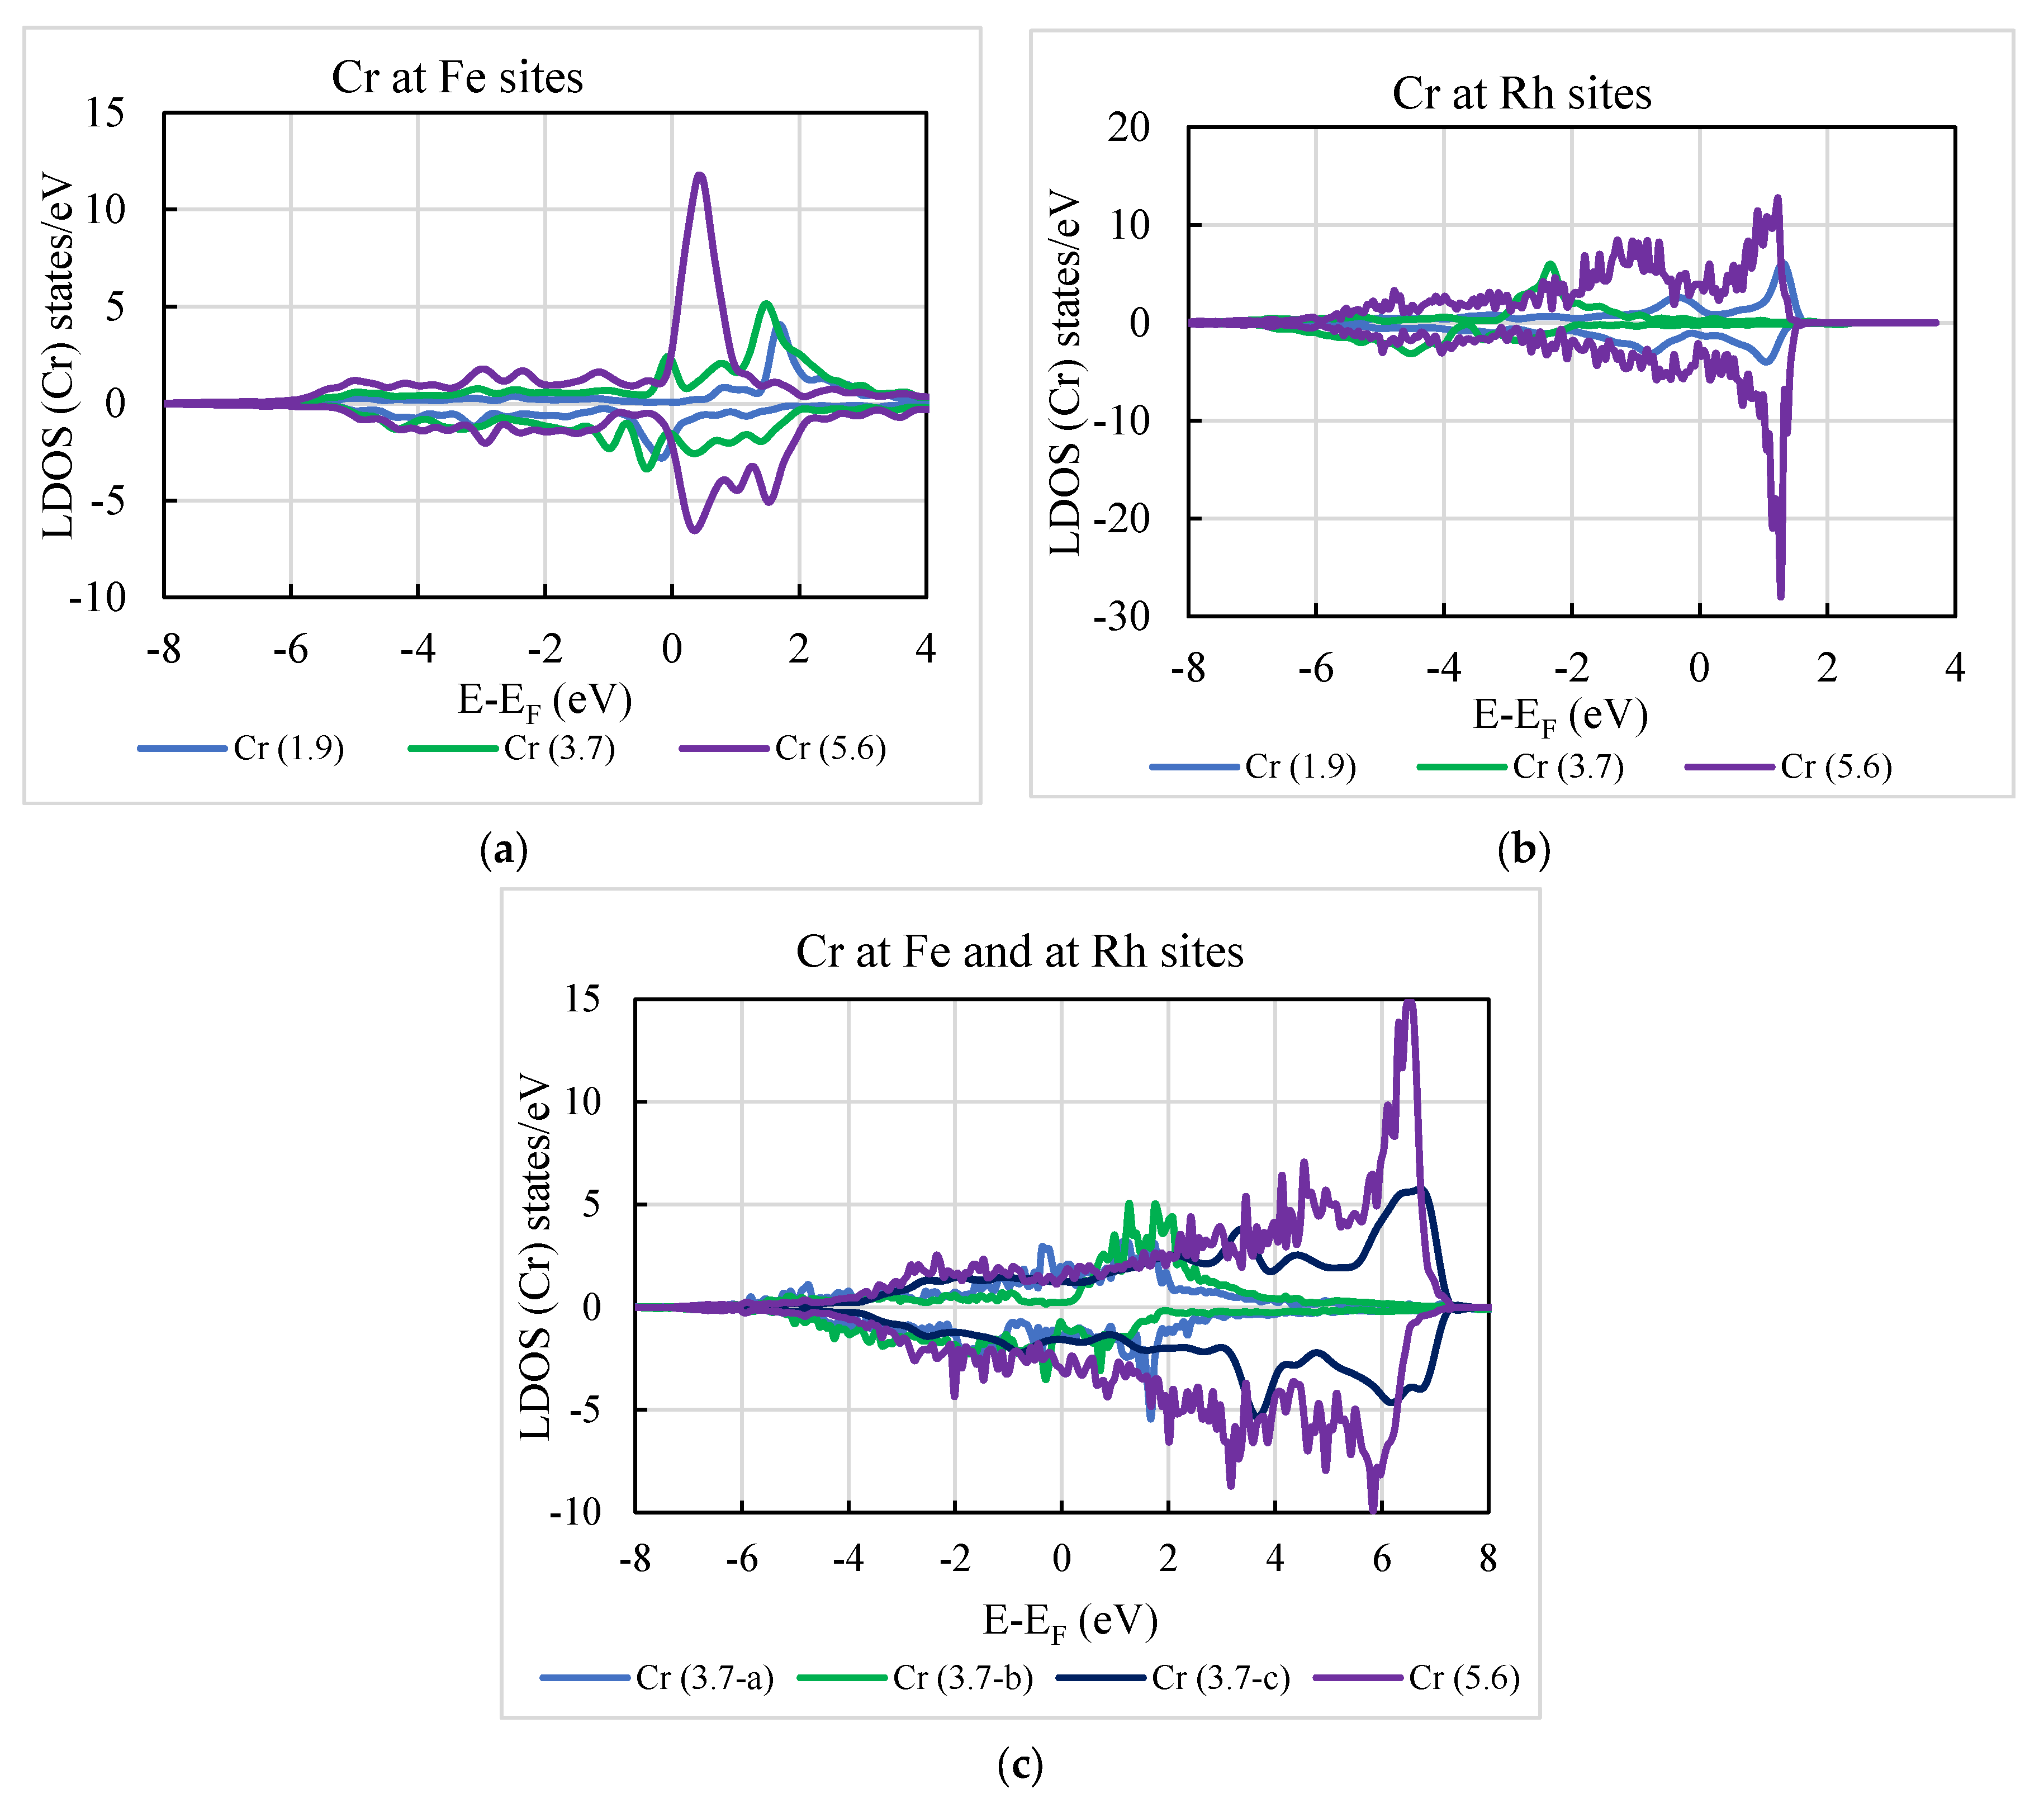
3.2. Electronic Properties

To complete the analysis, the electronic structures corresponding to the different Cr concentrations were calculated for both spin configurations (ferromagnetic and antiferromagnetic) (see Table S2 in the Supplementary Material). We also included the local density of states (LDOS) corresponding to the Fe-3d, Rh-4d and Cr-3d states to complete the analysis of the changes observed in the magnetic properties of this alloy. The Fermi level was taken as the reference.
The DOS curves’ qualitative form for the ferromagnetic and antiferromagnetic configurations shows a strong hybridization between Fe-3d states and Rh-4d states (see Table S2). An increase in the Cr concentration leads to a change in the density of electronic states near EF (Fermi energy). The local densities of the Cr-3d states at Fe sites (a), at Rh sites (b) and mixed sites are plotted for different Cr contents in the ferromagnetic state (see Figure 5) for better visualization. The comparative analysis of the Cr LDOS at the Fermi level revealed its large local values, especially when located at Rh sites (see Figure 5b). This indicates a higher local magnetic moment of Cr atoms compared to the Cr atoms located in Fe sites, as has been previously shown (Table 2). Finally, it can be mentioned that in the case of the disordered alloy (Figure 5c), the width of the LDOS (Cr) increases from ~8 eV to 12 eV.
Table 4 summarizes the values of densities of total and local states at the Fermi level obtained from the calculation of the electronic structure. When the Cr atoms are located at the Rh sites, the occupation number of the majority spin gradually increases and that of the minority spin decreases as the fraction of Cr increases. This trend is not observed when the Cr atoms are located at the Fe sites. On the other hand, we find that the states near the Fermi level are mainly contributed by the Rh states. This trend is maintained when the alloy is disordered, i.e., Cr atoms are in both sites. Such dependence is not observed in the case of Cr atoms located at the Fe sites. In particular, for the same Cr content (see, for example, x = 3.7), depending on where the Cr is located, the values of densities of states at the Fermi level differ (first five rows of Table 4). As the chromium concentration increases, the overall DOS value near the Fermi level decreases. Based on this fact, it can be assumed that the conductivity of the alloy will also decrease. Another important parameter is the difference in the DOS at the Fermi level ( n n in Table 4.). One can notice a general trend towards a decrease in this value with increasing chromium concentration. Hence, it can be assumed that the magnetization of the alloy during doping should decrease.
In addition, it can be observed that the electronic behavior is mainly contributed by the majority states (see Table S2) but the situation changes around the EF as the energy reference goes from 0 to 2 eV. The spin-down states move to higher energies. In the minority band, the participation of Rh is stronger below EF and weaker above EF, consistent with the fact that the Rh local moments are smaller than those of Fe.

4. Experimental Results
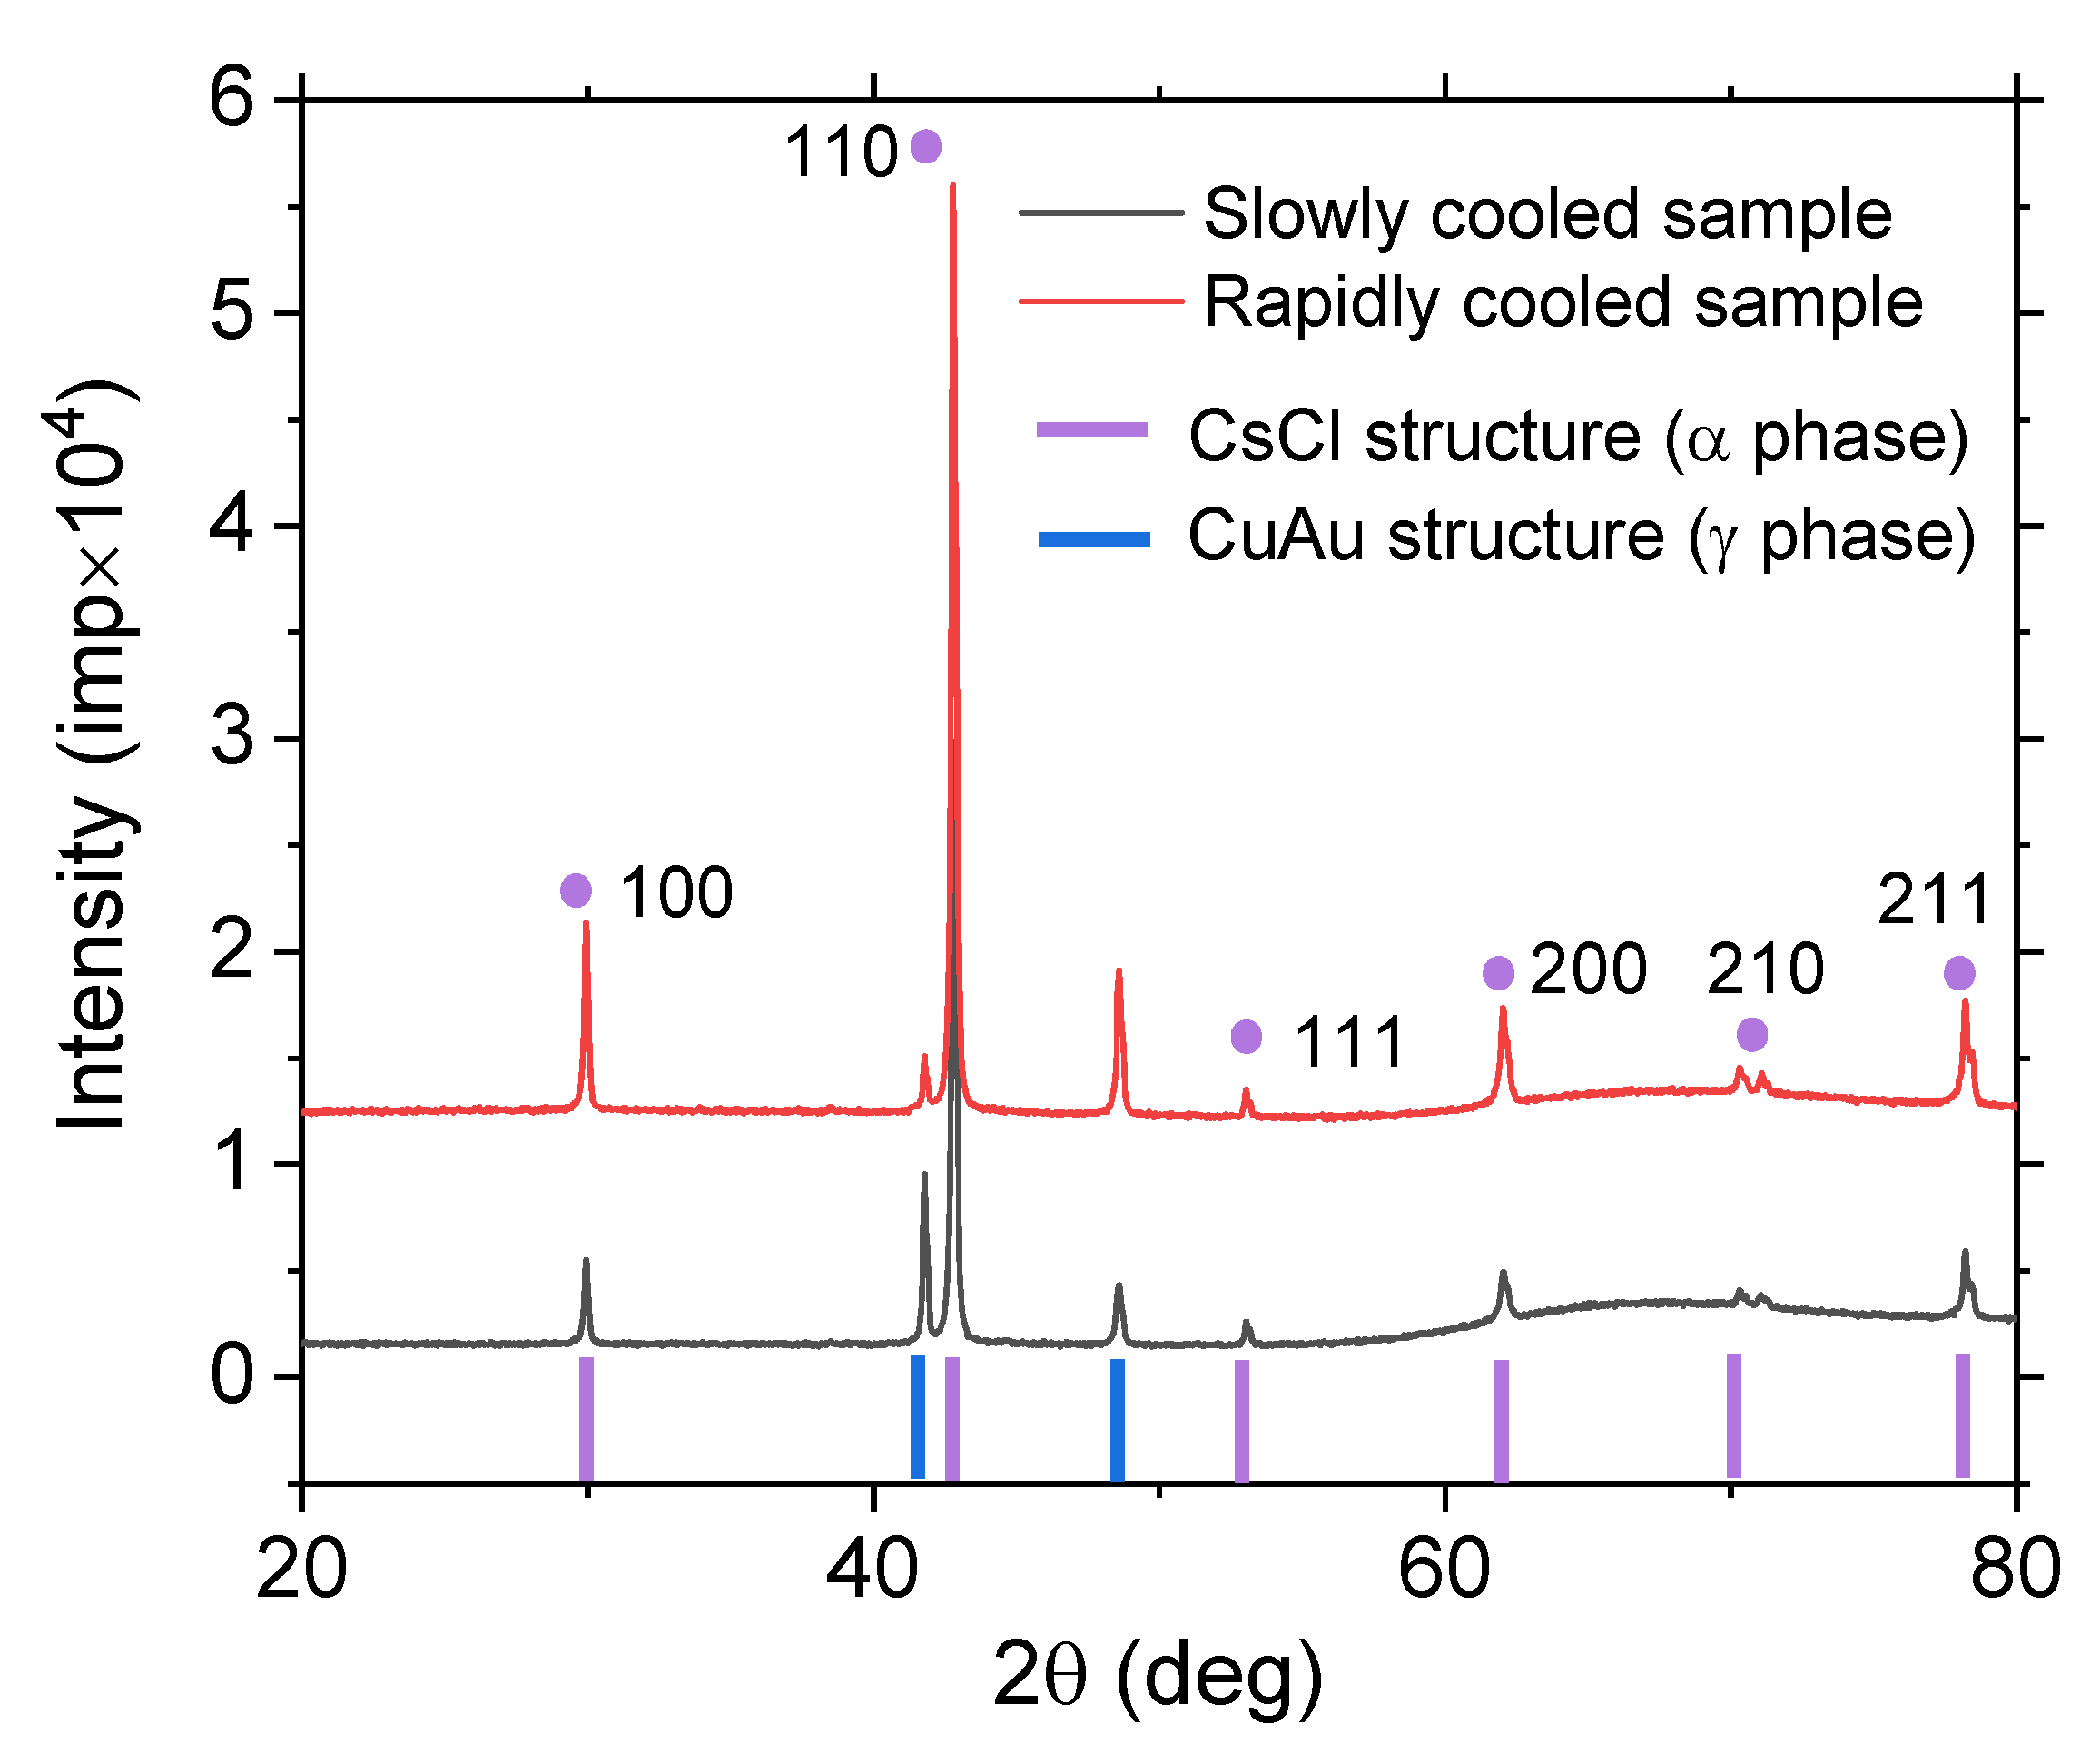
4.1. XRD Results

Based on the X-ray diffraction (XRD) results presented in Figure 6, both samples exhibit the main crystal structure of the CsCl type (α phase), along with an additional crystal structure of CuAu type (γ phase). The lattice constants for the ferromagnetic state of the slowly cooled and rapidly cooled samples are identified as 2.9961 Å and 2.9963 Å, respectively. The discrepancy in lattice constants between the two samples suggests the possibility of local disorder in the crystal structure of the rapidly cooled sample, as its lattice constant is larger compared to the slowly cooled one. Such phenomena are commonly observed in amorphous materials [42], where rapid cooling (at rates 105–106 K/s) results in the absence of a well-defined crystal structure, leading to the amorphous state. Moreover, the X-ray diffraction analysis revealed the presence of an additional crystalline phase, the CuAu type. The lattice constants of the γ phase in the slowly cooled and rapidly cooled samples are identified as 3.7549 Å and 3.7556 Å, respectively. The difference in the lattice constants of the γ phase further supports the notion of local disorder in the rapidly cooled sample. Notably, in the ferromagnetic state, the Fe49Rh51 alloy exhibits an increase in lattice constant compared to the Fe48Cr3Rh49 alloy [12]. This outcome is expected due to the smaller ionic size of the chromium atom compared to the ionic radii of the iron and rhodium atoms.

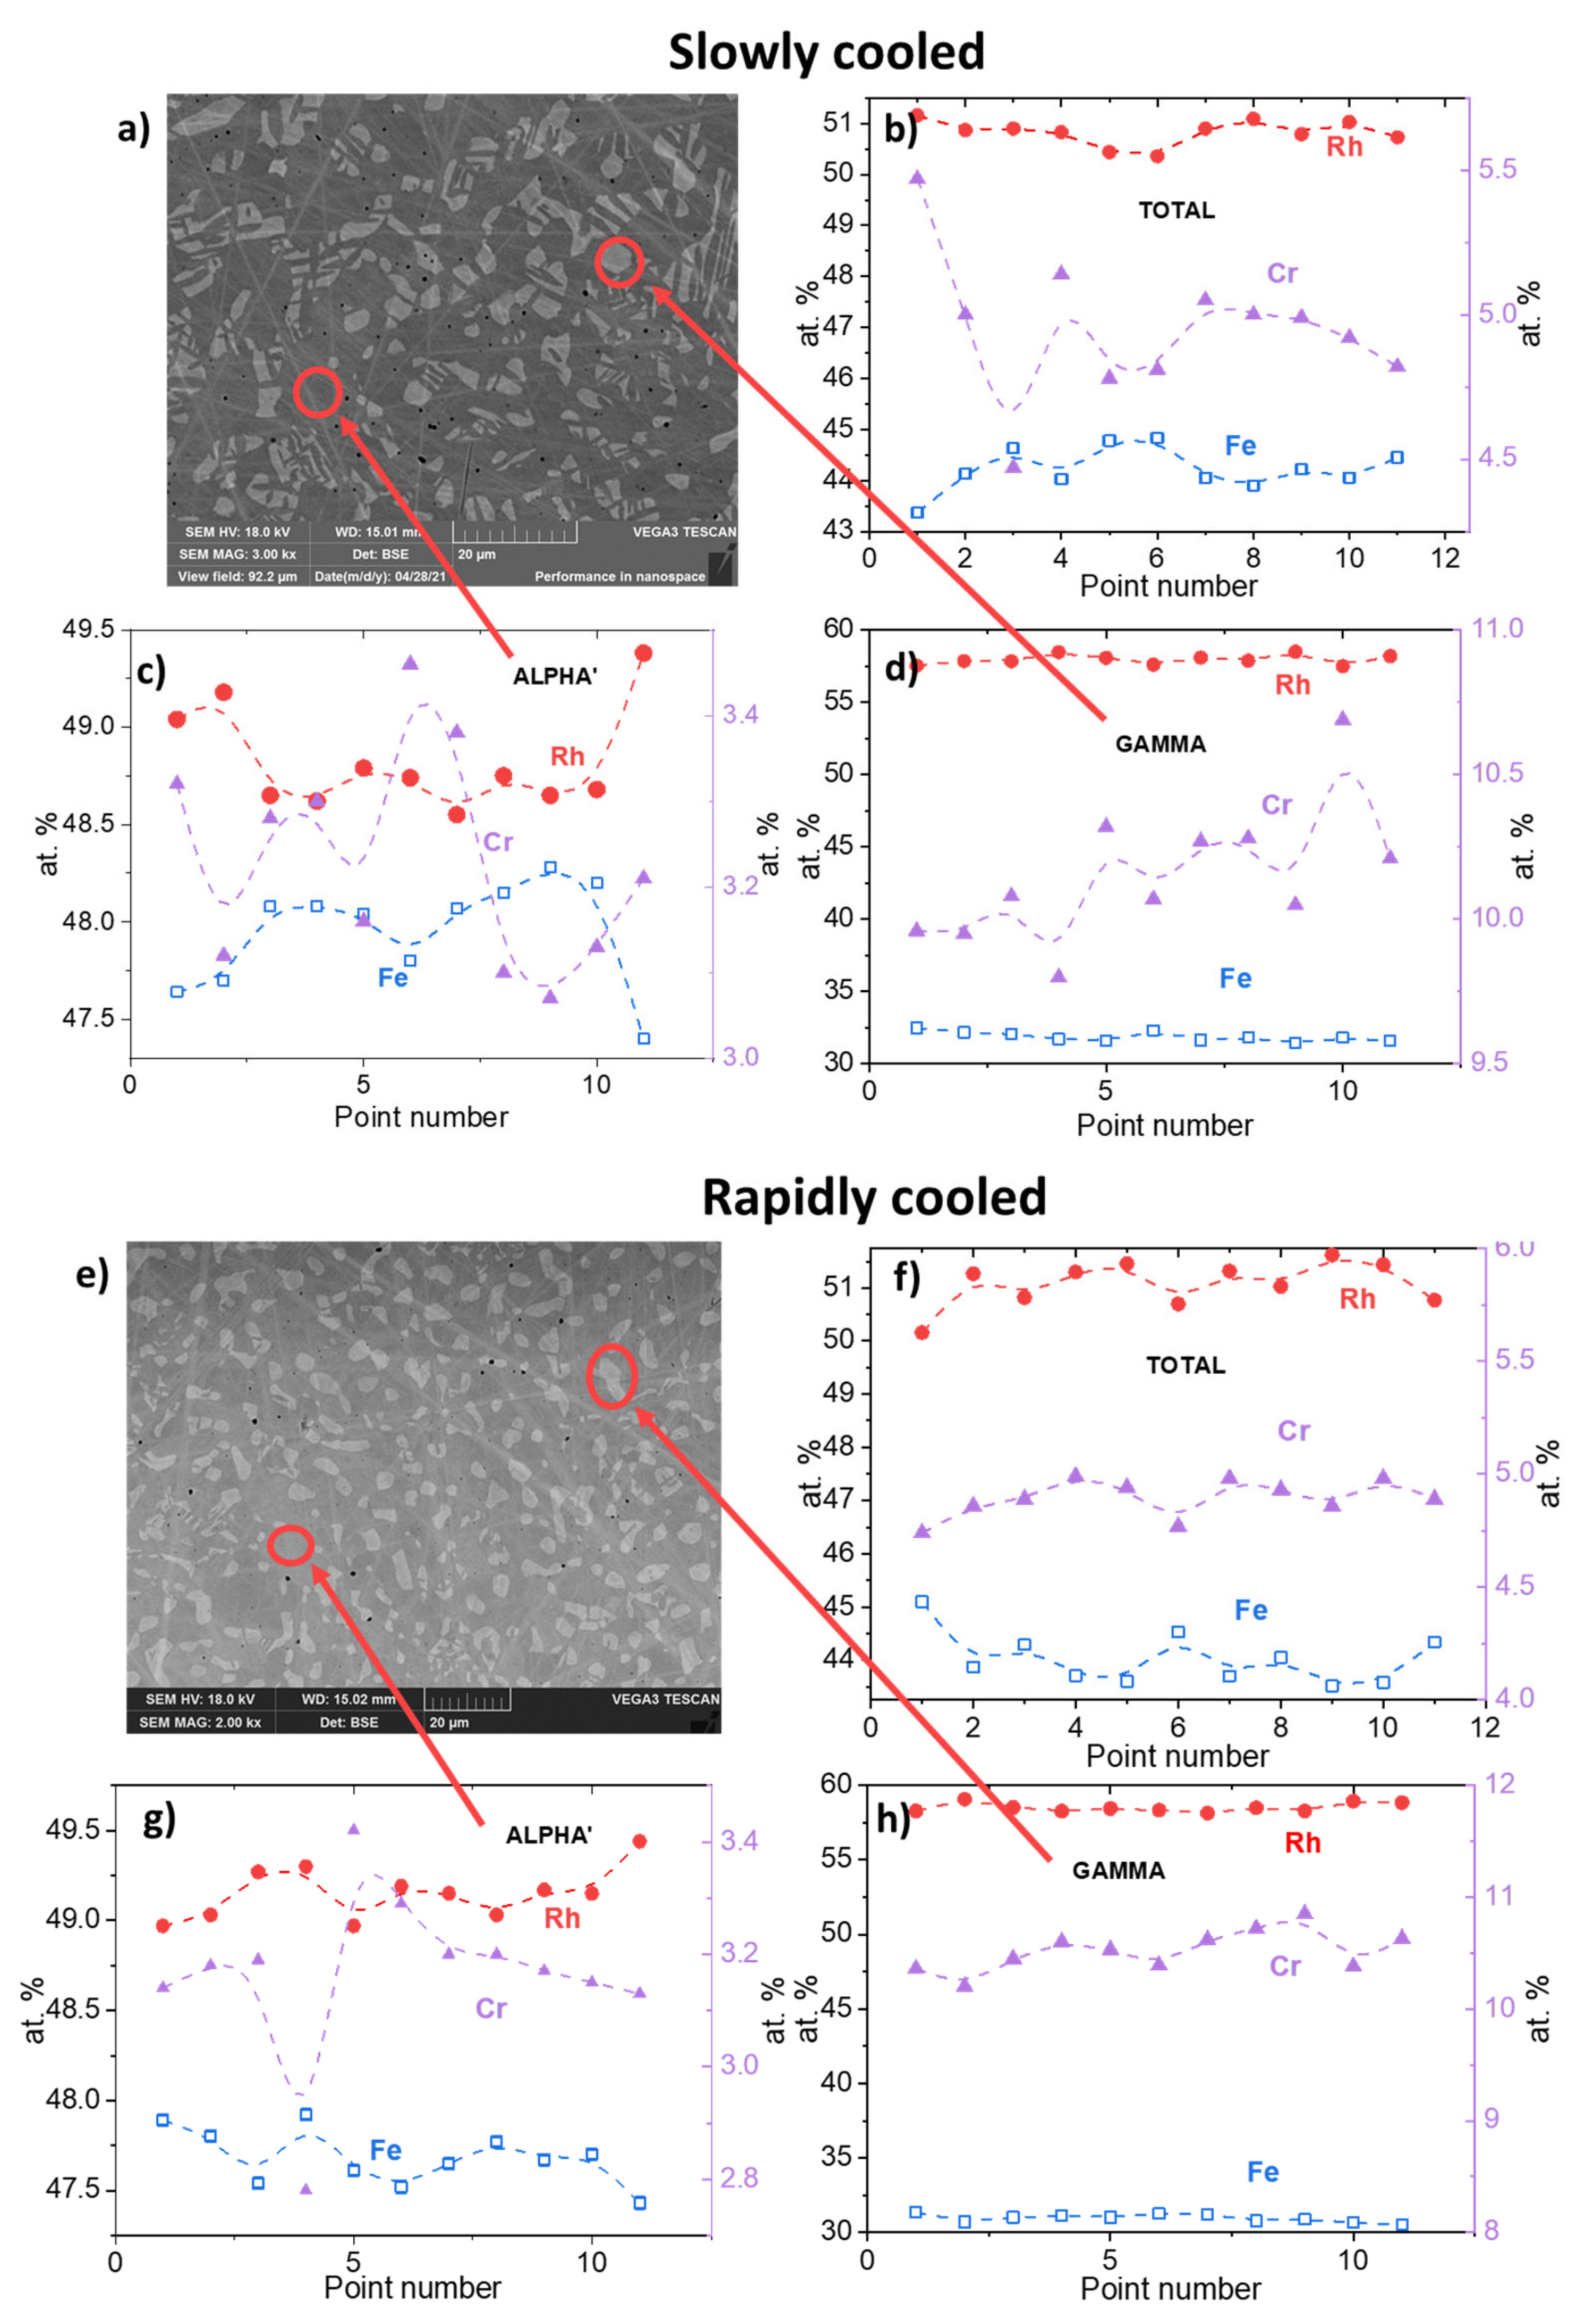
4.2. Electron Microscopy Results

The EDX analysis results confirmed the fact that both samples contain a volume fraction of the gamma phase, with 20% and 22% observed for the RC and SC samples, respectively. The presence of the gamma phase is expected for the Fe49Rh51 compound and can be explained by the proximity of the phase boundary in the phase diagram [43]. The stability of the main alpha phase is determined by the size of the substituting atom (one of the reasons), according to the hypothesis described in [41]. If the ionic radius of the substituting element is less than the ionic radius of the implemented element, then an increase in the percentage of the doped element reduces the stability of the alpha phase. This fact leads to an increase in the volume fraction of the gamma phase. A slight increase in the volume content of the gamma phase in Fe48Cr3Rh49 alloys compared to the volume fraction of the gamma phase in the binary compound Fe49Rh51 [41] may confirm the above hypothesis.
In addition, the results of EDX analysis allow us to determine the elemental composition of both phases for all samples. Figure 7 illustrates the percentages of Fe, Rh, and Cr atoms in SC and RC samples, respectively. The elemental compositions of both samples are approximately the same: Fe48Cr3Rh49 (Fe47.68Cr3.17Rh49.15 for rapidly cooled alloy and Fe47.95Cr3.23Rh48.82 for slowly cooled alloy) in alpha phase and Fe32Cr10Rh58 in gamma phase. The presented results for the alpha phase give us reason to believe that chromium atoms occupied the iron and rhodium positions in both samples. However, the actual concentrations of chromium and rhodium atoms in the alpha phase turned out to be less than the nominal concentrations. This fact may be explained by the increased concentration of chromium atoms in the gamma phase.

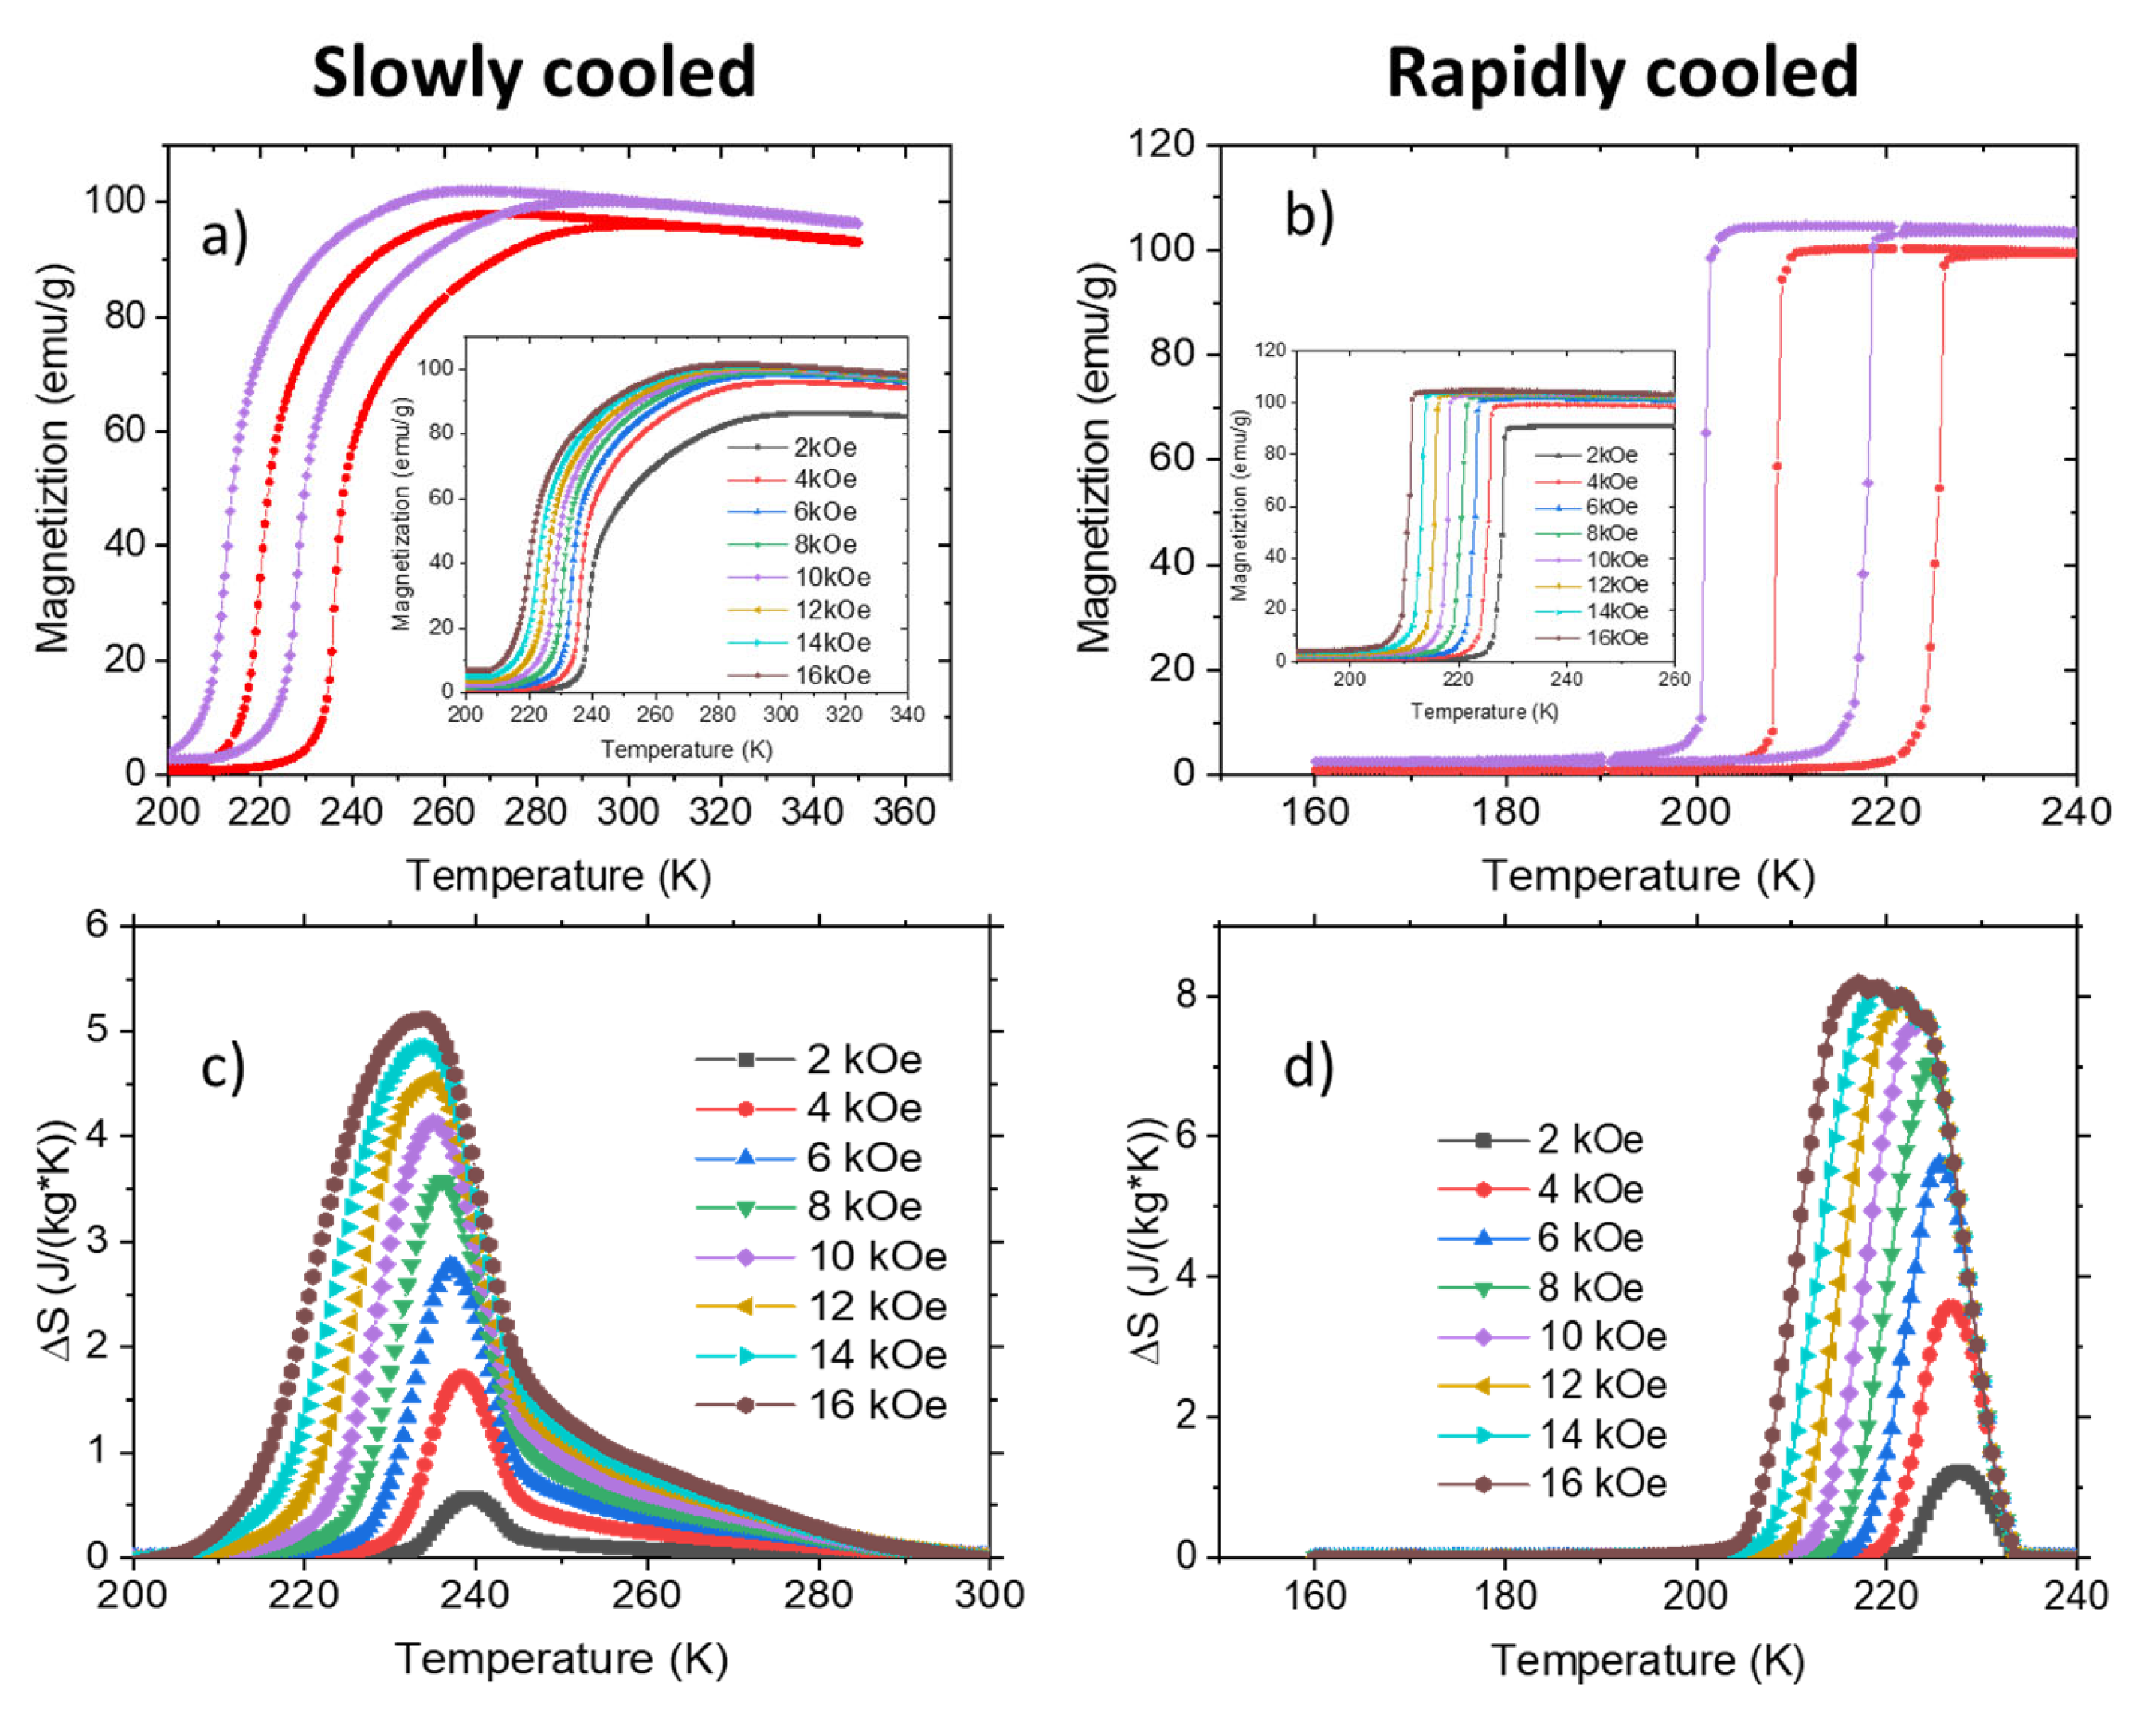
4.3. Magnetic Measurements

We measured the temperature dependences of the magnetization in different magnetic fields (Figure 8a,b) to determine the phase transition temperatures of the samples. The phase transition temperatures from the antiferromagnetic to the ferromagnetic state for RC and SC samples are equal to 228 K and 240 K (in field 2 kOe), respectively. A rapidly cooled sample has a lower phase transition temperature. We assume that the nucleation of the ferromagnetic phase may start near a local defect in the crystal lattice. Above, we put forward a hypothesis about the presence of such defects in a rapidly cooled sample based on the results of structural analysis. The change in the phase transition temperature may be a confirmation of our hypothesis. Another possible reason for the change in the phase transition temperature may be the presence of a negative chemical pressure effect in the rapidly cooled alloy [44,45,46]. The presence of vacancies may be the reason for the appearance of negative pressure in the crystal lattice. An indirect confirmation of this fact is a slight increase in the lattice parameter in a rapidly cooled alloy compared to a slowly cooled one (Table 1). As can be seen from Figure 8a,b, the temperature hysteresis widths for SC and RC samples are equal to 15 K and 17 K, respectively. Previously, it was reported that the temperature hysteresis width is proportional to the phase transition temperature [47,48]. However, these experimental results indicate that additional mechanisms may exist. For example, one of the possible reasons may be the presence of local defects in the crystal structure. We noticed an obvious difference in the maximum values of the temperature derivative of magnetization for the samples. The increase in magnetization with increasing temperature during first-order magnetic phase transition is associated with the ferromagnetic phase nucleation and growth. As is known, the nucleation of the ferromagnetic phase occurs at defects [49]. Then, according to our hypothesis, an increase in the number of defects in the crystal lattice should lead to an increase in the M T m a x value. The experimental results confirm this hypothesis. The derivative values in the field 16 kOe for a slowly cooled and rapidly cooled alloy are equal to 7.6 emu/(g × K) and 51 emu/(g × K), respectively. An alternative reason for the change in M T m a x value in the samples may be a different dispersion in the homogeneity of their composition. The dispersion of the iron and rhodium atomic composition in SC is 0.3%, and in RC it is 0.2%. A sample that is more homogeneous in composition has a greater value of M T m a x . The M T m a x value is an important parameter that is involved in the Maxwell relation for the entropy change calculation. The entropy change is a parameter that can be used to estimate the magnetocaloric effect value.
The results of the entropy change calculation are shown in Figure 8c,d. As expected, the entropy changes for the RC alloy were larger than for SC (8.2 J/kg/K and 5.1 J/kg/K, respectively, in a field of 16 kOe). However, the entropy change for the RC Fe48Cr3Rh49 alloy turned out to be smaller than for the binary one (14.4 J/kg/K in a field of 15 kOe) [10]. This fact may be explained by a decrease in the magnetic moment per crystal cell if the binary alloy is doped with chromium (Table 1).
Applying an external magnetic field is another mechanism of inducing a phase transition. Figure 9a shows the field dependences of the magnetization for RC and SC alloys (at 10 K). The initial, almost linear increase in the magnetization is associated with the skew of the magnetic moments along the direction of the magnetic field (like a usual antiferromagnetic). A phase transition, which is accompanied by a sharp increase in the magnetization, occurs at a critical magnetic field. It should be noted that the value of this field for the RC alloy is less (122 kOe) than for the SC one (133 kOe). The change in the phase transition temperature and the value of the critical magnetic field correlate for samples with different cooling rates. The magnetization of the SC sample does not reach the saturation magnetization. Therefore, the SC alloy cannot completely pass into the ferromagnetic state in a field of 14 T. The magnetization field dependences in the ferromagnetic state (at room temperature) were also measured for both samples (Figure 9b). We determine the effective anisotropy constant from these results. The effective anisotropy constant was calculated using the approximation of the magnetization curve produced by the Akulov law. A detailed description of the calculation methodology can be found in [50]. The effective anisotropy constant for a rapidly cooled sample is 6.1 × 10⁵ erg/cc, and it is 6.0 × 10⁵ erg/cc for a slowly cooled alloy. Certain values are close to each other since both alloys have the same composition and crystal lattice type. We assume that an insignificant number of defects in the crystal lattice structure may lead to an increase in the effective anisotropy constant due to the pinning of the magnetic moment orientation near the defects. We also analyzed the behavior of the coercive force and remnant magnetization at room temperature. The coercive force ( H c ) and remnant magnetization ( I r ) of the rapidly cooled sample ( H c = 15 Oe, I r = 3.3 emu/g) were slightly higher than those of the slowly cooled one ( H c   = 12 Oe, I r = 1.9 emu/g). An increase in the coercive force and remnant magnetization may also be associated with domain wall pinning near local inhomogeneities of the sample [51,52].
In summarizing the calculated and experimental results, we tried to estimate the most stable structure that can be realized experimentally. It is known from experimental data that the slowly cooled alloy (we suppose that it is the fully ordered alloy) has a lattice constant a = 2.996 Å and saturation magnetization I s a t = 103 emu/g. The closest crystal structure with a chromium concentration of 3.7% is Fe50Cr3.7Rh46.3 with the distance between chromium atoms a = 3.626 Å. This crystal structure has an average lattice constant a = 2.996Å and saturation magnetization I s a t = 106 emu/g. Note that the experimentally obtained values are slightly less than the theoretical ones. Above, we discussed the problem of implementing calculations of various proportions of substitutions for rhodium and iron positions at a low chromium concentration. Therefore, we made a rough estimate based on experimental results. The estimation was carried out by calculating the arithmetic mean value. If 8% of the chromium atoms were located at iron positions, and the rest at rhodium positions, then the lattice constant of the calculated structure would coincide with the experimental value (the distance between chromium atoms was chosen according to the minimum energy value). Next, we tried to make a similar estimate for a rapidly cooled alloy. We assumed that 8% of the atoms are in iron positions, with the rest in rhodium positions (as in the case of a slowly cooled alloy). However, the distances between chromium atoms can take values from 2.343 Å to 5.258 Å with equal probability (according to the performed calculations). The lattice constant for such a structure is a = 2.997 Å, while the saturation magnetization is I s a t = 107 emu/g. We note that the use of such a primitive estimate indicates a tendency towards an increase in the lattice constant and saturation magnetization in an incompletely ordered alloy. For a rapidly cooled alloy, the values a = 2.996 Å and I s a t = 111 emu/g were experimentally determined. Therefore, the calculated values correlated with the experimental ones. We hope that the use of more modern calculation methods in the future will be able to confirm and extended our rough estimates. The development of our method will make it possible to more accurately predict the properties of materials with different heat treatments.

5. Conclusions

This study provides experimental analysis and theoretical calculations of the structural, electronic and magnetic properties of Fe48Cr3Rh49 alloys with different cooling rates. Our findings are in line with the previous literature, suggesting that the magnetic phase transition parameters in alloys are sensitive to heat treatment protocols.
Through ab initio calculations, we demonstrated that the degree of crystalline ordering can be manipulated by selecting the substitution positions of the doping element. Specifically, we observed that chromium atoms tend to occupy rhodium positions, with a tendency towards clustering and reduced interatomic distances among chromium atoms.
When comparing our calculated results with experimental data for a slowly cooled alloy, we obtained a high degree of agreement for the Fe50Cr3.7Rh46.3 structure, where the distance between chromium atoms was found to be a = 3.626 Å. In contrast, for a rapidly cooled alloy, we consider a structure where 8% of chromium atoms replaced iron positions, while the remaining atoms occupied rhodium positions. In this case, the distances between chromium atoms varied from 2.343 Å to 5.258 Å with equal probability.
Based on our analysis of experimental results, we concluded that an increase in the quenching rate of the alloy results in an increase in crystal defects. This, in turn, affects the alloy’s magnetic properties through two main mechanisms: (i) the nucleation of the ferromagnetic phase near local defects in the crystal lattice and (ii) the presence of vacancies in the lattice inducing a negative pressure effect. Therefore, increasing the quenching rate leads to a decrease in the phase transition temperature and critical magnetic field, as well as an increase in the effective anisotropy constant, coercive force, and the value of the magnetocaloric effect.
In summary, our findings demonstrate that the choice of crystallographic substitution positions and interatomic distances (between the doped atoms in the crystal lattice) can significantly alter the magnetic properties of the alloy. Moreover, selecting specific heat treatment parameters provides a means to control the degree of crystal ordering in the alloy. We believe that further development of our approach will enable more accurate prediction of material properties under different heat treatment conditions.

Supplementary Materials

The following supporting information can be downloaded at: https://www.mdpi.com/article/10.3390/met13101650/s1. Table S1: Models of supercells using to represent different Cr concentration in FeRhCr alloy for both spin configurations (FM and AFM). Color reference: Rh atoms are in gray, Cr atoms are in purple and Fe atoms are in gold (spin up) and blue (spin down). The corresponding volume of the crystal lattice (Vol cell) and energy per atom in cell (E/at) are included. The most stable energy values for the different Cr concentrations are highlighted in bold.; Table S2: Local density of states (LDOS) of FeRh alloy at different contents of Cr obtained from FM and AFM magnetic configurations. The origin of the energy scale corresponds to the Fermi level. The spin-down (minority) were plotted as negative values to facilitate the visualization. Color reference: total DOS in black, LDOS of Fe (3d) in orange, Rh (4d) in gray and Cr (3d) in violet.

Author Contributions

A.S.K. designed the work concept, provided and analyzed experimental data, analyzed theoretical data, prepared the first draft of the manuscript with contributions from all other authors, and prepared the illustrations; G.F.C. carried out numerical calculations, analyzed theoretical data, and prepared the manuscript; A.M.C. synthesized samples, provided experimental data, and prepared the manuscript; N.U. provided XRD measurements and prepared the manuscript; E.A.S. performed XRD analysis; R.G. conducted data curation; V.I.Z. carried out project management; N.V.B. synthesized samples and performed validation; N.S.P. performed formal analysis and provided supervision. All authors have read and agreed to the published version of the manuscript.

Funding

The authors acknowledge support from the Russian Ministry of Science and Education, Grant No. 075-15-2021-1353 (A.S.K. and N.S.P. for magnetic measurements), theme № 122021000034-9 (N.V.B. for sample synthesis) and Project No. 122021000031-8 (E.A.S. for structure characterization). G.F.C. is thankful for the financial support from the Consejo Nacional de Investigaciones Científicas y Técnicas (CONICET) and the Universidad Nacional del Sur (UNS), Departamento de Física (PGI: 24/F081). A.S.K. thanks the BASIS Foundation for scholarship support.

Data Availability Statement

All relevant data are available from the authors.

Acknowledgments

The authors acknowledge support from M.V. Lomonosov Moscow State University’s Program of Development.

Conflicts of Interest

The authors declare no conflict of interest. The funders had no role in the design of the study; in the collection, analyses, or interpretation of data; in the writing of the manuscript; or in the decision to publish the results.

References

  1. Skokov, K.P.; Müller, K.-H.; Moore, J.D.; Liu, J.; Karpenkov, A.Y.; Krautz, M.; Gutfleisch, O. Influence of Thermal Hysteresis and Field Cycling on the Magnetocaloric Effect in LaFe11.6Si1.4. J. Alloys Compd. 2013, 552, 310–317. [Google Scholar] [CrossRef]
  2. Gueltig, M.; Wendler, F.; Ossmer, H.; Ohtsuka, M.; Miki, H.; Takagi, T.; Kohl, M. High-Performance Thermomagnetic Generators Based on Heusler Alloy Films. Adv. Energy Mater. 2017, 7, 1601879. [Google Scholar] [CrossRef]
  3. Nam, N.T.; Lu, W.; Suzuki, T. Exchange Bias of Ferromagnetic/Antiferromagnetic in FePt/FeRh Bilayers. J. Appl. Phys. 2009, 105, 07D708. [Google Scholar] [CrossRef]
  4. Zhou, T.J.; Cher, K.; Hu, J.F.; Yuan, Z.M.; Liu, B. The Concept and Fabrication of Exchange Switchable Trilayer of FePt/FeRh/FeCo with Reduced Switching Field. J. Appl. Phys. 2012, 111, 07C116. [Google Scholar] [CrossRef]
  5. Garcia-Sanchez, F.; Chubykalo-Fesenko, O.; Mryasov, O.N.; Chantrell, R.W. Multiscale Models of Hard-Soft Composite Media. J. Magn. Magn. Mater. 2006, 303, 282–286. [Google Scholar] [CrossRef]
  6. Thiele, J.-U.; Maat, S.; Fullerton, E.E. FeRh/FePt Exchange Spring Films for Thermally Assisted Magnetic Recording Media. Appl. Phys. Lett. 2003, 82, 2859–2861. [Google Scholar] [CrossRef]
  7. Komlev, A.S.; Zverev, V.I. Chapter 14—Magnetocaloric Effect for Medical Applications. In Magnetic Materials and Technologies for Medical Applications; Woodhead Publishing Series in Electronic and Optical Materials; Tishin, A.M., Ed.; Woodhead Publishing: Cambridge, UK, 2022; pp. 437–467. ISBN 978-0-12-822532-5. [Google Scholar]
  8. Scheibel, F.; Gottschall, T.; Taubel, A.; Fries, M.; Skokov, K.P.; Terwey, A.; Keune, W.; Ollefs, K.; Wende, H.; Farle, M.; et al. Hysteresis Design of Magnetocaloric Materials—From Basic Mechanisms to Applications. Energy Technol. 2018, 6, 1397–1428. [Google Scholar] [CrossRef]
  9. Gottschall, T.; Skokov, K.P.; Fries, M.; Taubel, A.; Radulov, I.; Scheibel, F.; Benke, D.; Riegg, S.; Gutfleisch, O. Making a Cool Choice: The Materials Library of Magnetic Refrigeration. Adv. Energy Mater. 2019, 9, 1901322. [Google Scholar] [CrossRef]
  10. Arreguín-Hernández, M.L.; Sánchez-Valdés, C.F.; Llamazares, J.L.S.; Ríos-Jara, D.; Pecharsky, V.K.; Blinov, M.I.; Prudnikov, V.N.; Kovalev, B.B.; Zverev, V.I.; Tishin, A.M. Magnetoelastic Transition and Magnetocaloric Effect in Induction Melted Fe100−xRhx Bulk Alloys with x = 50, 51. J. Alloys Compd. 2021, 871, 159586. [Google Scholar] [CrossRef]
  11. Chirkova, A.; Skokov, K.P.; Schultz, L.; Baranov, N.V.; Gutfleisch, O.; Woodcock, T.G. Giant Adiabatic Temperature Change in FeRh Alloys Evidenced by Direct Measurements under Cyclic Conditions. Acta Mater. 2016, 106, 15–21. [Google Scholar] [CrossRef]
  12. Lewis, L.H.; Marrows, C.H.; Langridge, S. Coupled Magnetic, Structural, and Electronic Phase Transitions in FeRh. J. Phys. D Appl. Phys. 2016, 49, 323002. [Google Scholar] [CrossRef]
  13. Komlev, A.S.; Makarin, R.A.; Gimaev, R.R.; Zverev, V.I. Magnetothermal Properties of Heavy Rare Earth Metals and Fe–Rh-Based Alloys. Mosc. Univ. Phys. 2022, 77, 690–712. [Google Scholar] [CrossRef]
  14. Gruner, M.E.; Hoffmann, E.; Entel, P. Instability of the Rhodium Magnetic Moment as the Origin of the Metamagnetic Phase Transition in α−FeRh. Phys. Rev. B 2003, 67, 064415. [Google Scholar] [CrossRef]
  15. Sandratskii, L.M.; Mavropoulos, P. Magnetic Excitations and Femtomagnetism of FeRh: A First-Principles Study. Phys. Rev. B 2011, 83, 174408. [Google Scholar] [CrossRef]
  16. Moruzzi, V.L.; Marcus, P.M. Antiferromagnetic-Ferromagnetic Transition in FeRh. Phys. Rev. B 1992, 46, 2864–2873. [Google Scholar] [CrossRef] [PubMed]
  17. Zarkevich, N.A.; Johnson, D.D. FeRh Ground State and Martensitic Transformation. Phys. Rev. B 2018, 97, 014202. [Google Scholar] [CrossRef]
  18. Jiménez, M.J.; Schvval, A.B.; Cabeza, G.F. Ab Initio Study of FeRh Alloy Properties. Comput. Mater. Sci. 2020, 172, 109385. [Google Scholar] [CrossRef]
  19. Kim, J.; Ramesh, R.; Kioussis, N. Revealing the Hidden Structural Phases of FeRh. Phys. Rev. B 2016, 94, 180407. [Google Scholar] [CrossRef]
  20. Adabifiroozjaei, E.; Maccari, F.; Schäfer, L.; Jiang, T.; Recalde-Benitez, O.; Chirkova, A.; Shayanfar, N.; Dirba, I.; Kani, N.A.; Shuleshova, O. The Premartensite and Martensite in Fe 50 Rh 50 System. arXiv 2023, arXiv:2305.01351. [Google Scholar]
  21. Chen, X.; Chen, Y.; Tang, Y. Study of Magnetocaloric Effect in LaFe11.5Si1.5 Alloys Prepared by Different Cooling Methods. Bull. Mater. Sci. 2014, 37, 849–854. [Google Scholar] [CrossRef]
  22. Zhang, C.L.; Nie, Y.G.; Shi, H.F.; Ye, E.J.; Han, Z.D.; Wang, D.H. Tuning Magnetostructural Transition and the Associated Giant Magnetocaloric Effect via Thermal Treatment in MnCoGe-Based Alloys. J. Magn. Magn. Mater. 2019, 469, 437–442. [Google Scholar] [CrossRef]
  23. Yan, A.; Müller, K.-H.; Schultz, L.; Gutfleisch, O. Magnetic Entropy Change in Melt-Spun MnFePGe. J. Appl. Phys. 2006, 99, 08K903. [Google Scholar] [CrossRef]
  24. Li, Y.; Zeng, Q.; Wei, Z.; Liu, E.; Han, X.; Du, Z.; Li, L.; Xi, X.; Wang, W.; Wang, S.; et al. An Efficient Scheme to Tailor the Magnetostructural Transitions by Staged Quenching and Cyclical Ageing in Hexagonal Martensitic Alloys. Acta Mater. 2019, 174, 289–299. [Google Scholar] [CrossRef]
  25. Agarwal, S.; Stern-Taulats, E.; Mañosa, L.; Mukhopadhyay, P.K. Effect of Low Temperature Annealing on Magneto-Caloric Effect of Ni–Mn–Sn–Al Ferromagnetic Shape Memory Alloy. J. Alloys Compd. 2015, 641, 244–248. [Google Scholar] [CrossRef]
  26. Shishkin, D.A.; Volegov, A.S.; Andreev, S.V.; Baranov, N.V. Magnetic State and Magnetocaloric Properties of Rapidly Quenched Gd75M25 Alloys (M = Co, Ni). Phys. Met. Metallogr. 2012, 113, 460–465. [Google Scholar] [CrossRef]
  27. Wada, H.; Funaba, C.; Asano, T. Effects of Heat Treatment on the Magnetic Phase Transition and Magnetocaloric Properties of Mn1+δAs1−xSbx. Mater. Trans. 2006, 47, 486–491. [Google Scholar] [CrossRef]
  28. Cho, H.T.; Park, I.J.; Shim, I.-B.; Kim, C.S.; Kim, S.J. Heat-Treatment Effect in Mn0.997Fe0.003As for Magnetic Refrigeration Application. J. Korean Phys. Soc. 2012, 60, 1049–1051. [Google Scholar] [CrossRef]
  29. Walter, P.H.L. Exchange Inversion in Ternary Modifications of Iron Rhodium. J. Appl. Phys. 1964, 35, 938–939. [Google Scholar] [CrossRef]
  30. Barua, R.; Jiménez-Villacorta, F.; Lewis, L.H. Predicting Magnetostructural Trends in FeRh-Based Ternary Systems. Appl. Phys. Lett. 2013, 103, 102407. [Google Scholar] [CrossRef]
  31. Kresse, G.; Hafner, J. Ab Initio Molecular Dynamcis for Liquid Metals. Phys. Rev. B 1993, 47, 558. [Google Scholar] [CrossRef]
  32. Kresse, G.; Hafner, J. Ab Initio Molecular Dynamics for Open-Shell Transition Metals. Phys. Rev. B 1993, 48, 13115–13118. [Google Scholar] [CrossRef] [PubMed]
  33. Kresse, G.; Furthmüller, J.; Hafner, J. Ab Initio Molecular-Dynamics Simulation of the Liquid-Metal–Amorphous-Semiconductor Transition in Germanium. Phys. Rev. B 1994, 49, 14251–14269. [Google Scholar] [CrossRef] [PubMed]
  34. Hafner, J. Ab-Initio Simulations of Materials Using VASP: Density-Functional Theory and Beyond. J. Comput. Chem. 2008, 29, 2044–2078. [Google Scholar] [CrossRef]
  35. Blöchl, P.E. Projector Augmented-Wave Method. Phys. Rev. B 1994, 50, 17953–17979. [Google Scholar] [CrossRef] [PubMed]
  36. Perdew, J.P.; Burke, K.; Ernzerhof, M. Generalized Gradient Approximation Made Simple. Phys. Rev. Lett. 1996, 77, 3865–3868. [Google Scholar] [CrossRef] [PubMed]
  37. Uebayashi, K.; Shimizu, H.; Yamada, H. Structure and Magnetism of Fe(Rh,Pd) Alloys. Mater. Trans. 2006, 47, 456–459. [Google Scholar] [CrossRef]
  38. Jiménez, M.J.; Komlev, A.S.; Gimaev, R.R.; Zverev, V.I.; Cabeza, G.F. Electronic and Thermoelectric Properties of FeRh Pd-Doped Alloys: Ab Initio Study. J. Magn. Magn. Mater. 2021, 538, 168258. [Google Scholar] [CrossRef]
  39. Yuasa, S.; Otani, Y.; Miyajima, H.; Sakuma, A. Magnetic Properties of Bcc FeRh1-xMx Systems. IEEE Transl. J. Magn. Jpn. 1994, 9, 202–209. [Google Scholar] [CrossRef]
  40. Yuasa, S.; Miyajima, H.; Otani, Y.; Sakuma, A. Magnetism of FeRh1−xPdx System—Band Calculation. J. Magn. Magn. Mater. 1995, 140–144 Pt 1, 79–80. [Google Scholar] [CrossRef]
  41. Komlev, A.S.; Karpenkov, D.Y.; Gimaev, R.R.; Chirkova, A.; Akiyama, A.; Miyanaga, T.; Hupalo, M.F.; Aguiar, D.J.M.; Carvalho, A.M.G.; Jiménez, M.J.; et al. Correlation between Magnetic and Crystal Structural Sublattices in Palladium-Doped FeRh Alloys: Analysis of the Metamagnetic Phase Transition Driving Forces. J. Alloys Compd. 2022, 898, 163092. [Google Scholar] [CrossRef]
  42. Orava, J.; Kosiba, K.; Han, X.; Soldatov, I.; Gutowski, O.; Ivashko, O.; Dippel, A.-C.; Zimmermann, M.V.; Rothkirch, A.; Bednarcik, J.; et al. Fast-Current-Heating Devices to Study in Situ Phase Formation in Metallic Glasses by Using High-Energy Synchrotron Radiation. Rev. Sci. Instrum. 2020, 91, 073901. [Google Scholar] [CrossRef] [PubMed]
  43. Ohnuma, I.; Gendo, T.; Kainuma, R.; Inden, G.; Ishida, K. Phase Equilibria and Thermodynamic Evaluation Approximating Short-Range Ordering Energy in the Fe–Rh Binary System. ISIJ Int. 2009, 49, 1212–1219. [Google Scholar] [CrossRef]
  44. Vinokurova, L.I.; Vlasov, A.V.; Pardavi-Horváth, M. Pardavi-Horváth Pressure Effects on Magnetic Phase Transitions in FeRh and FeRhIr Alloys. Phys. Status Solidi B 1976, 78, 353–357. [Google Scholar] [CrossRef]
  45. Wayne, R.C. Pressure Dependence of the Magnetic Transitions in Fe-Rh Alloys. Phys. Rev. 1968, 170, 523–527. [Google Scholar] [CrossRef]
  46. Zakharov, A.I.; Kadomtseva, A.M.; Levitin, R.Z.; Ponyatovskii, E.G. Magnetic and Magnetoelastic Properties of a Metamagnetic Fe–Rh Alloy. Sov. Phys. JETP 1964, 19, 1348–1353. [Google Scholar]
  47. Cong, D.Y.; Huang, L.; Hardy, V.; Bourgault, D.; Sun, X.M.; Nie, Z.H.; Wang, M.G.; Ren, Y.; Entel, P.; Wang, Y.D. Low-Field-Actuated Giant Magnetocaloric Effect and Excellent Mechanical Properties in a NiMn-Based Multiferroic Alloy. Acta Mater. 2018, 146, 142–151. [Google Scholar] [CrossRef]
  48. Qu, Y.; Sun, X.; Gui, W.; Li, R.; Nie, Z.; Gao, Z.; Cai, W.; Ren, Y.; Wang, Y.; Cong, D. Complete and Reversible Magnetostructural Transition Driven by Low Magnetic Field in Multiferroic NiCoMnIn Alloys. Acta Mater. 2023, 243, 118535. [Google Scholar] [CrossRef]
  49. Almeida, T.P.; Temple, R.; Massey, J.; Fallon, K.; McGrouther, D.; Moore, T.; Marrows, C.H.; McVitie, S. Quantitative TEM Imaging of the Magnetostructural and Phase Transitions in FeRh Thin Film Systems. Sci. Rep. 2017, 7, 17835. [Google Scholar] [CrossRef]
  50. Shabalkin, I.D.; Komlev, A.S.; Tsymbal, S.A.; Burmistrov, O.I.; Zverev, V.I.; Krivoshapkin, P.V. Multifunctional Tunable ZnFe2O4@MnFe2O4 Nanoparticles for Dual-Mode MRI and Combined Magnetic Hyperthermia with Radiotherapy Treatment. J. Mater. Chem. B 2023, 11, 1068–1078. [Google Scholar] [CrossRef]
  51. Paul, D.I. General Theory of the Coercive Force Due to Domain Wall Pinning. J. Appl. Phys. 1982, 53, 1649–1654. [Google Scholar] [CrossRef]
  52. Hadjipanayis, G.C.; Kim, A. Domain Wall Pinning versus Nucleation of Reversed Domains in R-Fe-B Magnets (Invited). J. Appl. Phys. 1988, 63, 3310–3315. [Google Scholar] [CrossRef]
Figure 1. Examples of some models of BCC supercells (CsCl-type) used to represent different Cr concentrations in Fe50Rh50−xCrx alloy (x = 0, 1.9, 3.7, 5.6). The first row corresponds to ferromagnetic spin configuration and the second one to antiferromagnetic spin configuration. Color reference: Rh in gray, Cr in purple and Fe in gold (spin up) and blue (spin down).
Metals 13 01650 g001
Figure 2. Dependence of the average magnetic moment per atom in cell as a function of the distance between chromium atoms (in the ferromagnetic state). Dash lines are guides for the eye.
Metals 13 01650 g002
Figure 3. Dependence of the free energy per atom in cell as a function of the distance between chromium atoms (in the ferromagnetic state). Dash lines are guides for the eye.
Metals 13 01650 g003
Figure 4. Dependence of the free energy per atom in cell as a function of the distance between chromium atoms (in the antiferromagnetic state). Dash lines are guides for the eye.
Metals 13 01650 g004
Figure 5. (Color online) Local Cr-3d states in the FM state at different Cr concentrations indicated in the legend near the Fermi energy. The spin-down (minority) bands have been plotted as negative values to facilitate the visualization. The three cases studied for the Fe48.15Rh48.15Cr3.7 alloy identified in the legend as 3.7-a, 3.7-b and 3.7-c correspond to those indicated in the last column of Table 2 (legend (a), (b), (c), correspond to different distances between chromium atoms in the lattice). The Fermi level is taken as the reference.
Metals 13 01650 g005
Figure 6. X-ray patterns for rapidly cooled and slowly cooled samples (measured at room temperature).
Metals 13 01650 g006
Figure 7. (a,e) SEM images of a slowly cooled and rapidly cooled alloy, respectively (light areas correspond to gamma phase, gray areas correspond to alpha phase, phase arrangement is indicated by arrows). (b,f) Total elemental composition of slowly cooled and rapidly cooled samples, respectively. (c,g) Elemental composition of the alpha phase of slowly cooled (Fe47.95Cr3.23Rh48.82) and rapidly cooled (Fe47.68Cr3.17Rh49.15) samples, respectively. (d,h) Elemental composition of the gamma phase of slowly cooled and rapidly cooled samples, respectively.
Metals 13 01650 g007
Figure 8. (a,b) Magnetization temperature dependences in different magnetic fields for slowly cooled and rapidly cooled alloys, respectively. (c,d) Calculated temperature dependences of the entropy change for slowly cooled and rapidly cooled alloys, respectively.
Metals 13 01650 g008
Figure 9. Magnetization field dependences at temperatures of (a) 10 K and (b) 300 K for slowly cooled and rapidly cooled alloys, respectively.
Metals 13 01650 g009
Table 1. Summary data on saturation magnetization ( I s a t ), phase transition temperature (during heating T p h .   t r . h e a t i n g and cooling T p h .   t r . c o o l i n g ), temperature hysteresis width ( T temperature derivative of magnetization ( M T m a x ), entropy change ( S M m a x ), and presence of additional crystallographic phases for various fast-cooled and slowly cooled alloys. The abbreviations RC is rapidly cooled; SC is slowly cooled. FeRh-based alloys are marked in red. LaFeSi-based alloys are marked in green. Mn(Co/Fe)Ge-based alloys are marked in gold. Heusler alloys are marked in black. Gd-based alloys are marked in blue. MnAs-based alloys are marked in gray.
Sample I s a t emu/g T p h . t r . h e a t i n g K T p h . t r . c o o l i n g K T
K
M T m a x
emu/(g × K)
S M m a x
(J kg−1 K−1)
Another PhaseRef.
Fe49Rh51
SC
110316
(2 T)
301
(2 T)
1711
(2 T)
8.9
(2 T)
+[10]
Fe49Rh51
RC
120315
(2 T)
299
(2 T)
1667
(2 T)
13.9
(2 T)
+[10]
Fe48Cr3Rh49
SC
103221
(1.6 T)
206
(1.6 T)
157.6
(1.6 T)
5.1
(1.5 T)
+This work
Fe48Cr3Rh49
RC
111210
(1.6 T)
193
(1.6 T)
1751
(1.6 T)
8.2
(1.5 T)
+This work
LaFe11.5Si1.5
SC
120202 (0.02 T)196
(0.02 T)
6−1.31
(0.02 T)
17.7
(2 T)
+[21]
LaFe11.5Si1.5
RC
110197.6 (0.02 T)192.2 (0.02 T)5.4−1.79
(0.02 T)
14.9
(2 T)
+[21]
Mn0.92Co1.08Ge 0.2 K/min78351
(1 T)
363
(1 T)
12−5.46
(1 T)
30
(2 T)
-[22]
Mn0.92Co1.08Ge 5 K/min82316
(1 T)
334
(1 T)
18−4.86
(1 T)
12
(2 T)
-[22]
Mn1.1Fe0.9P0.76Ge0.24 SC130299 (0.01 T)291
(0.01 T)
8-12
(2 T)
+[23]
Mn1.1Fe0.9P0.76Ge0.24 melt-spun (RC)130317 (0.01 T)309 (0.01 T)8-16
(2 T)
+[23]
MnCo0.962Fe0.038Ge
SC
12047944336---[24]
MnCo0.962Fe0.038Ge
RC
-44041030---[24]
Ni2Mn1.36Sn0.32Al0.32 SC40240 (0.01 T)221 (0.01 T)190.054 (0.01 T)7
(1.5 T)
-[25]
Ni2Mn1.36Sn0.32Al0.32 RC35239 (0.01 T)220 (0.01 T)190.047 (0.01 T)8
(1.5 T)
-[25]
Gd75Co25
SC
1601301300-5
(2 T)
-[26]
Gd75Co25
RC
1401721720-4.8
(2 T)
-[26]
Gd75Ni25
SC
3099990-0.4
(2 T)
-[26]
Gd75Ni25
RC
1201171170-3.6
(2 T)
-[26]
Mn1.02As0.9Sb0.1
SC
117-290
(1 T)
-−16
(1 T)
-+[27]
Mn1.02As0.9Sb0.1
RC
119-293
(1 T)
-−29
(1 T)
-+[27]
Mn0.997Fe0.003As
SC
80313 (0.02 T)301 (0.02 T)12−1.29
(0.02 T)
20
(1.5 T)
+[28]
Mn0.997Fe0.003As
RC
80308 (0.02 T)292 (0.02 T)16−1.91
(0.02 T)
31
(1.5 T)
+[28]
Table 2. Calculated data for the crystal lattice constants (a, b, c), the distance between the chromium atoms (dCr-Cr), the average magnetic moments (µB/at) on the atoms of iron (µFe), rhodium (µRh), and chromium (µCr), the average value of the magnetization (µB/at), and the free energy per atom in cell (eV/at) for the ferromagnetic (FM) state of the FeRhCr alloys with different substitutions (x). Distance units in (Å). The binary alloy is marked in red. Gold color marks alloys where iron atoms are replaced. Black color indicates alloys where rhodium atoms are replaced. The alloys where the positions of iron and rhodium are simultaneously substituted are marked in blue. The legends in the last column for the Fe48.15Rh48.15Cr3.7 alloy (a), (b), (c) are provided for ease of comparison of the results shown in Figure 5.
Compositiona
Å
b
Å
c
Å
dCr-Cr ŵFe µB µRh µB µCr
µB
Average Magn., µB/atE/at, eV/at
Fe50Rh503.0043.0043.004x3.1761.029x2.147−7.789
Fe48.1Rh50Cr1.93.0023.0023.002x3.1480.9750.1652.023−7.793
Fe46.3Rh50Cr3.73.0102.9823.0102.3433.1410.921−1.6511.868−7.819
2.9913.0023.0024.3393.1310.9290.3061.925−7.799
2.9992.9992.9995.1933.1280.9340.2121.943−7.798
Fe44.4Rh50Cr5.63.0162.9892.9894.221
4.221
8.442
3.1200.8980.3371.871−7.806
Fe48.15Rh48.15Cr3.72.9972.9972.9972.1673.1240.9760.486
(at Rh site)
−1.518
(at Fe site)
1.971−7.832 (a)
3.0243.0242.9514.8503.0980.911−2.905
(at Rh site)
−2.903
(at Fe site)
1.823−7.841 (b)
3.0003.0003.0007.7933.1060.947−2.974
(at Rh site)
−3.086
(at Fe site)
1.839−7.838 (c)
Fe48.1Rh46.3Cr5.62.9862.9942.9942.338
2.338
4.047
3.0750.956−0.410 (at Rh site)
−0.422
(at Rh site)
−0.153
(at Fe site)
1.905−7.854
Fe50Rh48.1Cr1.93.0003.0003.000x3.1220.993−3.0761.997−7.815
Fe50Rh46.3Cr3.73.0032.9922.9923.6263.0590.934−2.8871.868−7.845
2.9972.9972.9975.2763.0720.951−3.0981.874−7.842
2.9972.9972.9975.2583.0730.952−3.1021.874−7.842
Fe50Rh44.4Cr5.62.9922.9922.9923.928
3.928
3.928
2.9900.847−2.891
−2.885
−2.878
1.711−7.874
Table 3. Calculated data for the crystal lattice constants (a, b, c), the distance between the chromium atoms (dCr-Cr), the average magnetic moments (µB/at) on the atoms of iron (µFe), rhodium (µRh), and chromium (µCr), the average value of the magnetization (µB/at), and the free energy per atom in cell (eV/at) for the antiferromagnetic (AFM) state of the FeRhCr alloys with different substitutions (x). Distance units in (Å). Arrows indicate substitution of a Cr atom at Fe site with spin up (↑) or down (↓) (see Figure 1 and Table S1 in Supplementary Material). The binary alloy is marked in red. Gold color marks alloys where iron atoms are replaced. Black color indicates alloys where rhodium atoms are replaced. The alloys where the positions of iron and rhodium are simultaneously substituted are marked in blue.
Systema
Å
b
Å
c
Å
dCr-Cr
Å
µFe
µB/at
µRh
µB/at
µCr
µB/at
E/at
eV/at
Fe50Rh502.9912.9912.991x3.129
−3.052
0.075x−7.757
2.7342.7343.504x2.830
−2.715
0.043x−7.789
Fe48.1Rh50Cr1.92.9932.9932.993x3.038
−3.134
−0.072−2.893 ()−7.777
2.7693.0823.082x2.722
−2.878
−0.041−2.364 ()−7.807
Fe46.3Rh50Cr3.72.7633.0823.0824.4322.685
−2.889
−0.040−2.174 ()
−2.376 ()
−7.831
2.7223.5292.7223.5522.666
−2.796
−0.047−2.000 ()
2.199 ()
−7.835
3.2362.7182.9575.2912.434
−1.991
−0.116−2.152 ()
−2.200 ()
−7.832
Fe44.4Rh50Cr5.63.5332.7192.7193.7112.578
−2.860
−0.032−2.132 ()
−2.111 ()
−2.132 ()
−7.855
Fe48.15Rh48.15Cr3.72.9692.9692.9692.7332.666
−2.827
−0.071−1.685 (at Fe site)
0.235
(at Rh site)
−7.821
2.7212.9533.2294.5672.566
−2.698
−0.022−0.660
(at Rh site)
−2.211
(at Fe site)
−7.842
2.9742.9742.9747.8542.851
−2.802
−0.0151.451
(at Rh site)
−1.985
(at Fe site)
−7.828
Fe48.1Rh46.3Cr5.63.5362.7012.7012.6332.545
−2.622
−0.025−1.296
(at Rh site)
−1.173
(at Fe site)
−1.289
(at Rh site)
−7.863
Fe50Rh48.1Cr1.92.9862.9862.986x3.010
−3.071
−0.045−1.034−7.785
Fe50Rh46.3Cr3.73.2282.7032.9944.1762.974
−3.016
−0.015−1.004
−1.002
−7.849
2.9822.9822.9825.1702.708
−2.780
−0.022−1.836
0.662
−7.836
2.9662.9662.9667.2172.709
−2.781
−0.022−1.838
0.662
−7.836
Fe50Rh44.4Cr5.62.9552.9552.9553.6832.514
−2.680
−0.0940.648−7.856
Table 4. Values of total (n) and local DOS at the Fermi level (states/eV) obtained from the calculation of electronic structure (See Table S2 in Supplementary Material). Gold color marks alloys where iron atoms are replaced. Black color indicates alloys where rhodium atoms are replaced. The alloys where the positions of iron and rhodium are simultaneously substituted are marked in blue.
CompositiondCr-Cr
(Å)
FM—Majority (Up)FM—Minority (dn)
n (EF)RhFeCr n (EF)RhFeCr n n
Fe48.1Rh50Cr1.9x4.272.171.430.0849.649.7335.101.9445.37
Fe46.3Rh50Cr3.72.34322.749.844.696.7768.3713.4147.074.3245.63
Fe46.3Rh50Cr3.74.3396.753.091.891.0643.819.1930.082.0437.06
Fe46.3Rh50Cr3.75.19318.596.762.767.9957.2610.8639.054.1738.67
Fe44.4Rh50Cr5.64.22122.308.333.339.4459.5611.6038.536.2237.26
Fe50Rh48.1Cr1.9x4.052.021.400.0959.4110.6944.081.3755.36
Fe50Rh46.3Cr3.73.6265.182.541.770.2546.919.2333.751.1541.73
Fe50Rh46.3Cr3.75.2764.622.291.590.1854.619.2539.922.4149.99
Fe50Rh46.3Cr3.75.2584.602.271.570.2056.959.9341.502.4052.35
Fe50Rh44.4Cr5.63.9286.113.062.080.4145.078.9430.562.9438.96
Fe48.15Rh48.15Cr3.72.1678.193.332.381.8265.5612.4848.201.3257.37
Fe48.15Rh48.15Cr3.74.8504.862.471.590.2657.4113.4539.701.1152.55
Fe48.15Rh48.15Cr3.77.7934.772.371.590.2156.4810.6540.022.8151.71
Fe48.1Rh46.3Cr5.62.33812.004.262.973.9143.928.1331.142.1131.92
Disclaimer/Publisher’s Note: The statements, opinions and data contained in all publications are solely those of the individual author(s) and contributor(s) and not of MDPI and/or the editor(s). MDPI and/or the editor(s) disclaim responsibility for any injury to people or property resulting from any ideas, methods, instructions or products referred to in the content.

