1. Introduction
Bimetal materials are increasingly more often used in modern industry, allowing introduction of quite complex innovative design solutions. Steel–titanium bimetal plates are one such example [
1,
2]. During fabrication of nondetachable structures from steel–titanium plates, there is the problem concerning their welding. This problem is solved mostly through application of welding processes, among which arc processes are the most acceptable in terms of technology and cost. For arc welding of bimetal steel–titanium sheets, the Chinese National Standard “Welding specification for titanium and titanium alloy clad steel plate” (GB/T 13149-2009) envisages five types of butt welded joints [
3]. Usually, in fusion welding, the direct contact of steel and titanium in the liquid phase is avoided, using certain transition or barrier interlayers [
4]. Solid-phase heating takes place in the heat-affected zone (HAZ). Here, phase transformations can proceed on the steel and titanium interface, leading to intermetallic phase (IMPh) formation [
5]. Due to their high values of hardness and brittleness, such IMPh formation leads to hot cracking, which promotes intensive destruction of bimetal plate welded joints [
1,
6]. Even overheating above 500 °C, owing to structural transformations, can have a negative impact on the mechanical properties of steel–titanium plate joints; in particular, it can lower the fatigue life [
7]. In addition to crack formation during welding, there is the risk of fatigue crack initiation during further service of steel–titanium joints [
8]
It is known that titanium can easily interact with iron to form highly brittle intermetallic compounds, due to considerable differences in their physical–mechanical properties [
9,
10]. At the same time, the mechanism of formation of interdiffusion interaction on the Ti/Fe interface and the microstructural evolution mechanism have not yet been completely clarified. That is why it is extremely important to study the mechanism of intermetallics formation on the Ti/Fe interface and to develop a practical technology for argon-arc welding of titanium alloys with steel.
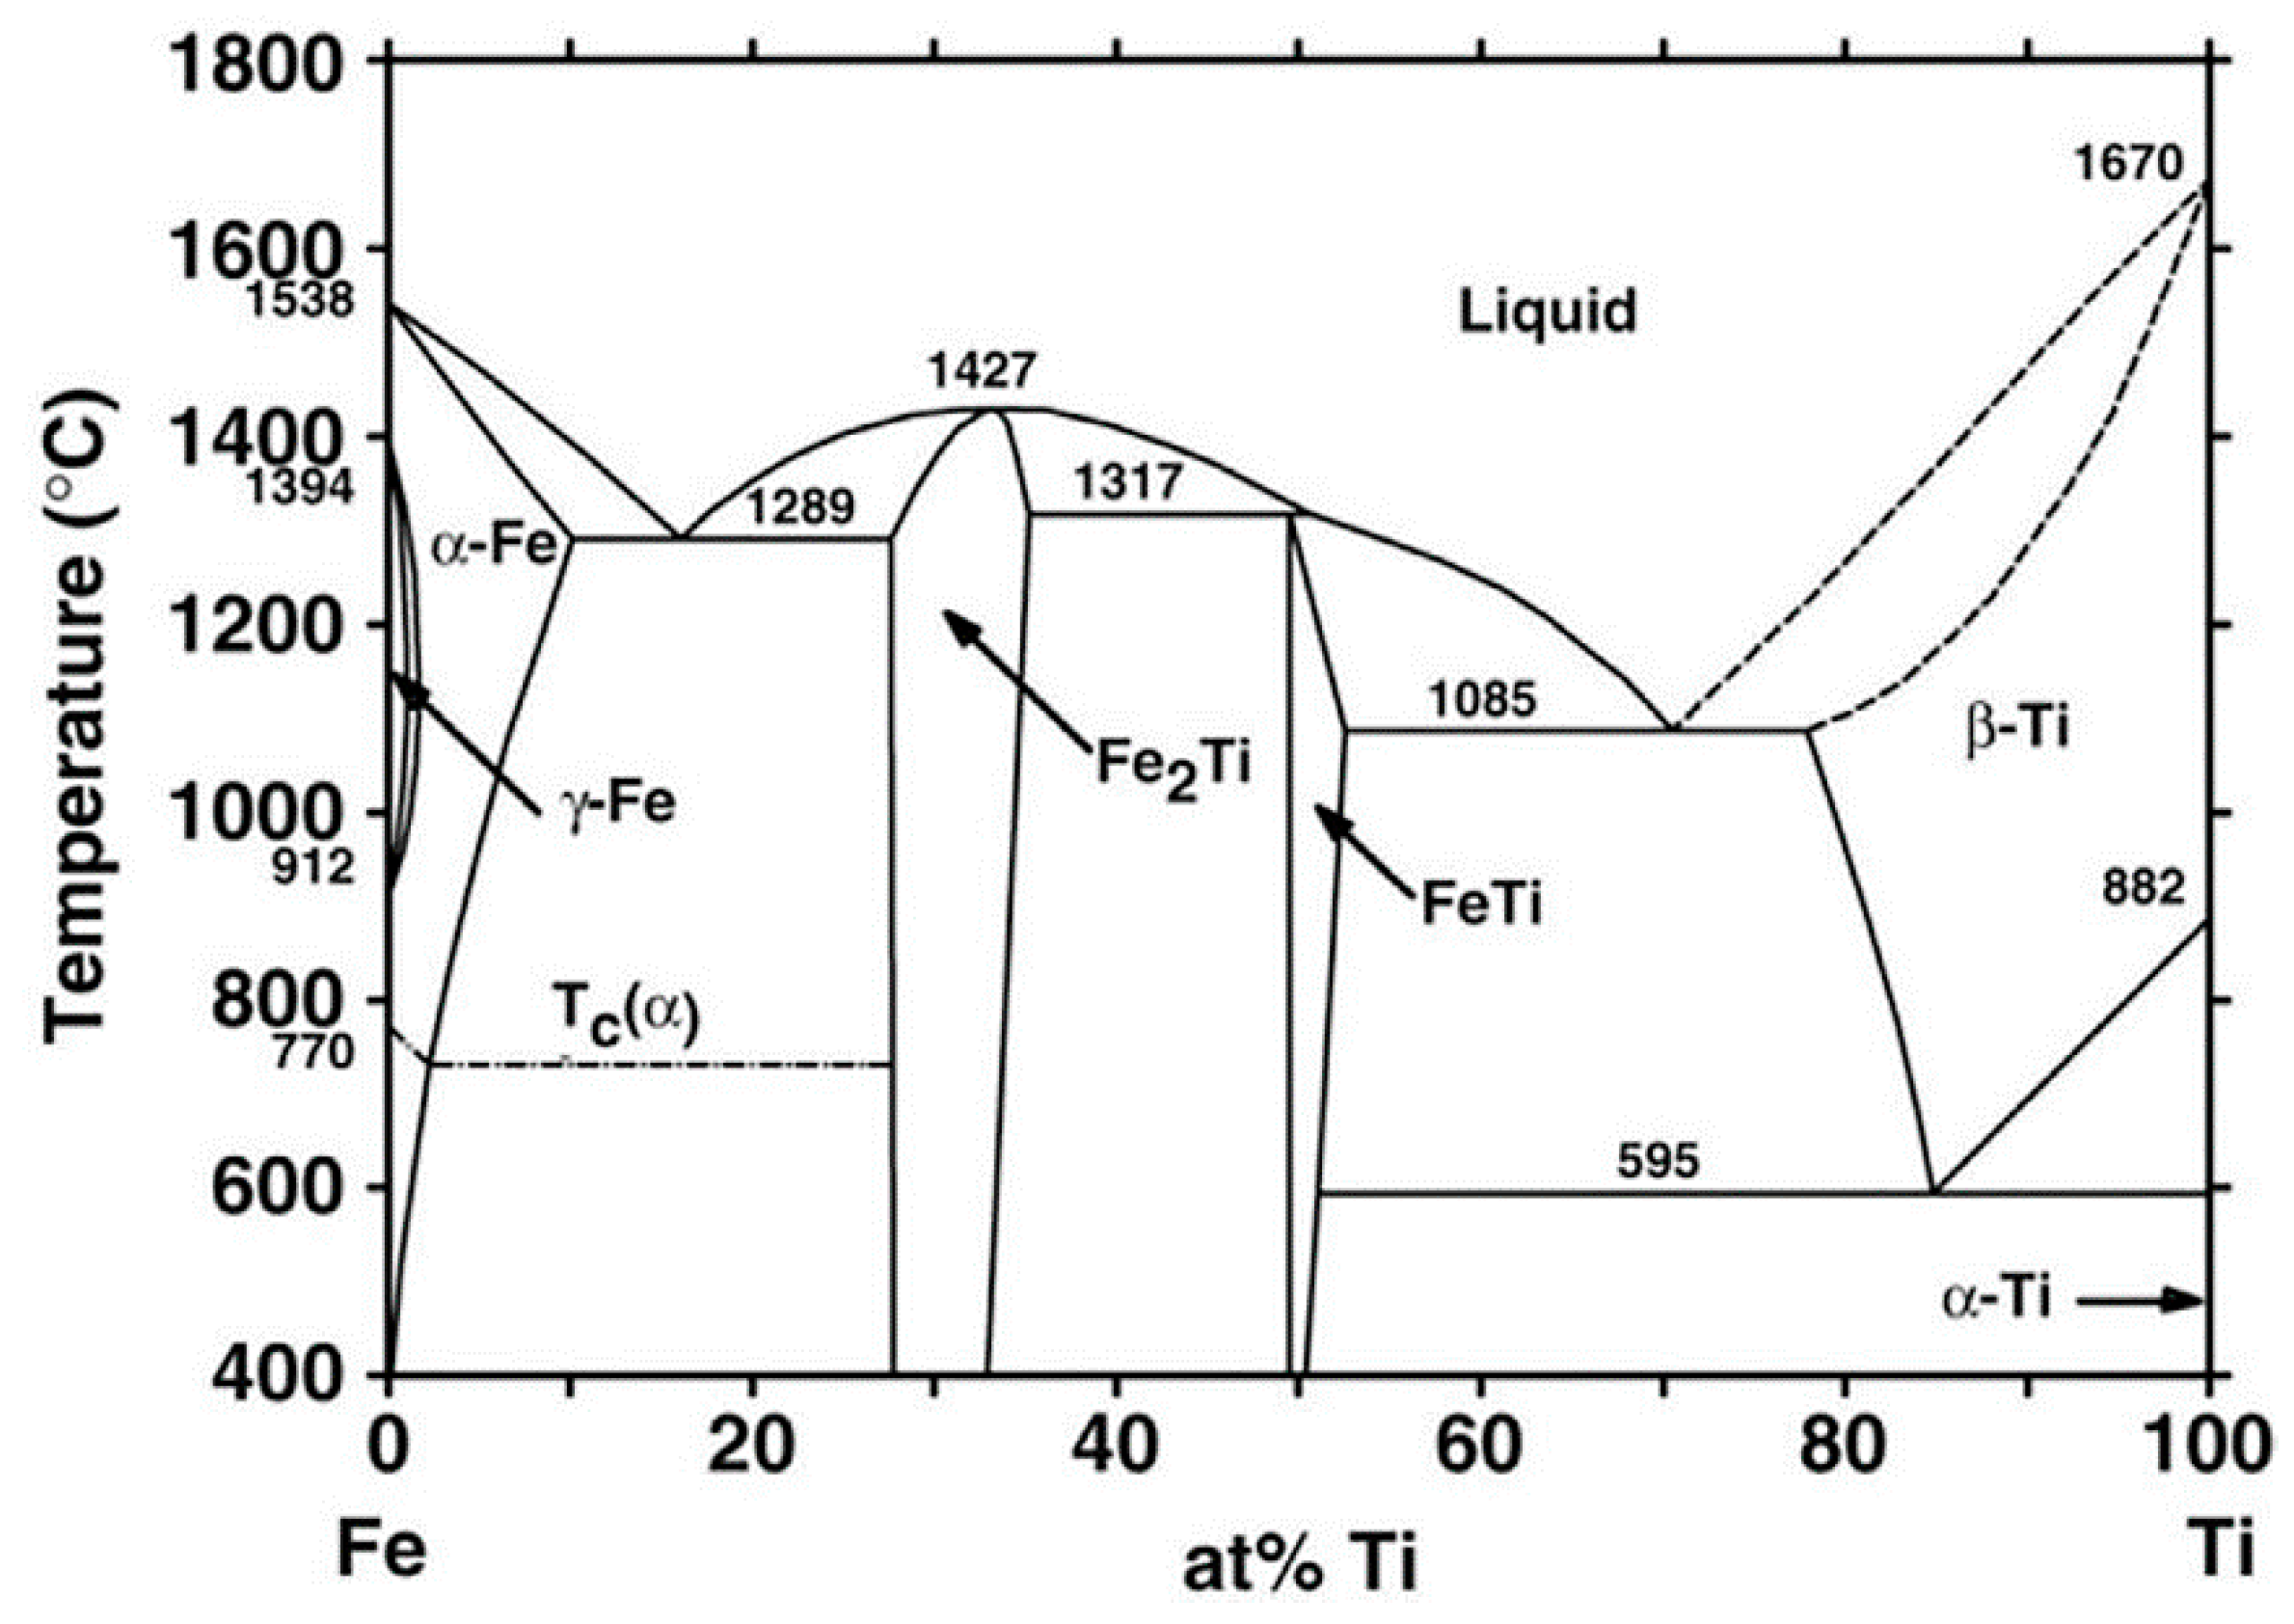
This fully applies to dissimilar joints of titanium (Ti) and steel (Fe), both stainless and carbon. In keeping with the binary equilibrium state diagram, a complex set of phases forms in the Fe-Ti system (
Figure 1) [
11,
12].
Two eutectics form in the Fe-Ti system: (1) α-Fe + Fe2Ti at 1298 °C and concentration 16 at.% Fe and 84 at.% Ti; (2) β-Ti + FeTi at 1085 °C and concentration 71 at.% Fe and 29 at.% Ti. The first of these compounds crystallizes with an open maximum at 1427 °C and it has a rather wide homogeneity region in the range ~10 at.% at 1300 °C. This region narrows slightly with lower temperature.
Maximum solubility of titanium in α-Fe is not higher than 9.8 at.%. Titanium solubility in α-Fe reaches 3.08 at.% at 900 °C, decreasing to 1.86 at.% at 600 °C. Titanium solubility in γ-Fe reaches a maximum at 1100 °C, and it is equal to 0.76 at.%. Maximum solubility of iron in α-Ti reaches 22 at.%. Maximum solubility of iron in α-Ti at the eutectoid temperature is equal to 0.44 at.%, dropping to 0.34 at.% at 400 °C.
Two intermetallic compounds form in alloys of the Fe-Ti system: Fe2Ti and TiFe. The TiFe compound forms by a peritectic reaction at 1317 °C, and its homogeneity region does not exceed ~4 at.%. At approximately 590 °C, the following eutectoid reaction occurs: β-Ti↔TiFe + α-Ti. The TiFe compound melts congruently at approximately 1500 °C. The Fe2Ti compound forms congruently at 1427 °C, and it has a wide homogeneity region (8–10 at.%).
The TiFe phase has a cubic body-centered structure (space group Pm-3m) with a lattice period a = 0.2975 nm. The Fe2Ti phase has a hexagonal structure (space group P63/mmc) with lattice parameters a = 0.4785 nm, c = 0.7799 nm, and c/a = 1.623.
In the Fe-Ti binary phase diagram, an extremely limited ability for producing solid solutions of Fe with Ti is also observed. Compounds of cubic FeTi and Fe
y(Ti
1−xCr
x) appear in the Fe-Cr-Ti ternary system at temperatures above 550 °C [
13]. Formation of such IMPhs in welds is undesirable, because of their brittleness. Also undesirable is penetration of more than 1% Ti into welds made by the traditional welding methods on steels [
14].
Reference [
15] provides a study of alloys in the Ti-Fe-O system, which alloys were crystallized with different degrees of overcooling from the liquid phase. It was found that in binary alloys of the Ti-Fe system, two phases form, namely β-(Ti, Fe) solid solution and TiFe intermetallics (CsCl structure type), regardless the degree of overcooling. Iron content in β-(Ti, Fe) rises to 24.3 at.%, which is somewhat higher when compared to equilibrium crystallized alloys (22 at.%). In the three-component Ti-Fe-O system with 4 at.% oxygen (which models open-air welding), formation of four phases is observed, regardless the degree of overcooling: solid solution based on β-Ti-(Ti, O) crystallizes first, which is followed by Ti
4Fe
2O, β-(Ti, Fe), and TiFe.
IMPhs influence both the regular strength and high-temperature strength of the transition joint. In reference [
16], an experiment was conducted on the heat treatment of a titanium alloy–stainless steel joint, produced by hot rolling using a nickel interlayer. It was found that heating the samples to temperatures of 600–800 °C for 10 and 30 min did not cause any significant interdiffusion on the steel–nickel interface. At a heat treatment temperature of 700 °C for 30 min., microcracks developed on this interface. Starting from the temperature of 600 °C, the thickness of IMPh layers became greater, and at 700 and 800 °C, microcracks initiated between the intermetallic layers or between the intermetallic layer and nickel interlayer. Tensile strength of the transition weld decreased with increase in the heat treatment temperature or soaking time. Experience concerning the development of bimetal welding technologies showed that application of a nickel interlayer is an efficient technique for eliminating cracks between steel and titanium [
17]. The thermal expansion coefficient for such an interlayer is between the respective coefficients for steel and titanium, and it acts as an effective barrier for diffusion of elements, limiting the growth of brittle intermetallics.
Thus, IMPh formation on the interface of the two metals depends on the temperature–time impact, to which both the metals are exposed [
18]. As IMPh formation depends on diffusion and reaction between the initial metals, a greater number of temperature–time cycles increases the metal atom mobility and thus promotes formation of different phases [
19]. Welding technologies and modes used during traditional argon-arc welding of similar metals and alloys, unfortunately, do not always ensure the optimal thermal cycles in welding bimetals and dissimilar materials, which causes formation of a significant number of IMPhs, their brittle fracture and development of cracks, often with complete destruction of the joint [
20]. As stated in reference [
21], it was established in a large number of studies that the main factor influencing the strength of dissimilar metal joints is the formation of intermetallics in welding, most of which are brittle phases. Application of new welding methods and/or techniques is most often proposed to eliminate them or control their formation, Here, the question of studying the applicability of traditional arc technologies (for instance, TIG and MIG/MAG) for welding bimetals is rather seldom raised.
The objective of this work consisted in assessing the susceptibility to IMPh formation during the fusion welding of steel–titanium bimetal on the interface of the two metals in the HAZ, depending on the temperature of heating during the impact of the welding heat source. It allows for determination of the welding-process heat input values, which promotes minimizing the dimensions of the IMPh interlayer, and improvement of welded joint performance, accordingly.
The following tasks were completed to reach the defined objective:
Modeling the thermal cycles of multipass butt welding of steel–titanium bimetal plates, and studying their influence on the structure of bimetal HAZ to determine the heating time and temperature;
Establishing the phase composition of the intermetallic interlayer that forms in the HAZ on the steel–titanium interface, due to solid-phase heating;
Characterizing the dimensions of the diffusion zone that develops in the solid phase under the impact of welding sources in the steel–titanium bimetal, on the interface of the two metals;
Determining the range of heat inputs in formation of the welded butt joint of steel–titanium plates, at which the size of the brittle intermetallic interlayer is minimized.
2. Materials and Methods
To reach the defined objective, it was necessary to perform the calculated and experimental determination of the HAZ dimensions; characterize the temperature variation in the time ranges for the welding heat-source action; conduct investigations into the chemical composition, microstructure, and thickness of the zones of titanium diffusion into steel and iron into titanium; study the changing evolution in the phase and chemical composition and microstructure of the intermetallic interlayer, which forms in the solid phase on the steel–titanium bimetal interface and depends on the temperature–time conditions for the welding source action; and determine the range in values for the welding heat inputs at which the minimal size of the HAZ and intermetallic interlayer on the steel and titanium interface ensued.
Investigations were performed by the following procedure. First, a mathematical model of heating the steel–titanium bimetal plates was selected that described the process of their multipass butt welding. By applying finite element modeling, this model was used to calculate the thermal fields formed in the plates being joined. The temperatures and time for heating the physical samples of steel–titanium bimetal plates were selected in keeping with the calculated isotherms. Heating of these samples was performed by the induction method in an inert gas (argon) atmosphere in the temperature ranges for the action of the selected welding sources (10–12 s). The processed samples were used to prepare templates, which were studied by scanning electron microscopy methods. IMPh presence and the features of their arrangement on the steel–titanium interface were determined in each sample. It allowed for evaluating the susceptibility to IMPh formation in the HAZ when producing welded joints of steel–titanium plates.
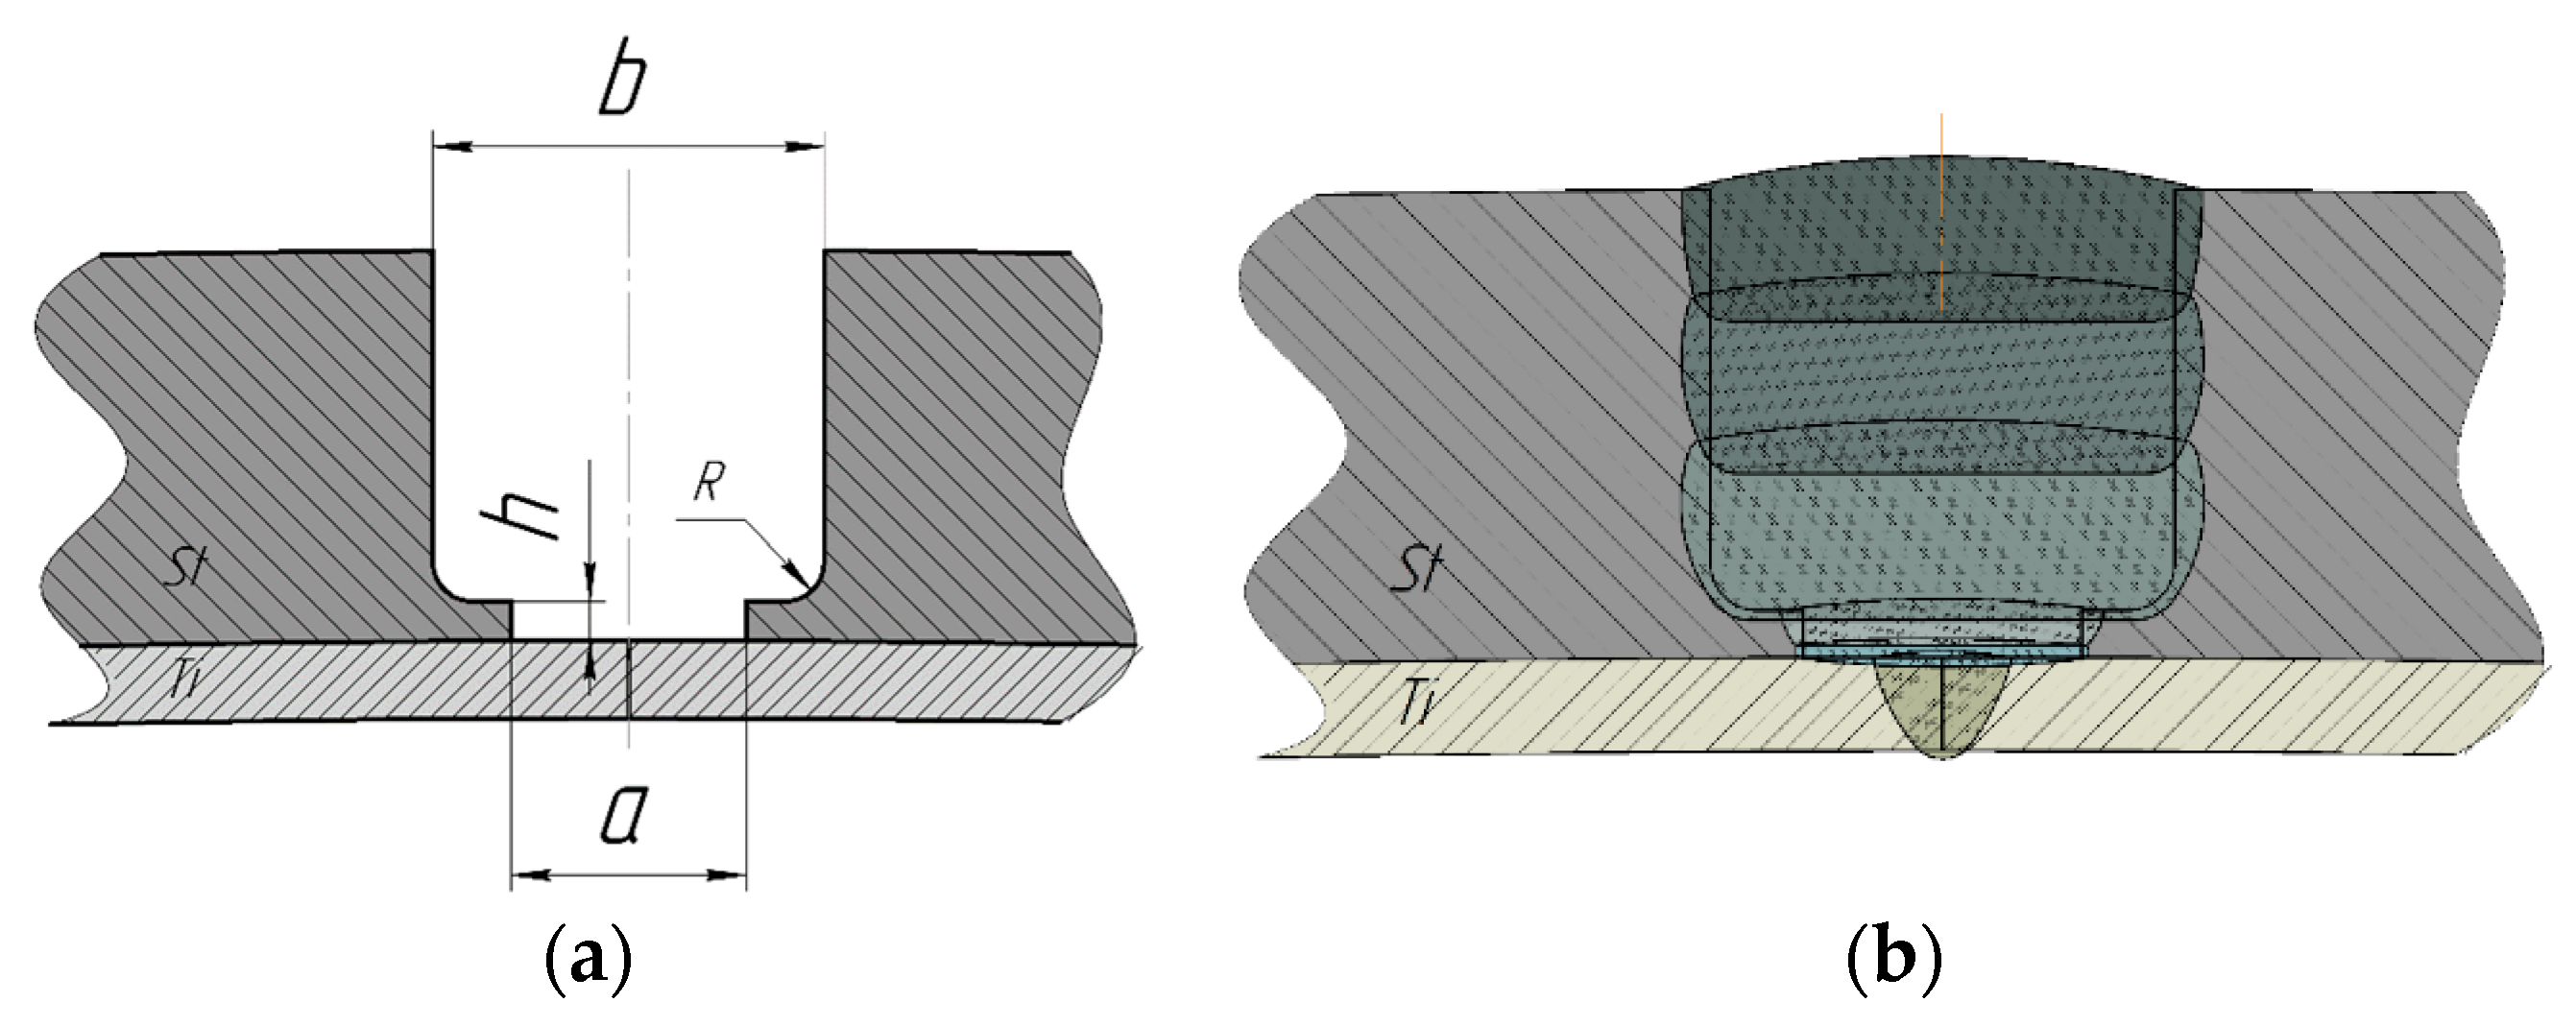
The object of study were bimetal plates with an overall thickness of 12 mm, which consisted of Q235-type low-carbon steel with thickness d = 10 mm and a layer of Grade 2 titanium with a thickness d = 2 mm. For butt welding of the abovementioned Q235 steel—Grade 2 titanium bimetal plates, edge preparation was performed (
Figure 2) so that it was possible to first weld a layer of titanium (thickness δ = 2 mm). At this stage, plasma welding (PAW) was used, where the heat input (i.e., energy consumed in welding a unit of weld length [
22]) was equal to 100–200 J/mm [
23]. After this, a barrier layer from CuSi3Mn1 bronze (0.5…1.0 mm thick) was deposited on the welded titanium layer, which separated the titanium from the steel. Nonconsumable electrode argon–arc surfacing (TIG) was used for this purpose with filler wire of 1.0 mm diameter from the abovementioned bronze (heat input was 350–400 J/mm [
24]). It was followed by single-pass arc welding, performed by using consumable steel filler wire ER70S-6 (Ø1.0 mm) with short-circuiting (CMT method, heat input value was close to 200 J/mm [
25]). After this, the groove in the layer of Q235 steel (thickness δ = 10 mm) was filled in six passes by pulse metal active-gas arc welding with consumable steel wire ER70S-6 (Ø1.0 mm), close in composition to Q235 steel (P-MAG—pulse metal active gas, heat input of each pass was approximately 300 J/mm [
26]). Groove parameters for the edges to be welded were as follows: a = 8 mm and b = 10 mm (
Figure 2a). The groove was filled in seven passes with the abovementioned welding wire ER70S-6.
Templates 10 × 10 × 12 mm in size from Q235 steel–Grade 2 titanium bimetal were used as test samples (
Table 1). For simulating the effect of the thermal cycles of welding, these samples were heated in argon by a model A22-0551 induction unit from Huttinger Company (Nuremberg, Germany). Heating time was selected to be 10–12 s, in keeping with the duration of thermal impact from the welding source, moving at a speed of 30…60 m/h. The heating temperature was monitored by an optical pyrometer.
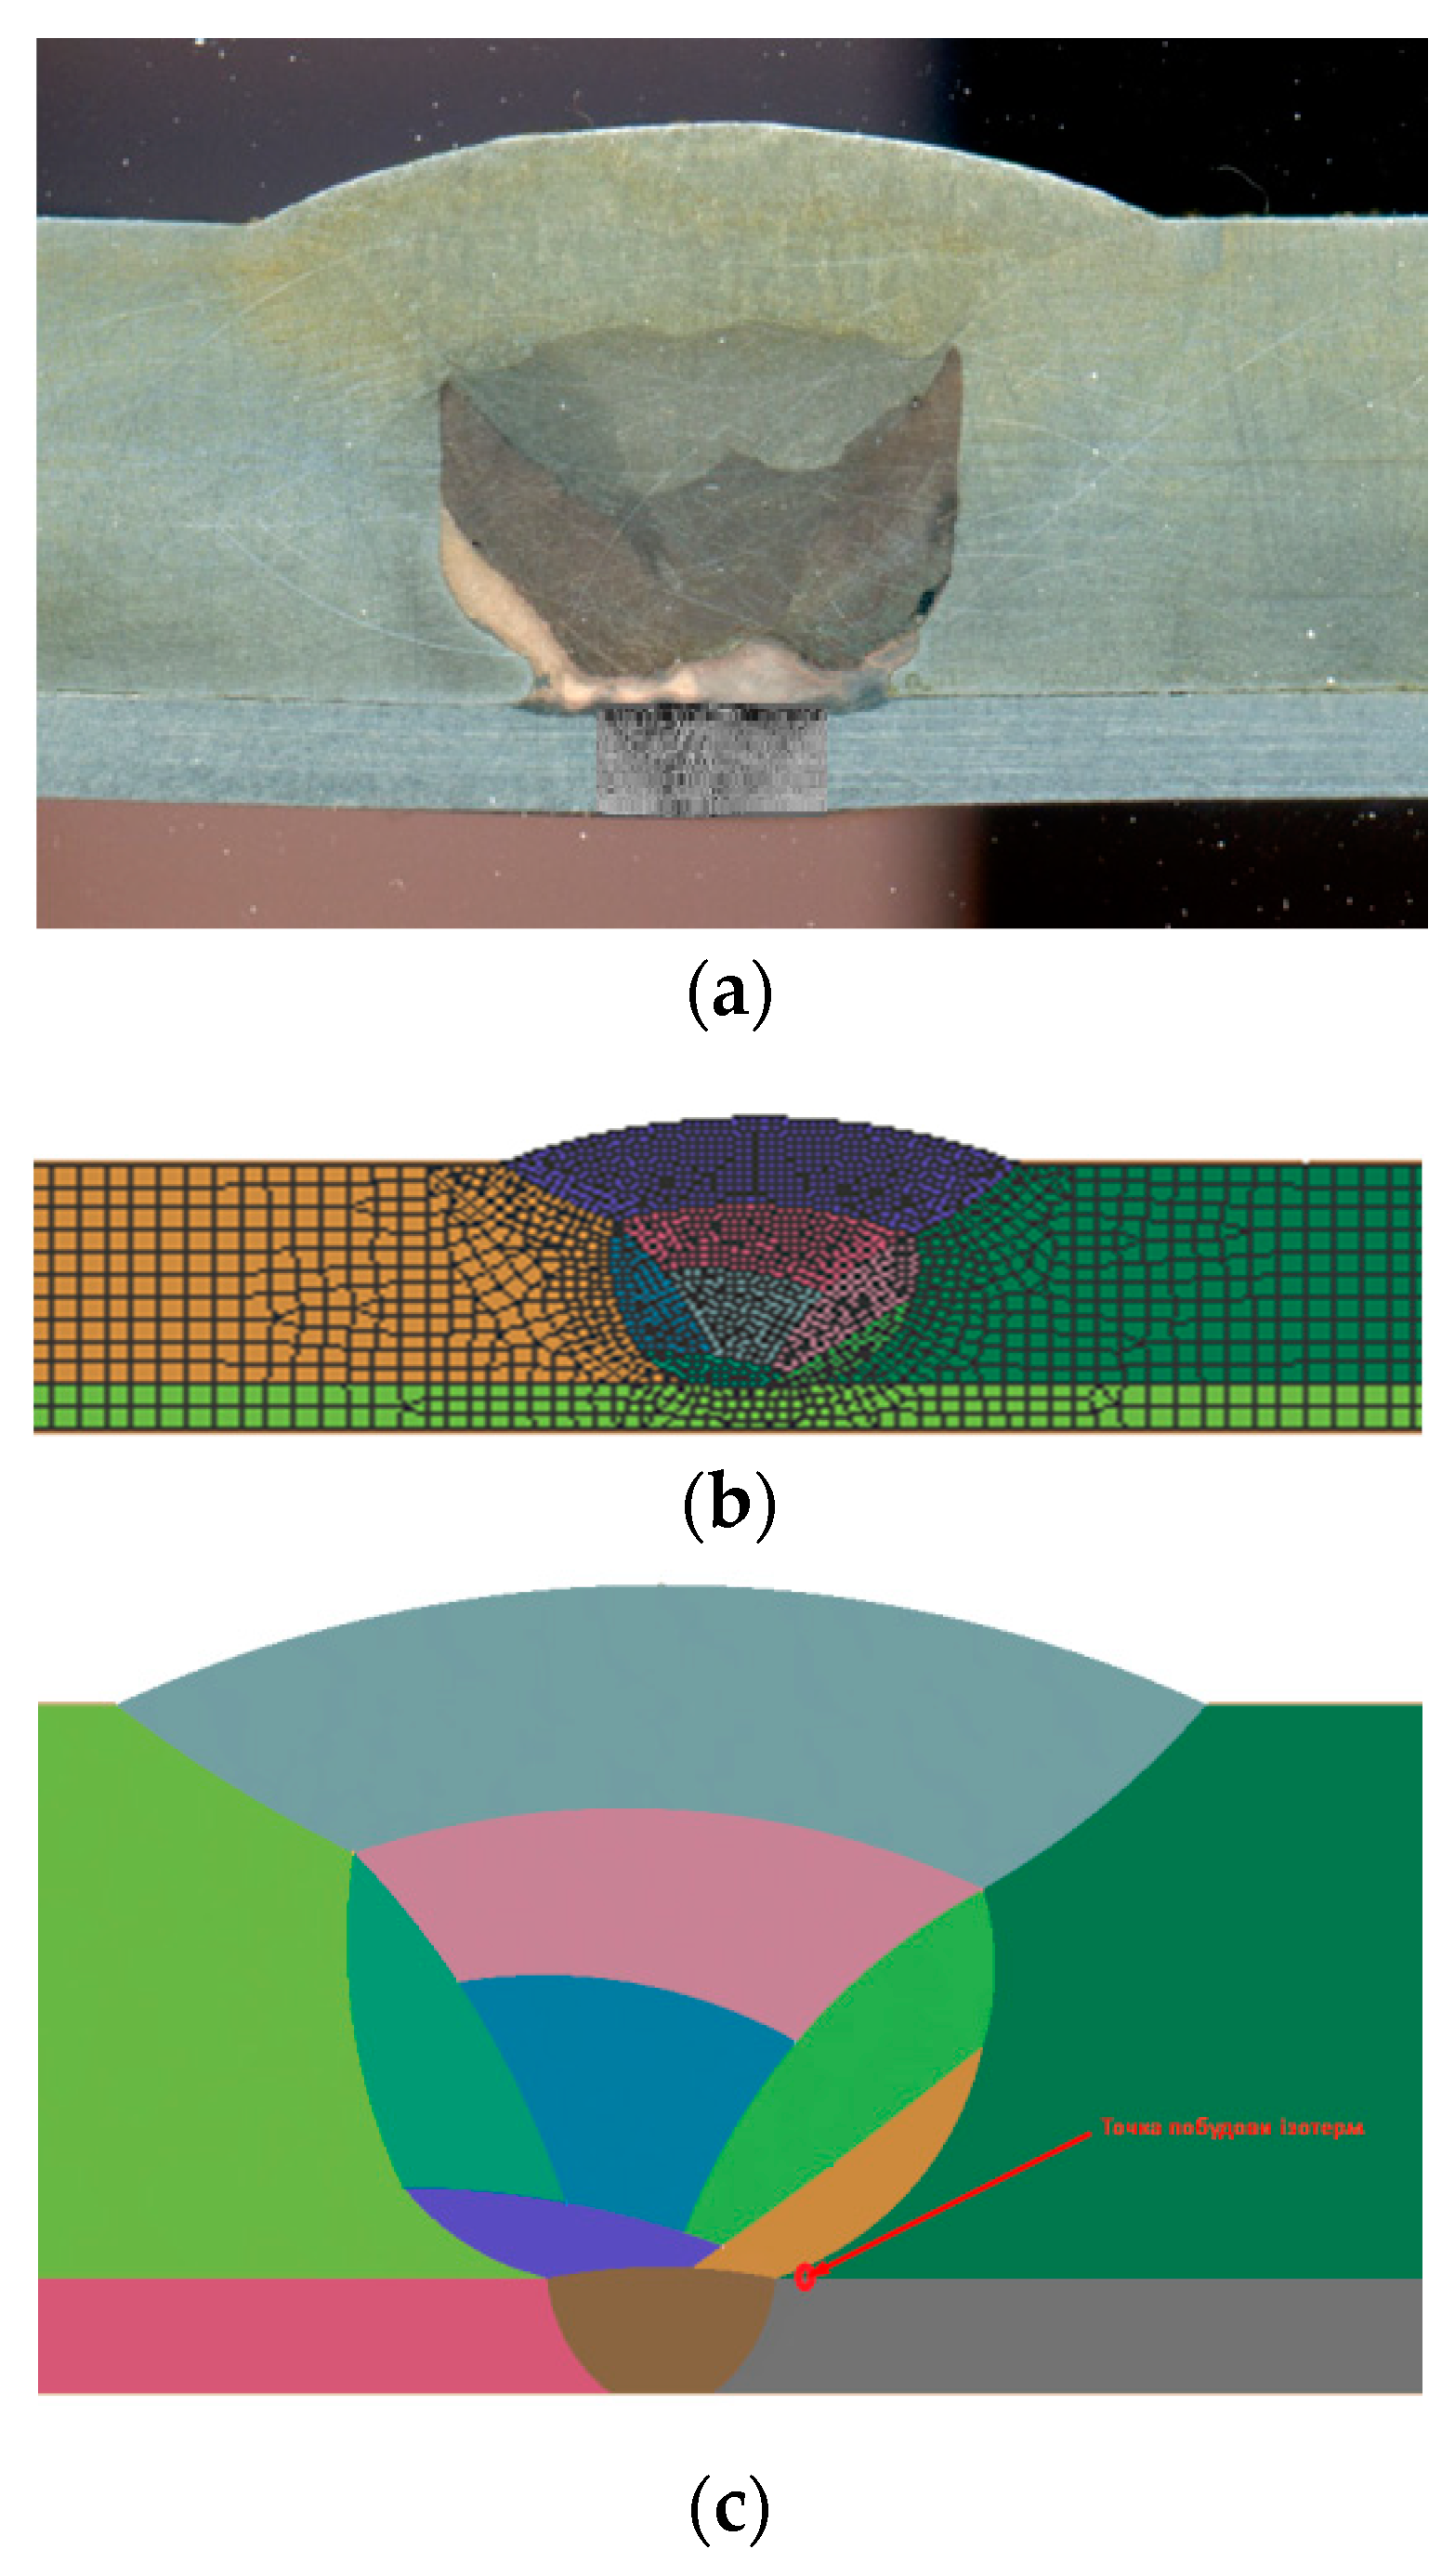
The finite element method for modeling was selected for computation of the thermal cycles in HAZ heating [
27]. At the first stage of its application, a finite element grid was developed, which was a combination of linear 3- and 4-node flat elements (
Figure 3). The grid size was selected to be 0.3 mm in the region of the deposited weld metal and HAZ, and 1.0 mm in the base metal region. At the second stage, a volumetric model of the heat source was selected. A model suggested by J. Goldak was used, as the most perfect model of a distributed bulk heat source [
28]. This model assigns a normal (Gaussian) distribution of the heat source power density within the body, which has the shape of a double ellipsoid.
The difference between the volumetric model of the double ellipsoid by J. Goldak and other models of bulk heat sources is that in this model the distribution in the bulk power density of the source is assigned independently for the frontal (index
f) and tail (index
r) quarters of the ellipsoid:
where
Q is the effective thermal power of the heat source (for arc welding
Q = ηIU);
τ is the time from the start of the source action;
t is the current time;
v is the speed of the source movement (welding speed);
x, y, z are the ellipsoid semiaxes along coordinates OX, OY, OZ;
ff and
fr are the coefficients that determine the ratio of heat introduced into the frontal and tail parts of the ellipsoid; and
af,
ar,
b,
c are the respective radii of normal distribution.
During the third stage, the initial and boundary conditions were selected. For this purpose, the heat losses both through the convective (free or forced) and through the radiation heat exchange were taken into account. The convective heat transfer depends on surface temperature
T and ambient temperature
T0, along with the coefficient of heat transfer
h. Convective energy loss
Qc per a unit of area
A can be expressed as follows:
Radiation as a result of radiation losses
Qr, according to the Stefan–Boltzmann law, depends on temperature and material emissivity
ε:
Boundary conditions, applied for modeling steel–titanium bimetal welding, are dependencies (3) and (4), complemented by the system initial temperature of 20 °C. The interface between the solid and gaseous phases, where the heat exchange processes take place, coincides with the upper and lower open surfaces of the plate being welded. When solving the problem,
h = 25 W/m
2∙°C and
ɛ = 0.6 were taken. The thermal cycles were calculated for a HAZ point maximum close to the weld on the interface of the titanium and steel layers (
Figure 3c).
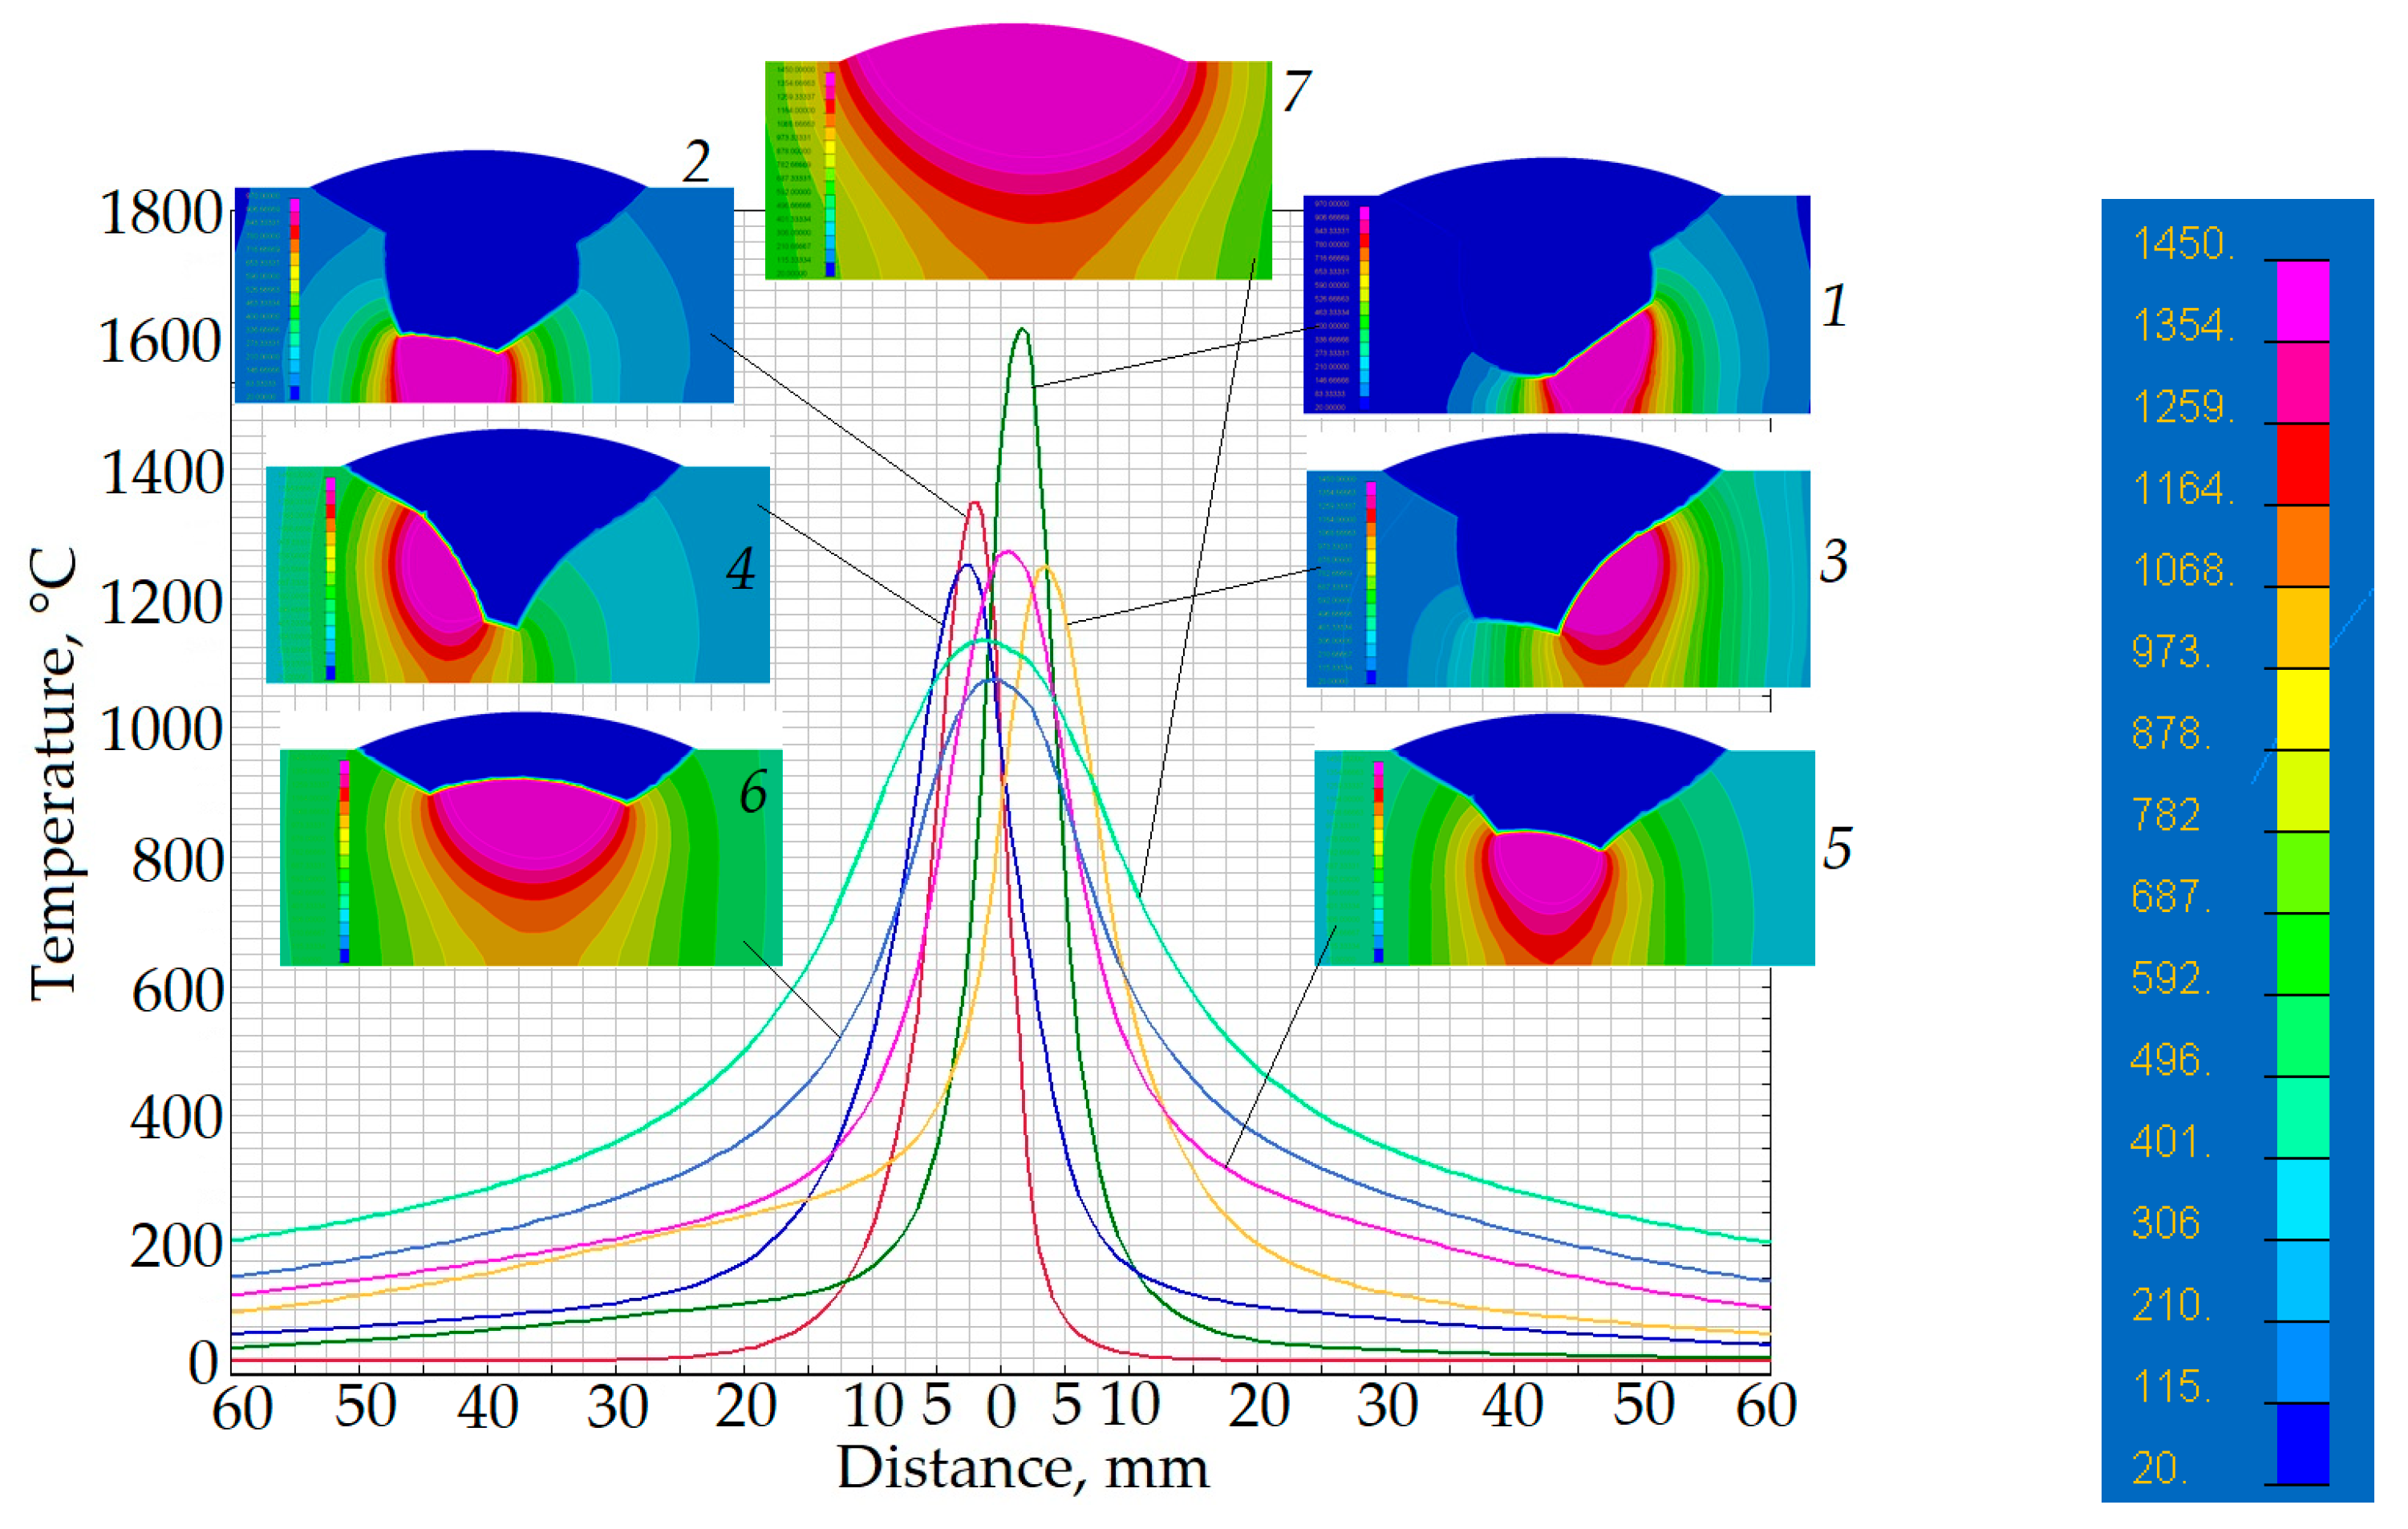
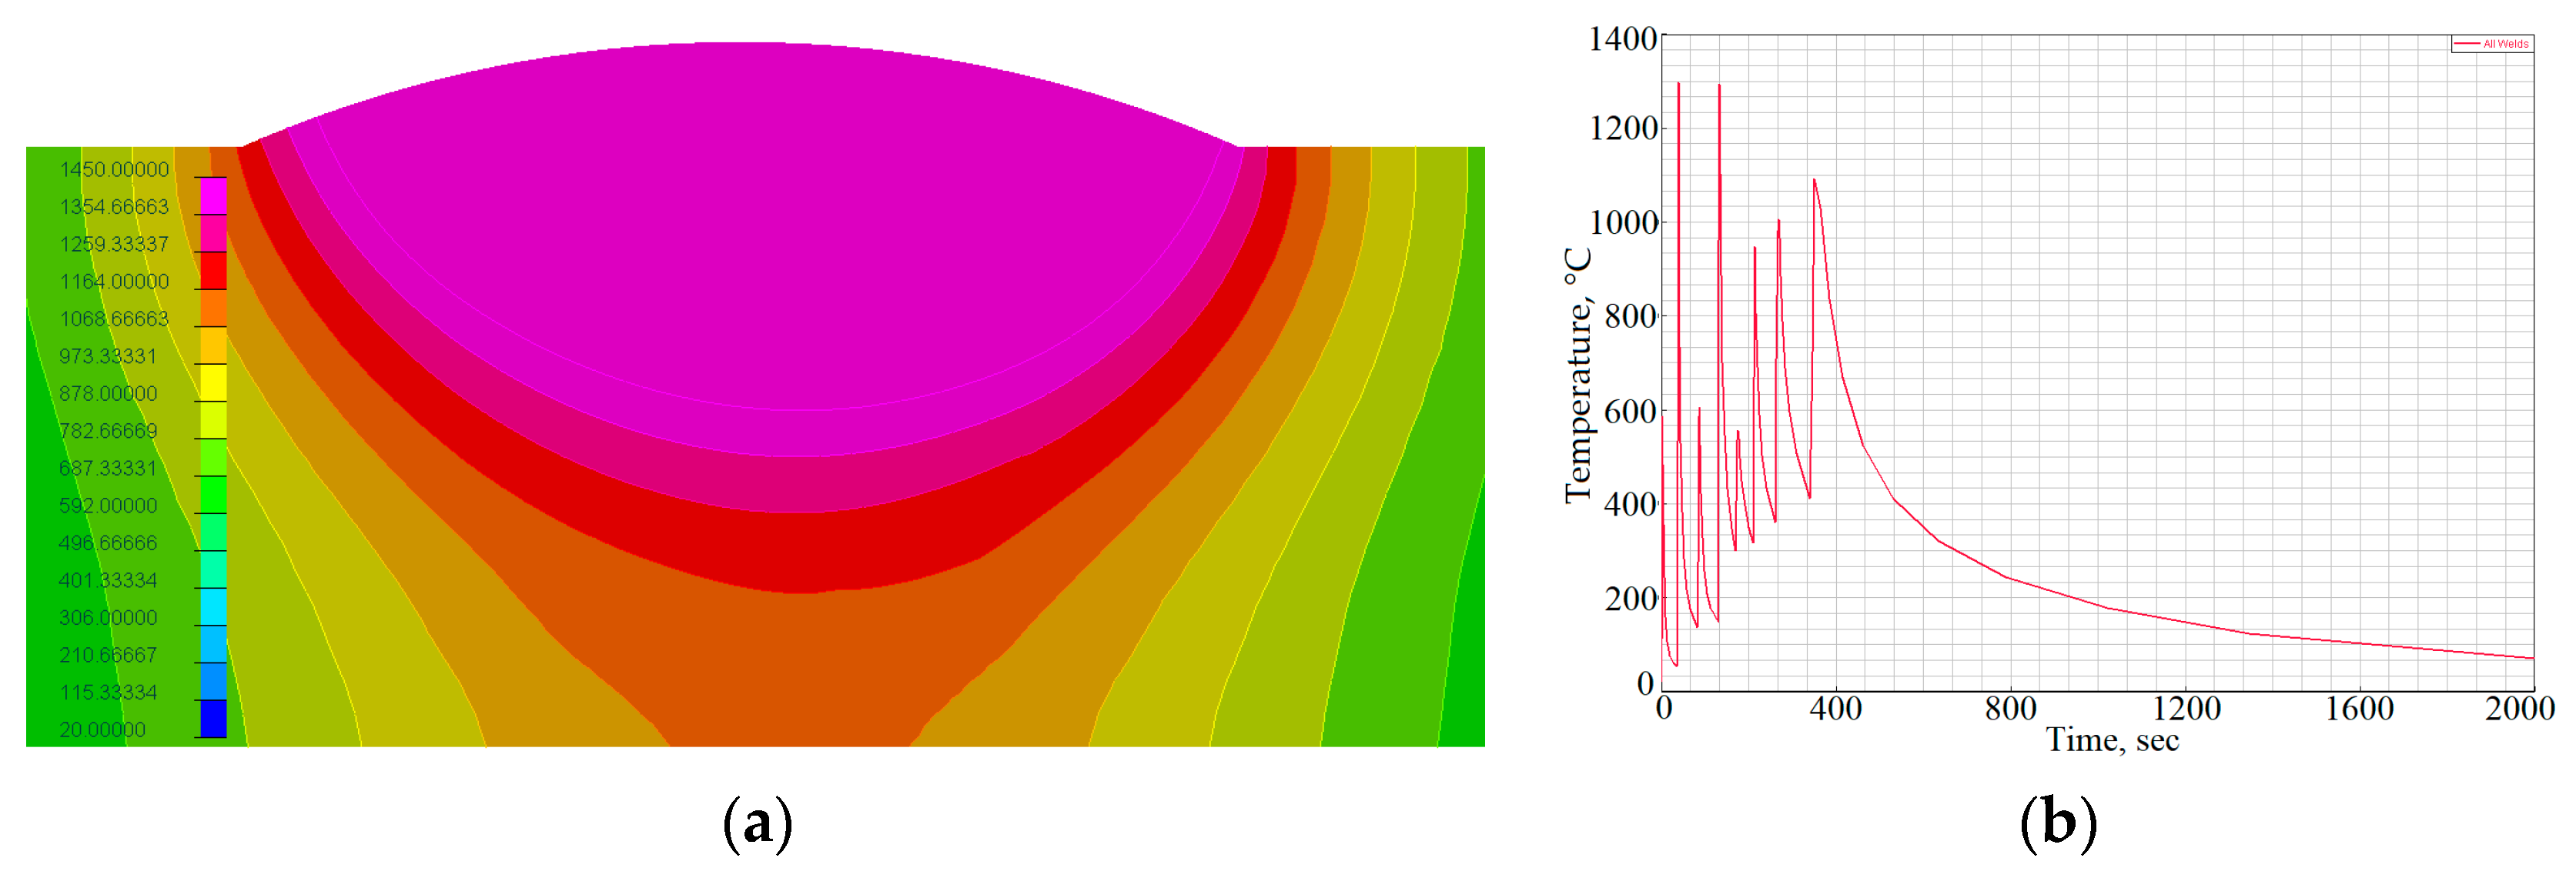
Calculations by the finite element method were performed taking into account the heat source model (1)–(2) for the selected finite element grid under the conditions of (3)–(4). Here, it was assumed that the produced joint length was 200 mm, the titanium layer welding was performed in one pass, and welding for the steel layer was performed in seven passes (
Figure 4). Calculations showed that the greatest heating of the studied zone on the steel–titanium interface occurred during the first pass; it was equal up to ~1600 °C, and is rather short-term (approximately 1.0–1.5 s). When the process of welding the steel layer of the steel–titanium bimetal was complete, the temperature of the interface in the HAZ was equal to 1100–1200 °C, and the HAZ size was from 1.5 to 3.5 mm (
Figure 5).
Taking into account the obtained calculation data and melting temperature of the steel layer on the fusion line (up to 1450 °C), it is rational to divide the temperatures into four ranges: 900–907, 1150–1250, 1300–1350, and 1430–1450 °C. The rationality of studying such temperature ranges is also confirmed by the published sources (for instance, [
29]).
In keeping with the precalculated data, modeling of the thermal cycles in the selected welding processes was performed with investigation of their effect on the structure of the iron–titanium bimetal joint zone. Modeling of the thermal cycles was performed by induction heating of the samples up to the respective temperature with 10…12 s soaking in the shielding gas (argon) atmosphere, in order to protect the joint zone from oxidation (
Table 2).
After heating and respective soaking, the inductor was switched off and the samples were gradually cooled with the inductor.
These samples were used further on to prepare microsections for metallographic investigations. Two-stage etching was applied to reveal the microstructure of the joint zone: chemical etching in 4% solution of nitric acid in alcohol (“nital” solution) was used for steel, and electrolytic etching in chromium anhydride was used for titanium.
Metallographic examination of the steel–titanium joint zone was conducted using an optical microscope (NEOPHOT-32, Carl Zeiss, Jena, Germany) and an electron microscope JSM 840 (JEOL, Akishima, Tokyo, Japan), the latter fitted with a combined system of energy dispersive microanalysis (INCA PentaFet ×3 («Oxford Instruments Analytical», High Wycombe, UK)) and recording (MAGALLANES 2.2 (SPA «Akadempribor», Sumy, Ukraine)). The analysis time for each region studied was 50 s.
Sample hardness was measured using an M400 hardness meter by Vickers («LECO», St. Joseph, MI, USA) with 100 gf loading from three results, and the average value was taken as the sample hardness value.
X-ray structural phase studies of the steel–titanium joint zone samples after heat treatment by different modes were conducted using a DRON UM-1 diffractometer in monochromatic Cukα radiation by the step scanning method (U = 35 kV; I = 25 mA; 5 s exposure time at a point, 0.05° step, output slits of 1 × 12 mm); diffraction pattern filming was performed from a rotating sample. Graphite single-crystal was used as a monochromator. The derived diffraction data were processed using PowderCell 2.4 programs for full-profile analysis of X-ray spectra from a mixture of polycrystalline phase components. Diffraction maximum profiles were approximated by applying the pseudo-Voigt function. Crystallography Open Database (COD_20221107) was used for structural phase calculations.
3. Results and Discussion
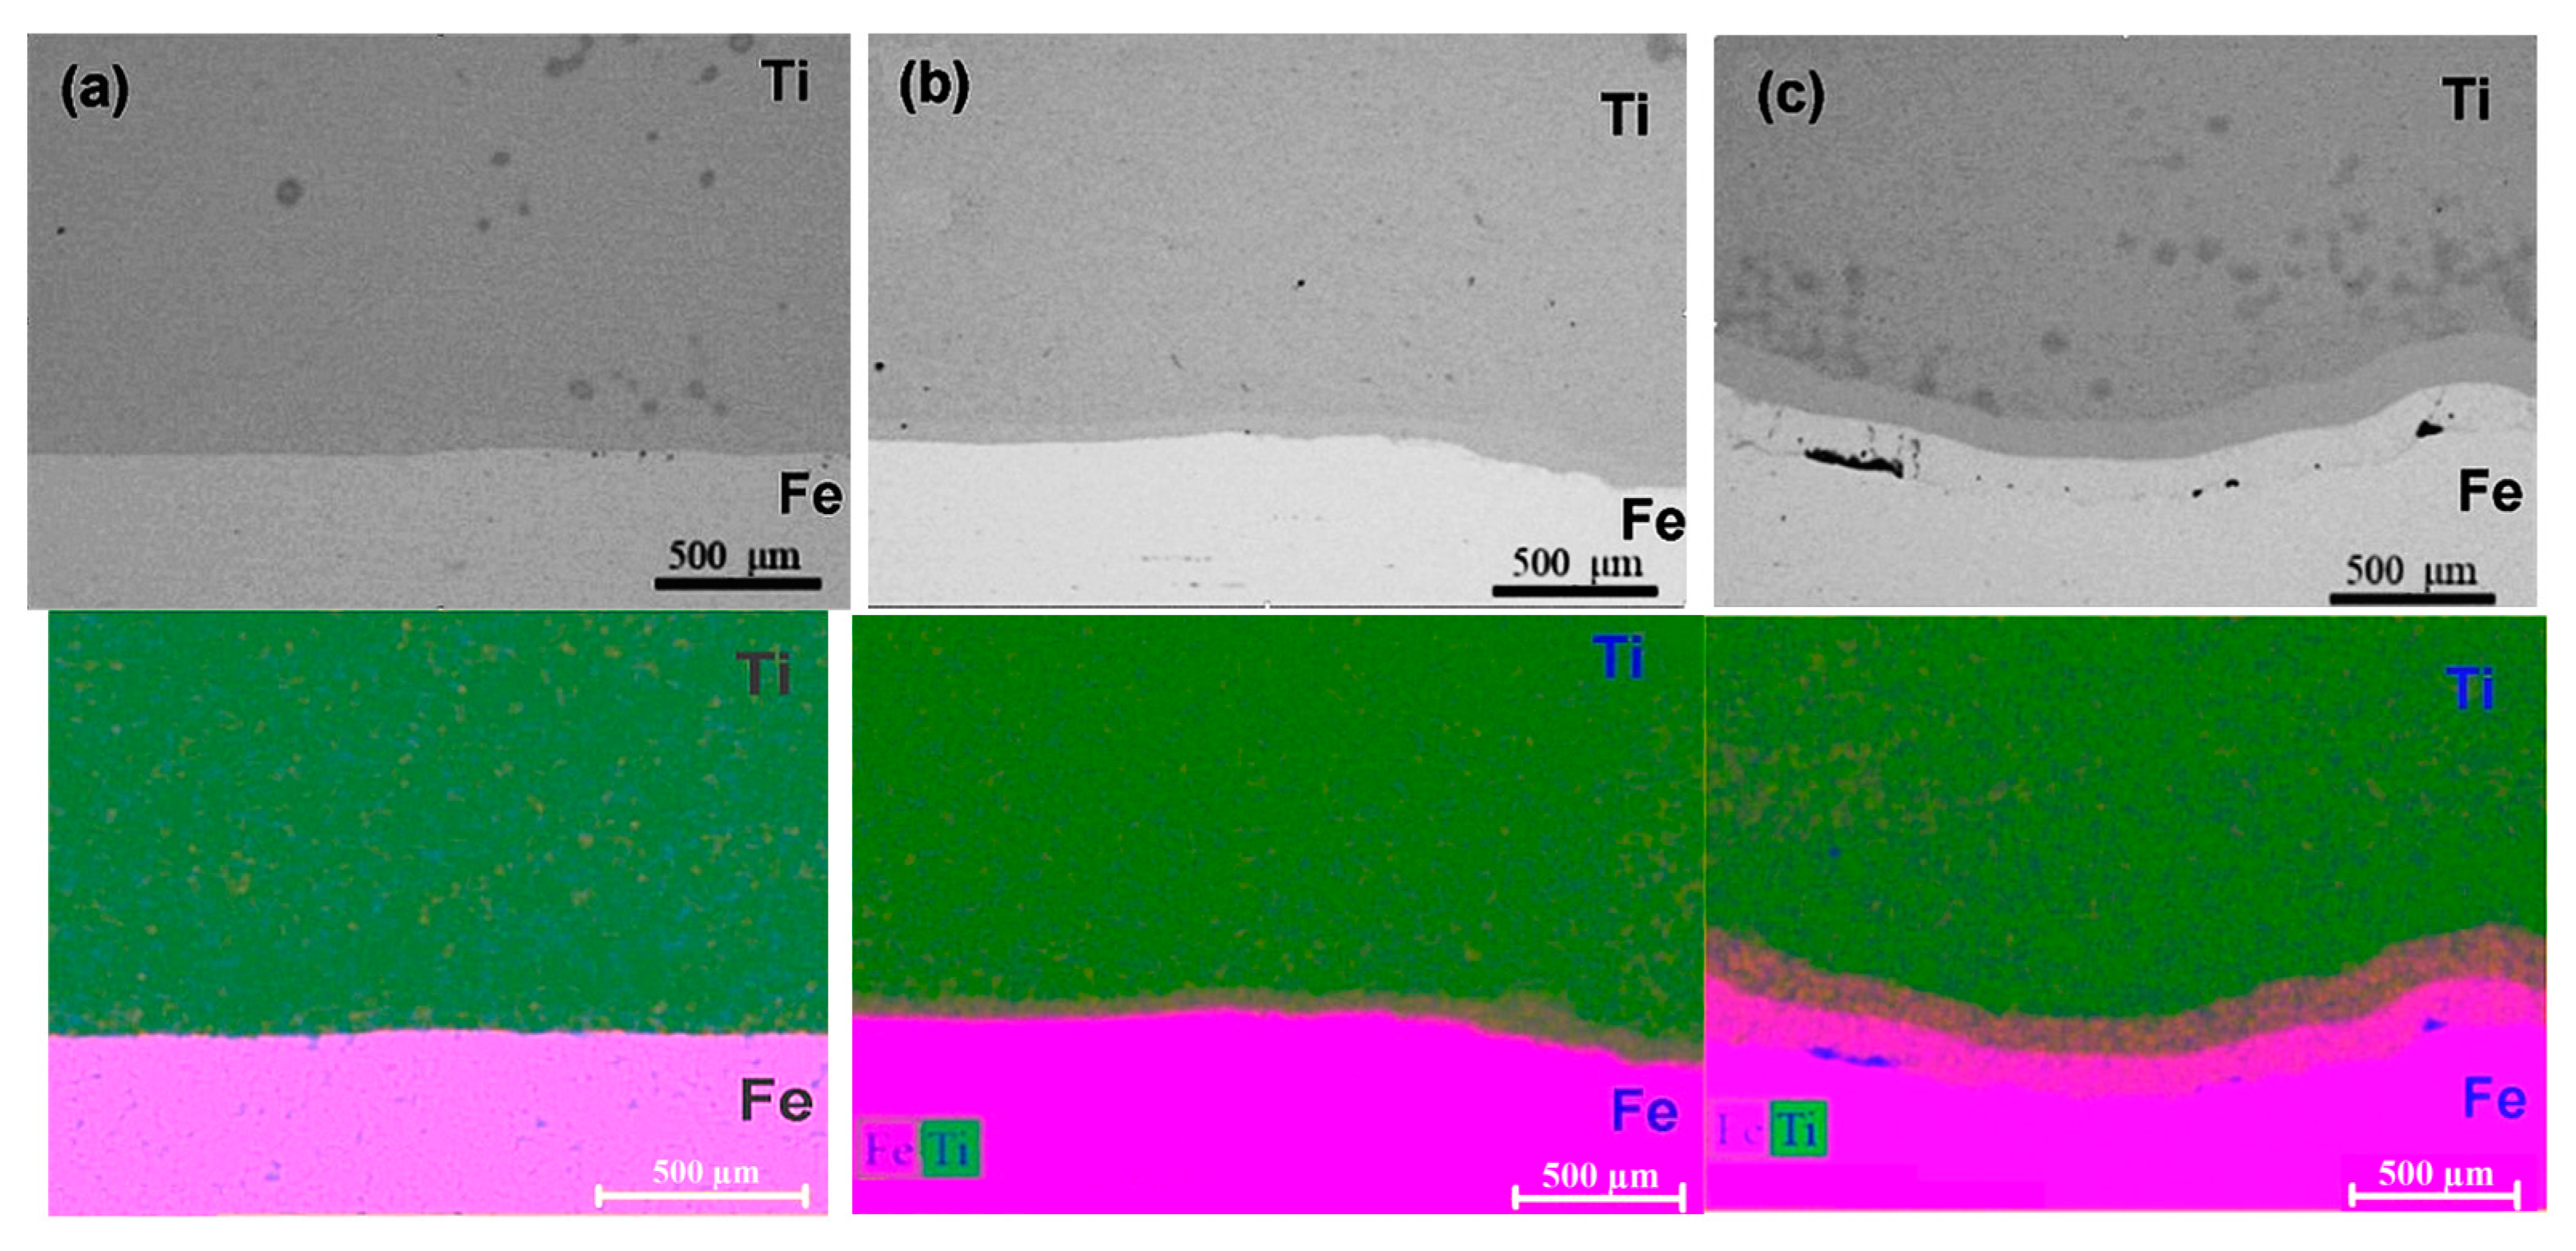
Macrostructure of Fe-Ti joint zone on test samples after different heating modes is given in
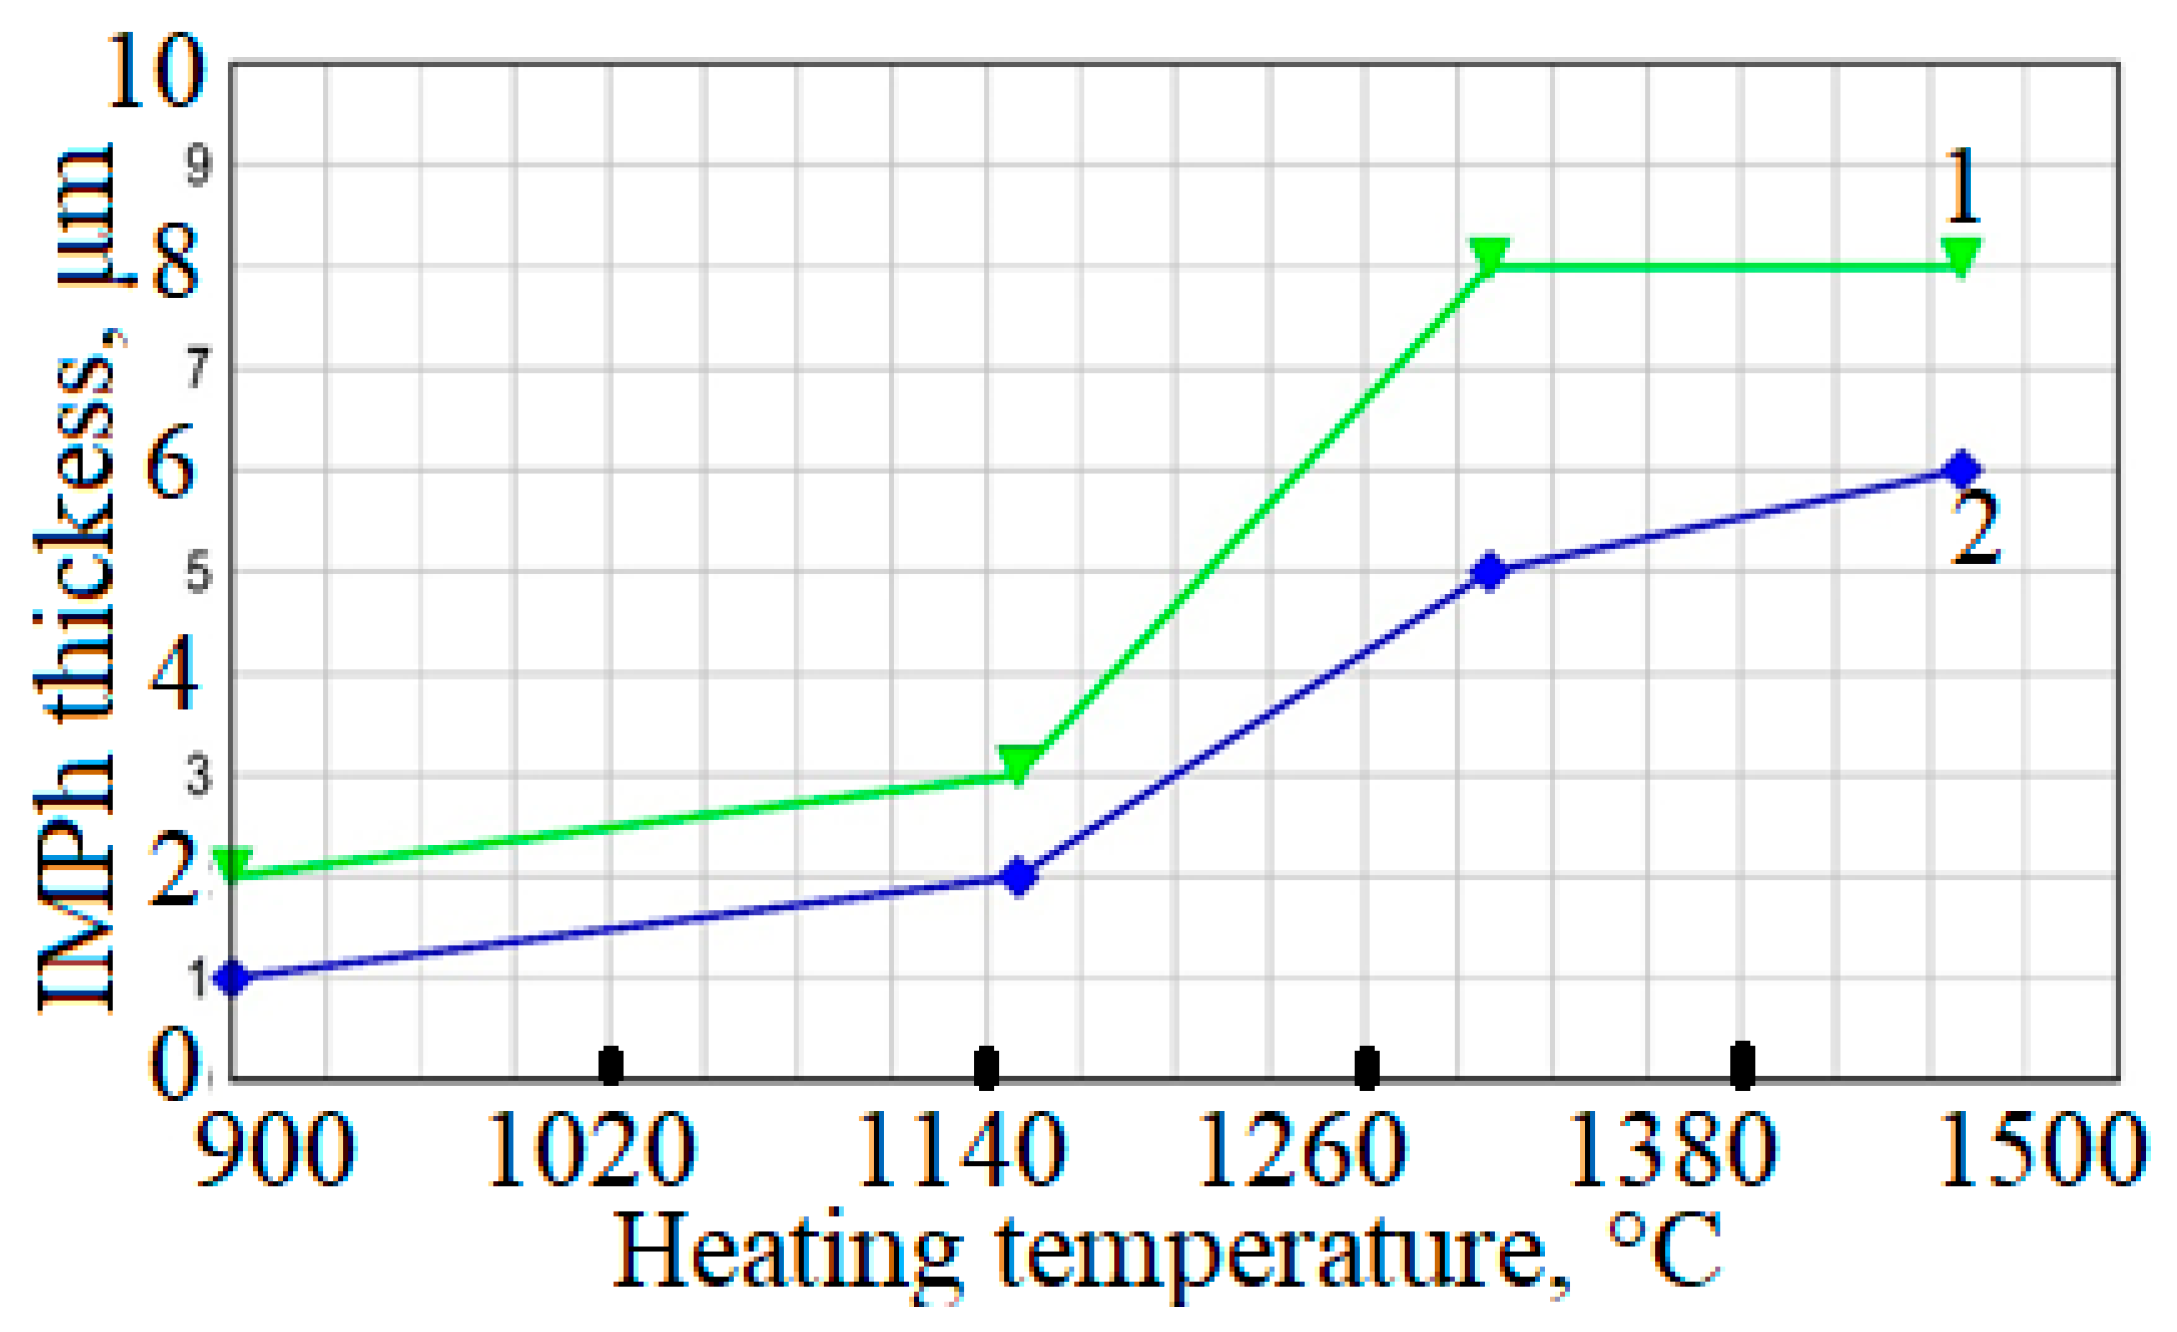
Figure 6. Analysis of the test sample macrostructure showed that the heating temperature influences IMPh thickness and size of the diffusion regions from the side of iron and titanium.
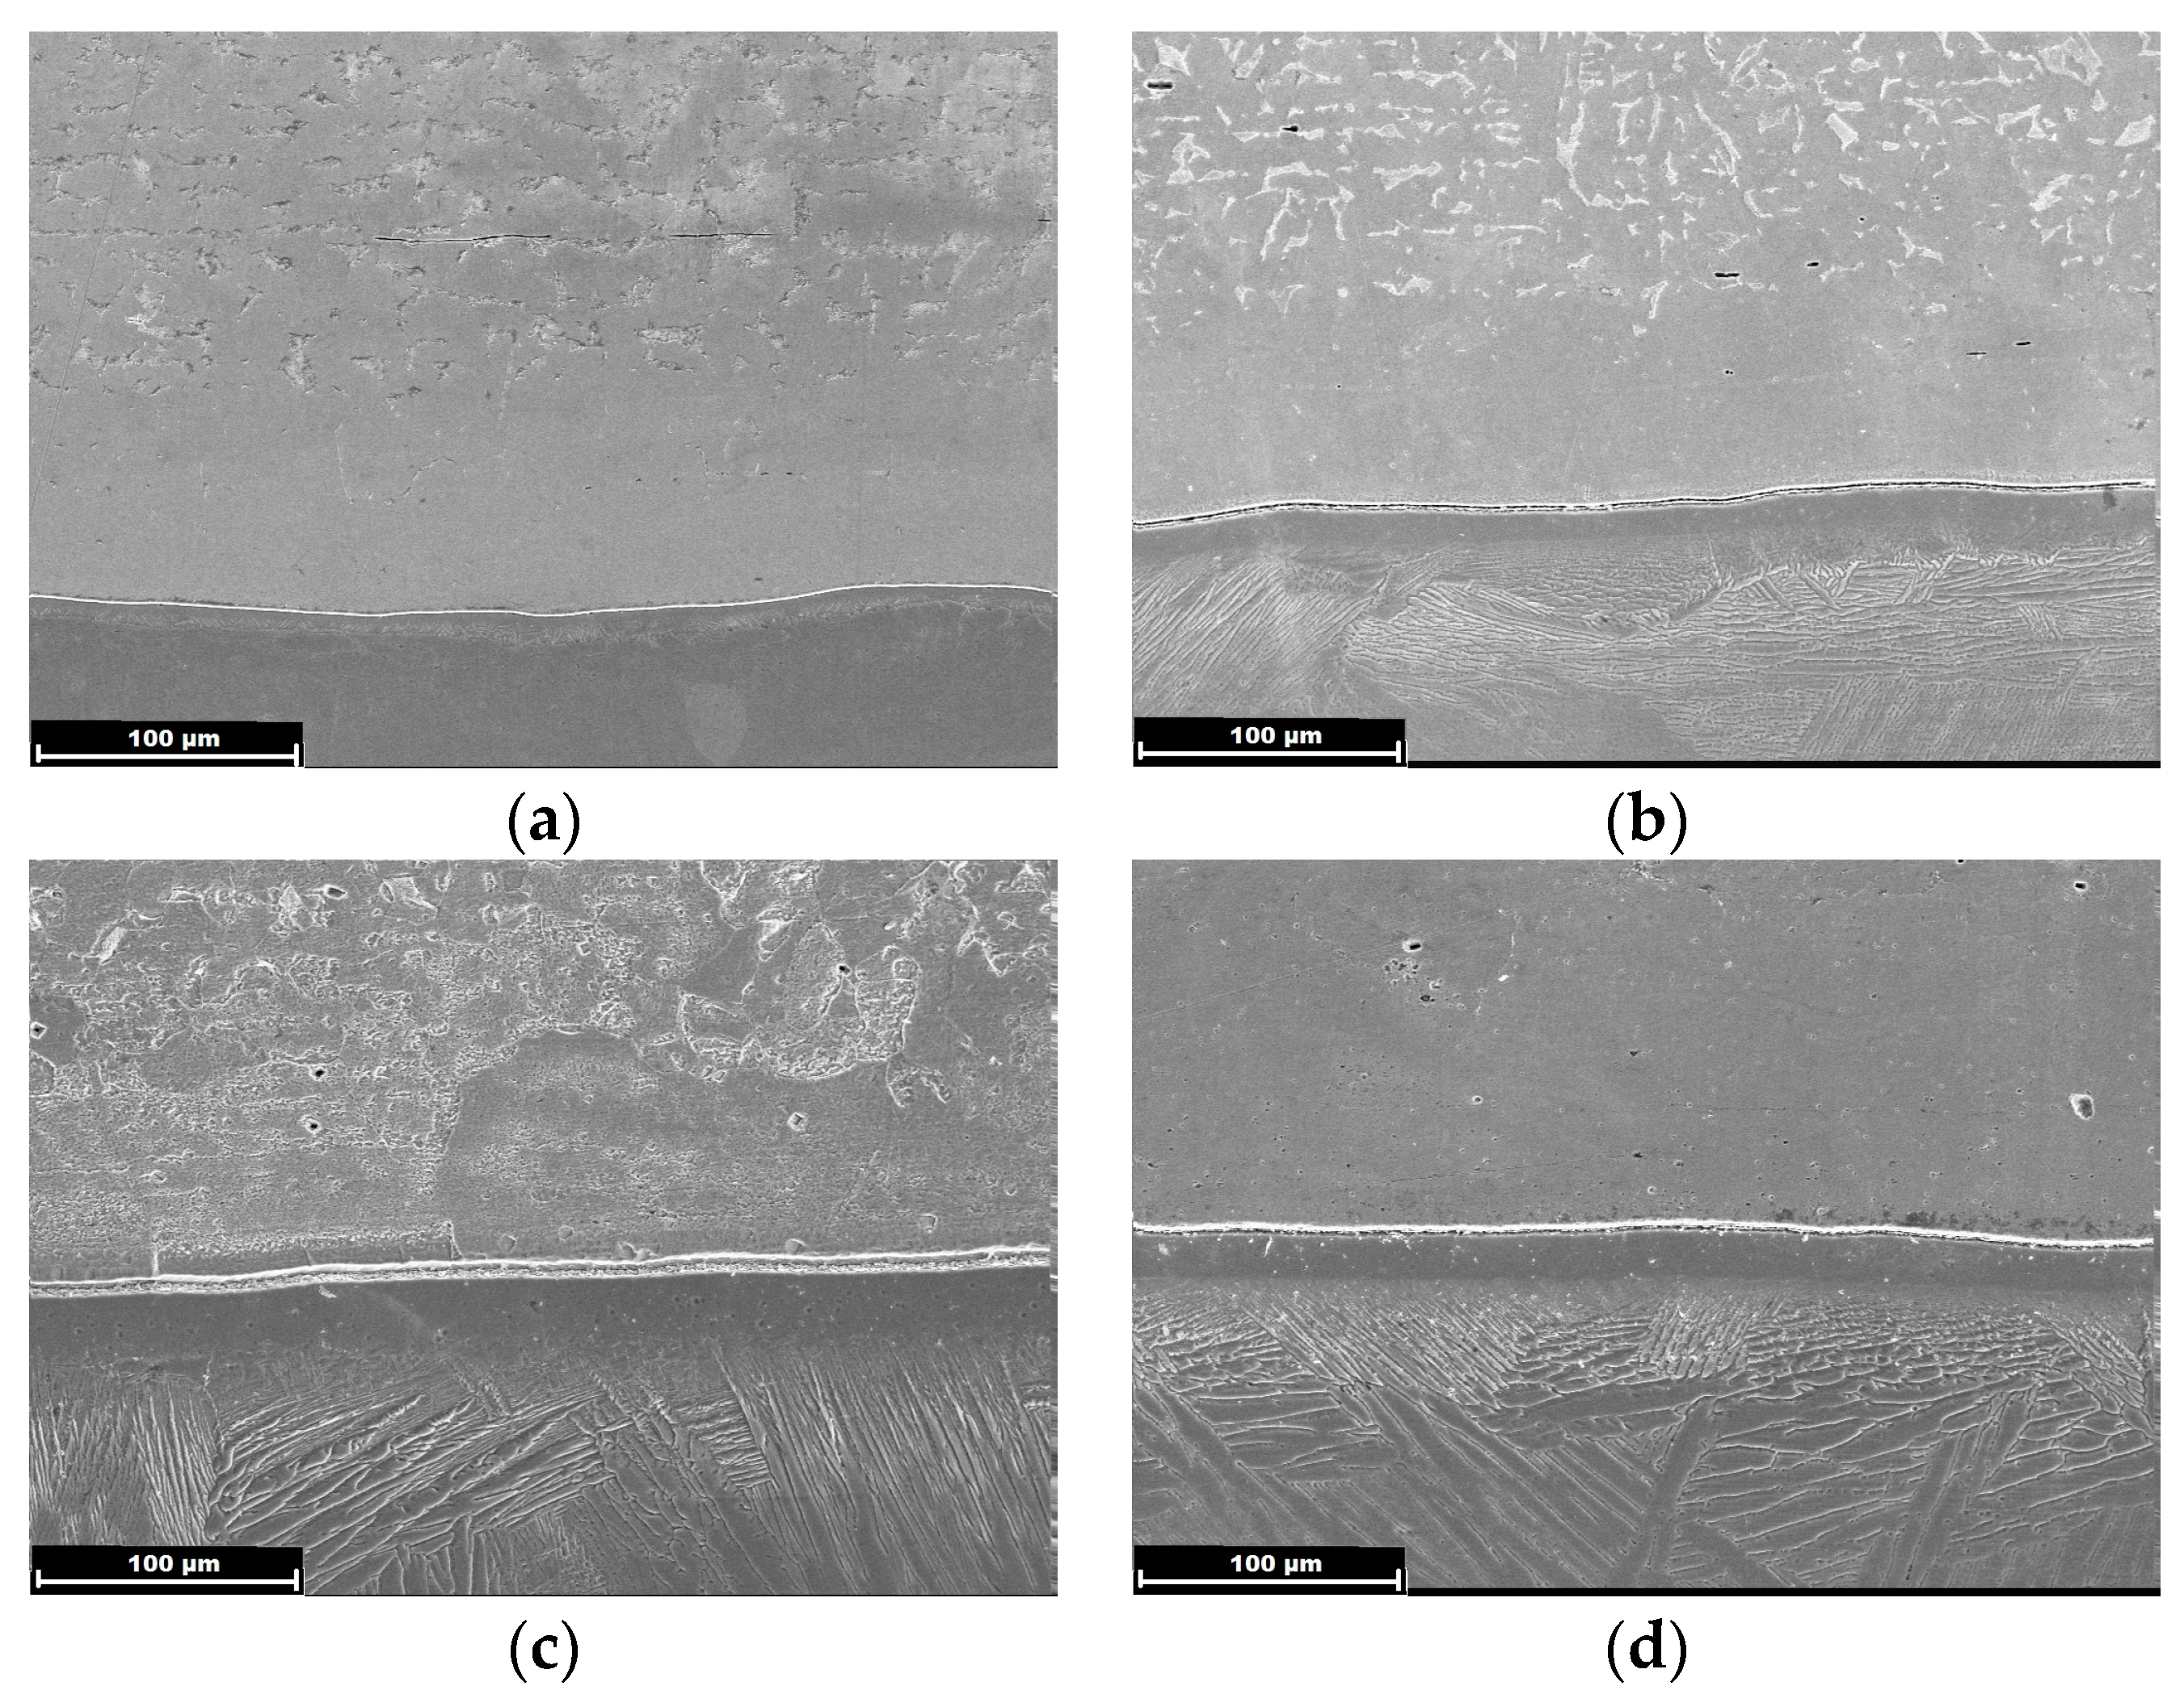
Studying the sample in the initial condition showed that no IMPh formed on the steel–titanium interface (
Figure 7a,b). Presence of a white strip on the interface may be related to formation of a threshold during preparation of microsections for microstructural analysis, which resulted from the difference in iron and titanium hardness. Microstructural investigations showed that the initial steel structure is ferritic–pearlitic and that of titanium is predominantly β-Ti, with a clearly pronounced characteristic lamellar structure.
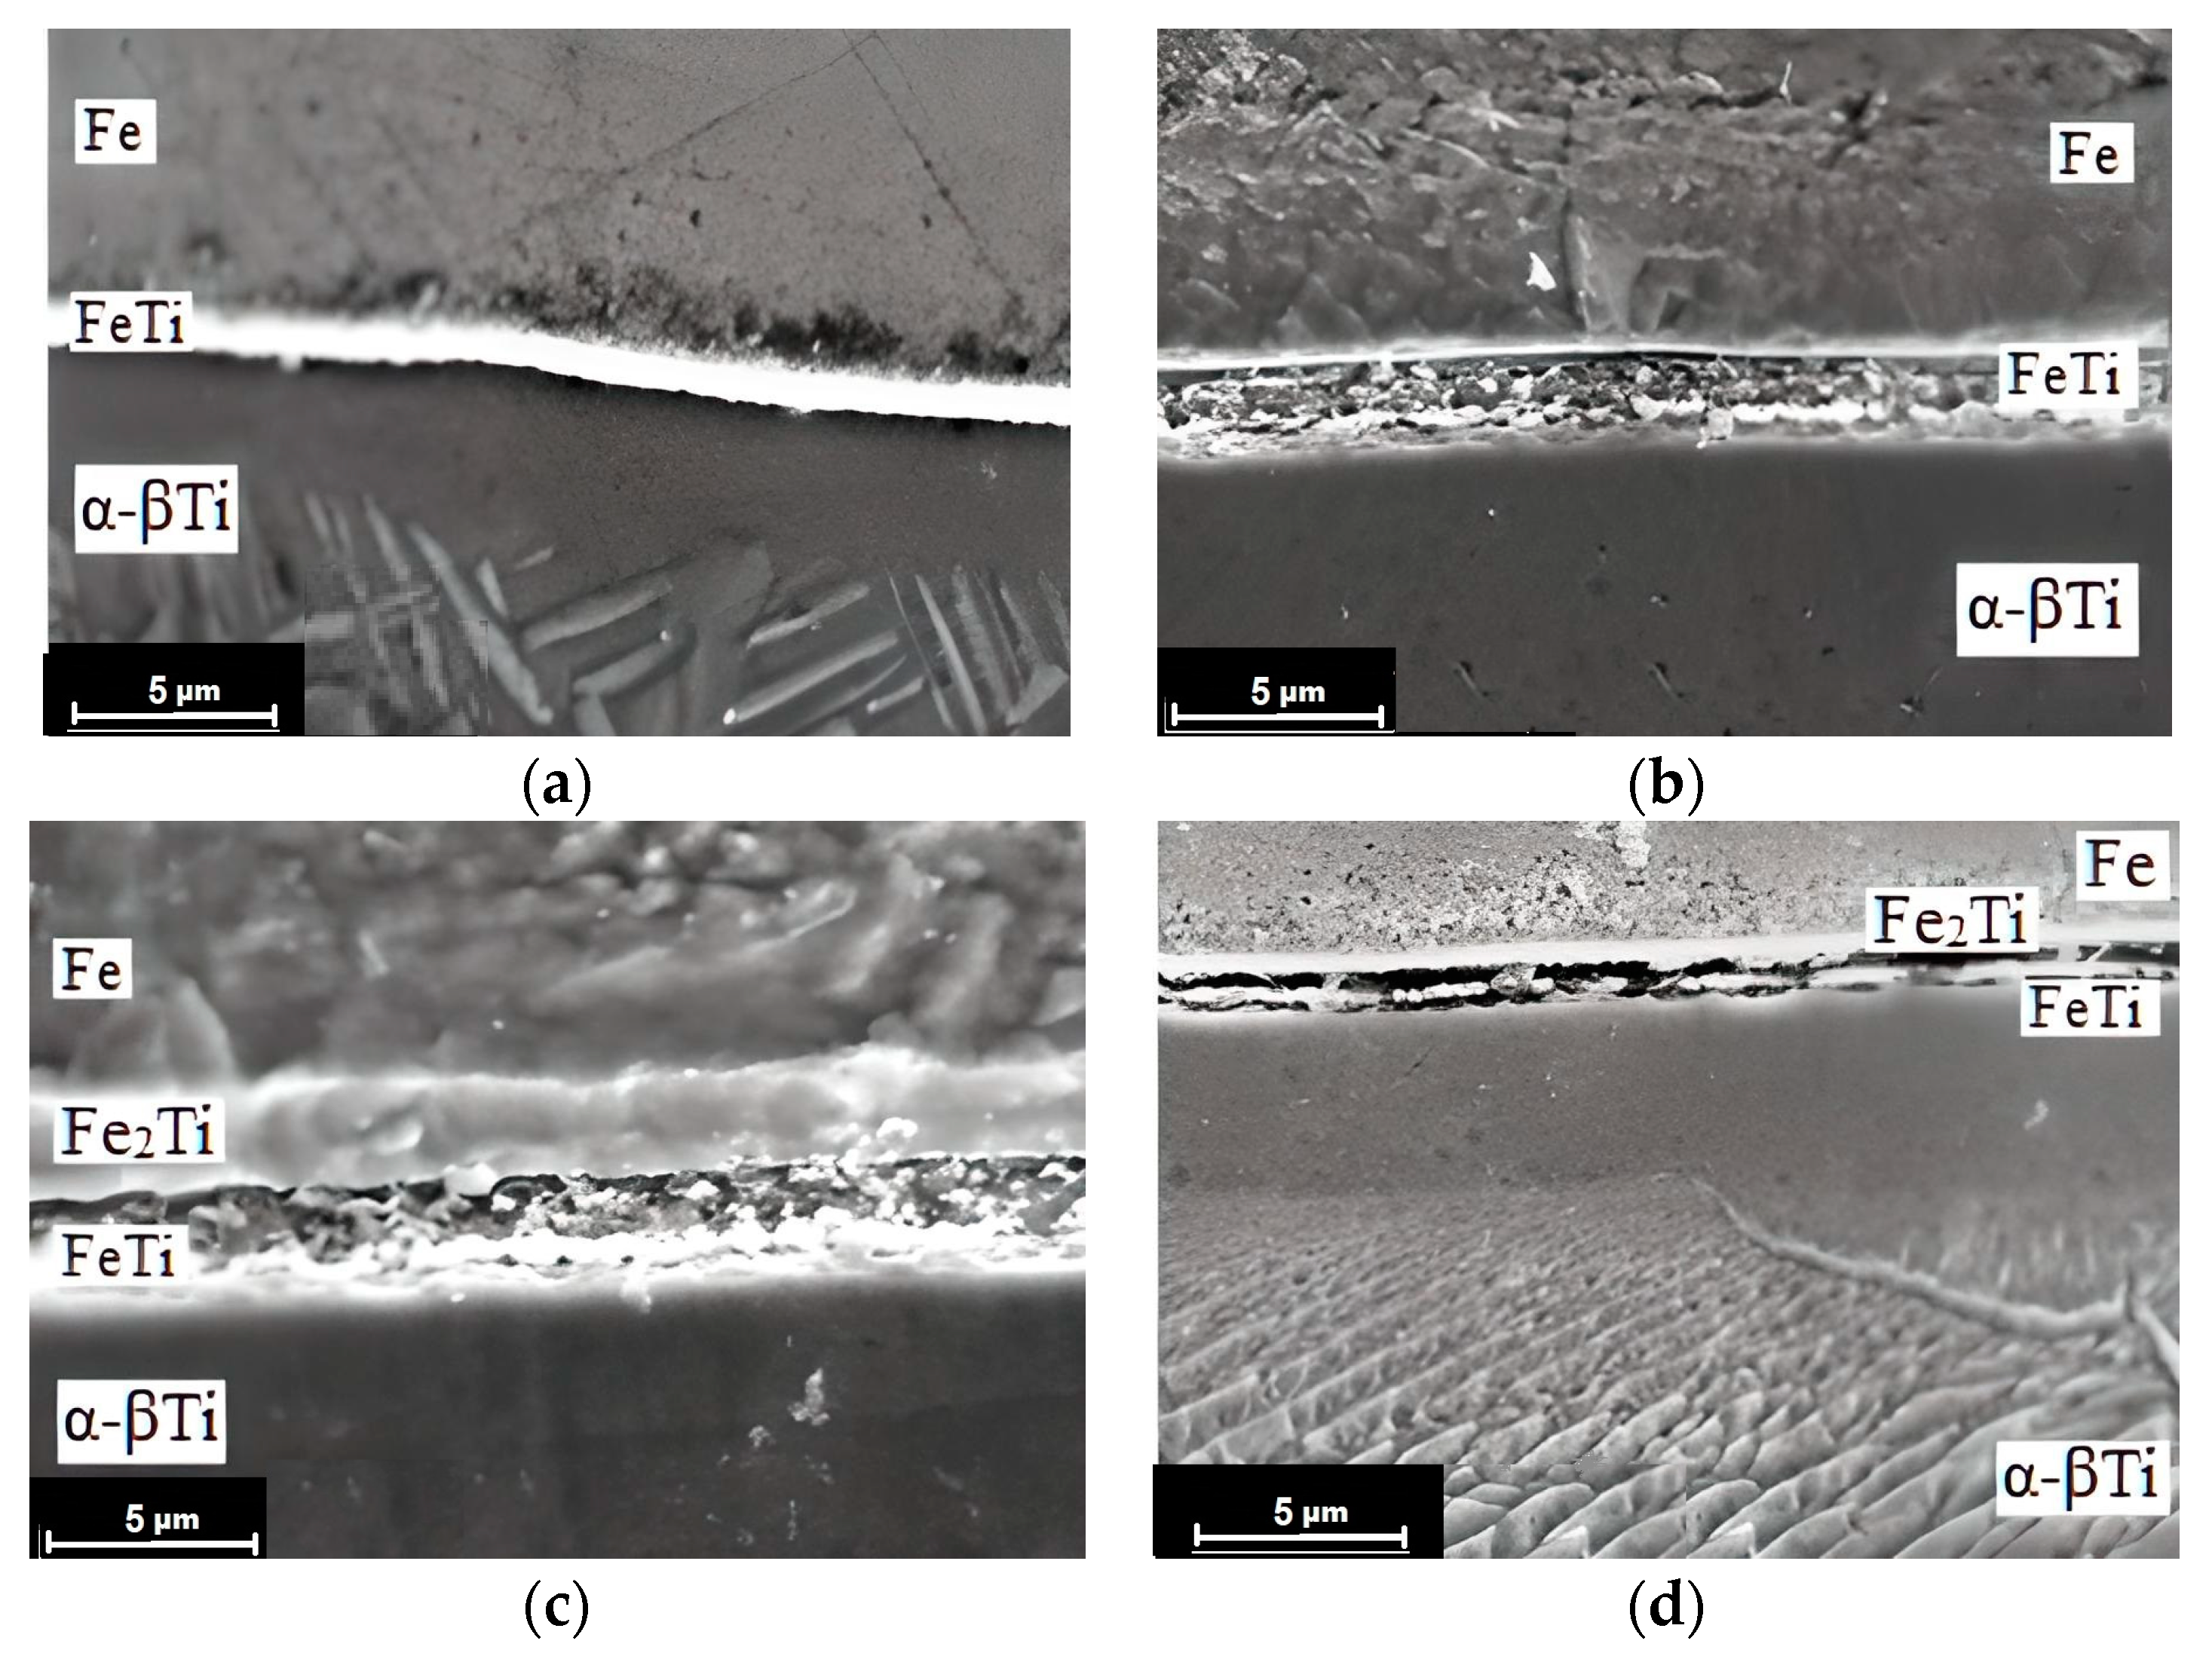
Further studies showed that an increase in the heating temperature in the steel–titanium joint zone leads to a change in morphology (
Figure 7d,f,h,j) and the dimensions of IMPh (
Figure 8) forming on the interface.
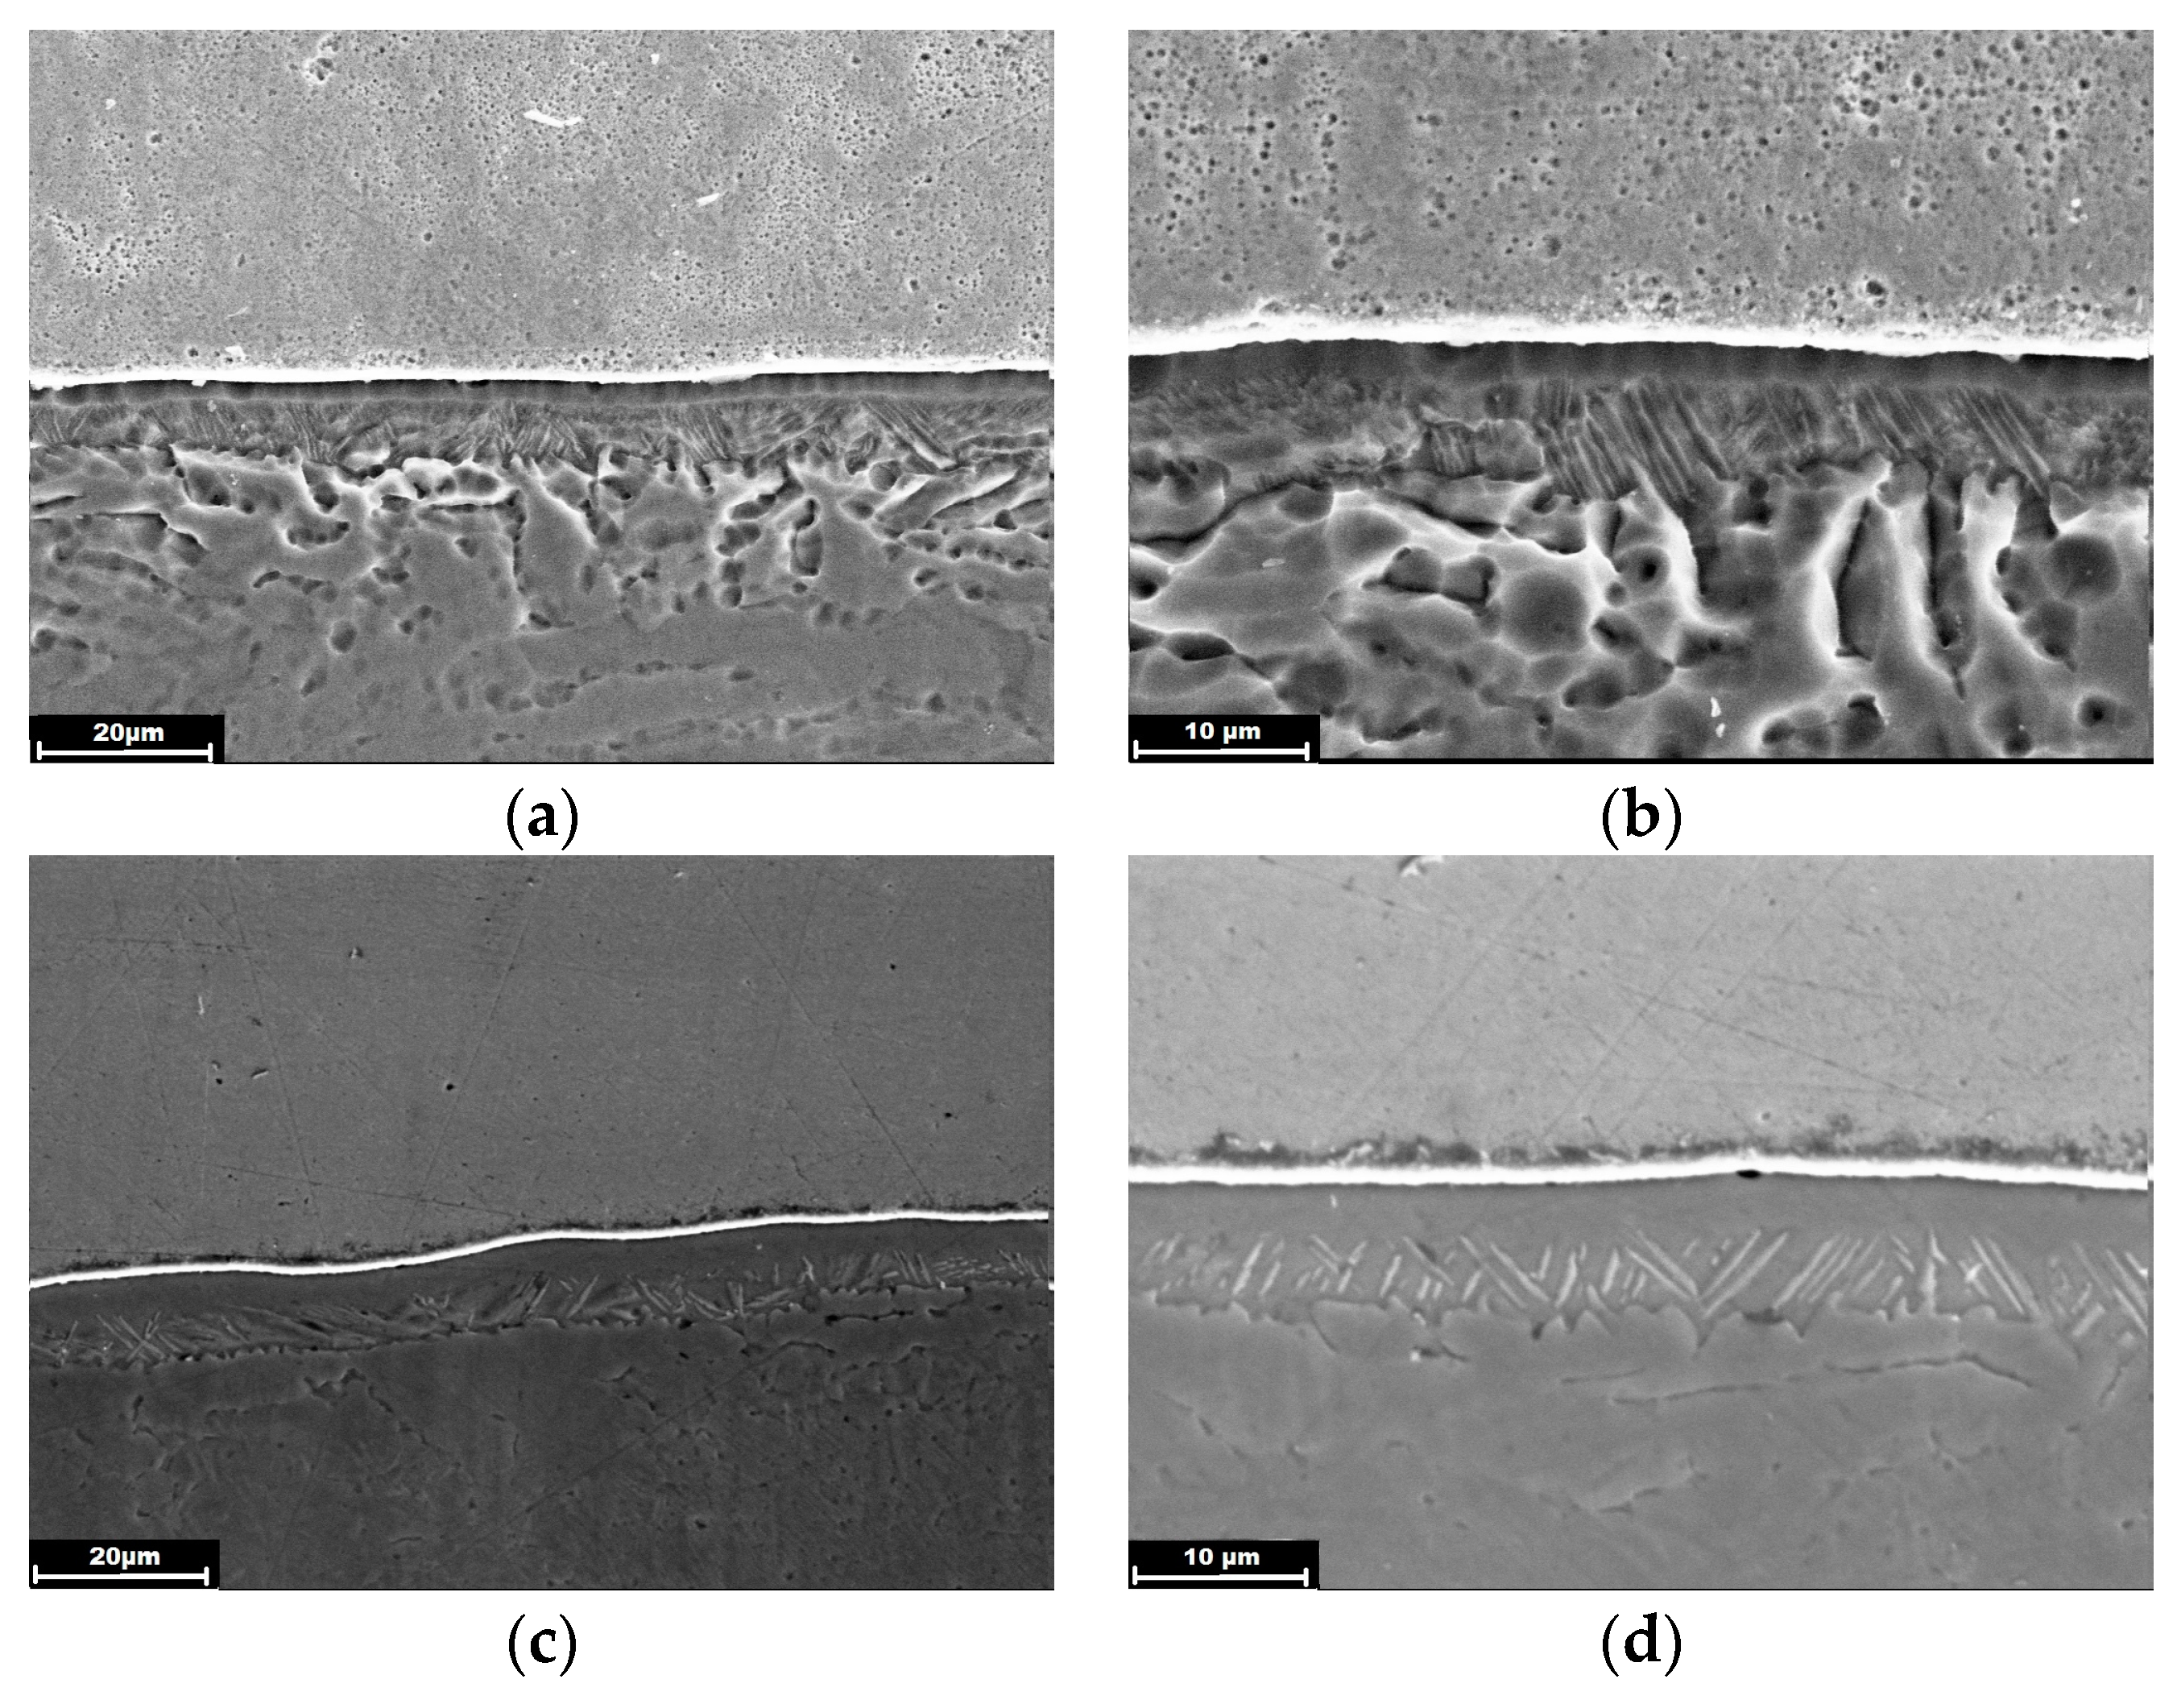
Analysis of the derived results showed that the intermetallic interlayer thickness gradually increases with temperature rise, but after reaching a temperature of 1300…1350 °C, the size of this interlayer is stabilized and no longer grows. The morphology of this interlayer also changes (
Figure 9).
The intermetallic interlayer becomes more ramified (loose) as a result of formation of a certain number of pores and microcracks within it, which may be related to oxidation processes on the joint boundary. During further operation, this welded joint region may lead to destruction through IMPhs in the ductile–brittle mode [
30]. At heat treatment temperatures below 1300 °C, a continuous intermetallic interlayer forms, where fracture occurs predominantly in the brittle mode (spallation).
Based on the equilibrium state diagram (
Figure 1) and results from the X-ray microspectral analysis (
Figure 10,
Table 3), it was found that FeTi-type intermetallics form along the steel/titanium joint boundary at relatively low heating temperatures (up to 1300 °C), whereas at higher temperatures, an IMPh of Fe
2Ti-type additionally begin forming from the steel side. Further studies showed that at the heating temperature of 1300–1350 °C and higher, two types of intermetallics begin to form along the steel/titanium joint boundary (
Figure 9c,d).
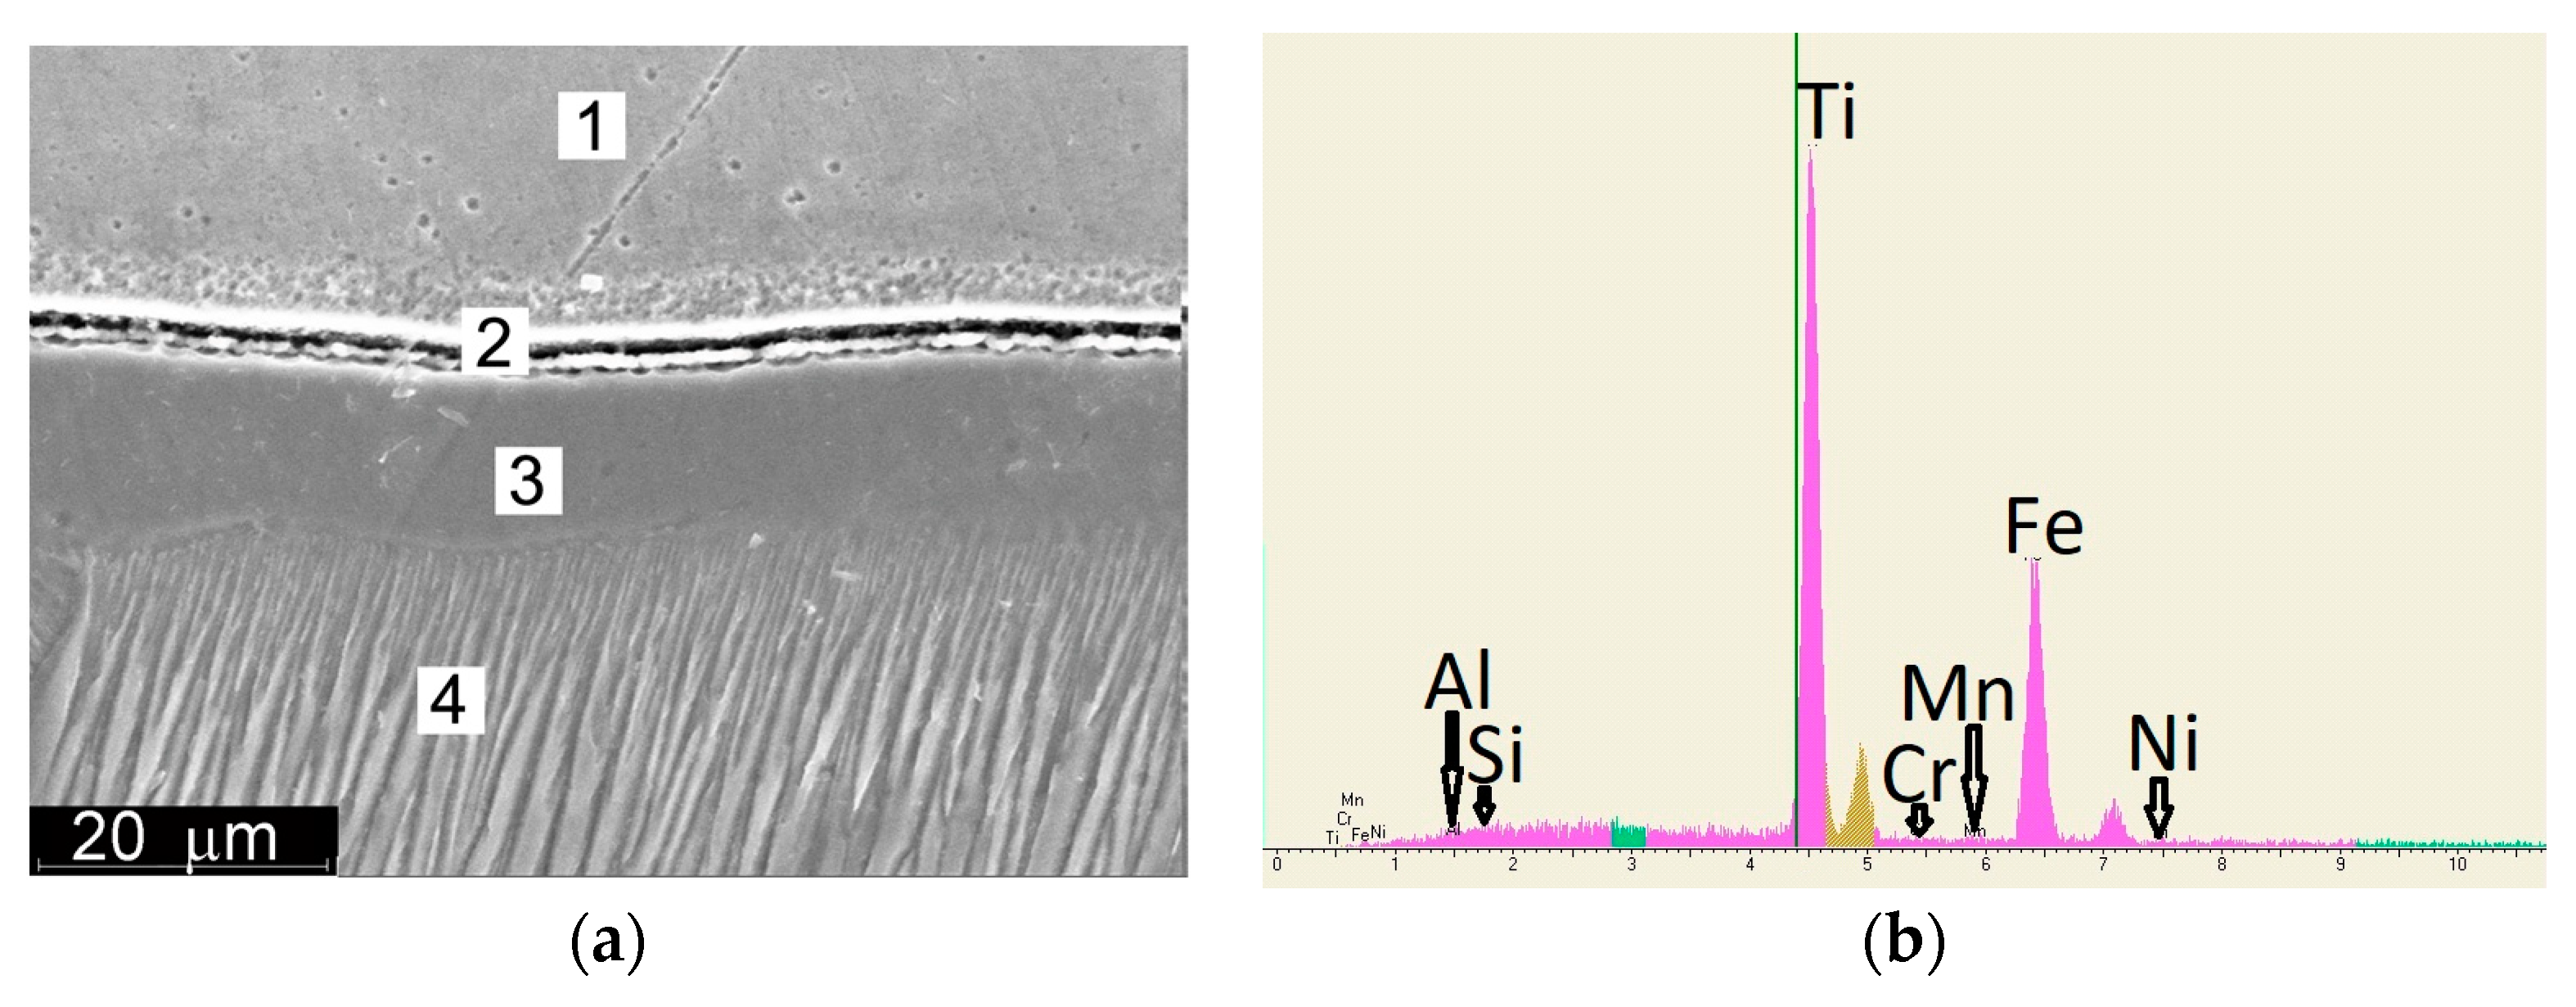
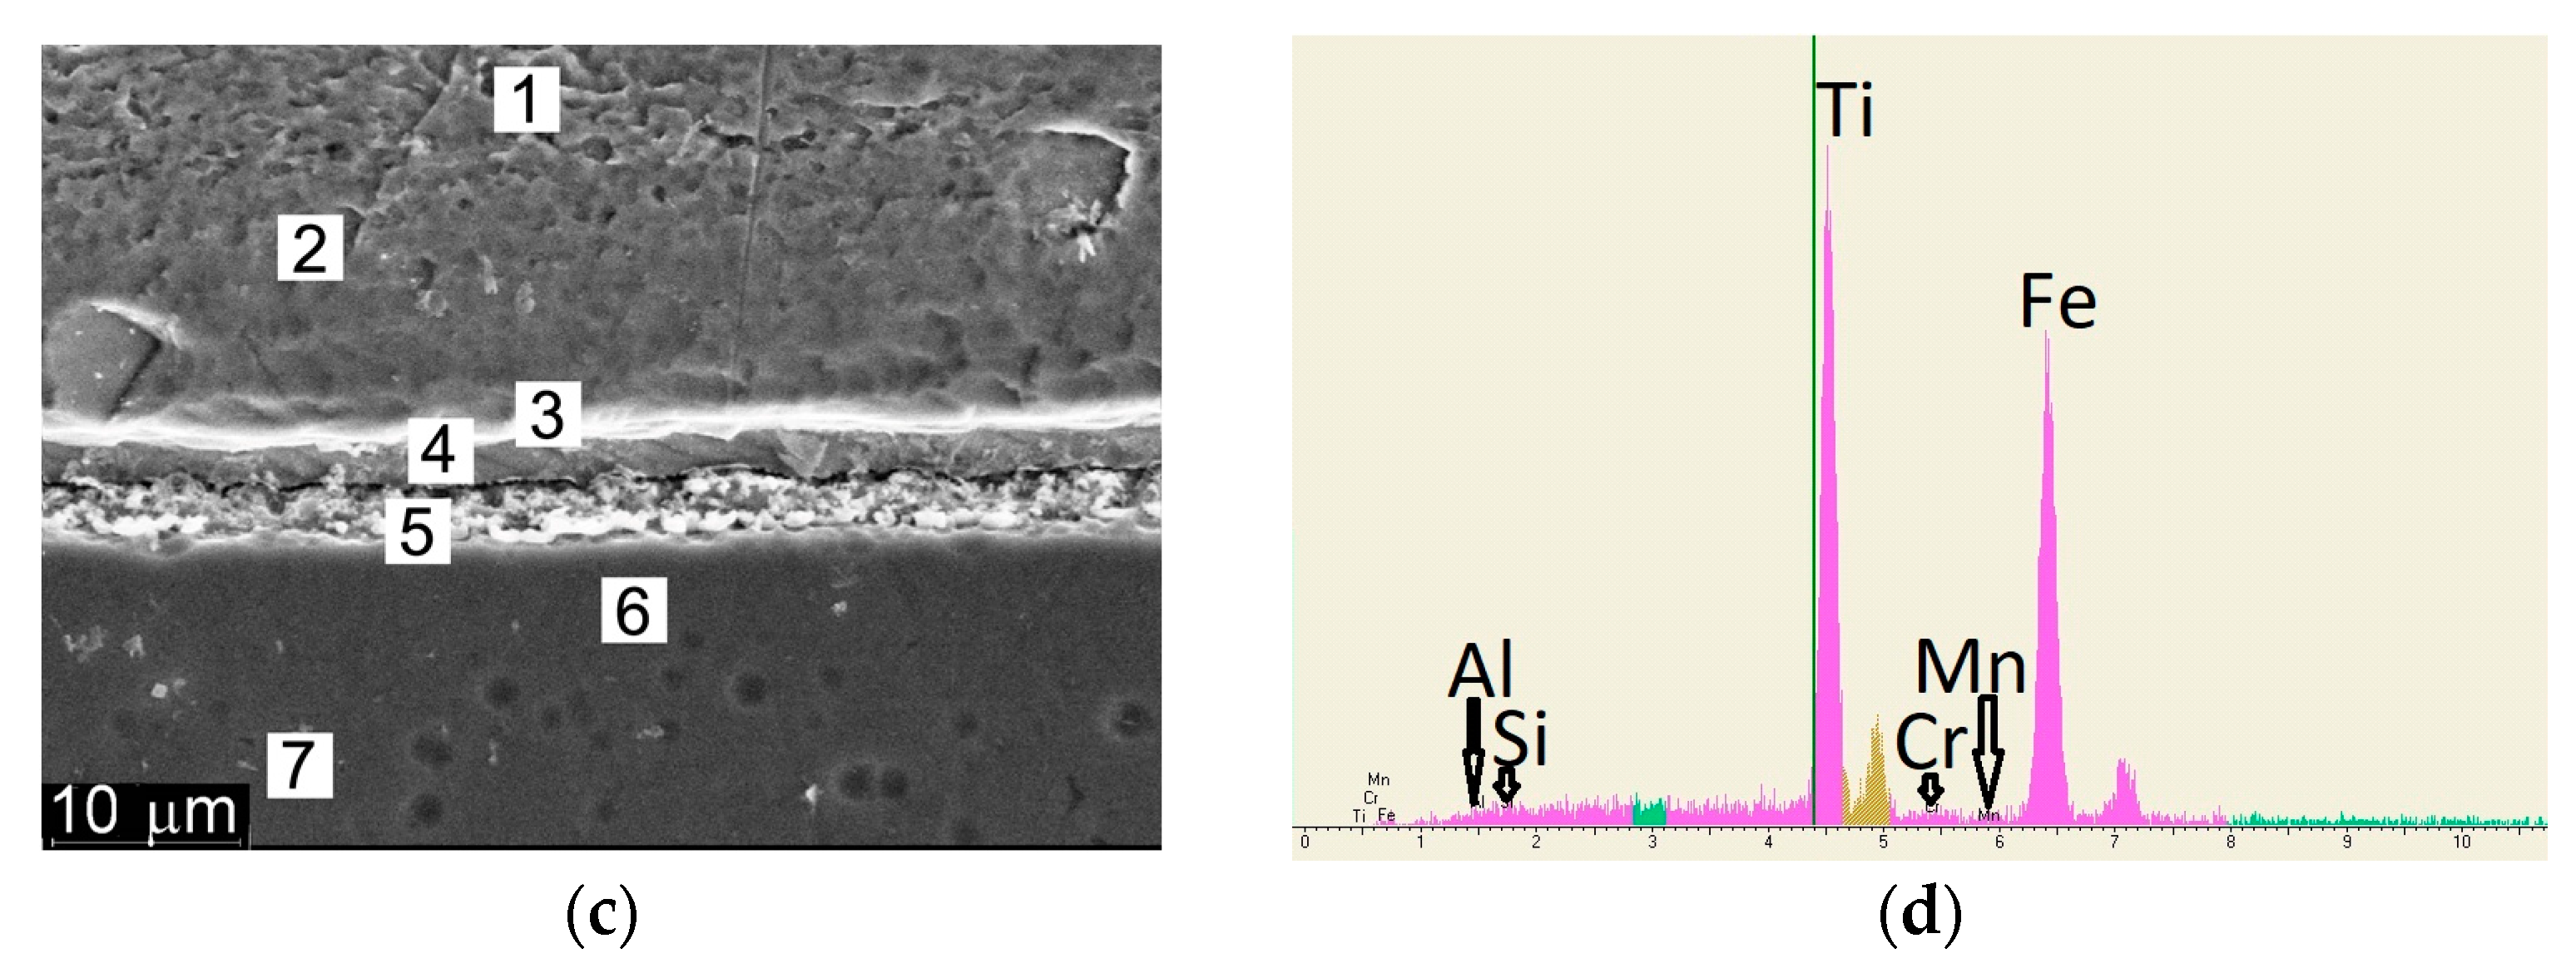
Results from the X-ray microspectral analysis, with the areas marked where quantitative element analysis was performed, are given in
Figure 10. Results from analysis of the content of selected individual elements are given in
Table 3.
In some cases, additional measurements were taken in the regions of IMPh presence. The map of iron and titanium distribution in the regions of the Fe/Ti joint is shown in
Figure 11.
According to the results from the X-ray microspectral analysis, it was established that after heat treatment of the steel–titanium joint at a temperature of 900–907 °C and soaking for t = 10–12 s (sample № 1), a continuous interlayer of FeTi IMPh 1–2 µm thick, containing approximately 54…57 wt.% Ti and 41…44 wt.% Fe, formed on the interface. Then, a diffusion zone with a higher content of iron formed in titanium, which slowly decreased with greater distance from the joint zone. The size of this diffusion zone was equal to 5…10 µm. In individual regions of the Fe-Ti interface, cracks developed on the IMPh–titanium boundary.
After heating the steel–titanium joint at 1150–1250 °C (sample № 2), an interlayer of FeTi IMPh formed on the interface, which contains approximately 50…55 wt.% Ti and 45…50 wt.% Fe. The thickness of the IMPh interlayer is equal to 1–2 µm. Here, a diffusion zone with higher iron content formed in the titanium, which smoothly decreases with greater distance from the joint zone. It was established that after heat treatment, the acicular α-Ti structure disappeared completely in the diffusion zone region with higher iron content.
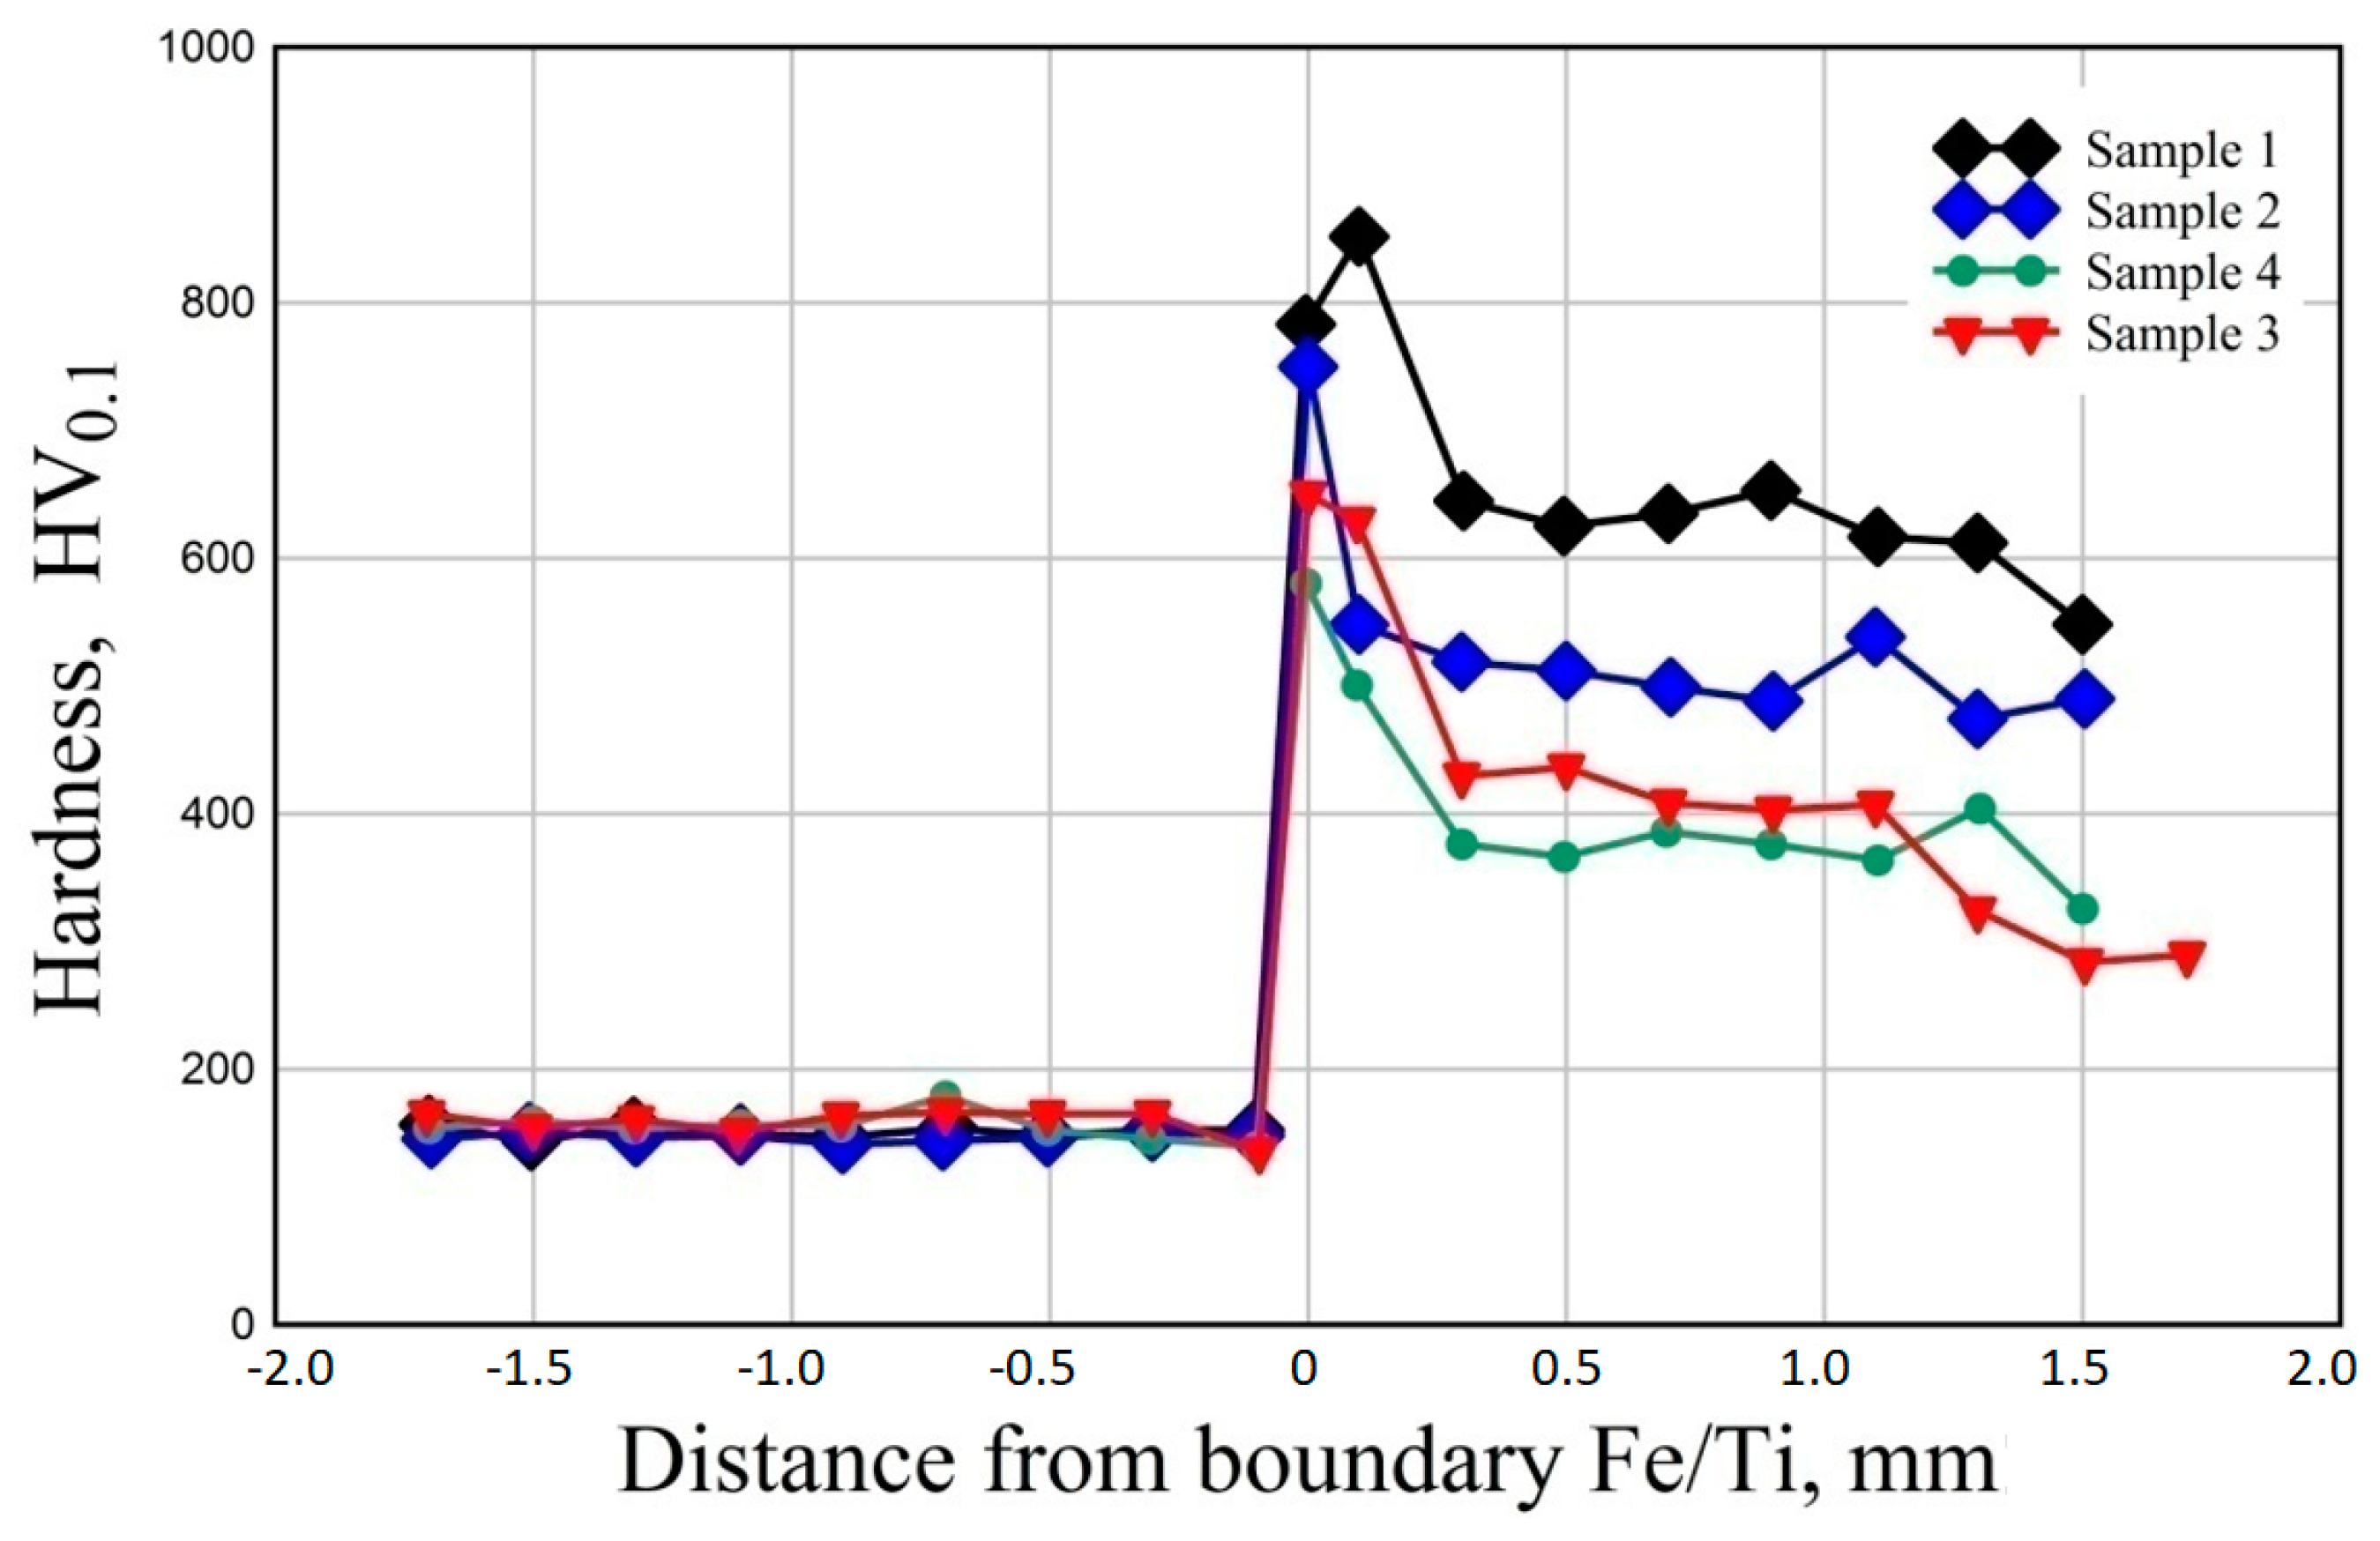
Based on the results from the durometric studies, the distribution of Vickers hardness HV
0.1 along the joint boundary was plotted for the test samples (
Figure 12).
The initial position of the Fe/Ti joint boundary was selected in order to compare the samples by the level of Vickers hardness HV
0.1. As shown in
Figure 12, the microhardness is maximal on the interface, which is mostly associated with formation of a larger amount of intermetallic compounds on the joint boundary. Hardness quickly decreases from the interface to both sides. It is found that steel hardness changes only slightly (to 100 µm), while hardness of the titanium alloy of Grade 2 demonstrates a gradual decrease within 1–2 mm from the joint zone, which is related to iron diffusion into titanium. The amount of dispersed Ti
2Fe phase formed gradually becomes smaller, due to intermetallic compound formation along the joint boundary from the titanium side, so that the total hardness from the titanium side decreases. Owing to iron diffusion into the titanium alloy and formation of dispersed Ti
2Fe intermetallic compounds at a certain distance (0.5–2.0 mm), it becomes a composite material with rather high hardness and strength values.
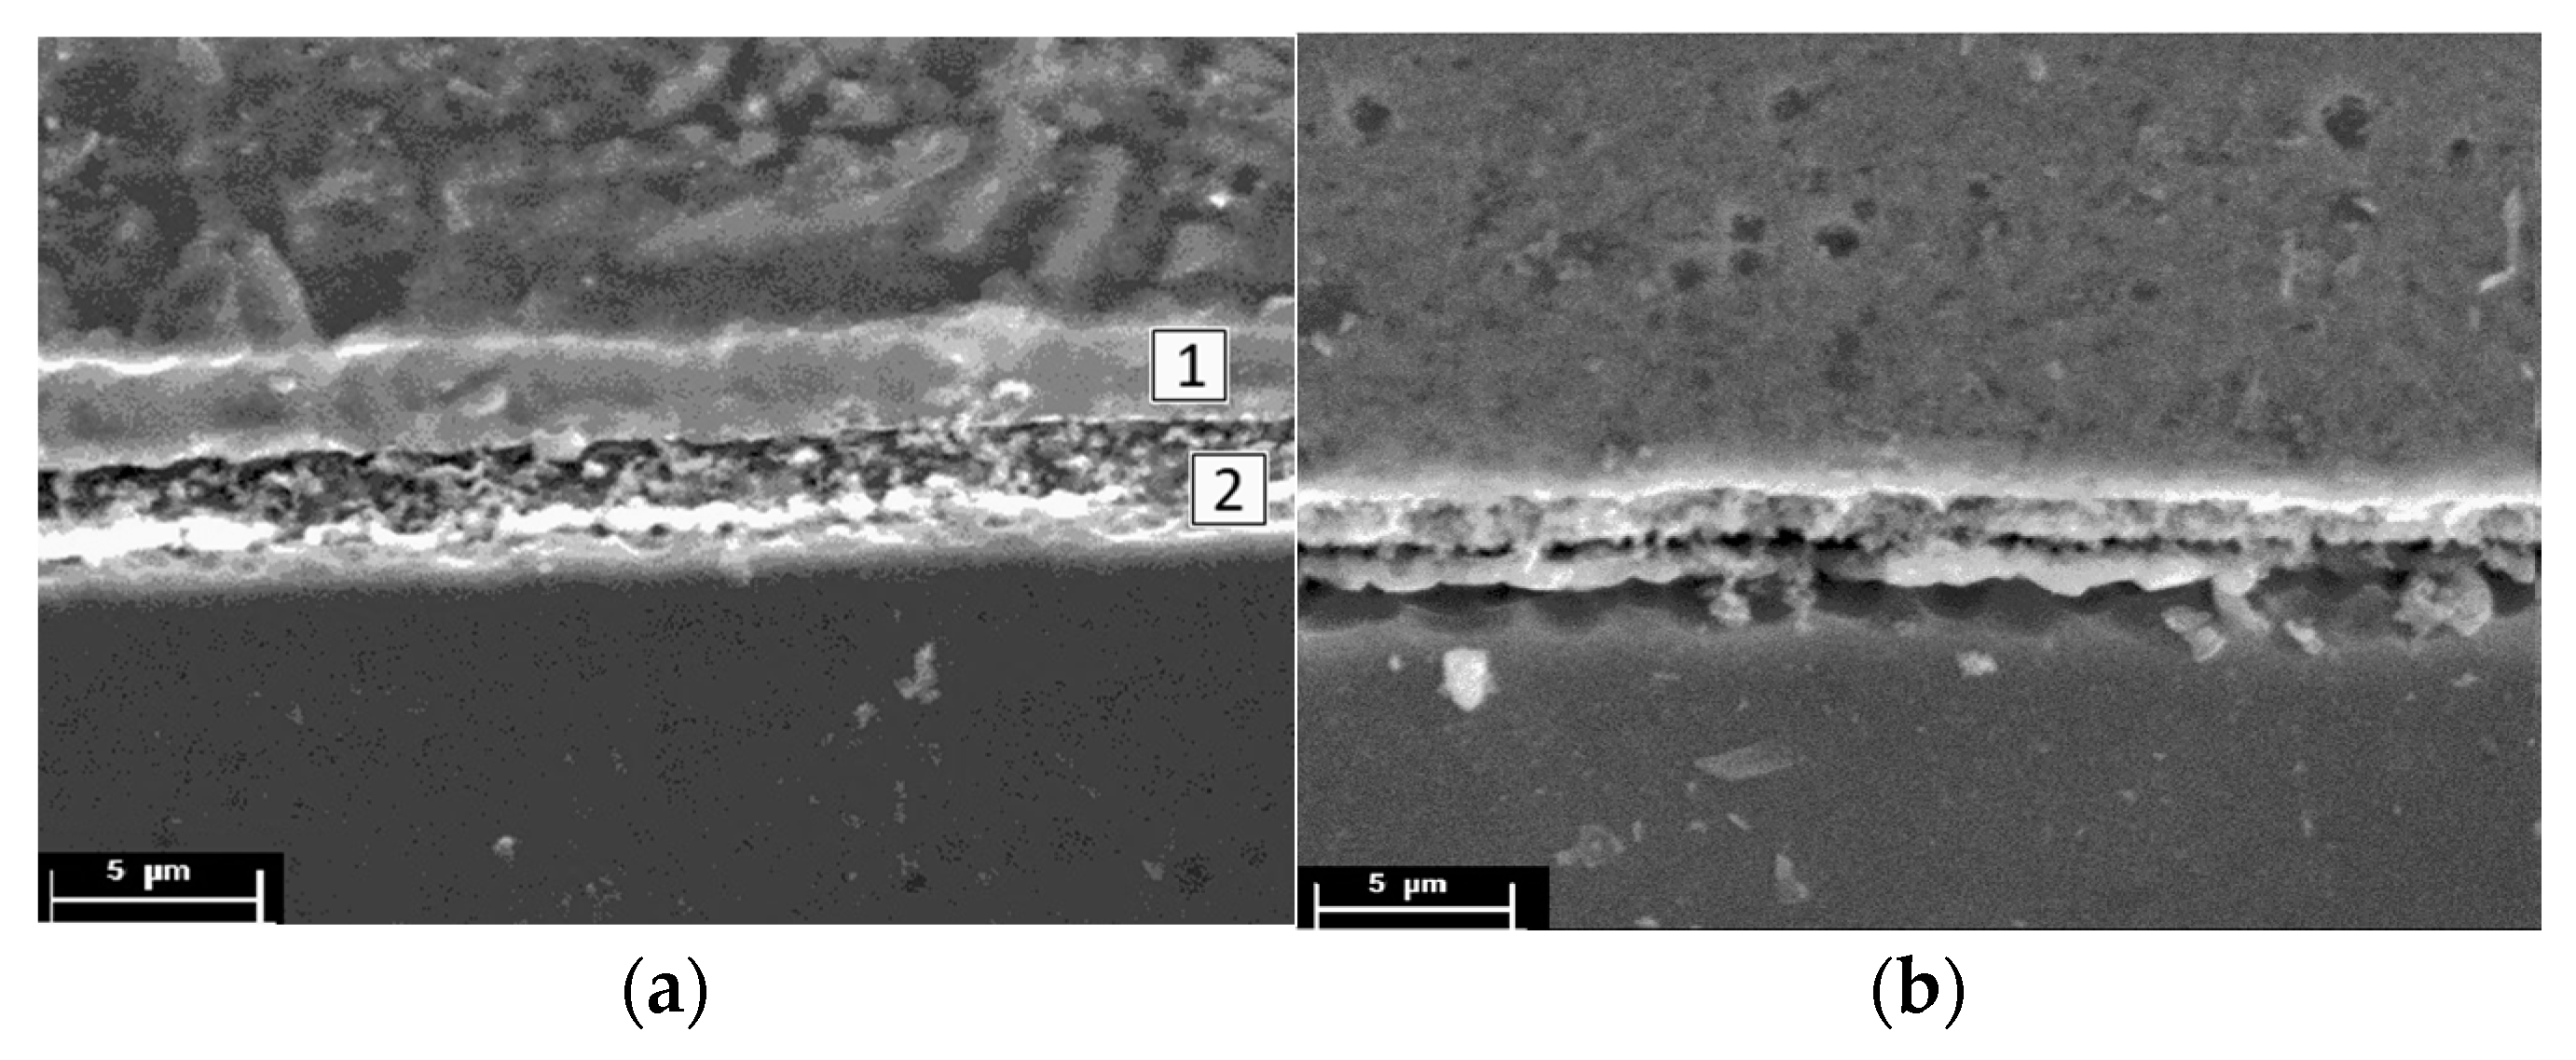
After heating the steel–titanium joint at 1300–1350 °C (sample № 3), two different IMPhs formed on its interface. The first phase formed from the steel side, its composition (regions 3 and 4,
Figure 6,c) is 8…10% Ti and 90…92% Fe. According to the Ti-Fe state diagram, this phase can be regarded as TiFe
2. Microhardness of the regions consisting mainly from this phase is equal to HV0.01—650. Such regions are characterized by the absence of pores, microcracks, and other defects (region 1,
Figure 13).
Composition of the other intermetallic phase, forming from the titanium side, is 30…40% Ti and 60…70% Fe, which corresponds to the TiFe
2 formula. Microstructure of the local zones, which consists of this phase, is characterized by presence of defects, namely pores, microcracks, etc. (region 2,
Figure 13). Microhardness values for these zones are equal to HV0.01—760.
Total thickness of the intermetallic interlayer is equal to 5…8 µm. It should be noted that a diffusion zone, where titanium content gradually decreases to 0%, formed from the intermetallic interlayer towards the steel to the depth of 15…20 µm. A larger diffusion zone also formed in the direction of the titanium, where the titanium content also gradually decreased to zero.
After heating the steel—titanium joint at 1430–1450 °C with soaking for t = 10–12 s (sample № 4), an interlayer with two different, characteristic IMPhs formed on the steel–titanium interface, in addition to the FeTi phase. The composition of the first phase (region 2,
Figure 10c), forming from the steel side, is 73…75 wt.% Ti and 27…25 wt.% Fe. In keeping with the Ti-Fe state diagram, this phase can be regarded as Ti
2Fe. The regions, consisting from the first phase, are characterized by the presence of defects (pores and cracks) 0.1–0.3 µm in size, and they have microhardness values HV0.01–690. The second phase has the chemical composition 80…85 wt.% Ti and 20…15 wt.% Fe, which corresponds to Ti
2Fe intermetallic. This titanium-enriched phase is located from the of titanium side (region 4,
Figure 6d). The regions consisting predominantly from this phase are also characterized by a ramified structure, presence of fine pores of up to 0.1 µm size, and the microhardness value in this area is equal to HV0.01–600.
On the whole, the intermetallic interlayer thickness is equal to 5…10 µm. In this interlayer, the ratio of the content of phases (73…75 wt.% Ti + 27…25 wt.% Fe) and (80…85 wt.% Ti + 20…15 wt.% Fe) changes from 50/50% to 20/80%, in keeping with the temperature rise from 1300 to 1430–1450 °C.
Here, the size of the diffusion zone from the steel side, where titanium content gradually decreases to 0%, is equal to 120…150 µm. From the titanium side, a diffusion zone of 20…30 µm size also formed, where iron content also gradually decreases to zero.
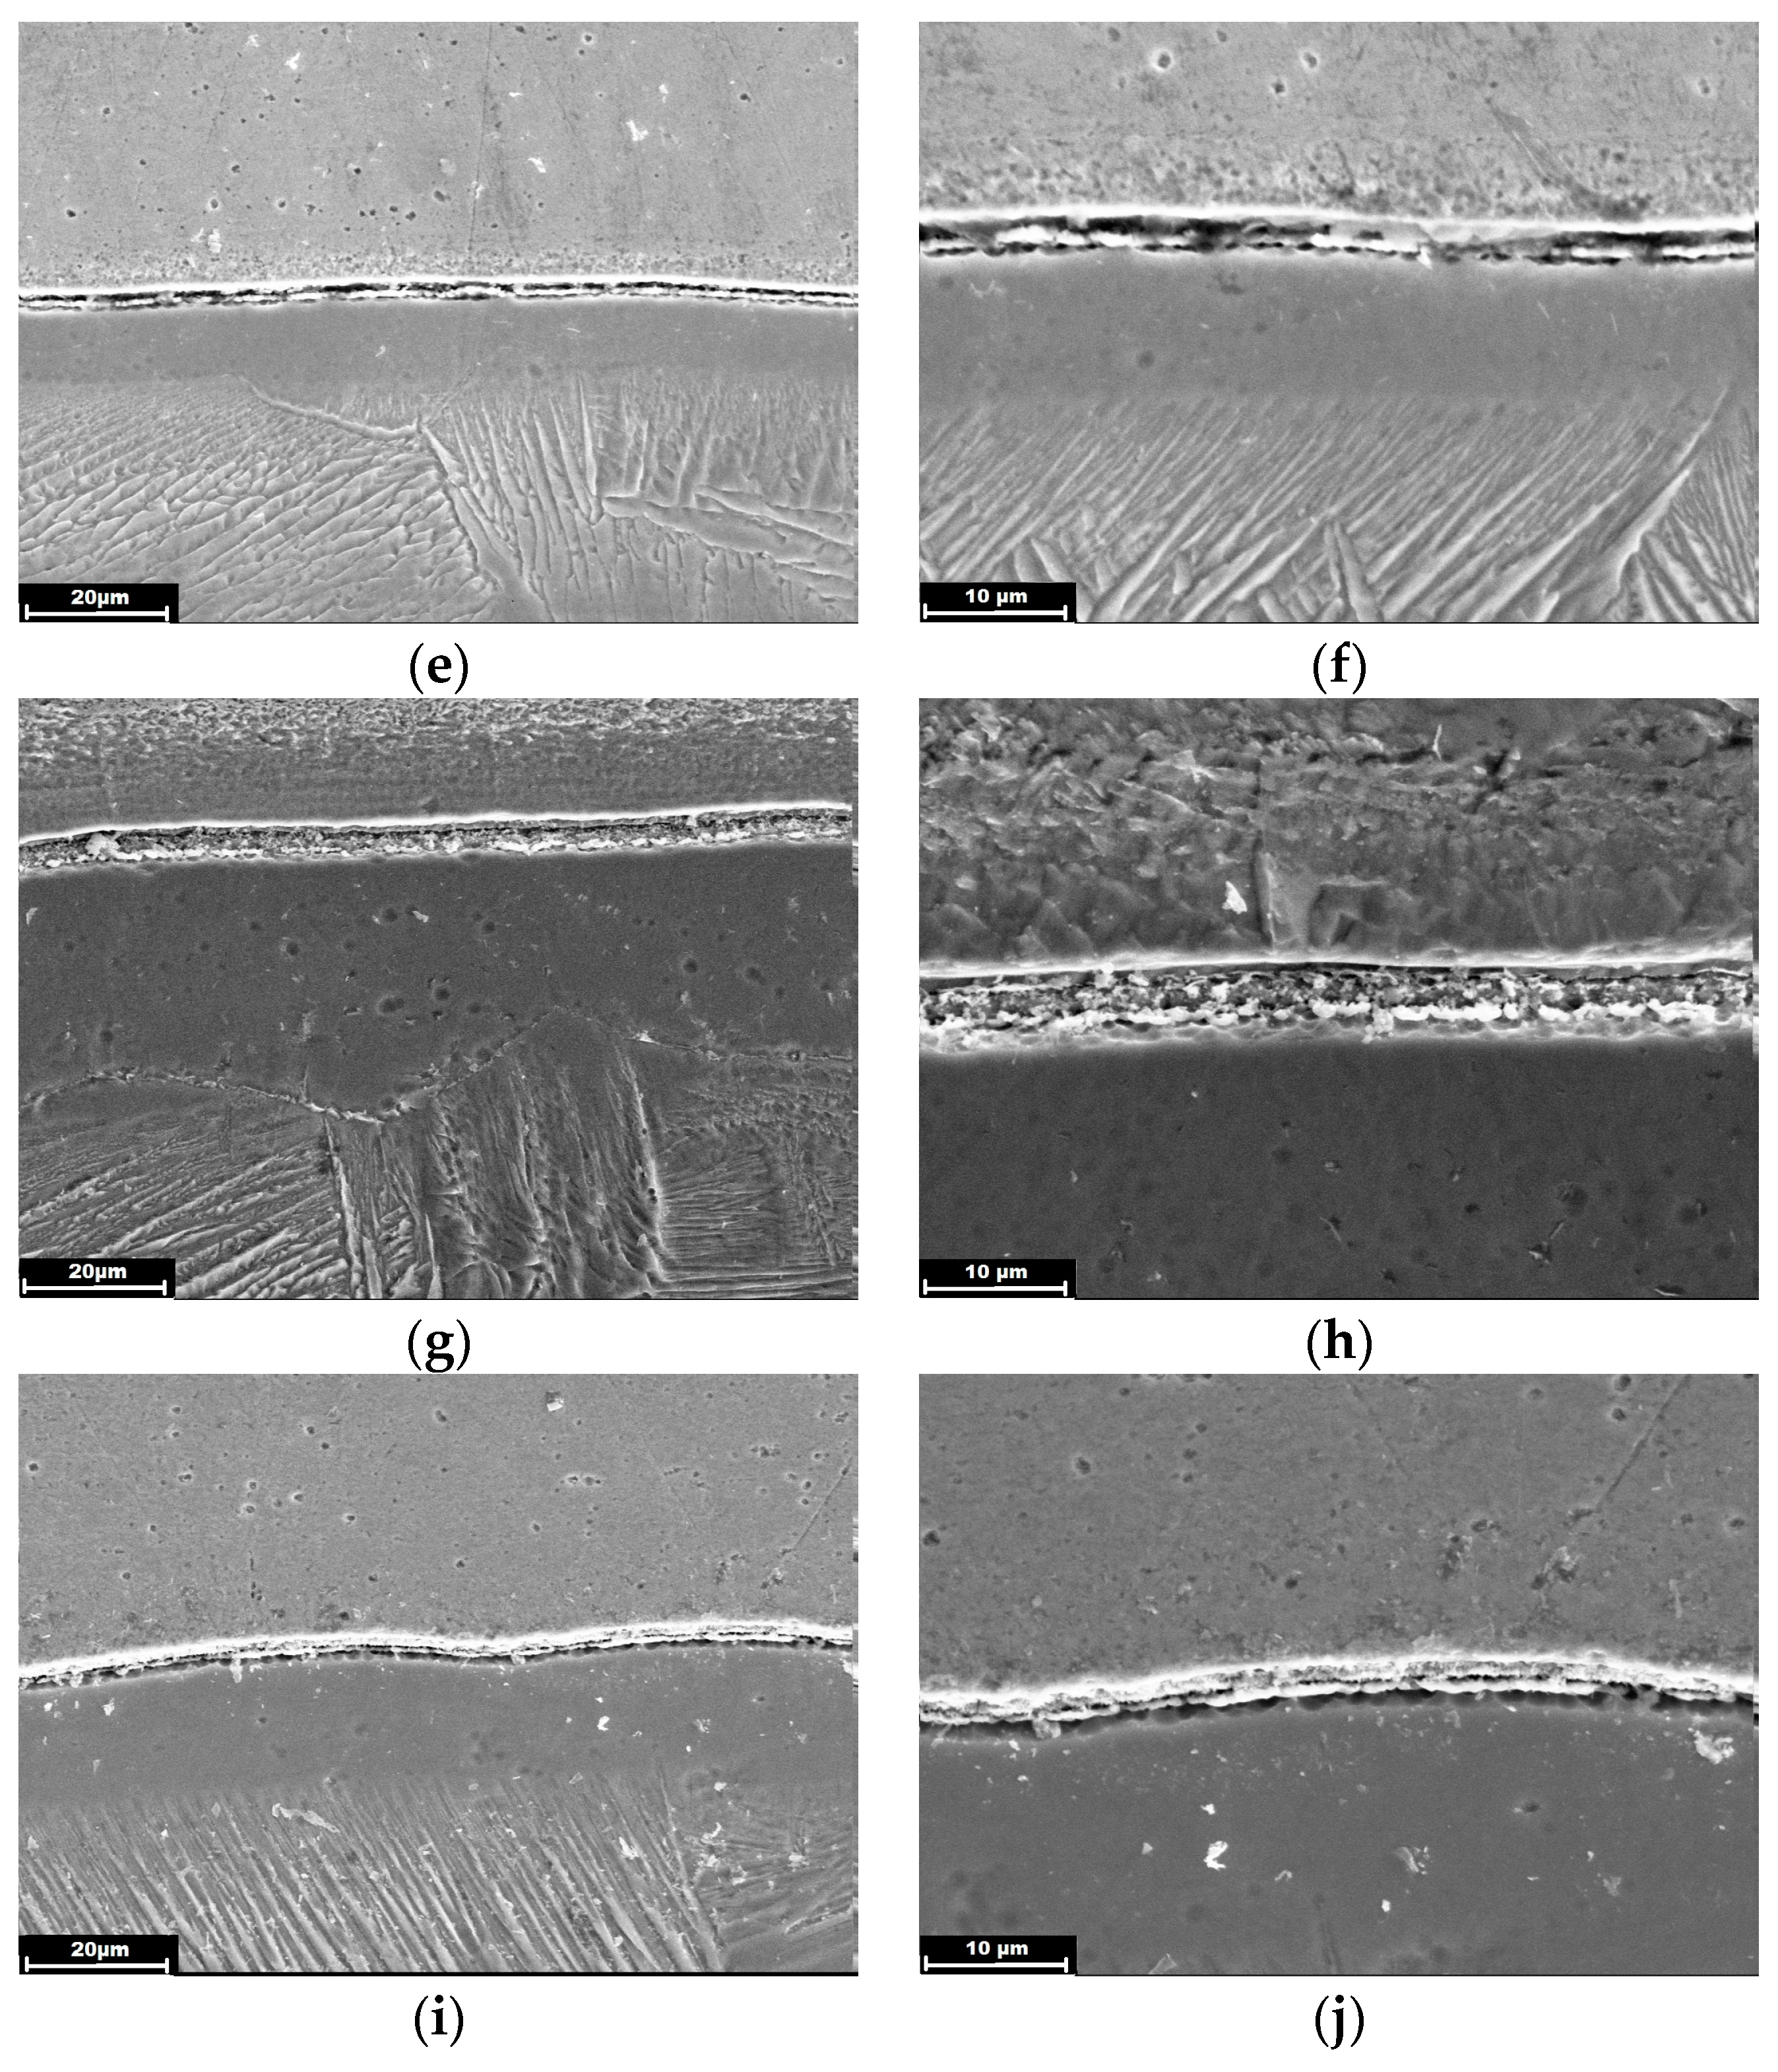
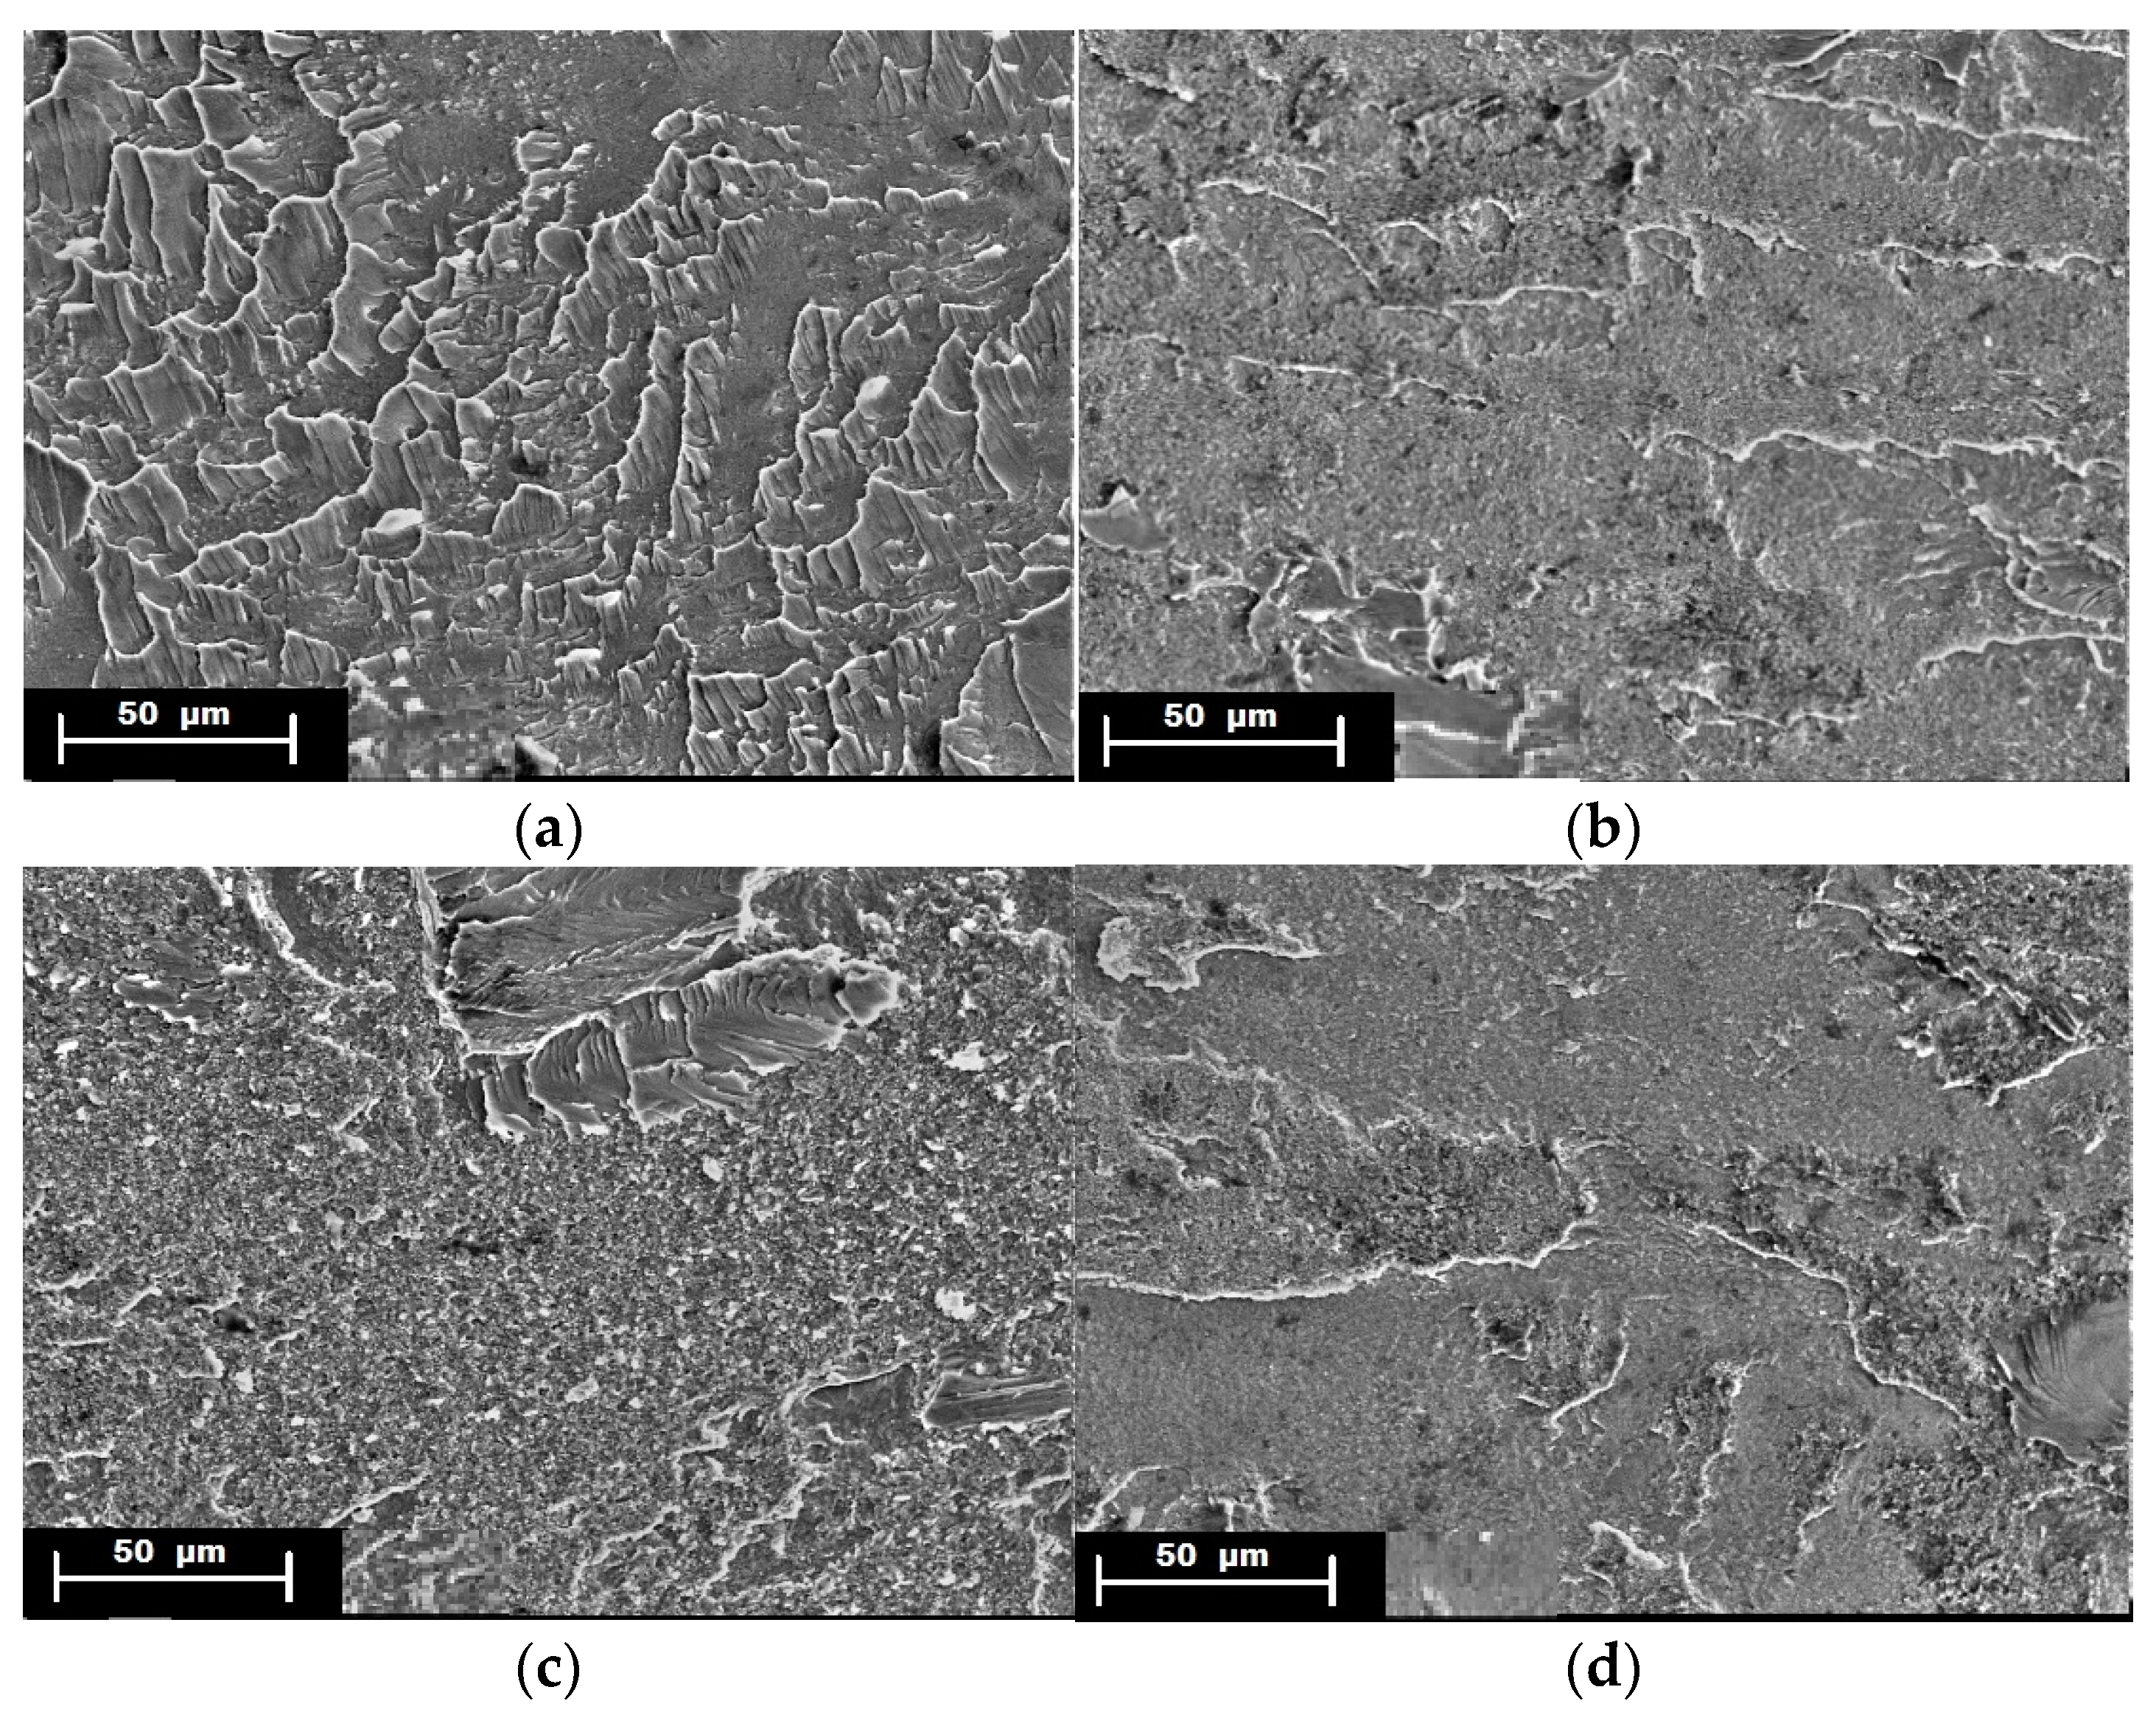
As the size of the intermetallic layers was equal to just several micrometers (5…10 µm), which is much less than the spatial resolution of the diffractometer, determination of the type of phases comprising the layers was performed on the end face of samples previously broken through the joint zone (
Figure 14).
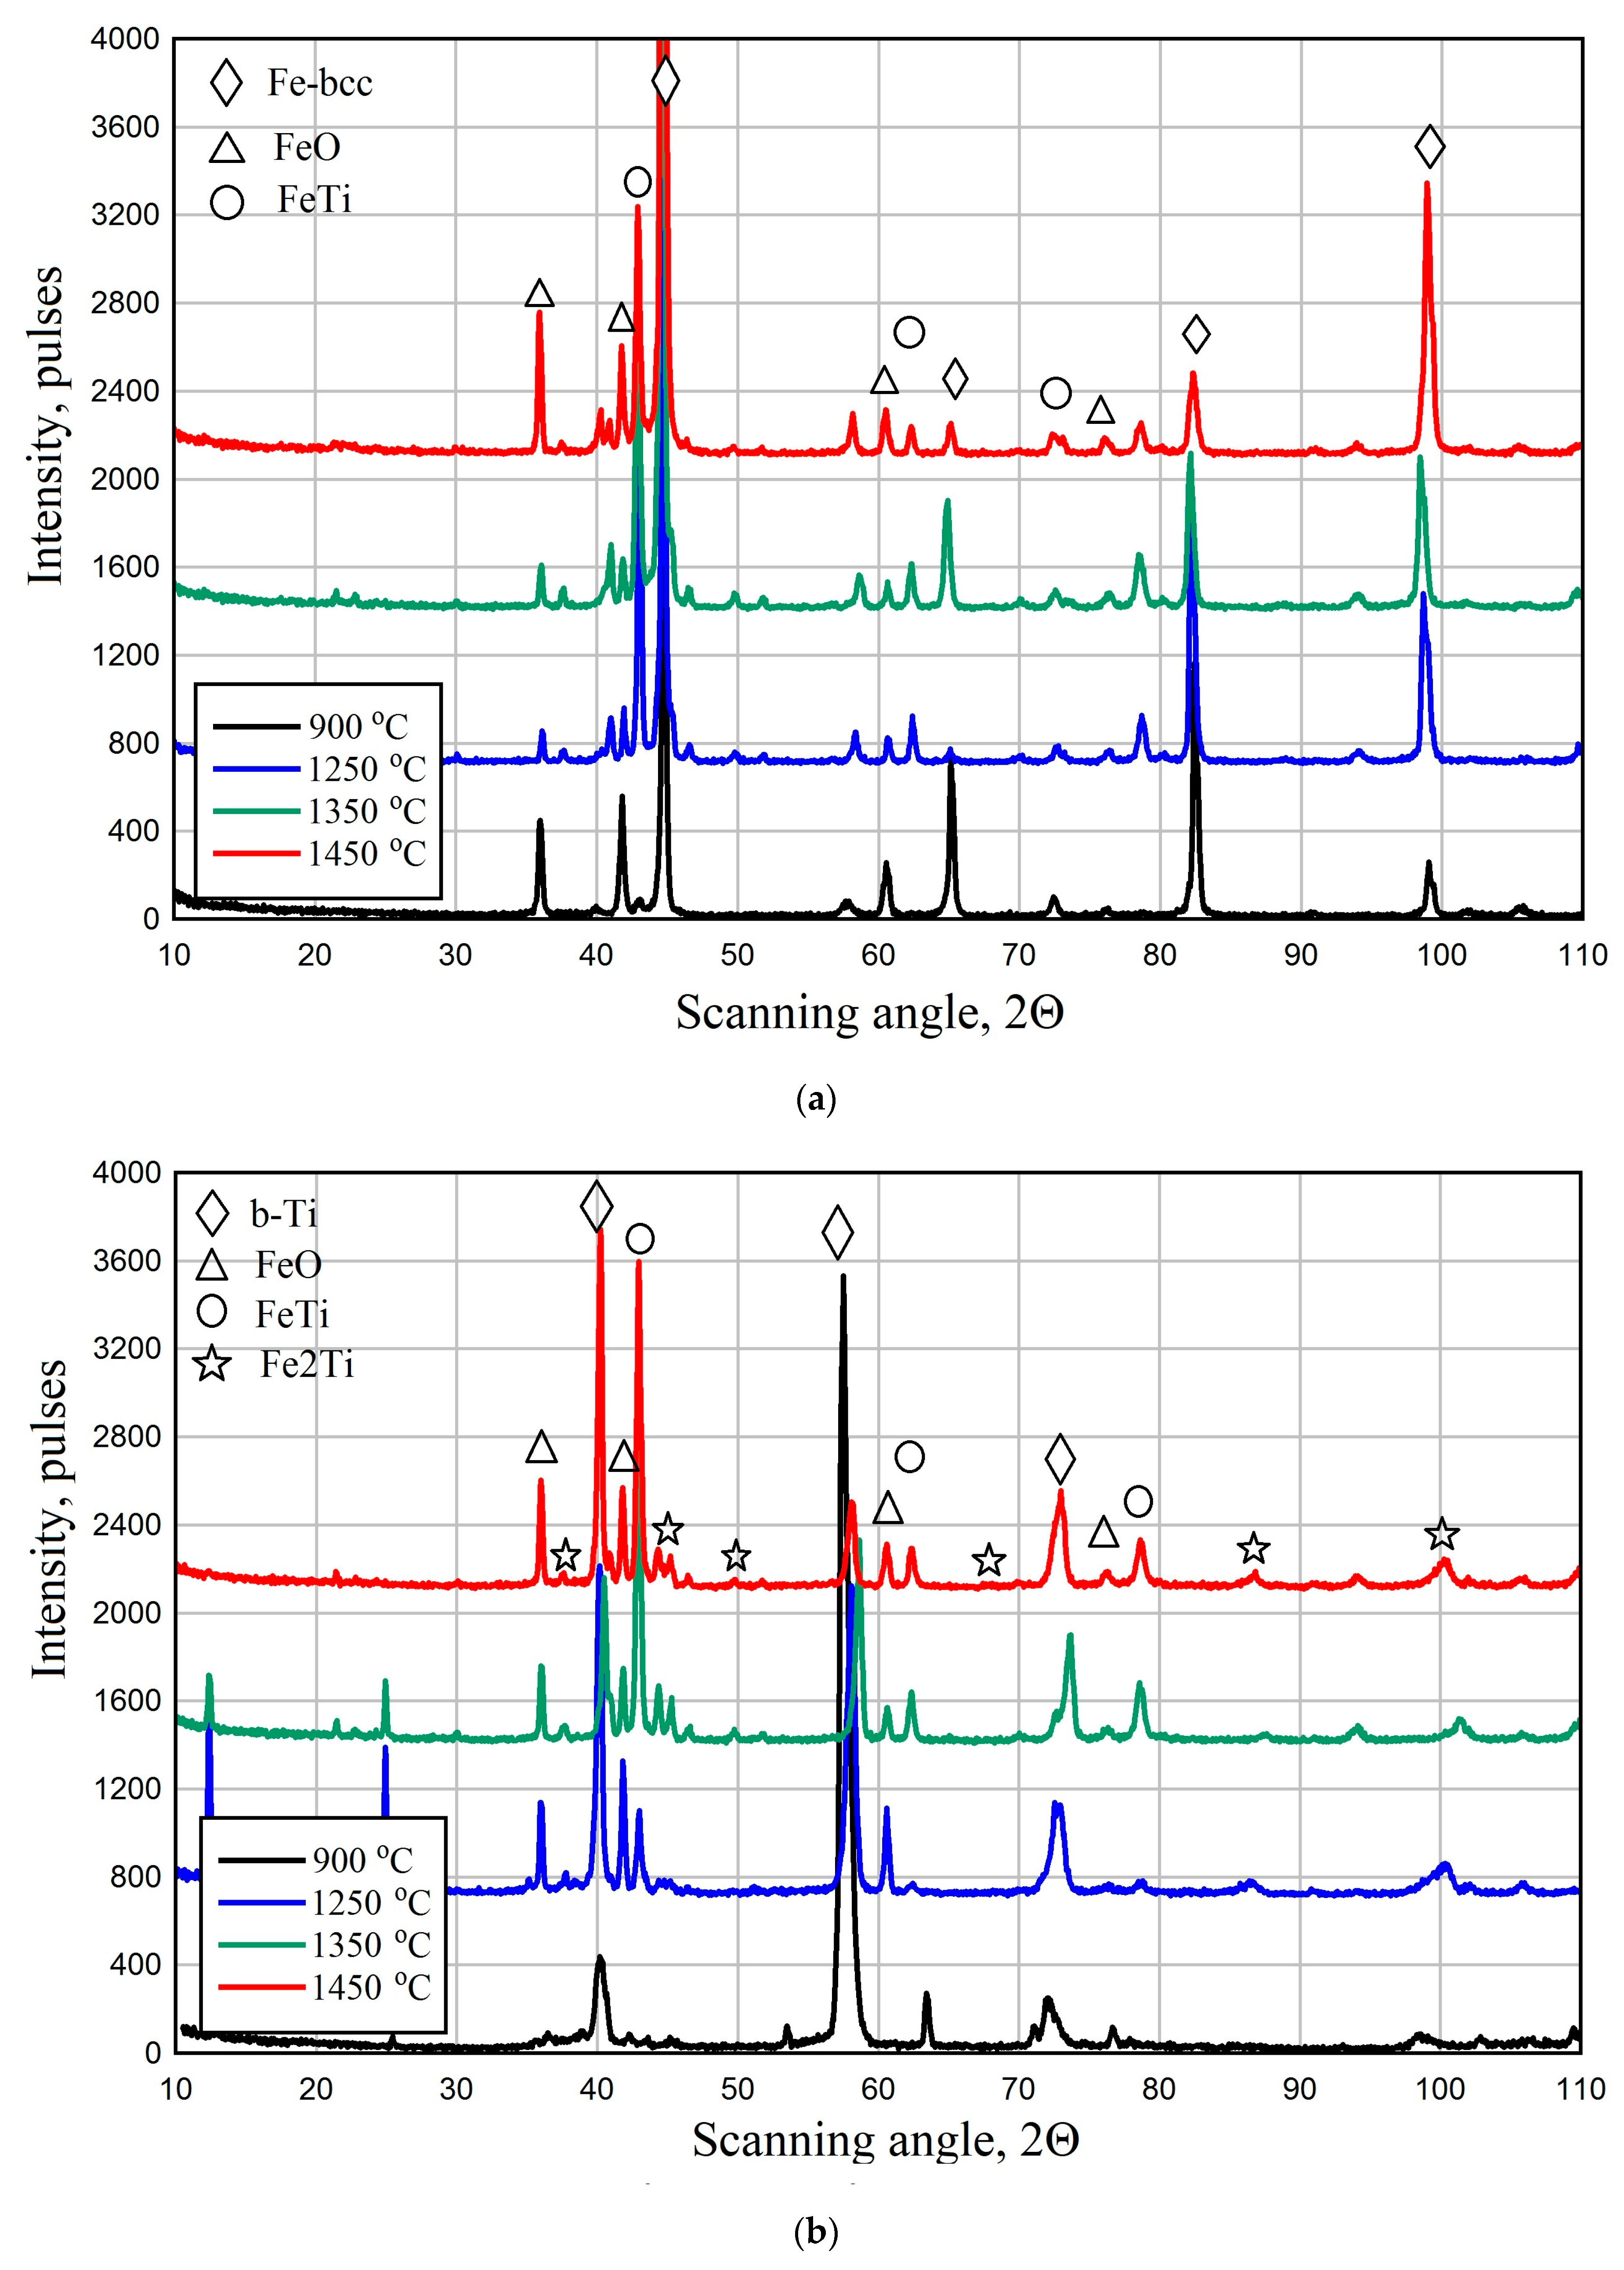
After sample-breaking in the steel–titanium joint zone, X-ray structural studies of the formed surface were conducted both from the steel side and from the titanium side. These studies showed the evolution in the change in the phases comprising the layers during heat treatment (
Figure 15). Based on the data from the X-ray structural analysis, phase composition of these layers essentially depends on the heat treatment temperature, but it is mainly determined by their location from this or that side of the joint zone. It is found that phases in which iron prevails in their composition, namely pure iron (α-Fe), iron oxide FeO, and FeTi, form from the steel side, whereas phases with a higher titanium content, namely pure titanium (β-Ti), Fe
2Ti, FeTi, and FeO, form from the titanium side, which is related to the diffusion processes of element redistribution during heating.
A study of the derived results from the quantitative phase analysis showed (
Table 4), that in the samples from the steel side, an increase in heat treatment temperature (900→1250→1350→1450 °C) leads to an increase in the α-Fe fraction from 65.58% to 76.09%, FeTi fraction from 0% to 45.92% (sample № 3), and a reduction in the iron oxide fraction from 34.42% to 5.73% (sample № 3). The lattice size becomes greater after heating to 900→1250 °C and remains almost unchanged further on.
In the samples from the titanium side (
Table 4), the fraction of the FeTi intermetallic phase increases up to 44.22% (sample № 4) and that of the Fe
2Ti phase up to 9.71% (sample № 3) with an increase in the heat treatment temperature. The quantity of FeO iron oxide remains almost at the same level, 17.95% (sample № 1) and 14.21% (sample № 4). Presence of iron oxide, in all probability, is related to air entering the samples during their cooling after heating. Iron remains (up to 1%) are found on the surface of the samples, taken from the titanium side, which is probably related to nonuniform propagation of the crack along the layer boundary.
Thus, these studies showed the presence of FeTi and Fe
2Ti phases in the produced joints. Other phases (for instance, of Ti
xFe-type) were not found. Analysis of lattice parameters of the phases studied showed that strong diffusion processes take place in the steel–titanium joint zone, as a result of which FeTi- and Fe
2Ti-type phases are “alloyed” to a considerable degree, leading to a marked change in crystalline lattice parameters. It is known from publications (for instance, [
31,
32]) that steel–titanium joints are prone to formation of fatigue cracks of predominantly transcrystalline type. We can assume that a change in crystalline lattice parameters promotes development of significant internal stresses and further brittle fracture in the joint zone in service. Studying the formation of residual stresses in the welded materials from the titanium side and the steel side can be a prospect for further research.
Results of the research performed can be used for selecting the modes for fusion welding of butt joints of steel–titanium bimetal plates, together with choosing the technologies for manufacturing steel–titanium bimetal pipes (for instance, for the main pipelines used in transporting hydrocarbon media—oil and gas) from the respective bimetal plates with application of fusion welding methods. It is recommended to perform industrial welding of such joints with selection of the methods and in the modes where the heat input is equal to 200…400 J/mm. During the time of up to 10–12 s, the heating temperature in the 1.5–3.5 mm wide HAZ will be equal to 900–1150 °C. It will promote formation of an intermetallic FeTi-type interlayer of less than 1–2 µm.

 ,
, 


