
Multi-Phase Field Method for Solidification Microstructure Evolution for a Ni-Based Alloy in Wire Arc Additive Manufacturing

Research Center for Structural Materials, National Institute for Materials Science, Ibaraki 305-0047, Japan
*
Author to whom correspondence should be addressed.
Metals 2022, 12(10), 1720; https://doi.org/10.3390/met12101720
Submission received: 31 August 2022
/
Revised: 7 October 2022
/
Accepted: 9 October 2022
/
Published: 14 October 2022
(This article belongs to the Special Issue Advances in Modelling and Numerical Evolution of Additive Manufacturing)
Abstract
:Wire arc additive manufacturing achieves high efficiency and low costs by using a melting wire for directional depositions. Thermal analyses and the finite element method have been applied to predict residual stress and the deformation of fabricated parts. For Ni-based alloy production, a method for predicting solidification microstructure evolution with segregation is needed in order to design precise heat treatment procedures. In this study, a multi-phase field method coupled with a CALPHAD database is developed to simulate the solidification microstructure evolution of a practical Ni-based alloy. Thermal analyses of a wire arc additive manufacturing model were performed by the process modeling of multi-pass depositions with a running cyclic arc. Solidification microstructure evolution was obtained using the temperature profile in each deposited layer by the multi-phase field method. These predicted microstructures are compared with experimental measurements. It is confirmed that the multi-phase field method coupled with the CALPHAD database is effective for predicting solidification microstructure and segregation in the engineering of Ni-based alloys.
1. Introduction
Additive manufacturing is increasingly being applied to industrial productions because it can provide small-batch customized structural components with high efficiency and low cost. Wire arc additive manufacturing (WAAM) is a form of additive manufacturing technology that fabricates three-dimensional components by cyclically layering the deposition of metal wires [1]. The fed wire is melted by an electric arc. WAAM has advantages over other additive manufacturing processes, such as laser or electron beam powder bed fusion (PBF) processes, for several reasons [2]. The equipment used for the WAAM process is the same as a traditional arc welding system; thus, it is quite simple. The wire alloy can be produced more inexpensively than, for example, the PBF powder required for the gas atomization method. Material and energy consumptions are more efficient than for PBF. Large-sized parts can be manufactured with a high deposition rate by WAAM. Despite these various advantages, however, WAAM also tends to generate excessive residual stress and distortion due to rapid repeated heating and cooling paths. These issues reduce not only the mechanical performance but also the efficiency of subsequent machinery manufacturing. Recently, the computation of simulations has been studied to tackle these issues. Thermal and elastic/plastic finite element methods (FEM) have also been developed to address these problems and have been applied to optimize the process’ conditions [3,4].
WAAM is also used for the production of Ni-based alloy components due to the above advantages. Ni-based alloys have improved characteristics, including corrosion resistance, tensile strength, and high-temperature strength and creep strength [5]. These alloys are widely used in components and structures for aeronautical, aerospace, and chemical applications. The excellent performance of Ni-based alloys is usually achieved by heat treatments for solution annealing and the precipitation of γ′ and/or carbide into the matrix, γ [6,7]. Kumar et al. reported that rapid repeated heating and cooling processes of WAAM caused not only residual stress and distortion but also different solidification microstructures depending on the depositing number [8]. These microstructure differences arise due to a deviation of temporal temperature distributions of the WAAM process. The different solidification microstructure is accompanied with different segregation solute compositions in the inter-dendrite region. The prediction of the segregation is significant for the precise design of the heat treatment of the annealing and precipitation. Thermal and elastic/plastic finite element methods do not allow for the prediction of the microstructure. Other approaches will be needed to solve this problem.
Currently, the multi-phase field method (MPFM) is used as a standard approach to simulate solidification microstructure evolution because it can estimate the interface’s driving force by coupling with the practical phase diagram or CALPHAD database of engineering alloys while also solving the solute element diffusion equation. In our past study of solidification microstructure evolution using interface non-equilibrium MPFM for PBF processes, it was shown that the interface’s non-equilibrium of the rapid solidification gradually increased over a cooling rate of 105 K/s during the PBF process [9,10,11]. In a thermal analysis for the WAAM process model that is explained in the following section, the cooling rate is estimated to be under 103 K/s. It is considered that the solidification microstructure of the WAAM process is mainly controlled by thermodynamically quasi-equilibrium or local-equilibrium conditions in the interface.
In this study, first, a thermal FEM analysis is performed under the condition of a single-pass and multi-layer deposition of the WAAM process model. Next, solidification microstructure evolution using a quasi-equilibrium MPFM coupled with the CALPHAD database for the practical engineering of a Ni-based alloy is performed in each deposition layer, the temperature profile of which is obtained by the previous thermal analysis. Finally, the microstructure is quantitatively compared with experimental measurements in the deposition layers by primary dendrite arm spacing (PDAS).
2. Thermal Analysis
Thermal FEM analysis was performed using a geometrical model, as shown in Figure 1a, which was the same as an experimental model of WAAM. An experimentally geometrical condition was set as the movement of a single beat in the y-direction at the center of the x-direction on the x-y plane. For the analytical model, a half region for the x-direction was selected because the temporal temperature distribution could be considered symmetrical for the x-direction. Under the experimental beat condition, a single beat was cyclically moved in a single direction as a single path by ten layers, as shown in Figure 1b. The deposition size of one path was designed as 6 mm × 70 mm × 1.5 mm. In the symmetrical half model for FEM analysis, the width of the model was set as shown in Figure 1b. A birth–death model of FEM was applied for the melt deposition with a running torch [12]. ABAQUS software (version 2019, Dassault Systems Simulia Corp., Paris, France) was used in this analysis. The deposit layer was divided by a hexahedral element of a constant size at 0.5 mm × 0.5 mm × 0.5 mm. Physical constants of the Ni-based alloy and WAAM process conditions are shown in Table 1. The heat density per unit time was defined as , where V denotes voltage, I denotes electric current, and η denotes power efficiency. The initial system’s temperature was assumed to be at room temperature, 25 °C. The arc power efficiency value, η = 0.2, was decided by comparing melt pool sizes in the first layer between FEM analyses and experimental measurements, and they are considered as approximately the same as each other.
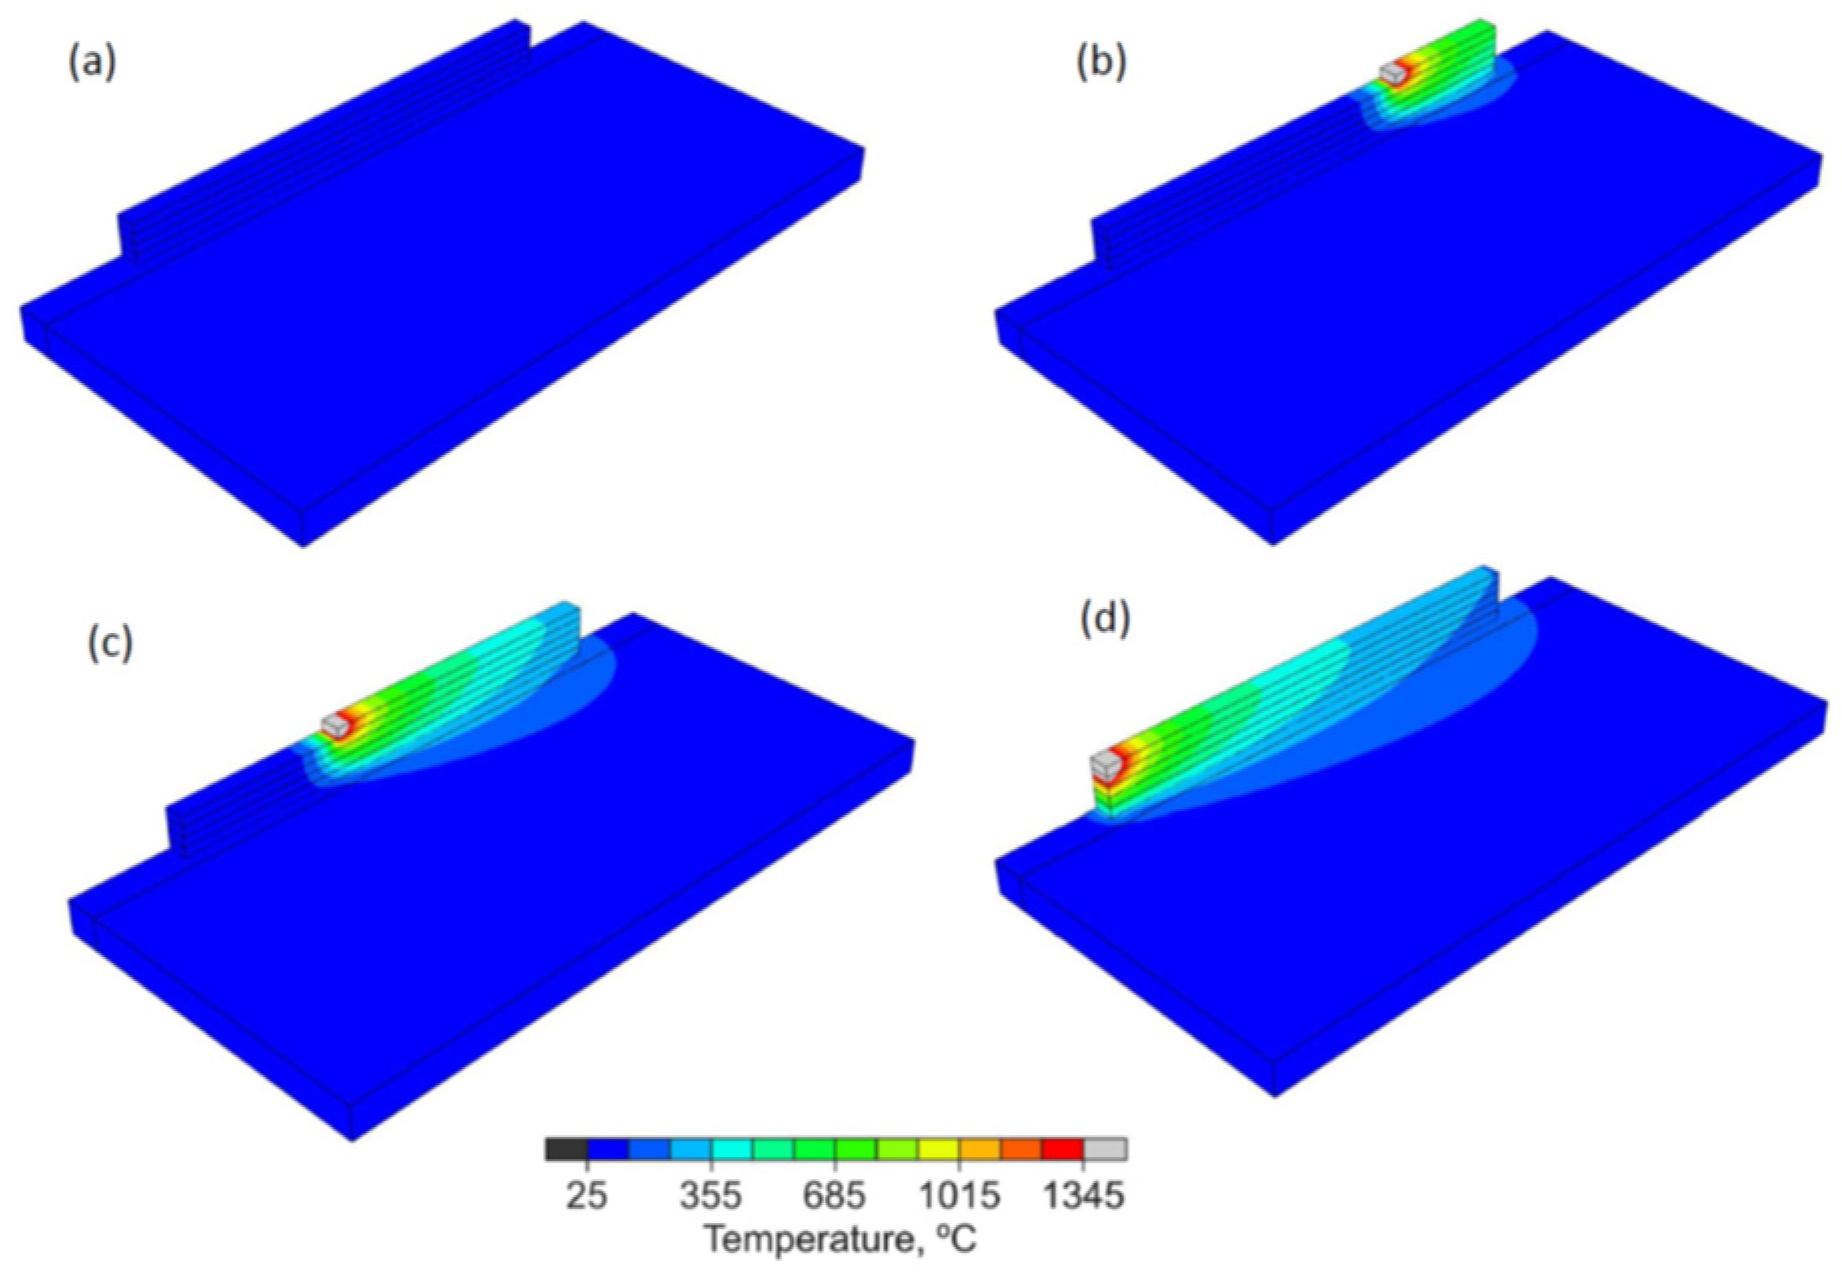
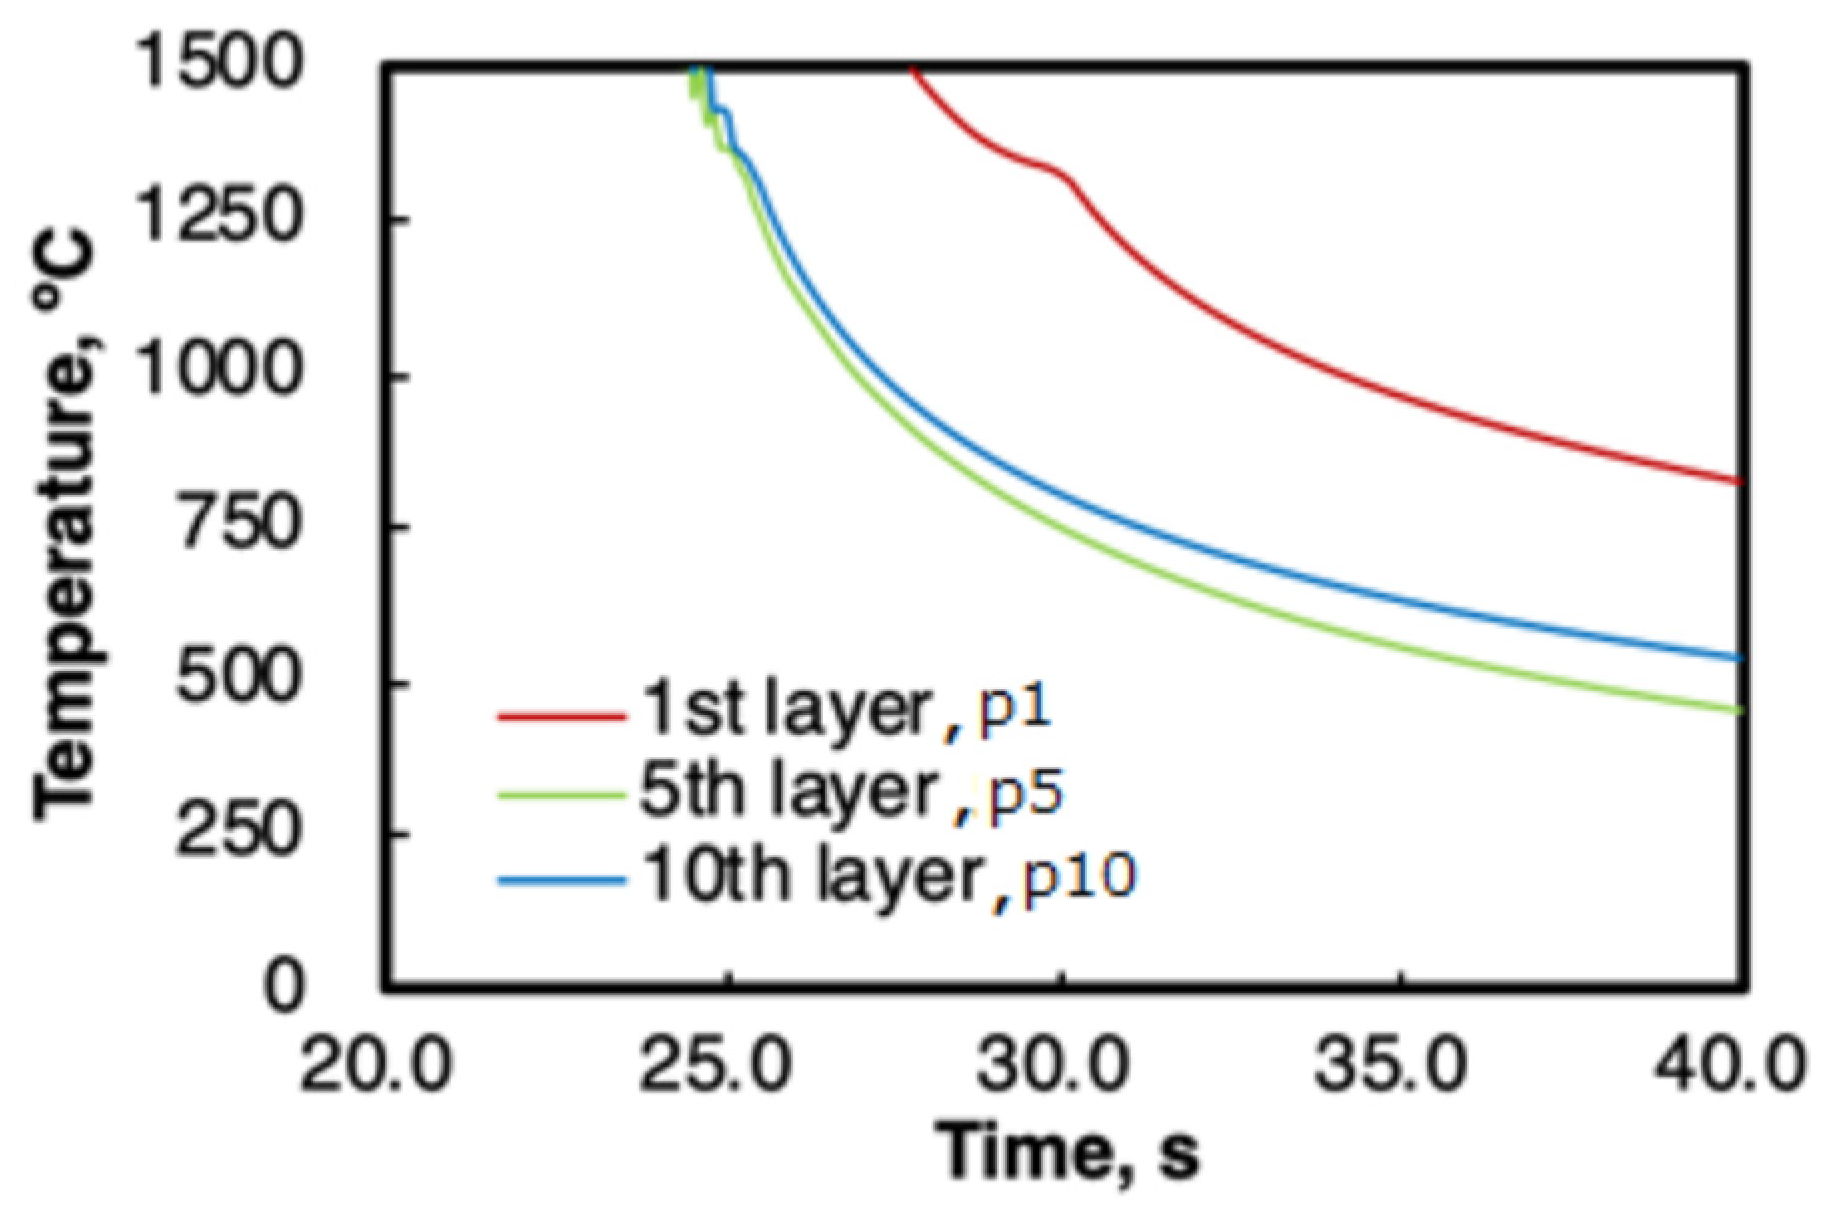
Snapshots of the temperature distributions at times 0 s, 15 s, 30 s, and 45 s are shown in Figure 2. The deposition of melted wire is piled with torch traveling velocity by cyclic layer. As the arc heat is continuously input, the temperature is distributed by diffusion from the torch position where the maximum temperature is maintained at each moment during deposition. Figure 3 shows the temporal temperature variations after depositions at the centers in the first, fifth, and tenth layers—numbers p1, p5, and p10, respectively—as indicated in Figure 1b. The temperature at each layer position decreases with time as thermal diffusion processes advance. The temperature curve of the lower layer numbers is located at a higher temperature range than the curve for the higher layer numbers, because continuously provided heat by the traveling arc produced a high temperature relative to the substrate. The cooling rate and temperature gradient values estimated from the profiles in Figure 3 were used for MPFM solidification microstructure evolutions in the following section.
3. Multi-Phase Field Method Coupled with the CALPHAD Database
In this study, an MPFM program was developed to predict solidification microstructure evolution and solute segregation for the practical engineering of a Ni-based alloy composed of nine elements. This methodology will provide a precise design for heat treatment after WAAM production. The reason why MPFM was selected for microstructure evolution was that it permitted considerations of the curvature effect, solute partitioning, and driving forces in the phase interface by one equation defining the diffuse interface assumption that was functionally coupled with the solute diffusion equation, the diffusivity of which was also estimated using a diffusion mobility database [13].
Initially, the chemical potential equation using the CALPHAD database for γ and γ′ of a Ni-based alloy consisting of nine elements, C, Al, Co, Cr, Fe, Mo, Ni, Si, and Ti, which described the free energy for the unit sub-lattice model, was derived as follows [11]:
where is the free energy of the unit sub-lattice system, in which and are site-fractions of the first and second sub-lattice for substitutional elements, Al, Co, Cr, Fe, Mo, Ni, Si, and Ti, respectively. and are site-fractions of the third sub-lattice for interstitial C and vacancy, respectively. is the molar fraction of each element, i = C, Al, Co, Cr, Fe, Mo, Ni, Si and Ti. The symbols m, n, and l are site numbers of the first, second, and third sub-lattice, respectively. For the liquid phase, the site-fraction equals the mole fraction for each element in a single lattice.
A multi-phase field method that is based on quasi-equilibrium assumptions and that is called the KKS model was applied in this study [14]. The quasi-equilibrium obeys the parallel tangent law that is schematically shown in Figure 4 [15]. The parallel tangent law is the equal diffusion potential of an element between phases at a point in the interface region, which is expressed as follows:
where i indicates the solute element. α and β are the liquid phase and γ phase. Note that γ′ was not considered in this study. The diffusion potential is defined using the chemical potential in Figure 4 as , in which Ni is selected as the solvent element. The MPFM equation is expressed as follows:
where is the order of phase α that is defined as . is the interfacial energy between the β and k phases. is the phase field interface mobility between α and β. is the interface driving force between α and β that is the difference of the parallel tangents in Figure 4. is the molar free energy. is the phase field interface width. N is the number of occupied phases at a point in the interface region.
Molar fraction of the solute element in the interface region is obtained by solving the following diffusion equation:
where is the diffusivity of solute element i for solute element j in phase α. The diffusivity value was supplied from the mobility database MOBNI of Thermo-Calc software (version 2021b, Thermo-Calc Software AB, Solna, Sweden) [16]. Molar fractions and of the solute element obtained by solving Equation (4) were input to solve Equation (2). By using the TQ-Interface function of Thermo-Calc software, the site fraction of elements in sub-lattice , free energy , and derivation of free energy by site-fraction are obtained by inputting the molar fraction of phase, into Equation (1). The thermodynamics database TCNI of Thermo-Calc was used for Equation (1) [17]. Equation (2) was solved and found to be convergent by the Newton–Raphson method. The two-dimensional finite difference method of the regular grid was applied for solving Equations (3) and (4). The antitrapping current and mobility correction algorithms were implemented in Equations (3) and (4), respectively, in the present study [18]. These algorithms correct errors caused by the assumption of a phase field finite diffuse interface. Zero gradient conditions for Equations (3) and (4) were applied to all boundaries.
4. Solidification Microstructure Evolution
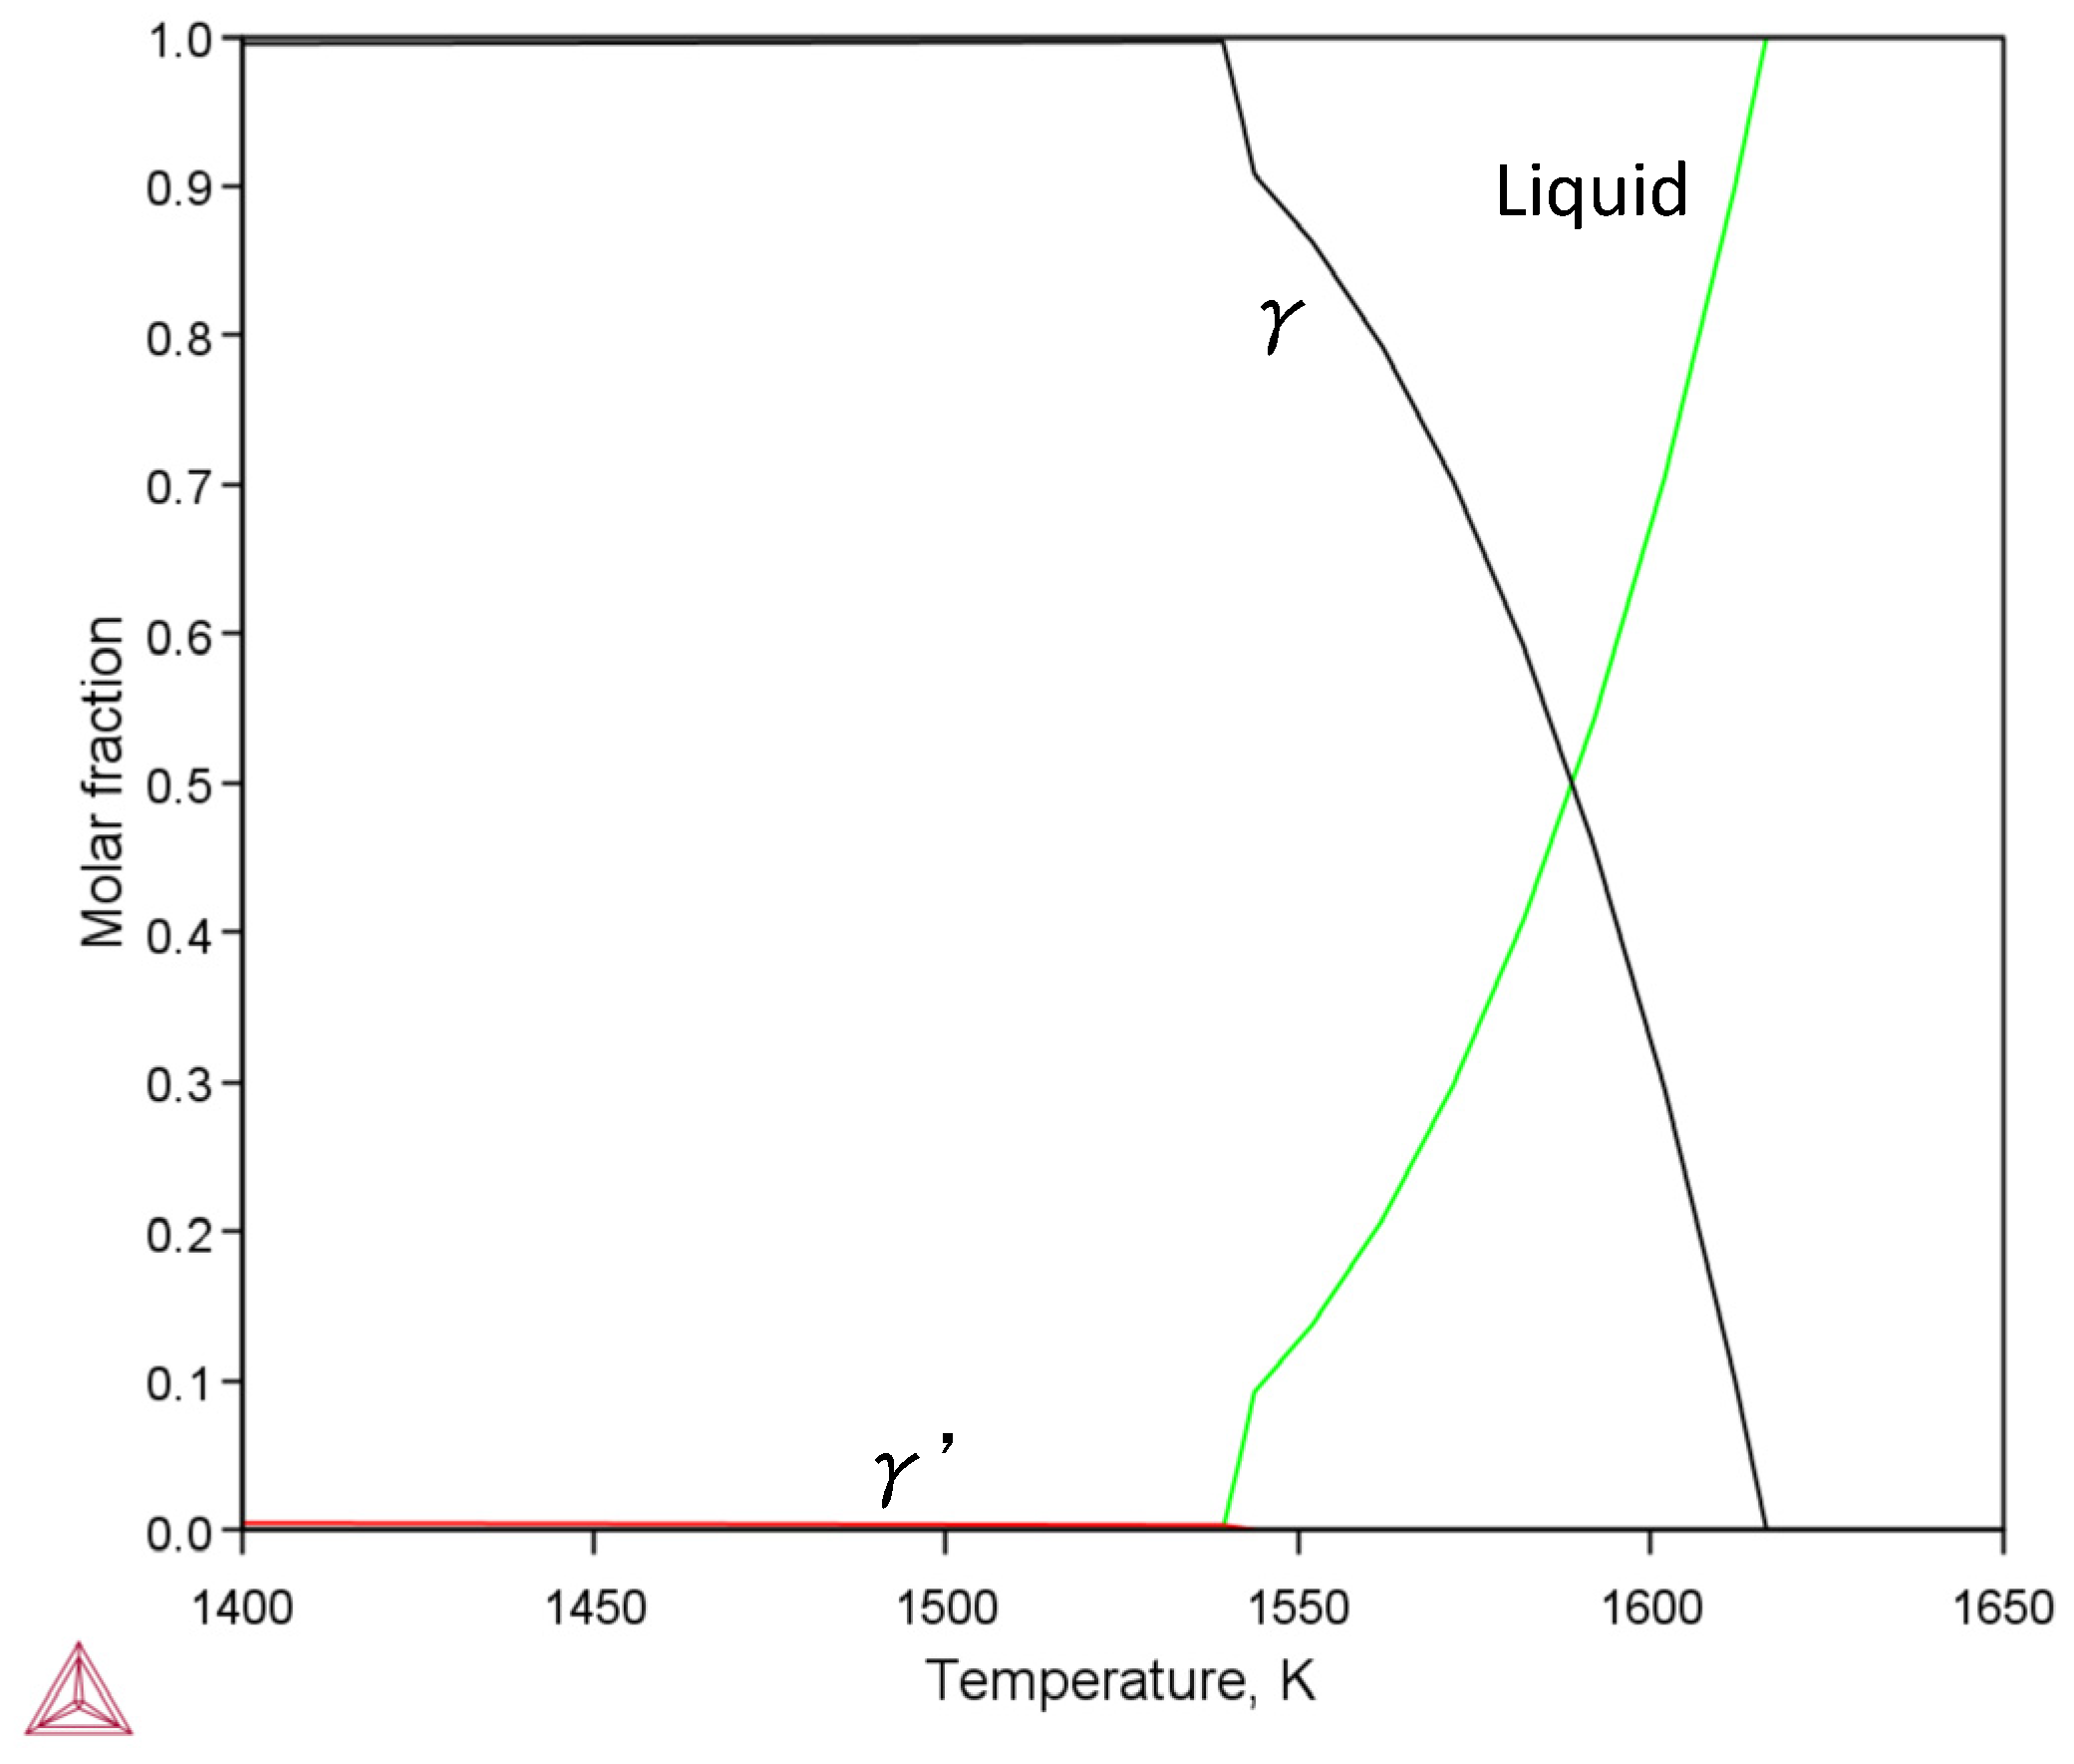
The composition of the Ni-based alloys in the experiment and the MPFM simulation of this study are shown in Table 2. Equilibrium phase fractions for temperature by Thermo-Calc calculation are shown in Figure 5. From these calculations, γ was considered to be dominant in the solidification microstructure. This was also confirmed by experimental measurements. It was predicted that the solidification of γ started at 1616.4 K (1343.4 °C). This temperature was used to start MPFM calculations. The cooling rate and temperature gradient values for MPFM conditions were estimated by an approximately linear line from 1200 °C to 1400 °C in Figure 3, as shown in Table 3. In present MPFM calculations, unsteady microstructure evolutions were performed in the narrow space of the melt pool even if using constant cooling rates and temperature gradients.
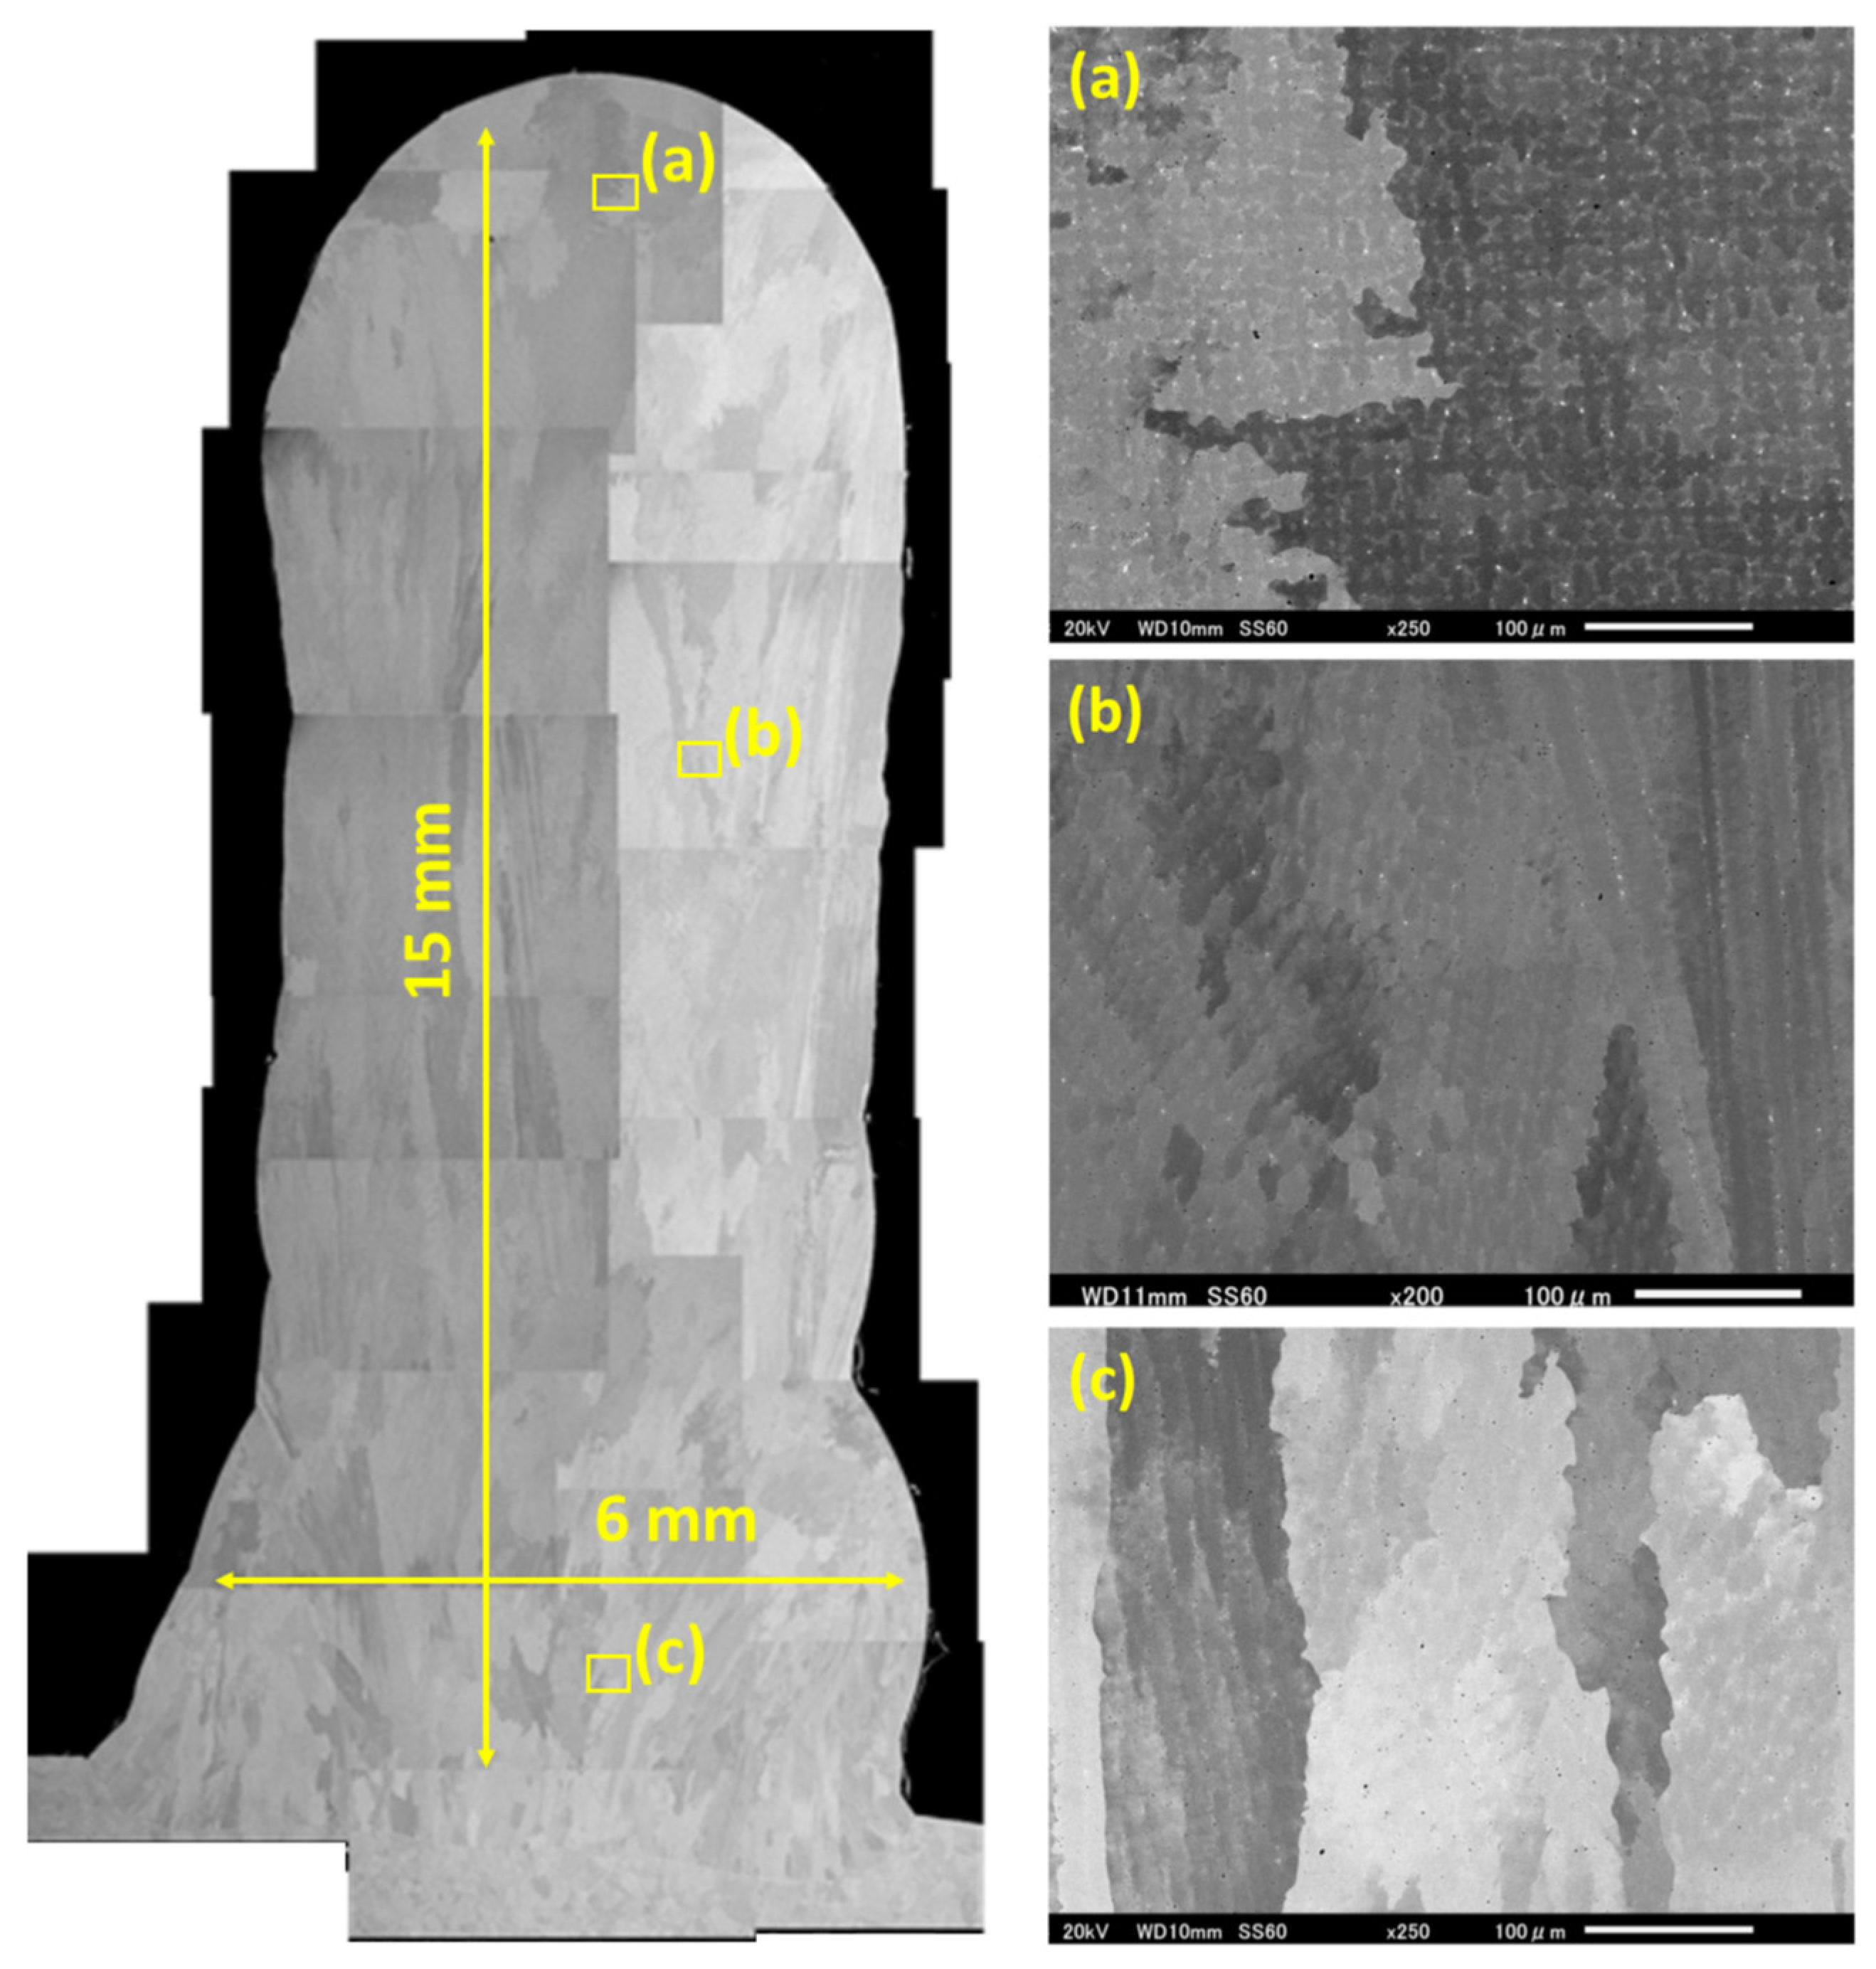
Figure 6 shows the experimentally measured WAAM microstructure on the cross-section that is perpendicular to the torch’s running direction. It was confirmed that the columnar structure was dominant except for the area around the surface, where it had a tendency to be an equiaxed structure. This characteristic of WAAM was also reported in the recent literature [8]. Columnar solidification microstructure evolution was performed in MPFM simulations.
MPFM microstructure evolution analyses for the condition of the tenth layer position (p10) in Table 3 were performed. Physical and numerical conditions are shown in Table 4. The initial γ was set on the bottom in the rectangular region as one grid height to simulate natural dendrite/cell growths from interface instabilities caused by constitutional undercooling [19].
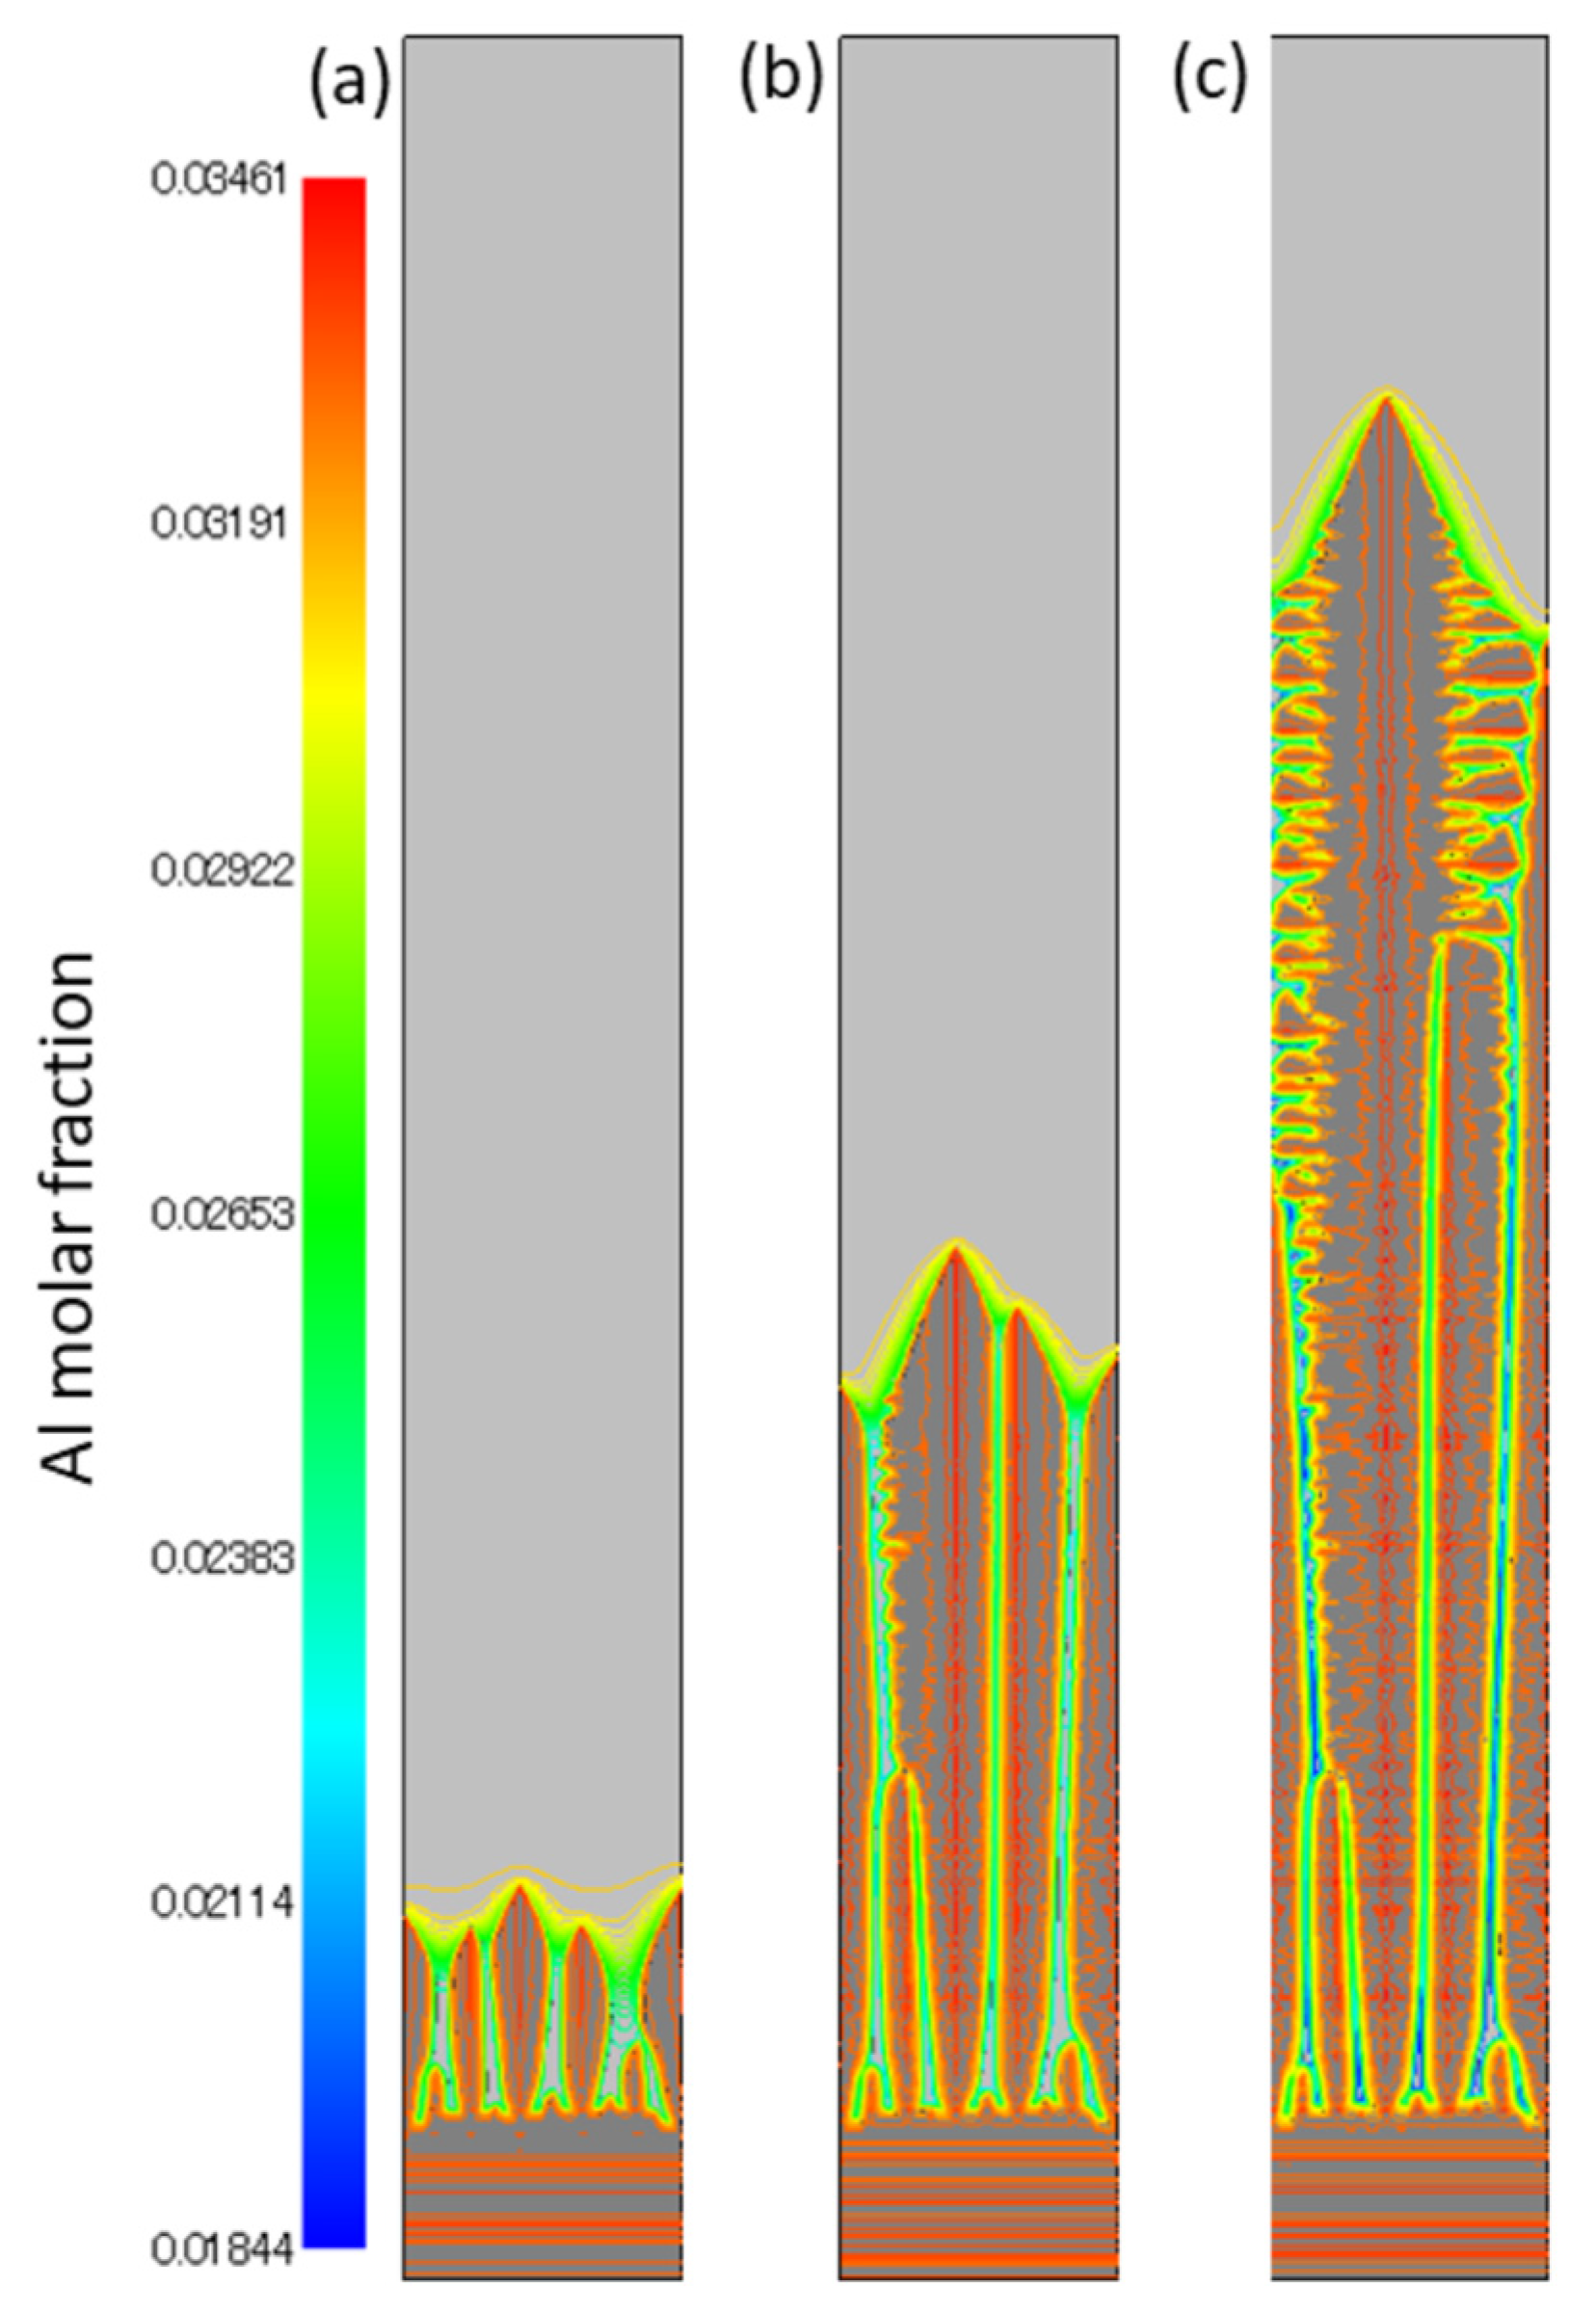
Temporal distributions of the Al molar fraction at 0.36, 0.44, and 0.54 s are shown in Figure 7 with phase distributions. It can be seen that the γ cell growth advances after the flat interface is broken due to interfacial instability. The dendrite grows with competition between cell growths. A secondary dendrite arm grows from 0.44 s due to an increase in instability on the cell side. The solute partitioning of Al in the interface increases with dendrite growth. The Al concentration in the inter dendrite is lower than that in the inner dendrite. Although the Al solid forms the FCC phase, Al is released from γ (FCC phase) to the liquid phase as the interface advances under the condition of the initial composition of the present Ni-based alloy.
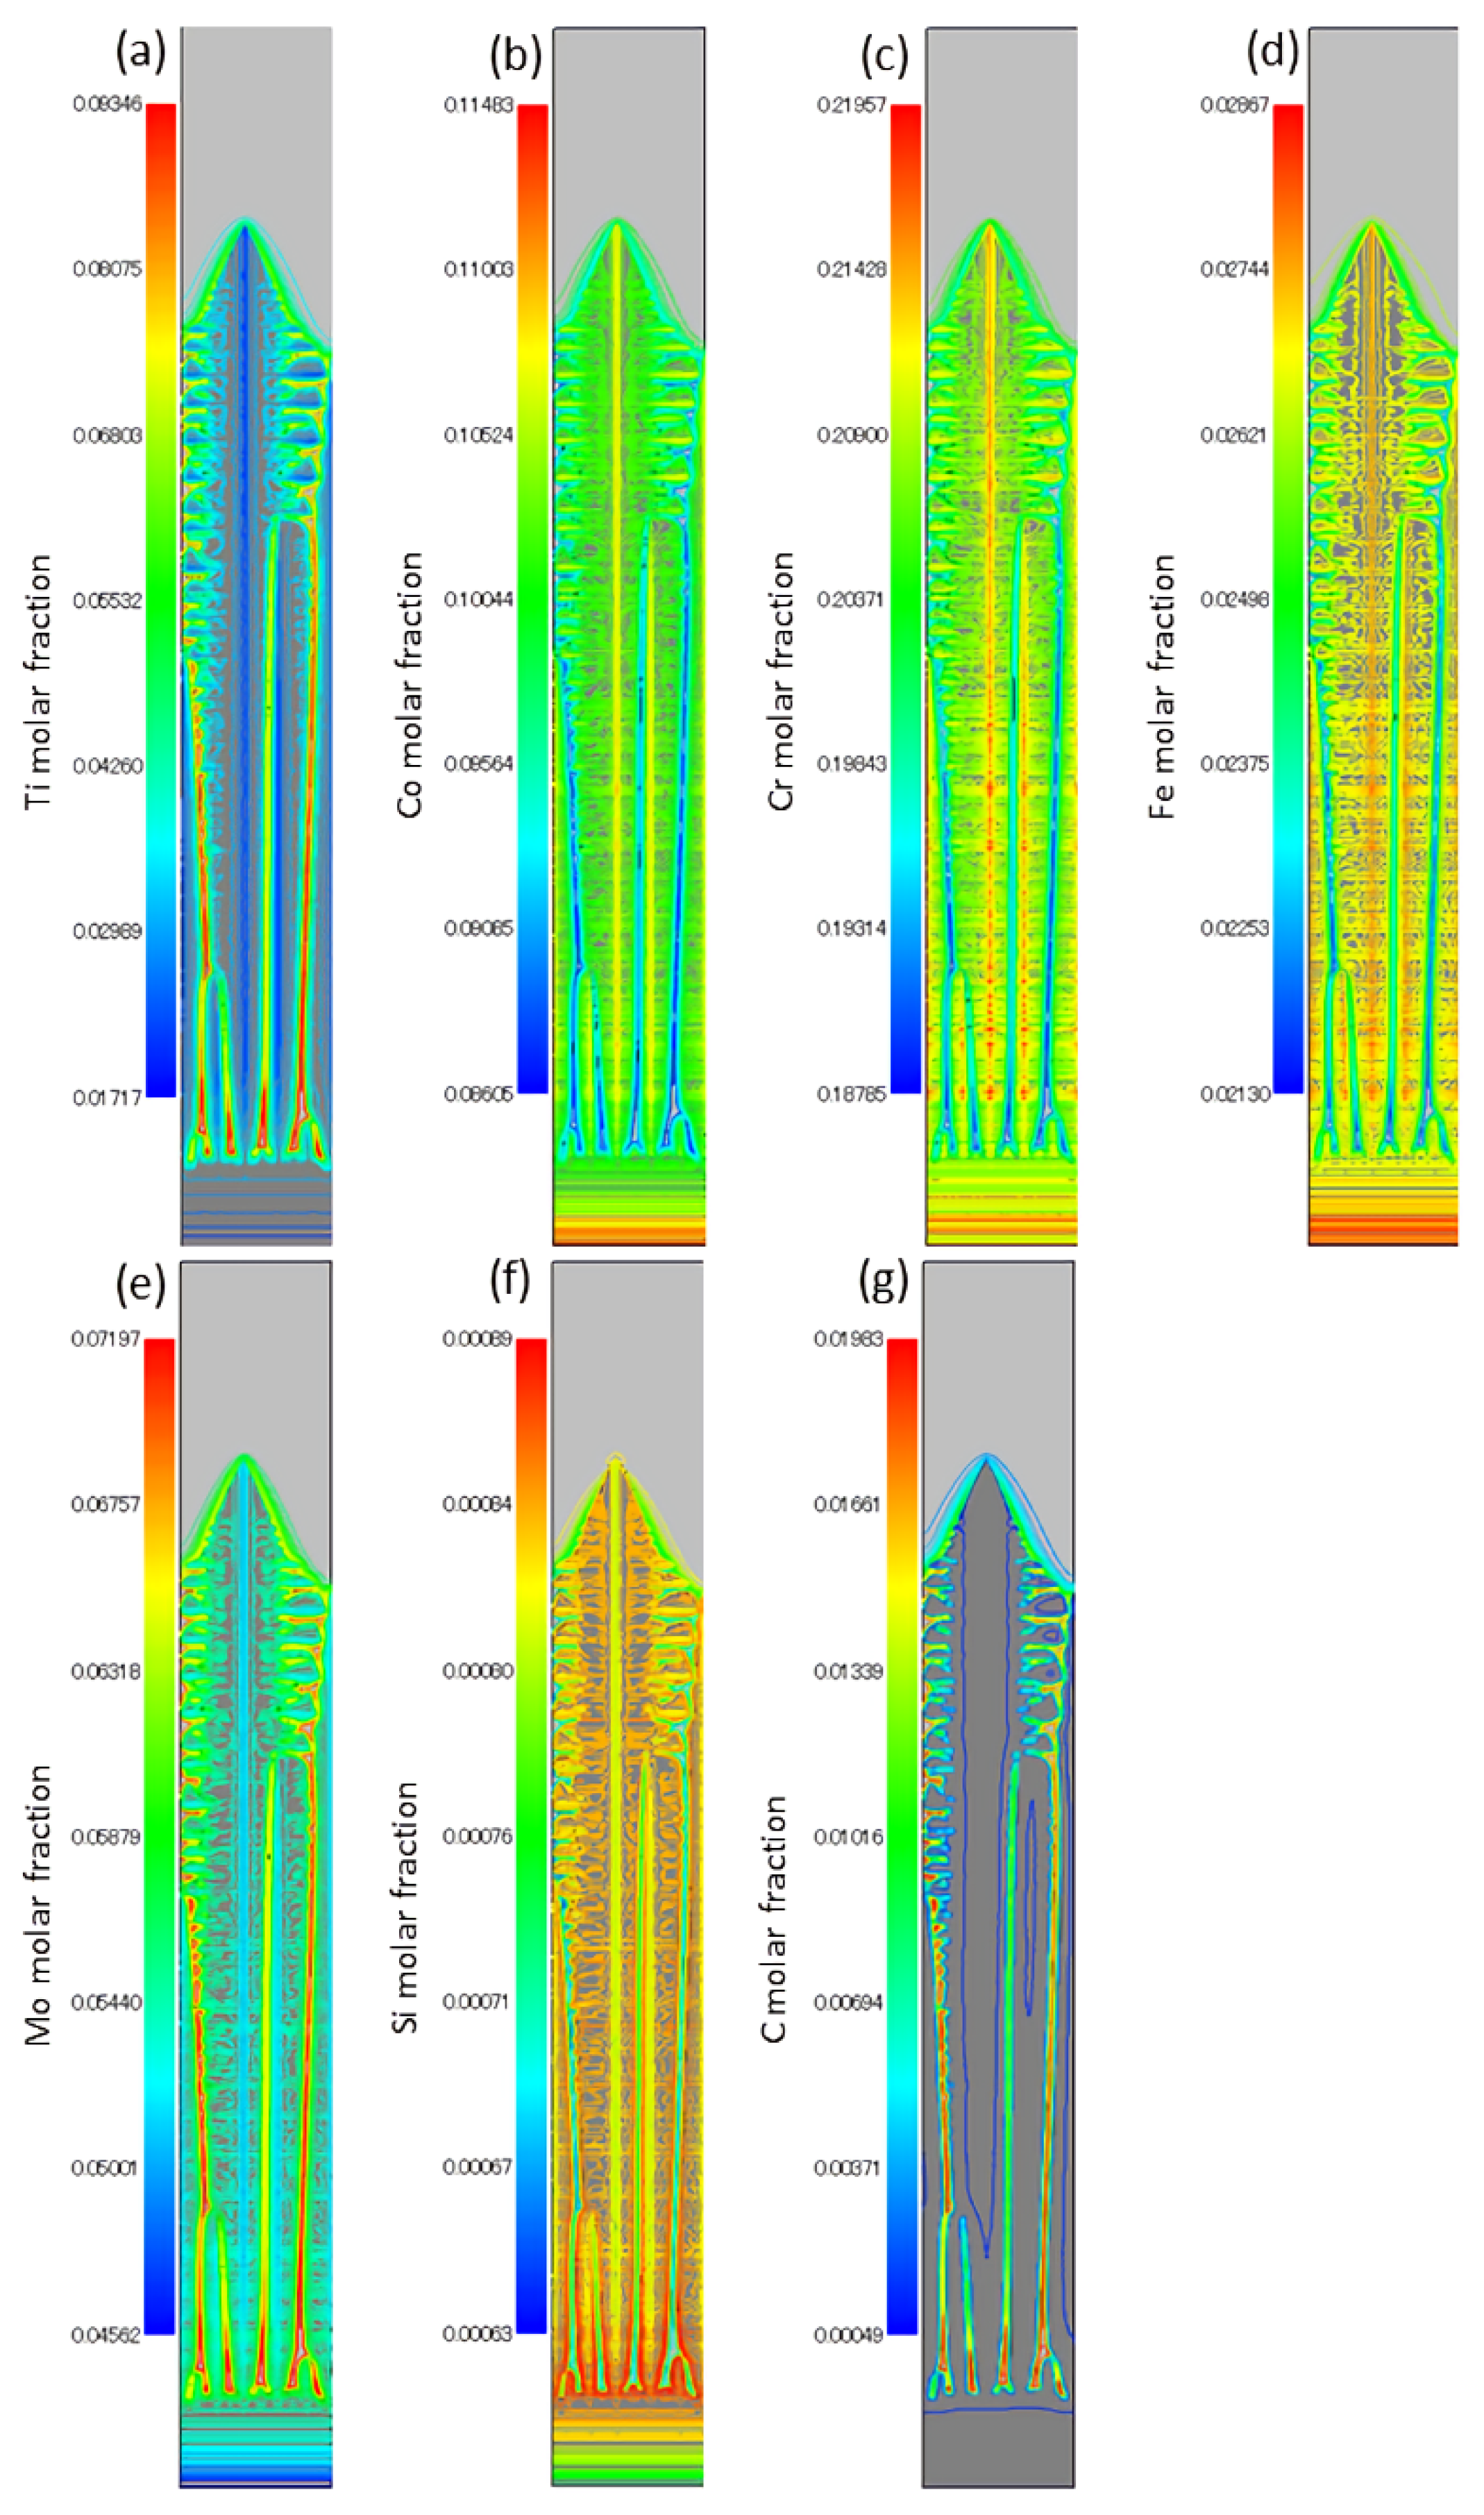
Molar fraction distributions of the seven other solute elements at 0.54 s are shown in Figure 8. It was confirmed that the solute’s partitioning in the advancing interface and solute element diffusion were normally simulated. Ti concentrations in the inter dendrite were higher than that in the inner dendrite. This is the opposite tendency compared to the previously mentioned Al element. It is well known that Ti encourages the formation of γ′ with Al [22]. These results may help explain why γ′ tends to nucleate in the inter or inner dendrite during solidification. Furthermore, obtained segregation values of elements can be used for heat treatment designs to precisely control γ′ or carbide precipitations. The chemical potential of each solute element contributing to the formation of γ′ is affected by other element concentrations. In this study, thermodynamic calculations using the CALPHAD database for engineering an alloy composition with a large number of elements provide rigorous estimations of the chemical’s potential values. Therefore, the MPFM coupled with the CALPHAD database can predict solute element segregation together with complex microstructures with high accuracy, as shown in Figure 8.
5. Comparison of Primary Dendrite Arm Spacing and Discussion
The length of the region of the previous MPFM simulation is too small in the horizontal direction to compare the primary dendrite arm’s spacing with the experimental measurement shown in Figure 6a–c. The MPFM conditions extending the horizontal length of the region are shown in Table 5. The horizontal length of the calculation region was chosen to obtain the averaged PDAS and to avoid the influence of the boundary condition on both sides for the horizontal direction in which the zero gradient condition was applied. The grid width for calculations in the one-layer position, p1, was set to twice the width of the other position to reduce the computation time by increasing the discrete time width. The normal result for the one-layer position was confirmed as shown below.
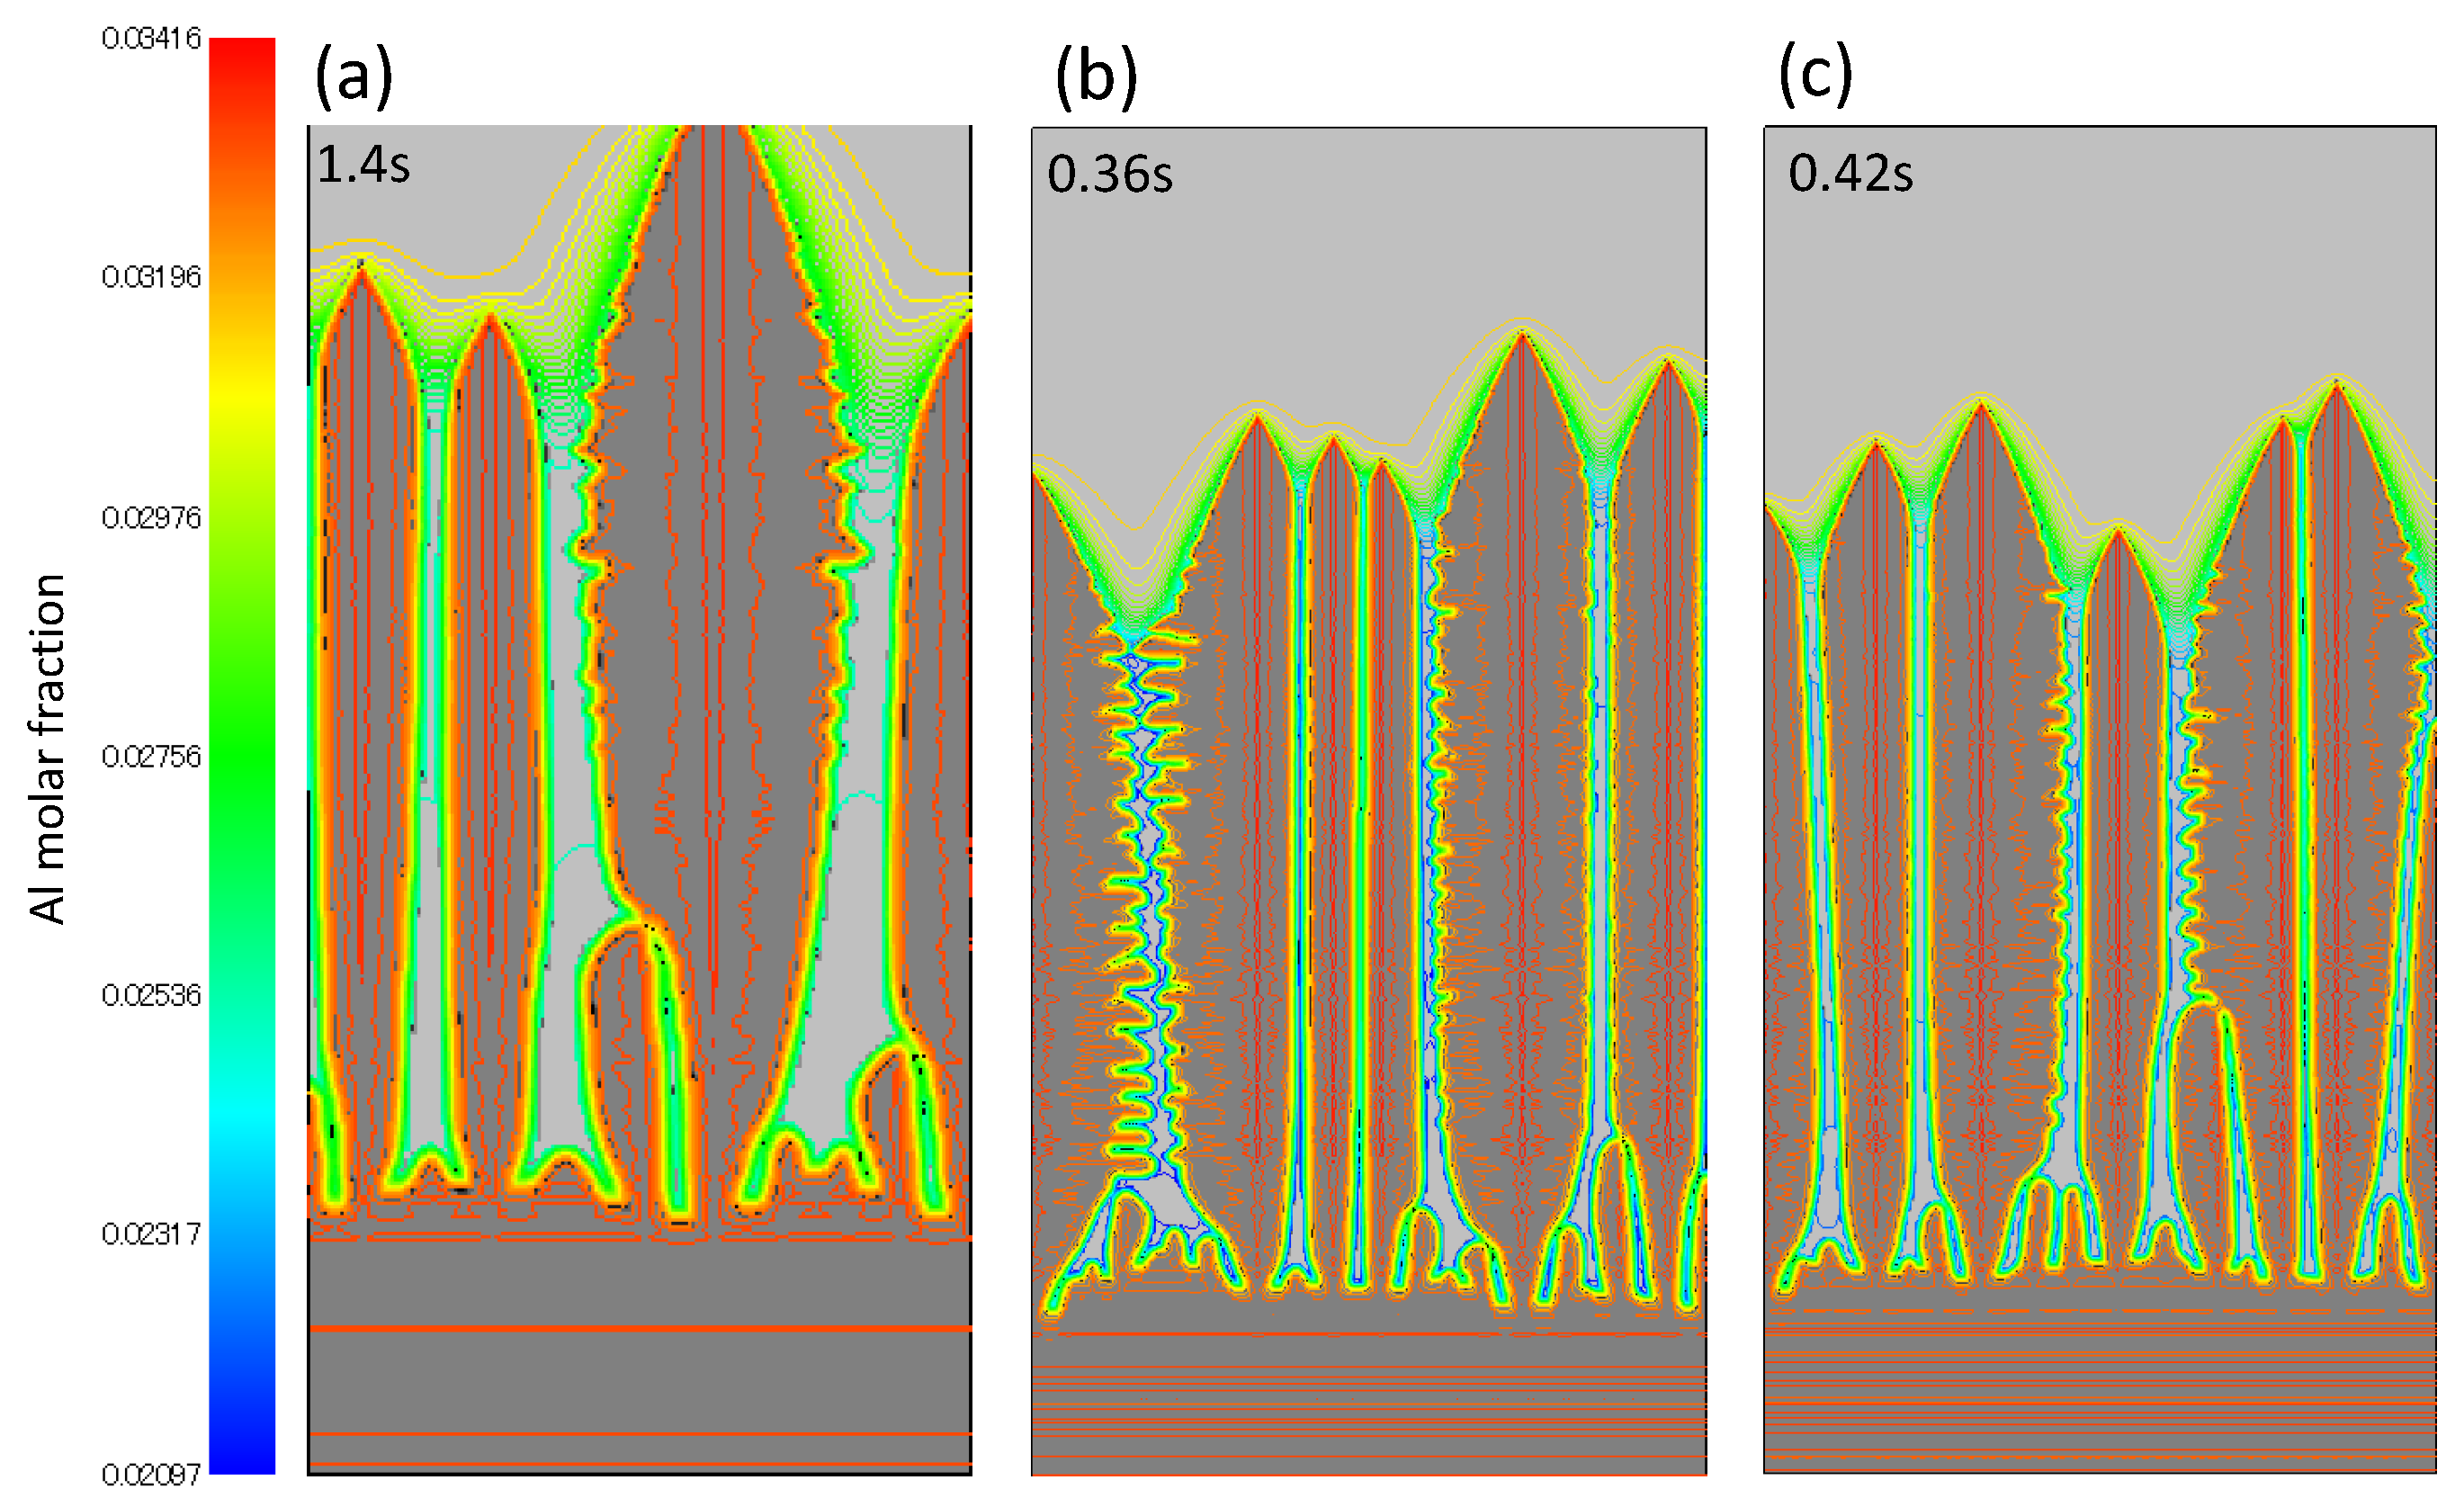
Al molar fraction distributions with phase distributions at 1.3 s for the 1-layer (p1), 0.35 s for the 5-layer (p5), and 0.4 s for the 10-layer position (p10) are shown for comparison with PDASs in Figure 9. The element partitioning in the interface and solute diffusion with advancing solidification were precisely calculated. Other element concentration distributions were also confirmed to have been normally obtained.
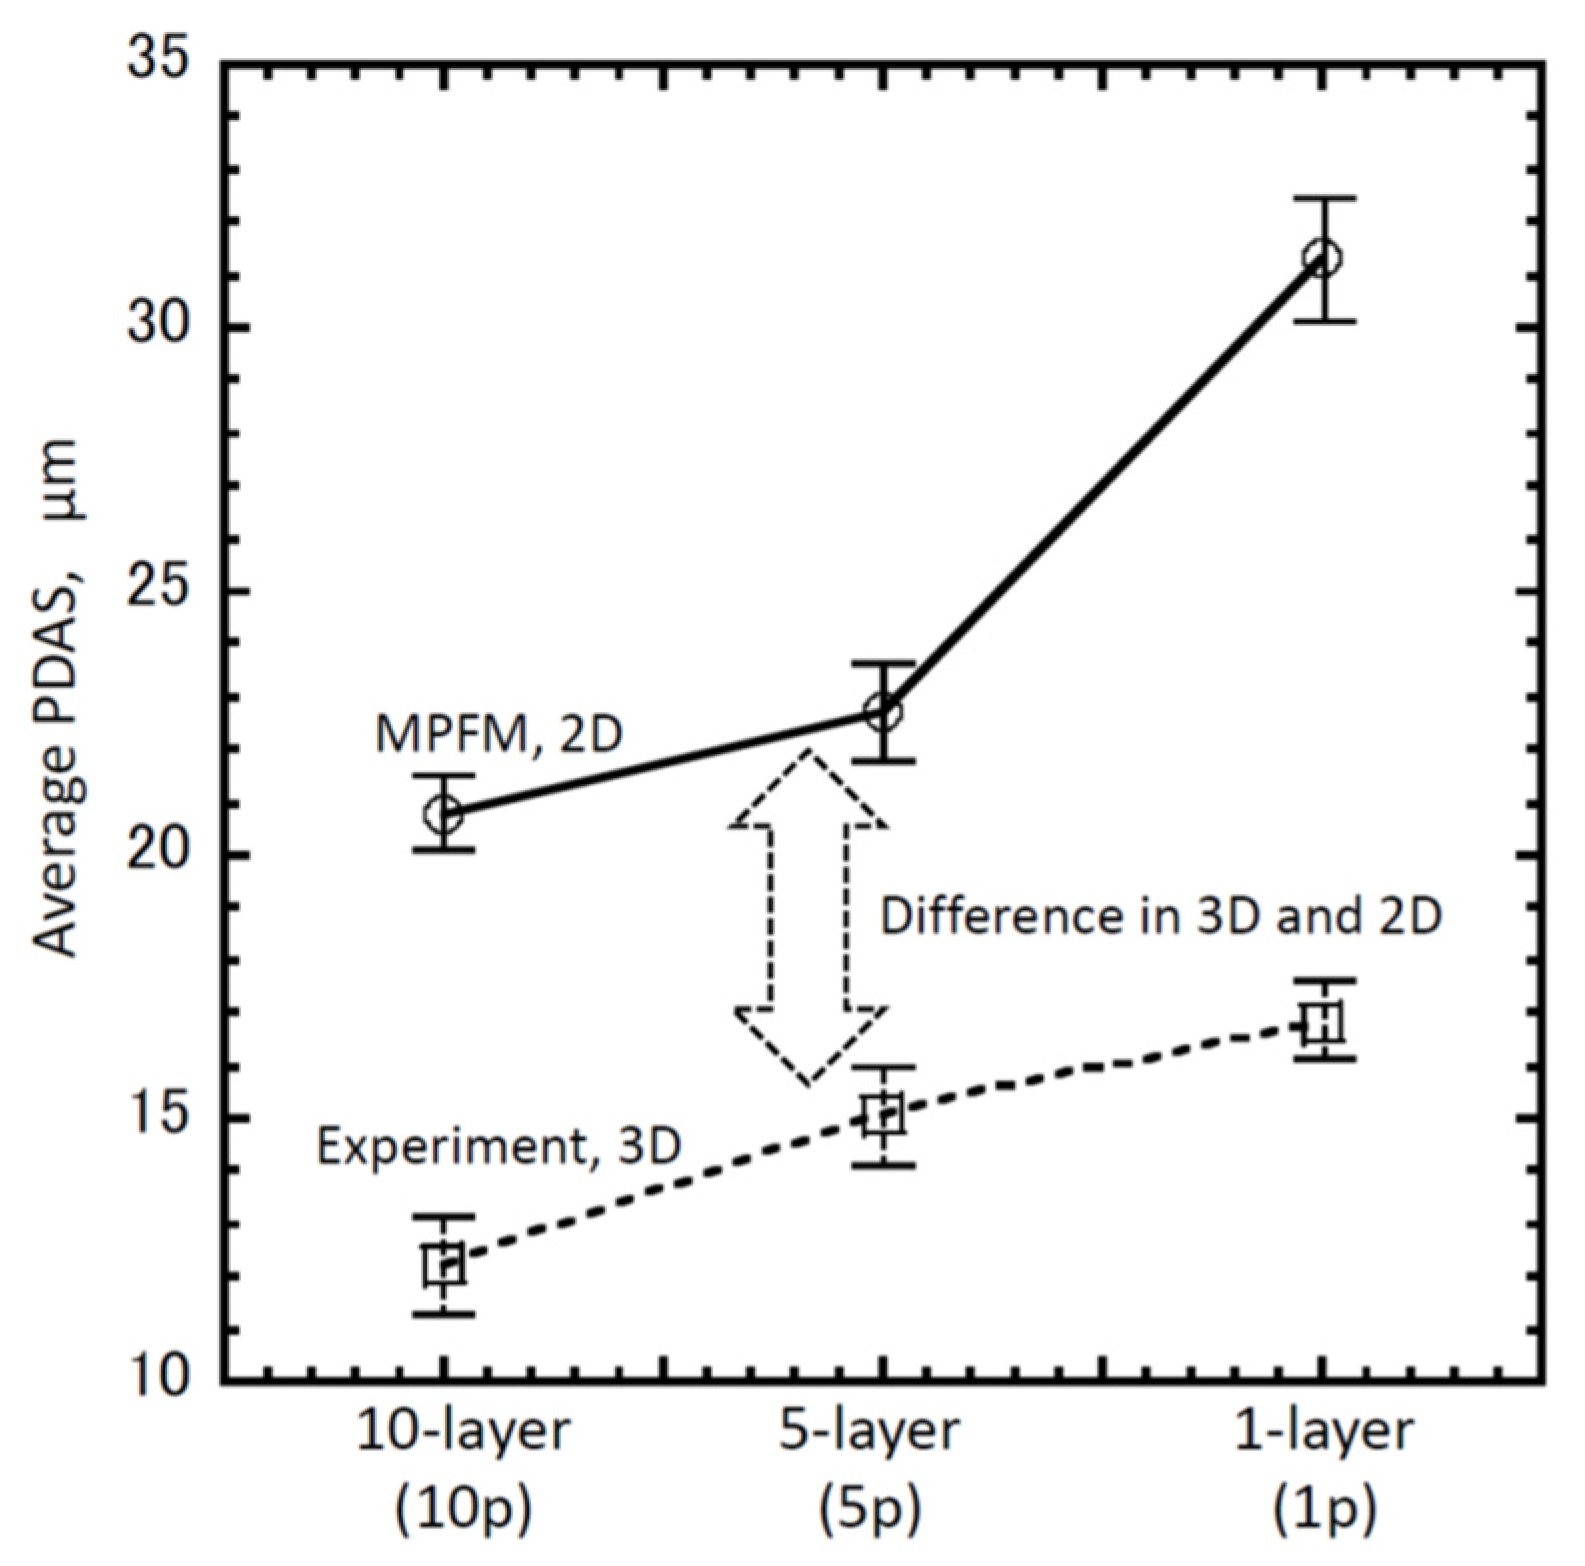
In Figure 9, the growth length of the initial flat interface for the vertical direction up to the start of dendrite growth in the one-layer position Figure 9a is longer than that for the other layer positions, as shown in Figure 9b,c. This is considered to be due to the lower constitutional undercooling in the first layer spending a longer time to reach interface instability than the other layers. The flat growth region is not seen in the experimental measurement of Figure 6, because columnar dendrites usually obey epitaxial-like growth from the poor melt bottom in the WAAM process [8,23]. The lower undercooling makes the PDAS of the first layer longer than that of the other layers by considering the solidification theory [24]. The average PDAS for each layer in Figure 9 is shown in Table 6 and Figure 10 by comparing experimentally measured values from Figure 6.
Variations in the average PDAS of MPFM from 1- to 10-layers are in qualitative agreement with experimental variations. According to the cooling rate and temperature gradient estimated by thermal analyses in Table 3, steady solidification velocities, which are defined by cooling rates divided by temperature gradients, in the first, fifth, and tenth layers are 4.99 × 10⁻³ m/s, 2.95 × 10⁻³ m/s, and 2.45 × 10⁻³ m/s, respectively. The PDAS of steady solidification is in inverse proportion to the root of the interface’s velocity by solidification theory. The tendency of the variations between the first layer and the fifth and tenth layers in Figure 10 is the inverse of those predicted by the theory [24]. It is considered that the solidification of the WAAM process is mainly controlled by the cooling rate in the transient state. Based on these results, it is understood that MPFM can be applied to unsteady solidification microstructure evolution for WAAM process conditions.
On the other hand, there are quantitative differences between MPFM simulation and the experimental measurements in Table 6 or Figure 10. For example, the PDAS value of MPFM in the fifth layer is 1.5 times the experimental one. The solidification of WAAM is controlled by element diffusion because the solidification from Table 3 is not rapid. It is considered that this difference is attributable to the MPFM simulation being performed in two dimensions. For the sake of simplicity, diffusion equations and their solutions for cylindrical and spherical symmetry fields are shown as follows.
The two-dimensional diffusion length is 1.5 times the power than the three-dimensional one in the same diffusivity. In other words, diffusivity in a two-dimensional field has 1.5-times the power of that in the three-dimensional field. PDAS is proportional to the root of diffusivity in the solidification theory [24]. It is considered that the differences between MPFM simulation and the experimental measurements in Table 6 or Figure 10 are reasonable. For more accurate MPFM simulations, three-dimensional calculations are demanded. However, such calculations have a high computational cost due to the huge number of CPU operations. High parallelization programing using MPI/OpenMP or GPU will be applied to drastically reduce the computation’s cost. So far, however, the TQ-interface function is not available for OpenMP or GPU.
6. Conclusions
A two-dimensional multi-phase field method incorporating the CALPHAD database of practical Ni-based alloy compositions consisting of up to nine elements was developed for analyzing the solidification microstructure evolution of the WAAM process. Thermal analyses were performed to obtain temperature profiles in each deposition layer of WAAM. Solidification columnar microstructures simulated in the deposition layers using the cooling rate and the temperature gradient values were used to evaluate the thermal analysis’ results. These microstructure results were compared with experimental measurements, of which the primary dendrite arm’s spacing was confirmed to depend on the cooling rate rather than the steady solidification velocity decided by the cooling rate and the temperature gradient values according to solidification theory. It was confirmed that simulated primary dendrite arm spacings were in qualitative agreement with experimental measurements. It was also shown that three-dimensional calculations would provide more quantitative prediction.
Author Contributions
Conceptualization, S.N., M.K. and H.K.; methodology, S.N. and M.K.; software, S.N.; validation, S.N.; formal analysis, S.N. and M.K.; investigation, S.N.; experimental resources, M.K., H.K. and M.W.; writing—original draft preparation, S.N.; writing—review and editing, M.W.; project administration, M.W. All authors have read and agreed to the published version of the manuscript.
Funding
Part of this research was supported by the Strategic Innovation Program for Energy Conservation Technologies (New Energy and Industrial Technology Development Organization: NEDO), P16007.
Data Availability Statement
Not included.
Acknowledgments
Partial financial support from the Strategic Innovation Program for Energy Conservation Technologies, NEDO, is also gratefully acknowledged.
Conflicts of Interest
The authors declare no conflict of interest.
References
- Cunningham, C.R.; Flynn, J.M.; Shokrani, A.; Dhokia, V.; Newman, S.T. Invited review article: Strategies and processes for high quality wire arc additive manufacturing. Addit. Manuf. 2018, 22, 672–686. [Google Scholar] [CrossRef]
- Vock, S.; Klöden, B.; Kirchner, A.; Weißgärber, T.; Kieback, B. Powders for powder bed fusion: A review. Prog. Addit. Manuf. 2019, 4, 383–397. [Google Scholar] [CrossRef] [Green Version]
- Montevecchi, F.; Venturini, G.; Scippa, A.; Campatelli, G. Finite element modelling of Wire-Arc-Additive-Manufacturing process. Procedia CIRP 2016, 55, 109–114. [Google Scholar] [CrossRef] [Green Version]
- Feng, G.; Wang, H.; Wang, Y.; Deng, D.; Zhang, J. Numerical Simulation of Residual Stress and Deformation in Wire Arc Additive Manufacturing. Crystals 2022, 12, 803. [Google Scholar] [CrossRef]
- Dhinakaran, V.; Ajith, J.; Fathima, A.; Fahmidha, Y.; Jagadeesha, T.; Sathish, T.; Stalin, B. Wire Arc Manufacturing (WAAM) process of nickel based superalloys—A review. Mater. Today Proc. 2020, 21, 920–925. [Google Scholar] [CrossRef]
- Galizoni, B.B.; Couto, A.A.; Pereira Reis, D.A. Heat Treatment on Nickel-Based Superalloy Inconel 713C. Metals 2019, 9, 47. [Google Scholar] [CrossRef] [Green Version]
- Sahu, S.K.; Mishra, D.K.; Behera, A.; Dalai, R.P. An overview on the effect of heat-treatment and cooling rates on Ni-based superalloys. Mater. Proc. 2021, 47, 3309–3312. [Google Scholar] [CrossRef]
- Kumar, M.B.; Sathiya, P.; Kannan, G.R.; Karthikeyan, M. Investigation on the microstructure and microhardness of Inconel 825 thick wall fabricated by wire arc additive manufacturing. Mater. Lett. 2022, 317, 132115. [Google Scholar] [CrossRef]
- Boussinot, G.; Apel, M.; Zielinski, J.; Hecht, U.; Schleifenbaum, J.H. Strongly Out-of-Equilibrium Columnar Solidification During Laser Powder-Bed Fusion in Additive Manufacturing. Phys. Rev. Appl. 2019, 11, 014025. [Google Scholar] [CrossRef] [Green Version]
- Zhang, L.; Steinbach, I. Phase-field model with finite interface dissipation: Extension to multi-component multi-phase alloys. Acta Mater. 2012, 60, 2702–2710. [Google Scholar] [CrossRef]
- Nomoto, S.; Segawa, M.; Watanabe, M. Non- and Quasi-Equilibrium Multi-Phase Field Methods Coupled with CALPHAD Database for Rapid-Solidification Microstructural Evolution in Laser Powder Bed Additive Manufacturing Condition. Metals 2021, 11, 626. [Google Scholar] [CrossRef]
- Hu, B.L.; Zhang, Q.H.; Wang, F.; Zhang, J.H. FEM Analysis of EDM in Gas Based on Birth and Death of Element. Mater. Sci. Forum 2009, 626–627, 599–604. [Google Scholar] [CrossRef]
- Fukumoto, S.; Oikawa, Y.; Tsuge, S.; Nomoto, S. Prediction of σ Phase Formation in Fe–Cr–Ni–Mo–N Alloys. ISIJ Int. 2010, 50, 445–449. [Google Scholar] [CrossRef] [Green Version]
- Kim, S.G.; Kim, W.T.; Suzuki, T. Phase-field model for binary alloys. Phys. Rev. E 1999, 60, 7186–7197. [Google Scholar] [CrossRef] [PubMed]
- Böttger, B.; Apel, M.; Eiken, J.; Schaffnit, P.; Steinbach, I. Phase-Field Simulation of Solidification and Solid-State Transformations in Multicomponent Steels. Steel Res. Int. 2008, 79, 22–30. [Google Scholar] [CrossRef]
- Nickel-Based Superalloys Databases. Available online: https://thermocalc.com/content/uploads/Documentation/Databases/Mobility/mobni6-technical-info.pdf (accessed on 22 August 2022).
- Nickel-Based Superalloys Databases. Available online: https://thermocalc.com/content/uploads/Documentation/Databases/Thermodynamic/tcni12-technical-info.pdf (accessed on 22 August 2022).
- Steinbach, I. Phase-field models in materials science. Model. Simul. Mater. Sci. Eng. 2009, 17, 073001. [Google Scholar] [CrossRef]
- Porter, D.A.; Eastering, K.E.; Sherif, M.Y. Phase Transformations in Metals and Alloys, 3rd ed.; CRC Press: New York, NY, USA, 2008; pp. 215–220. [Google Scholar]
- Yang, C.; Xu, Q.; Su, X.; Liu, B. Multiphase-field and experimental study of solidification behavior in a nickel-based single crystal superalloy. Acta Mater. 2019, 175, 286–296. [Google Scholar] [CrossRef]
- Böttger, B.; Eqiken, J.; Apel, M. Multi-ternary extrapolation scheme for efficient coupling of thermodynamic data to a multi-phase-field model. Compu. Mater. Sci. 2015, 108, 283–292. [Google Scholar] [CrossRef]
- Shao, Y.L.; Wang, J.X.; Zhang, Y.W.; Jia, J.; Liu, J.T.; Huang, H.L.; Zhang, M.; Wang, Z.C.; Zhang, H.F.; Hu, B.F. Effect of Ti and Al on microstructure and partitioning behavior of alloying elements in Ni-based powder metallurgy superalloys. Int. J. Miner. Metall. Mater. 2019, 26, 500–506. [Google Scholar] [CrossRef]
- Belotti, L.P.; Van Dommelen, J.A.W.; Geers, M.G.D.; Ya, W.; Hoefnagels, J.P.M. Microstructural characterisation of thick-walled wire arc additively manufactured stainless steel. J. Mater. Process. Technol. 2022, 299, 117373. [Google Scholar] [CrossRef]
- Kurz, W.; Fisher, D.J. Fundamentals of Solidification, 4th ed.; Trans Tech Publication Ltd.: Zuerich, Switzerland, 1998; pp. 55–58. [Google Scholar]
Figure 1.
Dimensions of the experimental product. (a) Length of substrate and deposition for the y-direction. (b) Width and height of substrate and deposition on the x-z cross-section.
Figure 1.
Dimensions of the experimental product. (a) Length of substrate and deposition for the y-direction. (b) Width and height of substrate and deposition on the x-z cross-section.

Figure 2.
Temperature field at times (a) 0 s, (b) 15 s, (c) 30 s, and (d) 45 s.

Figure 3.
Temporal temperature variations at the first, fifth, and tenth layer.

Figure 4.
Schematic illustration of the quasi-equilibrium, parallel tangent law of solute elements between the α and β phases.
Figure 4.
Schematic illustration of the quasi-equilibrium, parallel tangent law of solute elements between the α and β phases.

Figure 5.
Schematic molar fractions of the equilibrium phases for temperature.

Figure 6.
Solidification microstructure of the WAAM process under the conditions in Table 1 and Figure 1, at (a) p10, (b) p5, and (c) p1.

Figure 7.
Temporal Al molar fraction distributions with phase distributions at the 10-layer position for (a) 0.36, (b) 0.44, and (c) 0.54 s.
Figure 7.
Temporal Al molar fraction distributions with phase distributions at the 10-layer position for (a) 0.36, (b) 0.44, and (c) 0.54 s.

Figure 8.
Temporal solute element fraction distributions with phase distributions at the 10-layer position: 10p at 0.54 s, (a) Ti, (b) Co, (c) Cr, (d) Fe, (e) Mo, (f) Si, and (g) C.
Figure 8.
Temporal solute element fraction distributions with phase distributions at the 10-layer position: 10p at 0.54 s, (a) Ti, (b) Co, (c) Cr, (d) Fe, (e) Mo, (f) Si, and (g) C.

Figure 9.
Al molar fraction distributions with phase distributions in the (a) first, (b) fifth, and (c) tenth layers at 1.4 s, 0.36 s, and 0.42 s, respectively.
Figure 9.
Al molar fraction distributions with phase distributions in the (a) first, (b) fifth, and (c) tenth layers at 1.4 s, 0.36 s, and 0.42 s, respectively.

Figure 10.
Schematic illustration of the quasi-equilibrium, parallel tangent law of the solute element between α and β phases.
Figure 10.
Schematic illustration of the quasi-equilibrium, parallel tangent law of the solute element between α and β phases.


Table 1.
Physical constant of the Ni-based alloy and WAAM process conditions.
| Density, | 8250 kg/m3 |
| Heat capacity, | 451.9 J/g/K |
| Liquidus temperature, | 1345 °C |
| Solidus temperature, | 1310 °C |
| Latent heat, | 250 kJ/kg |
| Arc power efficiency, η | 0.2 |
| Torch traveling velocity, | 100 mm/min |
| Torch voltage, | 24–36 V |
| Torch electric current, | 60–150 A |
Table 2.
Composition of the Ni-based alloy in this study (wt%).
| Al | C | Co | Cr | Fe | Mo | Si | Ti | Ni |
|---|---|---|---|---|---|---|---|---|
| 1.47 | 0.06 | 10.25 | 18.55 | 2.53 | 9.27 | 0.04 | 3.08 | Bal. |
Table 3.
Estimated cooling rate and temperature gradient at p1, p5, and p10 in Figure 1b.
Table 3.
Estimated cooling rate and temperature gradient at p1, p5, and p10 in Figure 1b.
| Layer Position | Cooling Rate, K/s | Temperature Gradient, K/m |
|---|---|---|
| 1 (p1) | 44.9 | 9000 |
| 5 (p5) | 260 | 88,100 |
| 10 (p10) | 208 | 84,800 |
Table 4.
Conditions of MPFM calculation under the conditions of the tenth layer position (p10).
| Interface mobility | 1.0 × 10⁻⁷ m4/J/s |
| Interfacial energy | 0.2 J/m2 [20] |
| Diffusivity of liquid | 2.0 × 10⁻⁹ m2/s |
| Anisotropy factor | (0.0167, 0.0167) [21] |
| Initial temperature on bottom | 1610 K |
| Grid width | 0.5 μm |
| Number of grid point | 125 × 1000 |
| Region size | 62.5 μm × 500 μm |
| Discrete time width | 1 × 10⁻⁶ s |
Table 5.
Conditions of MPFM calculations for the 1-, 5-, and 10-layer positions.
| Interface mobility | 1.0 × 10⁻⁷ m4/J/s |
| Interfacial energy | 0.2 J/m2 [20] |
| Diffusivity of liquid | 2.0 × 10⁻⁹ m2/s |
| Anisotropy factor | (0.0167, 0.0167) [21] |
| Initial temperature on bottom | 1610 K |
| (5- and 10-layers positions) | |
| Grid width | 0.5 μm |
| Number of grid points | 250 × 500 |
| Region size | 125 μm × 250 μm |
| Discrete time width | 1 × 10⁻⁶ s |
| (1-layer position) | |
| Grid width | 1.0 μm |
| Number of grid points | 125 × 500 |
| Region size | 125 μm × 500 μm |
| Discrete time width | 1 × 10⁻⁵ s |
Table 6.
Average PDASs from MPFM calculation and experimental measurement.
| Layer Position | MPFM, µm | Experiment, µm |
|---|---|---|
| 1 (p1) | 35.7 (±5.2) | 16.8 (±4.4) |
| 5 (p5) | 22.7 (±4.3) | 15.1 (±4.3) |
| 10 (p10) | 20.8 (±3.6) | 12.2 (±3.5) |
Publisher’s Note: MDPI stays neutral with regard to jurisdictional claims in published maps and institutional affiliations. |
© 2022 by the authors. Licensee MDPI, Basel, Switzerland. This article is an open access article distributed under the terms and conditions of the Creative Commons Attribution (CC BY) license (https://creativecommons.org/licenses/by/4.0/).
Share and Cite
MDPI and ACS Style
Nomoto, S.; Kusano, M.; Kitano, H.; Watanabe, M. Multi-Phase Field Method for Solidification Microstructure Evolution for a Ni-Based Alloy in Wire Arc Additive Manufacturing. Metals 2022, 12, 1720. https://doi.org/10.3390/met12101720
AMA Style
Nomoto S, Kusano M, Kitano H, Watanabe M. Multi-Phase Field Method for Solidification Microstructure Evolution for a Ni-Based Alloy in Wire Arc Additive Manufacturing. Metals. 2022; 12(10):1720. https://doi.org/10.3390/met12101720
Chicago/Turabian StyleNomoto, Sukeharu, Masahiro Kusano, Houichi Kitano, and Makoto Watanabe. 2022. "Multi-Phase Field Method for Solidification Microstructure Evolution for a Ni-Based Alloy in Wire Arc Additive Manufacturing" Metals 12, no. 10: 1720. https://doi.org/10.3390/met12101720
Note that from the first issue of 2016, this journal uses article numbers instead of page numbers. See further details here.