
Superplastic Forming and Reaction Diffusion Bonding Process of Hollow Structural Component for Mg-Gd-Y-Zn-Zr Rare Earth Magnesium Alloy


1
School of Materials Science and Engineering, Harbin Institute of Technology, Harbin 150001, China
2
National Key Laboratory for Precision Hot Processing of Metals, Harbin Institute of Technology, Harbin 150001, China
3
Beijing Hangxing Machine Manufacturing Co., Ltd., Beijing 100013, China
*
Author to whom correspondence should be addressed.
Metals 2022, 12(1), 152; https://doi.org/10.3390/met12010152
Submission received: 19 December 2021
/
Revised: 10 January 2022
/
Accepted: 11 January 2022
/
Published: 14 January 2022
(This article belongs to the Special Issue Metal Forming—Hot Forming Technologies of Light Alloy Tubes and Sheets)
Abstract
:This work fabricated a double hollow structural component of Mg-8.3Gd-2.9Y-0.8Zn-0.2Zr alloy by superplastic forming (SPF) and reaction-diffusion bonding (RDB). The superplastic characteristic and mechanical properties of Mg-8.3Gd-2.9Y-0.8Zn-0.2Zr alloy sheets at 250–450 °C were studied. Tensile tests showed that the maximum elongation of tensile specimens was about 1276.3% at 400 °C under a strain rate of 1 × 10⁻³ s−1. Besides, the effect of bonding temperature and interface roughness on microstructure and mechanical properties of the reaction diffusion-bonded joints with a Cu interlayer was investigated. With the increase of temperature, the diffusion coefficient of Cu increases, and the diffusion transition region becomes wider, leading to tightening bonding of the joint. However, the bonding quality of the joint will deteriorate due to grain size growth at higher temperatures. Shear tests showed that the highest strength of the joints was 152 MPa (joint efficiency = 98.7%), which was performed at 460 °C.
1. Introduction
Magnesium and its alloys have been widely used in the aerospace, automotive, and 3C industries (computers, communications, and consumer electronics) due to their excellent physical and chemical properties, such as low density, high specific strength, and stiffness [1,2,3,4]. However, their low strength and ductility limit their further application, especially severe strength reduction at high temperatures [5]. Hence, rare earth (RE) magnesium alloys have been paid considerable attention as lightweight structural materials due to their excellent mechanical properties at ambient and elevated temperatures [6].
As a typical lightweight and high strength structure, the multi-layer hollow reinforcement structures can fulfill the requirements in terms of heat dissipation, ventilation, energy absorption, and electromagnetic wave absorption [7,8,9]. Superplastic forming (SPF) and diffusion bonding (DB) is a technique allowing for processing hollow metallic parts with an internal structure, which traditional machining technologies such as forging, casting, and milling, cannot be used to manufacture [10,11,12,13]. As a manufacturing process, SPF exhibits its unique advantages, including greater design freedom, low dies cost, the elimination of spring back, and producing components with complex geometries in one manufacturing step.
In the past few years, many scholars have carried out lots of research on the multi-layer hollow reinforcement structural components. Zhang et al. [14] established numerical models of four-layer honeycomb and hollow blade structure of Ti-6Al-4V, and then analyzed the effects of forming parameters (thickness ratio, strain rate, DB distance, and width) on groove defect and thickness distribution. Wu et al. [15] studied the superplastic properties of Ti-6Al-4V alloy at elevated temperatures and successfully manufactured a pyramid lattice sandwich panel. Du et al. [16] fabricated a four-layer hollow structural component of TA15 by SPF/DB process at 920 °C with the target strain rate of 0.001s−1, and then investigated the microstructure, thickness distribution, and mechanical property of the four-layer hollow structure. In recent years, titanium alloys’ SPF/DB technique tends to mature, while the SPF/DB of magnesium alloys is rarely investigated. It is well known that diffusion bonding of magnesium is a formidable challenge because of the compact oxide film covered on the substrate, which acts as a diffusion barrier. Therefore, it is essential to remove or break the continuity of oxide film for realizing diffusion bonding of magnesium alloy during the bonding process. Then Cu as an interlayer reacting with magnesium to realize diffusion bonding is proposed in this paper.
This study investigated the superplasticity of Mg-8.3Gd-2.9Y-0.8Zn-0.2Zr alloy at elevated temperatures. Besides, the effect of bonding temperature and interface roughness on microstructure and mechanical properties of the reaction diffusion-bonded joints with a Cu interlayer was analyzed. Finally, a double hollow structural component was fabricated by SPF/RDB. The microstructure was characterized, and the thickness distribution of the structure at different regions was measured.
2. Materials and Methods
The experimental rare earth (RE) magnesium alloy and the pure Cu foil (50 μm) were provided by Zhengzhou Light Alloy Co. Ltd. (Zhengzhou, China) and Qinghai Haiyuan Aluminum Alloy Co. Ltd. (Qinghai, China). The Mg-RE alloy’s composition (in wt%) received in forging state was 8.3 Gd, 2.9 Y, 0.8Zn, 0.2 Zr, and the balance Mg.
The tensile specimens with a gauge length of 20mm, a gauge width of 4.5 mm, and a thickness of 2mm were cut from the center of the forged billet using electrical discharge machining. Tensile tests are performed on the Shimadzu AG-Xplus 100 KN testing machine (Shimadzu, Tokyo, Japan) at the temperature ranging from 250 °C to 450 °C and the strain rate from 5 × 10⁻⁴ s−1 to 1 × 10⁻² s−1.
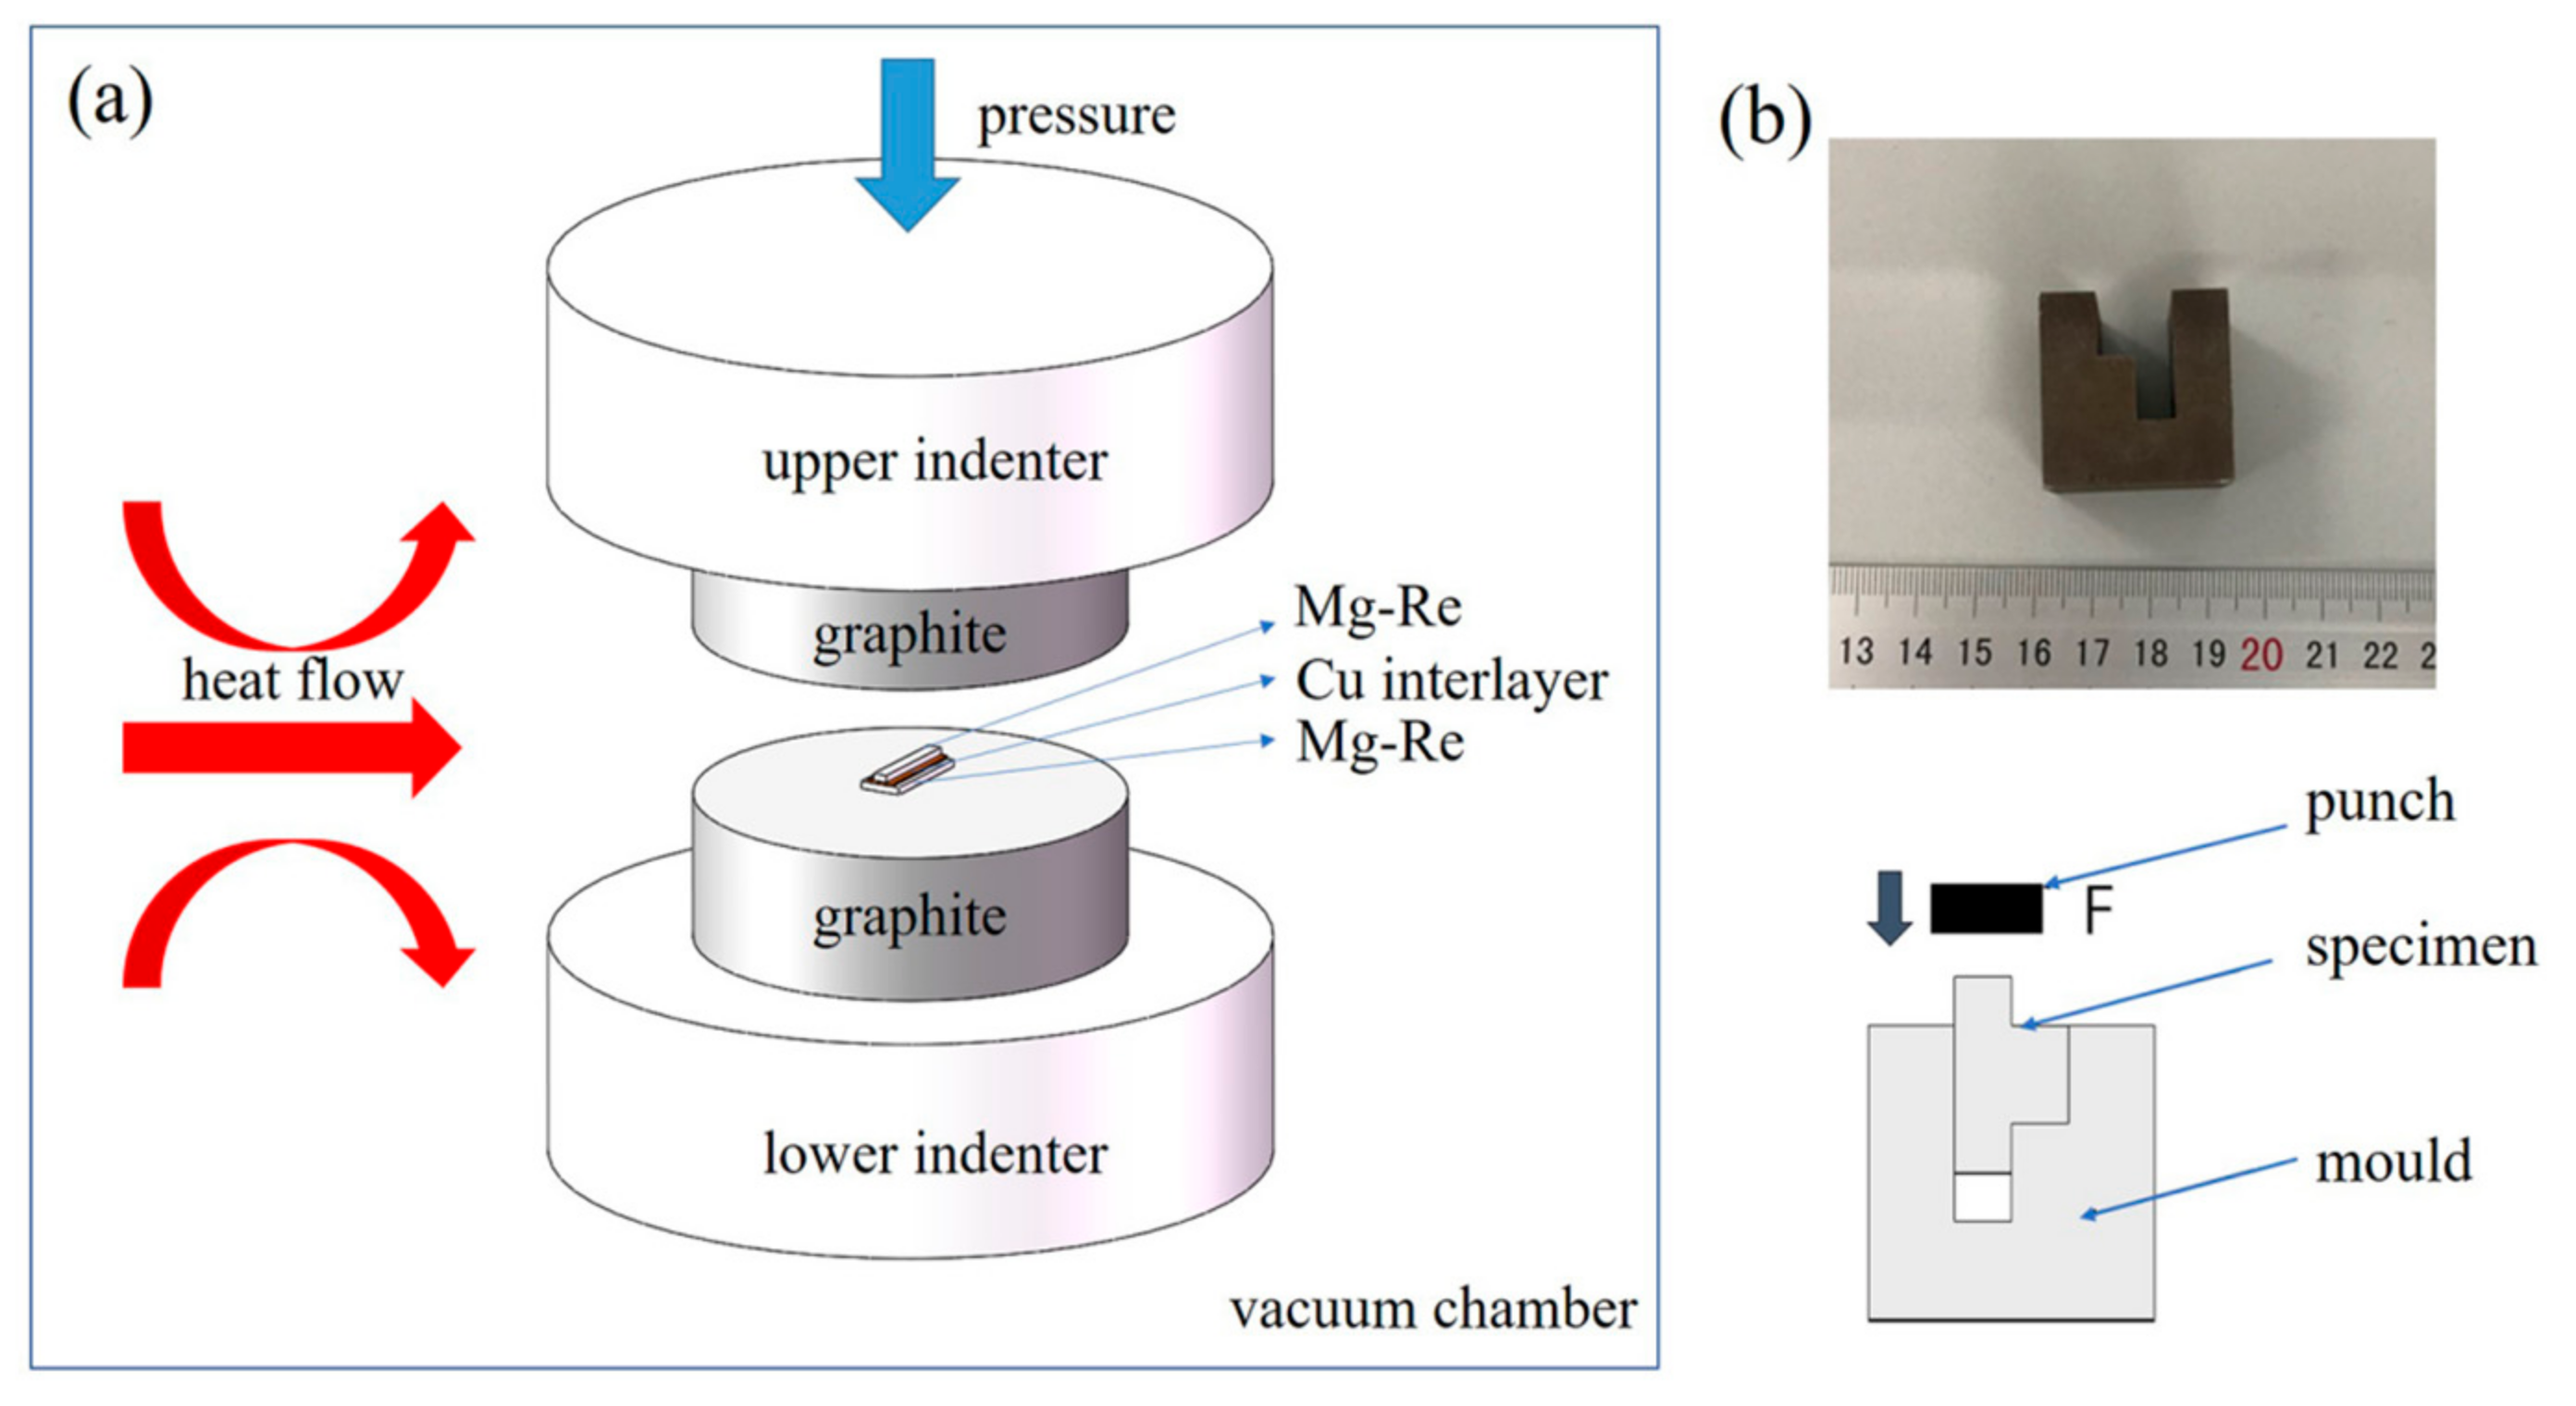
The contact surfaces of Mg-RE alloys were burnished with 180-grit, 800-grit, 1500-grit SiC paper before bonding, respectively. Subsequently, the polished Mg-RE alloys and the Cu foil were ultrasonically cleaned in acetone solution, and these cleaned samples were vacuum-sealed until further use. Before welding, the prepared specimens with different sizes (one is L70 mm × W10 mm × H6 mm, the other is L70 mm × W30 mm × H6 mm) were assembled into a sandwich-type structure with the Cu interlayer (L70 mm× W15 mm × H50 μm) in the middle of them, as illustrated in Figure 1a. The diffusion bonding was carried out in a vacuum hot-pressing sintering furnace (Jinzhou Hangxing Vacuum Equipment Co., LTD, Jinzhou, China) (ZRY55, maximum working temperature = 2000 °C, and the ultimate vacuum is 6.7 × 10⁻³ Pa) at 2 MPa. In view of the eutectic temperature of the Mg-Cu alloy being 485 °C, the samples were bonded at temperatures of 440 ℃, 460 °C, and 480 °C for 30 min at an induction heating rate of 20 °C/min. After the heating preservation, the uniaxial pressure was removed, and the specimens were cooled to ambient temperature in the furnace. The main diffusion bonding parameters are listed in Table 1.
The bonding joints were cut longitudinally, mechanical grinding, polished and finally etched in a glacial acetic acid (1.7 mL)-picric acid (1.8 g)-distilled water (3 mL)-ethyl alcohol (30 mL) solution for 20 s. The microstructure and microchemical analysis of the joints were performed by scanning electron microscopy (SEM, Quanta 200FEG, FEI company, Hillsboro, OR, USA) in conjunction with energy-dispersive X-ray spectroscopy (EDS) and FEI TALOS F200X scanning transmission electron microscopy (STEM) (FEI company, Hillsboro, OR, USA) coupled with a high-angle annular dark field (HAADF) detector and energy dispersive X-ray spectroscopy. The Instron-5500R testing machine Instron Corporation, Norwood, MA, USA) carried out the shear strength tests at ambient temperature with an initial strain rate of 1 mm/min. Figure 1b shows the schematic diagram of the shear test. All the specimens were tested at least three times to avoid random errors.
The SPF and RDB process of the double hollow structure was carried out on a 100 t four-column hydraulic press (Hefei Haide CNC Hydraulic Equipment Co., LTD, Hefei, China). The superplastic forming and diffusion bonding temperature was 475 °C and 460 °C, respectively. The target strain rate of the SPF process was 1 × 10⁻³ s−1.
3. Results and Discussion
3.1. Superplastic Characteristics of Mg-Re Alloy
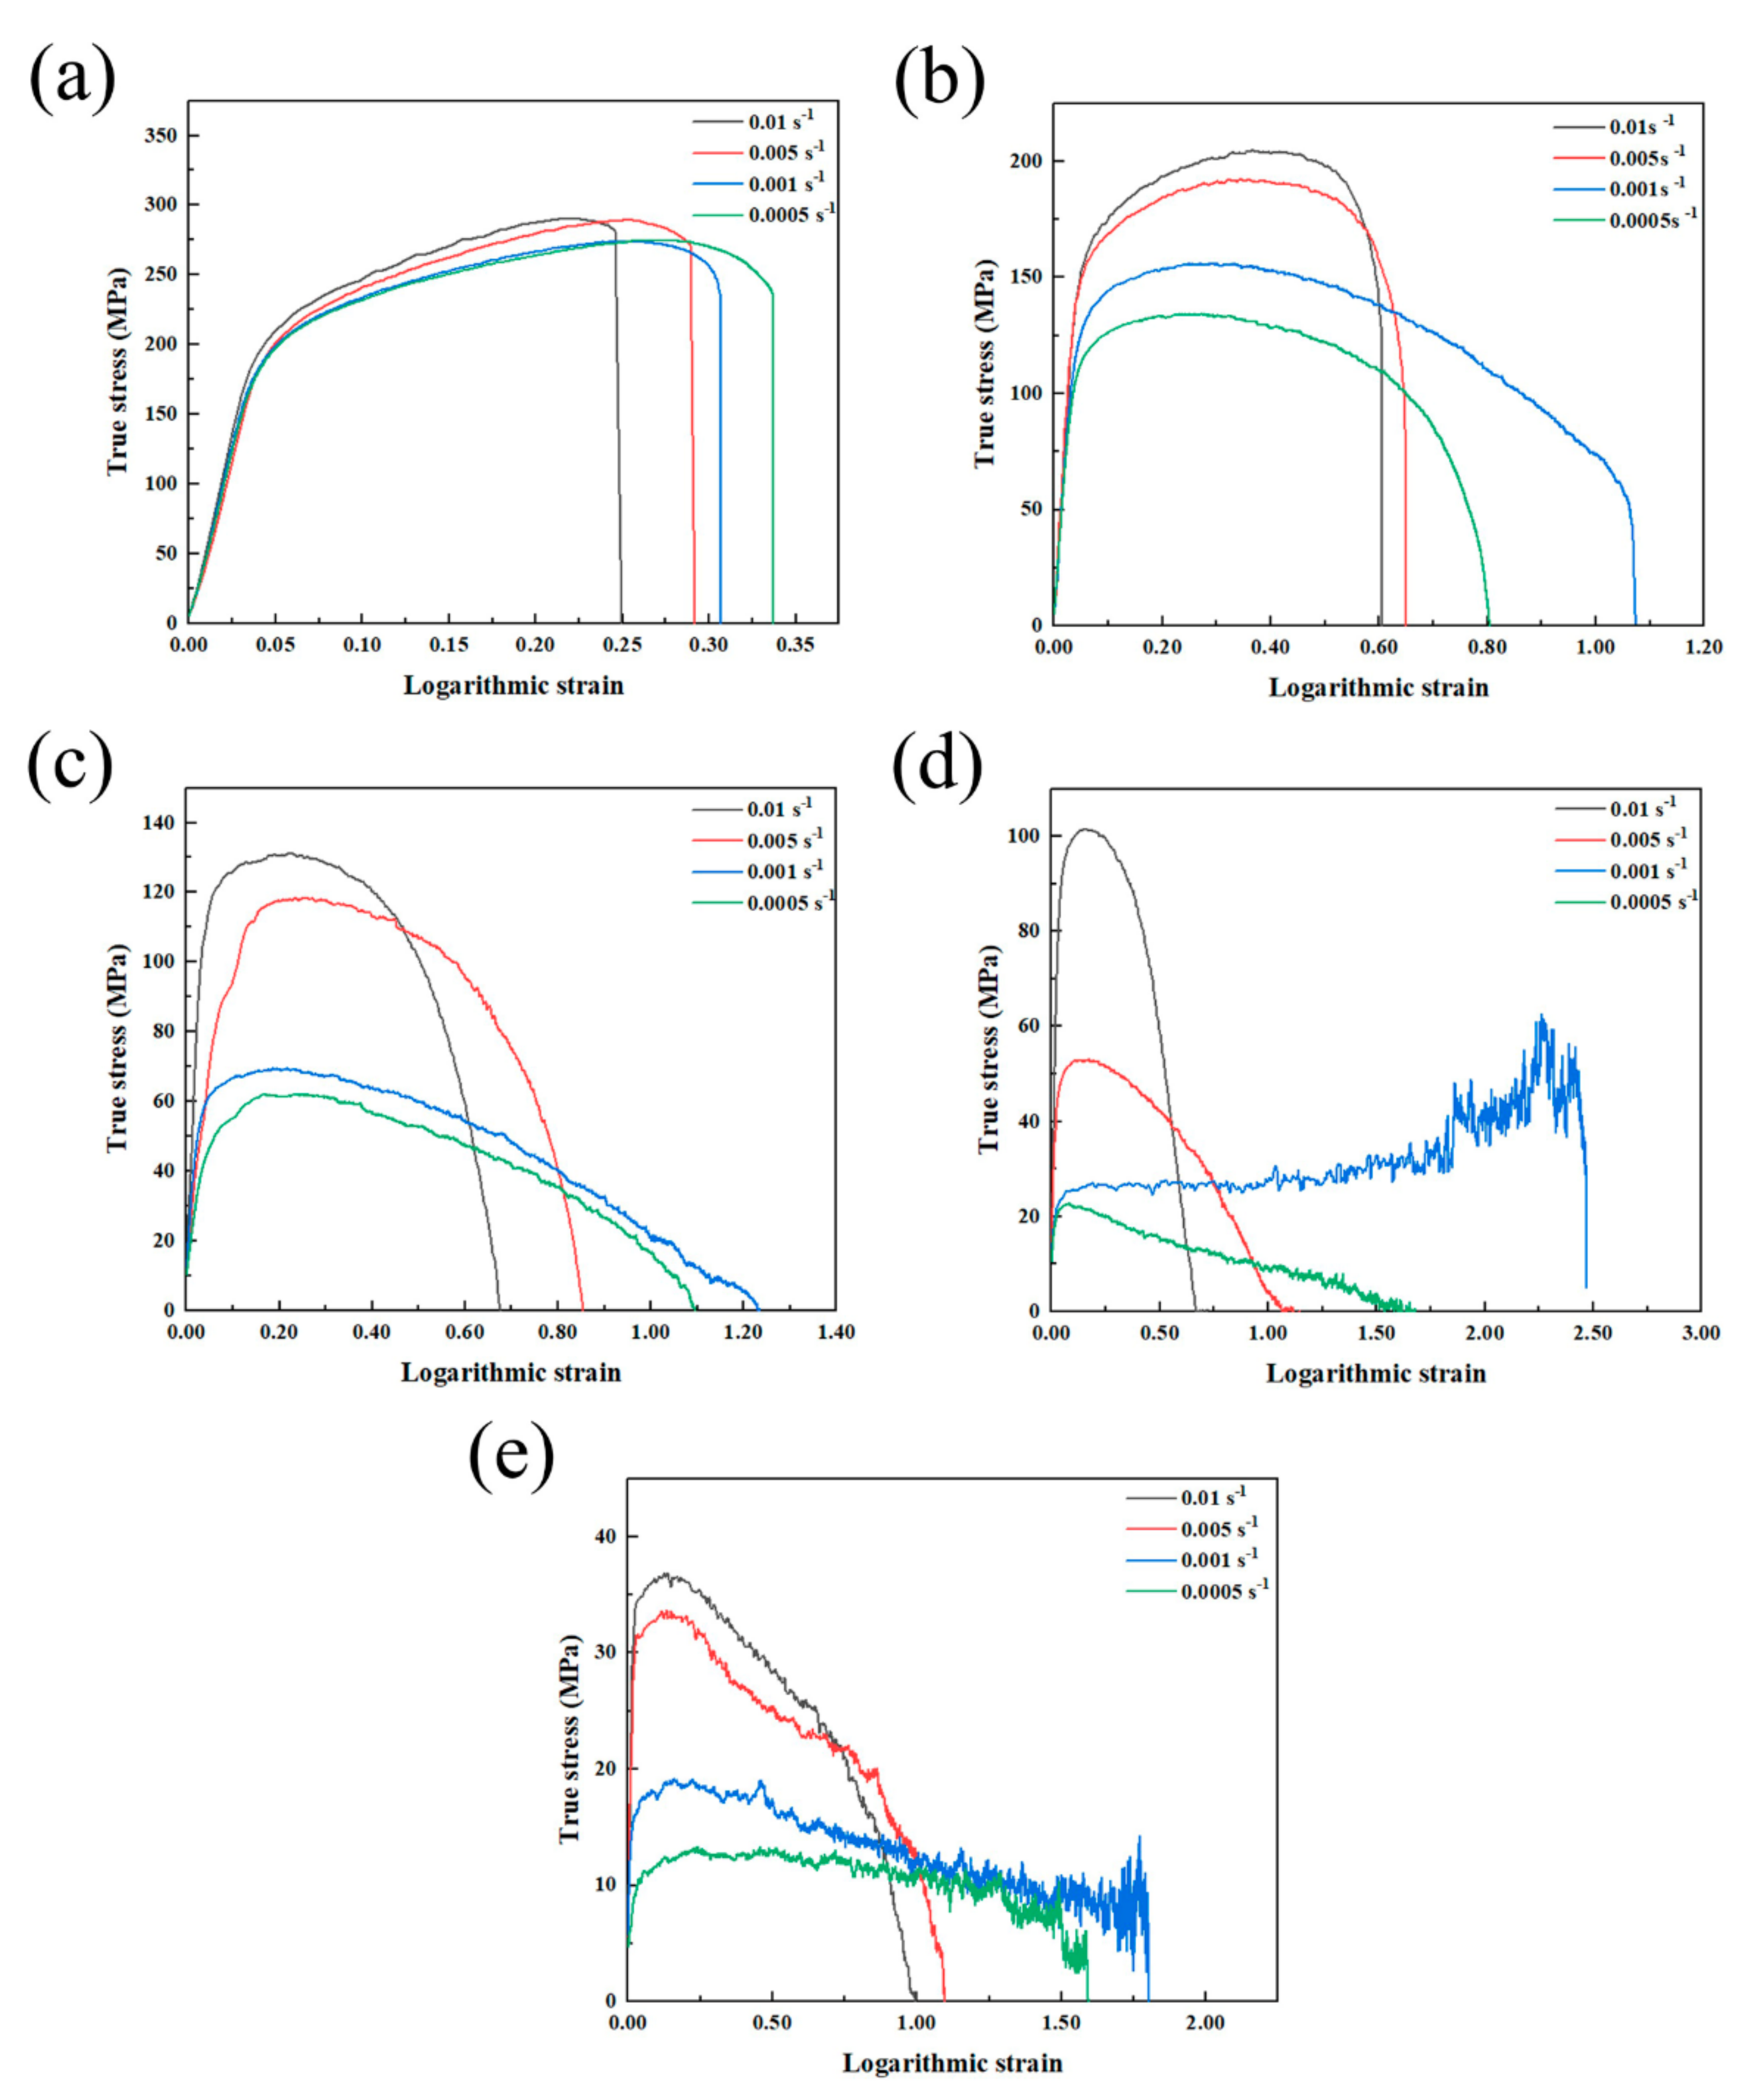
The effect of temperature and strain rate on the true stress-logarithmic strain curves for the Mg-Re alloy is shown in Figure 2. The temperature ranges from 250 °C to 450 °C while the strain rate ranges from 5 × 10⁻⁴ s−1 to 1 × 10⁻² s−1. The alloy has been found to exhibit obvious superplastic deformation with an elongation of 1276.3% (a true strain of 2.47) at 400 °C under a strain rate of 1 × 10⁻³ s−1. Thus, it can be concluded that the Mg-Re alloy exhibits superplastic-like large elongation. The flow stress decreases with increasing temperatures, and the material exhibits flow softening behavior after the flow stress peaks. The flow stress increases with increasing strain rates ranging from 1 × 10⁻³ s−1 to 1 × 10⁻² s−1. It is worth noting that the elongation of the specimens at 0.0005 s−1 is low than that at 0.001 s−1, which might attribute to the oxidation at a slow stain rate. The material also experiences a positive strain rate sensitivity, which can be described by a power-law [17]:
where m is the strain sensitivity coefficient indicated the effect of strain rate on the flow stress. K is the material constant related to the deformation temperature and the microstructure. Equation (1) was taken for the logarithms, and then it was expressed as:
For Equation (2), after being differential, the equation for m can be obtained as:
The data obtained by the tensile test are nominal stress-strain curves. In order to accurately analyze the test results, it is necessary to convert the curves into true stress-logarithmic strain curves, and the conversion formulas are as follows:
where σ is the true stress, ε is the true strain, F is the loading stress, A0 is the initial cross-sectional area, ∆l is the deformation of tensile specimens, and l0 is the standard distance of specimens.
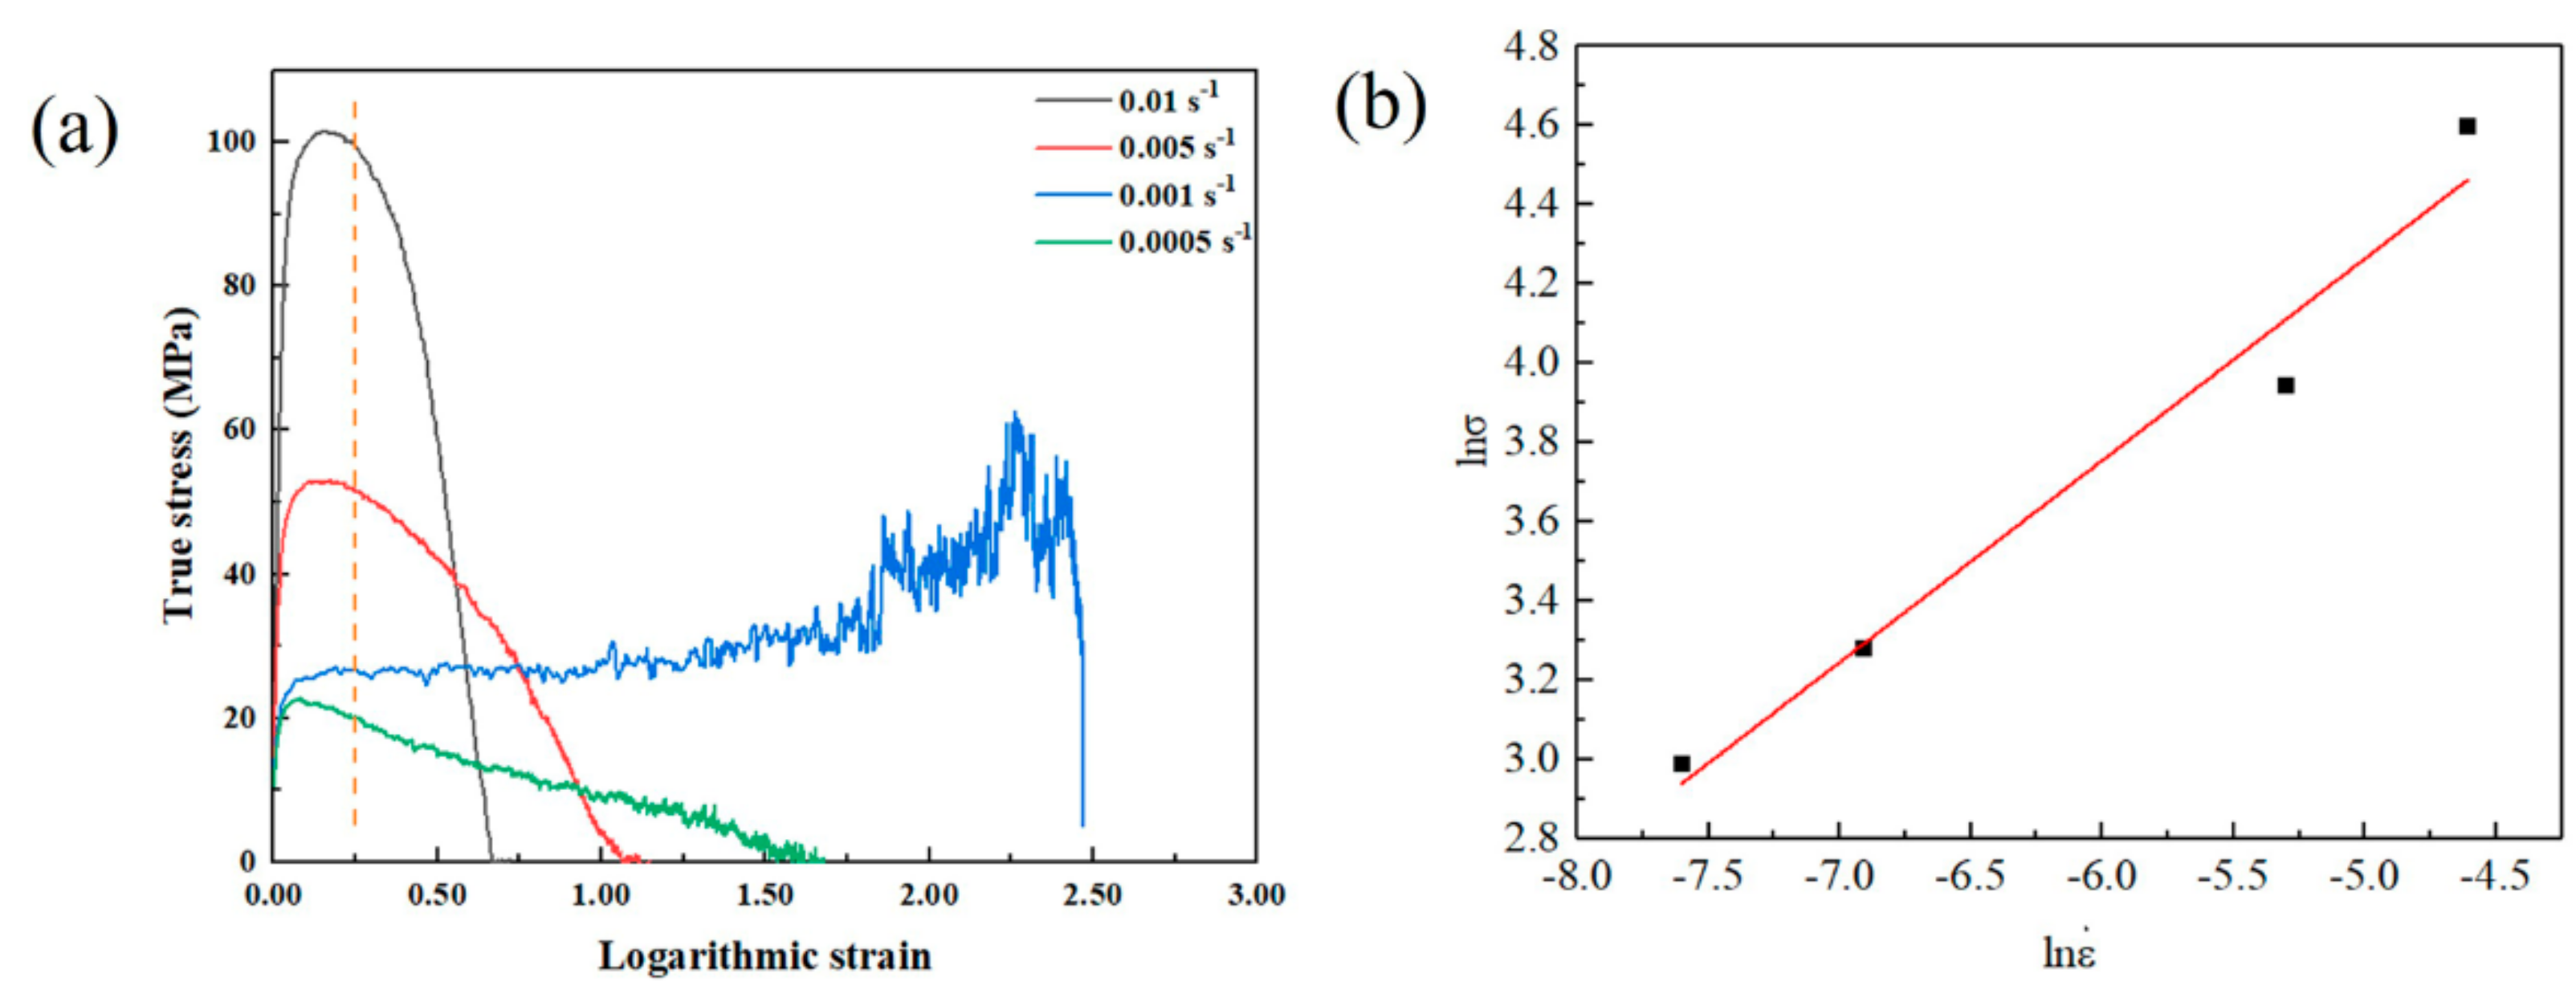
Figure 3a shows the true stress-logarithmic strain responses under different strain rates at 400 °C. The flow stress is cited as the logarithmic stress at the true strain of 0.25, where the material is in a relatively stable deformation stage. The strain rate sensitivity exponent m can be determined from the logarithm of tensile stress versus logarithmic strain rates, as shown in Figure 3b. The value of m is calculated to be 0.51, K is estimated to be 1038.03 MPa·s on account of the flow stress curves at 400 °C with different strain rates. Hidetoshi Somekawa [18] summarized that the flow stress of the extruded AZ31 alloy has little strain rate dependence, and the m-values are ~0.01. Besides, the m-values of Mg-Bi alloys are calculated to be 0.22–0.30. The obtained m-values in the present alloys are 0.51, grain-boundary sliding is known to be the rate-controlling mechanism [19]. Thus, the material in this paper could be applied to the SPF process.
3.2. Interface Microstructure and Shear Strength
3.2.1. Bond Formation Mechanism Assisted with Pure Cu Interlayer
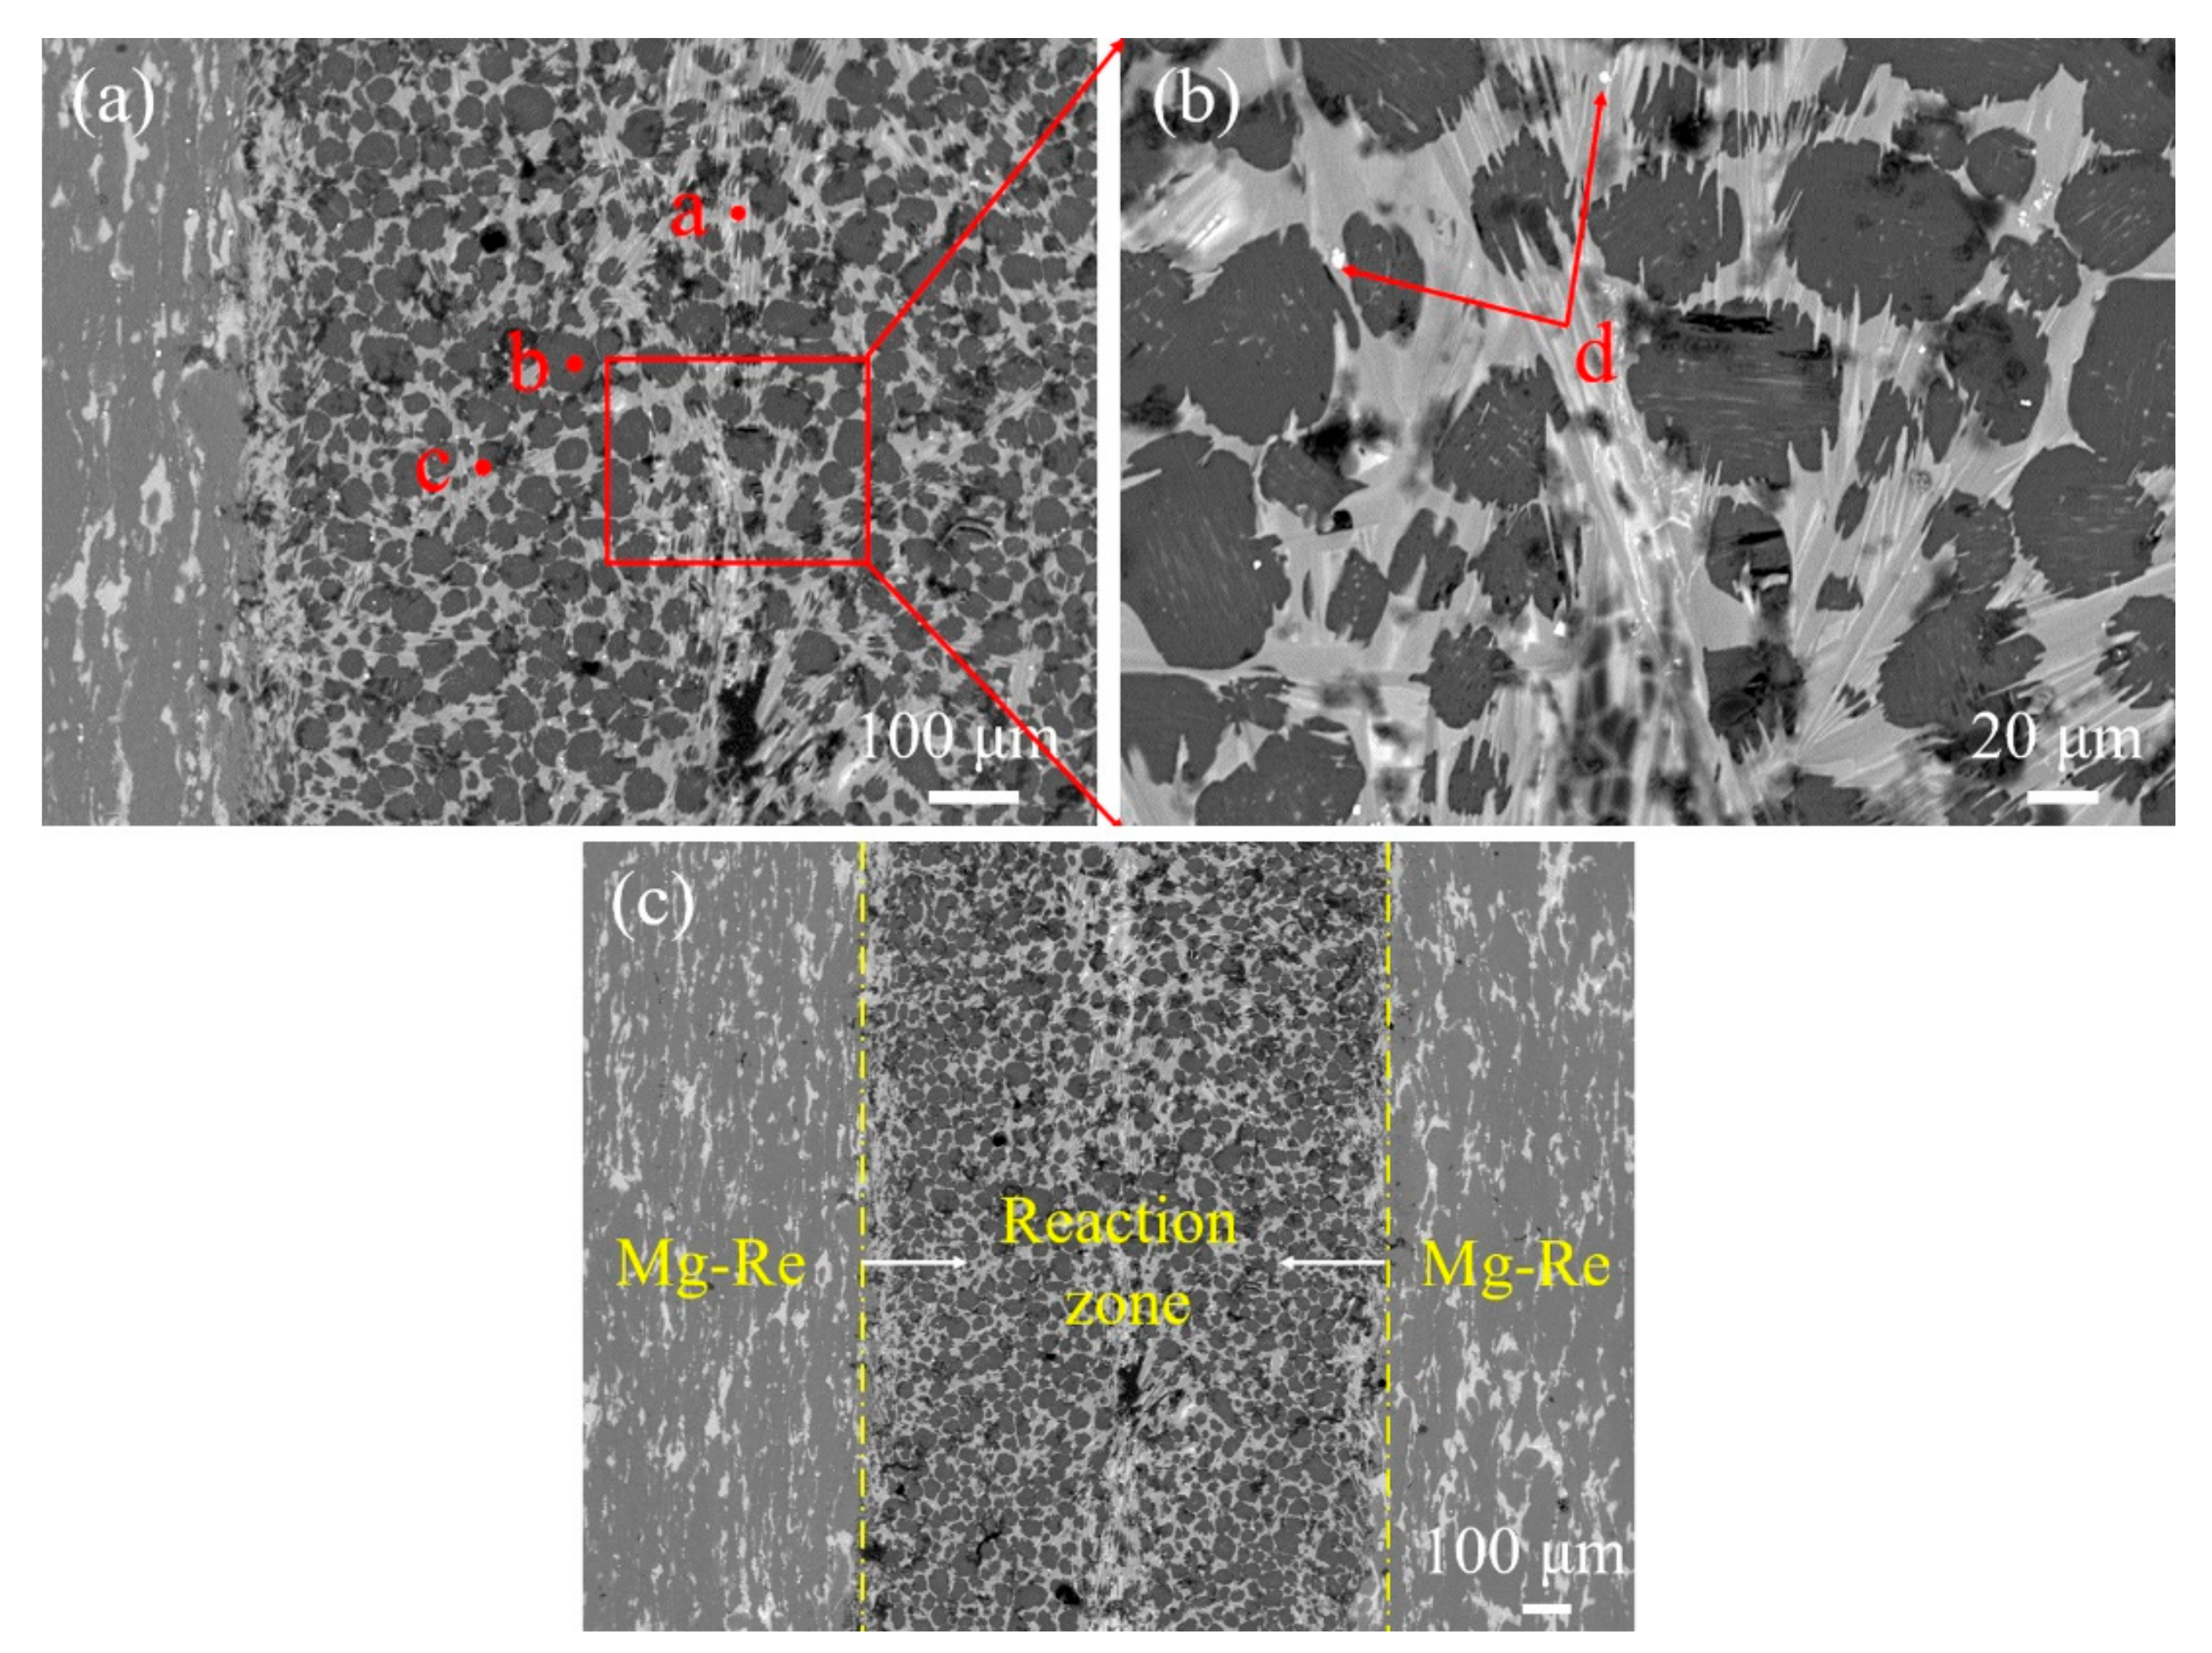
According to the Mg-Cu binary phase diagram shown in Figure 4, the melting point of Cu is 1084.87 °C, while Mg is 649 °C. The possible reaction products of Mg and Cu may be Mg2Cu and MgCu2 intermetallic compounds. Significantly, the solubility of Mg in Cu was about 4 at. %, while Cu was almost insoluble in Mg. The integrated morphology of diffusion bonding joints at 440 °C, 1500# for 30 min under 2 MPa is shown in Figure 5. The joint can be divided into three zones from left to right: Mg-Re substrate zone, copper diffusion and reaction zone, and Mg-Re substrate zone. In order to determine the composition of the interface microstructure, the spectroscopic point scanning analysis was performed on the phases with a characteristic morphology, and the EDS analysis results are shown in Table 2. It can be concluded that point a near the weld and its similar microstructure are Cu(Mg) solid solution; point b inside the grain which is in the reaction zone may be α-Mg; the light grey phase (point c) between grain boundaries could be MgCu2, and the white spherical particles (point d) are probably Mg2Cu.
It has been shown that heating binary metals in close contact will activate the atoms. Due to the concentration gradient, heterogeneous atoms diffuse to form a solid solution until one reaches its solid solubility. Subsequently, the organization loses its stability and forms a new crystal nucleus, which continuously grows to form a new phase, the intermetallic compound layer. According to the melting point of Mg and Cu, diffusion transfer of Mg occurs more easily than Cu at the same temperature. At the initial stage of diffusion, saturated Cu (Mg) solid solution formed immediately on the copper side due to the limited solid solubility of Mg in Cu. With the extension of holding time, the MgCu2 intermetallic compound layer generates owing to the instability of the supersaturated solid solution. As for the side of the Mg substrate zone, the activated Cu atoms prefer to diffuse along the grain boundaries where dislocations, vacancies, and other defects exist. When the atomic percentage of Mg and Cu reaches 2:1, the Mg2Cu phase precipitates out.
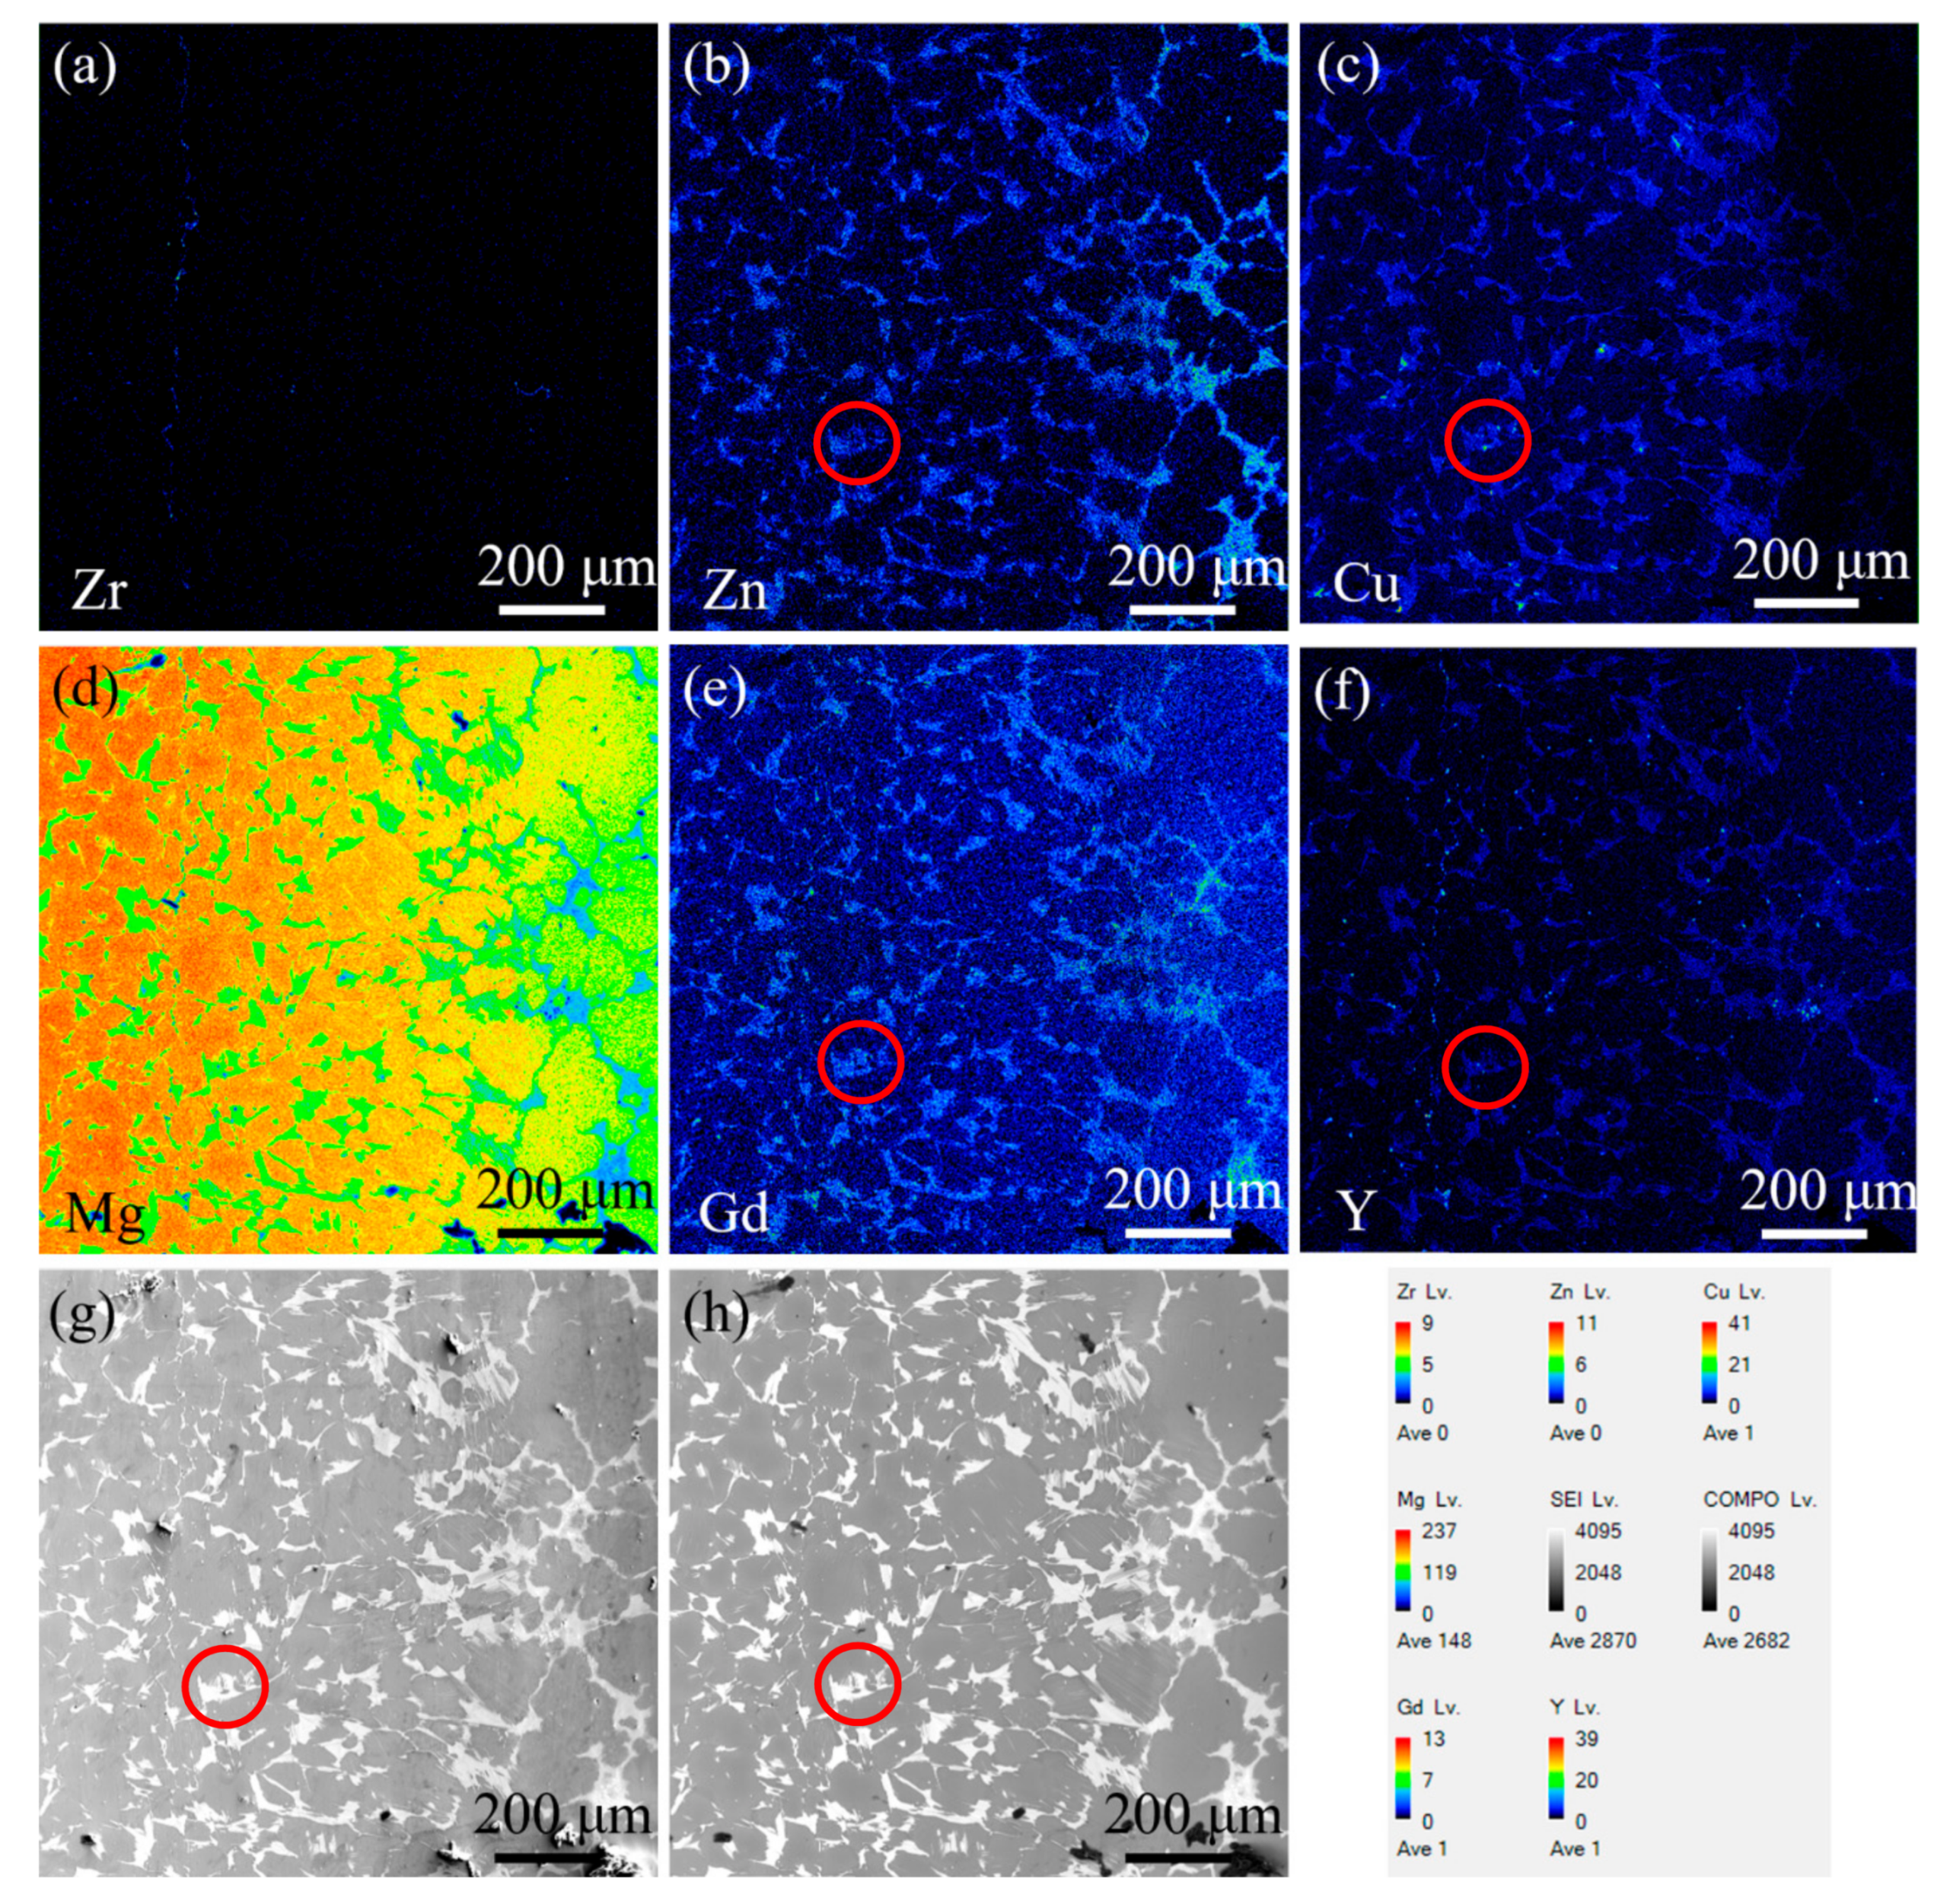
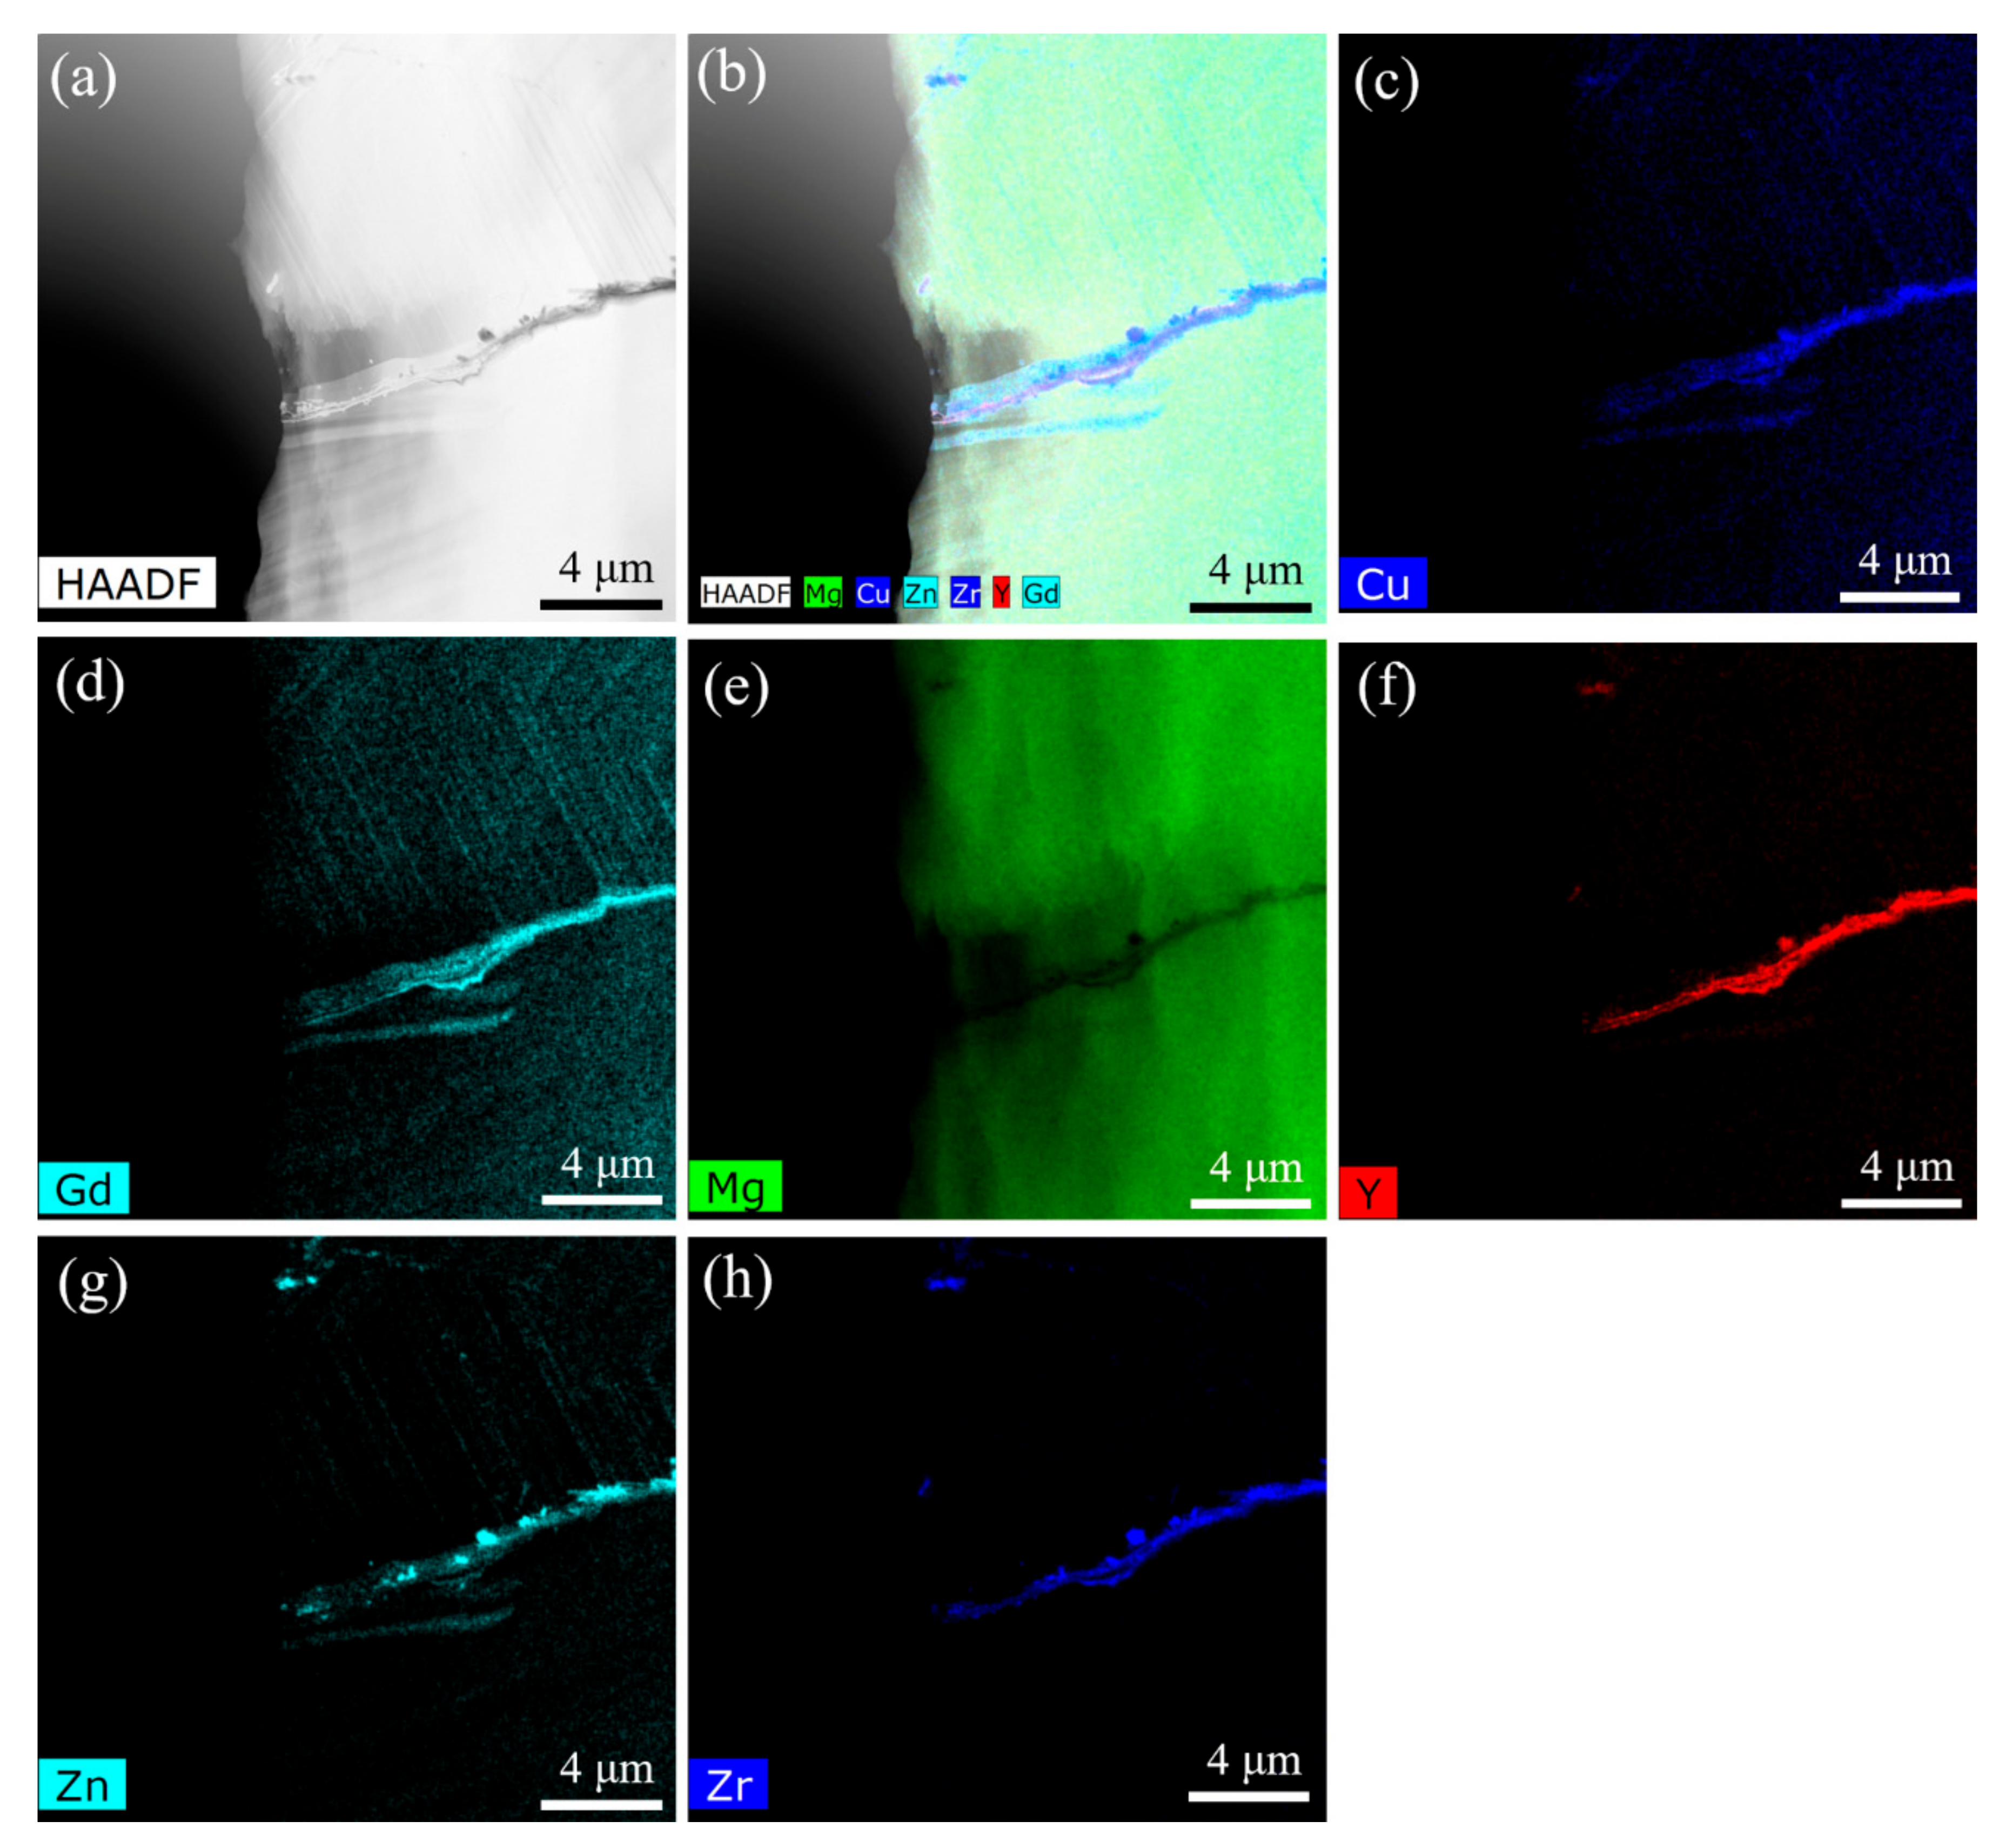
Figure 6 shows the SEM-EDS element distribution maps of all elements of the joint bonding at 480 °C, 1500# for 30 min under 2 MPa. It can be seen that the bright area is the enrichment phase of rare earth elements and magnesium-copper compounds, which distribute near grain boundaries, while the dark area is magnesium or magnesium-based solid solution, which distribute inside the grains. Cu element is evenly distributed. This proves once again that Cu diffused along grain boundaries. Taking the middle part of the circle in Figure 3 as an example, the distributions of Cu, Zn, and rare earth elements are much the same, mostly distributed near the grain boundaries. It is confirmed again that Cu, Zn, and rare earth elements prefer to diffuse along the grain boundaries. Figure 7 shows the TEM-EDS element distribution maps of all elements of the joint bonding at 480 °C, 1500# for 30 min under 2 MPa. It can be seen that the width of the weld containing blocky particles and non-eutectic phases is approximately 0.5 μm. The particles in the vicinity of the weld are mainly composed of Cu, Zn, Y, Zr elements, and the generates with multiple elements need to be further investigated.
3.2.2. Effect of Bonding Temperature on the Microstructure of Mg-Re Alloy
For diffusion bonding with the addition of an intermediate layer, the effect of temperature on the diffusion joint can be summarized as follows: (1) the movement ability of atoms at the interface, which means the diffusion ability of Mg and Cu elements; (2) phase transformation and recrystallization process of the joint organization.
The relationship between diffusion coefficient and temperature can be expressed by the Arrhenius-type equation (Equation (4)) [13]
where D is diffusion coefficient (m2∙s−1); D0 is the proportionality constant (m2∙s−1), independent of temperature for Equation (4) is valid; Q is the activation energy (J∙mol−1); R is the molar gas constant (8.314 J∙mol−1∙°C−1); T is the temperature (°C).
D = D0exp(−Q/RT)
Table 3 shows the proportionality constant and activation energy of Mg and Cu. The diffusion coefficient of the element at any temperature can be obtained according to the Arrhenius-type equation. It is calculated that the diffusion coefficient of Cu atoms in Mg crystals is much larger than that of Mg atoms in Cu crystals at the same temperature. Taking 440 °C as an example, the diffusion coefficient of Cu atoms in Mg crystals is 1.07 × 10⁻¹² m2∙s−1, while that of Mg atoms in Cu crystals is 0.83 × 10⁻¹⁶ m2∙s−1. The difference between them is 4 orders of magnitude, which is why the area of the Cu-based solid solution zone in the diffusion interface is much smaller than that of MgCu2.
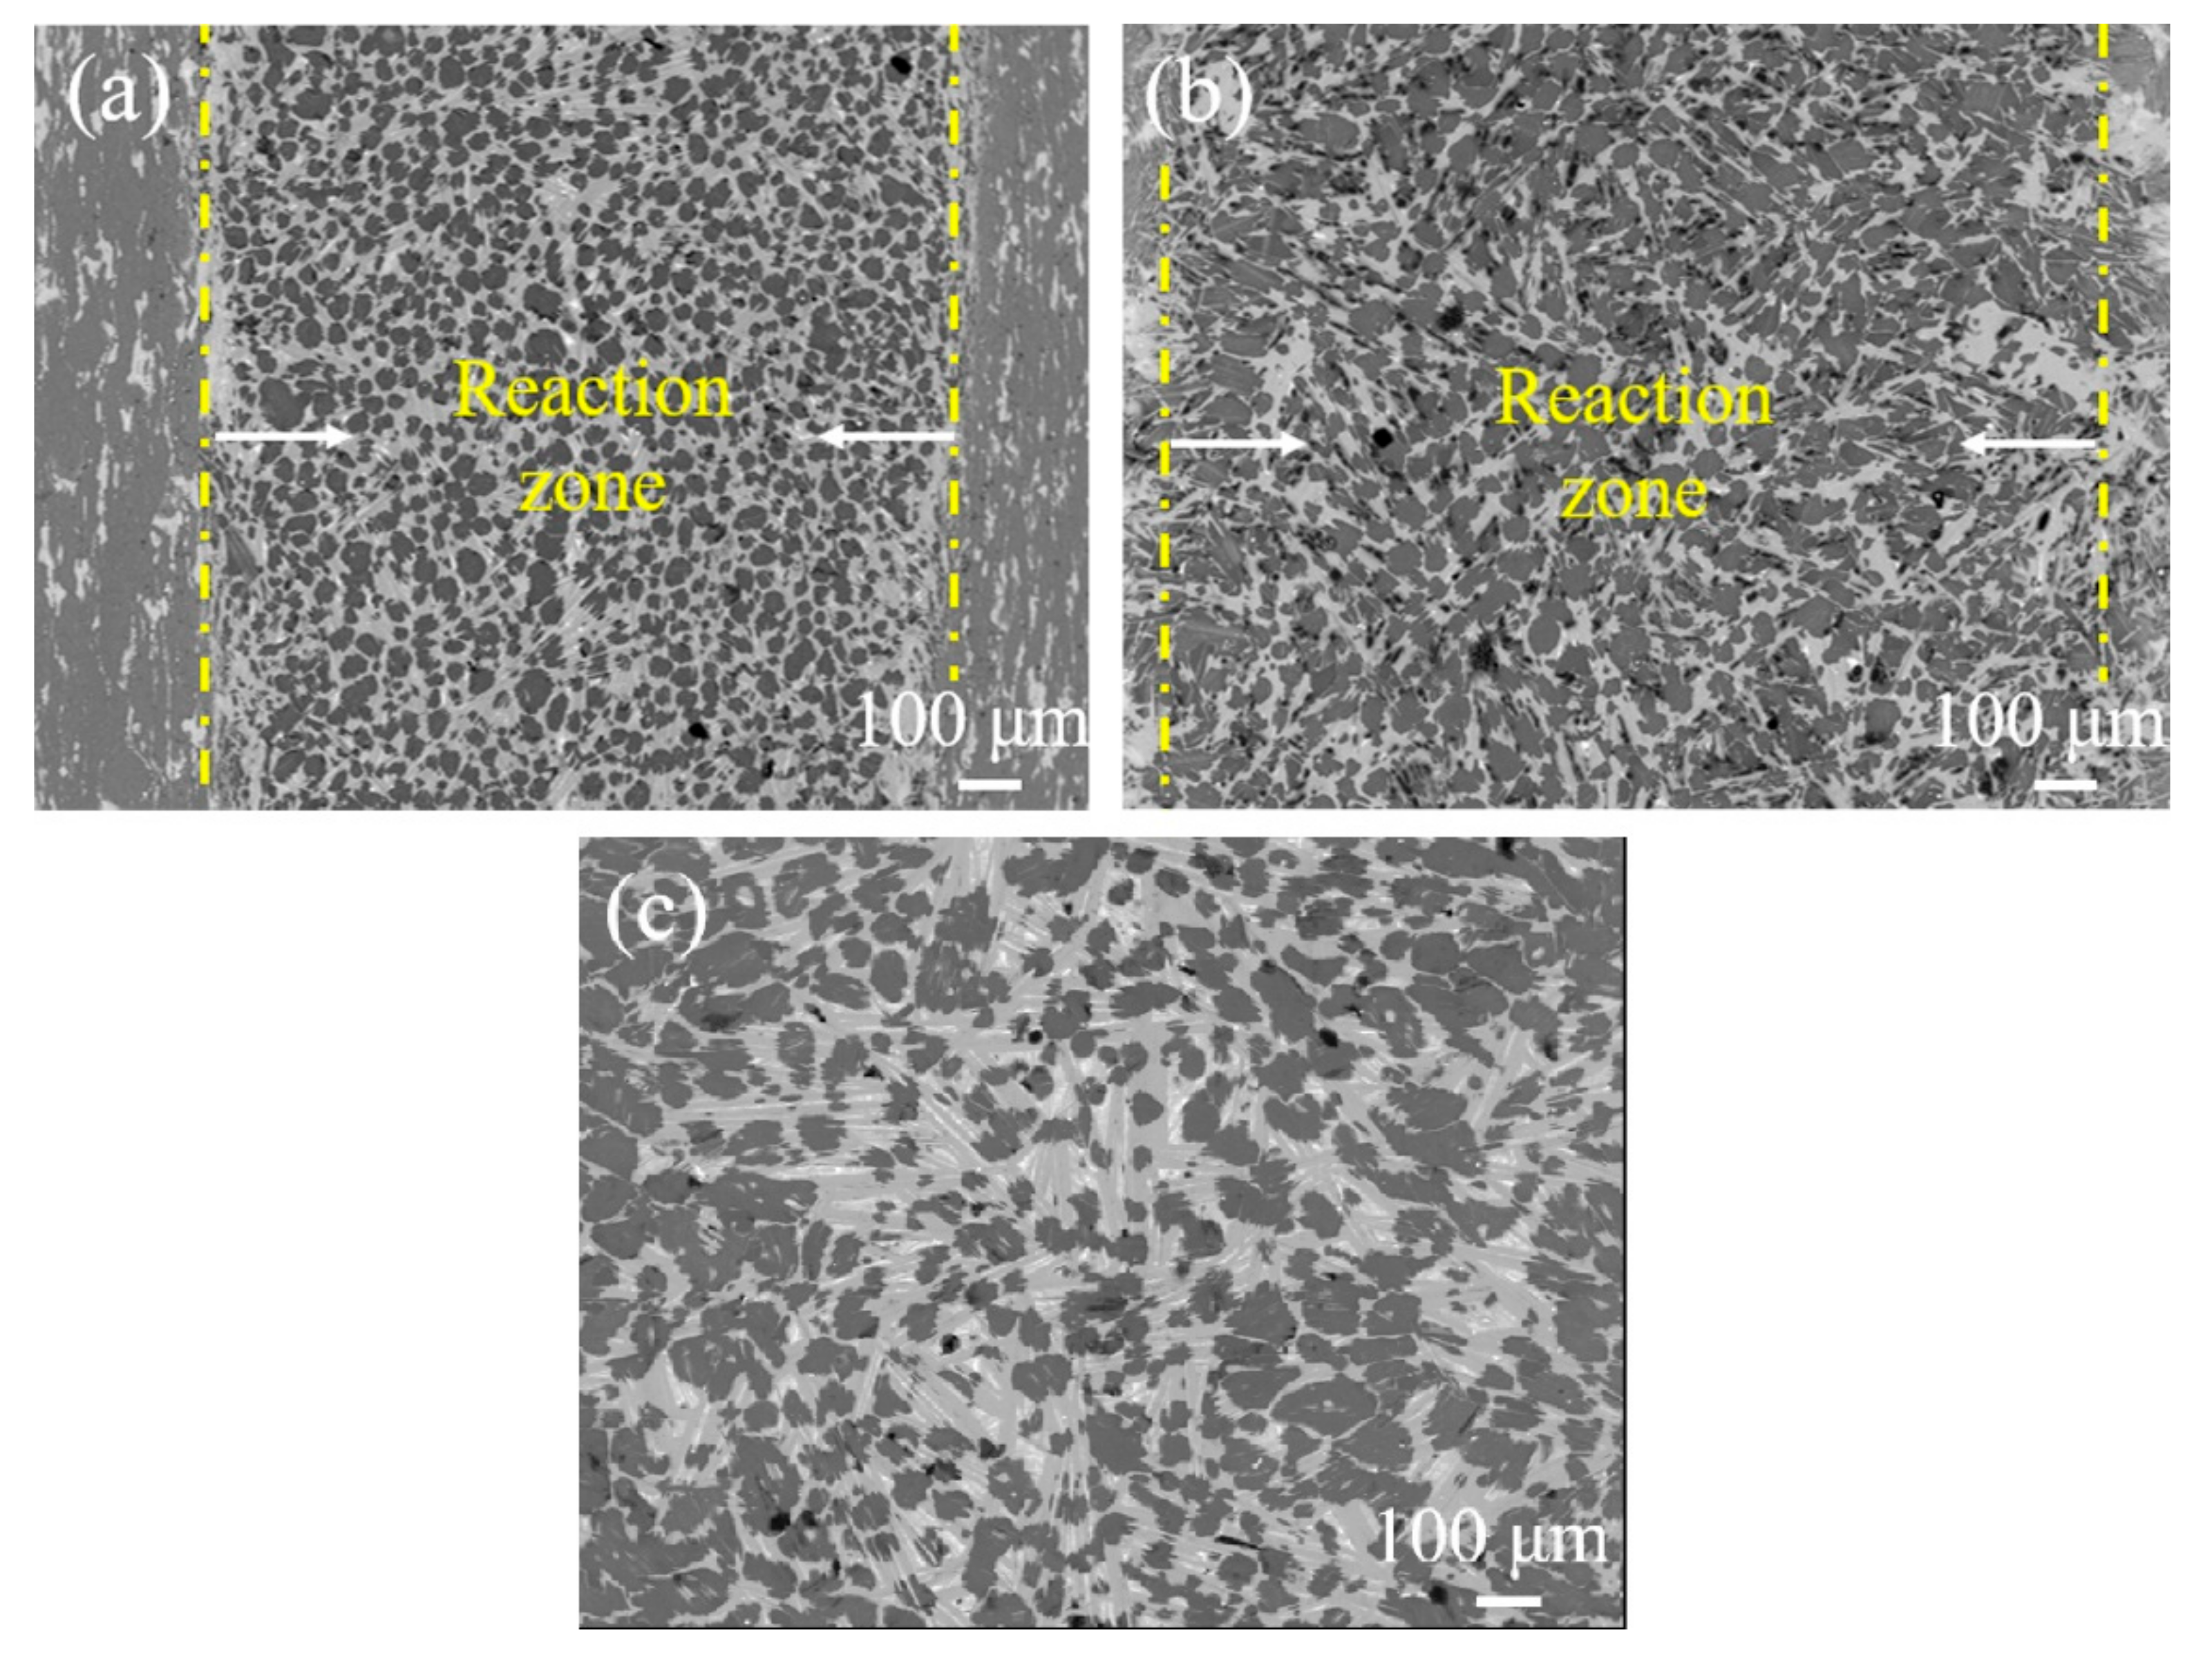
Figure 8 shows the microstructure of the diffusion interface at different temperatures with the same roughness. According to Equation (4), we can know that the mutual diffusion coefficient between Mg and Cu atoms has an exponential growth relationship with temperature. Therefore, the area of the MgCu2 phase and the width of the reaction zone increase as the temperature rises. When the temperature elevated from 440 °C to 460 °C, the grain size of α-Mg grows slightly, with an average size of about 30 μm. In contrast, it grows to about 70 μm at 480 °C, which may greatly impact the strength of the joints.
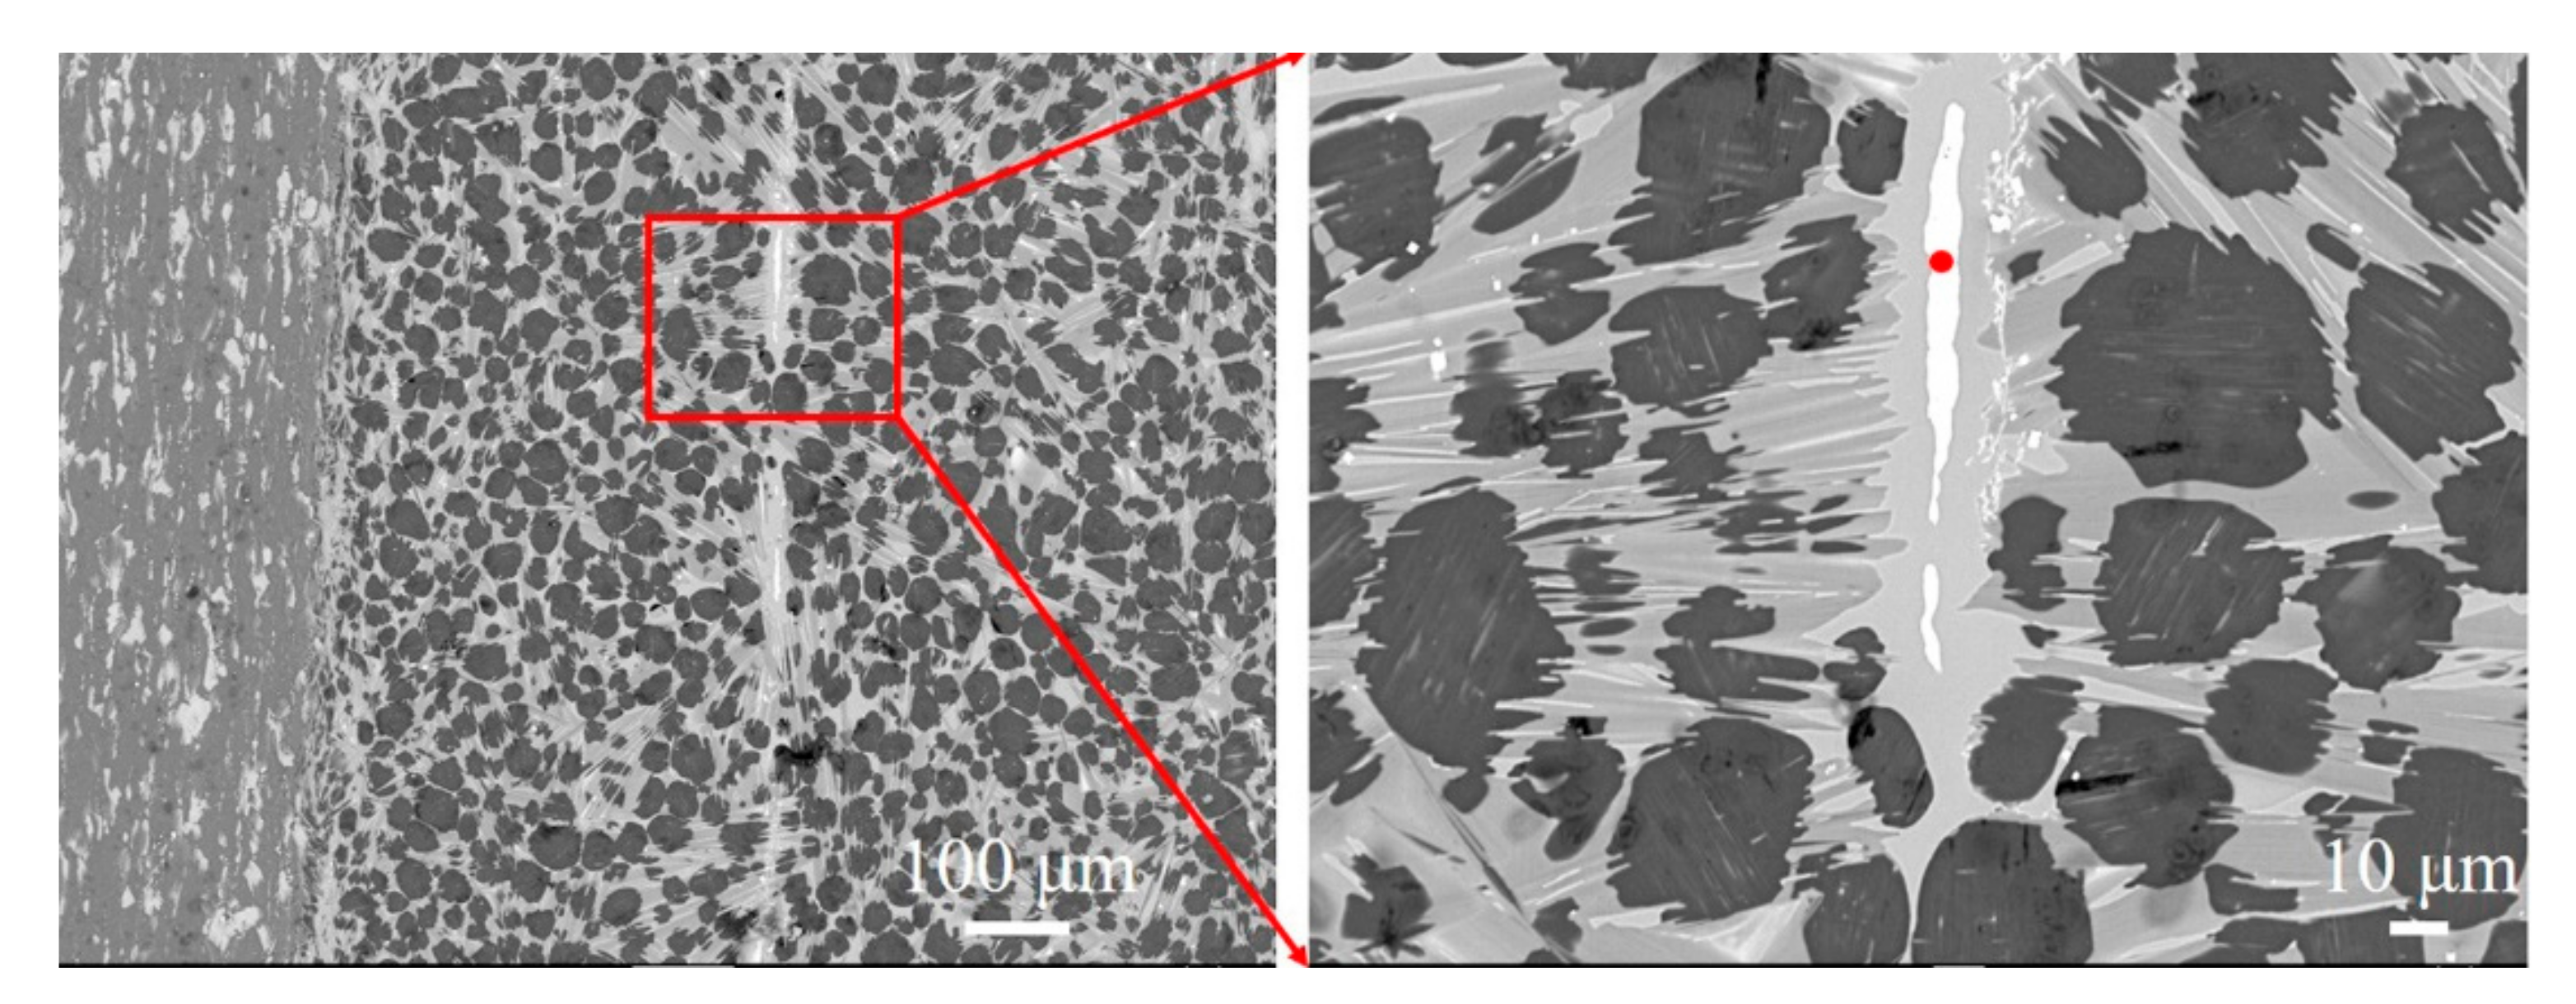
Figure 9 shows the microstructure of the joint bonding at 440 °C, 180# for 30 min under 2 MPa. The EDS results of the highlighted point in Figure 8 show that Cu’s atomic percent is as high as 99.76. Tt is reasonable to assume that the Cu element is not completely diffused at this temperature. In conclusion, grain size growth is not obvious, and the diffusion of Cu is thorough at 460 °C, which means that 460 °C may be the ideal diffusion bonding temperature of Mg-Re alloy.
3.2.3. Effect of Interface Roughness on the Microstructure of Mg-Re Alloy
As for diffusion bonding without an intermediate layer, the roughness of the diffusion interface will significantly affect the micro-contact of the bonding interface. For relatively active metals, the diffusion bonding mechanism is as follows: the elongation of alloy and compact oxide film covered on the substrate is quite different; the oxide film breaks first, leading to local contact at the place of the rupture under the same deformation conditions. With the heat preservation and pressure retention, the oxide film continuously ruptures and begins to form eutectic planes, eventually forming a stable diffusion joint. However, for the diffusion bonding with the intermediate layer, the connection mechanism is mainly that the atoms at the interface are activated in a certain temperature and pressure conditions. The atoms of binary metals will mutually diffuse to form a solid solution owing to the concentration gradient between the heterogeneous elements. When the solid solubility reaches a supersaturated state of one of the elements, the organization loses its stability and forms a new crystal nucleus, which continuously grows to form a new phase, that is, the intermetallic compound layer, and finally form a stable diffusion joint.
Figure 10 shows the microstructure of the diffusion bonding joint at the same temperature with different roughness of interface. It can be seen that the widths of the reaction zone hardly change with different roughness. The grain sizes and the area of the intermetallic compound layer at the grain boundary are almost the same. This demonstrates that there is little relationship between diffusion coefficient and roughness of interface for reaction-diffusion bonding.
3.2.4. Shear Strength of the Diffusion-Bonded Joints
Figure 11 shows the shear strength of joints under different diffusion bonding conditions. It can be concluded that the shear strength is significantly influenced by the temperature, while there is little relationship between the shear strength and the roughness of the interface. The shear strength at 480 °C (108 MPa) is generally low, which may be caused by the growth and softening of the grains. In contrast, the shear strength at 440 °C (130 MPa) is relatively high though the diffusion of Cu is not thorough. Furthermore, the shear strength is up to 150 MPa at 460 °C. The grains of the interface at 460 °C grow inapparently, and the diffusion of the Cu element is relatively uniform. In order to verify the specific shear performance of the specimens after diffusion, the base material was cut into the same size as the shear samples, and the shear test was carried out. The shear strength of the base material was measured to reach 154 MPa. Take the highest strength specimen from nine groups for comparison; the shear strength of the specimen obtained after diffusion could reach 98.7% of the matrix. Figure 12 shows the image of the joint bonding at 440 °C and the base metal after the shear test. It is worth noting that the fracture of the specimen occurred at the base material rather than at the interface.
3.3. Superplastic Forming and Reaction Diffusion Bonding of the Double Hollow Structural Component
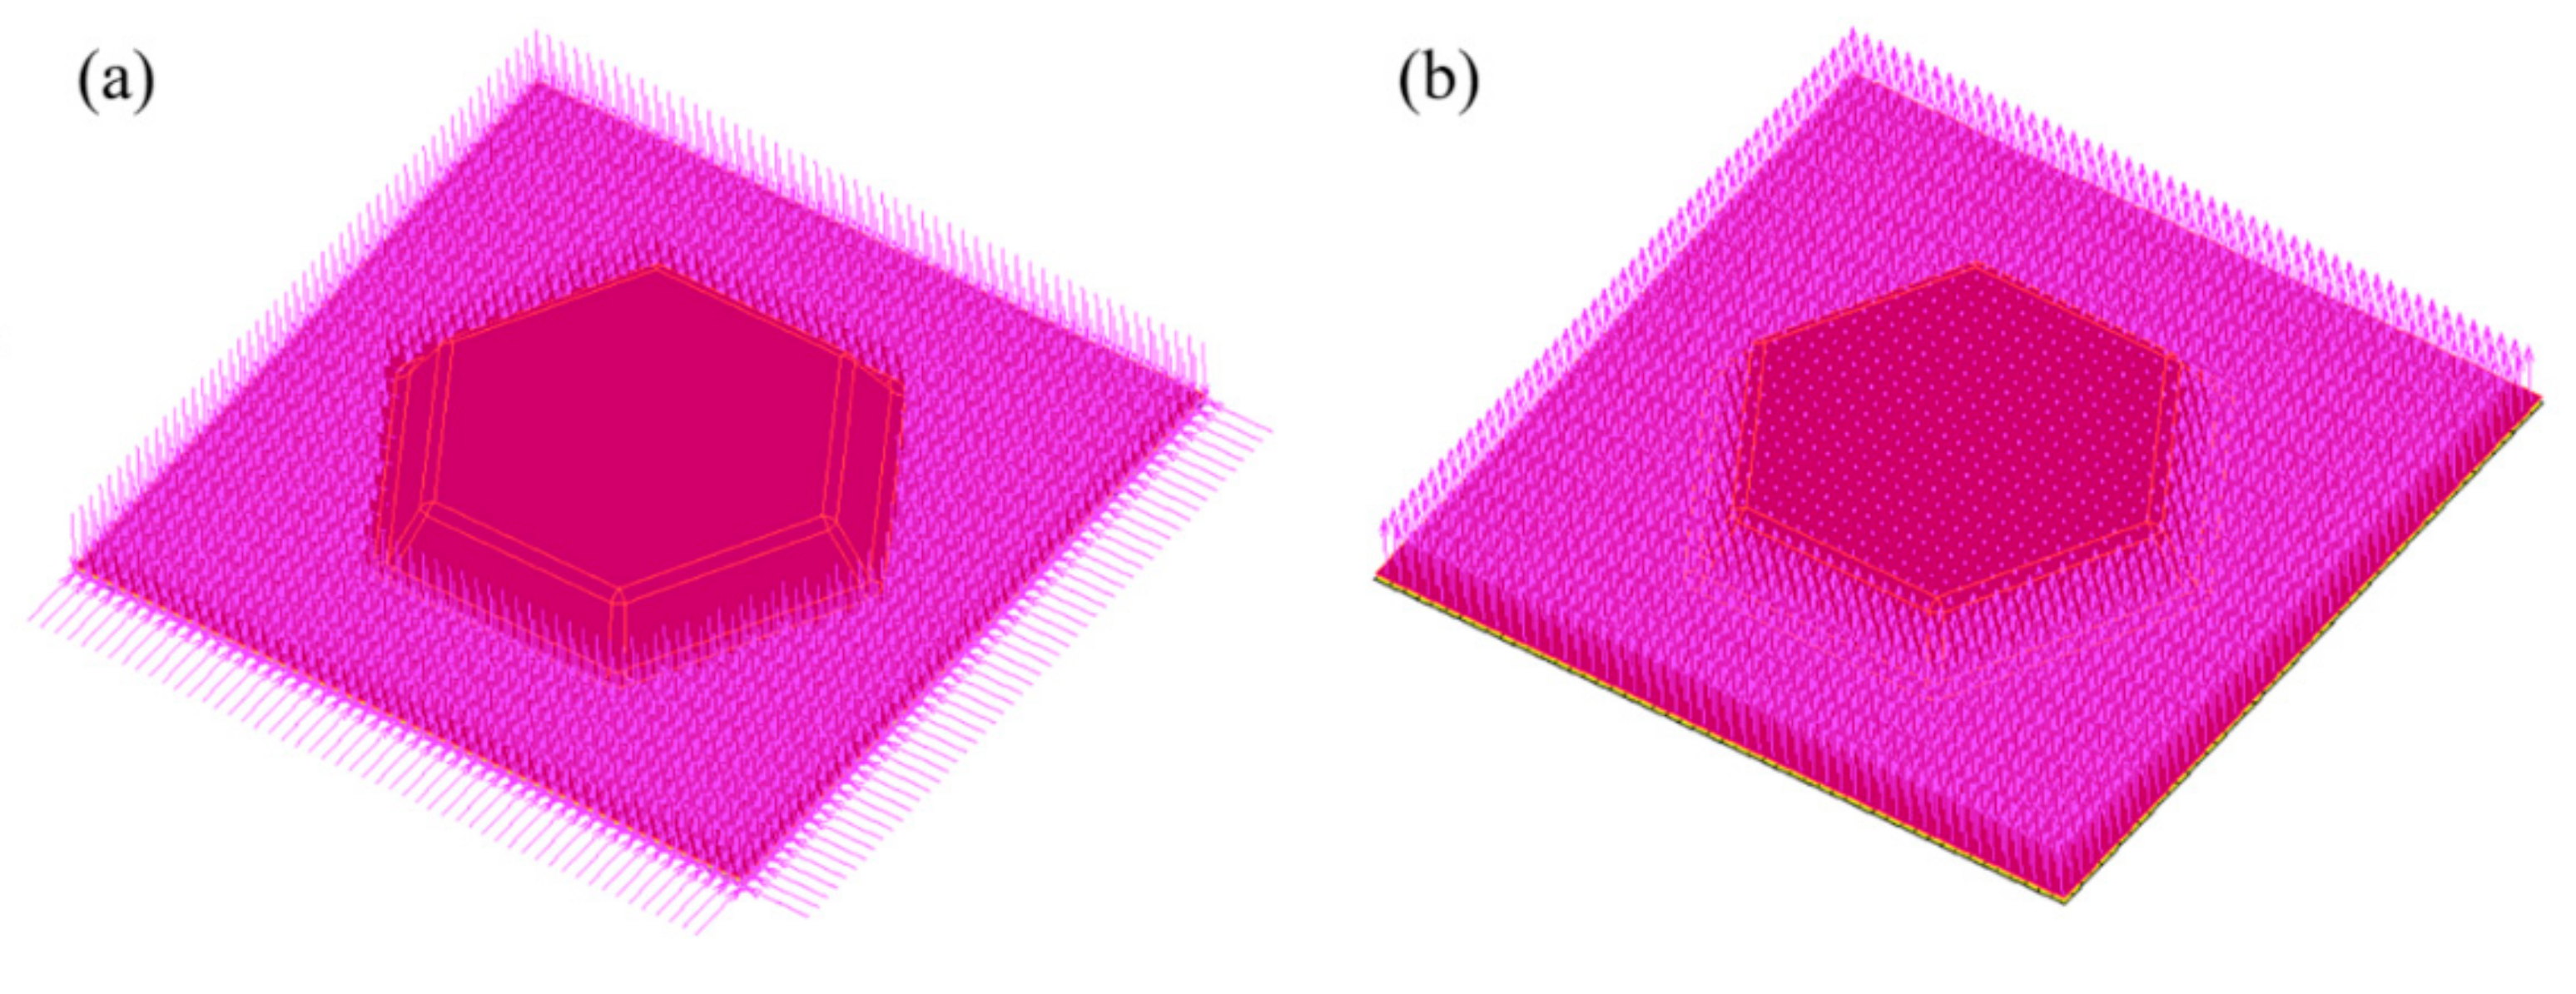
Figure 13 illustrates the sheet thickness distribution of a double hollow structural component during superplastic forming by finite element analysis (FEA). It has been demonstrated in Section 3.1 that Mg-Re alloy exhibits maximum ductility at the strain rate of 1 × 10⁻³ s−1. Hence, the strain rate for FEA was set to be 1 × 10⁻³ s−1. Due to the symmetry of the component, the simplified 1/2 model was applied for the FEA. There are 2500 elements in the component which are set as deformable, while the die is set as a rigid body. The Backofen equation describes the constitute equation of FEA, and the strain rate sensitivity coefficient m was chosen to be 0.51 with the material coefficient K = 1038.03, which are the same as stated in Section 3.1. Figure 14 shows the boundary conditions of the finite element model. Since argon gas pressure is the driving source for forming, the face load was applied to the whole sheet surface along the sheet’s normal direction. During the forming process of the sheet, the diffusion bonding area did not participate in the deformation, so the node displacement was set to 0, which meant displacement X = displacement Y = displacement Z = 0.
In the beginning, the center section of the blank is brought into contact with the cavity and gets thinning. Then the forming process is hindered by the sheet/die interface friction. With the gradual increase of argon gas pressure, the blank continues to fit the mold. The round corner, which requires a larger forming force, was the thinnest part of the component during superplastic forming.
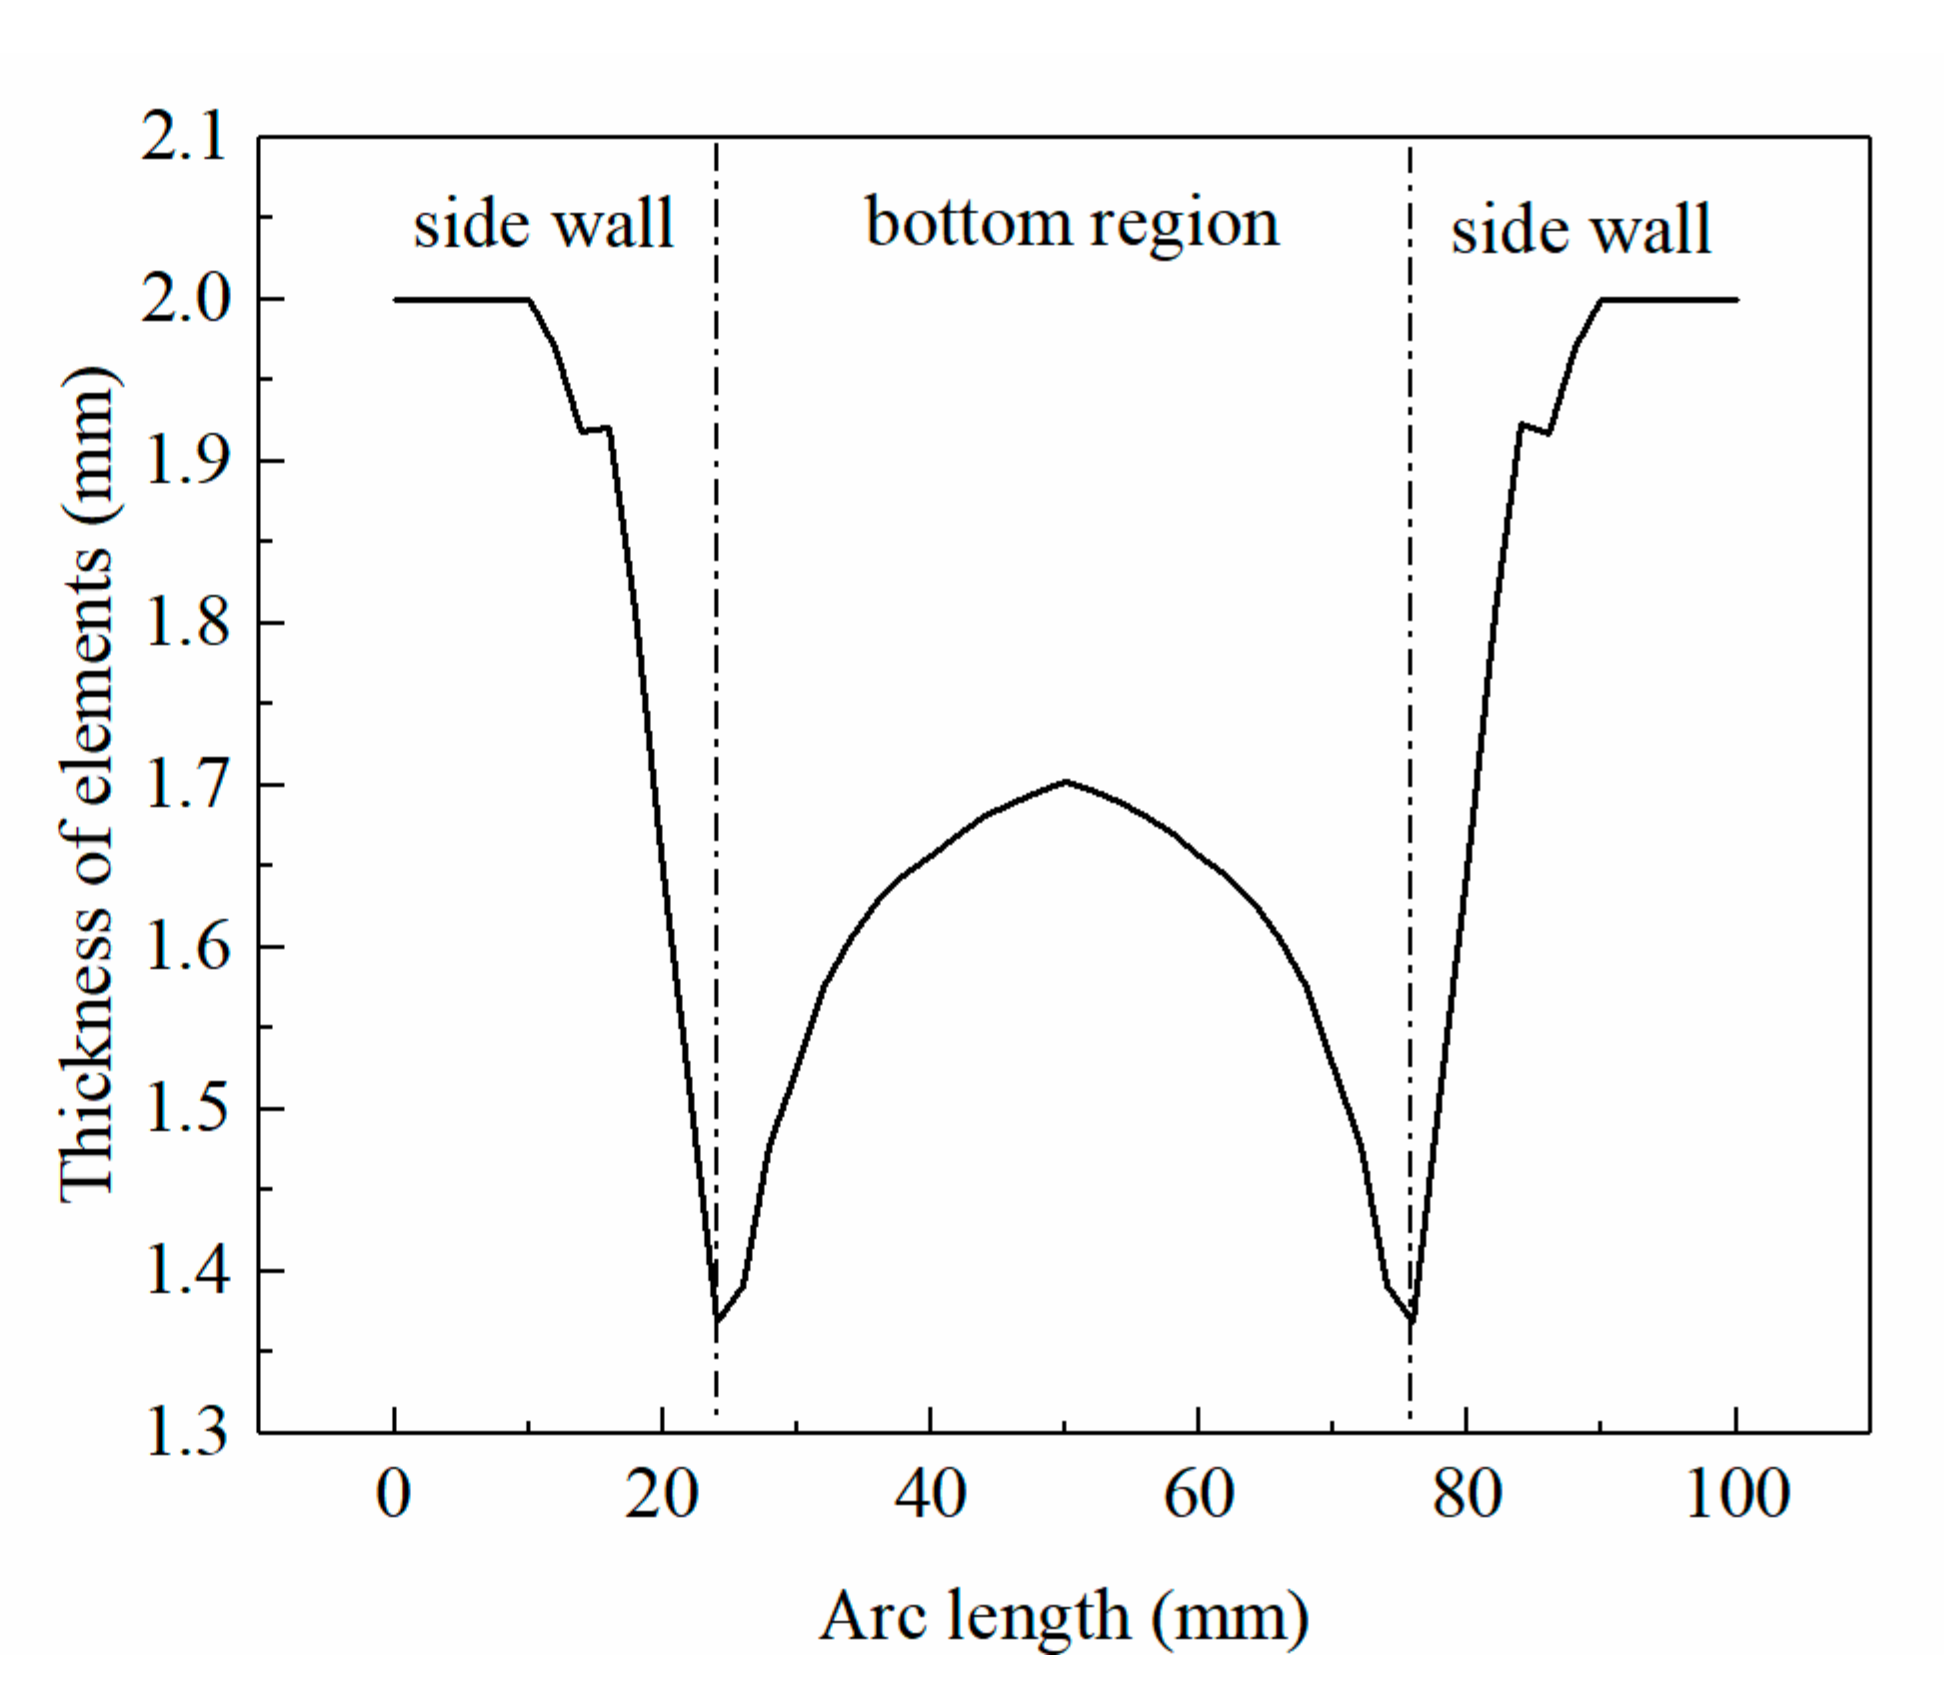
The thickness distribution from the flange to the bottom region of the final component predicted by FEA is shown in Figure 15. It can be seen that the thickness decreases gradually from 2 mm of the flange to 1.6 mm at the bottom of the component. In addition, the maximum thinning rate was 34% at the round corner.
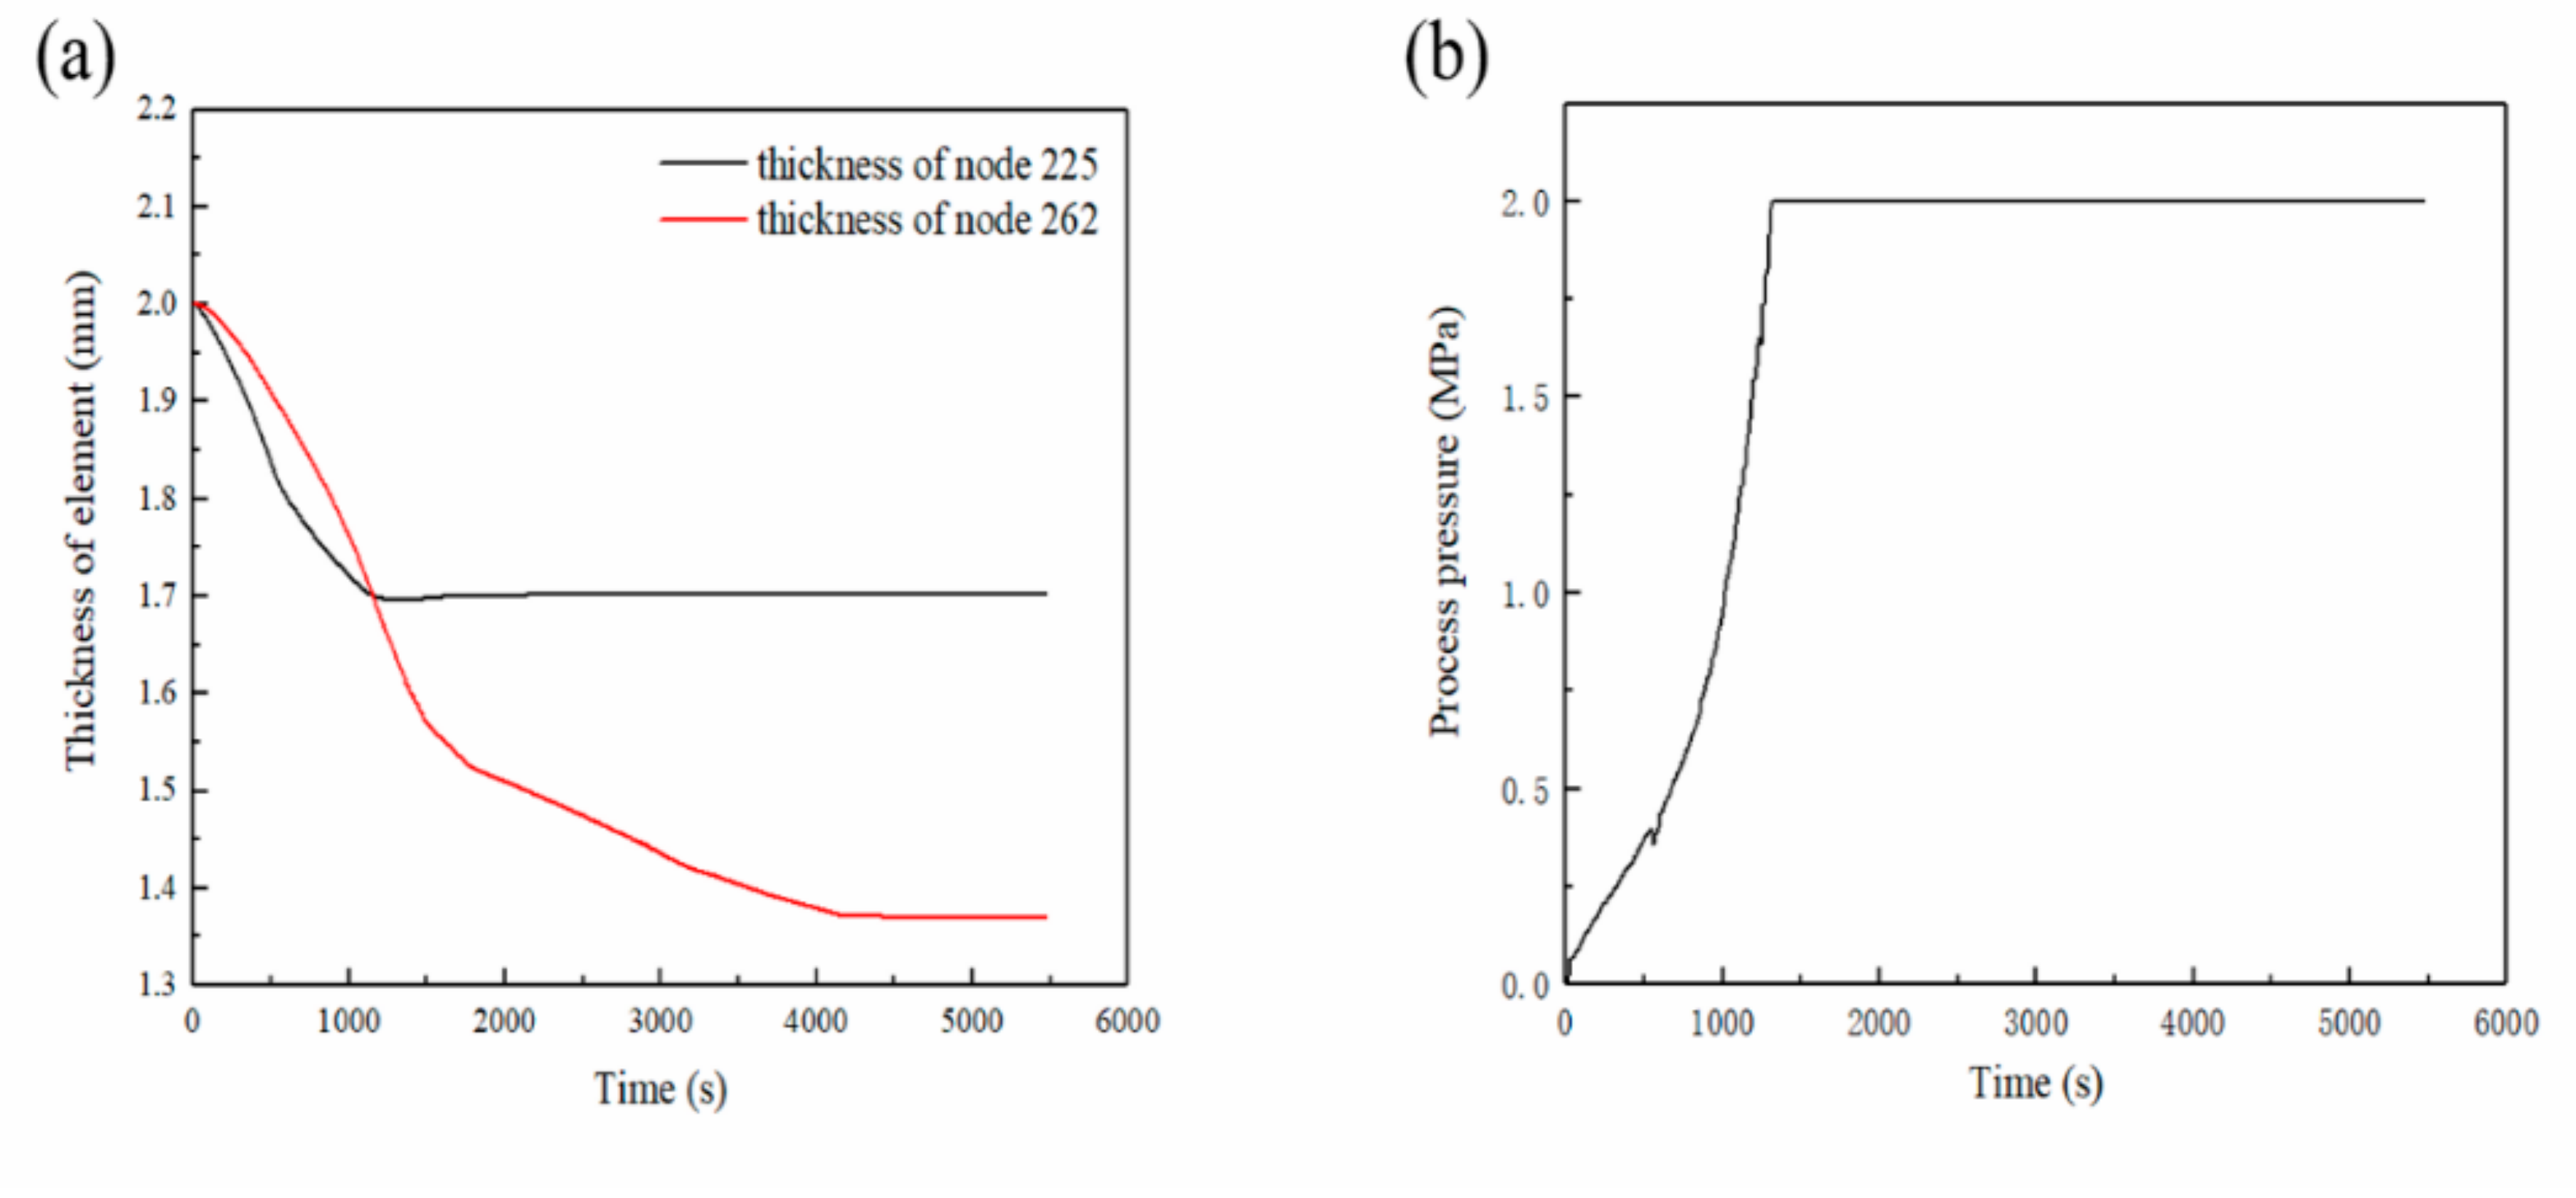
Figure 16 illustrates different nodes’ thickness variation with time and the process pressure predicted by FEA. It should be noted that the position of node 262 is at the round corner, while node 225 is at the bottom center of the component. The thickness of node 252 decreases rapidly from 2 mm to 1.7 mm and keeps stable. On the other hand, the rate of thickness thinning at node 262 slows down around 1500 s, implying that more pressure is required for deformation at this time, which can be reflected in the process pressure-time curve, where the slope of the curve increases. Besides, the pressure-time curve predicted by FEA in Figure 15 can be used to guide the subsequent SPF process.
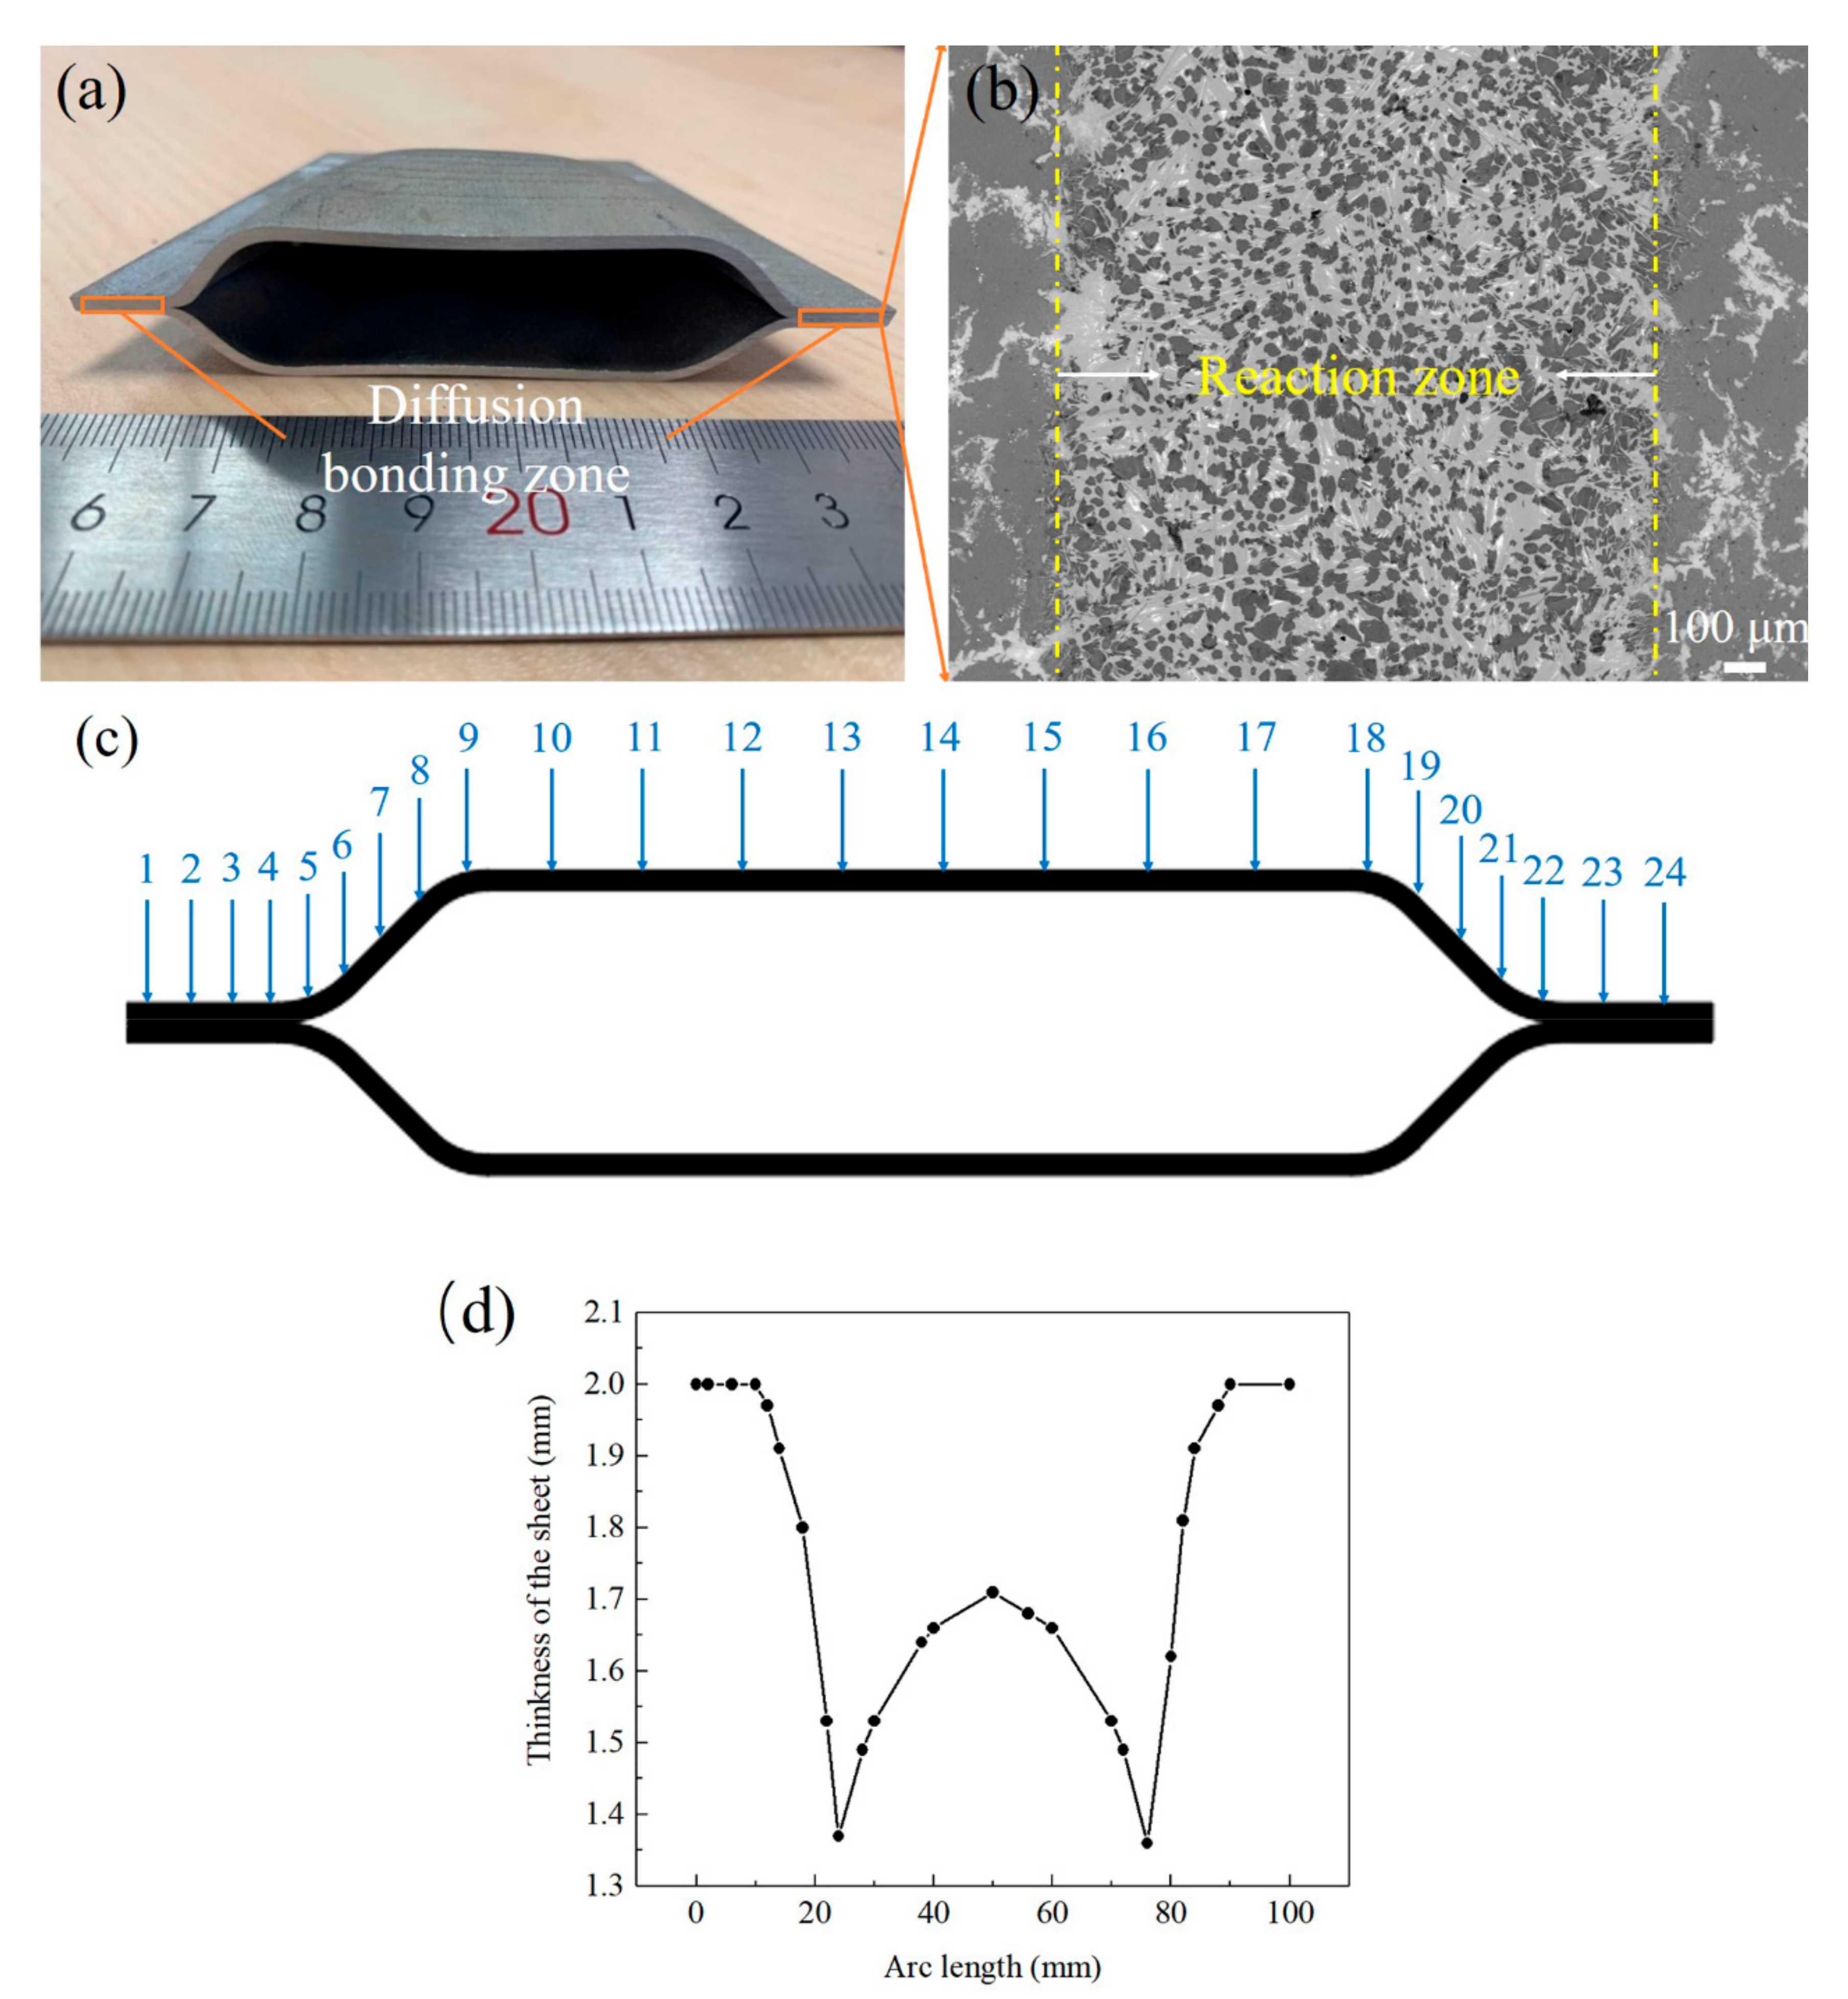
The SPF/RDB process is carried out to fabricate the hollow structural component on the superplastic forming machine (Hefei Haide CNC Hydraulic Equipment Co., LTD, Hefei, China). It has been demonstrated in Section 3.2 that the optimal temperature of the RDB is 460 °C. Thus, the sheets are diffusion bonded at 460 °C with argon gas pressure of 2 MPa for about 30 min. Subsequently, the SPF of the sheets is carried out at 400 °C with the target strain rate of 0.001 s−1. The thickness distribution of the finished double hollow structural component is illustrated in Figure 17. Similar to results predicted by FEA in Figure 15, the thickness reduces dramatically at the round corner with a thinning rate of about 35%.
4. Conclusions
The superplastic characteristic and mechanical properties of Mg-8.3Gd-2.9Y-0.8Zn-0.2Zr alloy sheets at 250–450 °C were studied. Besides, the effect of bonding temperature and interface roughness on microstructure and mechanical properties of the reaction diffusion-bonded joints with a Cu interlayer was investigated in this paper. The following conclusions can be drawn:
The maximum elongation of Mg-Re alloys is 1276.3% at 400 °C under a strain rate of 1 × 10⁻³ s−1. The value of m and K at 400 °C is 0.51 and 1038.03, respectively.
The area of MgCu2 phase and the width of the reaction zone increase as the temperature raises. Besides, the Cu element diffuses incompletely at 440 °C. However, there is little relationship between diffusion coefficient and roughness of interface for reaction-diffusion bonding.
The shear strength is significantly influenced by the temperature, while there is little relationship between the shear strength and interface roughness. The highest shear strength of the joints is diffused at 460 °C, reaching 152 MPa, which is 98.7% of the base metal.
Experimentally, a double hollow structural component was manufactured by SPF/RDB process. The thickness reduces dramatically at the round corner with a thinning rate of about 35%.
Author Contributions
P.P.: literature search, data analysis, data interpretation, figures, writing, finite element analysis; S.J.: literature search, study design, data collection; Z.Q.: literature search, fund support, finite element analysis; Z.L.: study design, finite element analysis, literature search. All authors have read and agreed to the published version of the manuscript.
Funding
The National Natural Science Foundation of China (51775135) and the NSAF Joint Fund (U1830119).
Data Availability Statement
Not applicable.
Acknowledgments
The authors acknowledge the funding support from the National Natural Science Foundation of China (51775135) and the NSAF Joint Fund (U1830119).
Conflicts of Interest
The authors declare that they have no known competing financial interests or personal relationships that could have appeared to influence the work reported in this paper.
References
- Horita, Z.; Matsubara, K.; Makii, K.; Langdon, T.G. A two-step processing route for achieving a superplastic forming capability in dilute magnesium alloys. Scr. Mater. 2002, 47, 255–260. [Google Scholar] [CrossRef]
- Song, J.; She, J.; Chen, D.; Pan, F. Latest research advances on magnesium and magnesium alloys worldwide. J. Magnes. Alloy. 2020, 8, 1–41. [Google Scholar] [CrossRef]
- Yang, Y.; Xiong, X.; Chen, J.; Peng, X.; Chen, D.; Pan, F. Research advances in magnesium and magnesium alloys worldwide in 2020. J. Magnes. Alloy. 2021, 9, 705–747. [Google Scholar] [CrossRef]
- Taylor, S.; West, G.; Mogire, E.; Tang, F.; Kotadia, H. Superplastic forming characteristics of AZ41 magnesium alloy. Trans. Nonferrous Met. Soc. China 2021, 31, 648–654. [Google Scholar] [CrossRef]
- Zhou, H.; Zhang, C.; Han, B.; Qiu, J.; Qin, S.; Gao, K.; Liu, J.; Sun, S.; Zhang, H. Microstructures and Mechanical Properties of Nanocrystalline AZ31 Magnesium Alloy Powders with Submicron TiB2 Additions Prepared by Mechanical Milling. Crystals 2020, 10, 550. [Google Scholar] [CrossRef]
- Xu, C.; Nakata, T.; Fan, G.H.; Li, X.W.; Tang, G.Z.; Kamado, S. Enhancing strength and creep resistance of Mg–Gd–Y–Zn–Zr alloy by substituting Mn for Zr. J. Magnes. Alloy. 2019, 7, 388–399. [Google Scholar] [CrossRef]
- Guomin, L.; Yongfu, W. Cover Structure Design of Titanium Alloy Based on the SPF/DB Process. DEStech Trans. Mater. Sci. Eng. 2017. [Google Scholar] [CrossRef] [Green Version]
- Wang, N.; Chen, M.; Xie, L. Hot flow behavior characterization for predicting the titanium alloy TC4 hollow blade surface Sinkage defects in the SPF/DB process. Int. J. Mater. Form. 2018, 12, 827–844. [Google Scholar] [CrossRef]
- Chandrappa, K.; Sumukha, C.S.; Sankarsh, B.B.; Gowda, R. Superplastic forming with diffusion bonding of titanium alloys. Mater. Today Proc. 2020, 27, 2909–2913. [Google Scholar] [CrossRef]
- Zhao, Z.; Xu, J.; Fu, Y.; Li, Z. An investigation on adaptively machining the leading and tailing edges of an SPF/DB titanium hollow blade using free-form deformation. Chin. J. Aeronaut. 2018, 31, 178–186. [Google Scholar] [CrossRef]
- Li, X.; Wang, G.; Zhang, J.; Liu, Y. Electrically assisted superplastic forming/diffusion bonding of the Ti2AlNb alloy sheet. Int. J. Adv. Manuf. Technol. 2019, 106, 77–89. [Google Scholar] [CrossRef]
- Wang, K.; Wang, L.; Zheng, K.; He, Z.; Politis, D.J.; Liu, G.; Yuan, S. High-efficiency forming processes for complex thin-walled titanium alloys components: State-of-the-art and perspectives. Int. J. Extreme Manuf. 2020, 2, 032001. [Google Scholar] [CrossRef]
- Wu, F.; Chen, W.; Zhao, B.; Hou, H.; Zhou, W.; Li, Z. Diffusion Bonding of 1420 Al–Li Alloy Assisted by Pure Aluminum Foil as Interlayer. Materials 2020, 13, 1103. [Google Scholar] [CrossRef] [PubMed] [Green Version]
- Zhang, T.; Sha, H.; Li, L.; Gong, H. Study of Macroscopic Defects of Four-Layer Structure of Ti-6Al-4V During Superplastic Forming/Diffusion Bonding. Int. J. Precis. Eng. Manuf. 2021, 22, 27–39. [Google Scholar] [CrossRef]
- Wu, Y.; Wu, D.; Ma, J.; Xiao, W.; Zheng, K.; Chen, M. A physically based constitutive model of Ti-6Al-4V and application in the SPF/DB process for a pyramid lattice sandwich panel. Arch. Civ. Mech. Eng. 2021, 21, 1–17. [Google Scholar] [CrossRef]
- Du, Z.; Zhang, K. The superplastic forming/diffusion bonding and mechanical property of TA15 alloy for four-layer hollow structure with squad grid. Int. J. Mater. Form. 2021, 14, 1057–1066. [Google Scholar] [CrossRef]
- Du, Z.; Wang, G.; Wang, H. The Process Design and Rapid Superplastic Forming of Industrial AA5083 for a Fender with a Negative Angle in a Small Batch. Metals 2021, 11, 497. [Google Scholar] [CrossRef]
- Somekawa, H.; Singh, A. Superior room temperature ductility of magnesium dilute binary alloy via grain boundary sliding. Scr. Mater. 2018, 150, 26–30. [Google Scholar] [CrossRef]
- Sherby, O.D.; Wadsworth, J. Superplasticity—Recent advances and future directions. Prog. Mater. Sci. 1989, 33, 169–221. [Google Scholar] [CrossRef]
- Okamoto, H. Alloy Phase Diagram. In ASM HANDBOOK; ASM International: Almere, The Netherlands, 1992; Volume 3, p. 747. [Google Scholar]
Figure 1.
(a) Schematic diagram of the vacuum diffusion bonding, (b) Schematic diagram of shear test.
Figure 1.
(a) Schematic diagram of the vacuum diffusion bonding, (b) Schematic diagram of shear test.

Figure 2.
The true stress-logarithmic strain curves of Mg-Re alloys. (a) 250 °C; (b) 300 °C; (c) 350 °C; (d) 400 °C; (e) 450 °C.
Figure 2.
The true stress-logarithmic strain curves of Mg-Re alloys. (a) 250 °C; (b) 300 °C; (c) 350 °C; (d) 400 °C; (e) 450 °C.

Figure 3.
(a) The true stress-logarithmic strain curves of Mg-Re alloy at 400 °C (taking the logarithmic strain at 0.25 for calculating the value of m); (b) Plot of the logarithm of tensile stress versus logarithmic strain rate to determine the strain rate sensitivity m.
Figure 3.
(a) The true stress-logarithmic strain curves of Mg-Re alloy at 400 °C (taking the logarithmic strain at 0.25 for calculating the value of m); (b) Plot of the logarithm of tensile stress versus logarithmic strain rate to determine the strain rate sensitivity m.

Figure 4.
Mg-Cu binary phase diagram [20].
Figure 4.
Mg-Cu binary phase diagram [20].

Figure 5.
Microstructure of diffusion bonding joint at 440 °C, 1500# for 30 min under 2 MPa. (a) the microstructure of the weld, (b) partial enlargement of a figure (a), (c) different zones at the weld.
Figure 5.
Microstructure of diffusion bonding joint at 440 °C, 1500# for 30 min under 2 MPa. (a) the microstructure of the weld, (b) partial enlargement of a figure (a), (c) different zones at the weld.

Figure 6.
SEM-EDS element distribution maps of the joint bonding at 480 °C, 1500# for 30 min under 2 MPa: (a) Zr; (b) Zn; (c) Cu; (d) Mg; (e) Gd; (f) Y; (g) and (h) SEM microstructure image of the joint.
Figure 6.
SEM-EDS element distribution maps of the joint bonding at 480 °C, 1500# for 30 min under 2 MPa: (a) Zr; (b) Zn; (c) Cu; (d) Mg; (e) Gd; (f) Y; (g) and (h) SEM microstructure image of the joint.

Figure 7.
TEM-EDS analyses of the joint bonding at 480 °C, 1500# for 30 min under 2 MPa: (a) HAADF-STEM image of the joint; (b) STEM-EDS mapping image of all elements; STEM-EDS elemental mapping images for (c) Cu; (d) Gd; (e) Mg; (f) Y; (g) Zn (h) Zr.
Figure 7.
TEM-EDS analyses of the joint bonding at 480 °C, 1500# for 30 min under 2 MPa: (a) HAADF-STEM image of the joint; (b) STEM-EDS mapping image of all elements; STEM-EDS elemental mapping images for (c) Cu; (d) Gd; (e) Mg; (f) Y; (g) Zn (h) Zr.

Figure 8.
Microstructure of the diffusion bonding joint with the interfacial roughness of 800#. (a) 440 °C (b) 460 °C (c) 480 °C.
Figure 8.
Microstructure of the diffusion bonding joint with the interfacial roughness of 800#. (a) 440 °C (b) 460 °C (c) 480 °C.

Figure 9.
The microstructure of the joint bonding at 440 °C, 180# for 30 min under 2 MPa.

Figure 10.
Microstructure of the diffusion bonding joint at 440 °C with different roughness of interface. (a) 180# (b) 800# (c) 1500#.
Figure 10.
Microstructure of the diffusion bonding joint at 440 °C with different roughness of interface. (a) 180# (b) 800# (c) 1500#.

Figure 11.
Shear strength of joints under different diffusion bonding conditions.

Figure 12.
Image of the joint bonding at 440 °C and the base metal after shear test.

Figure 13.
Thickness distribution of Mg-Re alloy at different stages of superplastic forming (a) 0s; (b) 50s; (c) 120s; (d) 250s; (e) 400s; (f) 547s.
Figure 13.
Thickness distribution of Mg-Re alloy at different stages of superplastic forming (a) 0s; (b) 50s; (c) 120s; (d) 250s; (e) 400s; (f) 547s.

Figure 14.
Boundary conditions of the finite element model (a) displacement boundary condition (b) face load boundary condition.
Figure 14.
Boundary conditions of the finite element model (a) displacement boundary condition (b) face load boundary condition.

Figure 15.
The thickness distribution of the component predicted by FEA.

Figure 16.
(a) The thickness-time curves of different nodes, (b) the process pressure-time curve predicted by FEA.
Figure 16.
(a) The thickness-time curves of different nodes, (b) the process pressure-time curve predicted by FEA.

Figure 17.
(a) The cross-section of the finished double hollow structural component; (b) microstructure of the diffusion bonding zone; (c) the position of thickness measurement; (d) The thickness distribution of the component.
Figure 17.
(a) The cross-section of the finished double hollow structural component; (b) microstructure of the diffusion bonding zone; (c) the position of thickness measurement; (d) The thickness distribution of the component.


Table 1.
Diffusion bonding parameters in the present study.
| Sample | Temperature (°C) | Pressure (MPa) | Time (min) | Interfacial Roughness (#) |
|---|---|---|---|---|
| S1 | 440 | 2 | 30 | 180 |
| S2 | 440 | 2 | 30 | 800 |
| S3 | 440 | 2 | 30 | 1500 |
| S4 | 460 | 2 | 30 | 180 |
| S5 | 460 | 2 | 30 | 800 |
| S6 | 460 | 2 | 30 | 1500 |
| S7 | 480 | 2 | 30 | 180 |
| S8 | 480 | 2 | 30 | 800 |
| S9 | 480 | 2 | 30 | 1500 |
Table 2.
EDS analysis results of locations in Figure 2a,b.
Table 2.
EDS analysis results of locations in Figure 2a,b.
| Locations | Composition (at.%) | Possible Phase | |
|---|---|---|---|
| Mg | Cu | ||
| a | 3.21 | 96.79 | Cu(Mg) |
| b | 95.62 | 4.38 | α-Mg |
| c | 32.18 | 67.82 | MgCu2 |
| d | 68.47 | 31.53 | Mg2Cu |
Table 3.
Proportionality constant and activation energy of Mg and Cu.
| Mg | Cu | Mg in Cu | Cu in Mg | |
|---|---|---|---|---|
| D0 (m2∙s−1) | ||||
| Q (J∙mol−1) |
Publisher’s Note: MDPI stays neutral with regard to jurisdictional claims in published maps and institutional affiliations. |
© 2022 by the authors. Licensee MDPI, Basel, Switzerland. This article is an open access article distributed under the terms and conditions of the Creative Commons Attribution (CC BY) license (https://creativecommons.org/licenses/by/4.0/).
Share and Cite
MDPI and ACS Style
Peng, P.; Jiang, S.; Qin, Z.; Lu, Z. Superplastic Forming and Reaction Diffusion Bonding Process of Hollow Structural Component for Mg-Gd-Y-Zn-Zr Rare Earth Magnesium Alloy. Metals 2022, 12, 152. https://doi.org/10.3390/met12010152
AMA Style
Peng P, Jiang S, Qin Z, Lu Z. Superplastic Forming and Reaction Diffusion Bonding Process of Hollow Structural Component for Mg-Gd-Y-Zn-Zr Rare Earth Magnesium Alloy. Metals. 2022; 12(1):152. https://doi.org/10.3390/met12010152
Chicago/Turabian StylePeng, Peng, Shaosong Jiang, Zhonghuan Qin, and Zhen Lu. 2022. "Superplastic Forming and Reaction Diffusion Bonding Process of Hollow Structural Component for Mg-Gd-Y-Zn-Zr Rare Earth Magnesium Alloy" Metals 12, no. 1: 152. https://doi.org/10.3390/met12010152
Note that from the first issue of 2016, this journal uses article numbers instead of page numbers. See further details here.