
Effect of Shear/Axial Stress Ratio on Multiaxial Non-Proportional Loading Fatigue Damage on AISI 303 Steel


1
Instituto Superior de Engenharia de Lisboa, Instituto Politécnico de Lisboa, 1959-007 Lisboa, Portugal
2
IDMEC, Instituto Superior Técnico, Universidade de Lisboa, 1049-001 Lisboa, Portugal
*
Authors to whom correspondence should be addressed.
Metals 2022, 12(1), 89; https://doi.org/10.3390/met12010089
Submission received: 30 November 2021
/
Revised: 14 December 2021
/
Accepted: 23 December 2021
/
Published: 4 January 2022
(This article belongs to the Special Issue Multi-Axial Fatigue and Fracture Behavior in Metals)
Abstract
:In this paper, we investigate the cyclic response of AISI 303 stainless steel subjected to non-proportional loads with different amplitude ratios between shear stresses and normal stresses. Based on the experiments, a relationship between the proportional reference load and a varied range of non-proportional loads was established. To achieve this objective, an experimental program was implemented to evaluate the non-proportional parameter Y. Then, the evolution of this parameter was analyzed with the number of cycles to failure and with the ratio between shear and normal stresses, finally, the evolution of the non-proportional parameter Y was mapped by two functions. The results show that the non-proportional response of the AISI 303 can be estimated using the two functions obtained. This allows the estimation of the relationship between non-proportional and proportional stresses as a function of the number of cycles to failure together with the relationship between shear and normal stresses. The results obtained have direct application in the evaluation of accumulated damage, assessed in real-time, resulting from variable amplitude loading spectra. This is of particular interest for the evaluation of structural health monitoring of structures and mechanical components.
1. Introduction
Fatigue design aims to ensure the safety and reliability of structures and mechanical components under cyclic loading. In practice, it was shown that cyclic loading leads to greater damage compared to static loading, i.e., fatigue failure can occur at stress levels well below the yield strength of the material [1]. In contrast to static loads, cyclic loads can be grouped according to their nature, i.e., proportional, and non-proportional loading. The difference between them can be described as a function of the principal directions of the stress tensor of the cyclic loading, i.e., for proportional loads the principal directions do not change during a loading cycle, whereas for non-proportional loads the principal directions change throughout the loading cycle [2,3]. Due to this fact, the damage caused by these two types of loads is different, even in cases where the magnitudes of the normal and shear stresses are the same [4]. Non-proportional loads result in more general damage to the material (in different slip planes), while proportional loads result in more localized damage (damage in well-defined planes predominates), resulting in different degrees of hardening/softening, which in turn result in different resistance to fatigue [5,6].
In practice, structures and mechanical components are usually subjected to cyclic multiaxial loads of variable amplitude with random patterns. Under these conditions, the fatigue strength must be evaluated from the point of view of accumulated damage by evaluating the partial damage for the load blocks extracted from the load spectra [7,8]. These load blocks may consist of proportional or non-proportional loads or even a mixture of both types. Under these conditions, it is important to know how to estimate the damage caused by both types of loads [9,10]. This aspect is important for the mechanical design phases, but it is even more important for monitoring the accumulated damage of structures and components in real-time, with a particular interest in promoting sustainability and circular economy by extending the life cycle of structures and mechanical components, which is a very topical issue [11].
In the literature, the characterization of accumulated damage resulting from non-proportional loads has not been explored with the desired regularity for some structural materials, although some work was carried out in this area of research [5,12,13]. This fact largely results from the complexity of this type of loading, which, in addition to the variation of the principal directions, it has additional features with great influence on the fatigue resistance of materials, such as the effect of mean stresses. In many cases, the normal and shear stresses of non-proportional loads may have sections (in their loading cycle) with mean stress effects, resulting in these loads having different aggregate effects, which makes their characterization an interesting challenge [14,15].
A brief bibliometric analysis (using the Google Scholar search engine) of the publications made in the last 21 years dealing with the characterization of damage due to non-proportional loads, shows that there are about 7159 publications with an average annual growth rate of about 17 articles/year, ranging from 153 articles published in 2000 to 512 published articles in 2021, indicating a growing interest of the scientific community in the subject of damage due to non-proportional loads. From this sample, it can also be observed that out of the 7159 publications, only 13 refer to AISI 303 stainless steel, a structural steel widely used in industry due to its excellent mechanical properties against corrosion. These 13 publications [4,16,17,18,19,20,21,22,23,24,25,26,27] have a total of 413 citations, with an average of 32 citations per article. These results show not only that the characterization of damage due to non-proportional loading is a current research topic of growing interest, but also that there is a deficit in the characterization of non-proportional damage in AISI 303 stainless steel, despite the great interest in this material, as shown by the average number of citations of the above 13 articles, in general, these 13 articles present experimental results on non-proportional loads, evaluating the evolution of damage with the number of load cycles by plotting the corresponding SN curves, which are then compared with proportional reference loads in order to correlate the damage between proportional and non-proportional loads. However, from the perspective of evaluating accumulated damage in real-time in structures and mechanical components, this experimental information is of limited use, as experimental tests would have to be performed for a large number of non-proportional loads, which is not economically feasible in practice.
In this sense, this work aims to investigate the relationship between proportional and non-proportional damage in AISI 303 stainless steel with the objective of estimating the non-proportional damage based on proportional damage. In order to analyze this relationship, the evolution of the non-proportionality parameter Y proposed by Anes et al. [4] was studied in terms of the number of cycles to failure () and in terms of the λ (ratio between the shear and normal stresses ) for a phase shift angle of 90°. This result will be very useful to evaluate in real-time the accumulated damage resulting from variable amplitude loading spectra. This is of particular interest for monitoring the structural strength of structures and mechanical components using structural health monitoring techniques [28].
2. Materials and Methods
In this paper, the cyclic behavior of AISI 303 stainless steel under non-proportional loading is studied. The aim is to characterize the non-proportional damage by the Y parameter proposed by Anes et al. [4]. This parameter relates the SN curves of the non-proportional loads to the SN curves of a proportional reference load. In this sense, an experimental program was developed to obtain the necessary SN curves to map the Y-parameter. Linear regressions are performed with the experimental results to obtain the expressions for this parameter. As a result, two functions are obtained for the Y parameter, one for the normal component (Ynormal) of the non-proportional load and another for the shear component (Yshear). These functions allow for estimating the damage of the non-proportional load in respect to the proportional reference load.
2.1. Material
The material used in the experiments is a stainless-steel X 10 CrNiS 18 9 (AISI 303). It is an austenitic steel, a ternary alloy of iron–chromium–nickel-containing about 18% Cr and 9% Ni. This type of alloy is called austenitic because its structure remains face-centered-cubic (fcc) during and after heat treatment, which guarantees it a high deformation capacity. The chemical composition of the AISI 303 stainless steel was specified by the manufacturer in the certificate of conformity and can be found in Table 1
The main applications of AISI 303 material are usually shafts, power screws, screws, bolts, nuts, and general commercial applications. The AISI 303 is also a structural steel with typical tensile strength and yield strength values of 625 MPa, and 330 MPa, respectively. Table 2 summarizes the typical mechanical properties of these alloys.
2.2. Experimental Program
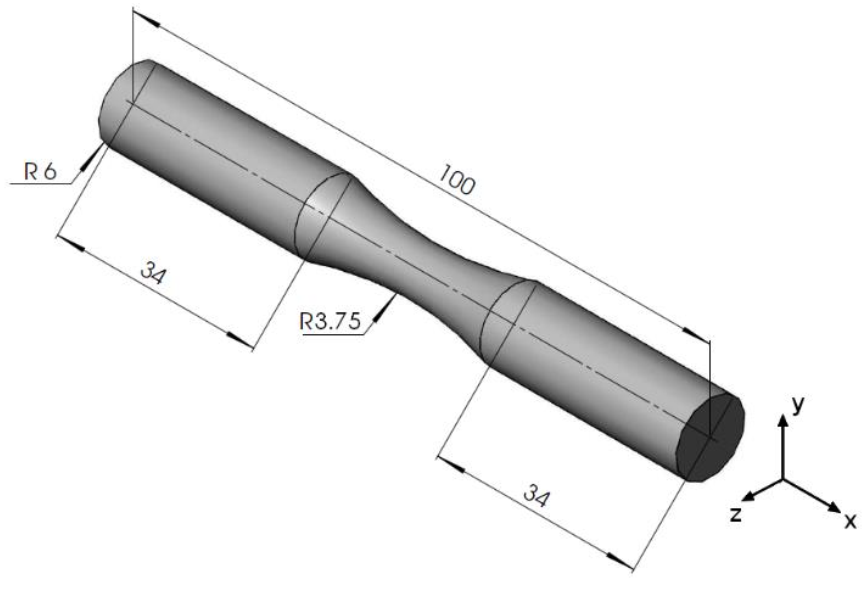
The experimental tests were performed in accordance with ASTME466 standard and under load control conditions in an Instron 8874 biaxial fatigue testing machine (Instron, Norwood, MA, USA) with a capacity of 25 kN/100 Nm. Figure 1 shows the geometry of the specimens and the respective dimensions. The specimens were fabricated using a CNC machine from extruded AISI 303 stainless steel bars; the longitudinal direction of the specimen coincides with the direction of extrusion. The specimens were polished with abrasive paper of decreasing grit size until the surface was mirror-like.
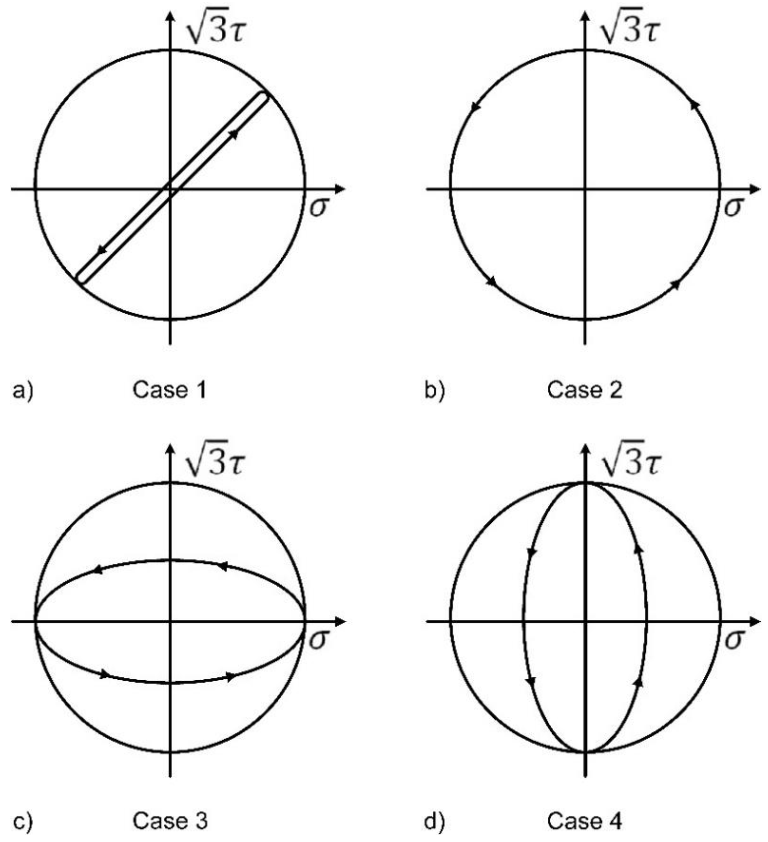
The experimental program performed includes a series of proportional and non-proportional multiaxial fatigue tests with different ratios of normal to shear amplitude stresses with r = −1 in both loading channels, i.e., no mean stress was considered. The tests were performed at room temperature and loading frequency equal to 4 Hz. The criterion for the end of the tests was the complete separation of the sample or the number of loaded cycles equal to 106 cycles (runout situation). Figure 2 shows the stress loading paths plotted in the von Mises stress space.
Figure 2a represents the proportional reference load, case 1, which is used for correlation with the non-proportional loads represented by cases 2 through 4. This load is normally used in the evaluation of proportional damage in structural materials. It has a ratio of shear stress to normal stress of λ = 0.57, which gives an angle of 45° in the von Mises stress space (30° if evaluated without the influence of the von Mises stress space). Case 2 (Figure 2b) is the non-proportional loading stress normally used to measure non-proportional damage. It has the same relationship between shear stresses and normal stresses as in case 1, i.e., both loadings have the same λ. In case 2, the non-proportionality results only from the phase shift between the normal and shear stresses. In case 3 (Figure 2c), the non-proportionality results from the 90° phase shift between the normal and shear stress together with the ratio of the shear stress to the normal stress equal to λ = 0.29. In this loading, the normal stresses predominate over the shear stresses. In case 4, the opposite of case 3 occurs, i.e., it has a λ = 1.15, where the shear stresses predominate over the normal stresses and the phase shift is also equal to 90°.
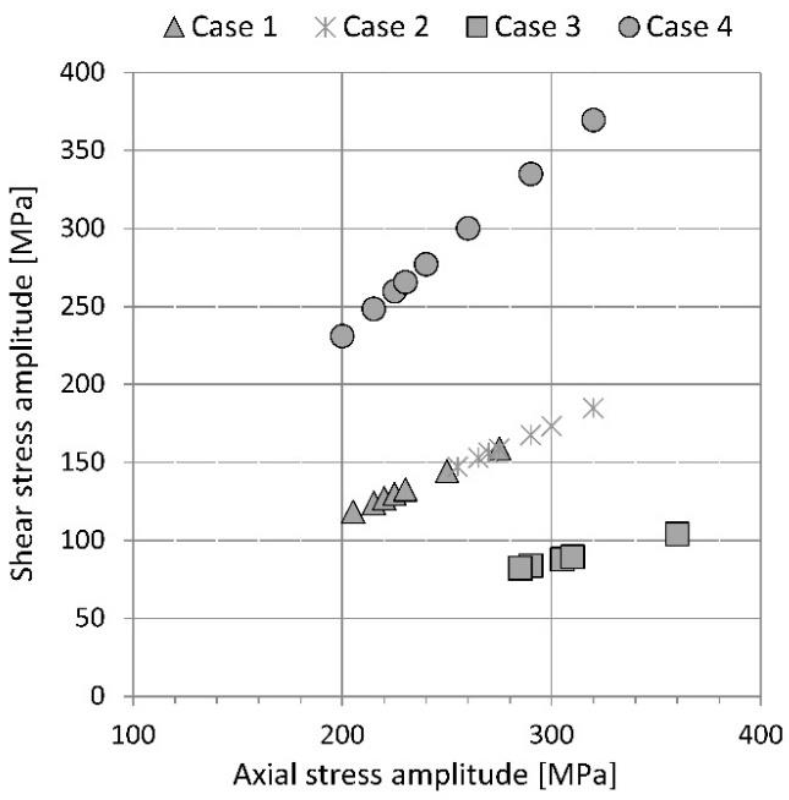
Figure 3 summarizes the amplitudes of the normal and shear stresses with R = −1 used in the experiments for each loading case.
2.3. Non-Proportional Damage Parameter, Y
Anes et al. [4] proposed a method for evaluating the relative damage between proportional and non-proportional stress paths. The idea was to eliminate the use of a stress space to compare proportional and non-proportional damage, which in turn eliminates several possible interpretation errors in the geometric representation of non-proportional loading paths in these stress spaces.
The method allows a direct comparison between the amplitudes of the normal stresses under proportional and non-proportional loading to determine the relative damage between the normal stresses. This is carried out by evaluating for the same fatigue life . The relative damage between shear stress amplitudes at proportional and non-proportional loading is evaluated with , also for the same .
To obtain the amplitudes of the normal and shear stresses under both proportional and non-proportional loading with respect to the same fatigue damage, represented by , the trendlines equations for the evolution of the normal and shear stresses with respect to are determined from the experimental data. Using these equations, it is possible to evaluate the amplitudes of the normal and shear stresses at both types of loading for the same . It is then possible to evaluate Ynormal and Yshear to compare the relative damage between proportional and non-proportional loads.
3. Results and Discussion
S-N Experimental Results
Table 3 shows the experimental results obtained for the four loading cases shown in Figure 2, considering the loading amplitudes shown in Figure 3. The results for the number of cycles at fatigue failure equal to 106 represent the run-out situation, i.e., the experimental test was interrupted without any separation of the specimen. A total of 30 specimens with the dimensions and shapes shown in Figure 1 were tested.
Figure 4 shows graphically the results presented in Table 3. They are plotted for each loading case, with the two loading components shown separately, i.e., the relationship between the normal and shear amplitudes in relation to the number of loading cycles is carried out separately. This allows the analysis of the relative damage between the two loading components (normal and shear) in each loading case, furthermore, the trend lines and the corresponding expressions as well as the R2 value of each expression can be determined.
From the results shown in Figure 4, it can be seen that the distance between the SN curves of the normal and the shear components varies greatly from case to case.
This result indicates that the relative damage between these components varies depending on the loading case, i.e., the relative damage varies depending on the relationship between the shear stress and the normal stress. Correlating case 1 (proportional reference loading—Figure 4a) with case 2 (Figure 4b), it can be seen that the SN curves of case 2 are higher than the corresponding curves of case 1. This result shows that the load of case 2 causes less damage than the proportional reference case, both loads have the same λ. In this sense, it can be concluded that the non-proportionality of case 2 causes less damage than the proportional reference, case 1. In case 2, the non-proportionality results only from the 90° phase shift between the components of the normal and shear stresses, where λ was maintained in both load channels. In cases 3 and 4, on the other hand, the non-proportionality results from the 90° phase shift between normal and shear stresses with different λ ratios.
Now, correlating case 1 with case 3 (Figure 4c), loadings with different λ (0.57 for case 1 and 0.29 for case 3), it is observed a change in the pattern of relative damage between the homologated SN curves, i.e., the SN curve of the normal component in case 3 is above the homologous curve of case 1 and the SN curve of the shear loading component is below the homologous curve of case 1. This result is to be expected since the λ =0.29 determined for case 3 results from a normal loading component that is larger than the homologous value determined in the reference case, and also from a shear component that is smaller than the homologous shear stress evaluated for the reference case. Due to this fact, it is not possible to directly assess the relative damage between case 1 and case 3 using the information presented in Figure 4c. On the other hand, in case 4 (Figure 4d), similar to the results found for case 2, it is found that both the SN curves of the normal and shear components are above the SN homologous curves of the proportional load of the reference. In this case, it can be concluded that case 4 causes less damage than case 1.
Table 4 summarizes the trend lines shown in Figure 4 for each loading case. These trend lines are of a power-law type and have R2 above 0.95, indicating a reasonable fit to the experimental data at hand. These expressions allow a comparison of the normal and shear amplitudes as a function of the number of cycles at fatigue failure, . In this way, it is possible to correlate the non-proportional fatigue damage (represented here by the number of cycles ) with the amplitudes of each load case, this correlation is made by fixing for both load types (proportional and non-proportional) which establishes the analysis at the same damage level, and compare the respective amplitudes obtained by the trend lines of the correlated cases. The results of this correlation for cases 1 to 4 are shown in Table 5 and Table 6.
In Table 5, Table 6 and Table 7, the first column represents the variation of between 104 and 106 cycles, representing different levels of damage. Columns 2 and 3 represent the normal and shear amplitudes for case 1 (proportional loading of the reference) determined by the respective trend lines in the first row of the tables. Columns 4 and 5 represent the amplitudes of the case to be correlated with the reference case, obtained by the respective trend lines. Columns 6 and 7 represent the calculated values for the parameter Ynormal and Yshear, respectively. According to the description of the parameter Y in Section 2.3, Ynormal is calculated by dividing the values in column 4 by the homologous values in column 2, and Yshear is calculated by dividing the values in column 5 by the homologous values in column 3.
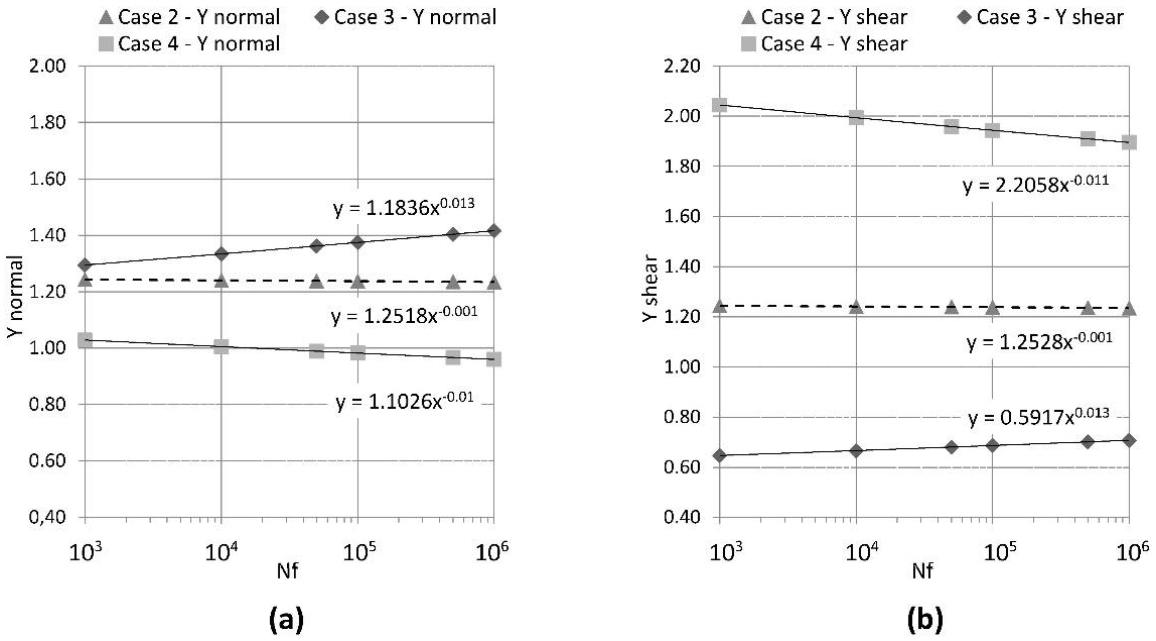
Figure 5 graphically represents the evolution of parameter Y for loading cases 2 to 4. Figure 5a plots the evolution of the Ynormal versus and Figure 5b plots the evolution of the Yshear versus , where Y values greater than 1 indicate that the non-proportional loading causes less damage than the proportional reference loading and Y values less than 1 indicate that the non-proportional loading causes more damage than the proportional reference loading.
From the results shown in Figure 5a, it can be concluded that the parameter Ynormal for case 2 does not vary with the number of cycles , the same is true for Yshear (Figure 5b), Ynormal and Yshear are independent of the number of cycles . On the other hand, for cases 3 and 4, Ynormal and Yshear are found to vary with the number of cycles . For case 3, Ynormal and Yshear increase with . Thus, it can be concluded that the non-proportional damage decreases with the increase in for this loading. In the case of loading 4, the opposite occurs, the normal and shear Y parameter decrease with the increase in indicating an increase in damage that is not proportional to the increase in .
Considering that the phase angle in cases 2 to 4 is the same, i.e., 90°, it can be concluded that the difference in the development of the non-proportional damage demonstrated in these three cases results from the different λ-ratios. The variation of the λ-ratio implies a variation in the predominance between shear stresses and normal stresses. In this sense, in case 3 the normal stresses predominate, i.e., the amplitudes of the normal stresses are larger than the amplitudes of the shear stresses, while in case 4 the opposite is true: the shear stresses are larger than the normal stresses.
In this sense, and for the AISI 303 stainless steel, the predominance of shear stresses in non-proportional loads leads to higher damage compared to non-proportional loads where the normal stresses predominate. In other words, the non-proportional damage increases with increasing λ-ratio and with increasing for the AISI 303 stainless steel case. However, despite this increase, the proportional reference load still causes more damage than the case 4 load.
To compare the relative damage between the proportional reference case and the 3 non-proportional cases, the von Mises equivalent stress was calculated for each damage level represented by and then correlated with the von Mises stresses of the proportional reference loading case. The results obtained are presented in Table 8.
In Table 8, the difference between the von Mises stresses is presented in columns 6 to 8. It can be seen that all the values obtained for the differences between the von Mises stresses in each non-proportional loading case are positive (see Table 8 for further information regarding calculations). This means that non-proportional loads must have higher normal and shear stress amplitudes to cause the same damage as the proportional reference load. This means that none of the non-proportional loads considered cause more damage than the proportional reference load.
Comparing the differences found for the von Mises stress for non-proportional loads, we find that the largest difference occurs in case 4 and the smallest in case 3. Although the non-proportional damage increases with the increase in λ and in case 4, this case is the one that causes the least damage. This indicates that the predominance of the normal component causes more damage than the predominance of the shear component for non-proportional loads, i.e., the non-proportional damage increases with the decrease in the λ-ratio.
Table 9 and Table 10 summarize the variation of the Ynormal and Yshear parameters with λ and . These values are shown graphically in Figure 6a,b, respectively.
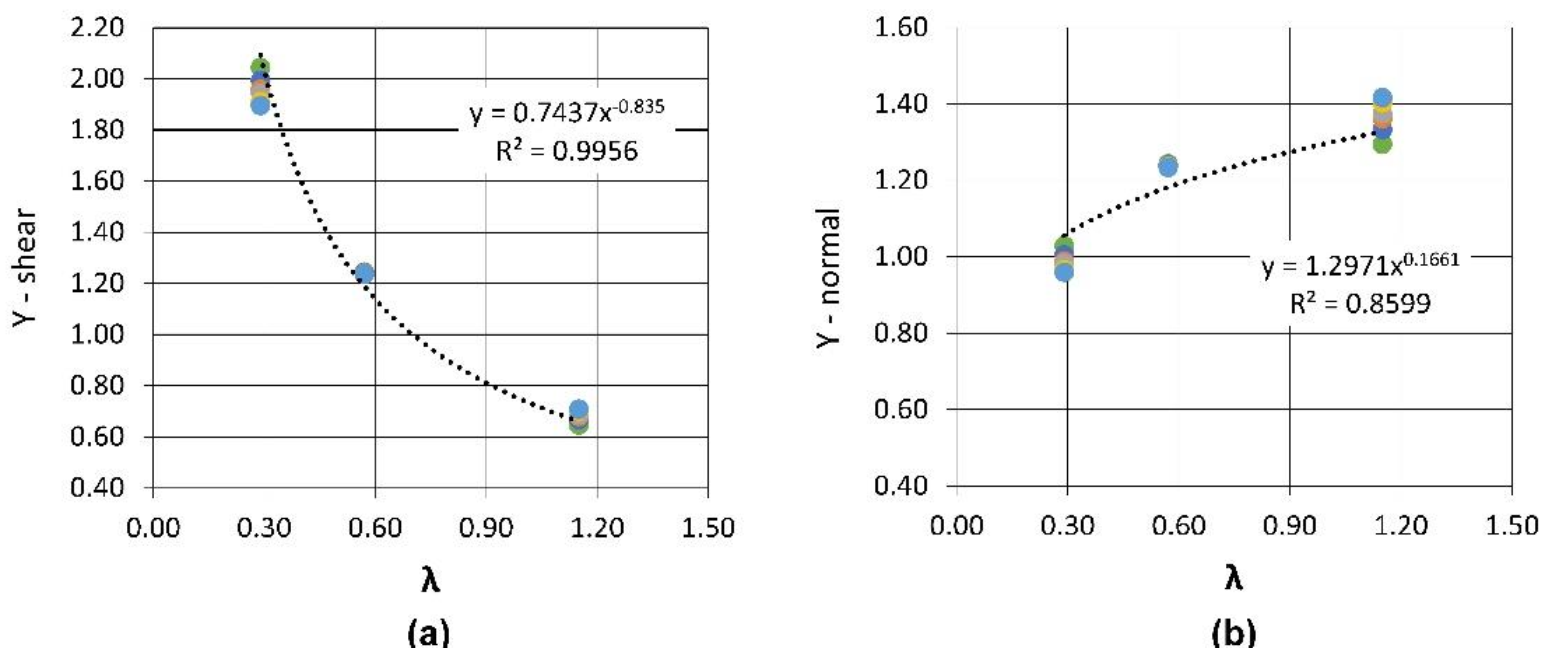
Using the graphical representation of Ynormal and Yshear as a function of λ, a fitting was made to obtain the expressions for the variation of the parameter Y as a function of λ. It was shown that the linear regression by a power-law function for Ynormal has an R2 of 0.86, indicating low accuracy, while the R2 for Yshear is 0.996, indicating good agreements between experimental data and estimates. Based on these results, it is concluded that it is necessary to perform an alternative linear regression of two variables to obtain an expression for Ynormal with an acceptable R2.
Figure 7 shows the linear regression performed for the Ynormal parameter as a function of λ and . This yielded equation 1, a second-degree polynomial of two variables with R2 = 0.99, indicating good agreement with the experimental data. The Ynormal values used in this regression were taken from Table 9.
The functions obtained for Ynormal and Yshear, Equations (1) and (2), can be used in mechanical design, namely in fatigue design for infinite life of AISI 303 stainless steel components and structures and in the evaluation of accumulated damage from variable amplitude loading spectra. From these equations, it is possible to obtain proportional normal and shear amplitudes equivalent to the normal and shear amplitudes of the non-proportional loading, this can be made using Equations (3) and (4).
4. Conclusions
In this work, the non-proportional damage of AISI 303 stainless steel was studied as a function of the ratio and , in order to make a correlation between non-proportional loads and a proportional reference load. This correlation resulted in two expressions, one for the Ynormal parameter and the other for the Yshear parameter.
In practice, these expressions allow the estimation of the AISI 303 non-proportional damage resulting from the variation of the ratio λ, number of cycles at failure , and phase shift equal to 90°.
These estimates are made by converting the non-proportional load amplitudes into equivalent proportional amplitudes using these Y parameters.
This result can be used in the evaluation of accumulated damage resulting from variable amplitude loading spectra and in the fatigue design of mechanical components and structures fabricated from AISI 303 stainless steel. Based on this study, the following conclusions were drawn about the cyclic behavior of the AISI 303 material under non-proportional loading:
(1) AISI 303 stainless steel is very sensitive to non-proportional loading, with fatigue strength varying significantly depending on the value of λ.
(2) It was found that at the three loads, the non-proportional damage was lower than the damage created by the proportional reference load.
(3) It was shown that the non-proportional damage increased with the decrease in the parameter λ, indicating that the predominance of normal stresses in the non-proportional loading caused greater damage than the predominance of shear stresses.
(4) It was found that for loadings with predominant shear stresses, the damage increases with increasing , but for loading with predominant normal stresses, the damage decreases with increasing λ.
The non-proportional damage of the loads considered in this study results from varying the ratio λ, keeping the phase angle at 90°. However, the non-proportionality of a given load can also result from the variation of the phase angle, in this sense and in order to perform a complete mapping of the non-proportional damage in AISI 303 stainless steel, it is proposed to perform additional tests where the variation of the phase angle is performed for each λ considered in this study.
Author Contributions
Conceptualization, V.A. and L.R.; methodology, VA.; software, V.A.; validation, L.R. and M.F.; formal analysis, L.R.; investigation, V.A.; resources, L.R.; data curation, V.A.; writing—original draft preparation, V.A.; writing—review and editing, L.R.; visualization, V.A.; supervision, L.R.; project administration, L.R.; funding acquisition, M.F. All authors have read and agreed to the published version of the manuscript.
Funding
This work was supported by FCT, through IDMEC, under LAETA, project UIDB/50022/2020, and also by the Polytechnic Institute of Lisbon through the Projects for Research, Development, Innovation and Artistic Creation (IDI&CA), within the framework of the project ReEdIA—Risk Assessment and Management in Open Innovation, IPL/2021/ ReEdIA/ISEL.
Institutional Review Board Statement
Not applicable.
Informed Consent Statement
Not applicable.
Data Availability Statement
Not applicable.
Conflicts of Interest
The authors declare no conflict of interest.
References
- Socie, D.; Marquis, G.B. Multiaxial Fatigue; Society of Automotive Engineers: Warrendale, PA, USA, 2000. [Google Scholar]
- Bernasconi, A.; Filippini, M.; Foletti, S.; Vaudo, D. Multiaxial fatigue of a railway wheel steel under non-proportional loading. Int. J. Fatigue 2006, 28, 663–672. [Google Scholar] [CrossRef]
- Itoh, T.; Sakane, M.; Ohsuga, K. Multiaxial low cycle fatigue life under non-proportional loading. Int. J. Press. Vessels Pip. 2013, 110, 50–56. [Google Scholar] [CrossRef]
- Anes, V.; Reis, L.; Li, B.; De Freitas, M. New approach to evaluate non-proportionality in multiaxial loading conditions. Fatigue Fract. Eng. Mater. Struct. 2014, 37, 1338–1354. [Google Scholar] [CrossRef]
- Socie, D. Multiaxial Fatigue Damage Models. J. Eng. Mater. Technol. 1987, 109, 293–298. [Google Scholar] [CrossRef]
- Fatemi, A.; Shamsaei, N. Multiaxial fatigue: An overview and some approximation models for life estimation. Int. J. Fatigue 2011, 33, 948–958. [Google Scholar] [CrossRef]
- Anes, V.; Reis, L.; Li, B.; De Freitas, M. New cycle counting method for multiaxial fatigue. Int. J. Fatigue 2014, 67, 78–94. [Google Scholar] [CrossRef]
- Anes, V.; Caxias, J.; Freitas, M.; Reis, L. Fatigue damage assessment under random and variable amplitude multiaxial loading conditions in structural steels. Int. J. Fatigue 2017, 100, 591–601. [Google Scholar] [CrossRef]
- Wang, C.H.; Brown, M.W. Life prediction techniques for variable amplitude multiaxial fatigue—Part 1: Theories. J. Eng. Mater. Technol. 1996, 118, 367–370. [Google Scholar] [CrossRef]
- Carpinteri, A.; Spagnoli, A.; Vantadori, S. A review of multiaxial fatigue criteria for random variable amplitude loads. Fatigue Fract. Eng. Mater. Struct. 2017, 40, 1007–1036. [Google Scholar] [CrossRef]
- Mesa, J.; González-Quiroga, A.; Maury, H. Developing an indicator for material selection based on durability and environmental footprint: A Circular Economy perspective. Resour. Conserv. Recycl. 2020, 160, 104887. [Google Scholar] [CrossRef]
- Anes, V.; Reis, L.; Freitas, M. Multiaxial fatigue damage accumulation under variable amplitude loading conditions. Procedia Eng. 2015, 101, 117–125. [Google Scholar] [CrossRef] [Green Version]
- Fatemi, A.; Yang, L. Cumulative fatigue damage and life prediction theories: A survey of the state of the art for homogeneous materials. Int. J. Fatigue 1998, 20, 9–34. [Google Scholar] [CrossRef]
- Mei, J.; Dong, P. A new path-dependent fatigue damage model for non-proportional multi-axial loading. Int. J. Fatigue 2016, 90, 210–221. [Google Scholar] [CrossRef]
- Mei, J.; Dong, P. An equivalent stress parameter for multi-axial fatigue evaluation of welded components including non-proportional loading effects. Int. J. Fatigue 2017, 101, 297–311. [Google Scholar] [CrossRef]
- Ivashyn, U. An experimental and numerical investigation of the biaxial tensile behaviour of biomedical alloys, nitinol and SS304. PhD Thesis, University of Limerick, Limerick, Ireland, 2015. [Google Scholar]
- Reis, L.; Li, B.; De Freitas, M. Analytical and experimental studies on fatigue crack path under complex multi-axial loading. Fatigue Fract. Eng. Mater. Struct. 2006, 29, 281–289. [Google Scholar] [CrossRef]
- De Freitas, M.; Reis, L.; Li, B. Comparative study on biaxial low-cycle fatigue behaviour of three structural steels. Fatigue Fract. Eng. Mater. Struct. 2006, 29, 992–999. [Google Scholar] [CrossRef]
- Reis, L.G.; Li, B.; de Freitas, M. Crack Growth Orientation in Two Structural Materials under Multiaxial Fatigue Loading. Mater. Sci. Forum 2008, 587, 892–897. [Google Scholar] [CrossRef]
- Reis, L.; Li, B.; De Freitas, M. Crack initiation and growth path under multiaxial fatigue loading in structural steels. Int. J. Fatigue 2009, 31, 1660–1668. [Google Scholar] [CrossRef]
- Albinmousa, J.; Jahed, H. Multiaxial effects on LCF behaviour and fatigue failure of AZ31B magnesium extrusion. Int. J. Fatigue 2014, 67, 103–116. [Google Scholar] [CrossRef]
- Pujari, P. Multiaxial Fatigue Analysis—Approach Toward Real-World Life Prediction. In Proceedings of Fatigue, Durability and Fracture Mechanics; Springer: Berlin/Heidelberg, Germany, 2018; pp. 167–183. [Google Scholar]
- de Freitas, M. Multiaxial fatigue: From materials testing to life prediction. Theor. Appl. Fract. Mech. 2017, 92, 360–372. [Google Scholar] [CrossRef]
- Pejkowski, L. On the material’s sensitivity to non-proportionality of fatigue loading. Arch. Civ. Mech. Eng. 2017, 17, 711–727. [Google Scholar] [CrossRef]
- Li, B.; Reis, L.; De Freitas, M. Simulation of cyclic stress/strain evolutions for multiaxial fatigue life prediction. Int. J. Fatigue 2006, 28, 451–458. [Google Scholar] [CrossRef]
- Li, B.; Reis, L.G.; de Freitas, M. Simulations of cyclic plasticity and fatigue behavior of structural steels under multiaxial loading. Mater. Sci. Forum 2006, 514, 1414–1418. [Google Scholar] [CrossRef]
- Marangon, C.; Lazzarin, P.; Berto, F.; Campagnolo, A. Some analytical remarks on the influence of phase angle on stress fields ahead of sharp V-notches under tension and torsion loads. Theor. Appl. Fract. Mech. 2014, 74, 64–72. [Google Scholar] [CrossRef]
- Liu, G.; Li, Z.; Li, Z.; Huang, Y. A multi-axial fatigue-oriented strategy for fatigue damage monitoring and assessment of tubular joints. Ocean Eng. 2021, 227, 108876. [Google Scholar] [CrossRef]
Figure 1.
Specimen geometry and respective dimensions in (mm).

Figure 2.
Proportional and non-proportional loadings performed in the fatigue life experimental program, (a) Case 1 is the proportional loading with a shear to normal stress ratio equal to tan(30°), (b) Case 2 is the non-proportional loading with phase shift equal to 90° and stress ratio equal to tan(30°), (c) Case 3, is the non-proportional loading with phase shift equal to 90° and stress ratio equal to tan(16°), and (d) Case 4, is the non-proportional loading with phase shift equal to 90° and stress ratio equal to tan(49°).

Figure 3.
Normal and shear stress amplitudes with R = −1 used in experiments.

Figure 4.
S-N experimental data and respective trend lines representation for loading cases 1 to 4. (a) Case 1 PP λ = 0.57, (b) Case 2 OP λ = 0.57, (c) Case 3 OP λ = 0.29, (d) Case 4 OP λ = 1.15.
Figure 4.
S-N experimental data and respective trend lines representation for loading cases 1 to 4. (a) Case 1 PP λ = 0.57, (b) Case 2 OP λ = 0.57, (c) Case 3 OP λ = 0.29, (d) Case 4 OP λ = 1.15.

Figure 5.
Y parameter evolution regarding fatigue life. (a) Y evaluated for the normal component, (b) Y evaluation for the shear component.
Figure 5.
Y parameter evolution regarding fatigue life. (a) Y evaluated for the normal component, (b) Y evaluation for the shear component.

Figure 6.
Y representation for loading cases 2 to 4. (a) variation of Ynormal with λ, (b) variation of Yshear with λ.
Figure 6.
Y representation for loading cases 2 to 4. (a) variation of Ynormal with λ, (b) variation of Yshear with λ.

Figure 7.
Regression surface for the Ynormal as a function of λ and Nf.


Table 1.
Typical AISI 303 chemical composition and weights.
| Element | C | Si | Mn | P | S | Cr | Ni |
|---|---|---|---|---|---|---|---|
| Weight (%) | 0.12 | 1.0 | 2.0 | 0.060 | 0.25 | 18.0 | 9.0 |
Table 2.
AISI 303 mechanical properties.
| Microstructure Type | fcc |
|---|---|
| Poisson’s ratio | 0.25 |
| Density (Kg/m3) | 8000 |
| Hardness (HV) | 174 |
| Tensile strength (MPa) | 625 |
| Yield strength (MPa) | 330 |
| Elongation (%) | 28 |
| Young’s modulus (GPa) | 178 |
| σ′f—Fatigue strength coefficient (MPa) | 534 |
| b—Fatigue strength coefficient | −0.07 |
| ε′f—Fatigue ductility coefficient | 0.052 |
| c—Fatigue ductility exponent | −0.292 |
Table 3.
AISI 303 multiaxial experimental fatigue data, cases 1 to 4.
| Loading Case | Normal Stress (MPa) | Shear Stress (MPa) | Nf |
|---|---|---|---|
| Case 1 | 205 | 118.4 | 1,000,000 |
| 215 | 124.1 | 392,005 | |
| 220 | 127 | 217,075 | |
| 225 | 129.9 | 85,376 | |
| 230 | 132.8 | 63,540 | |
| 250 | 144.3 | 16,405 | |
| 275 | 158.8 | 3194 | |
| Case 2 | 255 | 147.2 | 1,000,000 |
| 265 | 153 | 342,890 | |
| 270 | 155.9 | 219,540 | |
| 275 | 158.8 | 86,926 | |
| 290 | 167.4 | 50,412 | |
| 300 | 173.2 | 38,787 | |
| 320 | 184.8 | 11,950 | |
| Case 3 | 290 | 83.7 | 1,000,000 |
| 285 | 82.3 | 911,511 | |
| 305 | 88 | 798,243 | |
| 310 | 89.5 | 63,519 | |
| 360 | 103.9 | 4200 | |
| 360 | 103.9 | 3028 | |
| Case 4 | 200 | 230.9 | 1,000,000 |
| 200 | 230.9 | 668,250 | |
| 215 | 248.3 | 557,580 | |
| 225 | 259.8 | 26,859 | |
| 230 | 265.6 | 17,520 | |
| 240 | 277.1 | 14,514 | |
| 260 | 300.2 | 4700 | |
| 290 | 334.9 | 1983 | |
| 290 | 334.9 | 2811 | |
| 320 | 369.5 | 1070 |
Table 4.
S-N trend lines for normal and shear loading components of loading cases 1 to 4, experimentally evaluated for AISI303.
Table 4.
S-N trend lines for normal and shear loading components of loading cases 1 to 4, experimentally evaluated for AISI303.
| Case | λ = τa/σa | Trend Line [MPa] |
|---|---|---|
| 1 | 0.57 | σa = 407.56(Nf)−0.05 |
| τa = 235.28(Nf)−0.05 | ||
| 2 | 0.57 | σa = 510.2(Nf)−0.051 |
| τa = 294.75(Nf)−0.051 | ||
| 3 | 0.29 | σa = 482.37(Nf)−0.037 |
| τa = 139.21(Nf)−0.037 | ||
| 4 | 1.15 | σa = 449.37(Nf)−0.06 |
| τa = 518.97(Nf)−0.061 |
Table 5.
Y results for case 1 vs. case 2—AISI303.
| Nf | Normal (Case 1) σa = 407.56(Nf)^(−0.05) [MPa] (1) | Shear (Case 1) τa = 235.28(Nf)^(−0.05) [MPa] (2) | Normal (Case 2) σa = 510.2(Nf)^(−0.051) [MPa] (3) | Shear (Case 2) τa = 294.75(Nf)^(−0.051) [MPa] (4) | Ynormal (3)/(1) | Yshear (4)/(2) |
|---|---|---|---|---|---|---|
| 103 | 289 | 167 | 359 | 207.23 | 1.24 | 1.24 |
| 104 | 257 | 148 | 319 | 184.27 | 1.24 | 1.24 |
| 5 × 10⁴ | 237 | 137 | 294 | 169.75 | 1.24 | 1.24 |
| 105 | 229 | 132 | 284 | 163.85 | 1.24 | 1.24 |
| 5 × 10⁵ | 211 | 122 | 261 | 150.94 | 1.24 | 1.24 |
| 106 | 204 | 118 | 252 | 145.70 | 1.23 | 1.24 |
Table 6.
Y results for case 1 vs. case 3—AISI303.
| Nf | Normal (Case 1) σa = 407.56(Nf)^(−0.05) [MPa] (1) | Shear (Case 1) τa = 235.28(Nf)^(−0.05) [MPa] (2) | Normal (Case 3) σa = 482.37(Nf)^(−0.037) [MPa] (3) | Shear (Case 3) τa = 139.21(Nf)^(−0.037) [MPa] (4) | Ynormal (3)/(1) | Yshear (4)/(2) |
|---|---|---|---|---|---|---|
| 103 | 289 | 167 | 374 | 107.81 | 1.29 | 0.65 |
| 104 | 257 | 148 | 343 | 99.01 | 1.33 | 0.67 |
| 5 × 10⁴ | 237 | 137 | 323 | 93.28 | 1.36 | 0.68 |
| 105 | 229 | 132 | 315 | 90.92 | 1.37 | 0.69 |
| 5 × 10⁵ | 211 | 122 | 297 | 85.67 | 1.40 | 0.70 |
| 106 | 204 | 118 | 289 | 83.50 | 1.42 | 0.71 |
Table 7.
Y results for case 1 vs. case 4—AISI303.
| Nf | Normal (Case 1) σa =407.56(Nf)^(−0.05) [MPa] (1) | Shear (Case 1) τa = 235.28(Nf)^(−0.05) [MPa] (2) | Normal (Case 4) σa = 449.37(Nf)^(−0.06) [MPa] (3) | Shear (Case 4) τa = 518.97(Nf)^(−0.061) [MPa] (4) | Ynormal (3)/(1) | Yshear (4)/(2) |
|---|---|---|---|---|---|---|
| 103 | 289 | 167 | 297 | 340.52 | 1.03 | 2.04 |
| 104 | 257 | 148 | 259 | 295.90 | 1.01 | 1.99 |
| 5 × 10⁴ | 237 | 137 | 235 | 268.23 | 0.99 | 1.96 |
| 105 | 229 | 132 | 225 | 257.12 | 0.98 | 1.94 |
| 5 × 10⁵ | 211 | 122 | 204 | 233.08 | 0.97 | 1.91 |
| 106 | 204 | 118 | 196 | 223.43 | 0.96 | 1.89 |
Table 8.
Correlation between loading paths regarding von Mises stress levels —AISI303.
| Nf | von Mises (Case 1) [MPa] (1) | von Mises (Case 2) [MPa] (2) | von Mises (Case 3) [MPa] (3) | von Mises (Case 4) [MPa] (4) | Delta [MPa] (2)−(1) | Delta [MPa] (3)−(1) | Delta [MPa] (4)−(1) |
|---|---|---|---|---|---|---|---|
| 103 | 408 | 507 | 418 | 660 | 99 | 10 | 252 |
| 104 | 364 | 451 | 384 | 574 | 88 | 20 | 210 |
| 5 × 10⁴ | 336 | 416 | 361 | 521 | 80 | 26 | 185 |
| 105 | 324 | 401 | 352 | 499 | 77 | 28 | 175 |
| 5 × 10⁵ | 299 | 370 | 332 | 453 | 71 | 33 | 153 |
| 106 | 289 | 357 | 323 | 434 | 68 | 35 | 145 |
Table 9.
Ynormal variation with λ and .
| Nf | Case 3 λ = 0.29 | Case 2 λ = 0.57 | Case 4 λ = 1.15 |
|---|---|---|---|
| 103 | 1.29 | 1.24 | 1.03 |
| 104 | 1.33 | 1.24 | 1.01 |
| 5 × 10⁴ | 1.36 | 1.24 | 0.99 |
| 105 | 1.37 | 1.24 | 0.98 |
| 5 × 10⁵ | 1.40 | 1.24 | 0.97 |
| 106 | 1.42 | 1.23 | 0.96 |
Table 10.
Yshear variation with λ and .
| Nf | Case 3 λ = 0.29 | Case 2 λ = 0.57 | Case 4 λ = 1.15 |
|---|---|---|---|
| 103 | 0.65 | 1.24 | 2.04 |
| 104 | 0.67 | 1.24 | 1.99 |
| 5 × 10⁴ | 0.68 | 1.24 | 1.96 |
| 105 | 0.69 | 1.24 | 1.94 |
| 5 × 10⁵ | 0.70 | 1.24 | 1.91 |
| 106 | 0.71 | 1.24 | 1.89 |
Publisher’s Note: MDPI stays neutral with regard to jurisdictional claims in published maps and institutional affiliations. |
© 2022 by the authors. Licensee MDPI, Basel, Switzerland. This article is an open access article distributed under the terms and conditions of the Creative Commons Attribution (CC BY) license (https://creativecommons.org/licenses/by/4.0/).
Share and Cite
MDPI and ACS Style
Anes, V.; Reis, L.; Freitas, M. Effect of Shear/Axial Stress Ratio on Multiaxial Non-Proportional Loading Fatigue Damage on AISI 303 Steel. Metals 2022, 12, 89. https://doi.org/10.3390/met12010089
AMA Style
Anes V, Reis L, Freitas M. Effect of Shear/Axial Stress Ratio on Multiaxial Non-Proportional Loading Fatigue Damage on AISI 303 Steel. Metals. 2022; 12(1):89. https://doi.org/10.3390/met12010089
Chicago/Turabian StyleAnes, Vitor, Luis Reis, and Manuel Freitas. 2022. "Effect of Shear/Axial Stress Ratio on Multiaxial Non-Proportional Loading Fatigue Damage on AISI 303 Steel" Metals 12, no. 1: 89. https://doi.org/10.3390/met12010089
Note that from the first issue of 2016, this journal uses article numbers instead of page numbers. See further details here.