
On the Microstructure and Properties of the Nb-23Ti-5Si-5Al-5Hf-5V-2Cr-2Sn (at.%) Silicide-Based Alloy—RM(Nb)IC


Department of Materials Science and Engineering, Sir Robert Hadfield Building, The University of Sheffield, Mappin Street, Sheffield S1 3JD, UK
*
Author to whom correspondence should be addressed.
Metals 2021, 11(11), 1868; https://doi.org/10.3390/met11111868
Submission received: 25 October 2021
/
Revised: 16 November 2021
/
Accepted: 16 November 2021
/
Published: 20 November 2021
(This article belongs to the Special Issue Advanced Refractory Alloys)
Abstract
:The microstructure, isothermal oxidation, and hardness of the Nb-23Ti-5Si-5Al-5Hf-5V-2Cr-2Sn alloy and the hardness and Young’s moduli of elasticity of its Nbss and Nb5Si3 were studied. The alloy was selected using the niobium intermetallic composite elaboration (NICE) alloy design methodology. There was macrosegregation of Ti and Si in the cast alloy. The Nbss, αNb5Si3, γNb5Si3, and HfO2 phases were present in the as-cast or heat-treated alloy plus TiN in the near-the-surface areas of the latter. The vol.% of Nbss was about 80%. There were Ti- and Ti-and-Hf-rich areas in the solid solution and the 5-3 silicide, respectively, and there was a lamellar microstructure of these two phases. The V partitioned to the Nbss, where the solubilities of Al, Cr, Hf, and V increased with increasing Ti concentration. At 700, 800, and 900 °C, the alloy did not suffer from catastrophic pest oxidation; it followed parabolic oxidation kinetics in the former two temperatures and linear oxidation kinetics in the latter, where its mass change was the lowest compared with other Sn-containing alloys. An Sn-rich layer formed in the interface between the scale and the substrate, which consisted of the Nb3Sn and Nb6Sn5 compounds at 900 °C. The latter compound was not contaminated with oxygen. Both the Nbss and Nb5Si3 were contaminated with oxygen, with the former contaminated more severely than the latter. The bulk of the alloy was also contaminated with oxygen. The alloying of the Nbss with Sn increased its elastic modulus compared with Sn-free solid solutions. The hardness of the alloy, its Nbss, and its specific room temperature strength compared favourably with many refractory metal-complex-concentrated alloys (RCCAs). The agreement of the predictions of NICE with the experimental results was satisfactory.
1. Introduction
Interest in RM(Nb)ICs, i.e., refractory metal (RM) intermetallic composites based on Nb, also known as Nb-silicide-based alloys or Nb in situ composites, as potential metallic ultra-high temperature materials (UHTM) to replace Ni-based superalloys in high-temperature structural applications in aero engines, has arisen from early research on binary Nb-Si alloys and experimental data that showed that such RMICs could offer an attractive combination of high temperature strength, creep resistance, and room temperature fracture toughness (e.g., see [1]). Another contributing factor was the phase equilibria of the binary system [2] that makes it possible to cast in situ composites consisting of a RM terminal solid solution, namely, the bcc Nb solid solution (Nbss), and the creep-resistant tetragonal Nb5Si3 silicide. The latter can have the high-temperature βNb5Si3 (tI32, D8m, prototype W5Si3) or the low-temperature αNb5Si3 (tI32, D8l, prototype Cr5B3) structure that are isomorphous but with distinctly different lattice parameters α and c [2].
The early research focused on alloys of the Nb-Si-Ti-Hf-Cr-Al system, a typical example of which is the MASC alloy Nb-25Ti-16Si-8Hf-2Al-2Cr (at.%) [3]. The initial research showed (a) that the Si concentration should be in the range 16 < Si < 22 at.% in order to meet the creep property goal and (b) that the alloying with Al, Cr, Ti, and Hf plus RM and other simple metal and metalloid element additions could enable the alloy developer to achieve a balance of strength, creep, and toughness with improved oxidation resistance [4,5]. Even with RM alloying additions, e.g., Mo, it is possible to have RM(Nb)ICs with densities as low as 6.55 g/cm3 [6] compared with the typical densities of about 9 g/cm3 for Ni-based superalloys.
Vanadium gives strong solid solution strengthening to Nb [7]. The addition of V in Si-free Nb-Ti-Cr-Al-based alloys improved their room temperature ductility and tensile and rupture strength above 1000 °C [8,9]. Vanadium is also a solid solution strengthening element in RM(Nb)ICs [7] and destabilises the stable (tP32) Nb3Si silicide in favour of the Nb5Si3 silicide but has an adverse effect on the oxidation of Nb [7]. Control of pest oxidation in the temperature range 700 °C to 900 °C (“pest regime”), which is an essential requirement for RM(Nb)ICs and other metallic UHTMs, for example, refractory high-entropy alloys (RHEAs) and refractory complex concentrated alloys (RCCAs) [10,11], has been demonstrated to be possible with the addition of Sn [3,12], but the “desirable” Sn content is undecided [13,14,15,16]. Control of the contamination by interstitials of the aforementioned metallic UHTMs is also essential [10,17].
It is recognised that the oxidation of RM(Nb)ICs at intermediate (≤900 °C) and high temperatures (≥1200 °C) is controlled by the oxidation of the Nbss and can be very sensitive to the volume fraction of the latter [3,6,18,19], which depends not only on the Si content of the RM(Nb)IC but also on the other alloying additions [14,15,20,21,22,23]. Could an RM(Nb)IC with high vol.% Nbss have an acceptable oxidation behaviour, meaning a low mass change in isothermal oxidation, and be resistant to pesting in the pest oxidation regime? What would be the contamination by oxygen of such an alloy? One motivation for the research presented in this study was to answer these questions. (The answer to the question about contamination is very important owing to the sensitivity of RM(Nb)ICs, RHEAs, and RCCAs to contamination by interstitials and the effect of the latter on properties [10].)
The mechanical behaviour of RM(Nb)ICs at in-service temperatures depends on their microstructural stability. Of particular interest is the stability (a) of tetragonal (tI32) Nb5Si3 [3,8] compared with hexagonal (hP16) γNb5Si3, which is isomorphous with Hf5Si3 and Ti5Si3 [24]; (b) of the Nbss; and (c) of eutectic microstructure(s). RM additions can stabilise eutectic microstructures after exposure to high temperatures (e.g., 1500 °C/100 h), for example, the addition of Mo, Ta, or W in the RM(Nb)ICs YG4 [25], YG5, YG6, YG8 [26], and CM1 [27], as well as Hf in synergy with Sn in the Ti-free alloy EZ1 [28] (for nominal composition of alloys, see the Table A1 in the Appendix A). The stability of the Nbss can be affected by the synergy of Al with Sn in the absence/presence of Hf (see the Ti-free alloys EZ4 and EZ7 in [28]) or the synergy of Hf with Al, Sn, and Ti in Nb-24Ti-18Si-5Al-5Hf-5Sn (alloy EZ5 in [29]). The stability of hexagonal Ti5Si3 in RM(Nb)ICs should be avoided because this silicide is detrimental for the creep of RM(Nb)ICs [8,30]. However, in the microstructure of RM(Nb)ICs with high Ti and Hf concentrations, which are expected to improve their oxidation, the hexagonal Nb5Si3 can be stable instead of or with the tetragonal Nb5Si3. Furthermore, in the Nb-Hf-Si system, the Hf5Si3 can be stable to lower temperatures (in other words, Nb stabilises the hP16 Hf5Si3 to lower temperatures) [31,32]. Accordingly, after exposure to high temperature, the stability or not of Nbss and hexagonal Nb5Si3 in RM(Nb)ICs, where the transition metals (TMs) Cr, Hf, and Ti are in synergy with another (than Nb) RM and with the simple metal and metalloid element additions Al, Si, and Sn, is critical because of the knock-on effect these phases can have on the creep and oxidation performance in-service. What type of Nb5Si3 (meaning α, β or γ) can be stable in RM(Nb)ICs with high vol.% Nbss? Another motivation for the research presented in this study was to answer this question.
The structure of the article is as follows. A brief description of the alloy selection is given before the experimental details. The results for the microstructure of the alloy in the as-cast and heat-treated conditions are presented in advance of the oxidation, hardness, and nano-indentation results. The discussion considers first the microstructure of the alloy and then the oxidation and hardness of the alloy, and the hardness and elastic moduli of the solid solution and 5-3 silicide are discussed. Finally, the experimental results are compared with the calculations (predictions) of the alloy design methodology NICE [17].
2. Alloy Design/Selection
The alloy design methodology NICE was used to select the alloy for this research, as described in [10,11,17]. The property goal was that the mass change per unit area (ΔW/A) for isothermal oxidation in air at 800 °C should not exceed 20 mg/cm2. The alloy design constraints were as follows: (i) the RM(Nb)IC should be from the Nb-Si-Ti-Hf-Cr-Al system with the addition of Sn and V; (ii) the stable phases in its microstructure should be the Nbss and Nb5Si3; (iii) the vol.% Nbss should not be less than 70%; (iv) the room temperature yield strength (σy) should not be less than 1300 MPa (or 400 HV); and (v) the macrosegregation of Si (MACSi) should not be higher than 4 at.%. The Si, Sn, and V additions (constraint (i)) that have opposite effects on oxidation were chosen to study whether an alloy with a high vol.% Nbss and V addition cannot suffer from pest oxidation.
The nominal composition of the selected alloy was Nb-22.8Ti-5.1Si-4.8Al-4.9Hf-4.8V-2.1Cr-2.2Sn or (rounded to the nearest whole number) Nb-23Ti-5Si-5Al-5Hf-5V-2Cr-2Sn (at.%). According to NICE, the stable phases in this alloy should be the Nbss and Nb5Si3, and the alloy should have 75.5 vol.% Nbss, ΔW/A = 14.8 mg/cm2, MACSi = 3.7 at.% and σy = 1481 MPa. The former three values were the averages of the values calculated from the relationships in NICE that correlate vol.% Nbss, ΔW/A, and MACSi with the parameters δ, Δχ, and VEC, and the yield stress was the average of the values that link Vickers hardness with the parameters VEC, ΔSmix, and Δχ in NICE.
3. Experimental
High-purity (wt.%) elements (Nb 99.99%, Al 99.999%, Si 99.999%, Ti 99.99%, Cr 99.99%, Sn 99.99%, V 99.7%, and Hf 99.8%) were used as the starting materials to make button/ingots of 300 g weight of the alloy in an argon atmosphere using arc melting with a non-consumable tungsten electrode and a water-cooled copper crucible. In order to improve homogeneity, melting was repeated five times by turning over the button/ingot after each melt. The ingots were cooled down to ambient temperature inside the arc melting furnace. Cubic specimens that were cut from the bulk of the ingot were wrapped in Ta foil, placed in an alumina boat, and were heat treated at 1500 °C in a tube furnace for 100 h under a Ti-gettered argon atmosphere. The heat treatment temperature was decided following study of small-sized samples (results not shown) using differential scanning calorimetry (Stanton Redcroft STA-1500 DSC/DTA, Thermal Scientific plc., Odessa, TX, USA) to ensure avoidance of liquation during heat treatment. The DSC specimens were also cut from the bulk of the button/ingot.
Standard metallographic preparation was used to prepare specimens for study by X-ray diffraction (XRD) and electron beam microprobe analysis (EPMA). A Philips X-ray diffractometer with monochromatic Cu Kα (λ = 1.5418) radiation was used for the identification of the phases, which was done using JCPDS data. Secondary electron (SE) and backscatter electron (BSE) imaging and quantitative chemical analyses were performed using a JEOL 8600 electron probe micro-analyser (JEOL, Tokyo, Japan). High purity elements and Hf2Si [33], Al2O3, and BN, which had been polished to a 1 μm finish, were used for standardisation purposes. Analysis was performed at 15 kV, 20 nA, and about a 1 μm diameter beam, and, at each measurement, the probe diameter was adjusted so as to achieve a dead time less than 20%. At least ten analyses were done for each phase in different parts (top, bulk, and bottom) of the button/ingot. Average concentrations and the minimum and maximum concentrations of at least ten analyses of an element in a phase or region of the ingot are given in the tables in this article. Measurements of the area fraction of Nbss were performed using software available on the microprobe, and the contrast of the phases was adjusted under BSE imaging. Area fractions were measured for the same areas that were used for large area analyses in EPMA. At least ten measurements were taken for each alloy, all at the same magnification (X350).
Thermogravimetric analysis (TGA) of the alloy was carried out using a Stanton Redcroft thermo-balance (Thermal Scientific plc., Odessa, TX, USA) equipped with an alumina tube furnace. Small cube-shaped specimens (5 × 5 × 5 mm3) were cut from the as-cast ingot. Each specimen was placed in a small cylindrical alumina crucible, which was then placed on the thermo-balance. The tube furnace was preheated to the selected temperature. The bottom of the crucible was in direct contact with a thermocouple. The isothermal oxidation of the alloy was evaluated at 700, 800, and 900 °C for up to 100 h. The oxides that formed on the surface of the specimens and spalled off were ground to powder and studied using XRD. EPMA was performed on cross sections of oxidised specimens.
The Vickers hardness of the alloy in the as-cast and heat-treated conditions was measured with a load of 10 kg. At least ten measurements were taken. The density of the alloys was measured using the Archimedes’ principle and a Sartorious LA2305 electronic precision balance (Sartorius Lab Instruments GmbH & Co. KG, Göttingen, Germany), equipped with a density determination kit. The average and minimum and maximum values of the hardness and density of the alloys are given in this article.
The as-cast and heat-treated microstructures made it possible to measure the hardness and elastic moduli of Nbss and Nb5Si3 using nano-indentation. For this work, we used a Hysitron Inc. TriboScope ® Nanomechanical Testing System (Hysitron Inc., Minneapolis, MN, USA) equipped with the software package TriboScope version 3.5L and a TriboIndenter that was fitted with a Berkovich style tip, which is a flat three-sided, diamond-tipped pyramid with a total induced angle of 142.3° and a half angle of 65.35° [34]. The radius of curvature of the tip was 150 nm. This signified that only a low level of detail could be achieved during imaging compared with a sharper tip, owing to imaging using an atomic force microscope (AFM) that was linked to the nano-indenter. A load of 7000 μN was used for the nano-indentation measurements.
4. Results
4.1. As-Cast (NV1-AC)
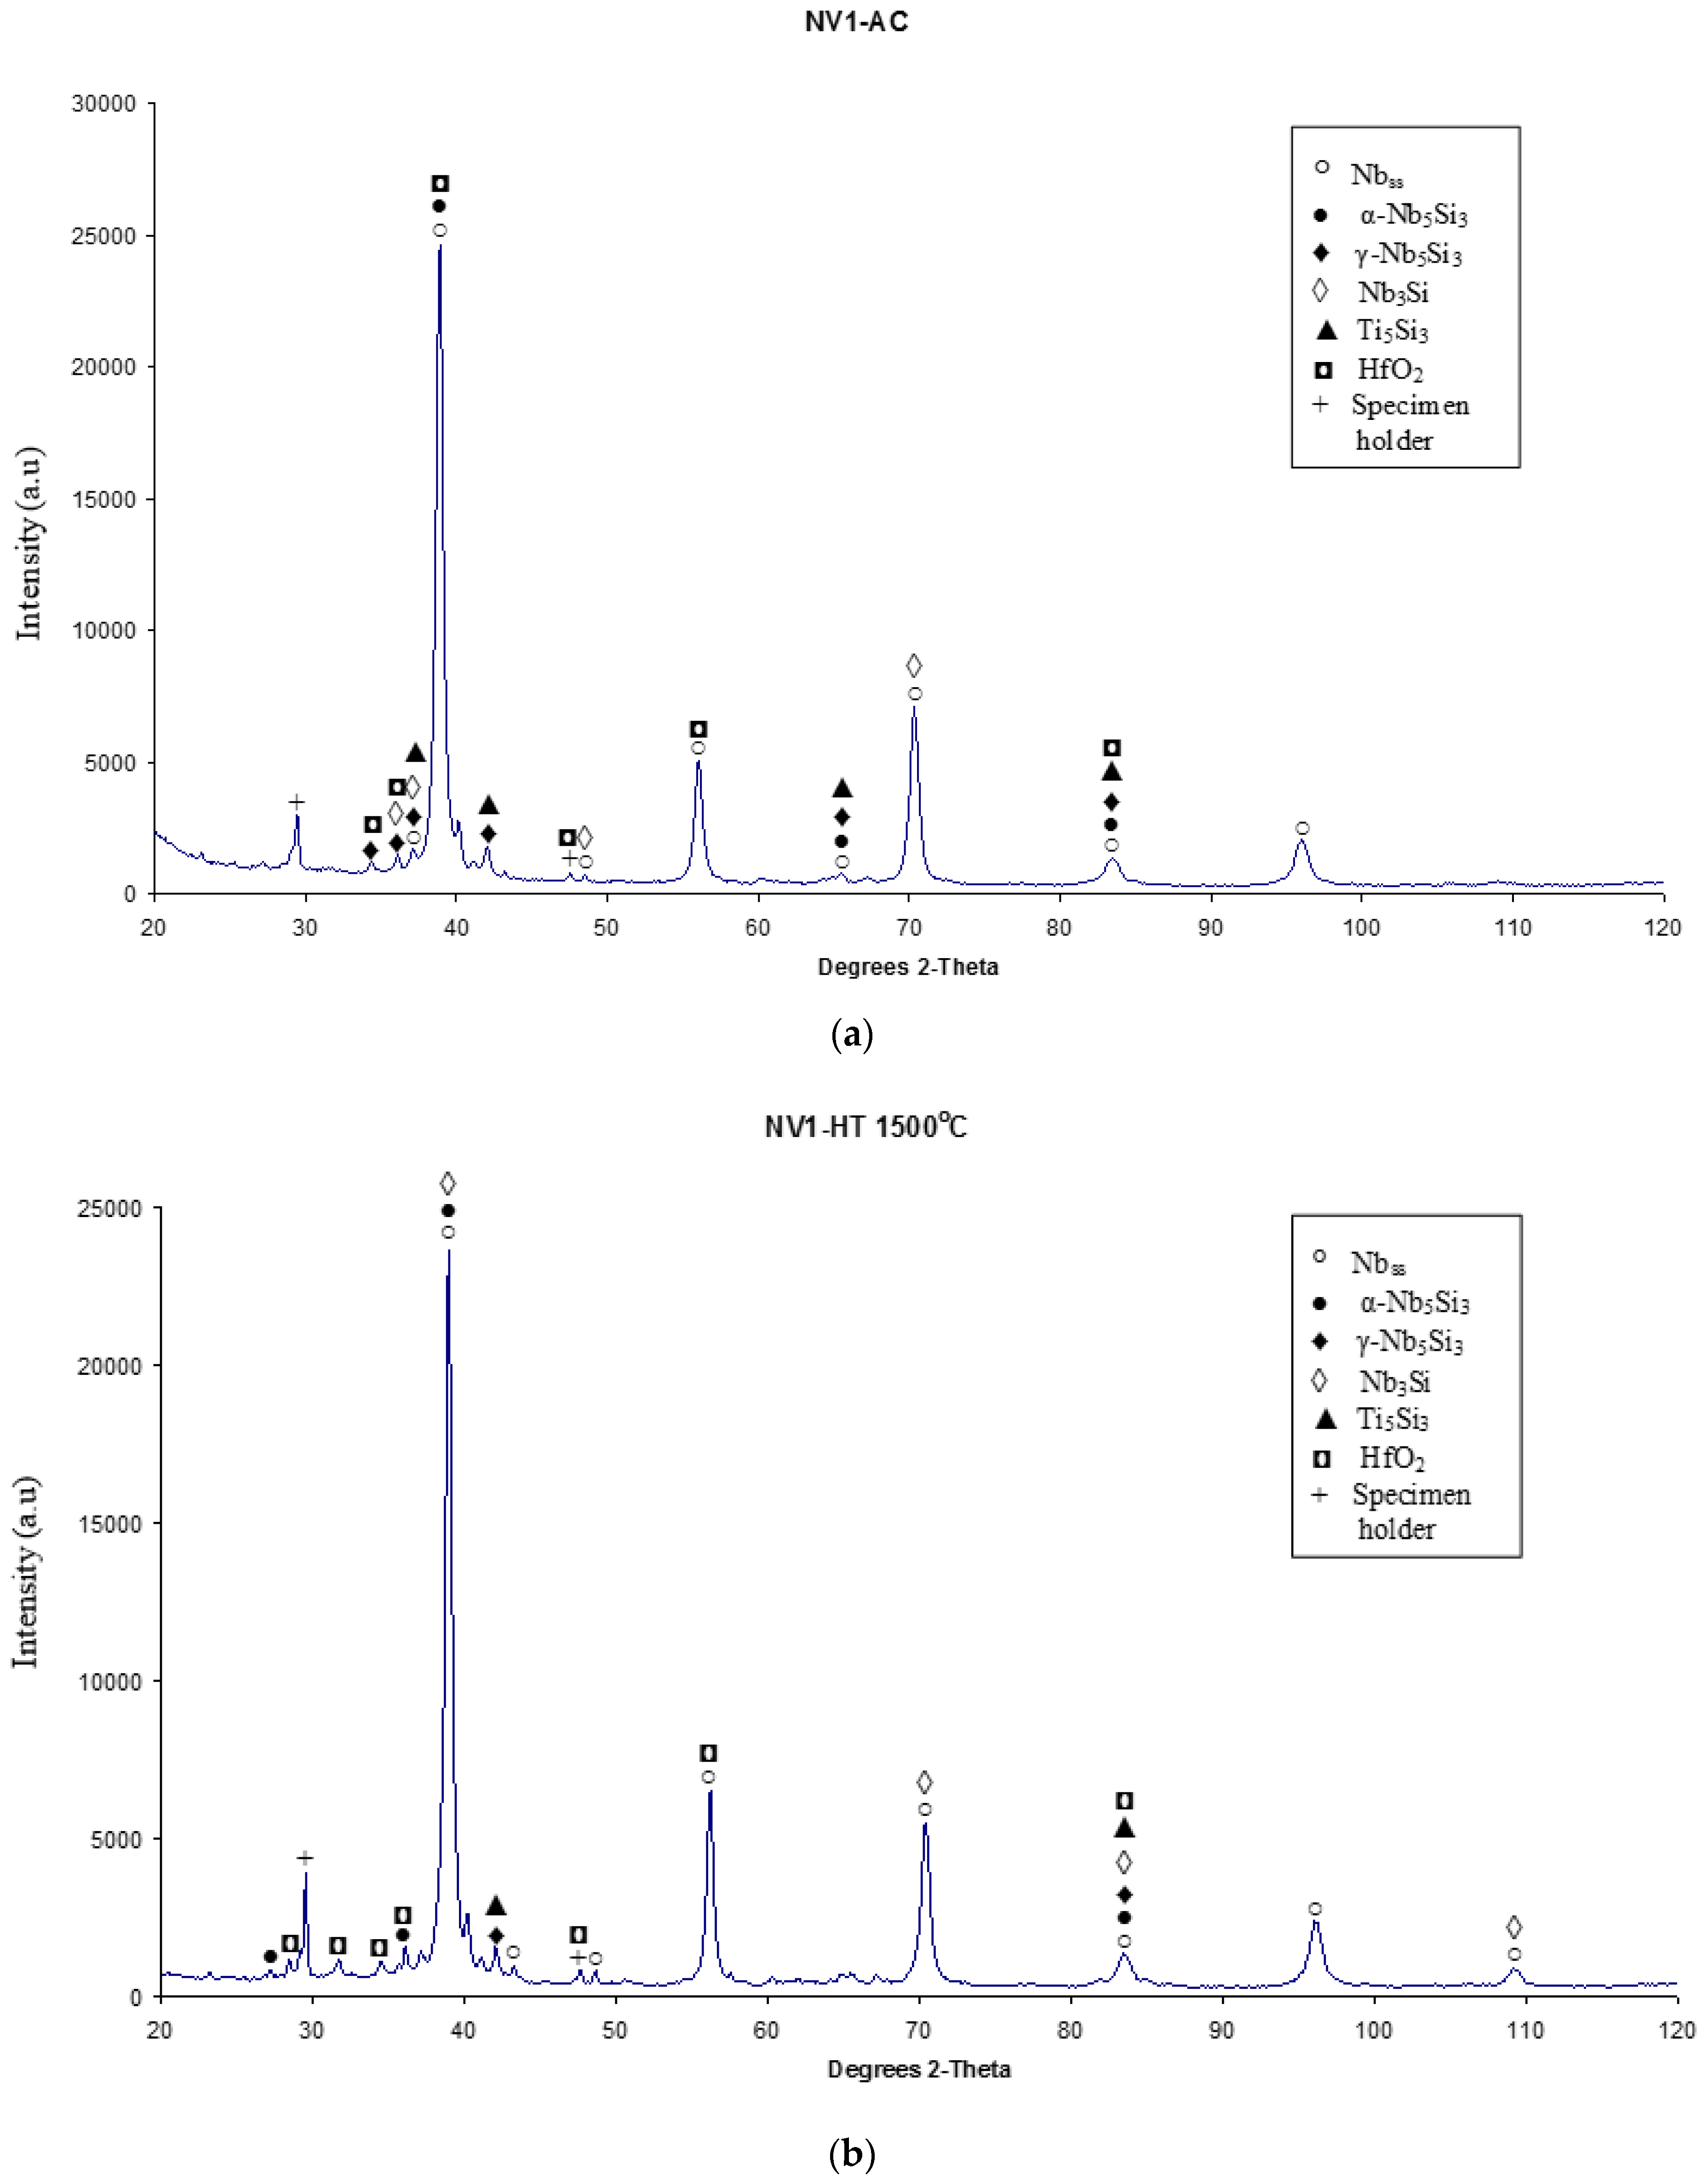
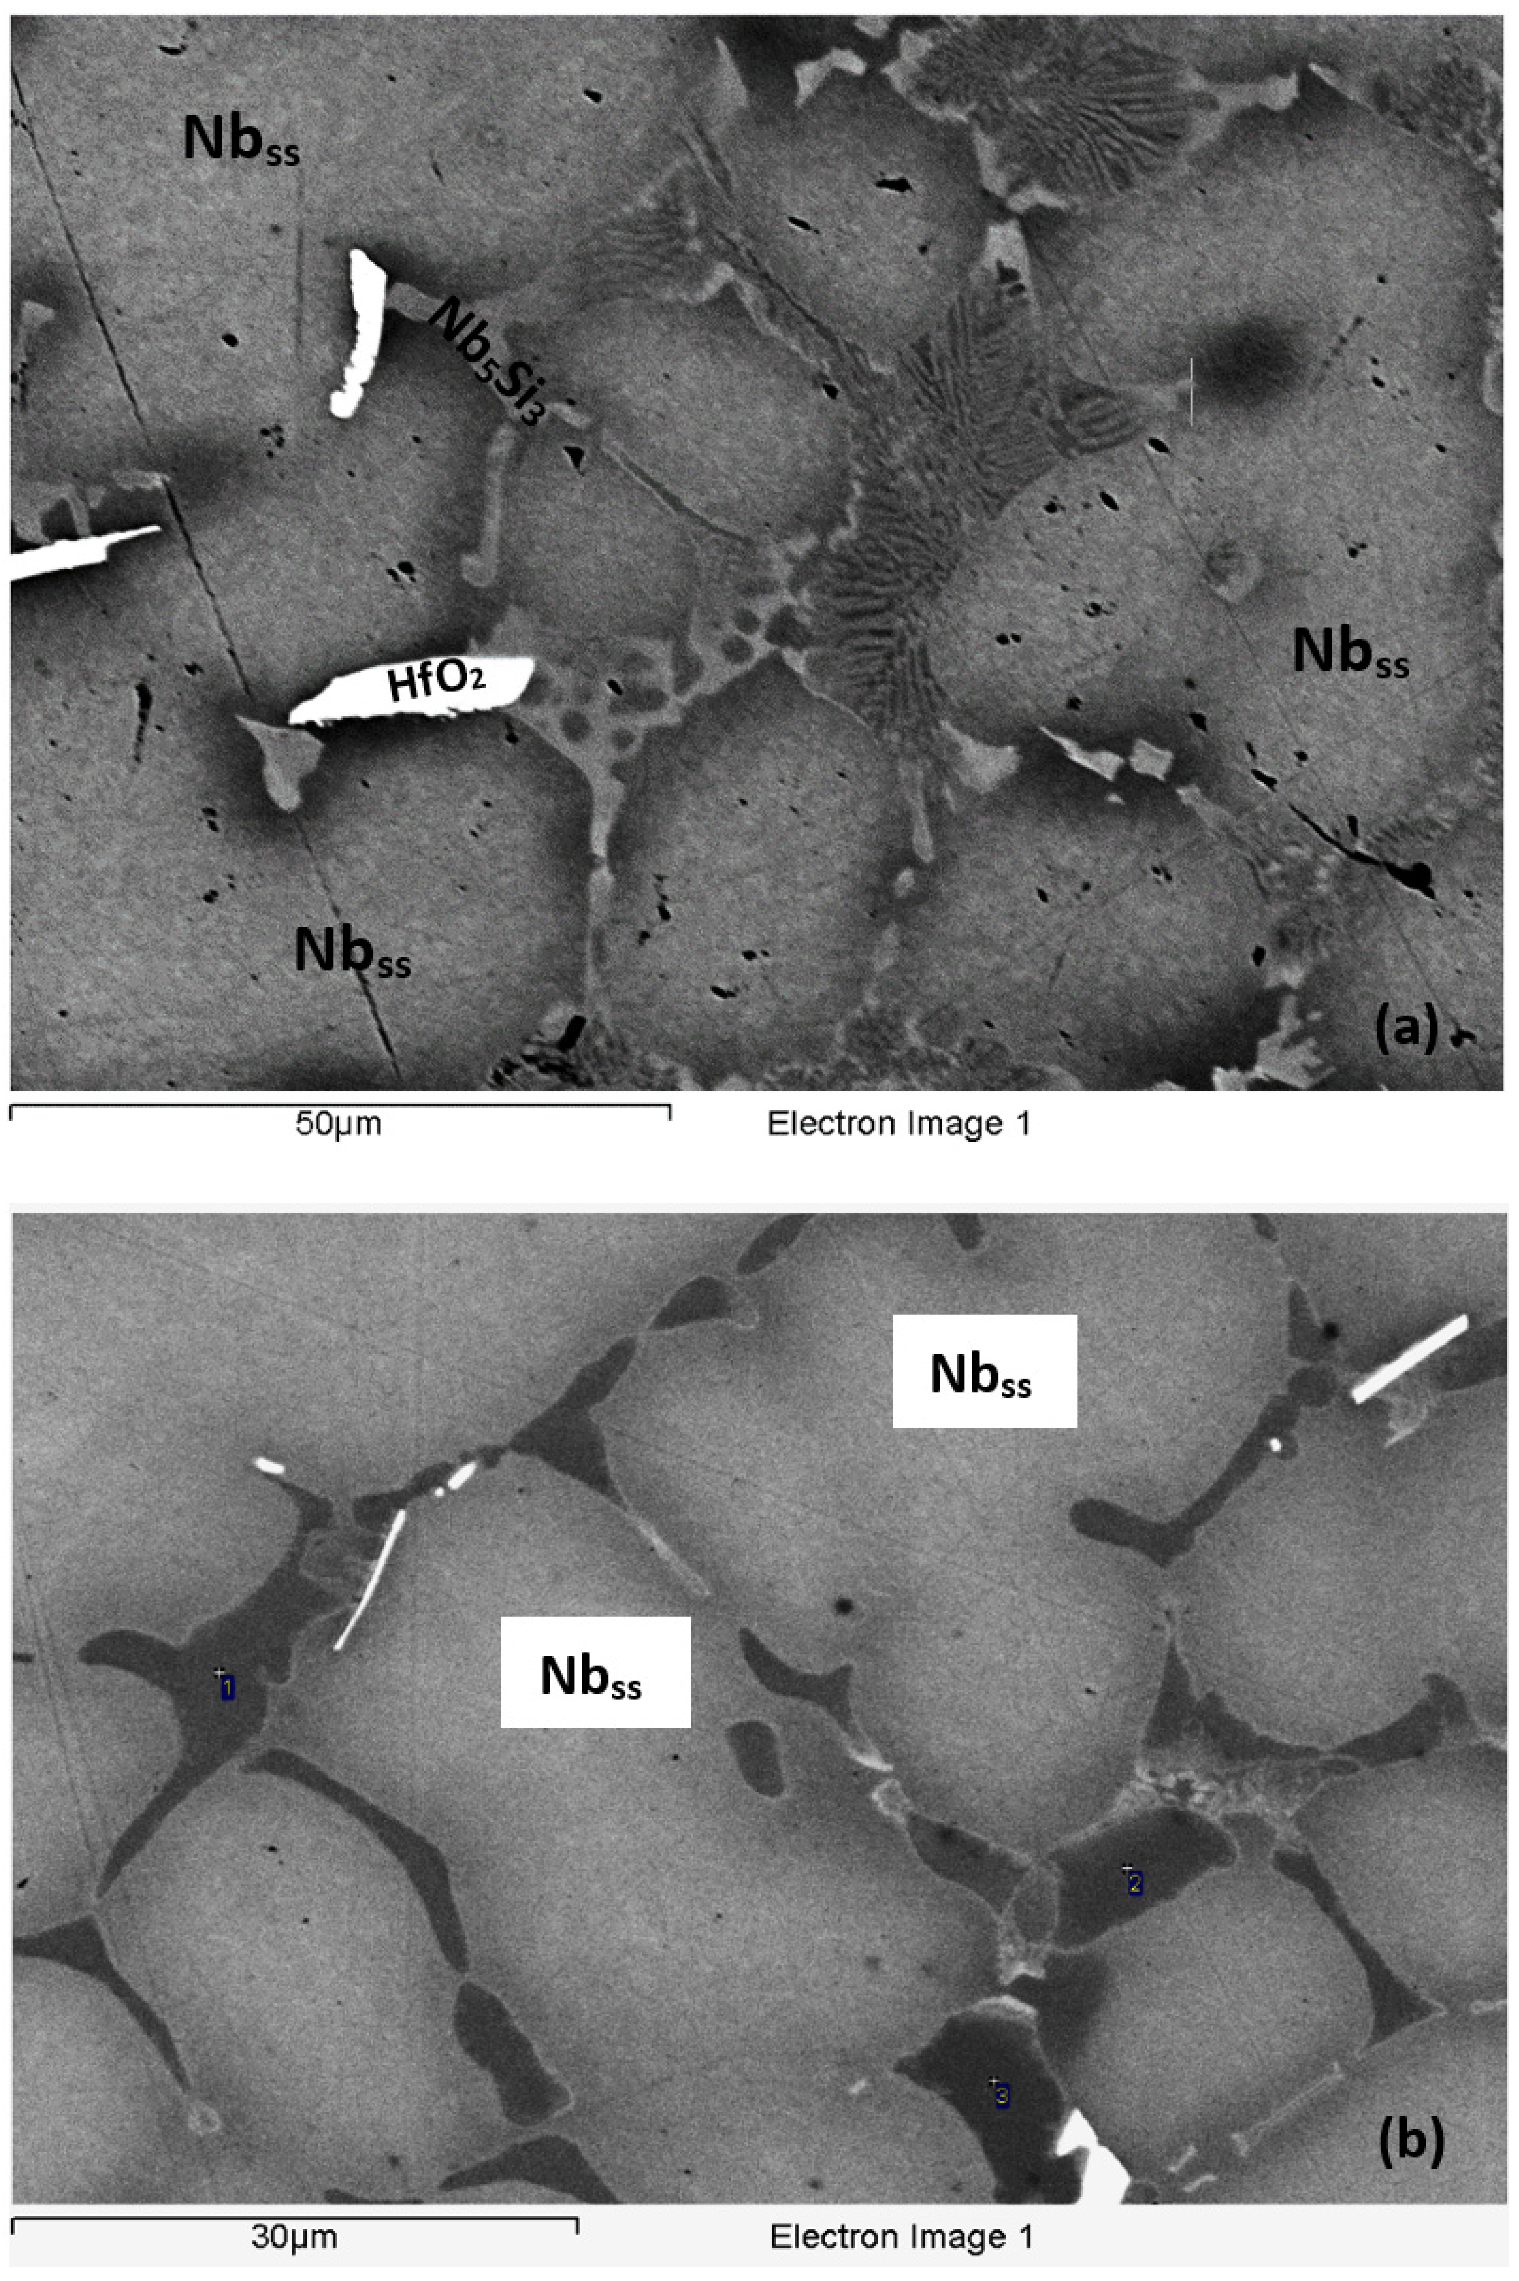
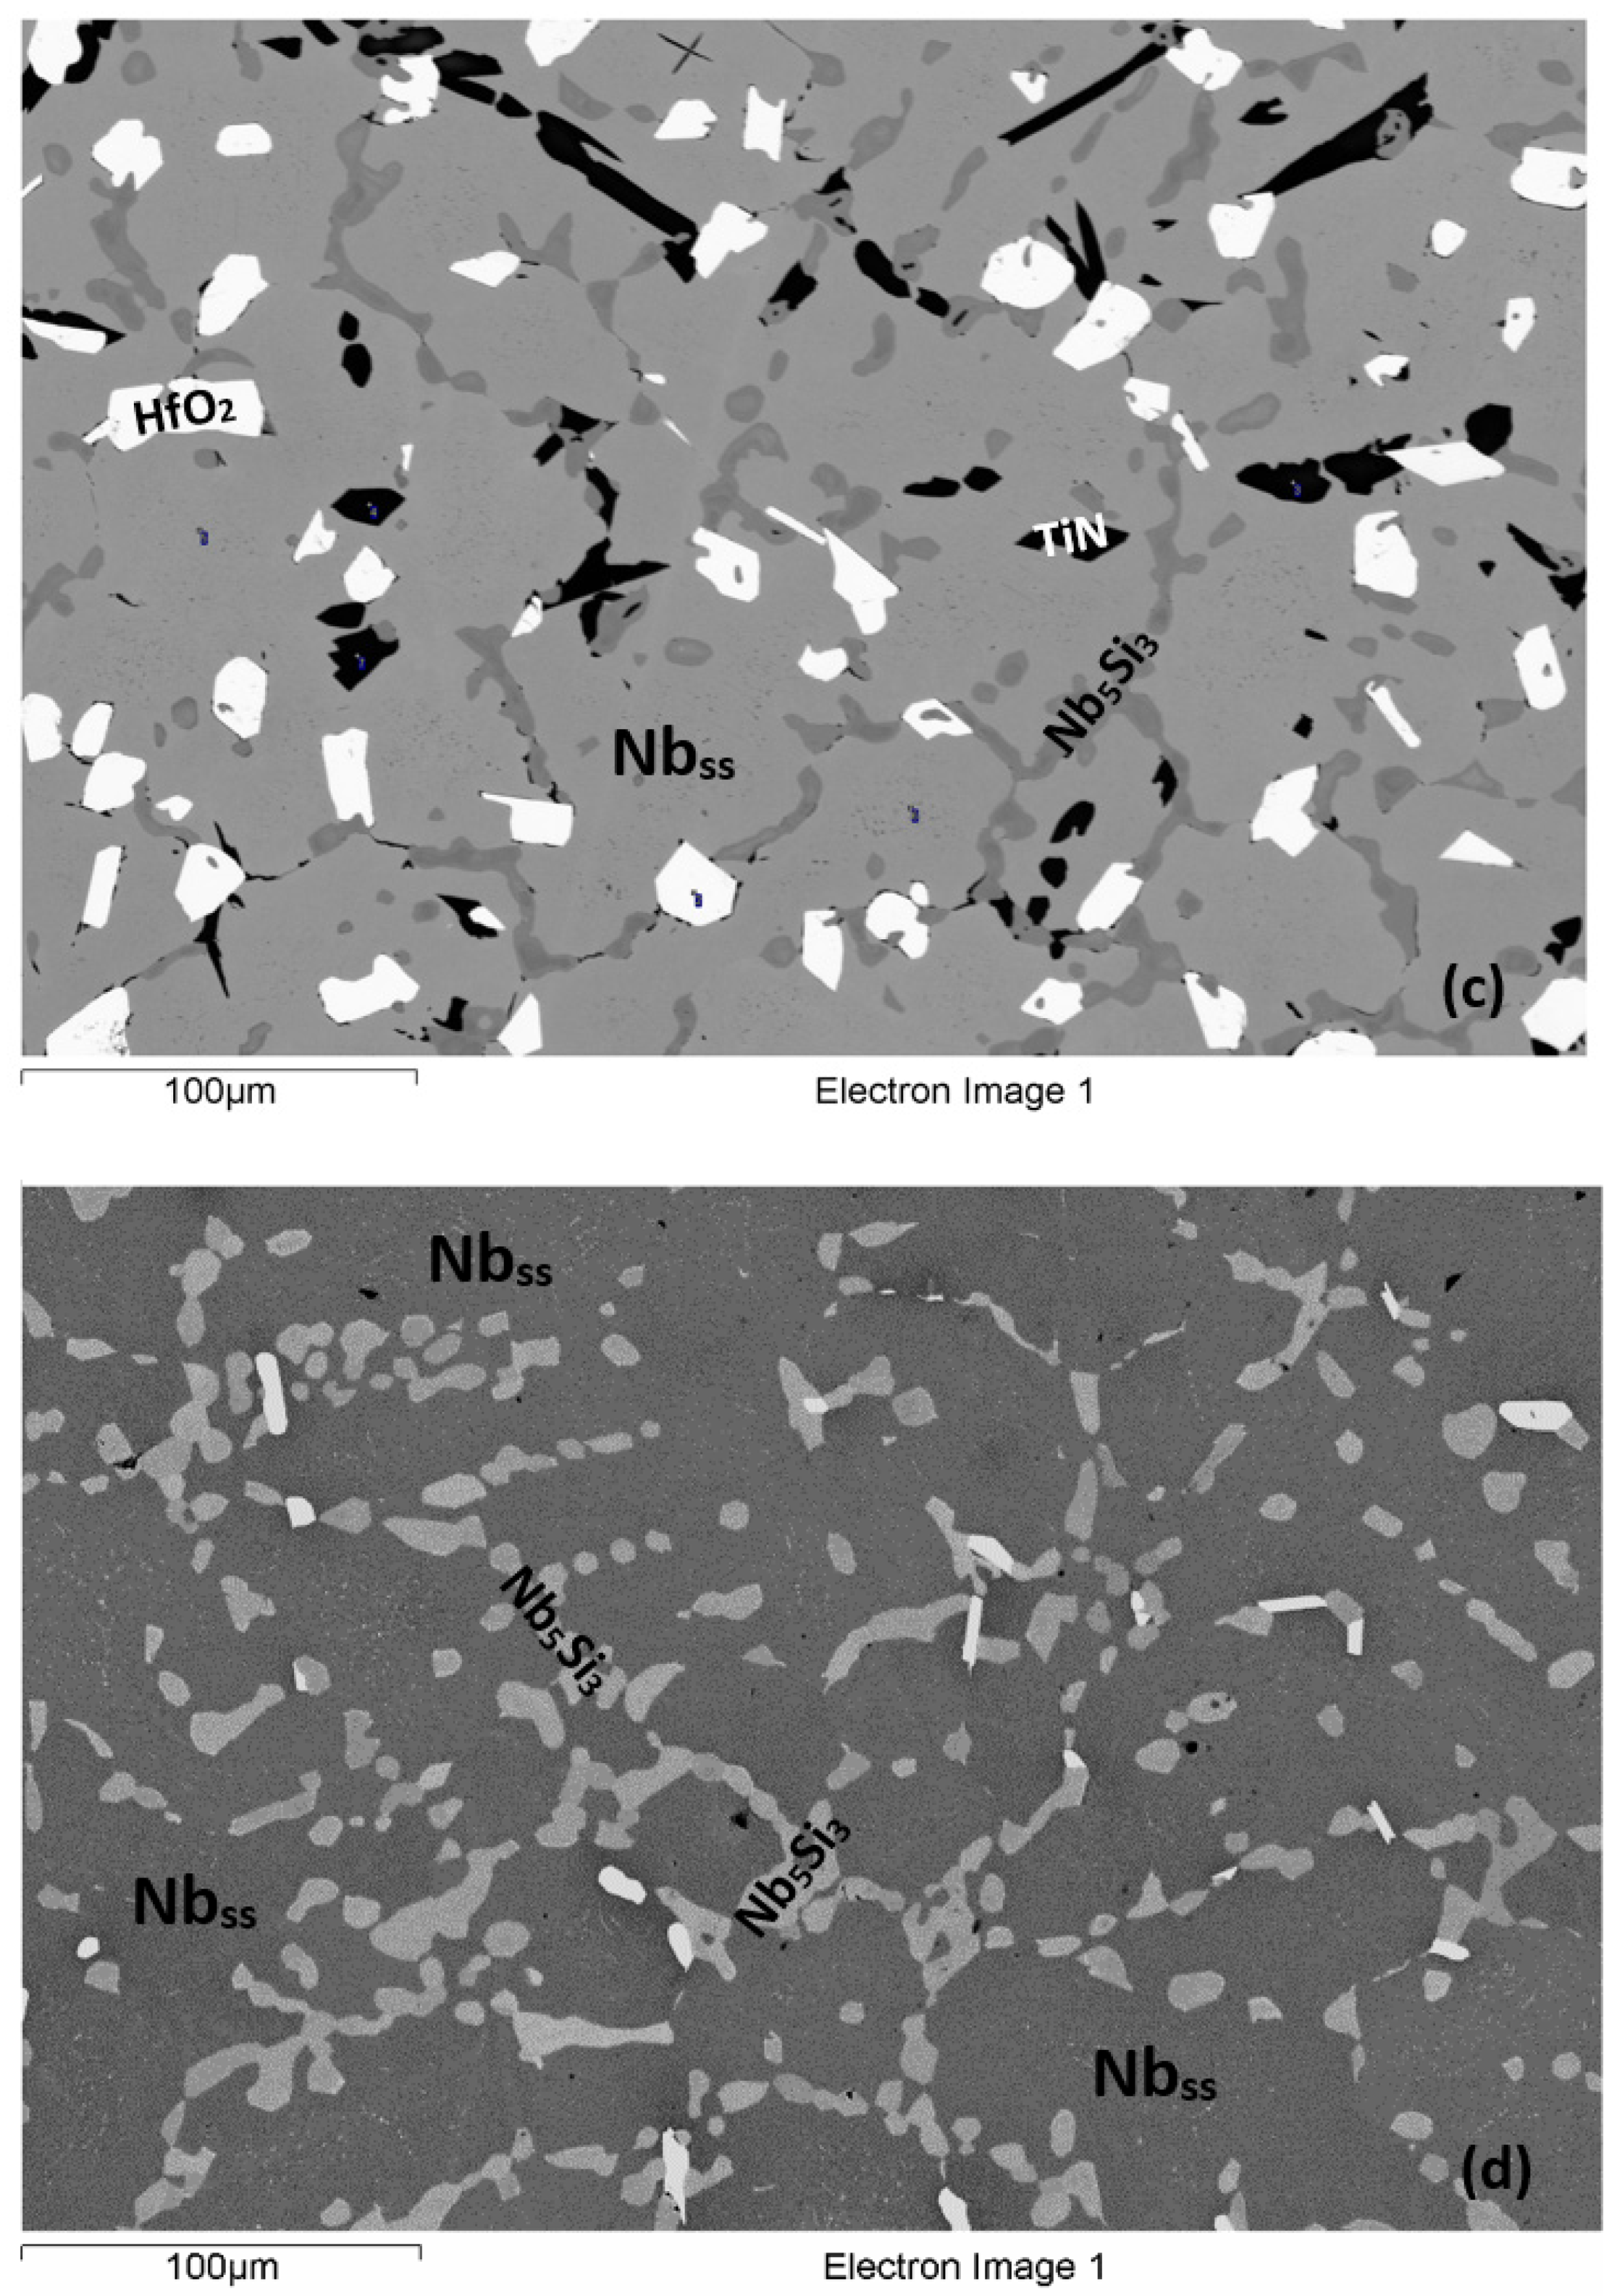
The actual chemical composition of NV1-AC was 51.4Nb-23Ti-6.2Si-5Al-2.1Cr-5.4Hf-2.2Sn-4.7V. This was the average composition of all the analyses taken from the bottom, bulk, and top areas of the as-cast button/ingot. The density of the alloy was 7.38 g/cm3 (Table 1). The microstructure in all parts of the ingot consisted of Nbss, Nb5Si3, HfO2, and Nbss + Nb5Si3 fine-scale lamellar microstructure (Figure 1, Figure 2 and Figure 3). The latter was “connected” with Nb5Si3 that had Nb/(Ti + Hf) less than one and an average <Si> of about 39 at.% (Figure 3) but not with Nb5Si3 with Nb/(Ti + Hf) greater than one and an average <Si> of about 37 at.% (Figure 2b) (<Si> = Al + Si + Sn). The XRD indicated the possible presence of Nb3Si. However, exhaustive study using EPMA to find Nb3Si, the presence or absence of which is important to understand how the lamellar microstructure formed (see discussion), did not confirm the existence of Nb3Si in NV1-AC.
The volume fraction of Nbss in NV1-AC was about 0.8 (Table 1). Data for the average chemical composition of the phases in the whole button/ingot are given in Table 2. Note that the very fine scale of the lamellar structure prevented reliable analysis of the chemical composition of its phases using EPMA. Strong partitioning of Cr, Ti, and V in the solid solution and of Hf and Ti in the silicide, which led to varying BSE contrast at the interface between these phases, was noted (Figure 2 and Figure 3).
For example, in Figure 2a,b, the areas of darker contrast near the Nb5Si3 silicide are Ti rich, and the brighter contrast Nb5Si3 grains are Hf rich (see below). The Ti-rich Nb5Si3, regarding its high Ti concentration, corresponded to the Ti-rich Nb5Si3 reported in other Ti-containing RM(Nb)ICs [35,36]. The Ti-rich Nbss was observed only in the top and bottom of NV1-AC. In Table 2, the Nb5Si3 is also designated as Ti- and Hf-rich Nb5Si3, owing to its high Hf and Ti contents (see below).
Compared with the nominal composition, the NV1-AC was slightly richer in Si with an average concentration of 6.2 at.%. The concentrations of the other alloying elements were very close to the nominal ones (see Section 2). There was macrosegregation of Ti and Si, the concentrations of which were in the ranges: 19.4 to 24.3 at.% (MACTi = 4.9 at.%) and 3.9 to 7 at.% (MACSi = 3.1 at.%), respectively. The XRD (Figure 1a) indicated the presence of tetragonal αNb5Si3 and hexagonal 5-3 silicide. There were three peaks that are characteristic of αNb5Si3 compared with six peaks for the hexagonal γNb5Si3 and four peaks for the hexagonal Ti5Si3, all shared with other phases. The latter two silicides are isomorphous [24].
In the areas close to the top of the button/ingot, the Si concentration was in the range 3.9 to 5.9 at.%, and the microstructure consisted of Nbss, Nb5Si3, and a lamellar microstructure of these phases. The Ti-rich Nbss was found either next to the Ti-and-Hf-rich Nb5Si3, or surrounded the HfO2, which was often found adjacent to the Ti-and-Hf-rich Nb5Si3. The Ti-rich areas in the Nbss and the Ti-rich Nb5Si3 exhibit a dark contrast in the microstructures shown in the Figure 2a,b. However, the Ti- and Hf-rich areas in the Nb5Si3 exhibited bright contrast. The Ti concentration varied from 18.8 to 20.8 at.% in the Ti-rich Nb5Si3 and from 22.4 to 25.2 at.% in the Ti-and-Hf-rich Nb5Si3. Despite the fact that the Ti-and-Hf-rich Nb5Si3 was richer in Ti compared with the Ti-rich Nb5Si3, it exhibited a brighter contrast owing to its very high Hf concentration, which varied from 12 to 12.7 at.% compared with 6 to 7 at.% in the Ti-rich Nb5Si3. The aforementioned Ti-rich and Ti-and-Hf-rich Nb5Si3 was observed more often as two discrete grains in the top of the ingot, unlike the bulk and bottom of the ingot where the segregation of Hf and Ti was observed mainly at the exterior or the interior of a single Nb5Si3 grain. The lamellar microstructure of Nbss and Nb5Si3 was formed adjacent to the Ti-and-Hf-rich Nb5Si3. The solubility of Cr in Nb5Si3 was low and exceeded 1 at.% in the Ti-and-Hf-rich Nb5Si3. Similarly, the V concentration in the Nb5Si3 was low and varied from 1.4 to 2.9 at.% in the Ti-and-Hf-rich Nb5Si3 and from 1.2 to 2.6 at.% in the Ti-rich Nb5Si3.
In the bulk of the button/ingot, the Si concentration was in the range 5.8 to 7 at.%. The microstructure was slightly coarser and consisted of the same phases as in the top (Figure 2b) but with two main exceptions. Firstly, the Ti-rich parts of the Nbss were also rich in V and Cr where the concentrations of these elements varied from 7.8 to 10.2 at.% and 3.6 to 8.4 at.%, respectively. This Nbss is designated as Ti-, V-, and Cr-rich Nbss in Table 2. The solubility of Al, Si, and Sn in the Nbss was reduced. Secondly, the Nb5Si3 exhibited Ti- and Hf-rich areas in different parts of the same grain. The Ti-rich Nb5Si3, unlike that observed in the top of the ingot, was also rich in Hf, and the Ti-and-Hf-rich Nb5Si3 was observed with Hf concentrations as high as 17 at.%. In other words, the Hf solubility in Nb5Si3 was much higher in the bulk of the ingot, compared with the top. Differences in the composition of the 5-3 silicide should also be noted (compare composition of 5-3 silicide in Figure 2b and Figure 3). The solubility of Sn was negligible in both the Ti-and-Hf-rich and the Ti-rich Nb5Si3. The lamellar microstructure (Figure 3) had average composition 39.6Nb-23.4Ti-18.2Si-7.7Hf-4.6Al-3.6V-1.6Sn-1.3Cr (at.%), similar to that observed in the top of the ingot.
In the bottom of the ingot, the Si concentration was in the range of 4.9 to 6.6 at.%. The Ti-rich Nbss had a similar composition to that in the top. In the Nb5Si3, the Hf segregation was not as strong as in the bulk. The solubility of Al in the Nbss was as high as 6.1 at.%. The average Si concentration in the lamellar microstructure was 20.8 at.%, which was slightly higher compared with the top and bulk of the ingot.
4.2. Heat-Treated (NV1-HT)
The actual chemical composition of NV1-HT was Nb-23.3Ti-5Si-4.9Al-1.8Cr-5Hf-2Sn-3.7V. The XRD data (Figure 1b) suggested the presence of αNb5Si3 and hexagonal 5-3 silicides and Nb3Si. However, the presence of Nb3Si in the microstructure was not confirmed by exhaustive study using EPMA. Compared with NV1-AC, the number of peaks for αNb5Si3 and γNb5Si3 and Ti5Si3 had increased and decreased, respectively. The typical microstructure in the bulk of NV1-HT consisted of Nbss, Nb5Si3, and HfO2 (see Figure 2d). There was no evidence of the lamellar microstructure seen in NV1-AC. Homogenisation had taken place in both the Nbss and Nb5Si3 (Table 2). The HfO2 was found at the interface of Nbss and Nb5Si3. The vol.% of the Nbss had not changed significantly compared with NV1-AC (see Table 1). The Cr solubility in the Nbss increased after the heat treatment and was as high as 5.6 at.% in some parts of the solid solution. On the contrary, the average solubility of V in the Nbss had decreased to 2.4 at.%. The Ti concentration in the Nbss was about 23.6 at.%, close to the nominal Ti concentration in the alloy. The solubilities of Al, Sn, and Hf in the Nbss did not change after the heat treatment. The solubilities of Ti and V in the Nb5Si3 were reduced, while those of Al and Hf had not changed. However, the solubility of Cr had increased in the Nb5Si3.
In the microstructure near the surface of NV1-HT there were Ti-rich regions in the Nb5Si3 (see Table 3). This was not observed in the bulk of NV1-HT (Table 2). Furthermore, the Hf concentration in the Nb5Si3 was reduced compared with the Nb5Si3 in the bulk of NV1-HT and NV1-AC (Table 2 and Table 3), and the Ti concentration in the Ti-rich Nb5Si3 was similar to that of the Ti- and Hf-rich Nb5Si3 in NV1-AC, while in the Nb5Si3, the average Ti and Hf concentrations barely exceeded 15 and 1 at.%, respectively. Thus, near the surface area of NV1-HT the Nb5Si3 had Nb/(Ti + Hf) greater than one, whereas in the bulk, this ratio was less than one. No Hf was analysed in the Nbss, and the Al, V, Cr, and Sn concentrations were in the solubility range of these elements as in the Ti-rich Nbss in NV1-AC. The vol.% and the size of the Hf oxide particles had increased compared with the bulk of NV1-HT (Figure 2c,d). Together with the phases described above, Ti nitride of irregular shape and various sizes had formed near the surfaces of NV1-HT specimens (Figure 2c), up to about 1 mm below the surface.
The Ti nitride grains were found either adjacent to Nb5Si3 or between the Nb5Si3 and HfO2. The presence of Ti nitride was confirmed only by EPMA (Table 3) owing to its small volume fraction in NV1-HT.
4.3. Oxidation
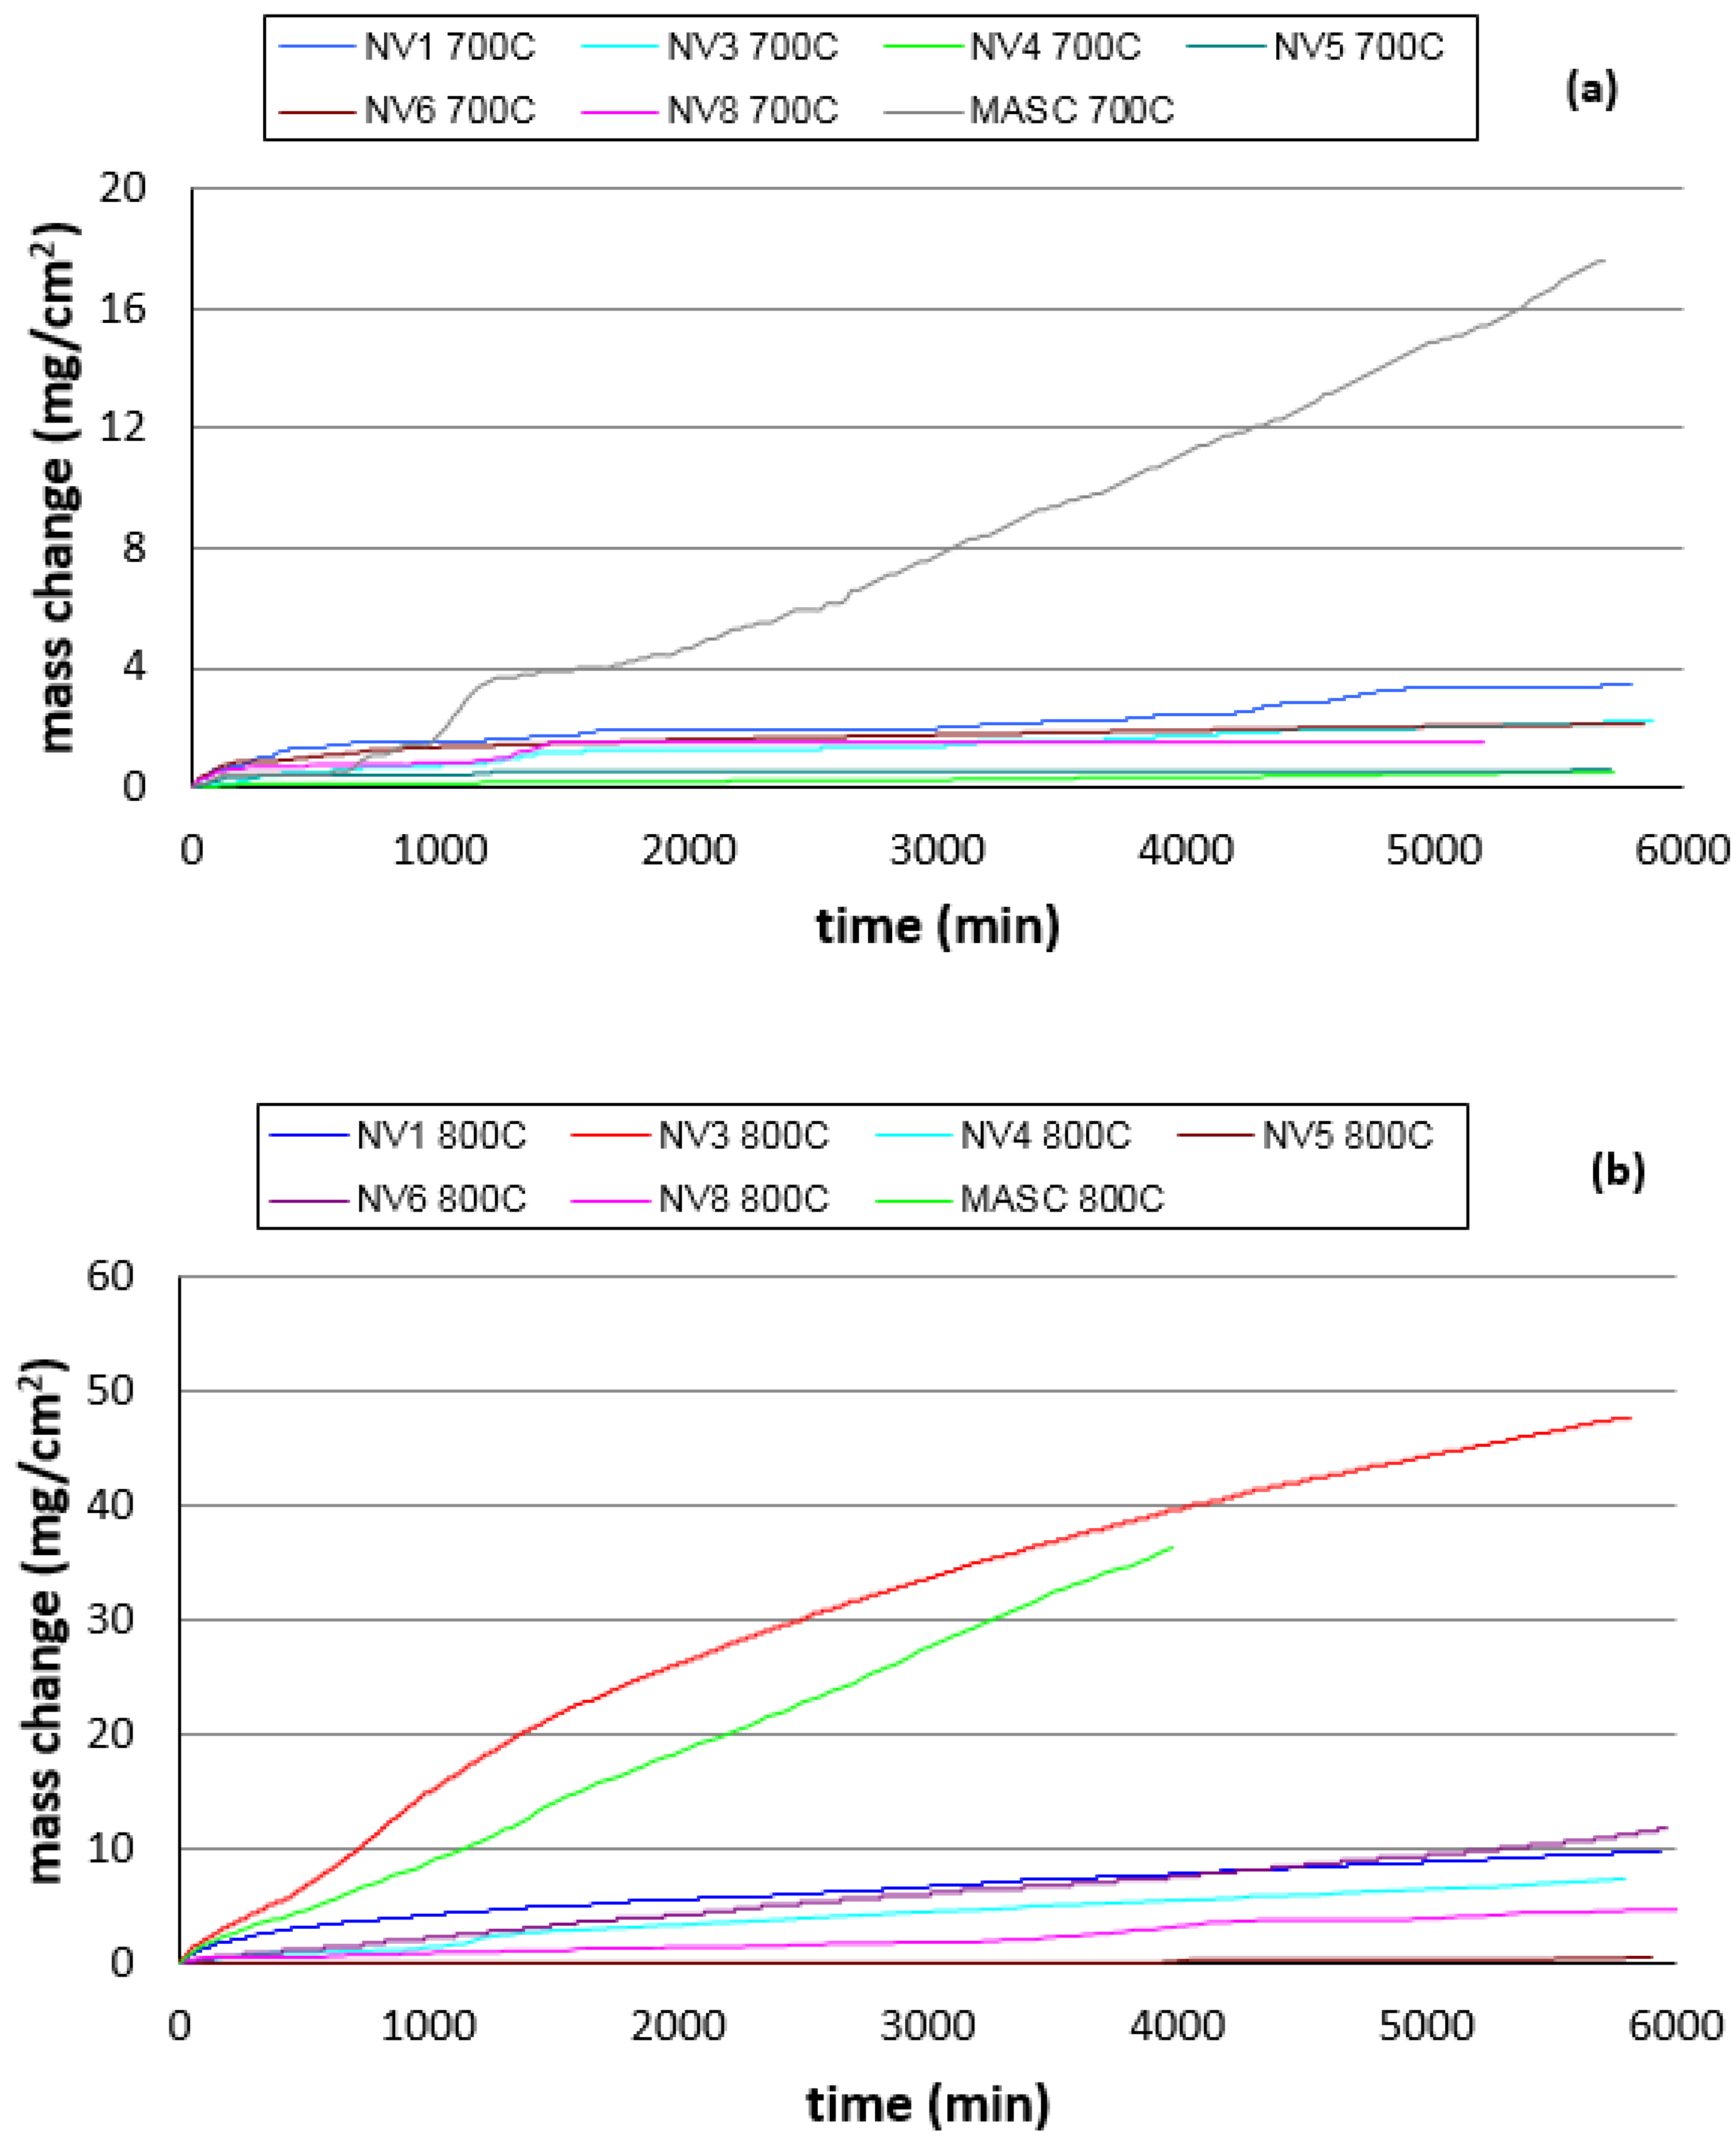
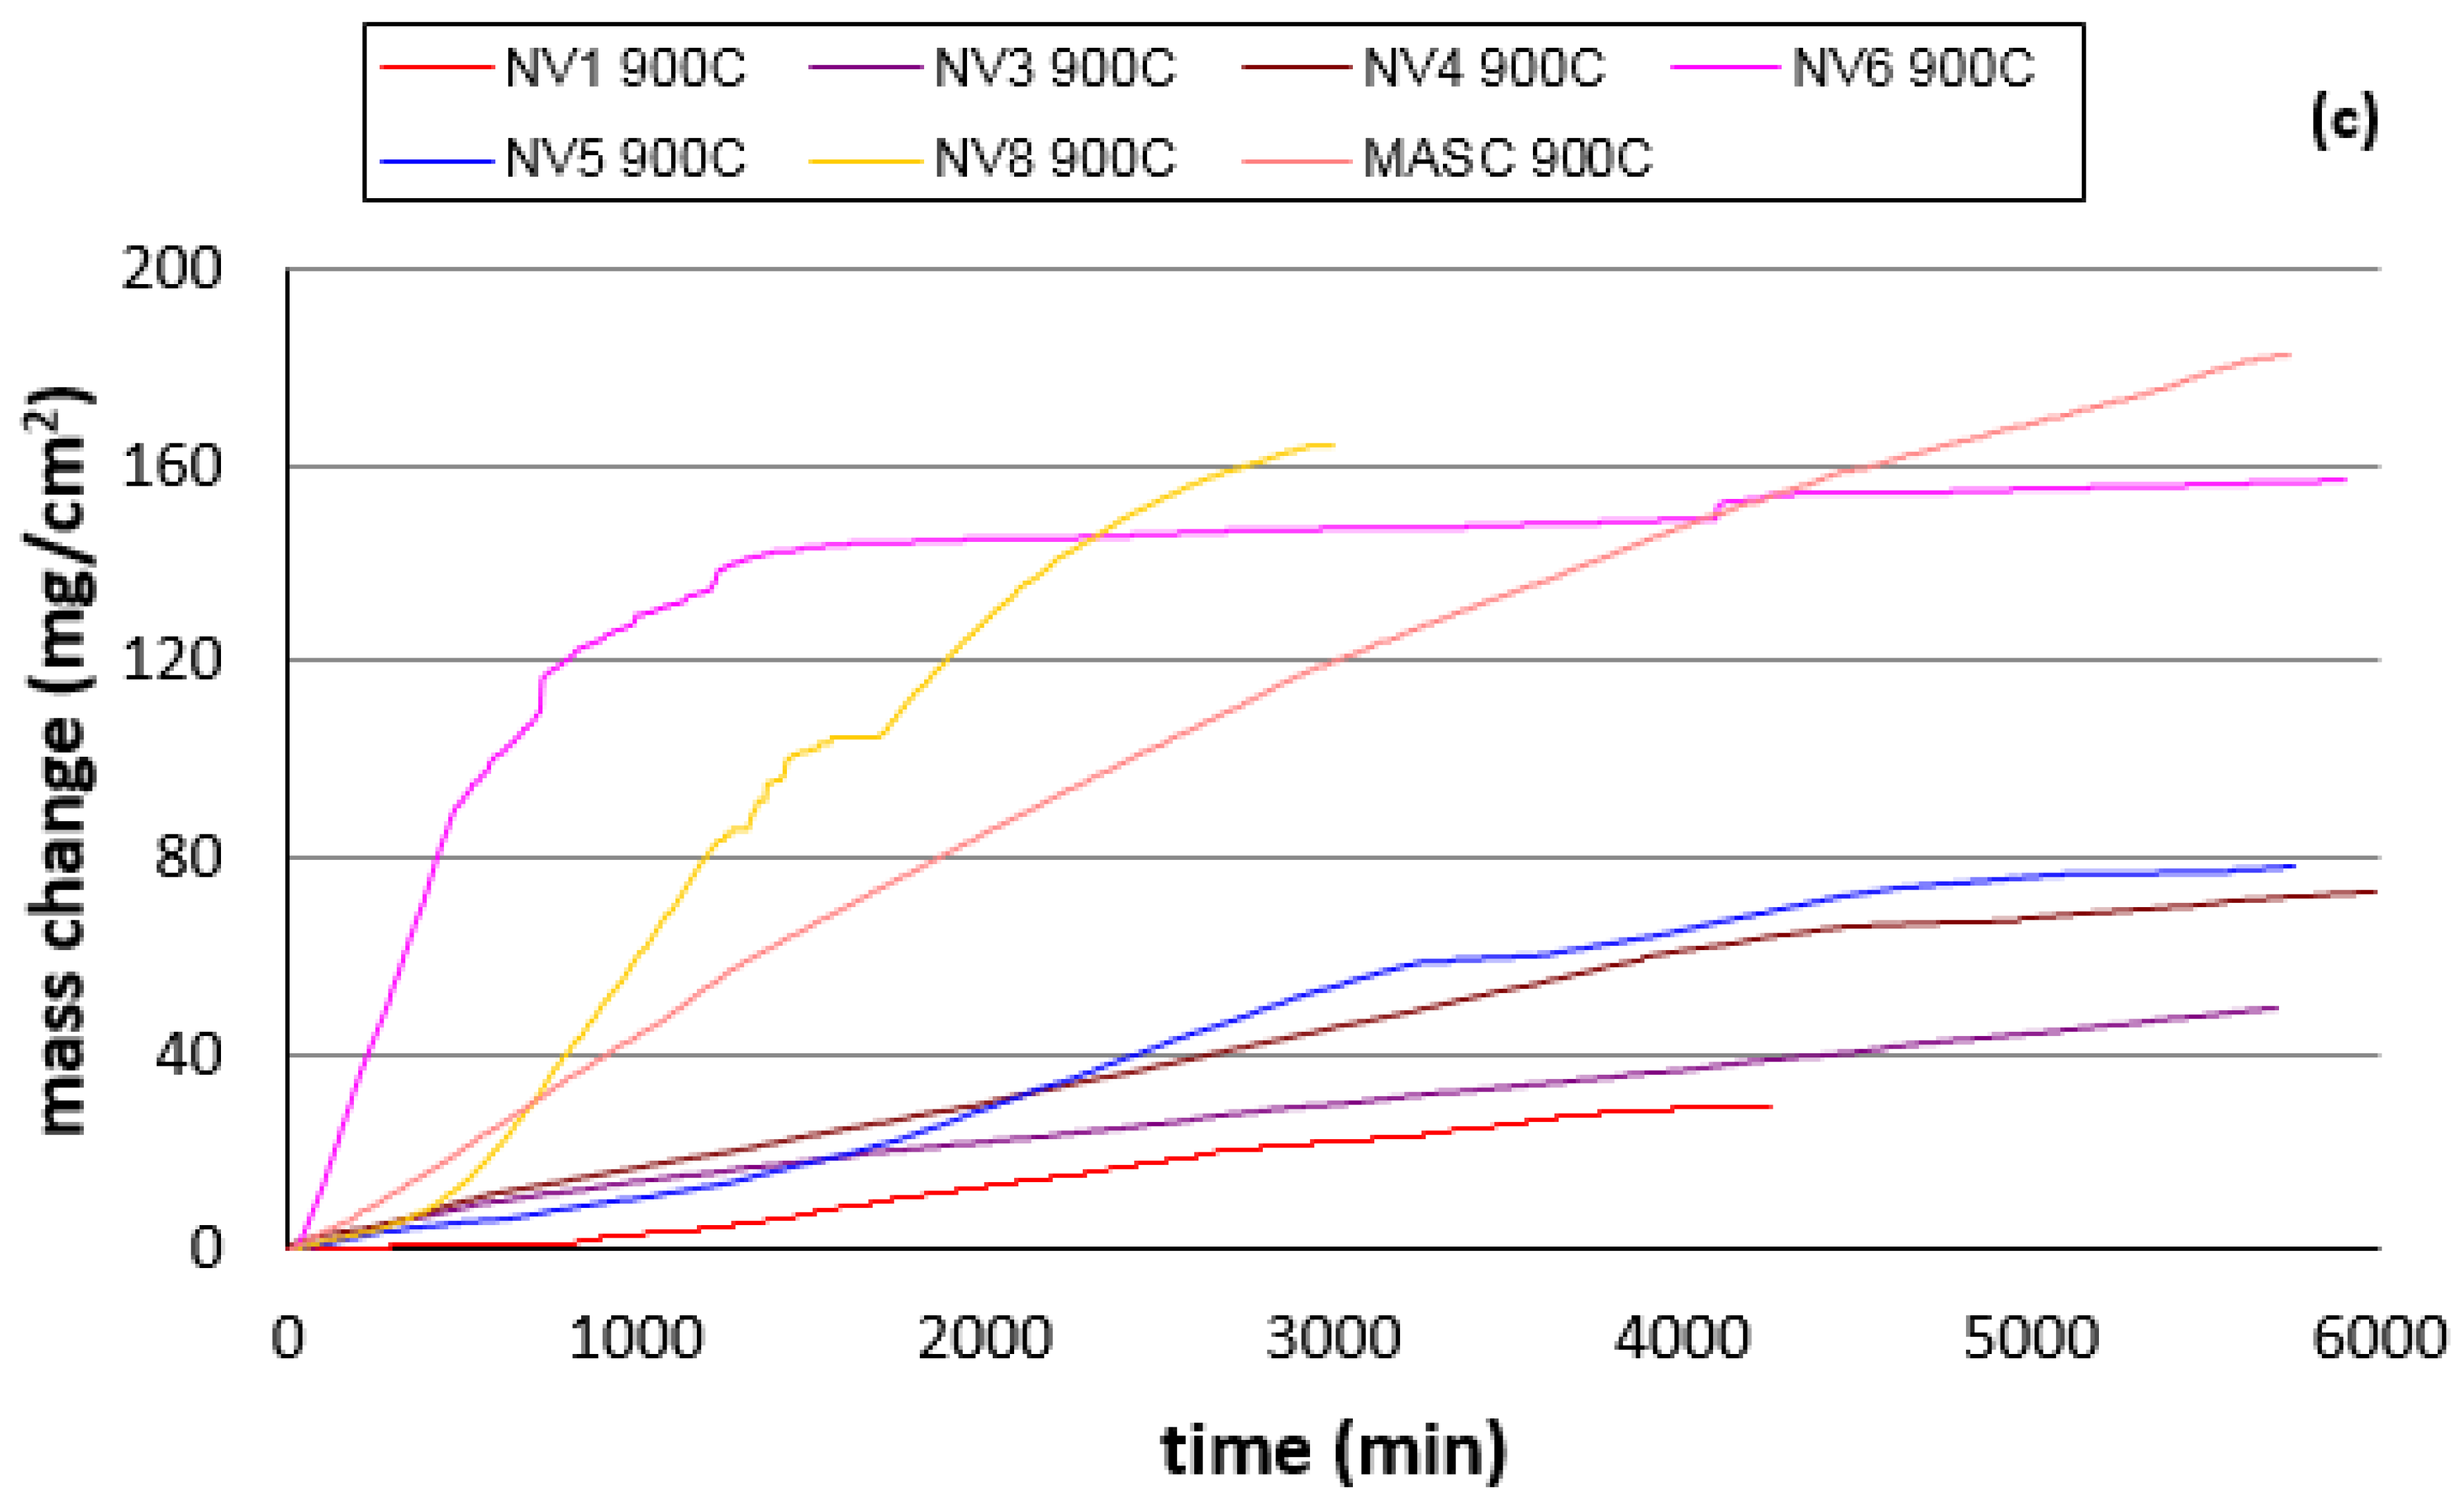
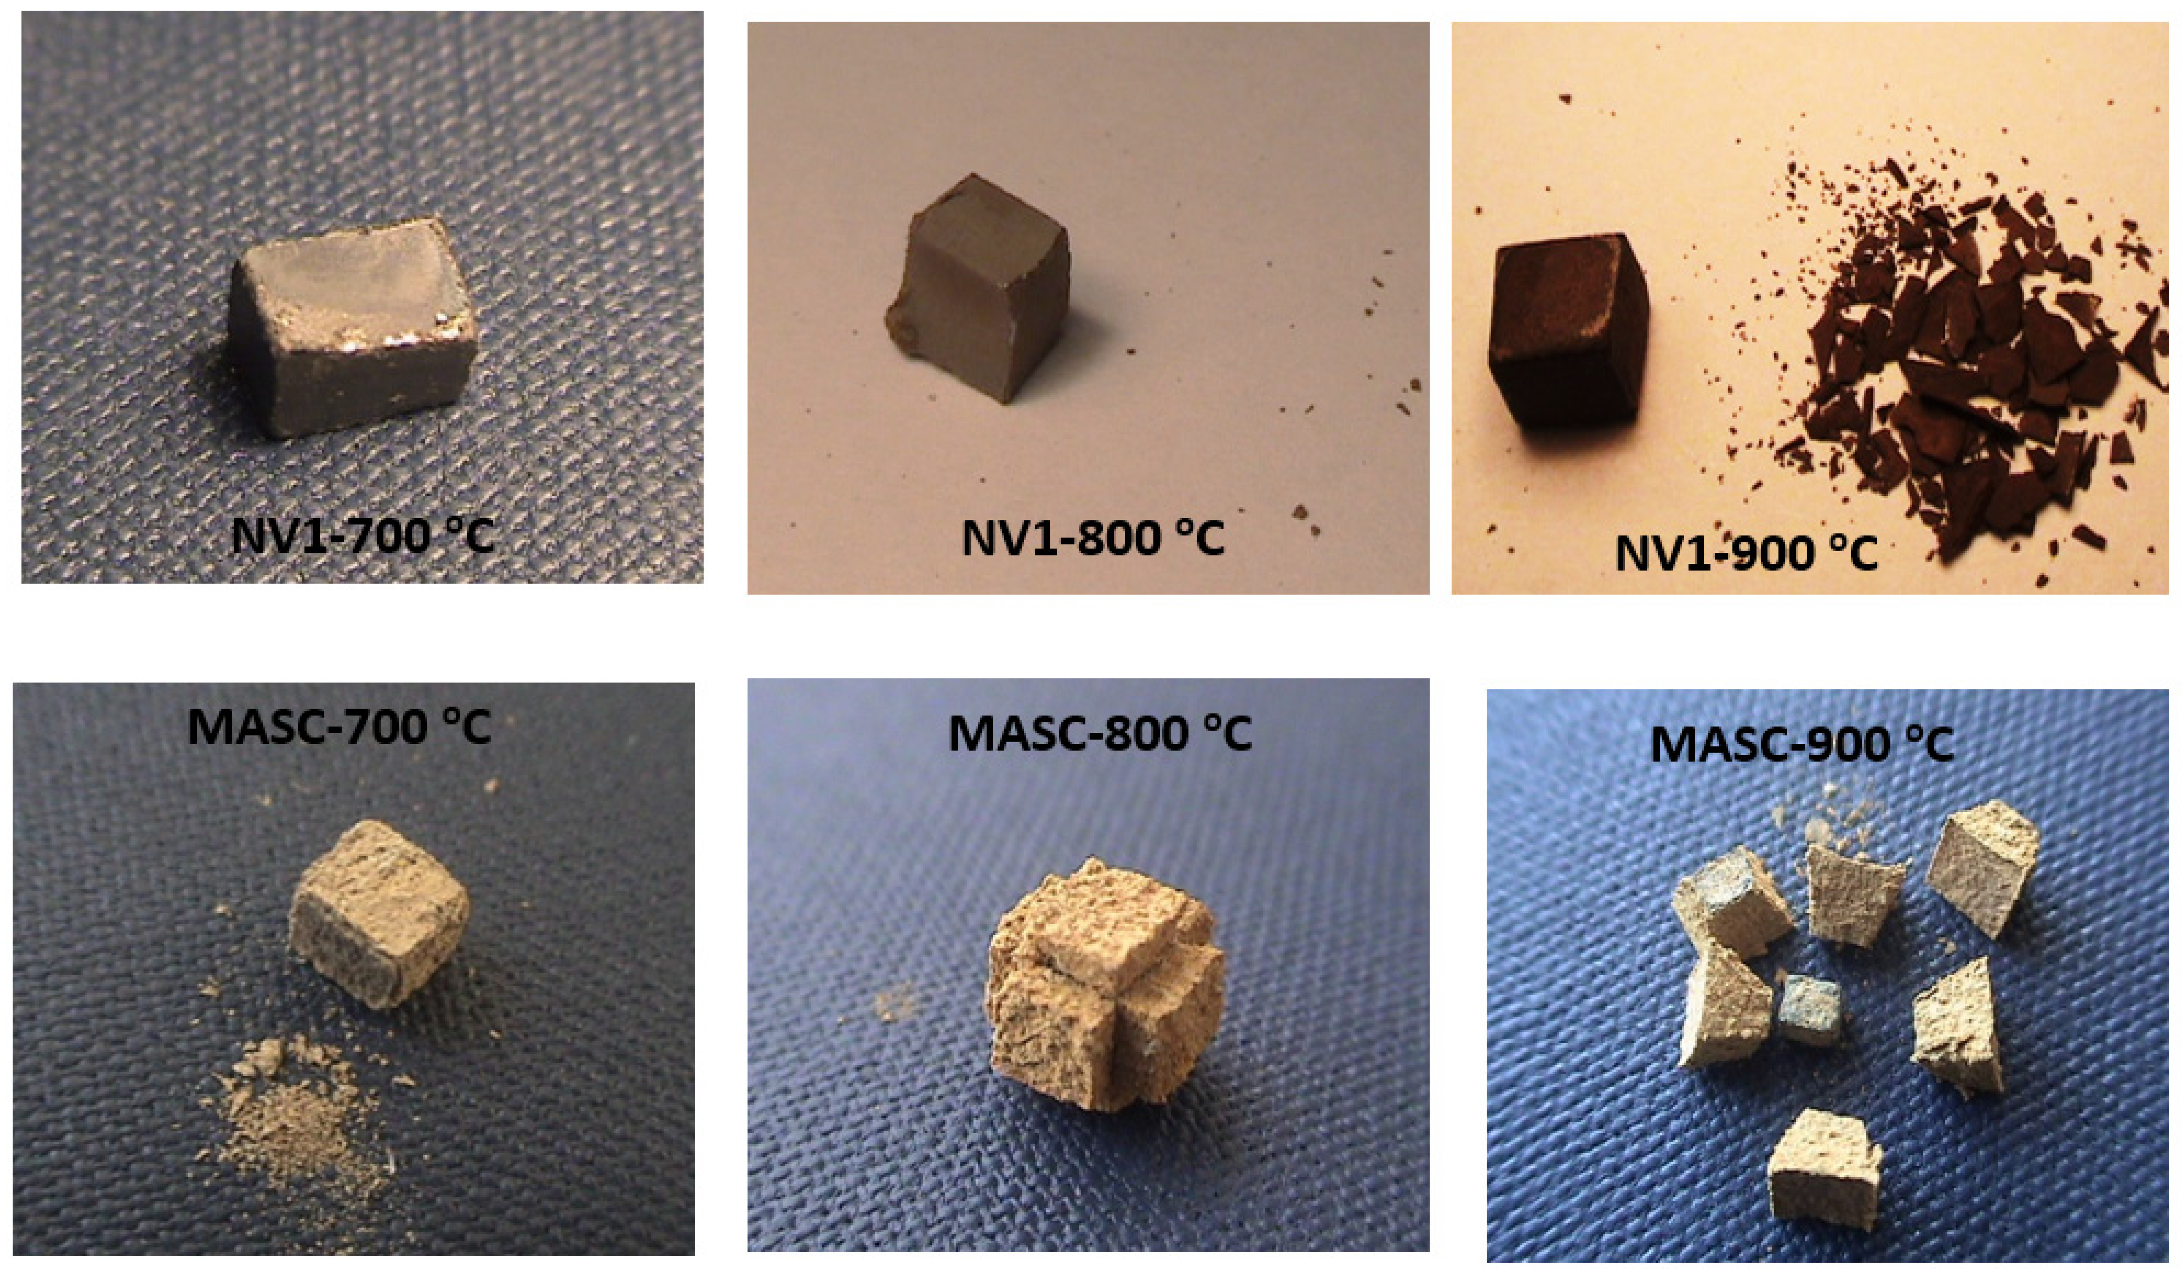
The mass change of NV1 in isothermal oxidation at 700, 800, and 900 °C was compared with the “reference” MASC alloy (see the introduction) and the alloys NV3 [37], NV4 [38], NV5 [37], NV6 [39], and NV8 [38] in Figure 4. Large button/ingots of all these alloys were made using arc melting. The oxidised specimens are shown in Figure 5, and the oxidation rate constants are given in Table 4. In the latter table, the vol.% of Nbss in the Sn-containing alloys with similar Ti concentration to the MASC alloy is also given. Note (i) that the MASC alloy was Sn-free, (ii) that the vol.% Nbss of the alloy NV4 [38] was about 51.3%, (iii) that the alloy NV4 was very Ti-rich (45 at.%, nominal), and (iv) that the Sn content of the alloys NV3 to NV6 and NV8 was 5 at.% (nominal) compared with 2 at.% Sn in NV1 (for nominal composition of the alloys, see the Table A1 in the Appendix A). The alloy NV9 [39] suffered catastrophic pest oxidation at all three temperatures. Data for this alloy is not included in the Figure 4. Furthermore, because of (iii), data for the oxidation rate constants of the alloy NV4 is not included in the Table 4.
At 700 °C, the NV series of alloys (see the previous paragraph and the Table A1 in the Appendix A) followed parabolic oxidation kinetics, whereas the MASC alloy exhibited parabolic oxidation for the first 10 h and then linear oxidation until the end of the oxidation (Table 4). The ranking of alloys from best to worst oxidation was NV5, NV8, NV6, NV3, NV1, and MASC. Partial pest oxidation was observed only for the MASC alloy (Figure 4). The NV1 alloy did not pest; there was some “blistering” along its edges; and its mass change was 3.5 mg/cm2. At 800 °C, the alloys NV3, NV6, and MASC followed linear oxidation kinetics, and the alloys NV1, NV2, NV5, and NV8 followed parabolic oxidation kinetics. The ranking of alloys from best to worst oxidation was NV5, NV8, NV1, NV6, MASC, and NV3. Pest oxidation was observed only for the NV3 alloy. The MASC alloy formed a Maltese cross (Figure 4). Even though the specimen of the NV1 alloy did not pest, there was evidence of oxide growth around one of the specimen corners (see the bottom left-hand corner in Figure 4), and some oxide from this area spalled off. The mass change of NV1 was 10 mg/cm2. At 900 °C, all the alloys followed linear oxidation. The ranking of alloys from best to worst oxidation was NV1, NV3, NV5, NV6, MASC, and NV8. Pest oxidation was observed for the alloys NV6 and NV8. The MASC alloy had formed a Maltese cross that separated in six pieces and a small core (Figure 4). The mass change of NV1 was 30 mg/cm2 after 70 h, and its scale spalled off.
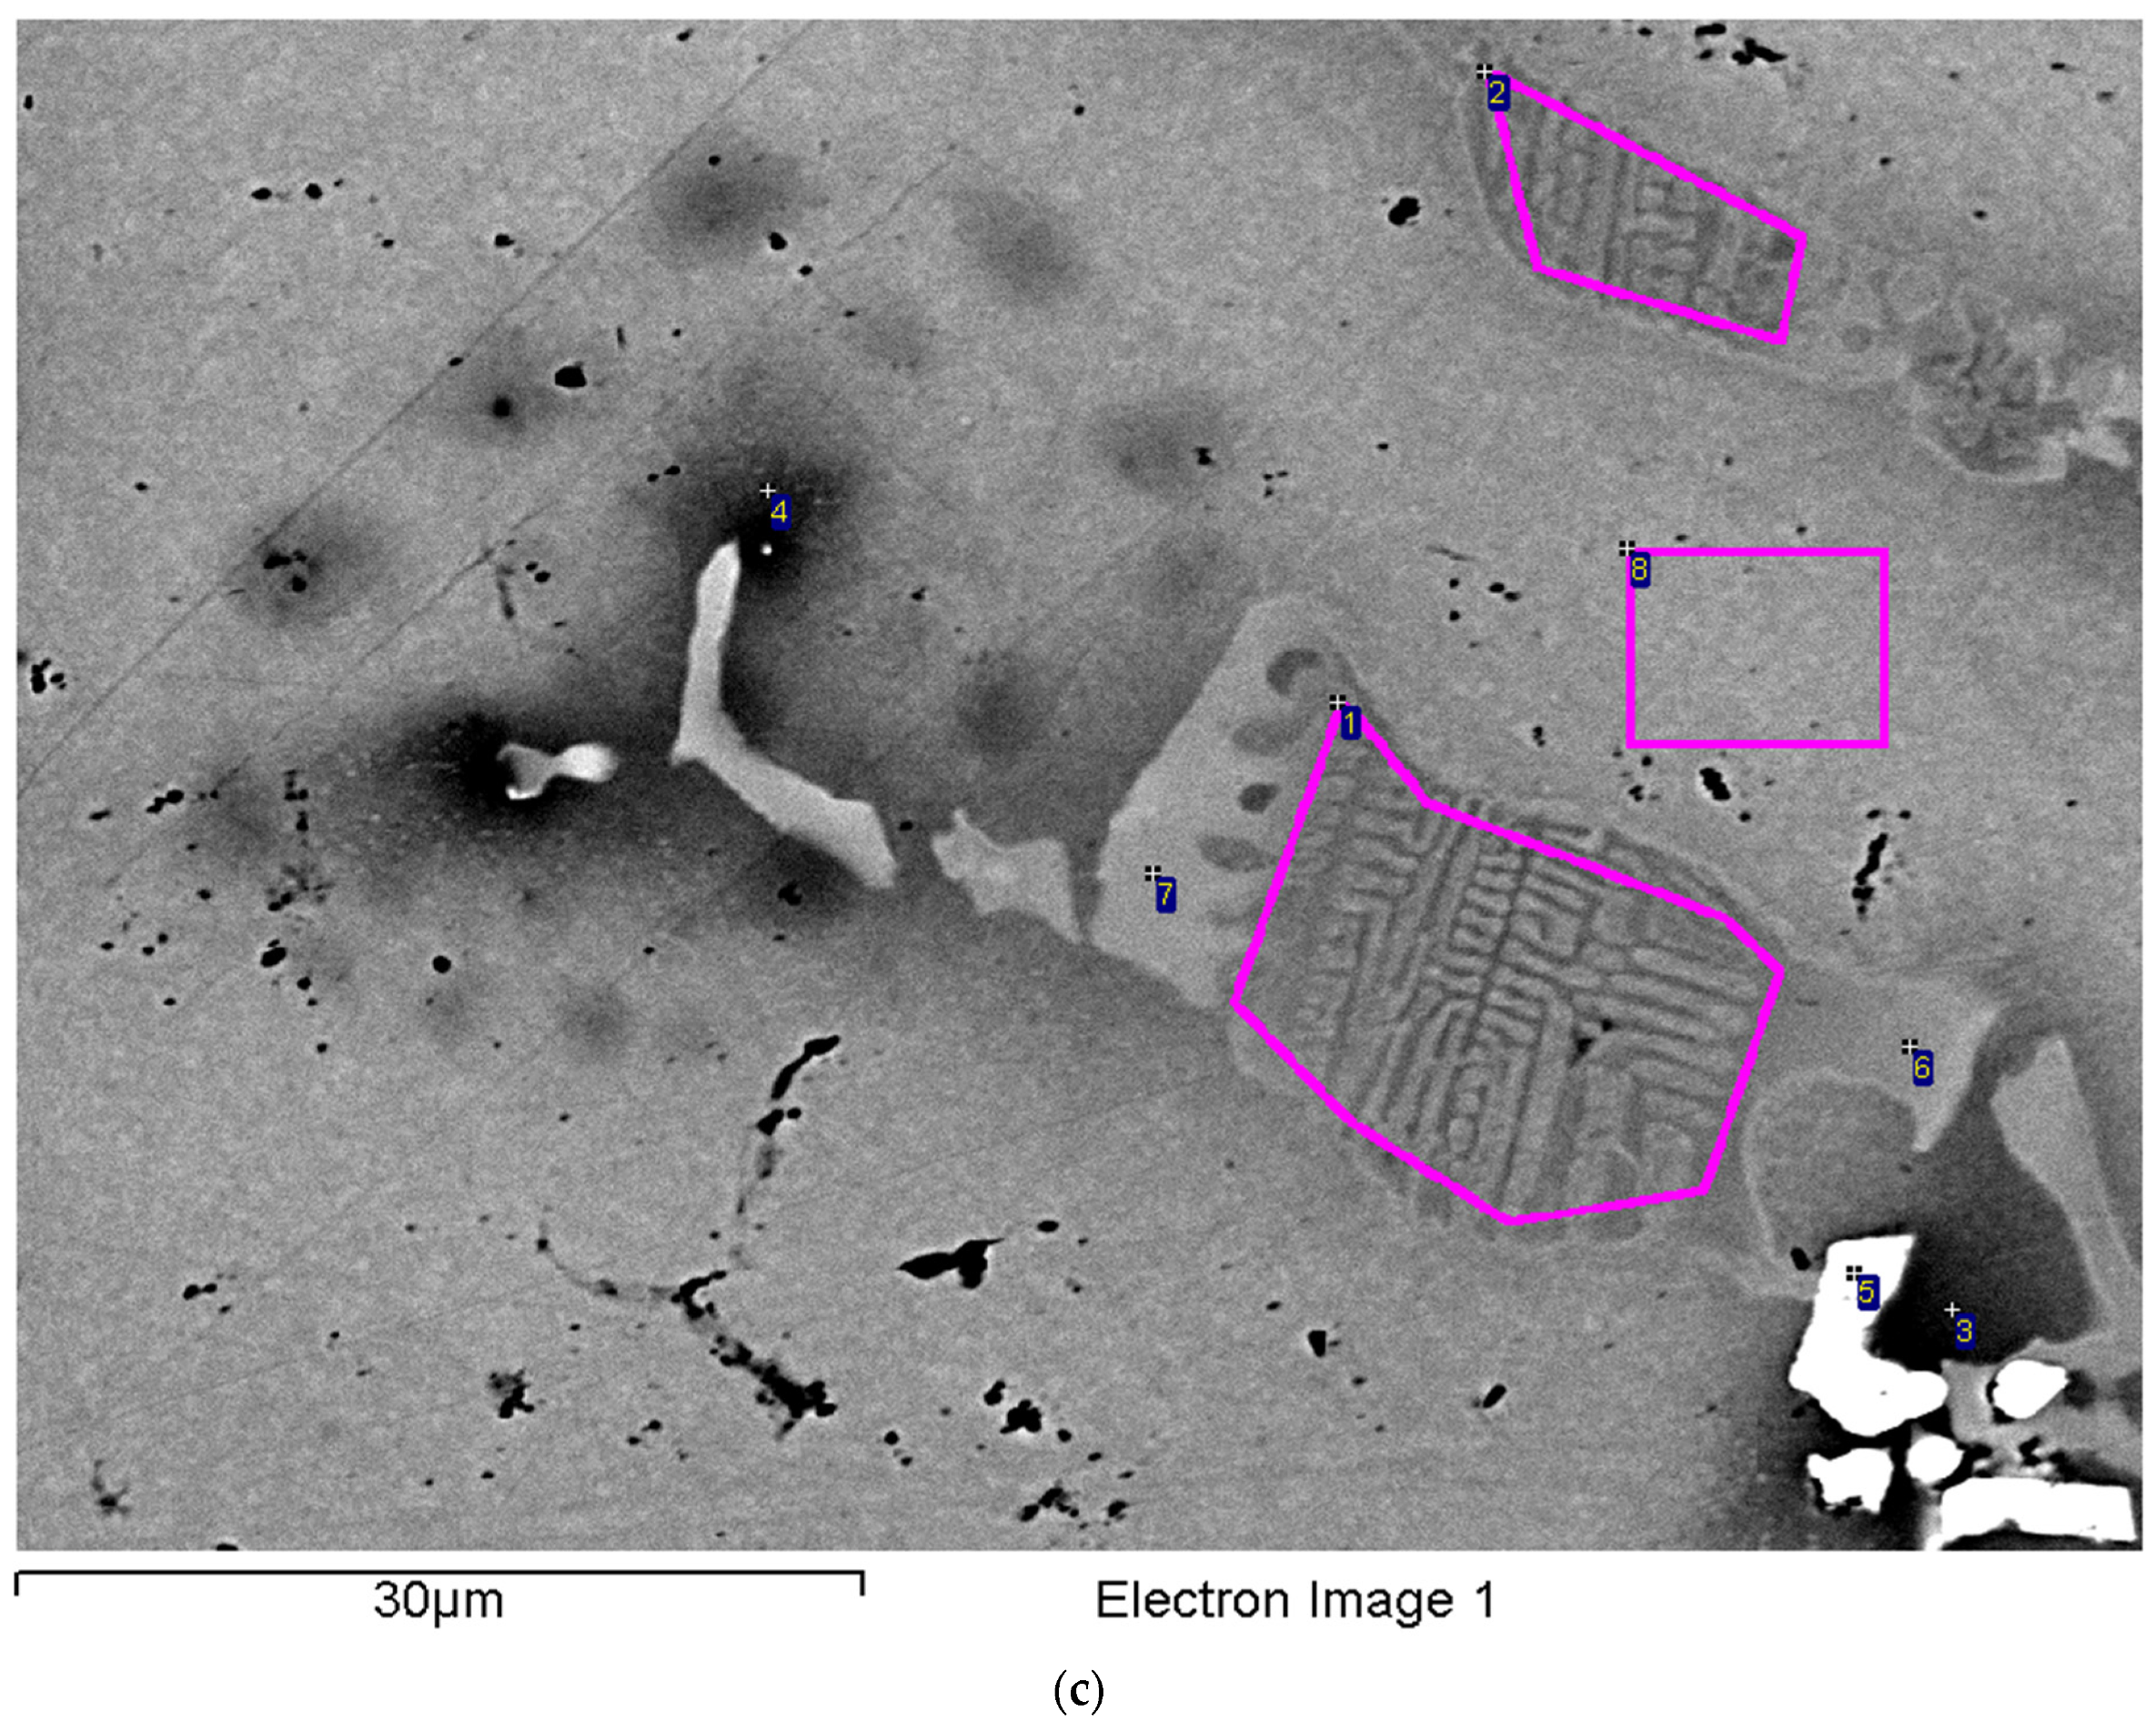
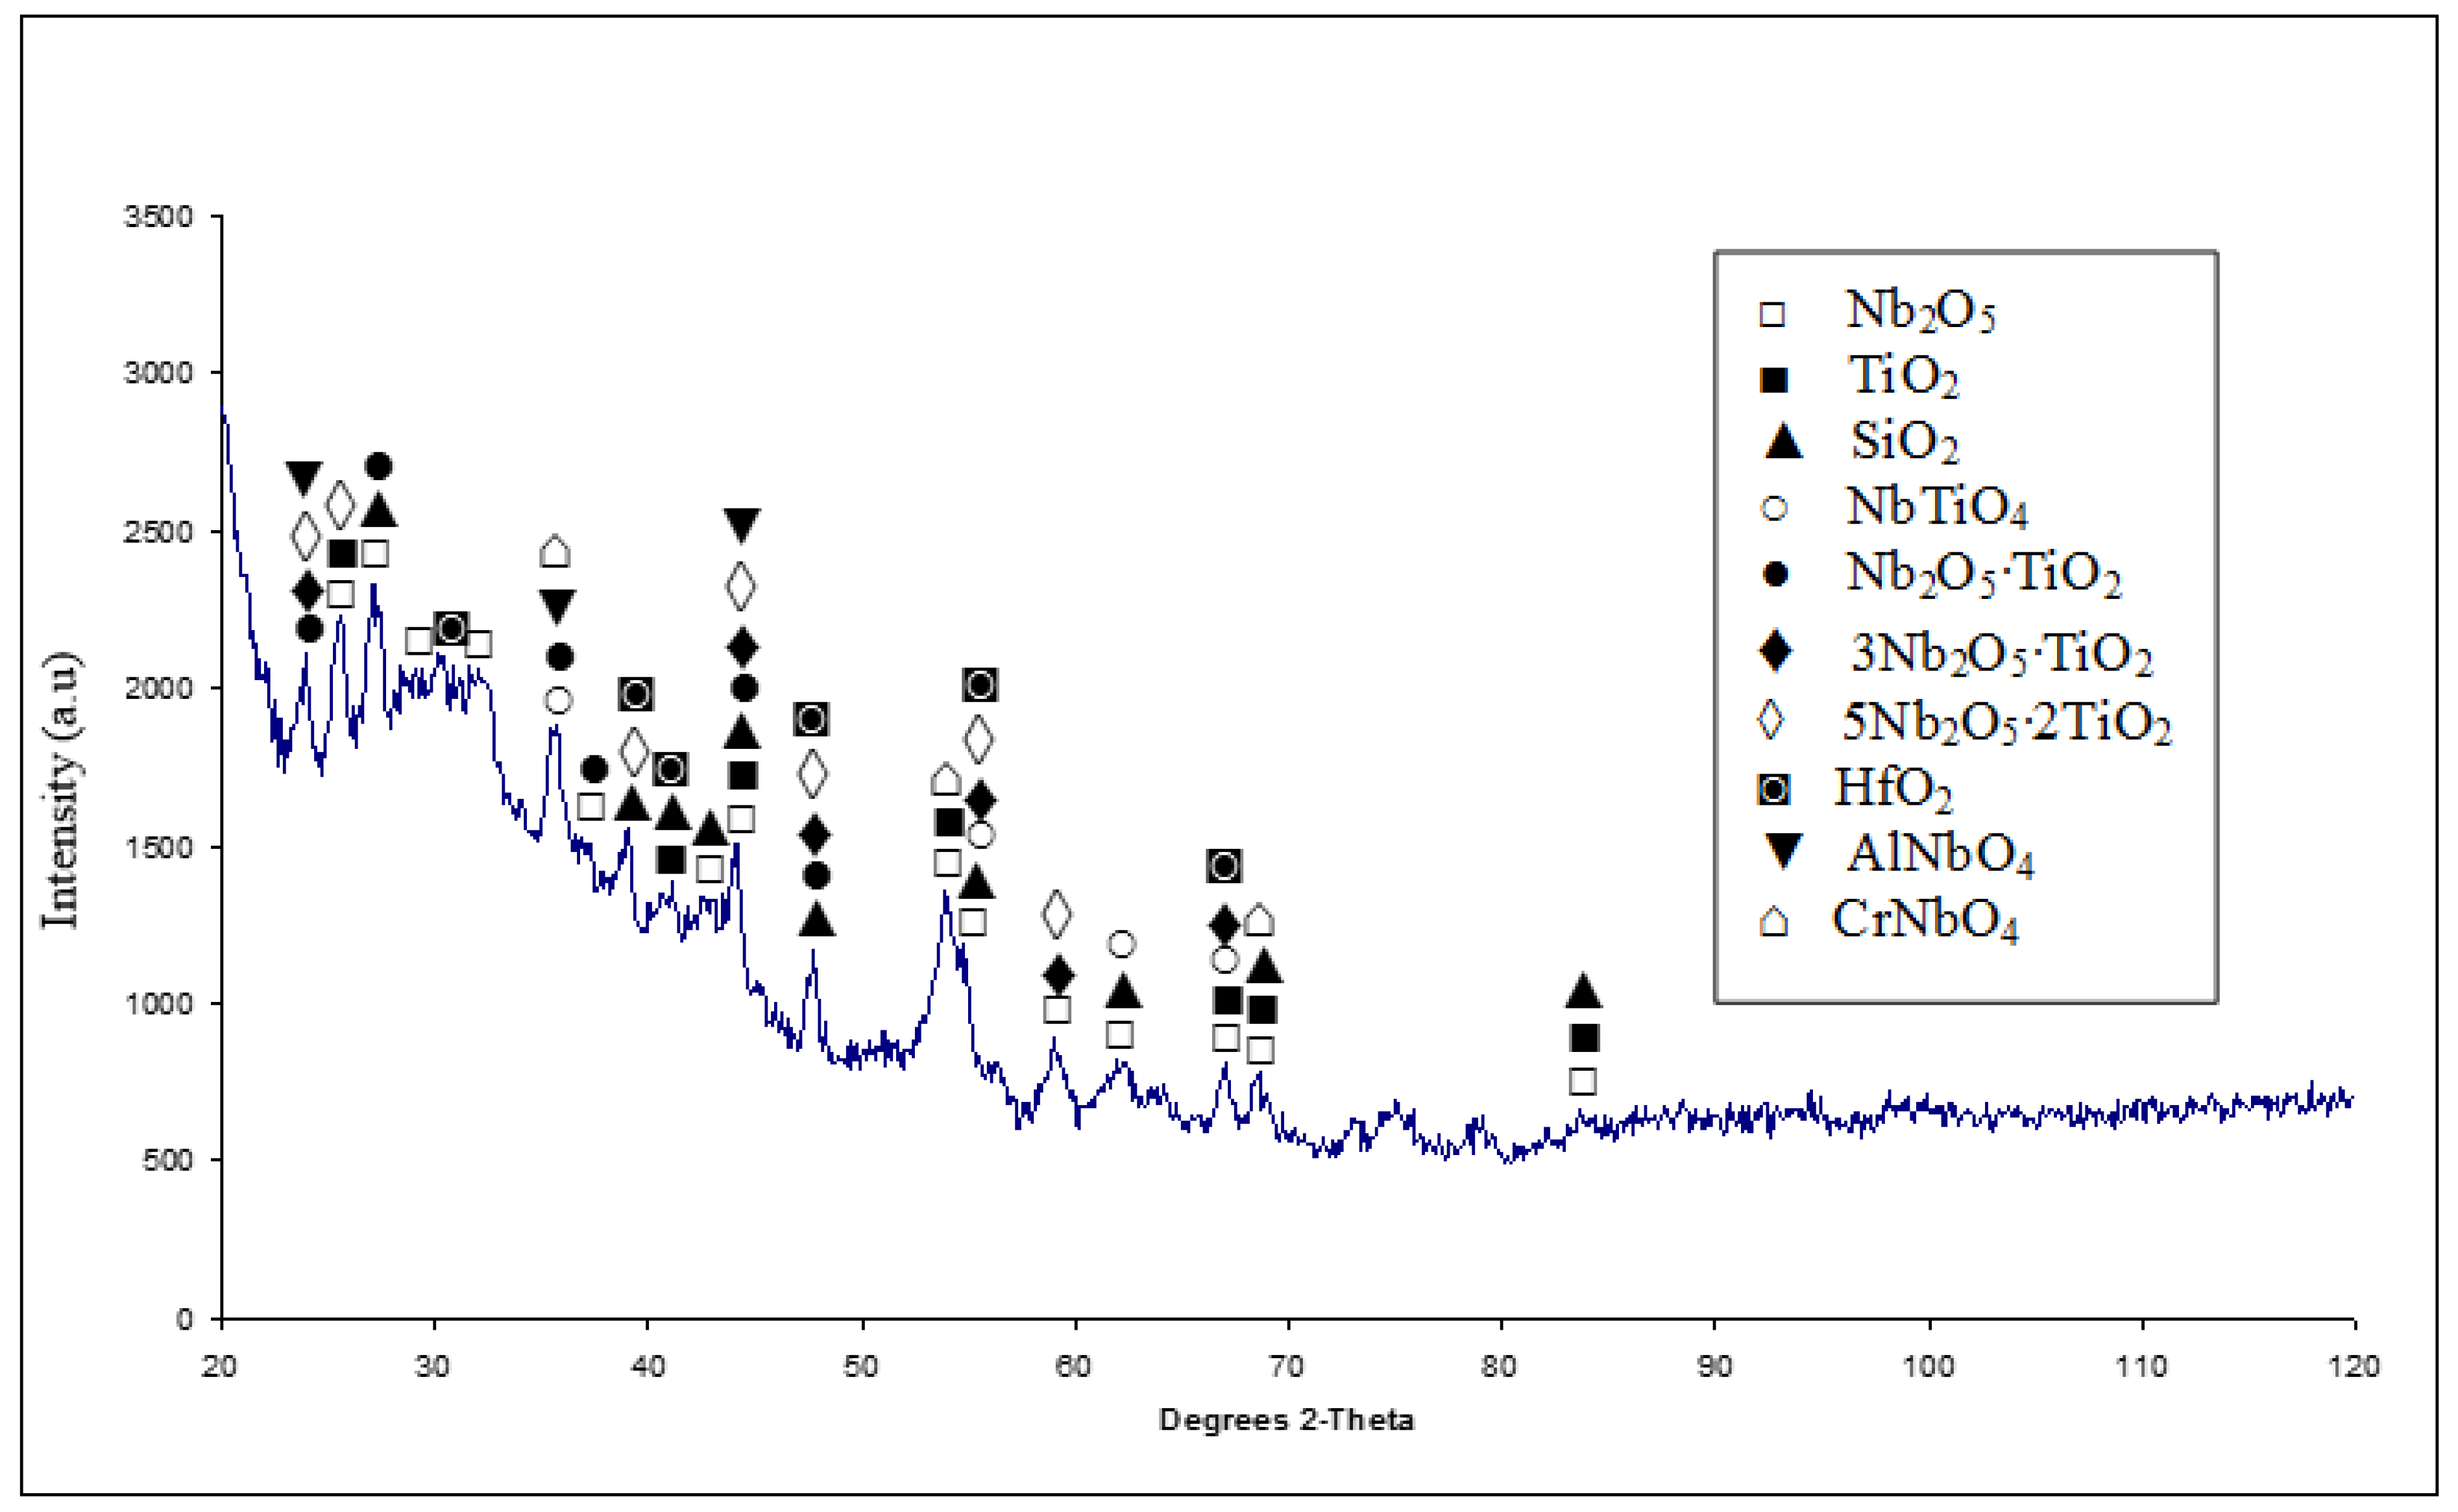
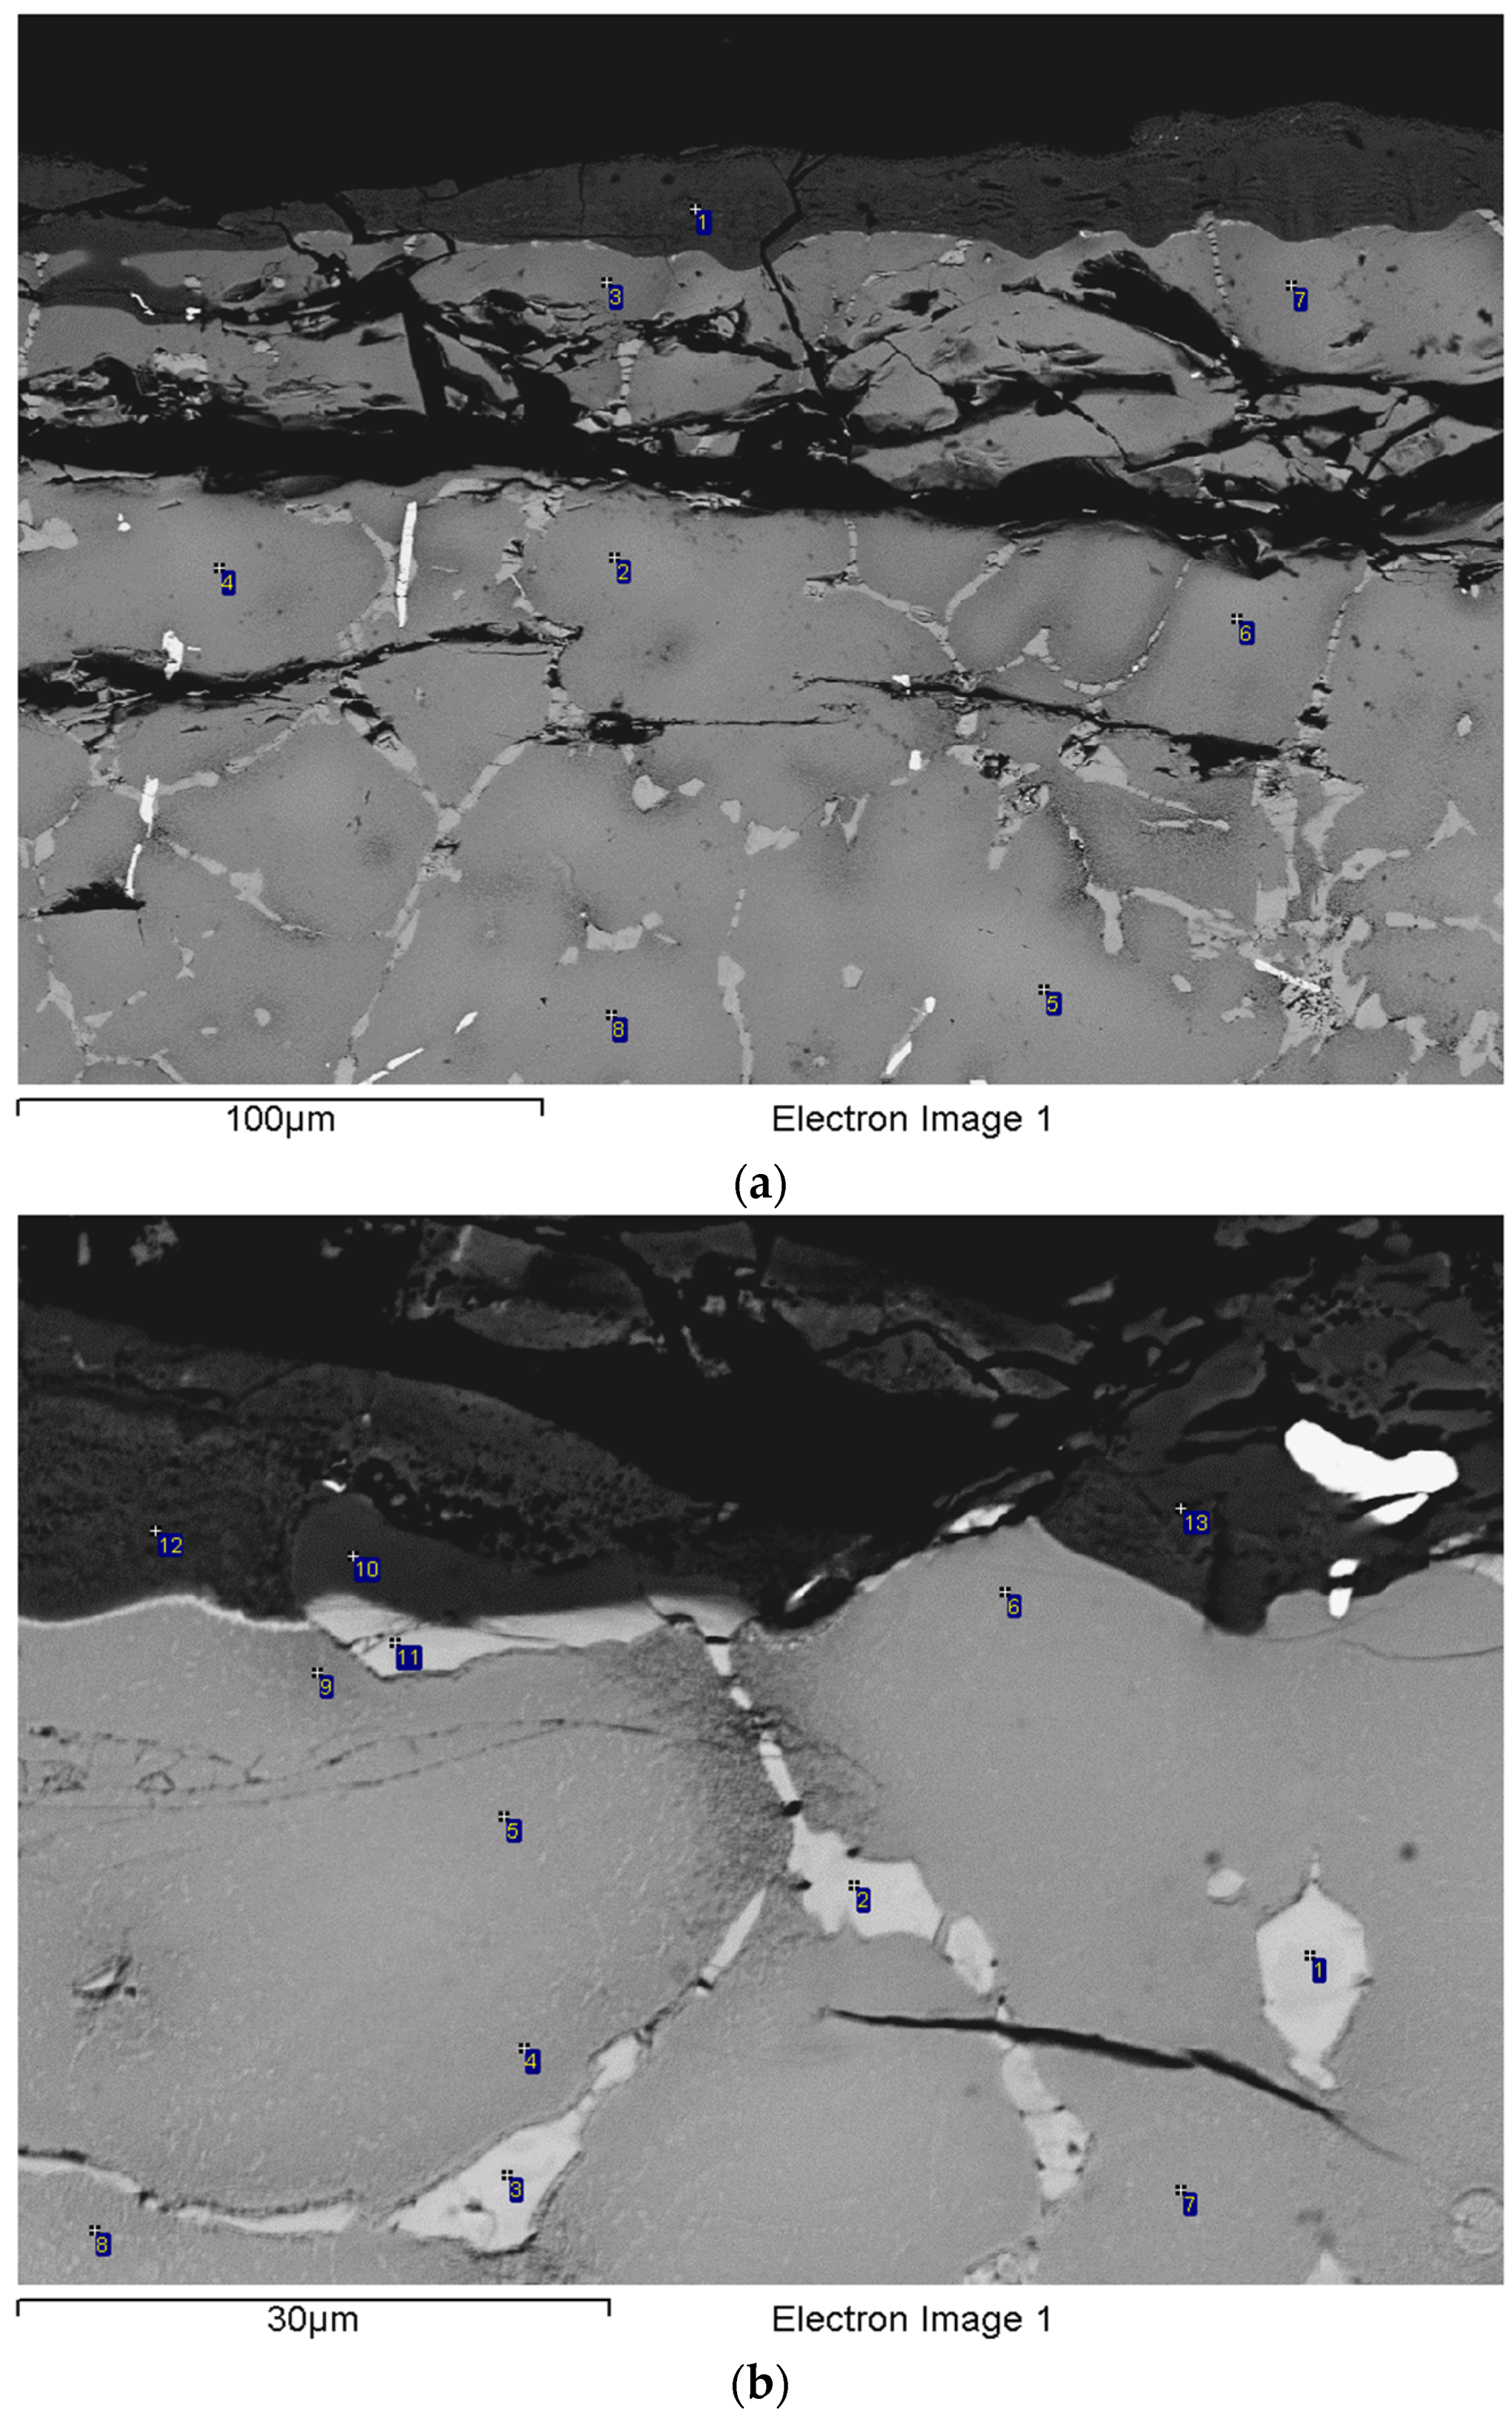
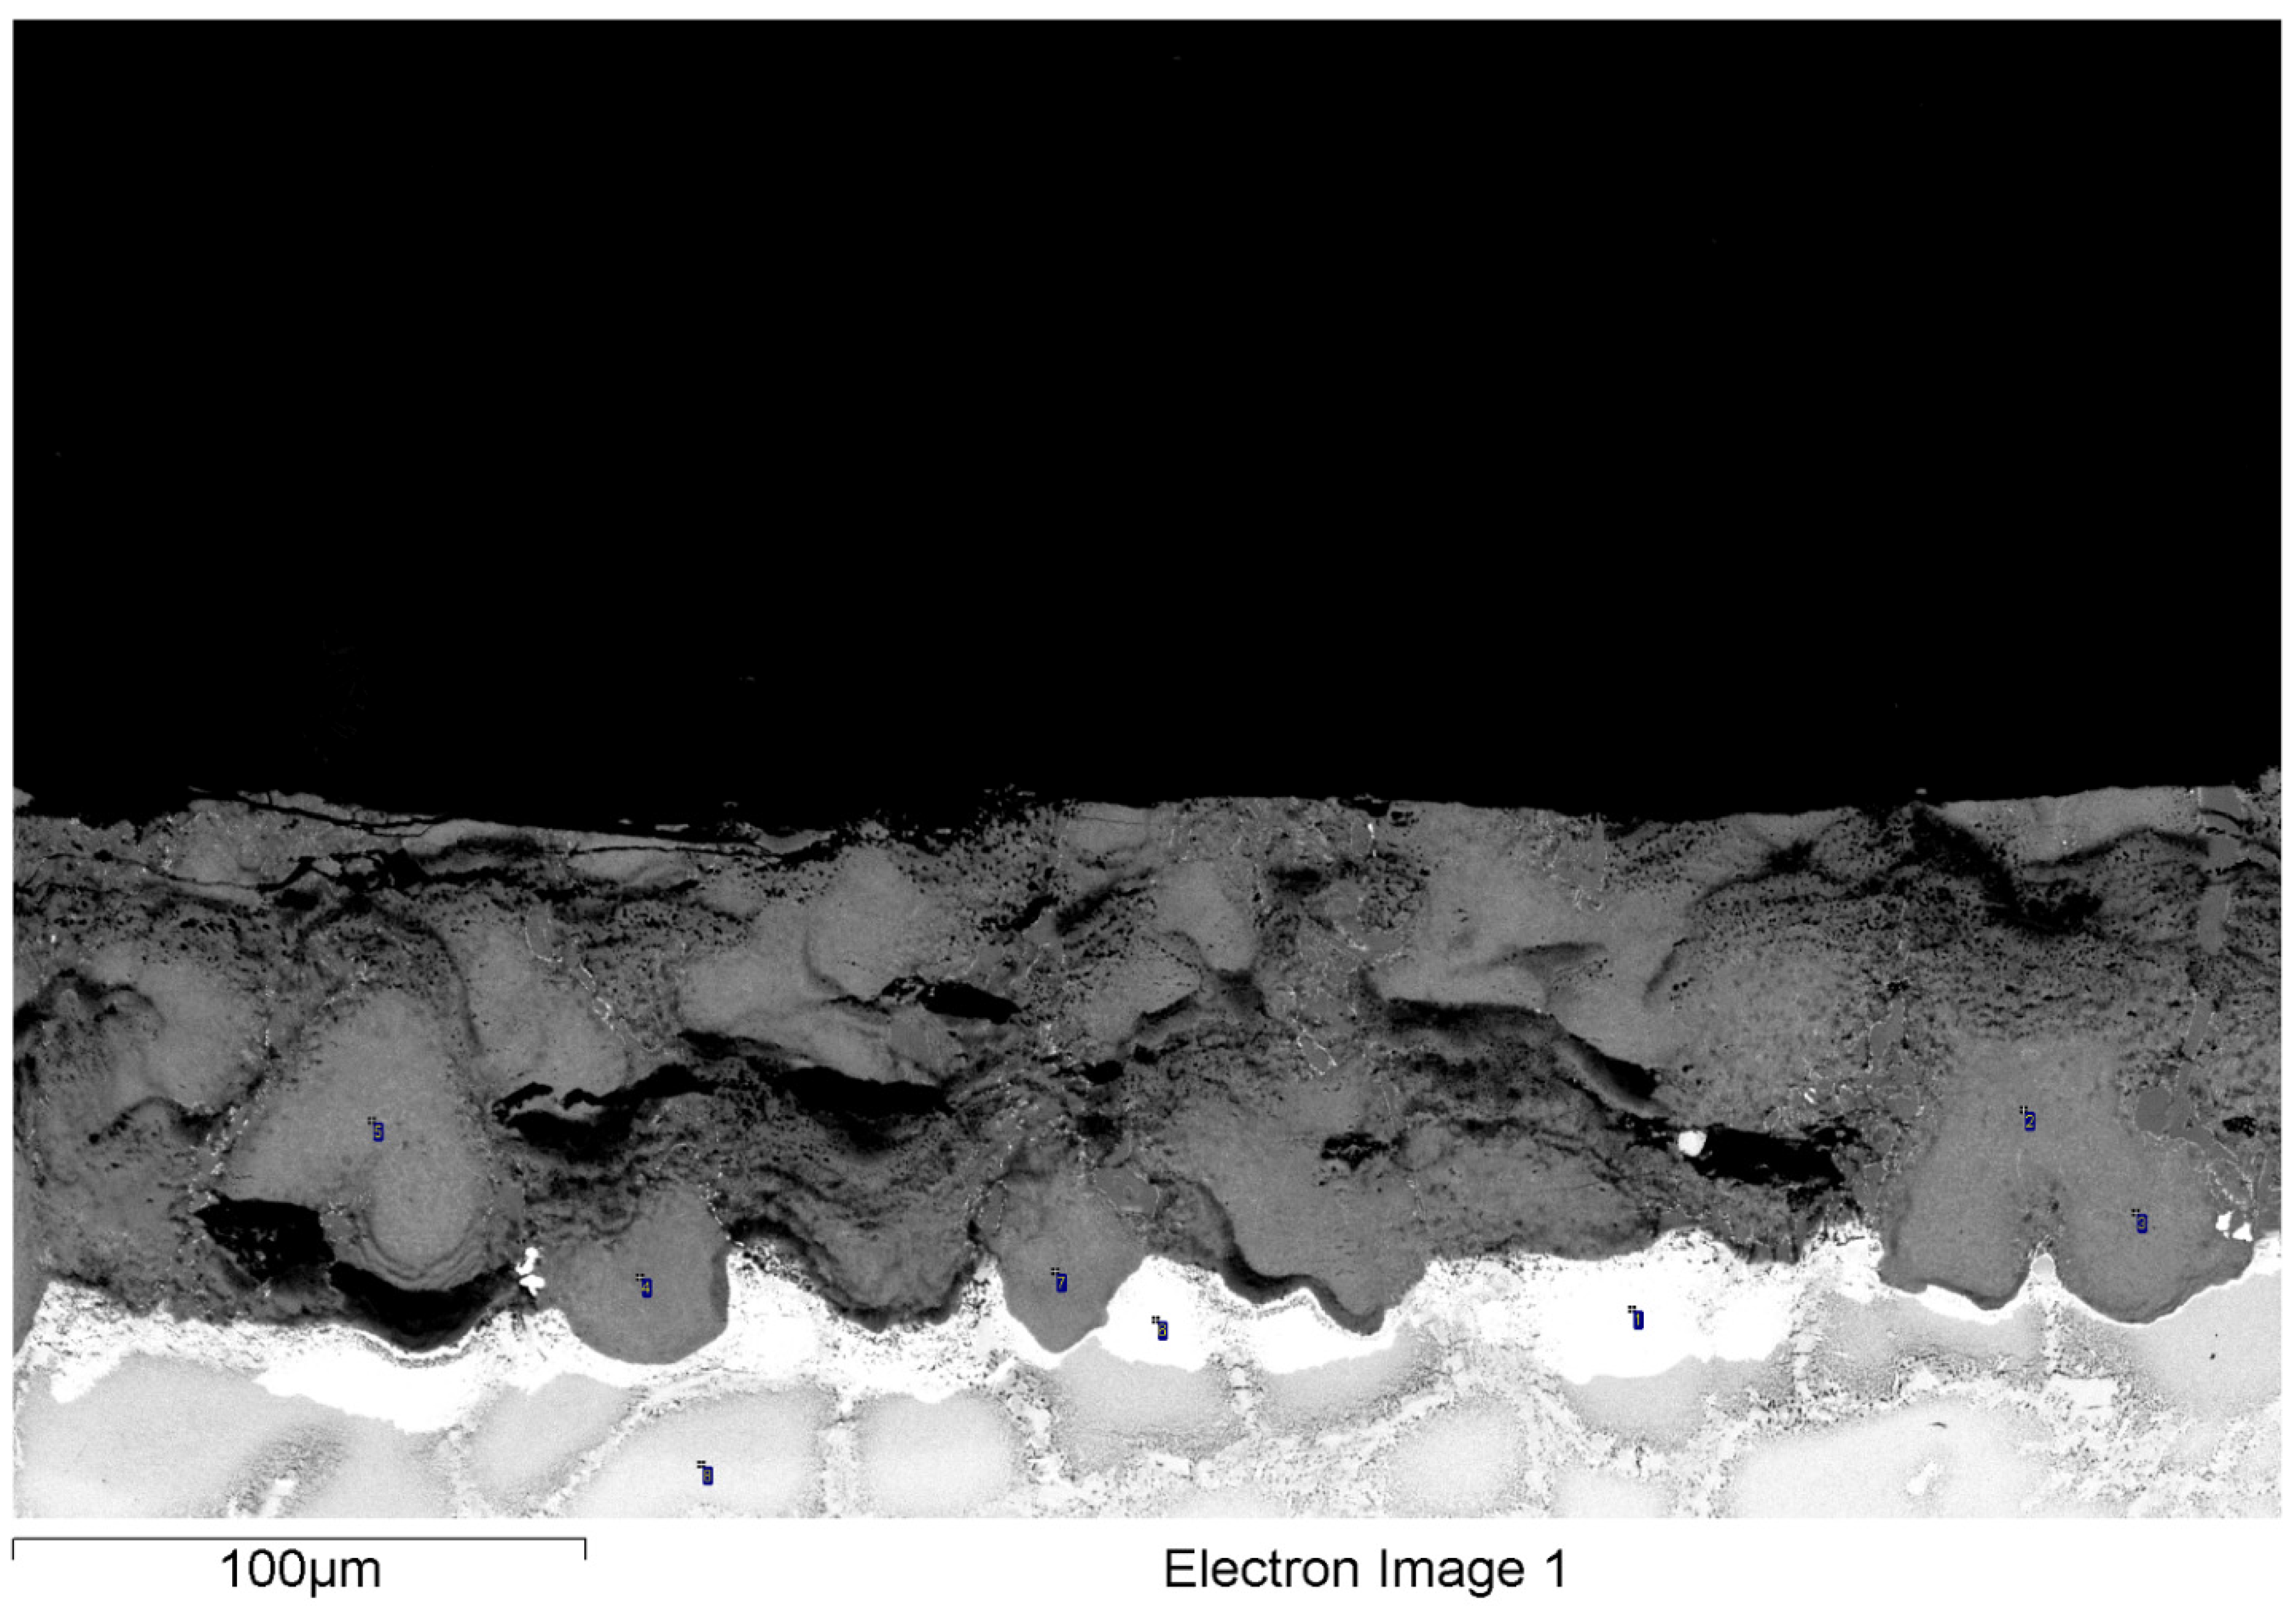
The oxidised specimens of the alloy NV1 at 800 and 900 °C were studied using XRD and EPMA. The actual composition of the bulk of NV1 at 800 °C was 34.8Nb-14.9Ti-3.9Si-3.6Al-2.4Cr-3.7Hf-1.4Sn-1.4V-33.9O. The alloy was heavily contaminated with oxygen. The scale that separated from the specimen during isothermal oxidation at 900 °C for 100 h (Figure 4) was crushed and then studied using XRD. The latter showed peaks that corresponded to the Nb2O5, TiNbO4, Nb2O5·TiO2, 3Nb2O5·TiO2, 5Nb2O5·2TiO2, CrNbO4, AlNbO4, SiO2, TiO2, and HfO2 oxides (Figure 6). The same oxides were observed at 800 °C. The cross section of the oxidised specimen at 800 °C was studied by EPMA. The EPMA analysis data is given in Table 5. The microstructures of the oxide scale and bulk are shown in Figure 7. Table 6 summarises the phases and characteristic features of the oxidised alloy.
The scale was non-uniform, and its thickness was ≤20 μm. Cracks perpendicular to the substrate were formed in the scale, which consisted of Nb- and Ti-rich oxide (Nb/Ti ≈ 2.8), Si-rich oxide (Nb/Ti ≈ 1.2 and Si/Ti ≈ 1.5), and HfO2 as well as oxidised Nbss and Nb5Si3 (Table 5 and Table 6, Figure 7b). The substrate just below the scale was also cracked with cracks running parallel and perpendicular to the surface of the specimen. In some parts of the cross section, about 50 μm below the oxide scale, there was separation of the subscale alloy from the bulk (Figure 7a). Parts of the Ti-rich Nbss in the subscale alloy were heavily oxidised (oxygen content in the range 30 to 50 at.%; see “peppered” darker contrast area on the right-hand side of analysis point 2 in Figure 7b), and the oxidised Nbss exhibited cracks running parallel to the interface (Figure 7b).
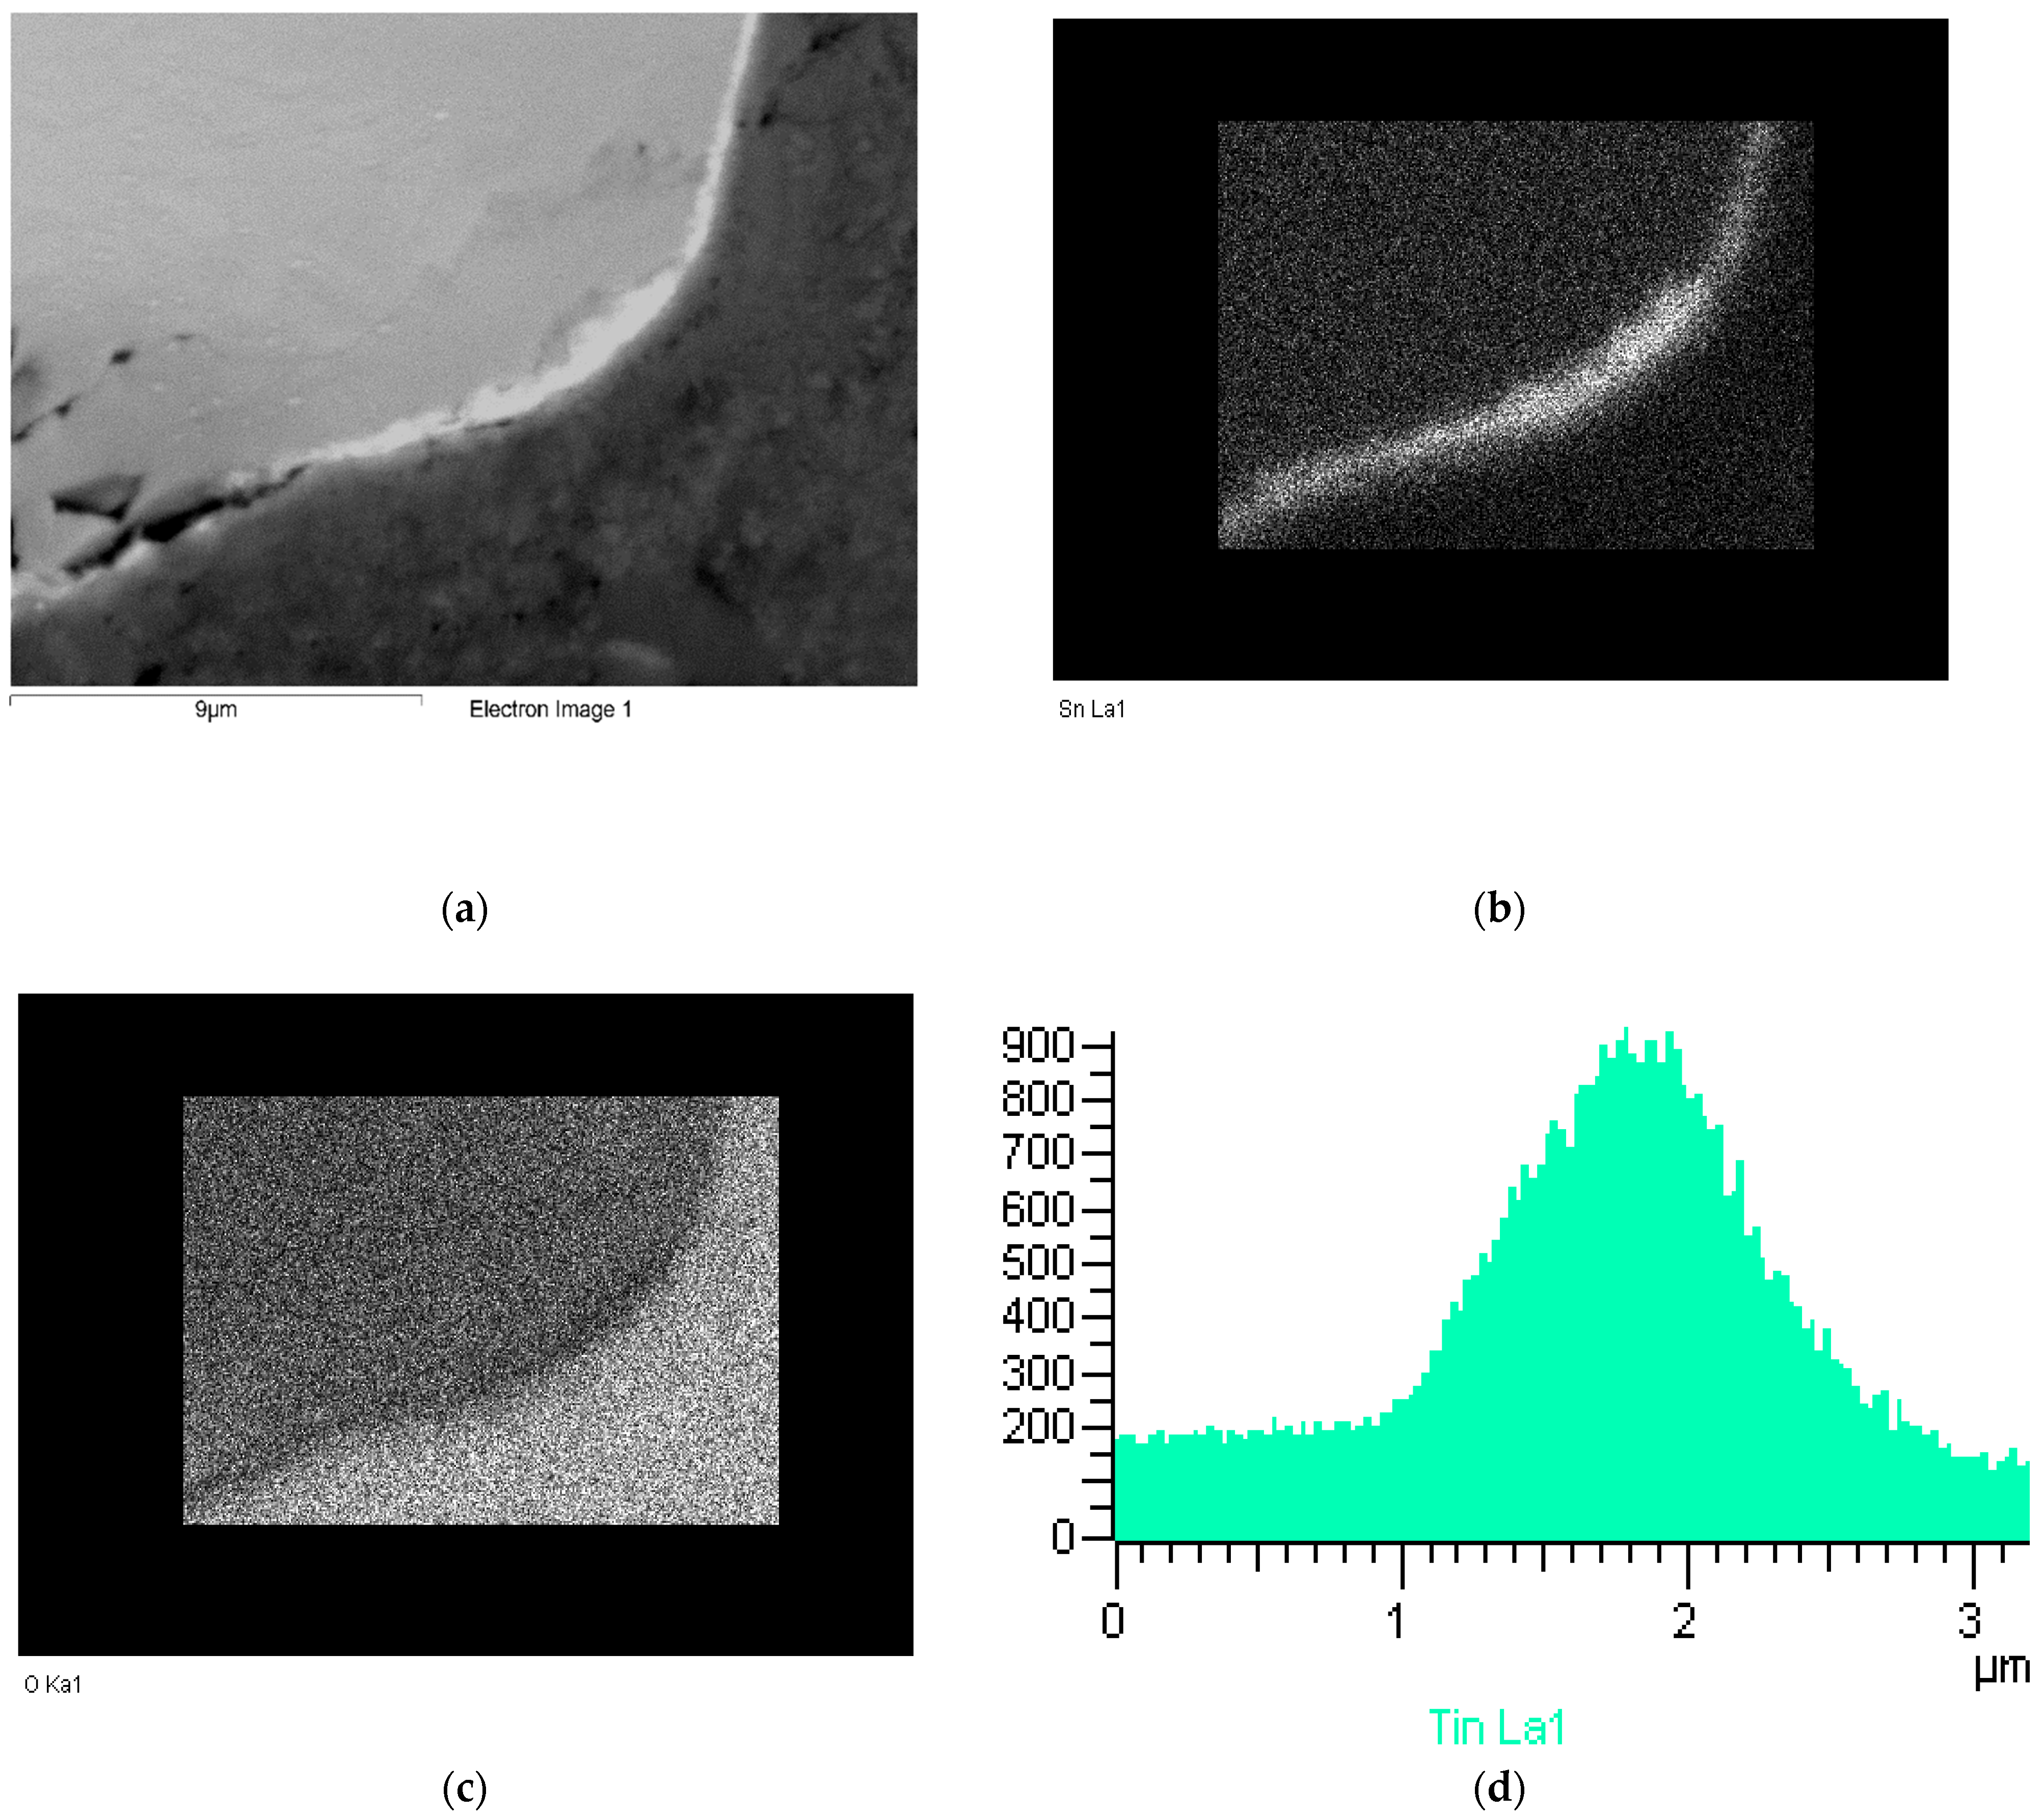
At 800 °C, and only in very few areas along the scale/substrate interface, a very thin layer was observed that exhibited a very bright contrast under BSE imaging. The thickness of these layers was too small for quantitative analysis. Line scans across such layers confirmed that they were Sn rich (Figure 8). Analysis of such layers became possible after oxidation at 900 °C, where they became more continuous, and their thickness increased. The analyses showed that the bright contrast layer that formed at 900 °C consisted of Nb3Sn and Nb6Sn5 (see Figure 9). The average composition of Nb3Sn was 30.8Nb-14.8Ti-4.4Si-3.9Al-3.7Hf-20.2Sn-0.7V-21.5O, whereas that of Nb6Sn5 was 51.1Nb-1Ti-2.2Si-1.8Al-3.7Hf-39.9Sn-0.3V, i.e., both compounds were Cr free, and the Nb6Sn5 was not contaminated with oxygen.
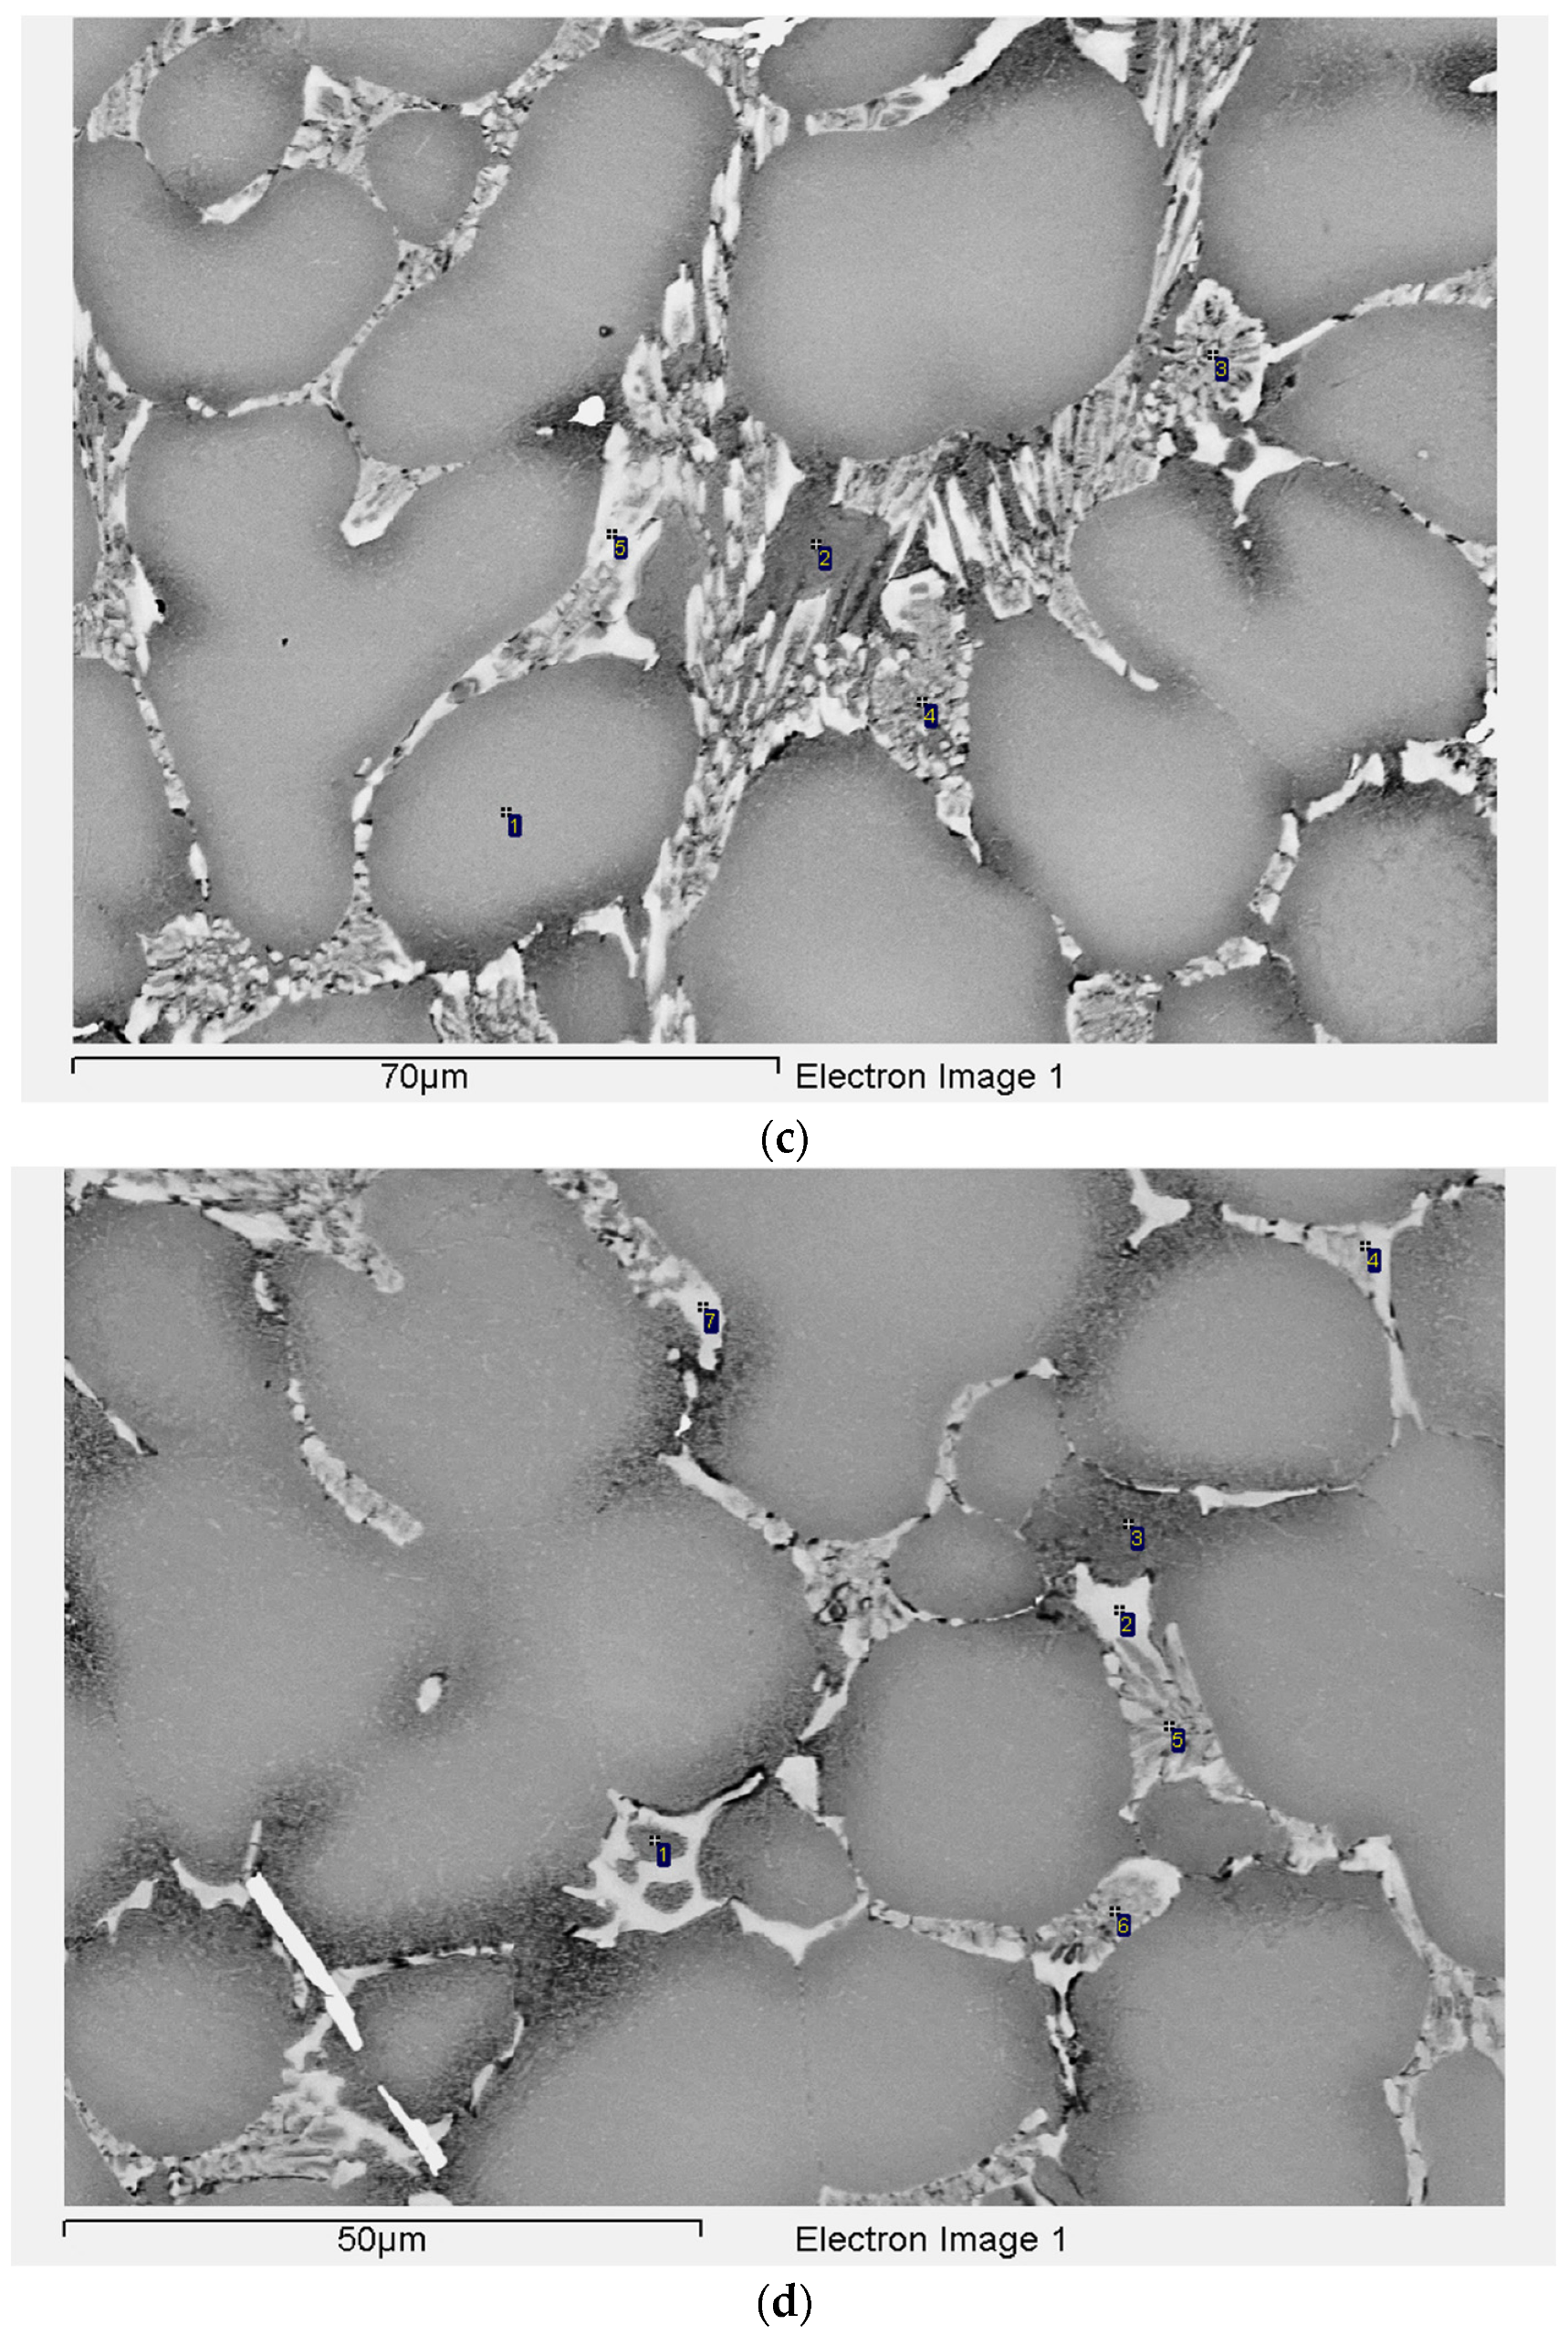
The bulk microstructure of the oxidised alloy NV1 consisted of the same phases that were observed in NV1-AC (Figure 7c,d). However, the Nbss and the Nb5Si3 and the lamellar Nbss + Nb5Si3 microstructure were contaminated with oxygen. In some parts of the microstructure, the lamellar microstructure had “disintegrated” (deteriorated and fragmented) owing to the heavy oxidation of its Nbss (analysis point 4 in Figure 7c). In other words, the contamination of NV1 with oxygen during oxidation had progressed all the way to the bulk. However, in the bulk there were also Nb5Si3 grains that were not contaminated with oxygen. In the contaminated Nb5Si3, the oxygen concentration varied from about 16 at.% near the oxide scale to about 7 at.% in the bulk of the specimen. On the other hand, the contamination of the Nbss was most severe. The oxygen content of the Nbss exceeded 40 at.% in areas up to about 100 μm below the oxide scale, and in the bulk it was about 30 at.%. The Ti-rich Nbss and Ti-, Cr-, and V-rich Nbss, which were still observed in the microstructure, exhibited “peppered” darker contrast, and the latter was stronger when the oxygen concentrations approached about 50 at.% (analyses points 2 and 3 in Figure 7c and d, respectively). However, the contamination with oxygen of the bulk of NV1 did not result in a further increase in the volume fraction of HfO2.
4.4. Hardness and Nano Indentation
The Vickers hardness of the alloy is given in Table 1. The hardness of NV1-HT and of Nbss in NV1-HT (see below) corresponds to the bulk microstructure (the area contaminated by nitrogen was removed prior to hardness measurements). The hardness decreased slightly after the heat treatment. The average Vickers microhardness of the Nbss in NV1-AC and NV1-HT, respectively, was 531 HV (516–545) and 540 HV (529–562), where, in the parentheses, the minimum and maximum microhardness values are given.
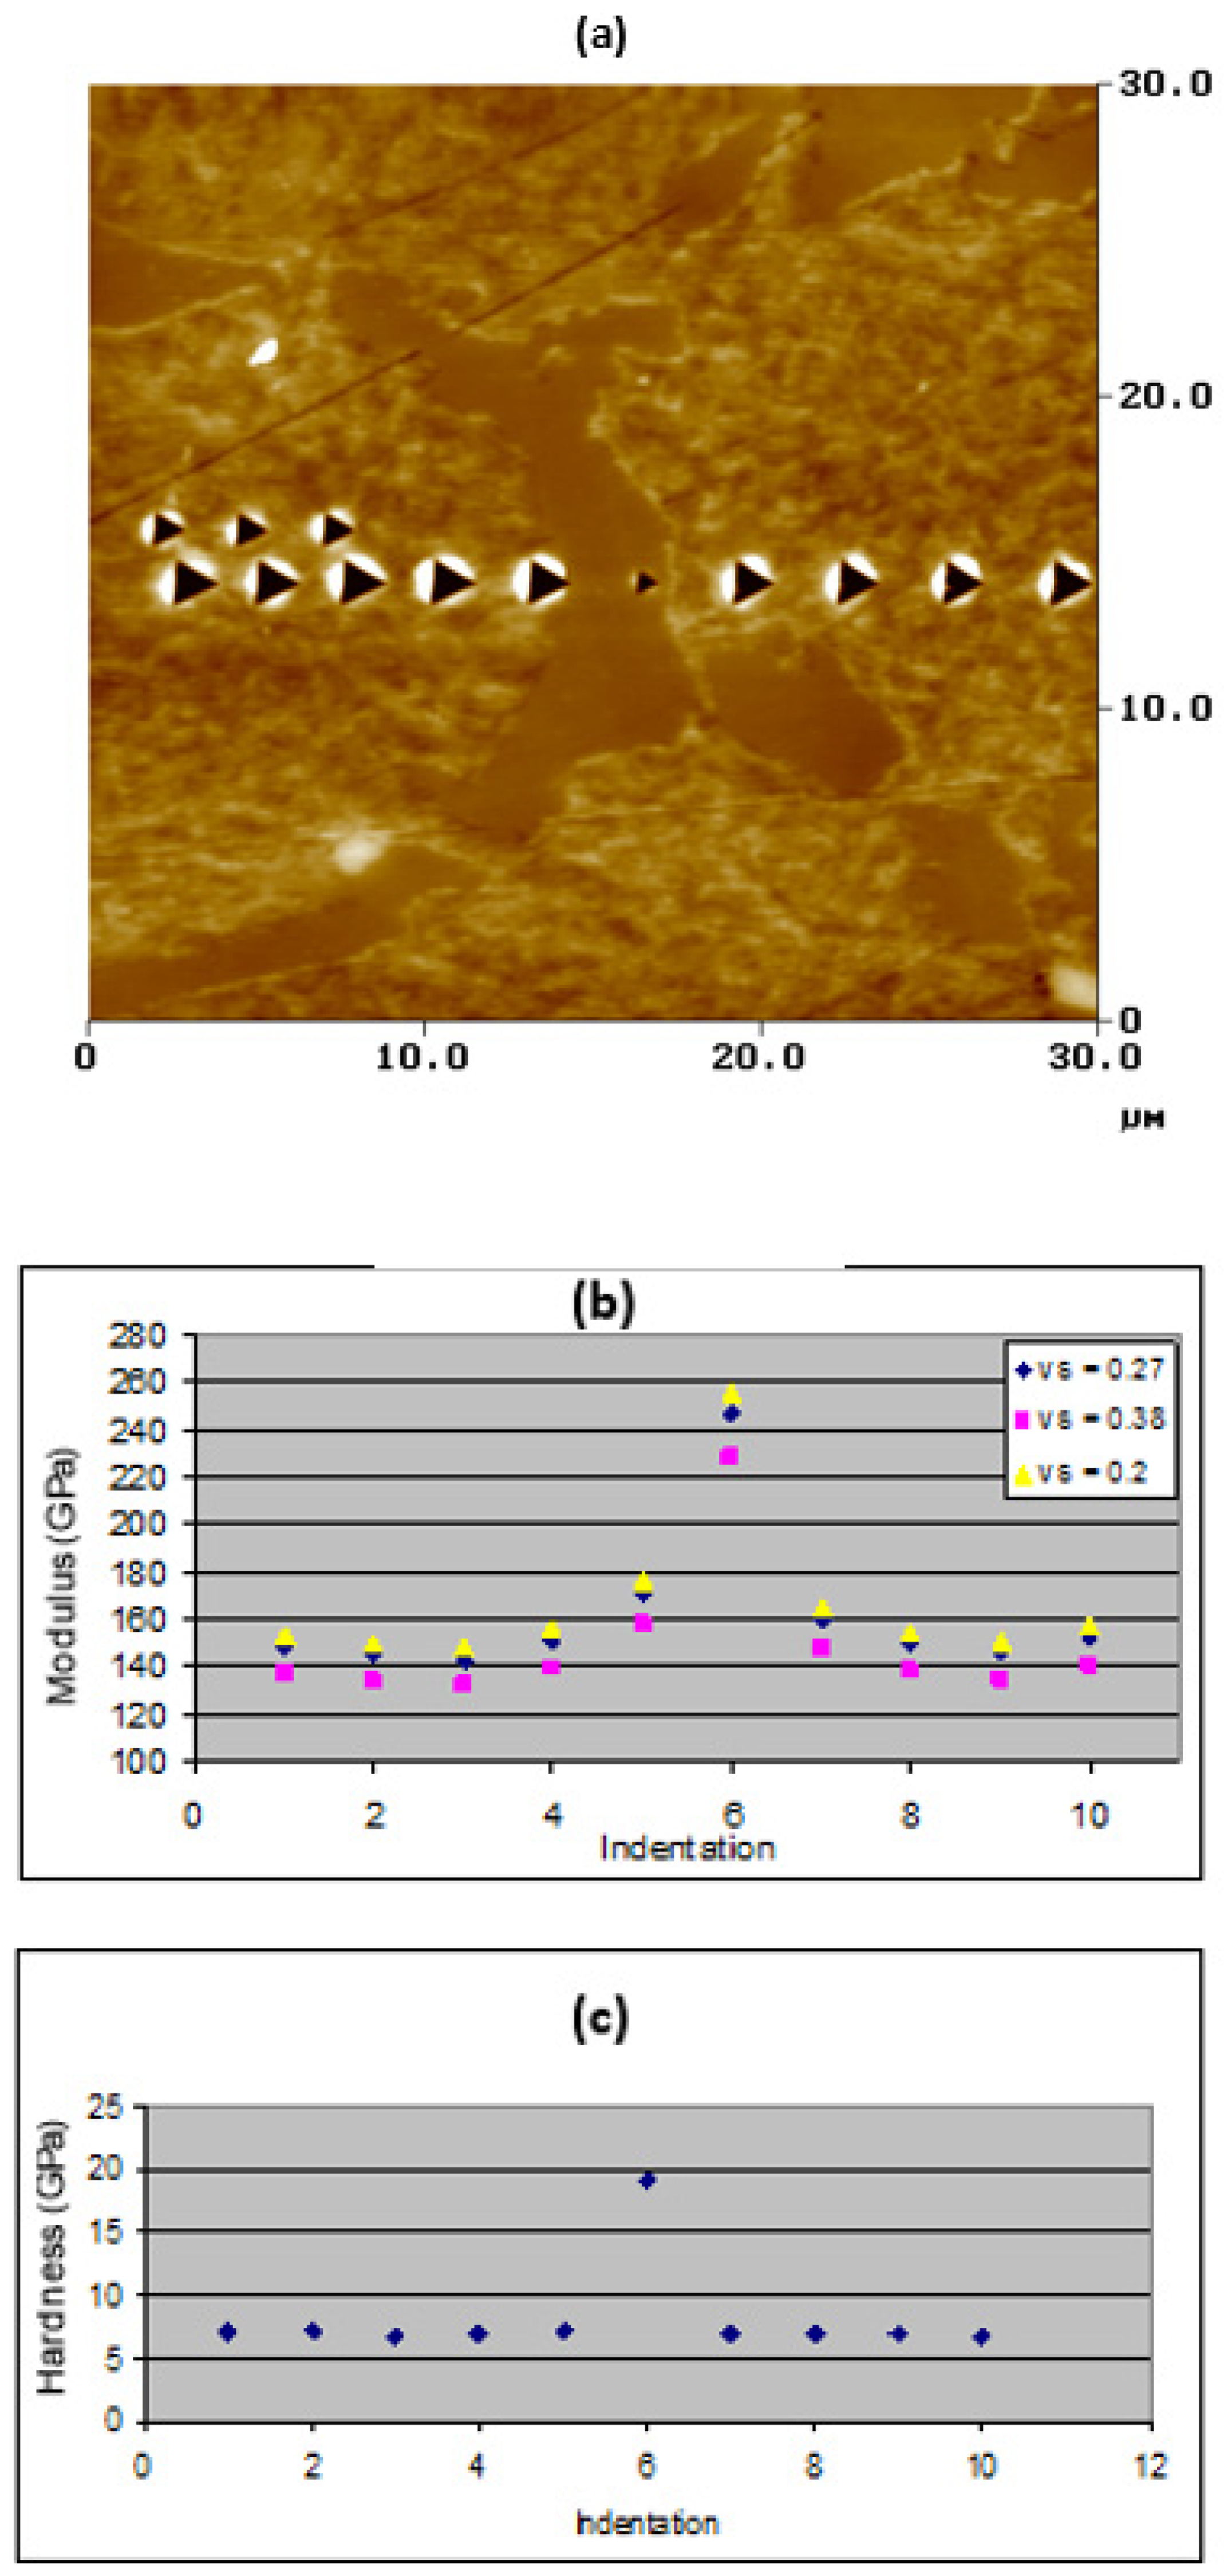
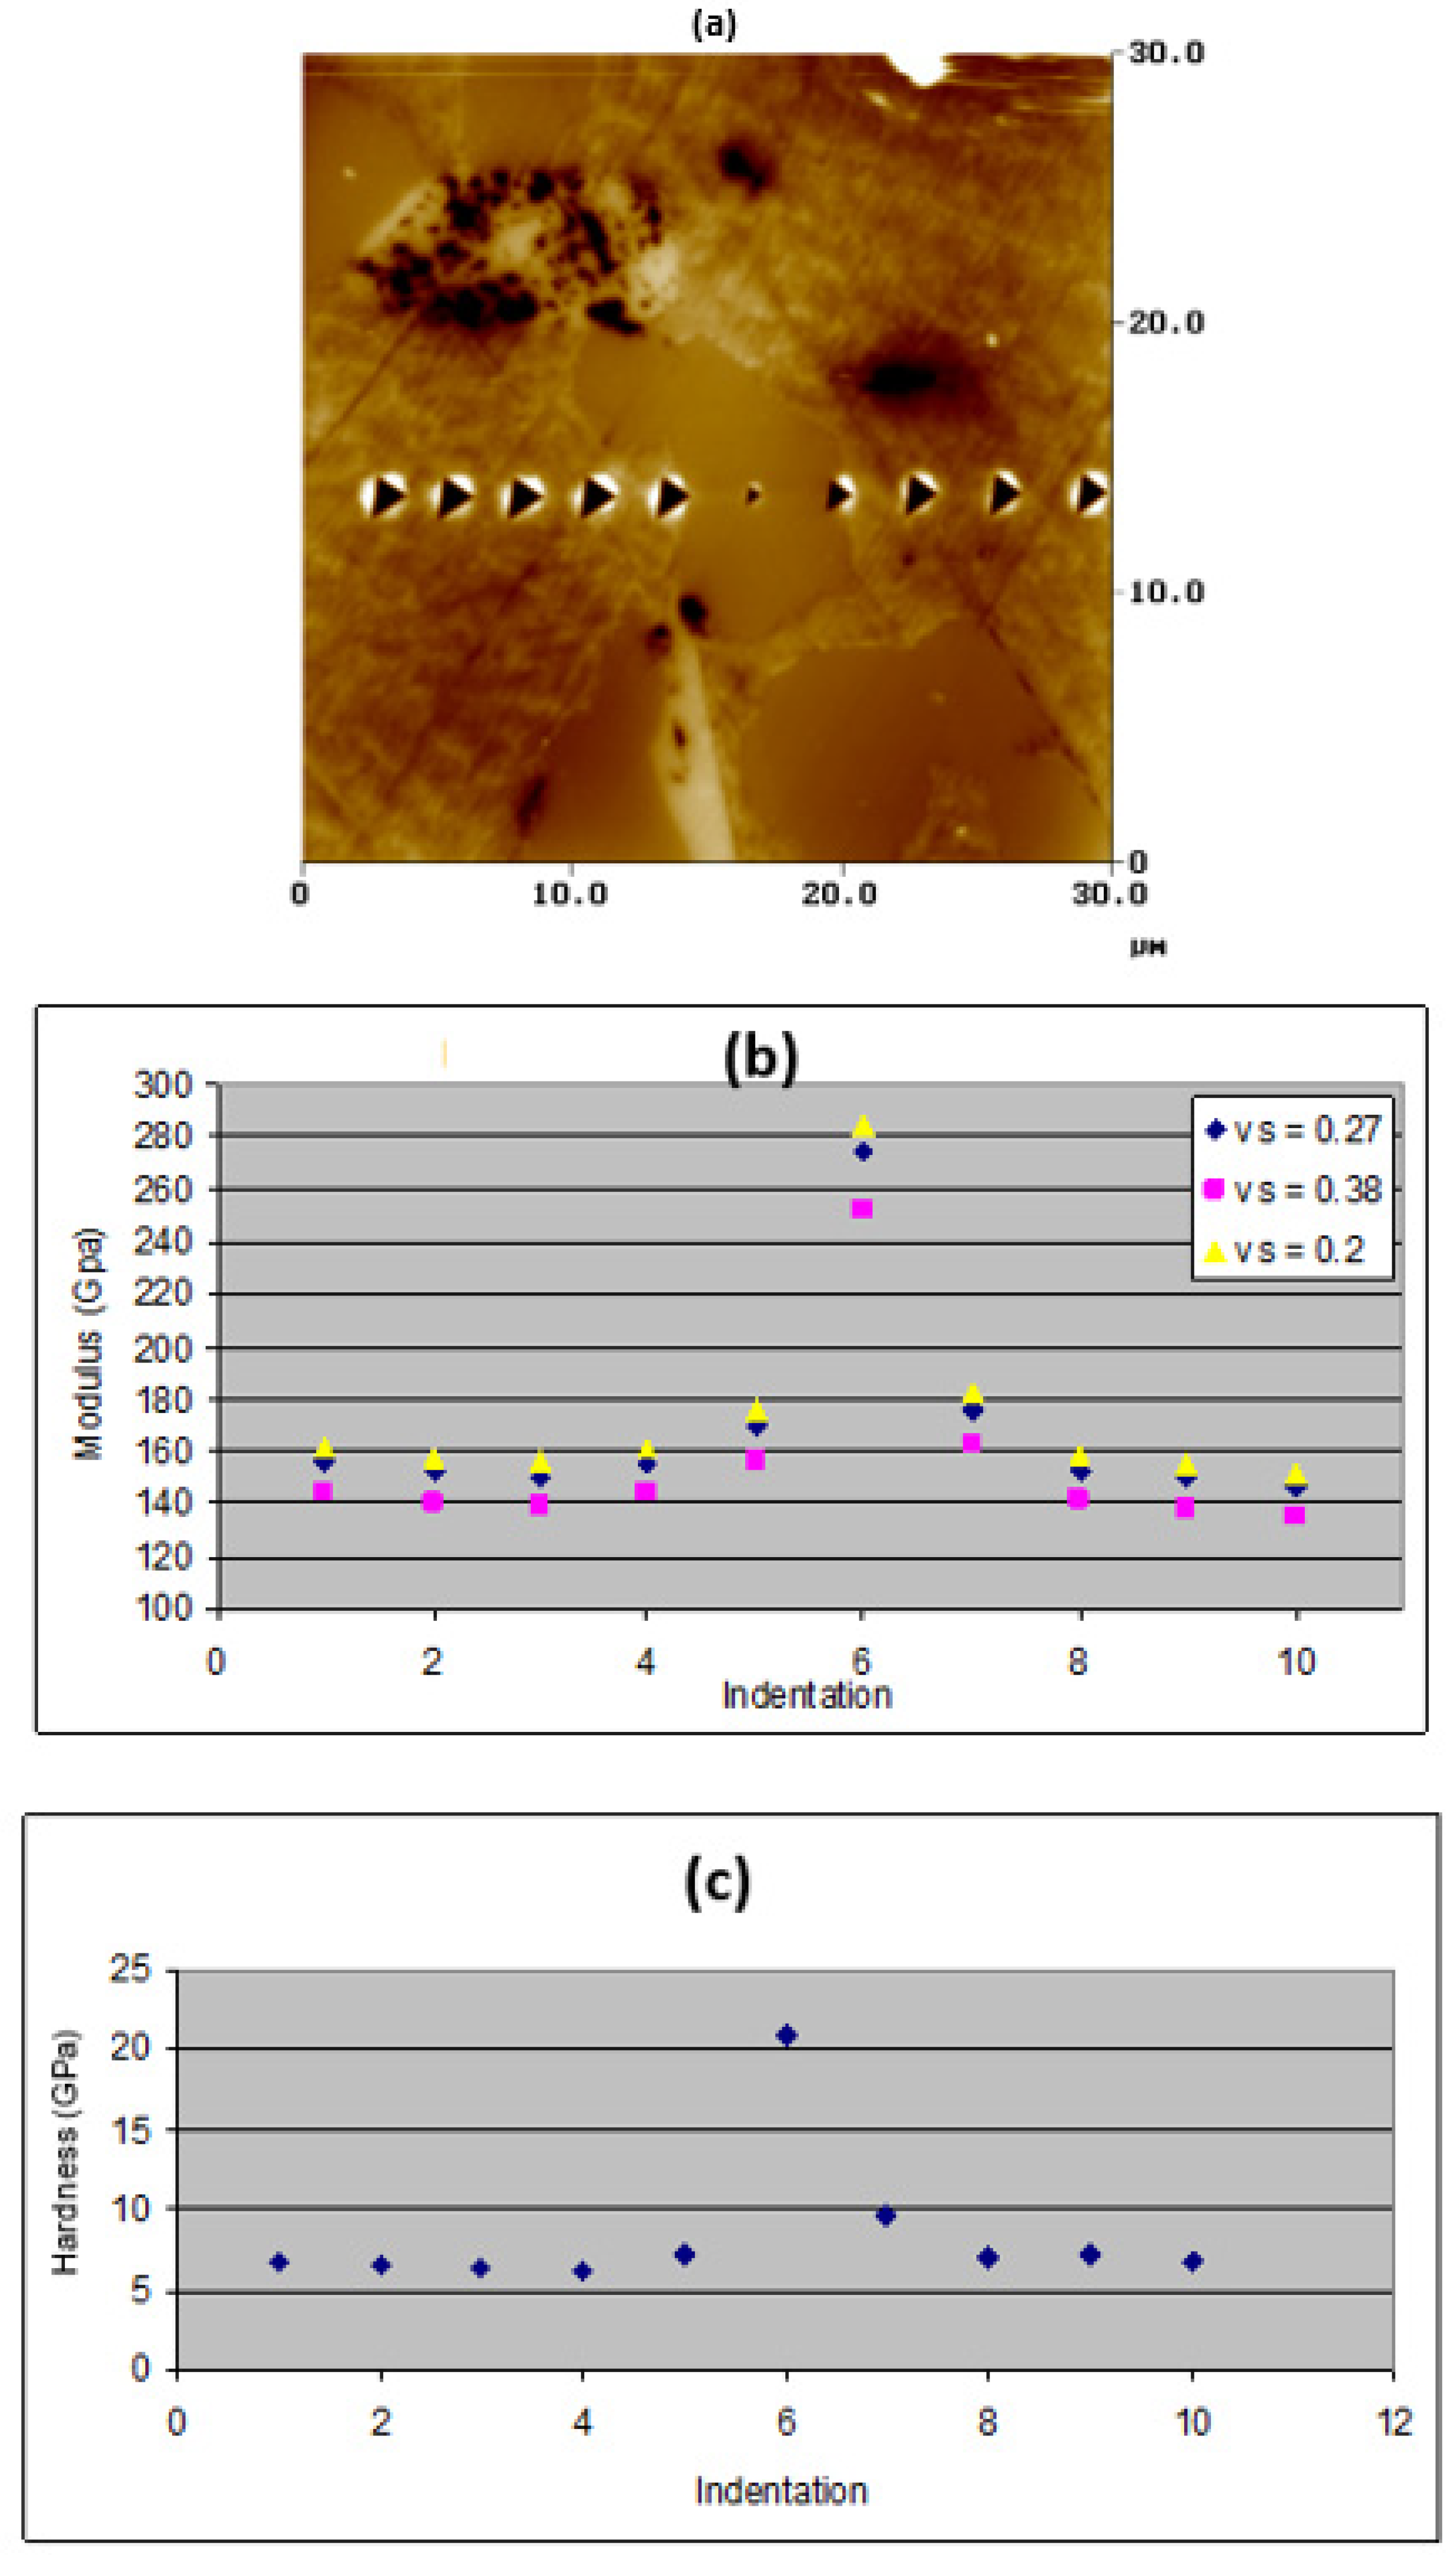
The large vol.% of Nbss in NV1 and its characteristic microstructure in NV1-HT (Figure 2d), and in NV1-AC in which in some areas it consisted of Nb5Si3 grains between Nbss grains without a lamellar microstructure (Figure 2b), offered us the opportunity to use nanoindentation to measure the hardness and elastic moduli of said phases in NV1-AC (Figure 10) and NV1-HT (Figure 11). Part (a) in each figure is a 30 × 30 μm2 AFM image of the indentation area and shows the nanoindentations running from left to right. In parts (b) and (c) in each figure, every point represents a particular nanoindentation. The first indentation on the left-hand side of (b) and (c) in each figure is number 1. In both figures the indentation number 6 is located in Nb5Si3, and the indentation number 5 in Figure 10 is on the “interface” between Nbss and Nb5Si3, whereas the indentation numbers 5 and 7 in Figure 11 are on said interface. In both conditions, there was an increase in the modulus at the interface. Additionally, the modulus of Nb5Si3 was significantly higher than that of Nbss. In NV1-AC, there was hardly a change in hardness at the interface, whereas in NV1-HT, a small increase was indicated by the indentation number 7. The hardness and moduli of the Nbss and Nb5Si3 for the as-cast and heat-treated conditions are given in Table 7 and Table 8.
5. Discussion
5.1. Microstructures
The solidification of NV1-AC started with the Nbss as the primary phase. The formation of Nb3Si was suppressed owing to the destabilising effect of Sn [39] or Al [36] on Nb3Si in the presence of Ti, and the destabilising effect of Sn on Nb3Si when it is in synergy with Hf or Al (alloys EZ1 and EZ7 in [28]) or in synergy with Hf and Al or Cr (alloys EZ3 and EZ4 in [28]), even though Nb3Si can form when Hf is in synergy with Cr in the absence of Ti (alloy YG1 in [40]) or in synergy with Ti in the absence of Al, Cr, or Sn ([33] and alloy YG3 in [40]). Furthermore, V forms cubic V3Si (cP8, A15, and prototype Cr3Si) [24] that is isomorphous with Nb3Sn and A15-Nb3Si [41], and thus the presence of V in NV1 would be expected to destabilise on tP32 Nb3Si. No A15-Nb3X (X = Al,Si,Sn) was observed in NV1 owing to the low Sn concentration [14].
When the stable (tP32) Nb3Si is suppressed in the Nb-Si binary under RS conditions, the Nbss + Nb3Si stable eutectic is replaced by the Nbss + βNb5Si3 metastable eutectic with Si content about 20 at.% [42]. However, the latter concentration depends on the version of the Nb-Si binary used to define the composition of the stable eutectic [43], which can be in the range 15.3 to 18.7 at.% Si [17,43]. In RM(Nb)ICs, the eutectics with Nbss and Nb5Si3 have <Si> in the range 21.6 to 24.3 at.% (<Si> = Al + Ge + Si + Sn, [43]). In the case of NV1-AC, the average <Si> content of the lamellar micro-structure was 25.1 at.% (Table 2) or 24.9 at.% for the five lamellar microstructures shown in Figure 3.
In RM(Nb)ICs, the type of Nb5Si3 (meaning tetragonal α or β) and the completion or not of the transformation βNb5Si3→αNb5Si3 depends on the size of the as-cast button/ingot, meaning in “large” button/ingots the above transformation can occur during solid state cooling of the as-cast alloy (see Table A3 in [28] and alloy CM1 in [27]), the method of casting (see alloy CM1 in [27]) and the DS conditions ([33] and alloy CM1 in [27]), the heat treatment temperature and duration of treatment (see Table A3 in [28]), and the alloying addition(s). For example, the 5-3 silicides of Cr and V are isomorphous with βNb5Si3 [24]; the addition of Sn in RM(Nb)ICs with/without Ti quickens but does not lead to the completion of the above transformation in as-cast large button/ingots [28,39], and the same is the case when Hf is in synergy with Al, Cr, and Ti in RM(Nb)ICs (see Table A3 in [28]). On the other hand, the synergy of Al with Ti favours the βNb5Si3 in as-cast large button/ingots, and the above transformation is completed after prolonged heat treatment at 1500 °C [36], whereas when Al is in synergy with Cr and Ti, said transformation is not completed for the same heat treatment conditions (see Table A3 in [28]). When tetragonal Nb3Si is formed, the αNb5Si3 forms from the eutectoid transformation Nb3Si→Nb + αNb5Si3, which is very sluggish.
In binary Nb-Si alloys, the hexagonal γNb5Si3 is metastable and can be stabilised by interstitials [2]. In RM(Nb)ICs, the formation/stability of γNb5Si3 depends (a) on the Hf and Ti concentrations and the Nb/(Ti + Hf) ratio in Sn-free RM(Nb)ICs [33]; (b) on the synergy of Hf with other alloying additions, in particular Al and Sn, in Ti-free RM(Nb)ICs (e.g., alloy EZ4 in [28]); and (c) on the synergy of Hf and Sn with Al and/or Cr in Ti-containing RM(Nb)ICs [29]. Nb5Si3 with Nb/(Ti + Hf) < 1 is most likely to have a hexagonal structure in RM(Nb)ICs with small Nb/(Ti + Hf) ratio, and this likelihood increases as the Nb/(Ti + Hf) ratio gets smaller [33]. In the alloy NV1-AC, the EPMA analyses confirmed the presence of Nb5Si3, which according to XRD had tetragonal (αNb5Si3) and hexagonal structures, and the EPMA analysis data indicated that the ratio Nb/(Ti + Hf) was less or greater than one (Figure 2b and Figure 3, Table 2). The αNb5Si3 and γNb5Si3 were also reported in Sn-free DS Nb-Ti-Si-Hf RM(Nb)ICs with 0.85 < Nb/(Ti + Hf) < 1.95 [33]. The alloy NV1-AC had Nb/(Ti + Hf) = 1.81.
Figure 3 shows that the lamellar microstructure was “connected” with (“grew” from) Nb5Si3 that had Nb/(Ti + Hf) less than one, i.e., hexagonal γNb5Si3. Figure 2b and Figure 3d provide unconvincing evidence that a lamellar microstructure with brighter contrast, similar to that of hexagonal γNb5Si3, is also associated with Nb5Si3 that has Nb/(Ti + Hf) greater than one, i.e., tetragonal αNb5Si3 (see brighter contrast area between silicides 2 and 3 and above and to the right of silicide 3 in Figure 2b, owing to the partitioning of Hf and Ti in Nb5Si3, and the slightly darker contrast area in the silicide 6 in Figure 3c from which “grew” the lamellar microstructure between silicides 6 and 7). Note that the lamellar microstructure was not stable in NV1-HT. Was the lamellar microstructure that was observed in NV1-AC a eutectic, a eutectoid, or a combination of eutectic and eutectoid microstructure?
Bewlay et al. [33] studied the microstructures of DS RM(Nb)ICs (nominal compositions, at.%) Nb-33Ti-16Si-12.5Hf (Nb/(Ti + Hf) = 0.84), Nb-33Ti-16Si-7.5Hf (Nb/(Ti + Hf) = 1.1), and Nb-21Ti-16Si-12.5Hf (Nb/(Ti + Hf) = 1.48). In the alloy with the lowest Nb/(Ti + Hf) ratio, they reported (i) that (Nb + γNb5Si3)eutectic formed via the solidification route L→tP32 Nb3Si→tP32 Nb3Si + Nb→(γNb5Si3 + Nb)eutectic, i.e., from the tetragonal Nb3Si, and (ii) that (Nb + γNb5Si3)eutectoid formed after heat treatment at 1200 °C for 24 h where the prior Nb3Si + Nb eutectic microstructure was still present and the eutectoid γNb5Si3 grew epitaxially off the fine-scale eutectic γNb5Si3. The partitioning of Hf and Ti in Nb5Si3 played a key role in both transformations. No (Nb + γNb5Si3)eutectic was observed in the alloys with a higher Nb/(Ti + Hf) ratio, but the (Nb + γNb5Si3)eutectoid formed after heat treatment at 1200 °C for 50 h in all the Nb-Ti-Si-Hf RM(Nb)ICs with 0.85 < Nb/(Ti + Hf) < 1.95. In the RM(Nb)IC Nb-21Ti-16Si-7.5Hf (Nb/(Ti + Hf) = 1.95), only a small volume fraction of (Nb + γNb5Si3)eutectic formed, and this was observed only in the regions that were rich in Ti, owing to the partitioning of Ti, where the ratio Nb/(Ti + Hf) was greater than 1.5. It should be noted that in NV1-AC the areas of the alloy where the lamellar microstructure was observed had average Nb/(Ti + Hf) = 1.62 and that the Nb/(Ti + Hf) ratio of NV1-AC and NV1-HT was 1.81 and 1.92, respectively.
Likewise, Nb3Si was present in the as-cast (arc-melted) alloy YG3 (Nb-24Ti-18Si-5Hf [40]) where Nb + Nb3Si eutectic was formed as well as a fine-scale eutectic of Nbss and Nb5Si3 in which Ti-rich areas were noticeable and with average composition 34.3Nb-36.8Ti-21Si-7.9Hf (Hf and Si content essentially the same as in the lamellar microstructure in NV1-AC). Evidence for γNb5Si3 in the as-cast alloy YG3 was weak. However, after heat treatment (1500 °C/100 h), Hf-rich Nb5Si3 with Nb/(Ti + Hf) = 0.74, i.e., hexagonal Nb5Si3, formed, and the Nb3Si was also present. Furthermore, in the as-cast large button/ingot of the RM(Nb)IC Nb-24Ti-18Si-5Al-5Hf-5Sn, the (Nb + γNb5Si3)eutectic with <Si> =23.2 at.% formed only in the bulk, and Hf-rich Nb5Si3 (<Si> = 38 at.%) grew from Nb5Si3 (<Si> = 36.9 at.%) in the bottom of the ingot. The eutectic γNb5Si3 had Nb/(Ti + Hf) = 0.7 and <Si> = 38.5 at.% [29].
Given the above data from Bewlay et. al. [33] and our research group [28,29,40], the analysis data for NV1-AC and NV1-HT, the types of Nb5Si3 in NV1-AC and NV1-HT, the absence of tP32 Nb3Si and A15-Nb3Sn in both conditions, and the characteristic features of the lamellar microstructures in NV1-AC (Figure 2a,b and Figure 3 and Table 2), it is suggested that the solidification paths in NV1-AC were (i) L→L + Nbss→Nbss + βNb5Si3 →Nbss + αNb5Si3, where the βNb5Si3→αNb5Si3 transformation occurred during solid state cooling (parts of Figure 2b), or (ii) L→L + Nbss→Nbss + βNb5Si3→ Nbss + αNb5Si3 + γNb5Si3 (with the formation of γNb5Si3 attributed to the partitioning of solutes, parts of Figure 2b), or (iii) L→L + Nbss→ Nbss + βNb5Si3→Nbss + αNb5Si3 + γNb5Si3→ Nbss + αNb5Si3 + γNb5Si3 + (Nb + γNb5Si3)eutectic (Figure 2a and Figure 3 and part of Figure 2b) with the possibility of some (Nb + γNb5Si3)eutectoid forming during solid state cooling. Because of this uncertainty about the presence of (Nb + γNb5Si3)eutectoid in NV1-AC, the lamellar microstructure is not designated eutectic in the Table 2.
In NV1-AC, owing to their average chemical compositions, both the Ti-, Cr-, and V-rich Nbss and the lamellar microstructure had a composition that corresponds to RCCAs (i.e., they were “RCCA phases”) but not the Nbss and Ti-rich Nbss. In other words, because of the solidification conditions and the partitioning of solutes’ “conventional” phases, i.e., Nbss and Ti-rich Nbss, and “RCCA phases” co-existed in the aforementioned solidification paths. However, the latter phases were not stable (not observed in NV1-HT). A similar co-existence of “conventional” and RHEA alloys was reported in the arc-melted RHEA of nominal composition (at.%) 13Nb-24Ti-24Si-35Al-4Hf [44]. The formation of bcc Nbss and eutectics with Nbss and Nb5Si3 that satisfy the “standard definition” of HEAs is not rare in RM(Nb)ICs [17,43].
In NV1-AC, the average Si solubility in Nbss and in the Ti-rich Nbss was similar to that reported (i) for alloys of the Nb-Ti-Si and Nb-Hf-Si systems by Bewlay et al. [45,46], (ii) for the Nb-24Ti-18Si-5Hf alloy (YG3 in [40]), and (iii) for alloys of the Nb-Ti-Si-Cr-Al system such as KZ3, KZ4, KZ5, and KZ7 (often referred to by our group as the KZ series of alloys, see [35,36]), but it was higher than that in the Nbss in the Nb-24Ti-18Si-5Sn (alloy NV6 in [39]) and in the alloy KZ2 with higher Cr concentration [36]. The increase in the solubility of Si in the solid solution with increasing Hf concentration is supported by the work of Bewlay et al. [31]. The solubility of Si in the Nbss was not sensitive to the V concentration, which is in agreement with [47].
The average Ti concentrations in Nbss and in the Ti-rich Nbss were lower than those reported in [35,45] for alloys of the Nb-Ti-Si system, for alloys of the Nb-Ti-Si-Al-Cr system [35,36], for the alloy YG3 [40], and for the alloy NV6 [39]. This difference was more significant for the Nbss. The presence of V led to a further increase in the average Ti concentration in parts of the Nbss where the solubilities of Cr, V, and Hf had also increased. In some of these parts, the solubility of Ti was similar to that reported for alloys of the Nb-Ti-Si and Nb-Ti-Si-Cr-Al systems [35,36,45] and alloy NV6 [39]. The increase in the solid solubilities of Al, Cr, and Hf in the Nbss with increased Ti concentration is in agreement with the results for the KZ series of alloys [35,36]; the alloys JG2, JG3, JG4, and JG6 with/without Hf (JG series of alloys) [6,48,49]; and the alloy YG3 [40]. It was concluded (i) that the solubilities of Al, Cr, and Hf in the Nbss increased with increasing Ti concentration in agreement with previous research and (ii) that the solubility of V in the Nbss also increased with the Ti content.
In NV1-AC, the solubility range of Hf in the Hf rich Nb5Si3 was in agreement with the data in [32,46,50] but was significantly higher than the data in [49] for the Hf-containing and Hf-and-Sn-containing alloys JG4 and JG6, respectively. Furthermore, the solubility of Hf in the Ti-rich Nb5Si3 in NV1-AC was in agreement with data for the Hf-rich Nb5Si3 in JG4 and JG6 [49]. The solubility of Sn in Nb5Si3 was significantly lower than the data for alloys JG6 [49] and NV6 [39], and the same was the case regarding the solubility of Cr, compared to the KZ series of alloys [35,36] and the JG series of alloys [48,49]. The solubility of V in Nb5Si3 did not depend on the Ti or Hf solubilities and was significantly higher than the solubility of Mo [48] but significantly lower than the solubility of Ta in Nb5Si3 [36]. However, the highest concentration values for V in Nb5Si3 were significantly lower than the data reported in [47]. Comparison of the solubilities of V in the Nbss and Nb5Si3 would suggest that V predominantly partitions to the former phase, which is also supported by the data for the aforementioned phases in NV1-HT and is in agreement with [47]. Finally, the solubility of Al in Nb5Si3 was the same as for the KZ and JG series of alloys [35,36,48,49].
The average Si and Sn concentrations of the lamellar microstructure in NV1-AC were higher and lower than the corresponding values for the Nbss + Nb5Si3 eutectics in NV9 and NV6 [39], respectively; within the range of the Si concentrations suggested for the Nbss + Nb5Si3 eutectic in the Nb-V-Si system [47]; and higher than that of the Nb-Si eutectic in the binary system [51] and the eutectics in JG series of alloys [6]. The average Hf concentration of the eutectic was the same as for the Nbss and Nb5Si3 eutectic in the alloy YG3 [40], but the Si concentration was lower.
The suppression of Nb3Si resulted to equilibrium between Nbss and γNb5Si3 in the bulk and between Nbss and αNb5Si3 in the near-the-surface areas of NV1-HT, according to the XRD and EPMA data (Table 2 and Table 3 and Figure 1b). In NV1-HT, the Si solubility in Nbss was reduced compared with NV1-AC but was still higher compared with the heat-treated KZ series of alloys [35,36], the JG series of alloys [49], and the alloy NV6 [39]. Compared with NV1-AC, the solubility of V in Nbss and Nb5Si3 was reduced; the solubility of Cr in Nb5Si3 was increased; and the average solubility of Hf in Nb5Si3 was the same as in the Hf-rich Nb5Si3 in NV1-AC but with a significantly lower Ti concentration in the Nb5Si3.
The lamellar microstructure was not observed in NV1-HT. Given that the prior eutectic microstructure was stable in heat-treated Nb-V-Si alloys [47] and not completely eliminated in NV6-HT [39] and that the prior eutectic microstructure was not observed in the heat-treated KZ and JG series of alloys [35,36,48,49], it is suggested that it is the synergy of Cr and Al that has the strong detrimental effect on the stability of Nbss + Nb5Si3 lamellar microstructures. The formation of HfO2 in the as-cast alloy and of TiN in the near-the-surface areas of the heat-treated alloy demonstrated the sensitivity of NV1 to interstitial contamination, which was also confirmed by the oxidation results.
5.2. Oxidation
Compared with the alloy ZX7 [14], which had the same Sn concentration as NV1 but which was V-free, the addition of the latter element and Hf, and the lowering of the Si concentration in NV1, had an effect on (i) the chemical composition of the scale, (ii) the thickness of the scale, (iii) the enrichment of the subscale area of the substrate with Sn, and (iv) the formation of Sn rich layer at the scale/substrate interface. The oxides in the scale of NV1 at 900 °C were the same as those reported for Sn-free and for Sn-containing RM(Nb)ICs [13,14,15,17,18,19]. The oxygen content of the scale of NV1 was in agreement with the Si-rich oxide in the alloy ZX7 and (the richer in Sn) alloy ZX8 and the Nb-and-Ti-rich oxide in the alloy ZX8 [14,15]. However, the Cr and Sn concentrations in the scale of NV1 were remarkably low compared with the alloy ZX7 [14]. Additionally, in the scale, the V content was markedly low but hafnia was present in it (Table 5). The scale of NV1 was thinner than that of ZX7 (≤20 μm and 40 μm, respectively), but unlike the latter its thickness was not uniform.
Contrary to the alloy ZX7 [14], in which formation of an Sn-rich layer at the scale/substrate interface was not observed at 800 °C, a thin Sn-rich layer was observed in the alloy NV1 at 800 °C, the thickness of which increased at 900 °C (Figure 7b, Figure 8, and Figure 9), where it consisted of the Nb3Sn and Nb6Sn5 compounds. Note (i) that these two compounds can be at equilibrium below about 916 °C [24], (ii) that the melting temperature of Nb6Sn5 is about 916 °C, (iii) that the oxidation of NV1 at T ≥ 1000 °C was catastrophic (results not reported in this study), and (iv) that A15-Nb3X (X = Al,Si,Sn) was not observed in NV1-AC and was not stable in NV1-HT. In other words, in the alloy NV1, similarly to the (richer in Sn) alloy ZX8 [15], an Sn-rich layer formed at said interface. Of the two compounds that made different parts of this layer (Figure 9), the Nb3Sn has been reported in richer in Si and Sn but V-free RM(Nb)ICs with/without Hf, in which the compounds Nb5Sn2Si and NbSn2 also have been observed [13,15], but not the Nb6Sn5. Remarkably, in NV1, the latter compound was not contaminated with oxygen compared with the Nb3Sn, the contamination of which was more severe than in the alloys JG6 and ZX8 [13,15]. Furthermore, in NV1, both the Nb3Sn and Nb6Sn5 were Cr free, and even though their V concentration was very low, it was double in the former than in the latter compound.
The consumption of solute additions in NV1 for the formation of (a) the scale, in particular Al, Hf, Si, and Ti; and (b) the Sn-rich layer, especially Al, Si, Sn, and Ti, resulted in the bulk composition at 800 °C being poorer in these elements compared with NV1-AC. Composition changes from the bulk to the surface of NV1 at 800 °C were expected owing (i) to the tendency of Al, Cr, Si, Sn, and Ti to segregate to the surface [14] and (ii) the presence of Ti-rich Nb5Si3, Ti nitride, and hafnia in the near surface areas of NV1-HT (Table 3). In Figure 7b, the Nb5Si3 grains shown with the analysis numbers 1 and 2 were not contaminated with oxygen, and their composition corresponded to hexagonal γNb5Si3 ((Nb/(Ti + Hf) equal to 0.95 and 0.78, respectively, analysis number 1: 29.1Nb-20.1Ti-35.1Si-3.5Al-0Cr-10.6Hf-0Sn-1.6V and analysis number 2: 25.8Nb-21.2Ti-35.6Si-3.2Al-0.5Cr-11.8Hf-0Sn-1.9V), whereas the Nb5Si3 grains shown with the analysis numbers 3 and 11 were also hexagonal γNb5Si3 ((Nb/(Ti + Hf) equal to 0.94 and 0.8, respectively) and contaminated, the latter more severely owing to its proximity with the scale/substrate interface (analysis number 3: 26.5Nb-18.6Ti-33.4Si-3.1Al-0.4Cr-9.7Hf-0.3Sn-1.3V-6.7O, analysis number 11:22.2Nb-18.3Ti-29.5Si-2.6Al-0.4Cr-9.3Hf-0.3Sn-1.5V-15.9O). Further in from the scale/substrate interface and toward the bulk, the contamination of Nb5Si3 was reduced, and there was oxygen-free (i.e., non-contaminated) Nb5Si3 in the bulk (Table 5). All the Nbss grains shown with the analysis numbers 4 to 9 in Figure 7b were contaminated with oxygen, and the chemical composition of the grains shown with the numbers 4 to 8 was similar (average composition 35.4Nb-14.8Ti-1.4Si-2.7Al-1.4Cr-2.6Hf-1.5Sn-2.9V-37.3O), whereas the composition of grain 9, below the Sn-rich layer, was slightly richer in Ti and V (31.4Nb-17.8Ti-1.1Si-3.5Al-2.1Cr-2.9Hf-1.8Sn-4V-35.4O). The contamination of the microstructure with oxygen from the scale/substrate interface to the bulk of NV1 followed the Ti-rich and Ti-, Cr-, and V-rich areas of Nbss grains on either side of Nb5Si3 grains (Figure 7b–d and Figure 9) and the Nbss in the lamellar microstructure (Figure 7c,d). In the latter, the more severe contamination of the Nbss resulted in “disintegration” (break-up and degeneration) of the lamellae (Figure 7c,d).
In spite of the fact that its microstructure was contaminated with oxygen from the scale/substrate interface to the bulk, and its very high vol.% Nbss, which played the key role in the contamination, the oxidation behaviour of the alloy NV1 in the pest regime was remarkable. Indeed, compared with other Sn-containing alloys with the same (alloy ZX7 [14]) or higher Sn content (alloys ZX8 [15] and JG6 [13] and the NV series alloys in Table 4) and the MASC alloy, the alloy NV1 (a) did not suffer from catastrophic pest oxidation, (b) had a mass change at 800 °C significantly lower than those of the alloys ZX7 and ZX8 (about 60 and 40 mg/cm2, respectively [15]), (c) had oxidation rate constants at 800 °C similar to those of the alloys ZX7 [14] and JG6 [13], and (d) had less mass change at 900 °C than all the other alloys in the Table 4, including the alloy NV5 that had the lowest vol.% Nbss (1.9%). However, compared with the alloy NV5, at 800 °C, the parabolic rate constant of NV1 was two orders of magnitude higher and its mass change 14 times higher.
Concerning the oxidation of RM(Nb)ICs in the pest regime, the results of this work (a) underpinned the benefits of alloying with Sn, (b) emphasised the key role of Nbss for the contamination of the alloy, (c) provided new data that show that the chemical composition of Nbss is as important as its vol.% for the oxidation behaviour of RM(Nb)ICs, and (d) showed that a 2 at.% Sn addition might be good enough for oxidation resistance purposes, depending on the other alloying additions and their concentrations. It is suggested that (a) to (d) are relevant to other multiphase metallic UHTMs with Nb addition, namely, RHEAs and RCCAs [10,11].
How does the isothermal oxidation of NV1 in the pest regime temperatures compare with the RCCAs in the review in [52]? At 700 °C, the mass change of NV1 (3.5 mg/cm2) was lower than those of the single phase bcc solid solution RRCAs Al0.3HfNbTaTiZr, Al0.5HfNbTaTiZr, Al0.75HfNbTaTiZr, AlHfNbTaTiZr, and HfNbTaTiZr (14, 14, 11, 10, and 55 mg/cm2 after 100 h, respectively). At 900 °C, the mass change of NV1 (30 mg/cm2) was lower than HfNbTaTiZr (54 mg/cm2), the same as Al0.3HfNbTaTiZr, but higher than Al0.5HfNbTaTiZr (18 mg/cm2), Al0.75HfNbTaTiZr (17 mg/cm2), and AlHfNbTaTiZr (16 mg/cm2). In other words, at 700 °C, the mass change of the alloy NV1 was less than all the aforementioned richer in Al, Ti, and Hf RCCAs, whereas, at 900 °C, the mass gain of the latter was less than NV1 only when their Al, Hf, or Ti concentrations were in the ranges 9.1 < Al < 16.7 at.% and 16.7 < Hf or Ti < 18.9 at.%.
5.3. Hardness and Nanoindentation
In nanoindentation, from the unloading curve, the stiffness, S, of the phase can be measured. The stiffness is correlated with the reduced modulus Er with the equation:
where P is the load, h is displacement, and A is the projected surface area of the indentation. The reduced modulus Er accounts for the effects of a non-rigid indenter during loading and is given by the equation:
where Es and νs are the Young’s modulus and Poisson’s ratio of the phase, respectively, and Ei, νi are the parameters for the indenter [53]. A rearrangement of the last equation gives the actual modulus, Es, of the phase as:
The values of Ei and νi were specified in the TriboScope manual [34] as 1140 GPa and 0.07, respectively. The Es was calculated for three different values of νs, namely, 0.38, 0.27, and 0.2 [54,55] (Figure 10b and Figure 11b). The average Es values of the Nbss and Nb5Si3 given in the Table 7 were from the Es calculated with νs equal to 0.38 and 0.27, respectively.
The Young’s modulus of the Nbss in NV1-HT (Table 7) was about 10 GPa higher than the average modulus of the Nbss in the heat-treated Sn-free alloys KZ5, KZ6, and KZ7 [56,57] (131.1 GPa, range 115.7 to 138.6 GPa) and about 8 GPa lower than the average modulus of the Nbss in the heat-treated Sn-free and Ge-containing alloys ZF4, ZF5, and ZF6 [58] (148.1 GPa, range 142.2 to 154 GPa), all calculated from nanoindentation data for the Nbss with νs = 0.38. Given that the aforementioned ZF series alloys were based on KZ series alloys with the addition of Ge, the data would suggest (a) that the alloying of the Nbss with Ge or Sn increases the elastic modulus of Nbss and (b) that the addition of Ge has a stronger effect (plus 17 GPa) than that of Sn (plus 10 GPa). The increase in the modulus of the Nbss near the Nbss/Nb5Si3 interface in NV1-AC and NV1-HT should be noted in Table 7.
The Young’s modulus of unalloyed (binary) Nb5Si3 decreases in the sequence αNb5Si3 > βNb5Si3 > γNb5Si3 according to ab initio calculations (291, 268.9, and 188.5 GPa, respectively [54]; also see Table 3 in [59]). The alloying of Nb5Si3 with Ti increases the Young’s modulus of α(Nb,Ti)5Si3 and γ(Nb,Ti)5Si3 and decreases the modulus of β(Nb,Ti)5Si3 [54]. In RM(Nb)ICs, the Si can be substituted by other simple metal and metalloid element additions and Nb by other TM and RM additions (e.g., see Table 2 in [59]). To our knowledge, there is no data from experiments or calculations that shows how other (than Ti) alloying additions that substitute Nb or additions that substitute Si in Nb5Si3 affect the Young’s modulus of the silicide.
The average Es of the alloyed Nb5Si3 in NV1-HT (285.1, Table 7) was lower than the moduli of α(Nb,Ti)5Si3 reported in [54] and of αNb5Si3 reported in [60] and [61] (314.3 and 325 GPa, respectively), and it was essentially the same as that of the alloyed α(Nb)5(Si)3 in KZ7-HT (283.8 GPa, calculated with νs = 0.27 [56]; the Nb and Si are in parentheses to indicate that they are substituted by other elements in the 5-3 silicide), which, however, was lower than the calculated moduli of α(Nb,Ti)5Si3 [54]. It should be noted that the silicides in the alloys KZ7 and NV1 were (Nb,Ti)5(Si,Al)3 and (Nb,Cr,Hf,Ti,V)5(Si,Al,Sn)3, respectively. Furthermore, the average Es of the (Nb)5(Si)3 in NV1-AC was significantly lower (230.7 GPa, Table 7) than said value in NV1-HT and closer to the moduli of hexagonal γ(Nb,Ti)5Si3 and alloyed hexagonal (Ti)5Si3 [54]. This difference (i) could be attributed to the fact that the nanoindentation measurements could not differentiate between the three different types of Nb5Si3 in the alloy (Table 2, Figure 1a) but also (ii) could indicate that in NV1-AC, where in the microstructure shown in Figure 2b the silicide is αNb5Si3 ((Nb/(Ti+Hf) > 1, see Section 4.1 and 5.1), the alloying of α(Nb,Ti,Hf,Cr,V)5(Si,Al,Sn)3 caused significant reduction in the Young’s modulus, whereas in NV1-HT, where the silicide was γ(Nb,Ti,Hf,Cr,V)5(Si,Al,Sn)3 ((Nb/(Ti+Hf) < 1, Table 2, Figure 2d), the alloying increased notably the Young’s modulus.
The hardness of Nbss and Nb5Si3 in RM(Nb)ICs that is measured using nanoindentation (nH) can be different from the microhardness (μH). The average correction factors derived from the data for the Nbss and Nb5Si3 in heat-treated KZ series alloys [56,57,58] and NV1-HT was 0.7357 for the former and 0.6395 for the latter; in other words, μHNbss = 0.7357 × nHNbss and μHNb5Si3 = 0.6395 × nHNb5Si3. For the particular case of KZ7-HT, where only the α(Nb,Ti)5(Si,Al)3 was present [36], the correction factor was 0.6275. Furthermore, the microhardness of binary αNb5Si3 and alloyed α(Nb)5(Si)3 was higher than that of the binary βNb5Si3 and alloyed β(Nb)5(Si)3 (see Table 4 in [59]). The microhardness of Nbss in NV1 calculated from the nanoindentation data and the aforementioned correction factor was 528.2 and 523.1 HV for NV1-AC and NV1-HT, respectively, which was in good agreement with the measured average values, particularly the former. The microhardness of Nb5Si3 was 1090 and 1340.3 HV for NV1-AC and NV1-HT, respectively. The former value was lower than the hardness of Nb5Si3 in the alloy NV6-HT [39] and in other Ti-containing RM(Nb)ICs (see the Figure 3 in [59]) but close to the hardness of (Nb,Ti,Hf,Cr)5(Si,Al,Sn)3 (1100 HV, [29]).
In Table 9, the measured average hardness of NV1 with the calculated hardness is compared. The calculations used the data for vol.% of phases in Table 1 (the vol.% hafnia is the balance), the microhardness values of the Nbss and Nb5Si3 calculated from the nanoindentation data, and 918 HV, the microhardness of hafnia. The calculated hardness is given for the law of mixtures, a Pythagorean-type addition rule, an inverse-type addition rule [28,39] and a cube-type addition rule (HV)3 = Σ[Vi(HV)i]3 where Vi is the volume fraction of phase i. The calculated values from the Pythagorean-type addition and the cube-type addition are closest to the measured values for NV1-AC and NV1-HT, respectively. The measured hardness of NV1-HT was lower than that of NV1-AC owing to the higher vol.% Nbss and the lower vol.% of Nb5Si3 compared with NV1-AC.
How does the room temperature hardness of NV1-AC (475 HV, Table 1) and of the bcc Nbss in the cast alloy (531 HV or 528 HV; the latter value was calculated from nanoindentation hardness, see above) compare with that of single-phase bcc solid solution as-cast RCCAs? Table 3 in [52] reports the hardness of 12 as-cast RCCAs. Five RCCAs had a hardness in the range of 298 to 454 HV, namely, (in increasing hardness) the alloys NbTaTiV, HfNbTaTiZr, MoNbTaTiV, NbTaTiVW, and MoNbTaW, whereas the hardness of six RCCAs, namely, NbTaVW, MoNbTaV, HfMoNbTaTiZr, MoNbTaVW, HfMoTaTiZr, and HfNbTaTiVZr were in the range 493 to 558 HV, and the hardness of CrMoNBTaVW was 705 HV. In other words, the hardness of NV1-AC was higher than that of the first five aforementioned RCCAs, and the hardness of the Nbss in NV1-AC was lower only than four of the above mentioned RCCAs, namely, the alloys CrMoNbTaVW, HfNbTaTiVZr, HfMoTaTiZr, and MoNbTaVW. Note that the mass change of NV1 at 700 and 900 °C was also better than that of HfNbTaTiZr (see previous section).
The room temperature yield stress of NV1-AC calculated from hardness was 1552.7 MPa, and the specific yield stress was 210.4 MPacm3g−1. The yield stress of NV1-AC was higher and lower than the yield stress of two RCCAs with a two-phase microstructure (bcc solid solution + M5Si3 silicide)—the HfNbSi0.5TiV (1399 MPa) and HfMo0.5NbSi0.3TiV0.5 (1617 MPa)—whereas, the specific yield stress of NV1-AC was higher than both RCCAs (179.8 and 191.1 MPacm3g−1, respectively) [52]. Furthermore, the room temperature specific yield stress of NV1-AC was higher than most of the RCCAs reviewed in [52] (see Figure 6b and data in Table 2 in the ref. [52]).
5.4. Comparison with NICE
In Section 2, where the alloy design/selection was briefly discussed, the property goal and the constraints of the design were given together with the predicted values according to NICE. The latter overestimated MACSi (3.7 versus 3.1 at.%) and the mass change at 800 °C (14.8 versus 10 mg/cm2), underestimated the vol.% of Nbss (75.5 versus 81 at.%), and predicted correctly the stable phases (meaning the Nbss and Nb5Si3 and the absence of Nb3Si and A15-Nb3X) and the room temperature yield stress from hardness. Given the uncertainties in the design of metallic UHTMs and RM(Nb)ICs [10,11,17], the agreement of NICE with the experimental results was satisfactory.
6. Conclusions
We studied the microstructure, isothermal oxidation, and hardness of the Nb-23Ti-5Si-5Al-5Hf-5V-2Cr-2Sn alloy and the hardness and Young’s moduli of elasticity of its Nbss and Nb5Si3. There was macrosegregation of Ti and Si in the as-cast alloy. The microstructure consisted of the Nbss, αNb5Si3, γNb5Si3, and HfO2 phases in the as-cast or heat-treated alloy plus TiN in the near-the-surface areas of the latter. The vol.% of Nbss was about 80%. There were Ti- and Ti-and-Hf-rich areas in the solid solution and 5-3 silicide, respectively, and a lamellar microstructure of these two phases in the cast alloy. The V partitioned to the Nbss, where its solubility increased with increasing Ti concentration. At 700, 800, and 900 °C, the alloy did not suffer from catastrophic pest oxidation; it followed parabolic oxidation kinetics in the former two temperatures and linear oxidation kinetics in the latter, where its mass change was the lowest compared with other Sn-containing alloys. A thin Sn-rich layer formed in the interface between the scale and the substrate, which consisted of the Nb3Sn and Nb6Sn5 compounds at 900 °C. The latter compound was not contaminated with oxygen. Both the Nbss and Nb5Si3 were contaminated with oxygen (the former more severely than the latter). Furthermore, the bulk of the alloy was also contaminated with oxygen. However, in the bulk, some Nb5Si3 grains were not contaminated. The contamination of the microstructure with oxygen from the scale/substrate interface to the bulk followed the Ti- and Ti-, Cr-, and V-rich Nbss grains on either side of Nb5Si3 grains, and the Nbss in the lamellar microstructure, where the more severe contamination of the Nbss resulted in “disintegration” of the lamellae. The alloying of the Nbss with Sn increased its elastic modulus compared with Sn-free solid solutions. The hardness of the alloy and its Nbss and its specific room temperature strength compared favourably with many RCCAs. The research answered the three questions that motivated it, namely, that an RM(Nb)IC with very high vol.% Nbss (i) can have acceptable oxidation in the pest regime and that it (ii) will be contaminated with oxygen from the surface areas to its bulk. It also confirmed that in such an alloy both the αNb5Si3 and γNb5Si3 can be stable. The agreement of the predictions of the alloy design methodology NICE with the experimental results was satisfactory.
Author Contributions
Experimental work, N.V., P.K.; funding, P.T.; supervision, P.T.; resources, P.T.; formal analysis, N.V., P.K. and P.T.; draft preparation, N.V.; P.K.; review, P.T.; final paper, P.T. All authors have read and agreed to the published version of the manuscript.
Funding
This research was funded by the EPSC (EP/H500405/1, EP/L026678/1).
Institutional Review Board Statement
Not applicable.
Informed Consent Statement
Not applicable.
Data Availability Statement
All the data for this paper is given in the paper, other data cannot be made available to the public.
Acknowledgments
Support of parts of this work by the University of Sheffield, Rolls-Royce Plc, EPSRC (EP/H500405/1, EP/L026678/1), and the University of Surrey is gratefully acknowledged.
Conflicts of Interest
The authors declare no conflict of interest.
Appendix A

Table A1.
Nominal compositions (at.%) of reference alloys used in this work.
| Alloy | Nb | Ti | Si | Al | Hf | Cr | Mo | Ta | W | Fe | Ge | Sn | Ref. |
|---|---|---|---|---|---|---|---|---|---|---|---|---|---|
| CM1 | 60.5 | 8.3 | 21.1 | - | 0.7 | - | 5.4 | - | 4 | - | - | - | [27] |
| EZ1 | 72 | - | 18 | - | 5 | - | - | - | - | - | - | 5 | [28] |
| EZ4 | 67 | - | 18 | 5 | 5 | - | - | - | - | - | - | 5 | [28] |
| EZ5 | 43 | 24 | 18 | 5 | 5 | - | - | - | - | - | - | 5 | [29] |
| EZ7 | 72 | - | 18 | 5 | - | - | - | - | - | - | - | 5 | [28] |
| JG2 * | 43 | 24 | 18 | 5 | - | 5 | 5 | - | - | - | - | - | [48] |
| JG3 * | 46 | 24 | 18 | 5 | - | 5 | 2 | - | - | - | - | - | [48] |
| JG4 * | 41 | 24 | 18 | 5 | 5 | 5 | 2 | - | - | - | - | - | [49] |
| JG6 * | 36 | 24 | 18 | 5 | 5 | 5 | 2 | - | - | - | - | 5 | [49] |
| KZ2 ** | 46 | 24 | 18 | 4 | - | 8 | - | - | - | - | - | - | [36] |
| KZ3 ** | 58 | 24 | 18 | - | - | - | - | - | - | - | - | - | [34] |
| KZ4 ** | 53 | 24 | 18 | - | - | 5 | - | - | - | - | - | - | [35] |
| KZ5 ** | 48 | 24 | 18 | 5 | - | 5 | - | - | - | - | - | - | [35,36] |
| KZ7 ** | 53 | 24 | 18 | 5 | - | - | - | - | - | - | - | - | [35,36] |
| MASC | 47 | 25 | 16 | 2 | 8 | 2 | - | - | - | - | - | - | [3] |
| NV3 + | 48 | 24 | 18 | - | - | 5 | - | - | - | 5 | - | - | [37] |
| NV4 + | 30 | 45 | 15 | - | - | - | - | - | - | 5 | - | 5 | [38] |
| NV5 + | 43 | 24 | 18 | - | - | 5 | - | - | - | 5 | - | 5 | [37] |
| NV6 + | 53 | 24 | 18 | - | - | - | - | - | - | - | - | 5 | [39] |
| NV8 + | 48 | 24 | 18 | - | - | - | - | - | - | 5 | - | 5 | [38] |
| NV9 + | 77 | - | 18 | - | - | - | - | - | - | - | - | 5 | [39] |
| YG1 | 72 | - | 18 | - | 5 | 5 | - | - | - | - | - | - | [40] |
| YG3 | 53 | 24 | 18 | - | 5 | - | - | - | - | - | - | - | [40] |
| YG4 | 72 | - | 18 | - | 5 | - | 2 | 3 | - | - | - | - | [25] |
| YG5 | 70 | - | 20 | - | 5 | - | - | - | 5 | - | - | - | [26] |
| YG6 | 72 | - | 20 | - | - | - | 5 | - | 3 | - | - | - | [26] |
| YG8 | 67 | - | 20 | - | 5 | - | 5 | - | 3 | - | - | - | [26] |
| ZF4 ++ | 48 | 24 | 18 | - | - | 5 | - | - | - | - | 5 | - | [62] |
| ZF5 ++ | 48 | 24 | 18 | 5 | - | - | - | - | - | - | 5 | - | [63] |
| ZF6 ++ | 43 | 24 | 18 | 5 | - | 5 | - | - | - | - | 5 | - | [20] |
| ZX7 | 46 | 24 | 18 | 5 | - | 5 | - | - | - | - | - | 2 | [14] |
| ZX8 | 43 | 24 | 18 | 5 | - | 5 | - | - | - | - | - | 5 | [15] |
* JG series alloys, + NV series alloys, ** KZ series alloys, and ++ ZF series alloys.
References
- Mendiratta, M.G.; Dimiduk, D.M. Phase relations and transformation kinetics in the high Nb region of the Nb-Si system. Scr. Metall. Mater. 1991, 25, 237–242. [Google Scholar] [CrossRef]
- Schlesinger, M.E.; Okamoto, H.; Gokhale, A.B.; Abbaschian, R. The Nb-Si (Niobium-Silicon) System. J. Phase Equilibria 1993, 14, 502–509. [Google Scholar] [CrossRef]
- Bewlay, B.P.; Jackson, M.R. High-temperature in situ composites: Processing and Properties. In Comprehensive Composite Materials; Kelly, A., Zweben, C., Eds.; Chapter 3.22; Elsevier: Amsterdam, The Netherlands, 2003; pp. 579–615. [Google Scholar]
- Jackson, M.R.; Bewlay, B.P.; Briant, C.L. Creep Resistant Nb-Silicide Based Two Phase Composites. US Patent 6,447,623, 10 September 2002. [Google Scholar]
- Jackson, M.R.; Bewlay, B.P.; Zhao, J.-C. Niobium Silicide Based Composites Resistant to Low Temperature Pesting. US Patent 6,419,765, 16 July 2002. [Google Scholar]
- Geng, J.; Tsakiropoulos, P. A study of the microstructures and oxidation of Nb-Si-Cr-Al-Mo in situ composites alloyed with Ti, Hf and Sn. Intermetallics 2007, 15, 382–395. [Google Scholar] [CrossRef]
- Jackson, M.R. NbTiAlCrHf Alloy and Structures. US Patent 5,366,565, 22 November 1994. [Google Scholar]
- Bewlay, B.P.; Jackson, M.R.; Gigliotti, M.F.X. Niobium Silicide High Temperature In-Situ Composites. In Intermetallic Compounds, Principles and Practice; Westbrook, J.H., Fleischer, R.L., Eds.; Wiley: Hoboken, NJ, USA, 2002; Volume 3, pp. 541–560. [Google Scholar]
- Prokoshkin, D.A.; Vasil’eva, E.V. Alloys of Niobium; Samatin, A.M., Ed.; Kaner, N., Translator; Translation Edited by Molly Gleser; Israel Programme for Scientific Translations: Jerusalem, Israel, 1965. [Google Scholar]
- Tsakiropoulos, P. Alloys for application at ultra-high temperatures: Nb-silicide in situ composites. Challenges, breakthroughs and opportunities. Prog. Mater. Sci. 2020, 123, 100714. [Google Scholar] [CrossRef]
- Tsakiropoulos, P. Refractory Metal (Nb) Intermetallic Composites, High Entropy Alloys, Complex Concentrated Alloys and the alloy design methodology NICE—Mise-en-scène patterns of thought and progress. Materials 2021, 14, 989. [Google Scholar] [CrossRef] [PubMed]
- Tsakiropoulos, P. Alloys. US Patent 10,227,680, 17 June 2009. [Google Scholar]
- Geng, J.; Tsakiropoulos, P.; Shao, G. A thermo-gravimetric and microstructural study of the oxidation of Nbss/Nb5Si3 based in situ composites with Sn addition. Intermetallics 2007, 15, 270–281. [Google Scholar] [CrossRef]
- Xu, Z.; Utton, C.; Tsakiropoulos, P. A study of the effect of 2 at.% Sn on the microstructure and isothermal oxidation at 800 and 1200 °C of Nb-24Ti-18Si based alloys with Al and/or Cr additions. Materials 2018, 11, 1826. [Google Scholar] [CrossRef] [Green Version]
- Xu, Z.; Utton, C.; Tsakiropoulos, P. A study of the effect of 5 at.% Sn on the microstructure and isothermal oxidation at 800 and 1200 °C of Nb-24Ti-18Si based alloys with Al and/or Cr additions. Materials 2020, 13, 245. [Google Scholar] [CrossRef] [Green Version]
- Knittel, S.; Mathieu, S.; Portebois, L.; Vilasi, M. Effect of tin addition on Nb-Si based in situ composites. Part II: Oxidation behaviour. Intermetallics 2014, 47, 43–52. [Google Scholar] [CrossRef]
- Tsakiropoulos, P. On Nb silicide based alloys: Alloy design and selection. Materials 2018, 11, 844. [Google Scholar] [CrossRef] [Green Version]
- Zelenitsas, K.; Tsakiropoulos, P. Effect of Al, Cr and Ta additions on the oxidation behaviour of Nb-Ti-Si in situ composites at 800 °C. Mater. Sci. Eng. 2006, A416, 269–280. [Google Scholar] [CrossRef]
- Geng, J.; Tsakiropoulos, P.; Shao, G. Oxidation of Nb-Si-Cr-Al in situ composites with Mo, Ti and Hf additions. Mater. Sci. Eng. 2006, A441, 26–39. [Google Scholar] [CrossRef]
- Li, Z.; Tsakiropoulos, P. On the microstructure and hardness of the Nb-24Ti-18Si-5Al-5Cr-5Ge and Nb-24Ti-18Si-5Al-5Cr-5Ge-5Hf (at.%) silicide based alloys. Materials 2019, 12, 2655. [Google Scholar] [CrossRef] [PubMed] [Green Version]
- Hernandez-Negrete, O.; Tsakiropoulos, P. On the microstructure and isothermal oxidation at 800 and 1200 °C of the Nb-24Ti-18Si-5Al-5Cr-5Ge-5Sn (at.%) silicide based alloy. Materials 2020, 13, 722. [Google Scholar] [CrossRef] [Green Version]
- Zhao, J.; Utton, C.; Tsakiropoulos, P. On the microstructure and properties of Nb-12Ti-18Si-6Ta-2.5W-1Hf (at.%) silicide based alloys with Ge and Sn additions. Materials 2020, 13, 1778. [Google Scholar] [CrossRef] [Green Version]
- Zhao, J.; Utton, C.; Tsakiropoulos, P. On the microstructure and properties of Nb-18Si-6Mo-5Al-5Cr-2.5W-1Hf Nb-silicide based alloys with Ge, Sn and Ti additions (at.%). Materials 2020, 13, 4548. [Google Scholar] [CrossRef]
- Okamoto, H. Desk Handbook: Phase Diagrams for Binary Alloys; ASM International: Materials Park, OH, USA, 2000. [Google Scholar]
- Grammenos, I.; Tsakiropoulos, P. Study of the role of Mo and Ta additions in the microstructure of Nb-18Si-5Hf silicide based alloy. Intermetallics 2010, 18, 1524–1530. [Google Scholar] [CrossRef]
- Grammenos, I.; Tsakiropoulos, P. Study of the role of Hf, Mo and W additions in the microstructure of Nb-20Si silicide based alloys. Intermetallics 2011, 19, 1612–1621. [Google Scholar] [CrossRef]
- McCaughey, C.; Tsakiropoulos, P. Type of primary Nb5Si3 and precipitation of Nbss in αNb5Si3 in a Nb-8.3Ti-21.1Si-5.4Mo-4W-0.7Hf (at.%) near eutectic Nb-silicide based alloy. Materials 2018, 11, 967. [Google Scholar] [CrossRef] [Green Version]
- Zacharis, E.; Utton, C.; Tsakiropoulos, P. A study of the effects of Hf and Sn on the microstructure, hardness and oxidation of Nb-18Si silicide based alloys without Ti addition. Materials 2018, 11, 2447. [Google Scholar] [CrossRef] [Green Version]
- Zacharis, E. Study of the role of Hf and Sn in Nb-18Si silicide based alloys. PhD thesis, University of Sheffield, Sheffield, UK, 2013. [Google Scholar]
- Bewlay, B.P.; Whiting, P.; Davis, A.W.; Briant, C.L. Creep mechanisms in niobium–silicide based in situ composites. MRS Proc. High Temp. Ordered Intermet. Alloys VIII 1999, 552, KK6.11.1–KK6.11.5. [Google Scholar] [CrossRef]
- Bewlay, B.P.; Bishop, R.R.; Jackson, M.R. The Nb-Hf-Si ternary phase diagram: Liquid–solid phase equilibria in Nb and Hf rich alloys. Z. Met. 1999, 90, 413–422. [Google Scholar]
- Zhao, J.-C.; Bewlay, B.P.; Jackson, M.R. Determination of Nb-Hf-Si phase equilibria. Intermetallics 2001, 9, 681–689. [Google Scholar] [CrossRef]
- Bewlay, B.P.; Sitzman, S.D.; Brewer, L.N.; Jackson, M.R. Analyses of eutectoid phase transformations in Nb-silicide in-situ composites. Microsc. Microanal. 2004, 10, 470–480. [Google Scholar] [CrossRef] [PubMed]
- Triboscope User Manual; Hysitron Ltd: Eden Prairie, MN, USA, 2005.
- Zelenitsas, K.; Tsakiropoulos, P. Study of the role of Cr and Al additions in the microstructure of Nb-Ti-Si in situ composites. Intermetallics 2005, 13, 1079–1095. [Google Scholar] [CrossRef]
- Zelenitsas, K.; Tsakiropoulos, P. Study of the role of Ta and Cr additions in the microstructure of Nb-Ti-Si-Al in situ composites. Intermetallics 2006, 14, 639–659. [Google Scholar] [CrossRef]
- Vellios, N.; Tsakiropoulos, P. The role of Fe and Sn additions in the microstructure of Nb-24Ti-18Si-5Cr silicide base alloys. Intermetallics 2010, 18, 1729–1736. [Google Scholar] [CrossRef]
- Vellios, N.; Tsakiropoulos, P. The role of Fe and Ti additions in the microstructure of Nb-18Si-5Sn silicide- based alloys. Intermetallics 2007, 15, 1529–1537. [Google Scholar] [CrossRef]
- Vellios, N.; Tsakiropoulos, P. The role of Sn and Ti additions in the microstructure of Nb-18Si base alloys. Intermetallics 2007, 15, 1518–1528. [Google Scholar] [CrossRef]
- Grammenos, I.; Tsakiropoulos, P. Study of the role of Al, Cr and Ti additions in the microstructure of Nb-18Si-5Hf silicide based alloys. Intermetallics 2010, 18, 242–253. [Google Scholar] [CrossRef]
- Tsakiropoulos, P. Alloying and properties of C14-NbCr2 and A15-Nb3X (X = Al, Ge, Si, Sn) in Nb-silicide based alloys. Materials 2018, 11, 395. [Google Scholar] [CrossRef] [Green Version]
- Bendersky, L.; Biancaniello, F.S.; Boettinger, W.J.; Perepezko, J.H. Microstructural characterisation of rapidly solidified Nb-Si alloys. Mater. Sci. Eng. 1987, 89, 151–159. [Google Scholar] [CrossRef]
- Tsakiropoulos, P. Alloying and hardness of eutectics with Nbss and Nb5Si3 in Nb-silicide based alloys. Materials 2018, 11, 592. [Google Scholar] [CrossRef] [Green Version]
- Ghadyani, M.; Utton, C.; Tsakiropoulos, P. Microstructures and isothermal oxidation of the alumina scale forming Nb1.7Si2.4Ti2.4Al3Hf0.5 and Nb1.3Si2.4Ti2.4Al3.5Hf0.4 alloys. Materials 2019, 12, 222. [Google Scholar] [CrossRef] [PubMed] [Green Version]
- Bewlay, B.P.; Jackson, M.R. The Nb-Ti-Si Ternary Phase Diagram: Evaluation of Liquid-Solid Phase Equilibria in Nb- and Ti-Rich Alloys. J. Phase Equilibria 1997, 18, 264–278. [Google Scholar] [CrossRef]
- Bewlay, B.P.; Zhao, J.-C.; Jackson, M.R.; Bishop, R.R. Determination of the effect of Hf additions on phase stability in Nb-silicide based in-situ composites. Mater. Res. Soc. Symp. Proc. 1999, 552, KK6.8.1–K6.8.6. [Google Scholar] [CrossRef]
- Kim, W.Y.; Yeo, I.D.; Ra, T.Y.; Cho, G.S.; Kim, M.S. Effect of V addition on microstructure and mechanical property in the Nb-Si alloy system. J. Alloys Compd. 2004, 364, 186–192. [Google Scholar] [CrossRef]
- Geng, J.; Tsakiropoulos, P.; Shao, G. The effects of Ti and Mo additions on the microstructure of Nb silicide base in situ composites. Intermetallics 2006, 14, 227–235. [Google Scholar] [CrossRef]
- Geng, J.; Tsakiropoulos, P.; Shao, G. A Study of the Effects of Hf and Sn Additions on the Microstructure of Nbss/Nb5Si3 based in situ composites. Intermetallics 2007, 15, 69–76. [Google Scholar] [CrossRef]
- Yang, Y.; Chang, Y.A.; Zhao, J.-C.; Bewlay, B.P. Thermodynamic modelling of the Nb-Hf-Si ternary system. Intermetallics 2003, 11, 407–415. [Google Scholar] [CrossRef]
- Bewlay, B.P.; Lipsitt, H.A.; Jackson, M.R.; Reeder, W.J.; Sutliff, J.A. Solidification processing of high temperature intermetallic eutectic-based alloys. Mater. Sci. Eng. 1995, A192/193, 534–543. [Google Scholar] [CrossRef]
- Senkov, O.N.; Miracle, D.B.; Chaput, K.J. Development and exploration of refractory High entropy alloys—A review. J. Mater. Res. 2018, 33, 3092–3128. [Google Scholar] [CrossRef] [Green Version]
- Oliver, W.C.; Pharr, G.M. An improved technique for determining hardness and elastic modulus using load and displacement sensing indentation experiments. J. Mater. Res. 1992, 7, 1564–1583. [Google Scholar] [CrossRef]
- Papadimitriou, I.; Utton, C.; Tsakiropoulos, P. The impact of Ti and temperature on the stability of Nb5Si3 phases: A first-principles study. Sci. Technol. Adv. Mater. 2017, 18, 467–479. [Google Scholar] [CrossRef] [Green Version]
- Kumar, K.S. Intermetallic Compounds: Principles and Practice; Westbrook, H., Fleischer, R.L., Eds.; John Wiley & Sons: Chichester, UK, 1995; Volume 2, p. 213. [Google Scholar]
- Sethi, J.S. Study of the Contamination of Nb Silicide Alloys by Interstitials; Final Year Project; University of Sheffield: Sheffield, UK, 2012. [Google Scholar]
- Claire, V. Study of the Role of Refractory Metal Additions on the Hardness of Nbss and Nb5Si3 in Nb Silicide Based Alloys; Final Year Project; University of Sheffield: Sheffield, UK, 2012. [Google Scholar]
- Feng, T. Study of the Effect of Interstitial Element Contamination on the Properties of Nbss and Nb5Si3 in Nb Silicide Based Alloys; Final Year Project; University of Sheffield: Sheffield, UK, 2013. [Google Scholar]
- Tsakiropoulos, P. On the alloying and properties of tetragonal Nb5Si3 in Nb-silicide based alloys. Materials 2018, 11, 69. [Google Scholar] [CrossRef] [Green Version]
- Chen, Y.; Hammerschmidt, T.; Pettifor, D.G.; Shang, J.; Zhang, Y. Influence of vibrational entropy on structural stability of Nb-Si and Mo-Si systems at elevated temperatures. Acta Mater. 2009, 57, 2657–2664. [Google Scholar] [CrossRef]
- Shi, S.; Zhu, L.; Jia, L.; Zhang, H.; Sun, Z. Ab initio study of alloying effects on structure stability and mechanical properties of Nb5Si3. Comput. Mater. Sci. 2015, 108, 121–127. [Google Scholar] [CrossRef]
- Li, Z.; Tsakiropoulos, P. Study of the effect of Cr and Ti additions in the microstructure of Nb-18Si-5Ge based in situ composites. Intermetallics 2012, 26, 18–25. [Google Scholar] [CrossRef]
- Li, Z.; Tsakiropoulos, P. The microstructure of Nb-18Si-5Ge-5Al and Nb-24Ti-18Si-5Ge-5Al in situ composites. J. Alloys Compd. 2013, 550, 553–560. [Google Scholar] [CrossRef]
Figure 1.
X-ray diffractograms of the alloy NV1 (a) as cast and (b) heat treated.

Figure 2.
BSE images of the microstructure of NV1. (a) and (b) as cast; (c) and (d) heat treated. (a) top and (b) bulk of NV1-AC, (c) near surface area of NV1-HT, and (d) bulk of NV1-HT. Analysis in (b) as follows. 1: 5-3 silicide 35.9Nb-18.8Ti-32.1Si-4.1Al-1Cr-6Hf-0.9Sn-1.2V, Nb/(Ti + Hf) = 1.45, <Si> = 37.1 at.%, 2: 5-3 silicide 33.7Nb-19.4Ti-33.1Si-3.9Al-0.6Cr-6.5Hf-0.8Sn-2V, Nb/(Ti + Hf) = 1.30, <Si> = 37.8 at.%, 3: 5-3 silicide 33.8Nb-20.8Ti-31.9Si-3.8Al-0Cr-7Hf-0.9Sn-1.8V, Nb/(Ti + Hf) = 1.22, <Si> = 36.6 at.%.


Figure 3.
Details of lamellar microstructure and composition (at.%) of phases in the bulk of NV1-AC. (a) Analyses 1 to 6 as follows: 1: solid solution 42.8Nb-30.6Ti-1.7Si-5.9Al-4.1Cr-5.1Hf-2.9Sn-6.9V, 2: solid solution 38.1Nb-31.7Ti-2.2Si-5.7Al-6.1Cr-5.7Hf-2.7Sn-7.8V, 3: lamellar microstructure 39.2Nb-22.7Ti-19.7Si-4.4Al-1.1Cr-8.2Hf-1.3Sn-3.4V,<Si> = 25.4 at.%, 4: solid solution 58.5Nb-21.6Ti-2Si-5.2Al-1.9Cr-4.4Hf-2.3Sn-4.1V, 5: 5-3 silicide 23.1Nb-22.2Ti-35.3Si-3.2Al-0.7Cr-13.1Hf-0.5Sn-1.9V, Nb/(Ti + Hf) = 0.65, <Si> = 39 at.%, 6: 5-3 silicide 23Nb-21.9Ti-35.5Si-3.5Al-0.5Cr-13.3Hf-0.4Sn-1.9V, Nb/(Ti + Hf) = 0.65, <Si>= 39.4 at.%. (b) Analyses 1 to 8 as follows: 1: lamellar microstructure 40.2Nb-23.9Ti-17.5Si-4.6Al-1.3Cr-7.3Hf-1.6Sn-3.6V, <Si> = 23.7 at.%, 2: lamellar microstructure 39.2Nb-23.1Ti-18.6Si-4.8Al-1.2Cr-7.7Hf-1.6Sn-3.8V, <Si> = 25 at.%, 3: solid solution 40.2Nb-31.3Ti-1.5Si-6.1Al-5Cr-4.9Hf-3.1Sn-7.9V, 4: solid solution 48.5Nb-26.7Ti-2.5Si-5.4Al-3.9Cr-4.9Hf-2.6Sn-6.4V, 5: solid solution 60.3Nb-20.9Ti-1.8Si-5Al-1.3Cr-4.3Hf-2.3Sn-4.1V, 6: solid solution 41.7Nb-29.6Ti-2.6Si-5.8Al-4.3Cr-5.6Hf-2.8Sn-7.6V, 7: 5-3 silicide 22Nb-23Ti-35Si-3.6Al-0.7Cr-13Hf-0.4Sn-2.3V, Nb/(Ti + Hf) = 0.61, <Si > =39 at.%, 8: 5-3 silicide 24.5Nb-21.6Ti-35.5Si-3.6Al-0.4Cr-12.4Hf-0Sn-2V, Nb/(Ti + Hf) = 0.72, <Si> = 39.1 at.%, 9: 5-3 silicide 24.1Nb-22.1Ti-35.3Si-3.5Al-0.4Cr-12.4Hf-0.4Sn-1.8V, Nb/(Ti + Hf) = 0.7, <Si> = 39.2 at.%. (c) Analyses 1 to 8 as follows: 1: lamellar microstructure 40.1Nb-22.7Ti-18.3Si-4.7Al-1.3Cr-7.7Hf-1.6Sn-3.6V, <Si> = 24.6 at.%, 2: lamellar microstructure 38.7Nb-23Ti-20.1Si-4.4Al-1.1Cr-8Hf-1.4Sn-3.3V, <Si> = 25.9 at.%, 3: solid solution 38Nb-33.2Ti-1.5Si-5.5Al-6.6Cr-4.1Hf-3Sn-8.1V, 4: solid solution 38.3Nb-32Ti-2Si-5.8Al-5.8Cr-5Hf-3Sn-8.1V, 5: hafnia 34Hf-66O, 6: 5-3 silicide 25.6Nb-21.5Ti-35.3Si-3.4Al-0Cr-11.8Hf-0.4Sn-2V, Nb/(Ti + Hf) = 0.77, <Si> = 39.1 at.%, 7: 5-3 silicide 23.5Nb-22.4Ti-35.3Si-3.4Al-0Cr-12.6Hf-0.5Sn-2.3V, Nb/(Ti + Hf) = 0.67, <Si> = 39.2 at.%, 8: solid solution 59.7Nb-21.2Ti-2.3Si-4.8Al-1.4Cr-4Hf-2.3Sn-4.3V.


Figure 4.
Mass change versus time of the alloys NV1, NV3, NV4, NV5, NV6, and NV8 at (a) 700 °C, (b) 800 °C, and (c) 900 °C. Ranking of alloys from best to worst oxidation in (a) NV4, NV5, NV8, NV6, NV3, NV1, and MASC; (b) NV5, NV8, NV4, NV1, NV6, MASC, and NV3; and (c) NV1, NV3, NV4, NV5, NV6, MASC, and NV8.


Figure 5.
The oxidised specimens of the alloys NV1 (top row) and MASC (bottom row) at 700, 800, and 900 °C.
Figure 5.
The oxidised specimens of the alloys NV1 (top row) and MASC (bottom row) at 700, 800, and 900 °C.

Figure 6.
X-ray diffractogram of the oxides formed on NV1 after isothermal oxidation in static air at 900 °C for 100 h.
Figure 6.
X-ray diffractogram of the oxides formed on NV1 after isothermal oxidation in static air at 900 °C for 100 h.

Figure 7.
BSE images of the microstructure of NV1 after isothermal oxidation at 800 °C. (a) Oxide scale, interface between scale and substrate and bulk of oxidised specimen, 1 scale, 2–8 Nbss, Nb5Si3 is the bright contrast phase. (b) Oxide scale and interface between scale and substrate, 1–3 and 11 Nb5Si3, 4 to 9 Nbss, 10 and 13 Si-rich oxide, 12 Nb- and Ti-rich oxide; the thin white contrast phase at the interface of Nb-and-Ti-rich oxide with Nbss on the left-hand side of analysis 11 is the Sn-rich phase; see text. (c) Bulk microstructure: 1 Nbss; 2 oxidised Nbss; 3, 4 oxidised lamellar microstructure; 5 Nb5Si3. (d) Bulk microstructure: 1, 3 Nbss; 2, 7 Nb5Si3; 5, 6 oxidised lamellar microstructure.


Figure 8.
(a) Bright contrast layer at the interface between oxide scale and substrate. (b) Sn X-ray map. (c) Oxygen X-ray map. (d) Line scan showing thin layer to be rich in Sn.
Figure 8.
(a) Bright contrast layer at the interface between oxide scale and substrate. (b) Sn X-ray map. (c) Oxygen X-ray map. (d) Line scan showing thin layer to be rich in Sn.

Figure 9.
Sn-rich layer formed at the interface between oxide scale and NV1 substrate at 900 °C. Analysis point 1 is on the right-hand side of the bright contrast layer and corresponds to Nb6Sn5, whereas the analysis point 6 is on the left-hand side of the point 1 and corresponds to Nb3Sn. Notice the heavily oxidised areas of Ti-rich Nbss in the subscale microstructure.

Figure 10.
Data for (b) modulus and (c) hardness of Nbss and Nb5Si3 in NV1-AC for (a) a nano-indentation line scan crossing a Nb5Si3 grain located between two Nbss grains. The three smaller nano-indentations on the left-hand side of (a) above the row of lager nano-indentations were produced with a load of 4000 μN.

Figure 11.
Data for (b) modulus and (c) hardness of Nbss and Nb5Si3 in NV1-HT for (a) a nanoindentation line scan crossing a Nb5Si3 grain located between two Nbss grains.
Figure 11.
Data for (b) modulus and (c) hardness of Nbss and Nb5Si3 in NV1-HT for (a) a nanoindentation line scan crossing a Nb5Si3 grain located between two Nbss grains.

Table 1.
Density, Vickers hardness, and vol.% of Nbss and Nb5Si3. (Average values are shown in bold numbers).
Table 1.
Density, Vickers hardness, and vol.% of Nbss and Nb5Si3. (Average values are shown in bold numbers).
| Alloy | Density (g/cm3) | Hardness (HV) | Vol.% Nbss | Vol.% Nb5Si3 |
|---|---|---|---|---|
| NV1–AC | 7.26–7.43 | 454–503 | 78.5–81.6 | 16.1–19.8 |
| 7.38 ± 0.1 | 475 ± 17 | 79.6 ± 1.1 | 18.0 ± 1.4 | |
| NV1–HT | - | 376–488 | 79.2–83.6 | 15.7–18.1 |
| - | 454 ± 35 | 81. 0 ± 1.5 | 16.9 ± 0.9 |
Table 2.
EPMA data (at.%) of phases in NV1-AC and the bulk of NV1-HT. (Average values are shown in bold numbers).
Table 2.
EPMA data (at.%) of phases in NV1-AC and the bulk of NV1-HT. (Average values are shown in bold numbers).
| Phases in NV1-AC | Elements | ||||||||
|---|---|---|---|---|---|---|---|---|---|
| Nb | Ti | Si | Al | Cr | Hf | Sn | V | O | |
| Nbss | 56.0–65.3 | 14.4–23.5 | 1.3–2.9 | 4.2–5.5 | 0.3–2.2 | 3.4–4.4 | 1.7–2.5 | 3.3–5.2 | - |
| 60.6 ± 2.8 | 20.9 ± 1.2 | 2.0 ± 0.4 | 4.9 ± 0.3 | 1.5 ± 0.5 | 3.8 ± 0.3 | 2.1 ± 0.2 | 4.2 ± 0.4 | - | |
| Ti-rich Nbss | 40.3–51.9 | 25.5–34.0 | 1.6–2.7 | 5.4–6.1 | 2.0–5.0 | 3.2–4.9 | 2.2–3.0 | 5.2–7.0 | - |
| 47.5 ± 3.3 | 28.4 ± 2.8 | 2.2 ± 0.4 | 5.7 ± 0.2 | 3.3 ± 0.8 | 4.3 ± 0.5 | 2.8 ± 0.2 | 5.8 ± 0.6 | - | |
| Ti, Cr, andV-rich Nbss | 29.8–45.0 | 28.5–35.7 | 1.4–1.7 | 5.1–6.1 | 3.6–8.4 | 4.5–6.0 | 2.4–2.8 | 7.8–10.2 | - |
| 36.5 ± 3.9 | 32.8 ± 1.7 | 1.6 ± 0.2 | 5.6 ± 0.3 | 6.8 ± 1.1 | 5.3 ± 0.5 | 2.7 ± 0.3 | 8.7 ± 0.8 | - | |
| Nb5Si3 | 33.8–36 | 18.8–20.8 | 31.9–33.4 | 3.7–4.1 | 0.2–1.0 | 6.0–7.0 | 0.6–1.0 | 1.2–2.0 | |
| 34.8 ± 0.9 | 19.3 ± 0.8 | 32.7 ± 0.7 | 3.8 ± 0.2 | 0.5 ± 0.3 | 6.4 ± 0.4 | 0.8 ± 0.1 | 1.7 ± 0.3 | ||
| Ti and Hf-rich Nb5Si3 | 14.9–25.3 | 22.4–25.4 | 34.1–35.6 | 3.1–4.4 | 0.2–1.2 | 12.0–17.0 | 0.1–0.5 | 1.4–2.9 | - |
| 21.6 ± 2.8 | 23.4 ± 1.2 | 34.8 ± 0.5 | 3.6 ± 0.3 | 0.6 ± 0.4 | 13.6 ± 1.2 | 0.3 ± 0.2 | 2.1 ± 0.3 | - | |
| Ti-rich Nb5Si3 * | 23.2–36.0 | 18.8–23.0 | 31.9–35.4 | 3.4–4.0 | 0.2–1.0 | 6.0–13.2 | 0.2–0.9 | 1.2–2.6 | - |
| 29.2 ± 4.8 | 20.7 ± 1.3 | 34.1 ± 1.2 | 3.7 ± 0.2 | 0.4 ± 0.3 | 9.6 ± 2.3 | 0.5 ± 0.3 | 1.8 ± 0.3 | - | |
| Lamellar * Nbss + Nb5Si3 | 37.7–40.6 | 21.8–25.1 | 16.6–21.6 | 4.1–4.8 | 0.9–1.8 | 7.2–8.9 | 1.1–1.7 | 2.8–4.1 | - |
| 39.3 ± 0.5 | 23.2 ± 0.8 | 19.1 ± 1.4 | 4.5 ± 0.2 | 1.3 ± 0.2 | 7.8 ± 0.3 | 1.5 ± 0.2 | 3.3 ± 0.3 | - | |
| HfO2 | - | - | - | - | - | 33.4–34.5 | - | - | 65.5–66.6 |
| 34.0 ± 0.3 | 66.0 ± 0.3 | ||||||||
| NV1-HT | |||||||||
| Nbss | 54.7–56.4 | 22.8–24.1 | 0.9–1.5 | 5.0–6.1 | 4.5–5.6 | 3.3–4.2 | 2.0–2.8 | 2.0–2.6 | - |
| 55.6 ± 0.5 | 23.6 ± 0.4 | 1.2 ± 0.2 | 5.6 ± 0.3 | 5.2 ± 0.2 | 3.8 ± 0.3 | 2.6 ± 0.2 | 2.4 ± 0.3 | - | |
| Nb5Si3 | 25.1–26.8 | 19.2–20.2 | 35–36.6 | 3.4–4.0 | 1.5–2.2 | 11.8–13.8 | 0.1–0.4 | 0.2–0.6 | - |
| 25.8 ± 0.5 | 19.6 ± 0.4 | 35.7 ± 0.5 | 3.7 ± 0.2 | 1.6 ± 0.2 | 13.0 ± 0.8 | 0.2 ± 0.1 | 0.4 ± 0.1 | - | |
| HfO2 | - | - | - | - | - | 33.0–33.8 | - | - | 66.2–67.0 |
| 33.5 ± 0.5 | 66.5 ± 0.5 | ||||||||
* see text.
Table 3.
EPMA data (at.%) of the phases in the microstructure near the surface of NV1-HT (1500 °C/100 h). (Average values are shown in bold numbers).
Table 3.
EPMA data (at.%) of the phases in the microstructure near the surface of NV1-HT (1500 °C/100 h). (Average values are shown in bold numbers).
| Phases Near Surface of NV1-HT | Element | |||||||||
|---|---|---|---|---|---|---|---|---|---|---|
| N | O | Nb | Ti | Si | Al | Cr | Hf | Sn | V | |
| Nbss | - | - | 63.0–63.4 | 18.4–19.6 | 0.1–0.5 | 6.0–6.2 | 2.7–2.9 | - | 2.4–2.5 | 6.0–6.2 |
| - | - | 63.2 ± 0.3 | 19.0 ± 0.8 | 0.3 ± 0.2 | 6.1 ± 0.1 | 2.8 ± 0.2 | - | 2.5 ± 0.1 | 6.1 ± 0.1 | |
| Nb5Si3 | - | - | 45.9–46.1 | 14.8–15.2 | 33.6–34.0 | 1.8–2.1 | - | 1.2–1.4 | 0.5–0.7 | 1.0–1.3 |
| - | - | 46.1 ± 0.1 | 15.0 ± 0.2 | 33.8 ± 0.2 | 2.0 ± 0.1 | - | 1.3 ± 0.2 | 0.6 ± 0.1 | 1.2 ± 0.2 | |
| Ti-rich Nb5Si3 | - | - | 32.5–33.5 | 23.3–24.3 | 33.2–33.5 | 3.4–3.8 | 0.4–0.5 | 2.5–3.9 | - | 2.2–2.5 |
| - | - | 33 ± 0.4 | 23.9 ± 0.5 | 33.4 ± 0.2 | 3.6 ± 0.2 | 0.4 ± 0.1 | 3.3 ± 0.6 | - | 2.4 ± 0.1 | |
| HfO2 | - | 65.6–68.2 | - | - | - | - | - | 31.8–34.4 | - | - |
| - | 67.1 ± 1.1 | - | - | - | - | - | 32.9 ± 1.1 | - | - | |
| Ti nitride | 34.5–40.9 | - | 2.6–3.4 | 54.8–61.3 | - | - | - | 0.6–1.7 | - | - |
| 36.9 ± 2.4 | - | 3.0 ± 0.2 | 59.0 ± 2.3 | - | - | - | 1.1 ± 0.4 | - | - | |
Table 4.
Oxidation rate constants of the alloys NV1, NV3, NV4, NV5, NV6, and NV8 at 700 °C, 800 °C, and 900 °C.
Table 4.
Oxidation rate constants of the alloys NV1, NV3, NV4, NV5, NV6, and NV8 at 700 °C, 800 °C, and 900 °C.
| Alloy | Vol.% Nbss | 700 °C | 800 °C | 900 °C | ||
|---|---|---|---|---|---|---|
| kl (g·cm−2·s−1) | kp (g2·cm−4·s−1) | kl (g·cm−2·s−1) | kp (g2·cm−4·s−1) | kl (g·cm−2·s−1) | ||
| NV1 | 79.6 | - | 3.4·10−11 | - | 2.8·10−10 | 5.4·10−8 (0–16 h), 1.3·10−7 (>16 h) |
| NV3 | 28 | - | 1.4·10−11 | 1.4·10−7 | - | 1.4·10−7 |
| NV5 | 1.9 | - | 1.3·10−12 | - | 1.3·10−12 | 3.0·10−7 (0–55 h), 1.3·10−7 (>55 h) |
| NV6 | 33.5 | - | 1.3·10−11 | 3.3·10−8 | - | 2.1·10−6 (0–17 h), 9.3·10−8 (>17 h) |
| NV8 | 15.3 | - | 7.2·10−12 | - | 6.1·10−11 | 3.1·10−7 (0–5 h), 9.8·10−7 (>5 h) |
| MASC | 30 | 5.6·10−8 (>10 h) | 6.9·10−12 (0–10 h) | 1.5·10−7 | - | 5.3·10−7 |
Table 5.
Chemical composition (at.%) of the phases present in the oxide scale and the bulk of the oxidised alloy NV1 at 800 °C/100 h. (Average values are shown in bold numbers).
Table 5.
Chemical composition (at.%) of the phases present in the oxide scale and the bulk of the oxidised alloy NV1 at 800 °C/100 h. (Average values are shown in bold numbers).
| Phase | Oxide Scale | ||||||||
|---|---|---|---|---|---|---|---|---|---|
| Element | |||||||||
| Nb | Ti | Si | Al | Cr | Hf | Sn | V | O | |
| Nb- and Ti-rich oxide | 18.9–22.3 | 5.2–7.8 | 0.6–0.9 | 1.4–2.0 | 0.2–0.8 | 1.1–1.5 | 0.2–0.9 | 1.0–1.8 | 65.8–68.3 |
| 19.9 ± 0.7 | 7.0 ± 0.4 | 0.7 ± 0.1 | 1.7 ± 0.2 | 0.5 ± 0.2 | 1.3 ± 0.2 | 0.5 ± 0.2 | 1.3 ± 0.2 | 67.1 ± 0.7 | |
| Si-rich oxide | 8.2–9.5 | 6.2–12.0 | 9.2–12.4 | 1.0–1.2 | 3.0–4.3 | 0.2–0.5 | 0.4–0.8 | 64.0–67.4 | |
| 9.1 ± 0.3 | 7.5 ± 1.1 | 11.4 ± 0.8 | 1.1 ± 0.1 | - | 3.8 ± 0.6 | 0.3 ± 0.1 | 0.6 ± 0.1 | 66.2 ± 0.5 | |
| HfO2 | 33.2–33.6 | 66.4–66.8 | |||||||
| 33.4 ± 0.1 | 66.6 ± 0.1 | ||||||||
| Bulk (analyses up to about 300μm below the scale/substrate interface) | |||||||||
| Nbss | 28.9–45.5 | 11.5–17.3 | 1.0–1.7 | 2.6–4.1 | 0.7–1.5 | 2.2–3.1 | 1.0–1.8 | 2.0–2.9 | 22.0–47.5 |
| 36.6 ± 4.2 | 13.1 ± 1.5 | 1.4 ±0.3 | 3.1 ± 0.2 | 1.0 ± 0.2 | 2.4 ±0.2 | 1.4 ± 0.2 | 2.4 ± 0.3 | 38.6 ± 4.5 | |
| Ti-rich Nbss | 23.4–39.1 | 14.5–20 | 0.6–1.3 | 2.6–4.0 | 1.6–2.6 | 2.4–3.3 | 1.2–1.8 | 3.1–3.9 | 25.0–48.6 |
| 29.2 ± 3.9 | 17.0 ± 2.2 | 1.0 ± 0.3 | 3.3 ± 0.5 | 1.9 ± 0.3 | 2.7 ± 0.2 | 1.5 ± 0.2 | 3.5 ± 0.3 | 39.9 ± 5.2 | |
| Nb5Si3 | 18.0–26.4 | 18.3–23.2 | 29.2–33.4 | 2.6–4.0 | 0.1–0.6 | 9.3–11.4 | 0.1–0.6 | 1.3–2.2 | 6.7–14.5 |
| 22.7 ± 3.1 | 20.0 ± 1.5 | 31.5 ± 1.1 | 3.0 ± 0.3 | 0.4 ± 0.1 | 10.5 ± 0.7 | 0.3 ± 0.2 | 1.8 ± 0.3 | 9.8 ± 2.8 | |
| Nb5Si3 Oxygen-free | 23.1–29.0 | 20.1–23.0 | 35.1–36.0 | 3.2–3.5 | 0.1–0.7 | 10.2–12.5 | 0.1–0.4 | 1.4–1.9 | |
| 25.7 ± 2 | 21.7 ± 0.6 | 35.5 ± 0.2 | 3.3 ± 0.1 | 0.4 ± 0.2 | 11.7 ± 0.7 | 0.3 ± 0.1 | 1.6 ± 0.2 | - | |
| Lamellar Nbss + Nb5Si3 | 24.5–32.5 | 16.0–19.0 | 10.4–15.1 | 2.9–3.8 | 0.9–1.5 | 4.8–6.3 | 0.9–1.3 | 2.3–2.8 | 24.8–33.3 |
| 28.4 ± 2.5 | 17.6 ± 1.1 | 12.5 ± 1.9 | 3.3 ± 0.3 | 1.1 ± 0.1 | 5.4 ± 0.5 | 1.1 ± 0.2 | 2.6 ± 0.2 | 28.0 ± 4 | |
| HfO2 | 33.4–34.5 | 65.5–66.6 | |||||||
| 34.0 ± 0.3 | 66.0 ± 0.2 | ||||||||
Table 6.
Phases and characteristic features of the oxide scale and bulk of the oxidised alloy NV1 at 800 °C/100 h.
Table 6.
Phases and characteristic features of the oxide scale and bulk of the oxidised alloy NV1 at 800 °C/100 h.
| Location | Phases | Characteristic Features |
|---|---|---|
| Oxide scale | Nb- and Ti-rich oxide, Si-rich oxide, and HfO2 | Thickness: non-uniform |
| Cracks parallel and transverse to oxide surface | ||
| Nbss, and Nb5Si3 “trapped” in scale | ||
| Interface between scale and substrate | Sn-rich phase | Very thin discontinuous layer of an Sn-rich phase |
| Subscale area | Oxidised Nbss and Nb5Si3 Severe oxidation of Ti-rich Nbss Cracks in Nbss running parallel to interface between scale and substrate Cracked Nb5Si3 | |
| Bulk (up to 300 μm below scale) | Nbss, Nb5Si3, lamellar microstructure, and HfO2 | Microstructure architecture same as in as-cast alloy |
| Nbss oxidised Ti-rich areas of the Nbss oxidised heavily Nb5Si3 also oxidised but less severely compared with Nbss | ||
| In the bulk, some Nb5Si3 grains not oxidised Cracks parallel to the surface formed in Nb5Si3 grains near the Interface between scale and substrate | ||
| Partial disintegration (break-up) of lamellar microstructure into Nbss and Nb5Si3 owing to the oxidation of the solid solution |
Table 7.
Average modulus and hardness results from tests performed with a 7000 μN load showing the changes of property with regard to the distance from the Nb5Si3; data for as-cast (AC) and heat-treated (HT) conditions.
Table 7.
Average modulus and hardness results from tests performed with a 7000 μN load showing the changes of property with regard to the distance from the Nb5Si3; data for as-cast (AC) and heat-treated (HT) conditions.
| Condition and Property (GPa) | Average Value for Nb5Si3 | Distance from Nb5Si3 | Average Value for Nbss | ||
|---|---|---|---|---|---|
| 0–5 μm | 5–10 μm | +10 μm | |||
| AC—modulus | 230.7 | 144.5 | 136.5 | 138.8 | 139.9 |
| HT—modulus | 285.1 | 146.1 | 137.7 | 140.5 | 141.4 |
| AC—hardness | 17.02 | 7.1 | 7.0 | 7.0 | 7.04 |
| HT—hardness | 20.93 | 7.2 | 6.8 | 6.9 | 6.97 |
Table 8.
Average nano-hardness data (GPa) and Vickers hardness (HV) values for Nbss and Nb5Si3.
| Condition | Nbss | Nb5Si3 | ||
|---|---|---|---|---|
| (GPa) | HV | (GPa) | HV | |
| AC | 7.04 | 718 | 17.02 | 1737 |
| HT | 6.97 | 711 | 20.93 | 2136 |
Table 9.
Measured and calculated Vickers hardness of NV1.
| Alloy and Condition | Measured * | Calculated + | |||
|---|---|---|---|---|---|
| A | B | C | D | ||
| NV1-AC | 475 | 639.2 | 459.4 | 585.9 | 432 |
| NV1-HT | 454 | 670.5 | 480 | 640.8 | 442.5 |
* Average value from Table 1, + see text. A = law of mixtures. B = Pythagorean-type addition. C = inverse-type addition. D = cube-type addition.
Publisher’s Note: MDPI stays neutral with regard to jurisdictional claims in published maps and institutional affiliations. |
© 2021 by the authors. Licensee MDPI, Basel, Switzerland. This article is an open access article distributed under the terms and conditions of the Creative Commons Attribution (CC BY) license (https://creativecommons.org/licenses/by/4.0/).
Share and Cite
MDPI and ACS Style
Vellios, N.; Keating, P.; Tsakiropoulos, P. On the Microstructure and Properties of the Nb-23Ti-5Si-5Al-5Hf-5V-2Cr-2Sn (at.%) Silicide-Based Alloy—RM(Nb)IC. Metals 2021, 11, 1868. https://doi.org/10.3390/met11111868
AMA Style
Vellios N, Keating P, Tsakiropoulos P. On the Microstructure and Properties of the Nb-23Ti-5Si-5Al-5Hf-5V-2Cr-2Sn (at.%) Silicide-Based Alloy—RM(Nb)IC. Metals. 2021; 11(11):1868. https://doi.org/10.3390/met11111868
Chicago/Turabian StyleVellios, Nikos, Paul Keating, and Panos Tsakiropoulos. 2021. "On the Microstructure and Properties of the Nb-23Ti-5Si-5Al-5Hf-5V-2Cr-2Sn (at.%) Silicide-Based Alloy—RM(Nb)IC" Metals 11, no. 11: 1868. https://doi.org/10.3390/met11111868
Note that from the first issue of 2016, this journal uses article numbers instead of page numbers. See further details here.