
Modelling the Effect of Solution Composition and Temperature on the Conductivity of Zinc Electrowinning Electrolytes

 , ,
, ,
Abstract
:1. Introduction
2. Materials and Methods
3. Results and Discussion
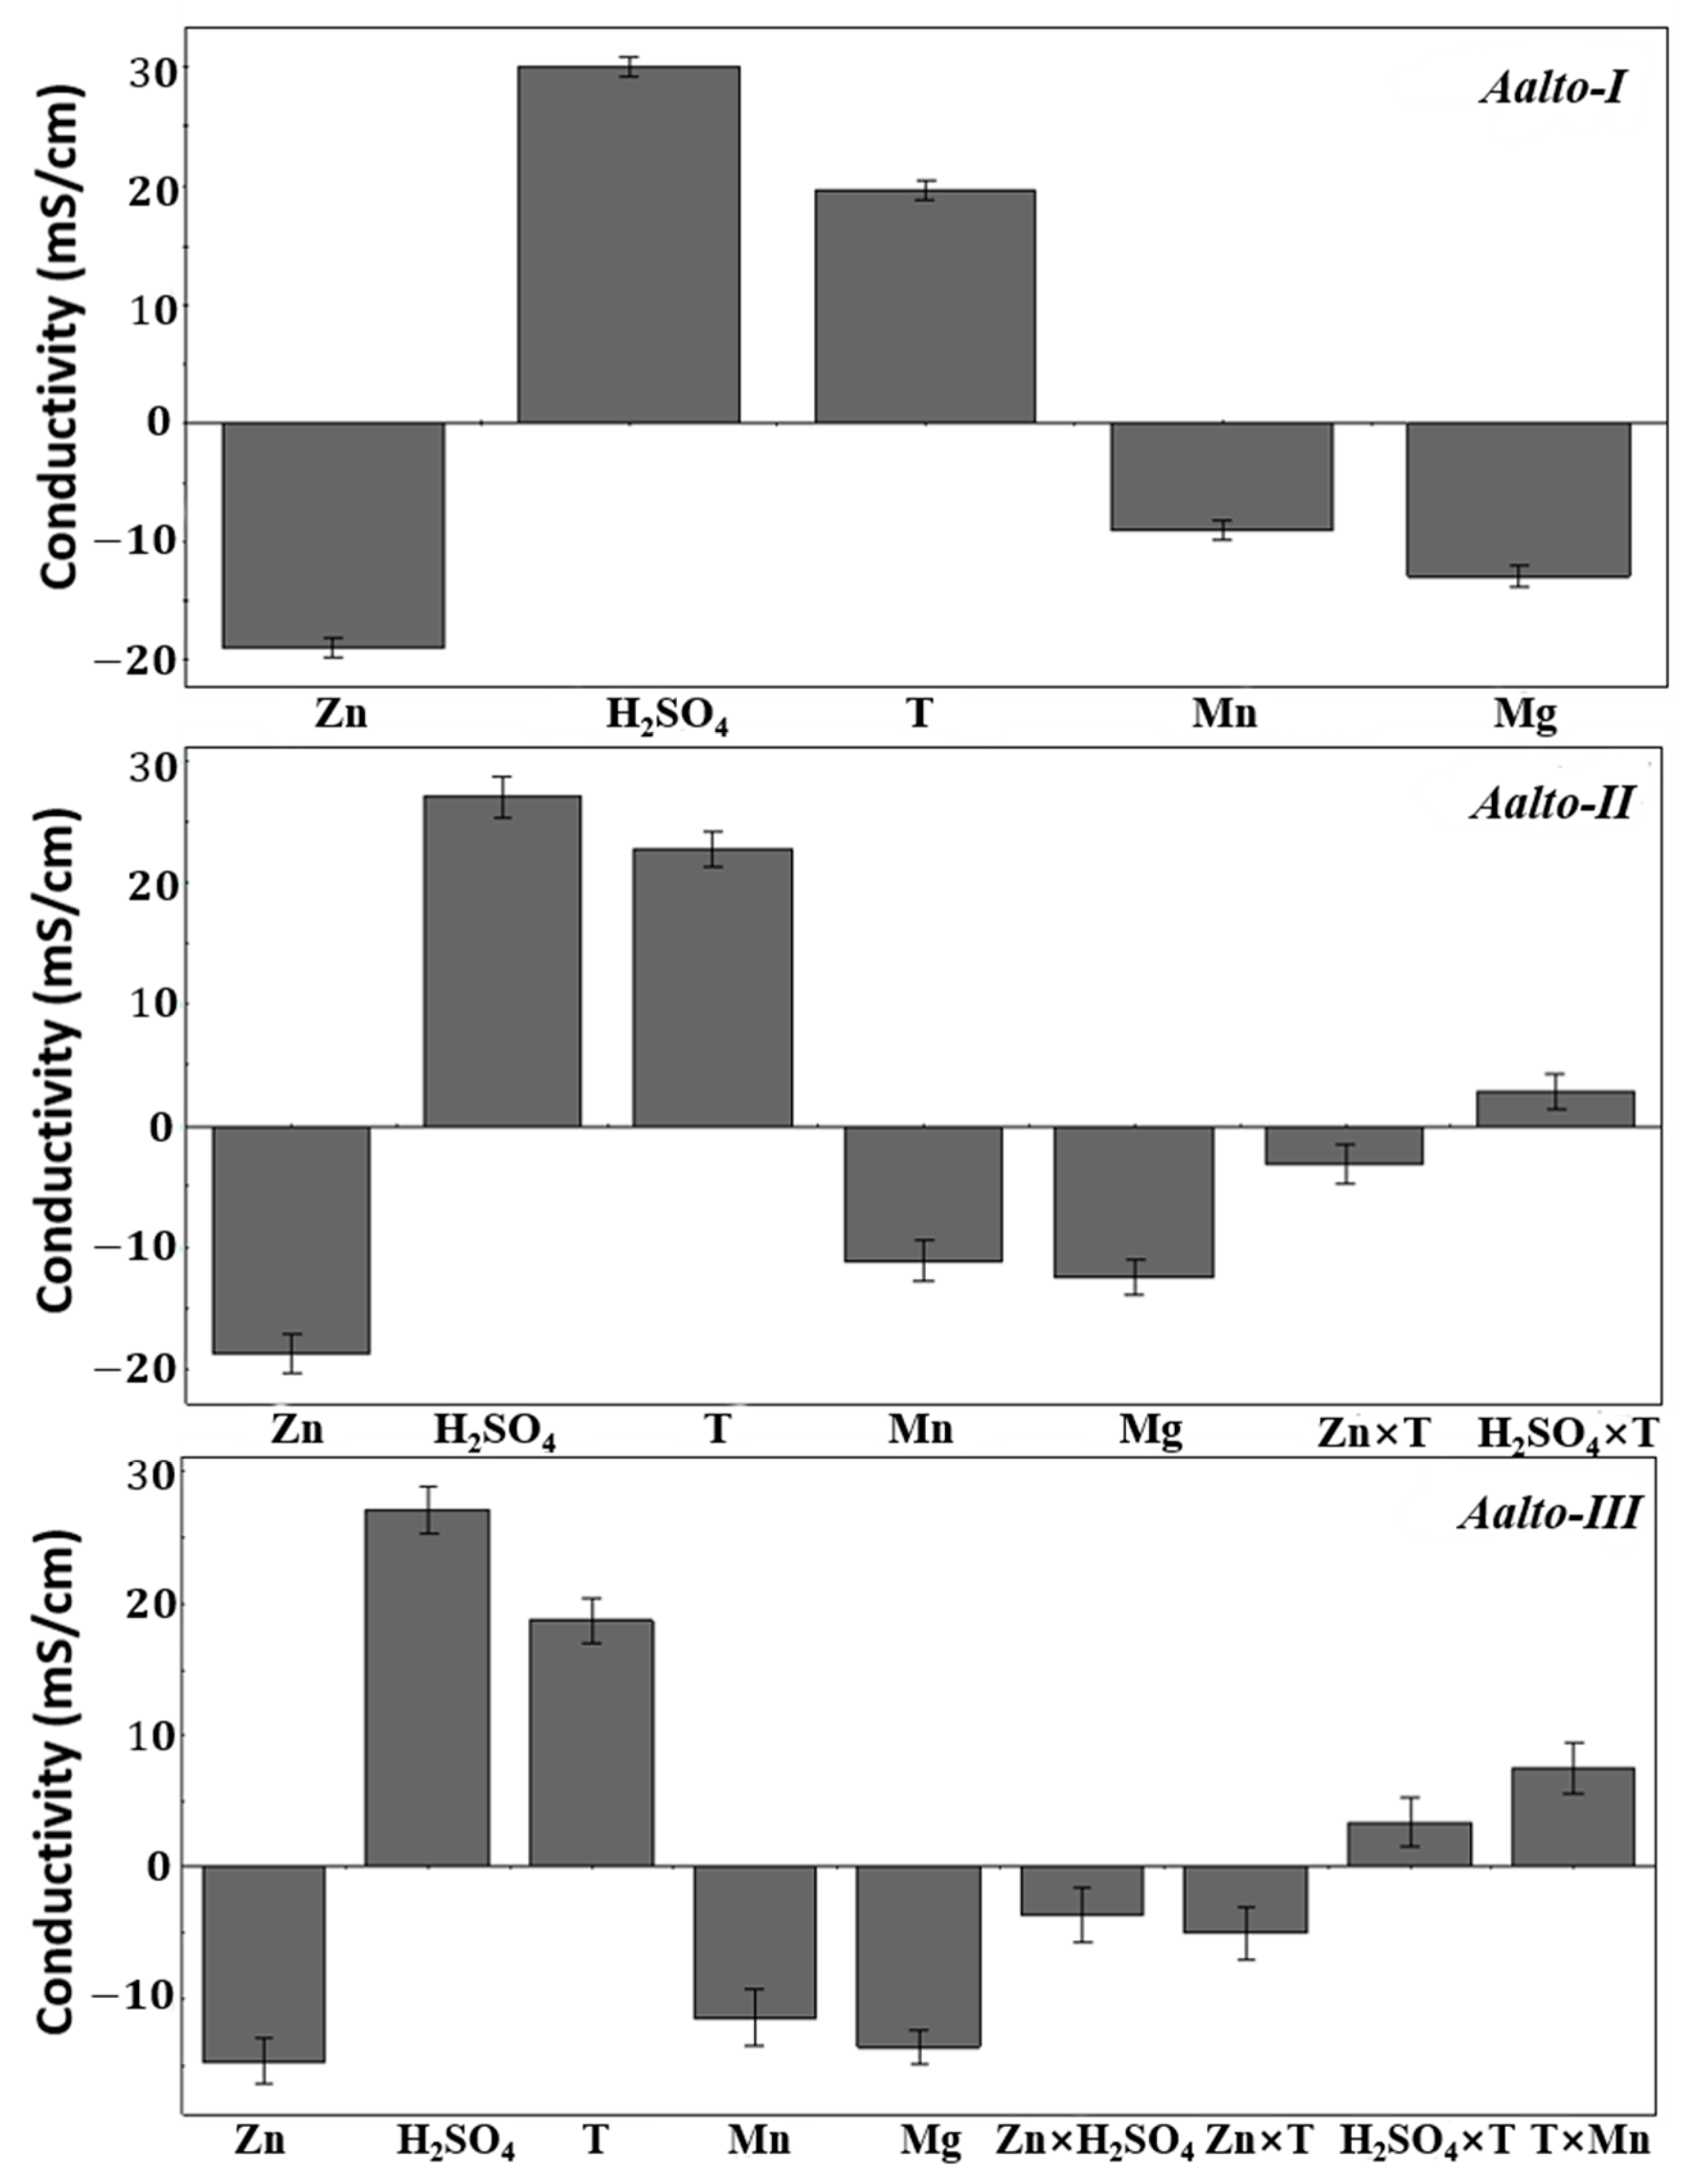
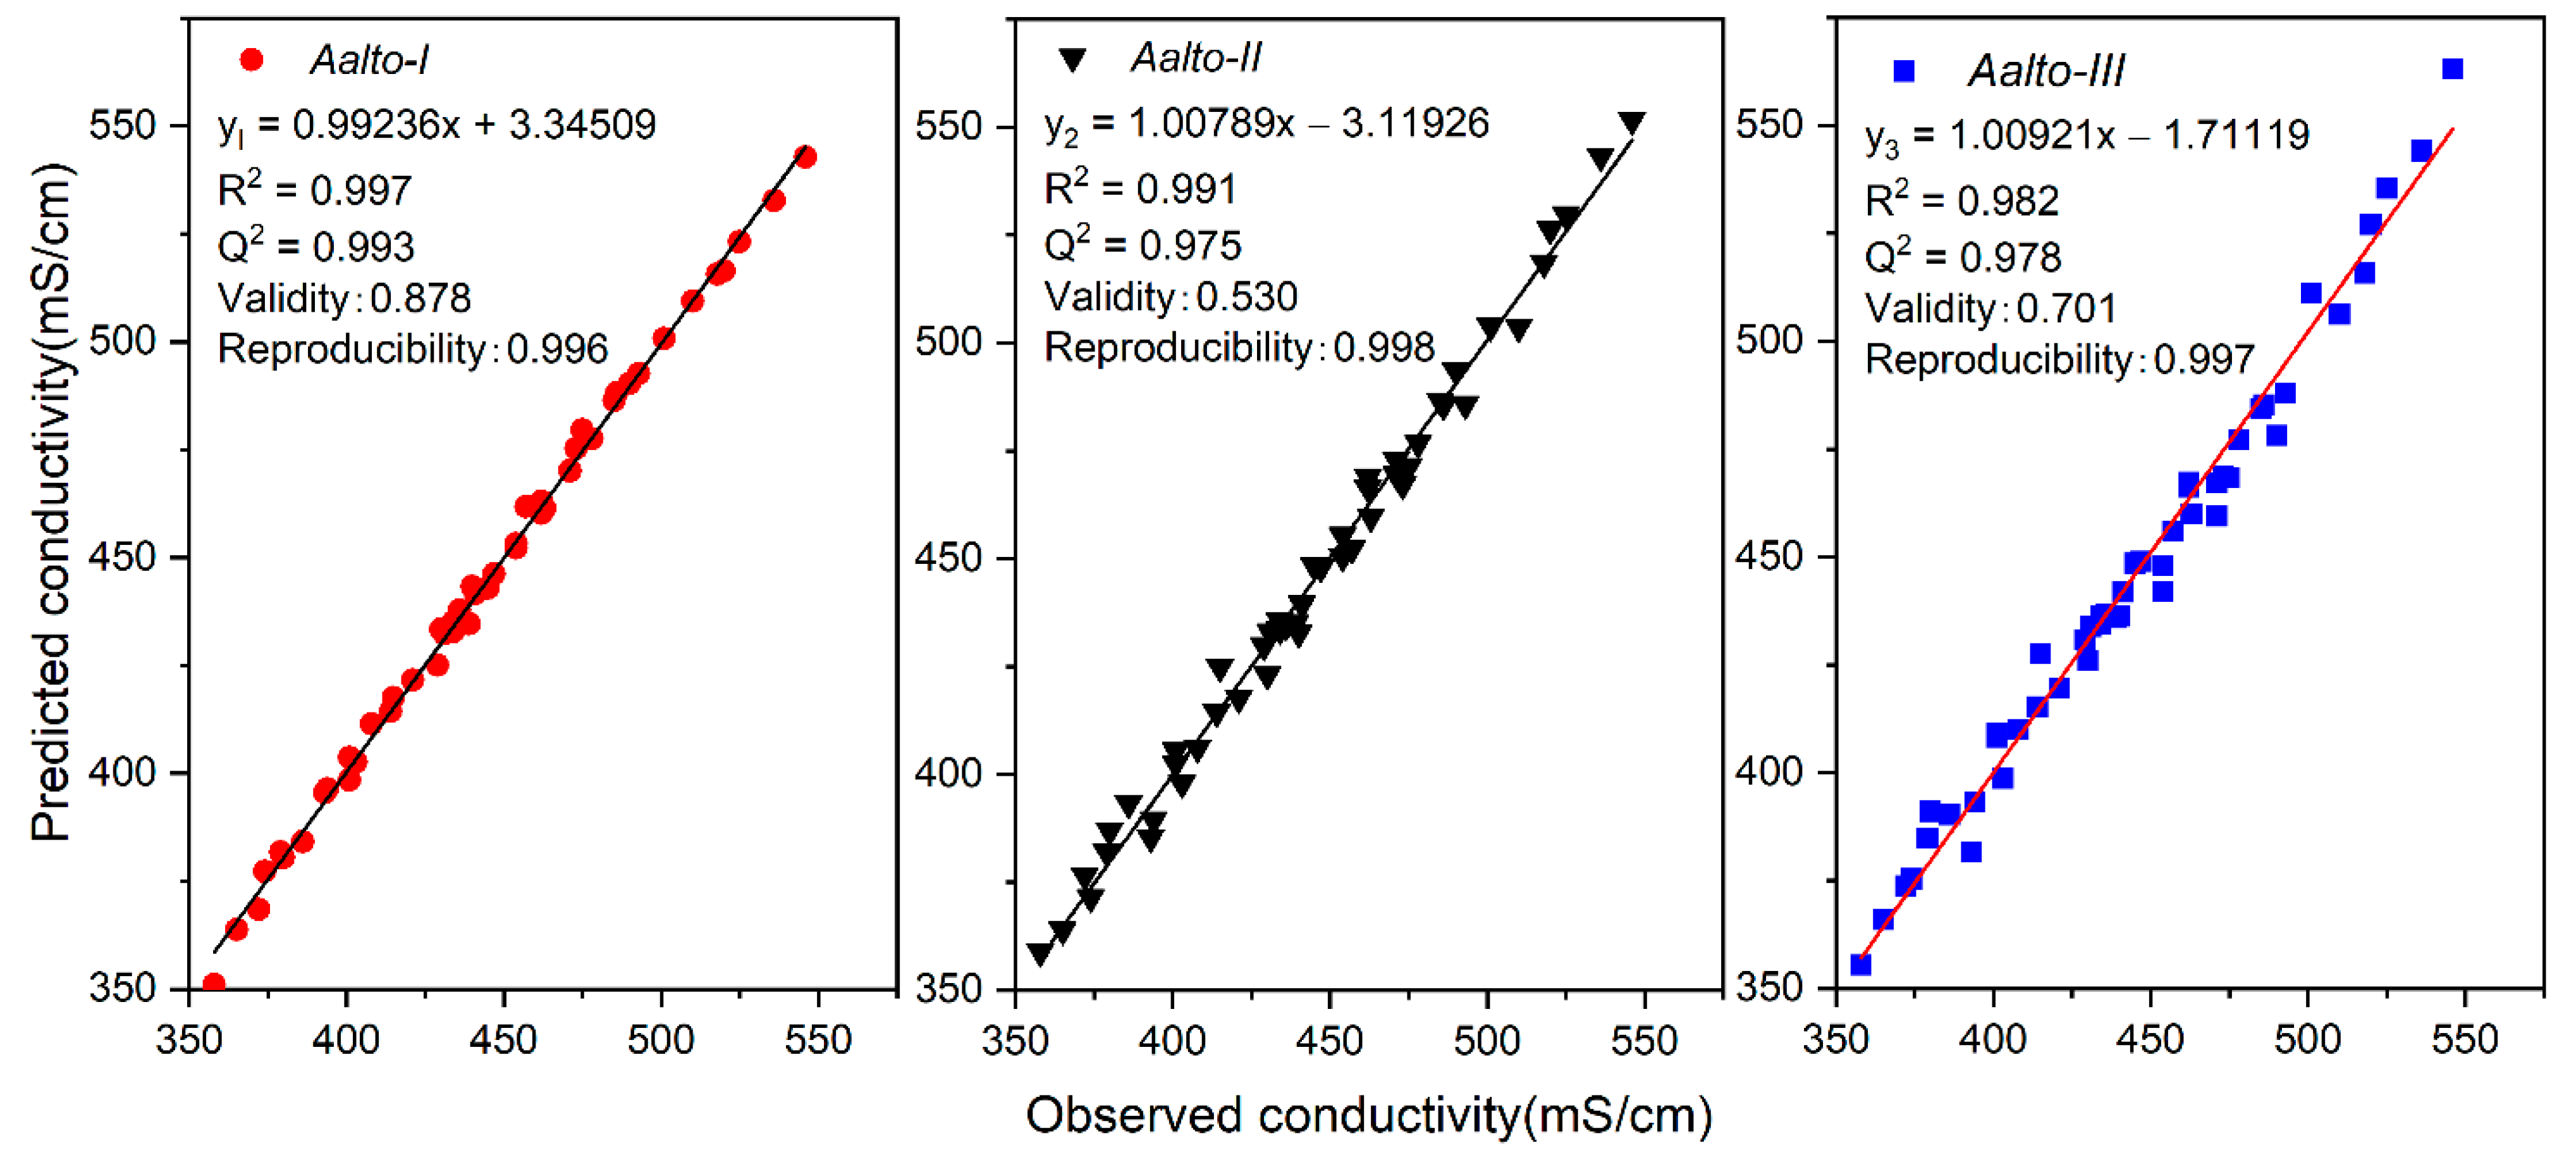
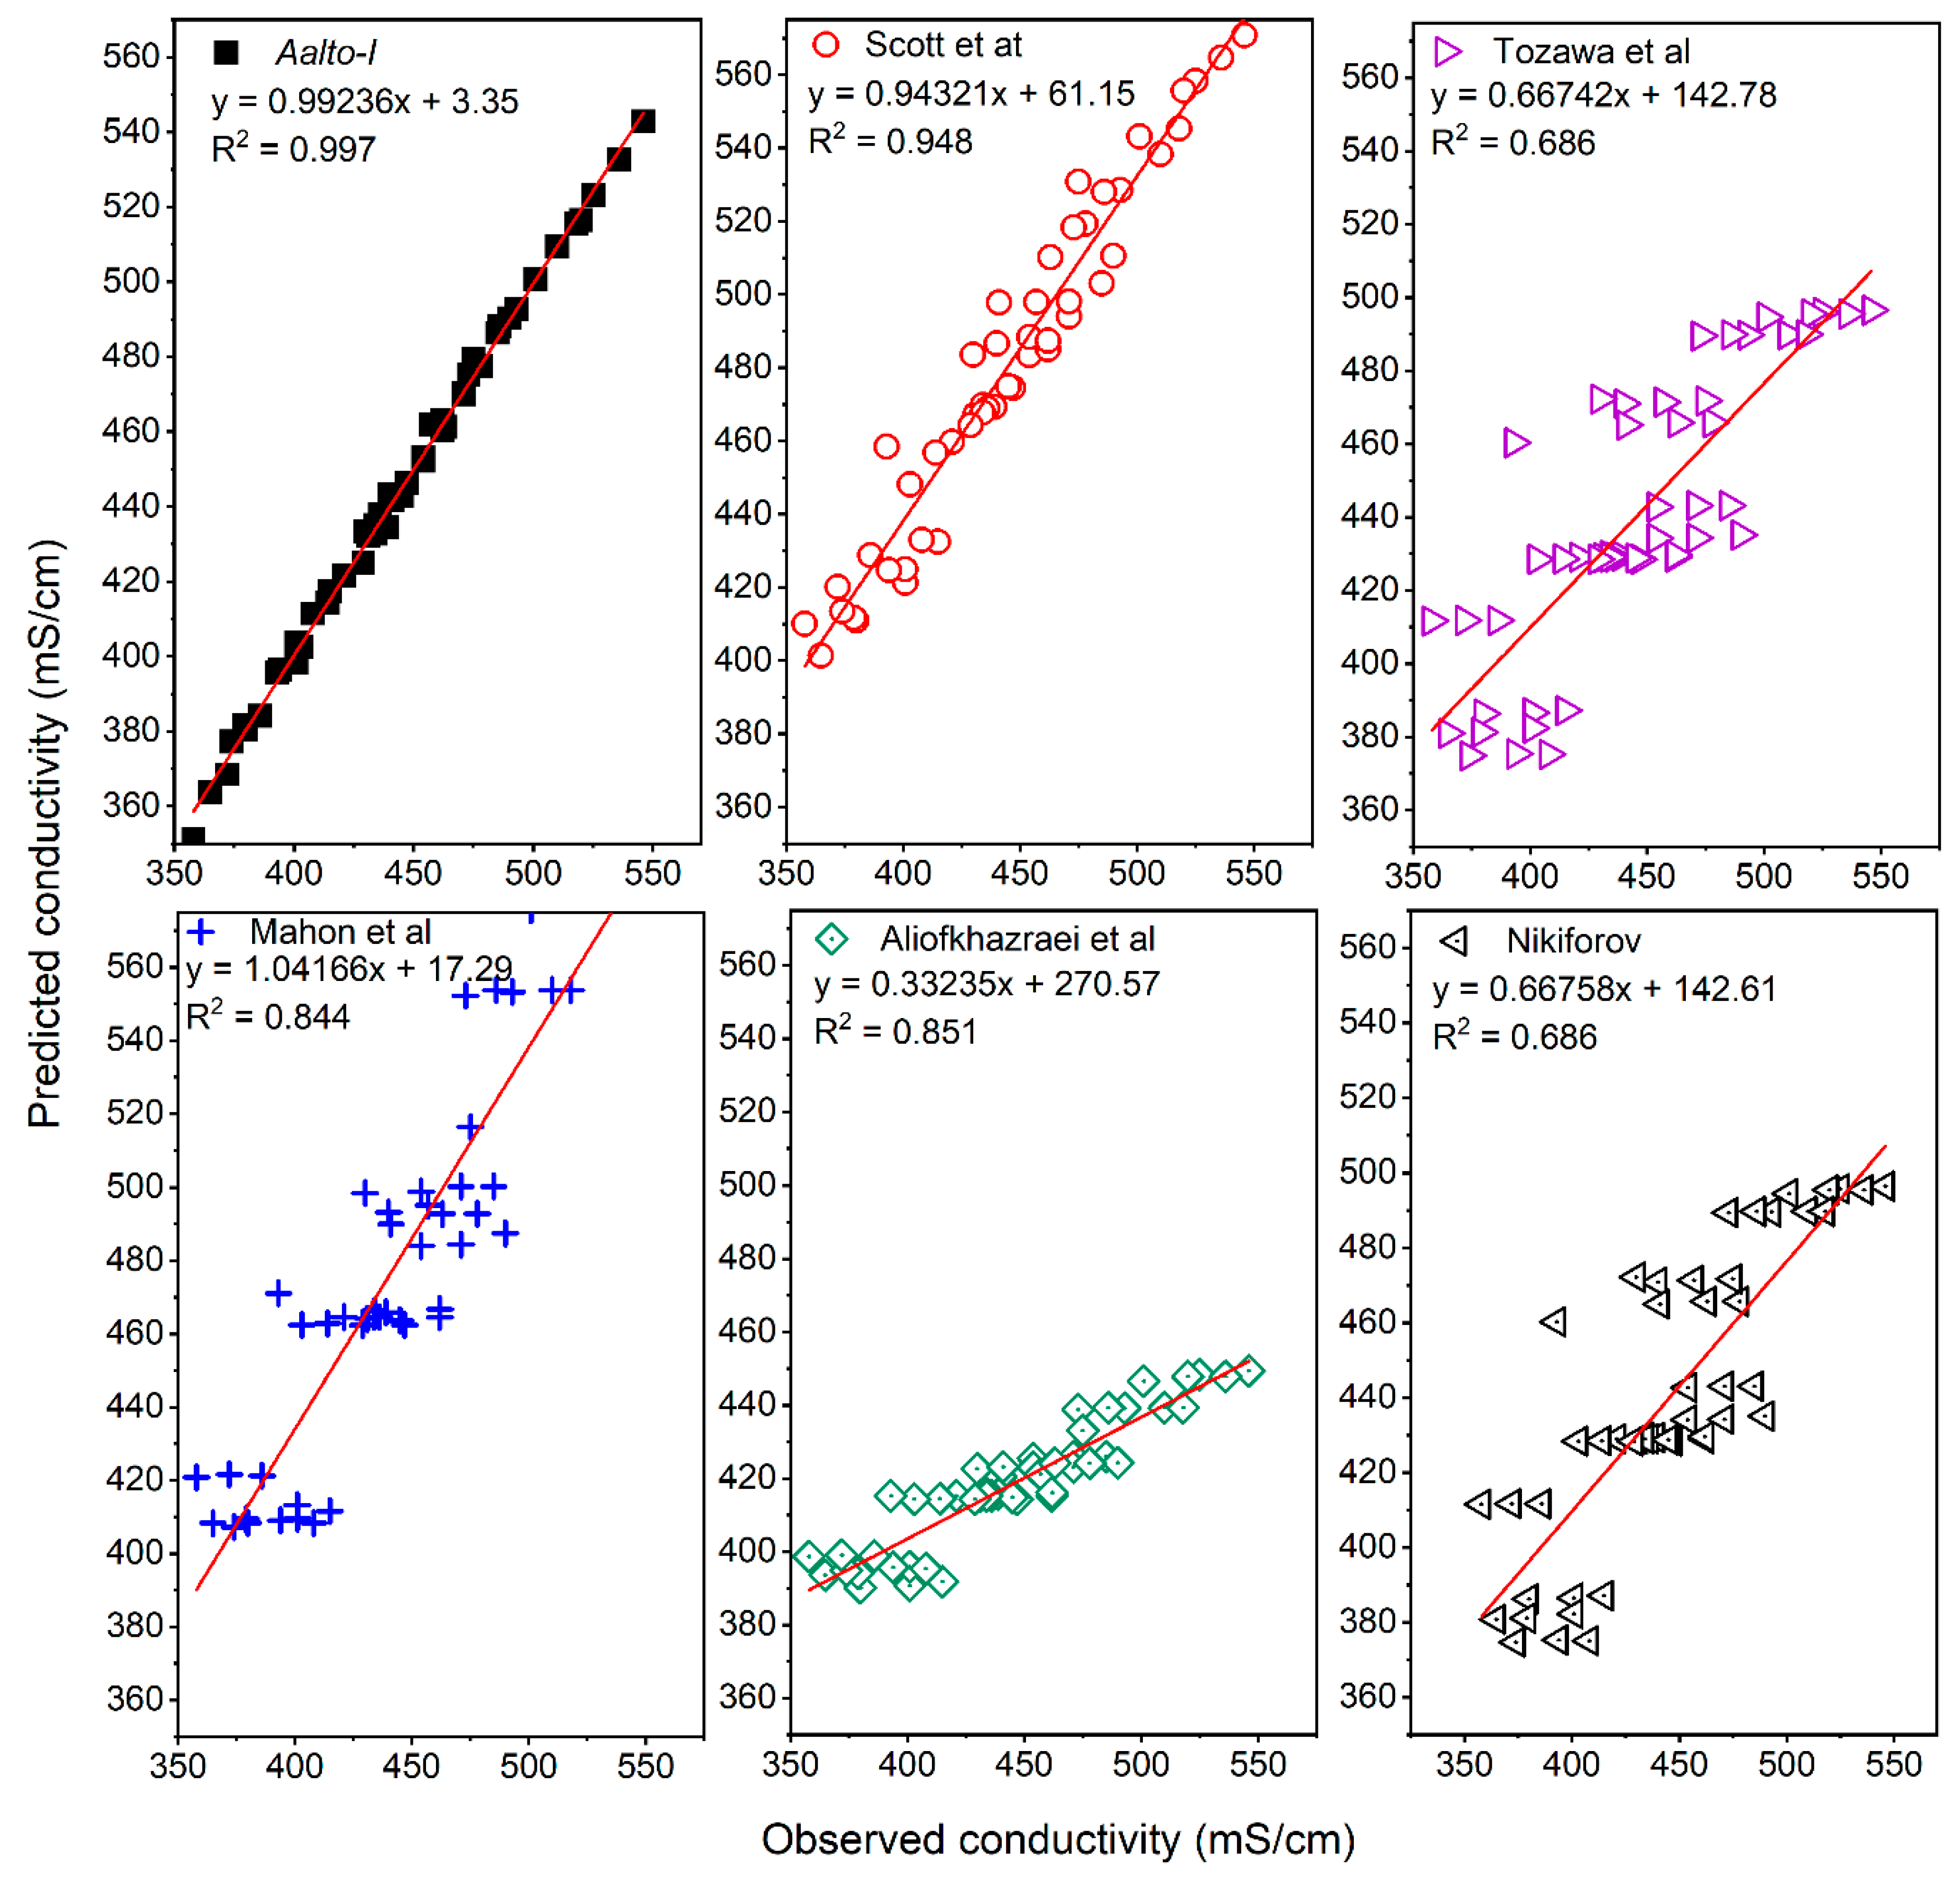
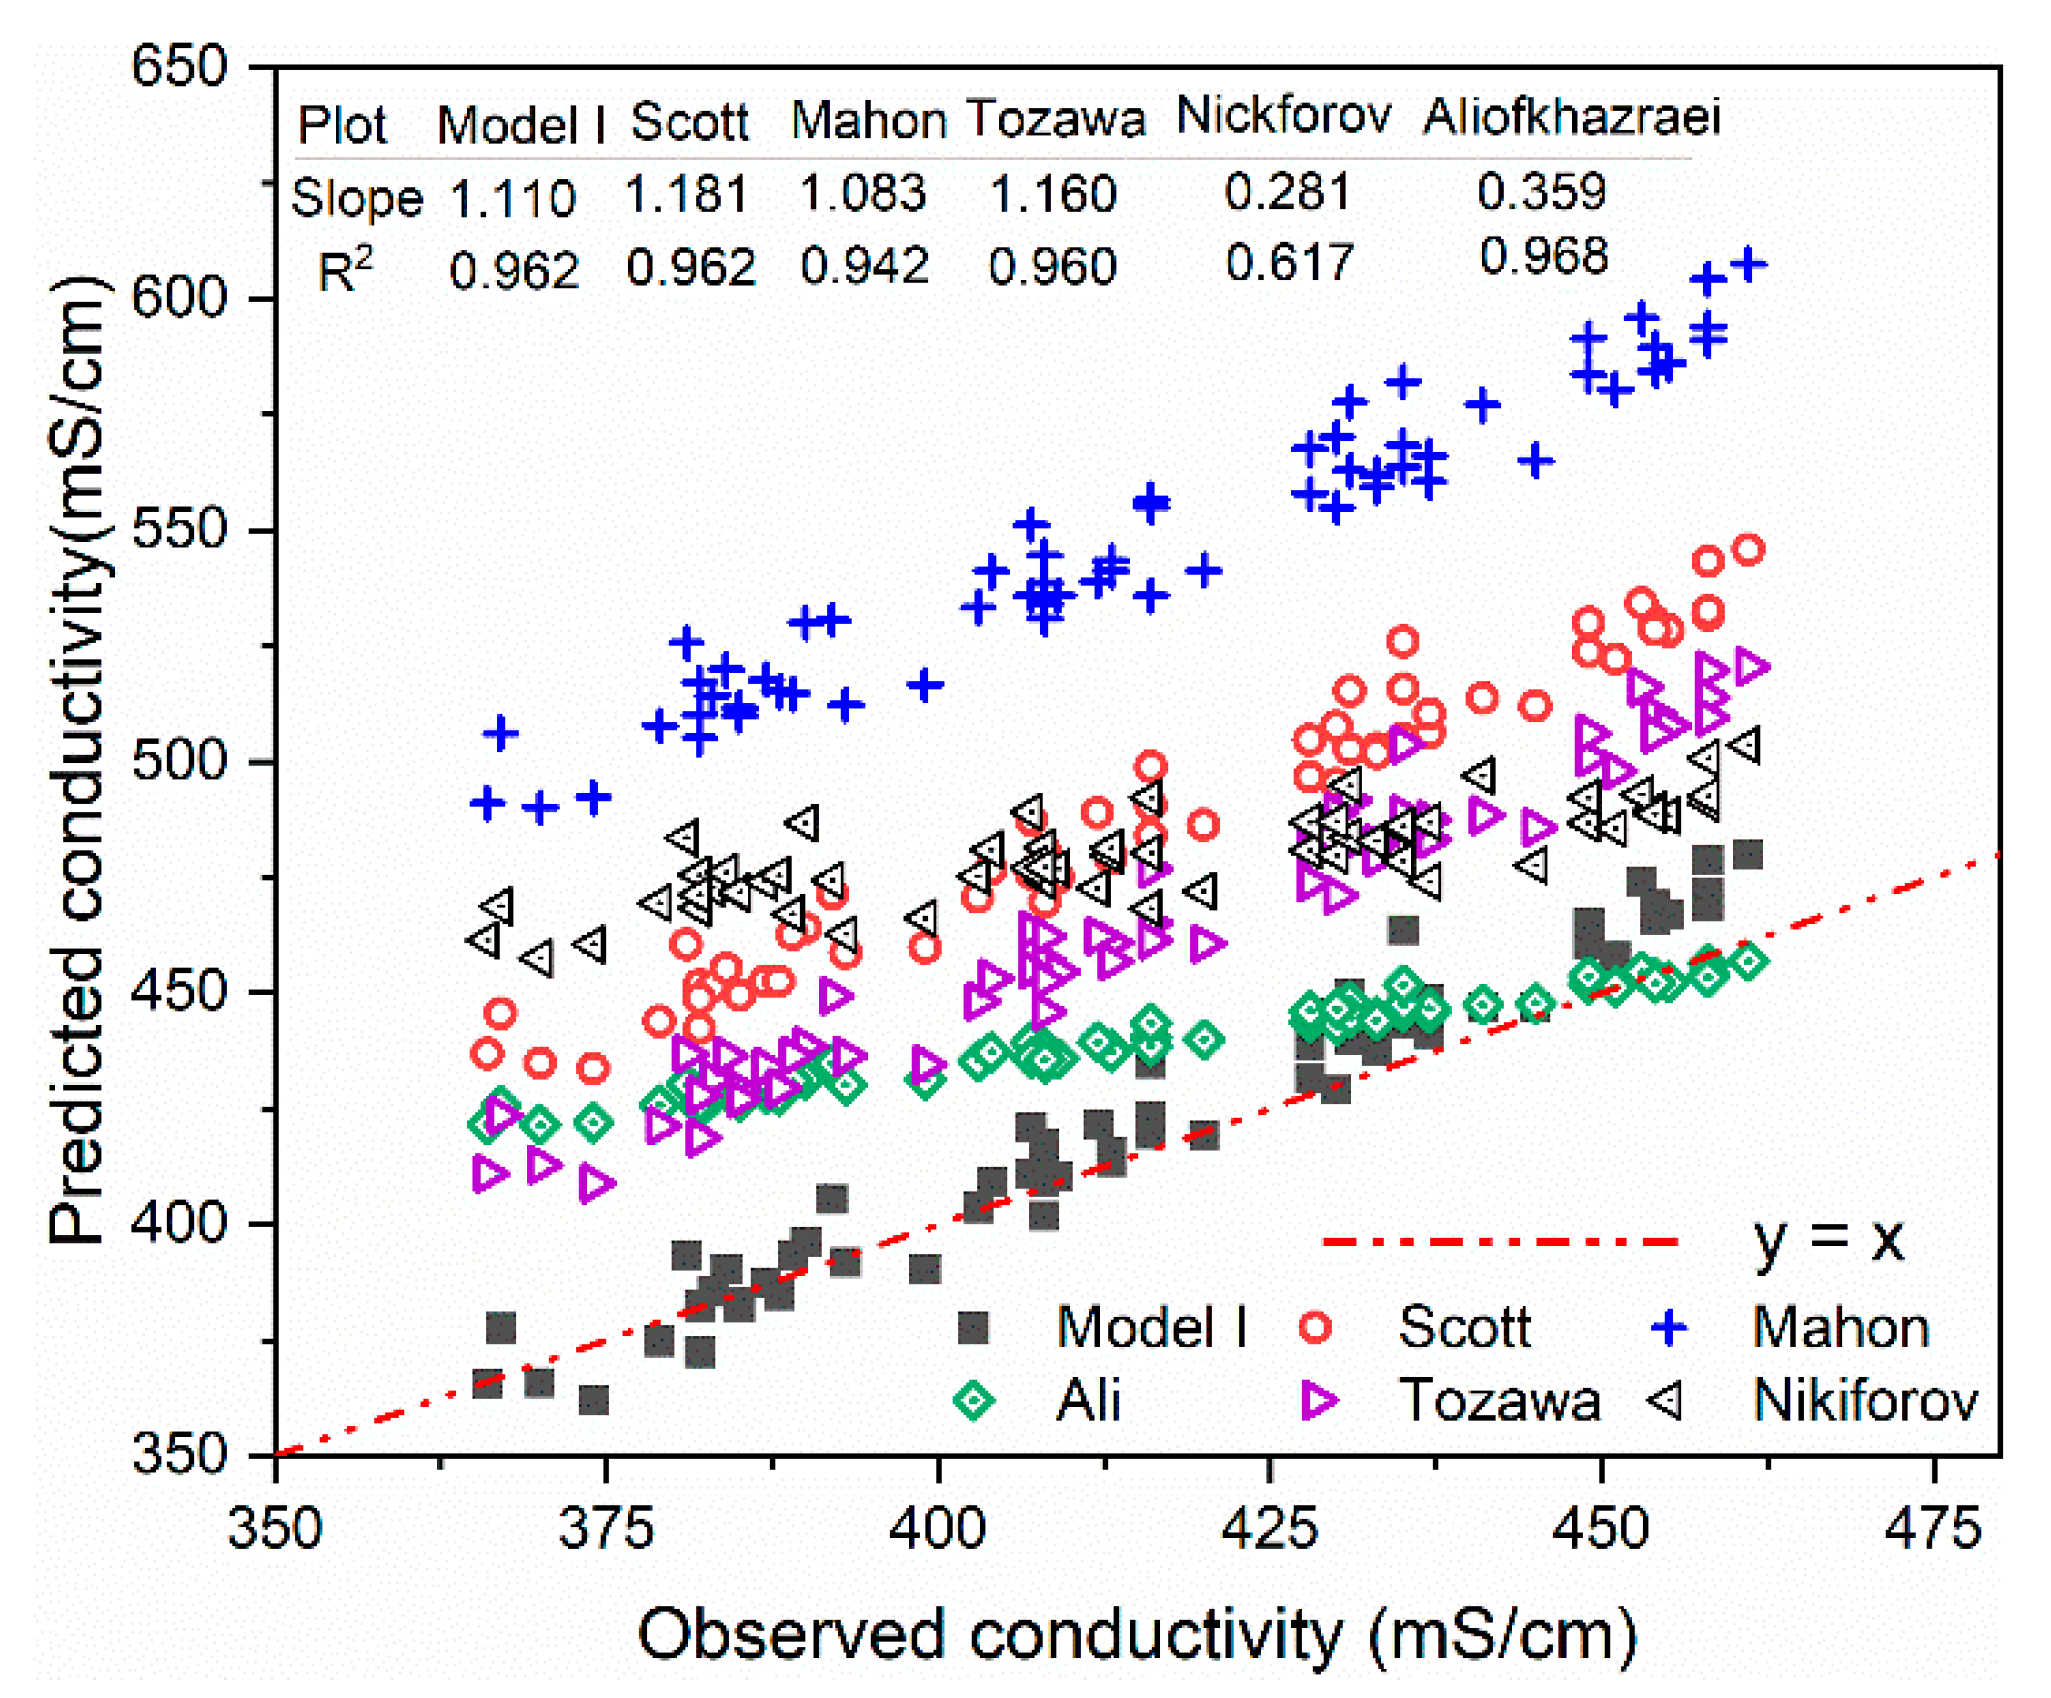
3.1. Aalto Conductivity Models
3.2. Comparison of Models with Synthetic Solutions
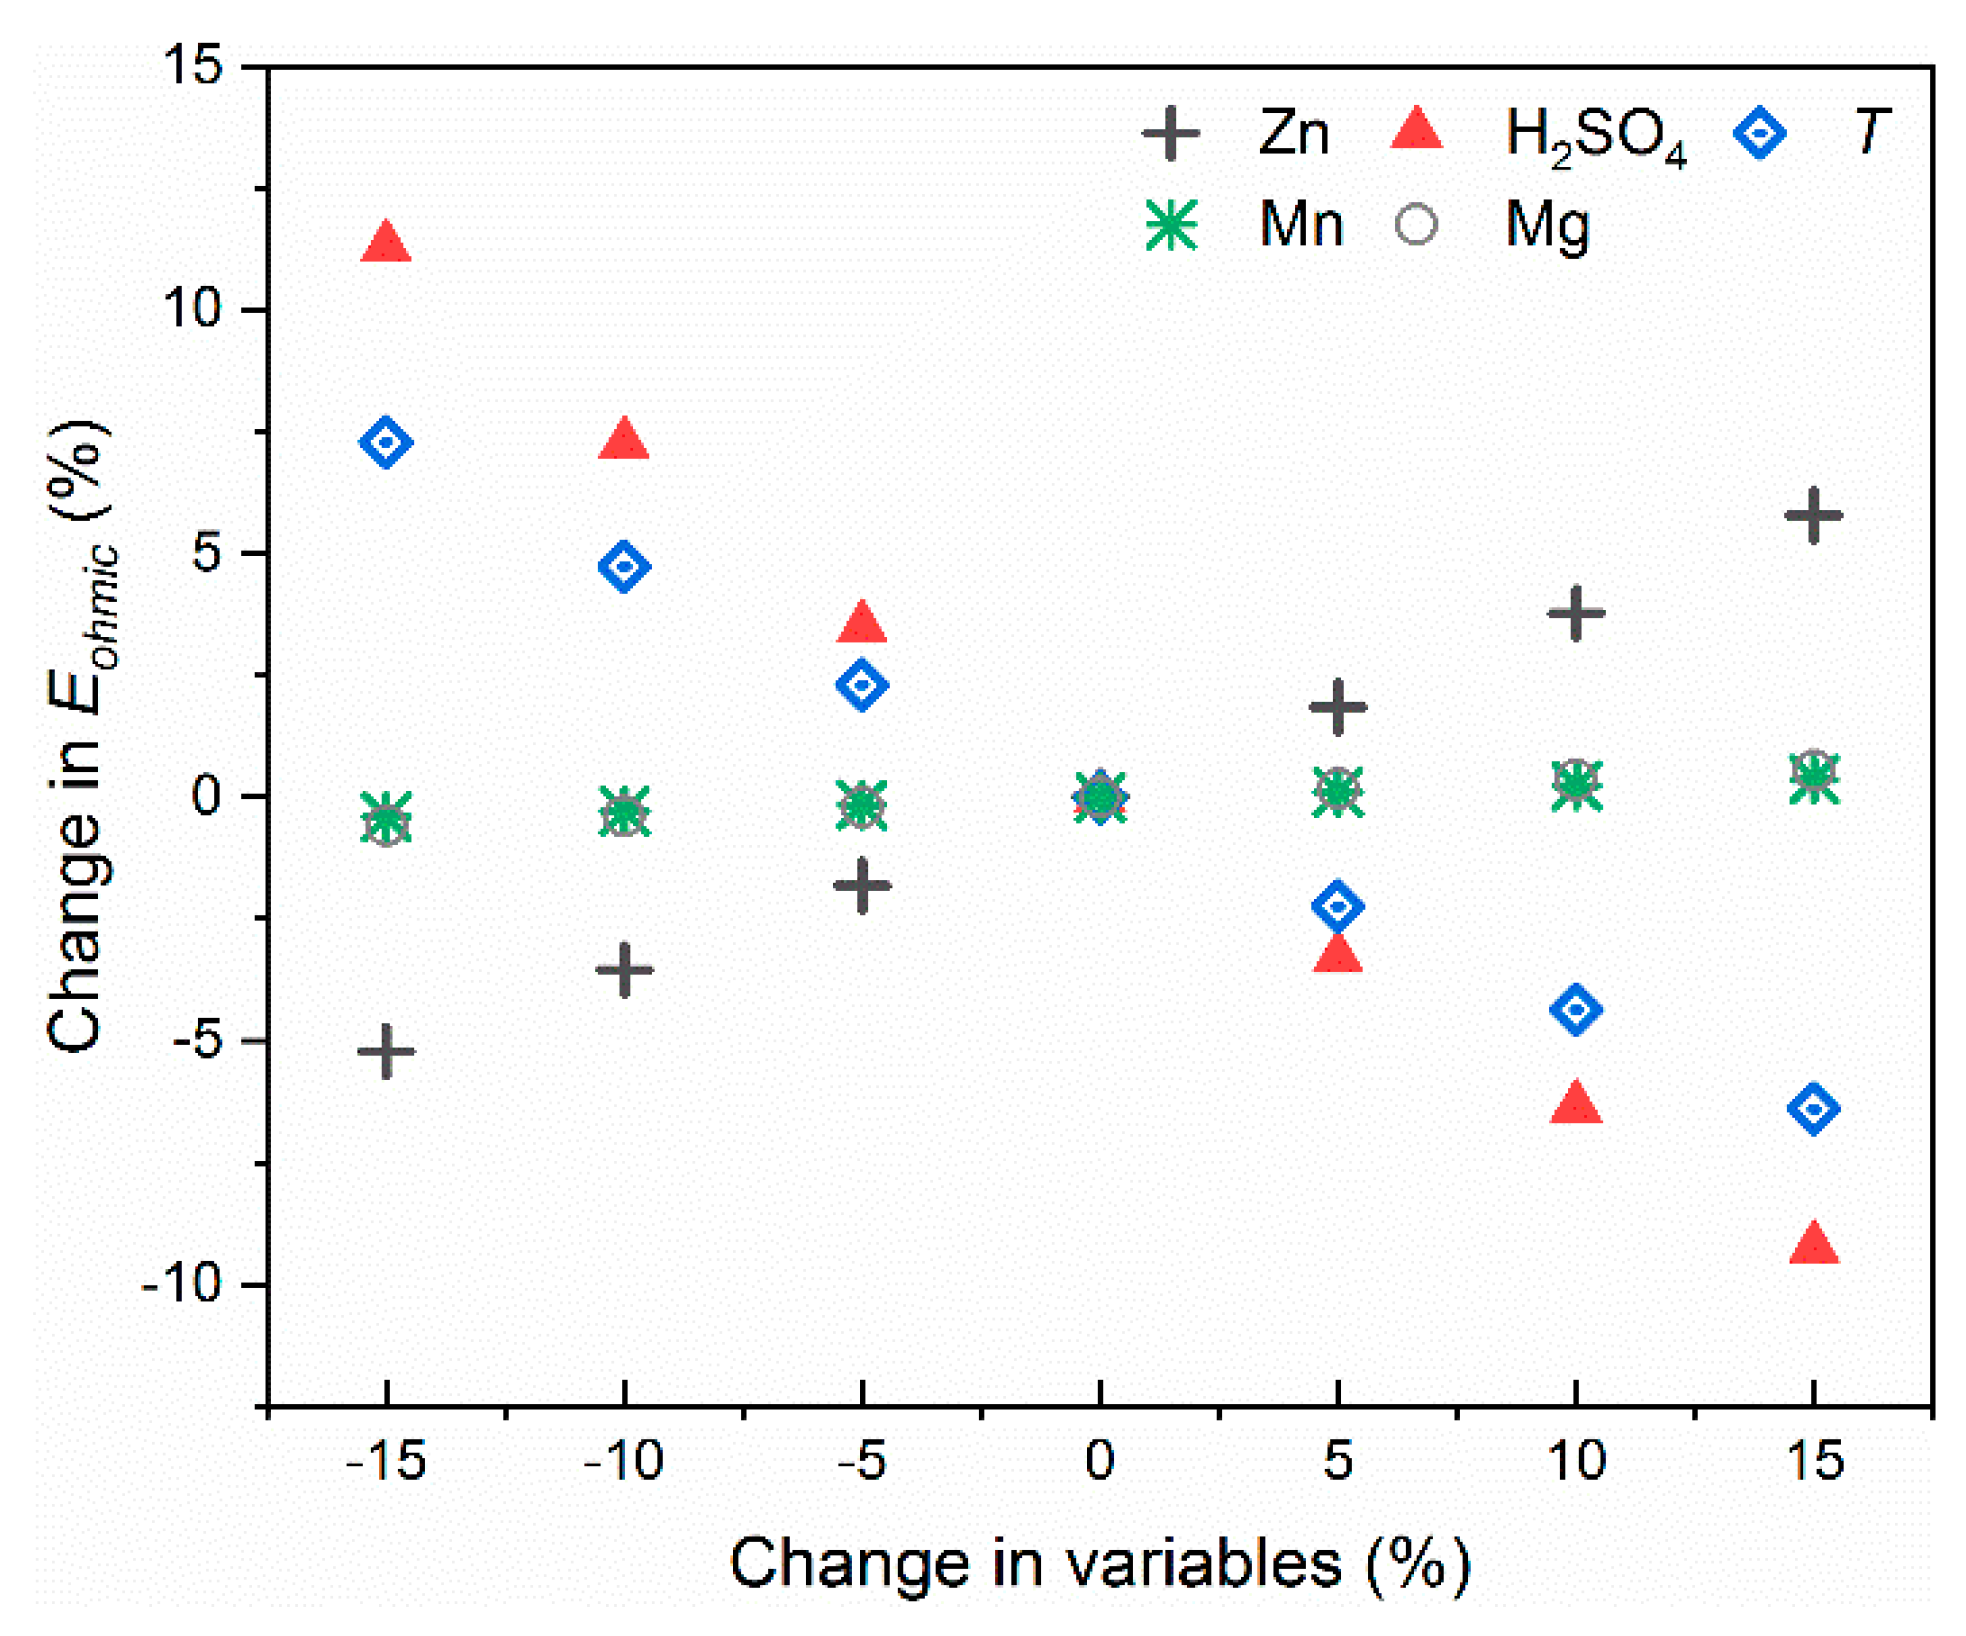
3.3. Industrial Validation
3.4. Model Utilization
4. Conclusions
Supplementary Materials
Author Contributions
Funding
Data Availability Statement
Acknowledgments
Conflicts of Interest
References
- O’Keefe, T.J. Zinc electrowinning-short course. In Lead Zinc 2000 Symposium; John Wiley & Sons: Pittsburgh, PA, USA, 2000. [Google Scholar]
- Stefanov, Y.; Dobrev, T. Potentiodynamic and electronmicroscopy investigations of lead–cobalt alloy coated lead composite anodes for zinc electrowinning. Trans. IMF 2005, 83, 296–299. [Google Scholar] [CrossRef]
- Jin, L.; Huang, H.; Fei, Y.; Yang, H.; Zhang, H.; Guo, Z. Polymer anode used in hydrometallurgy: Anodic behaviour of PANI/CeO2/WC anode from sulfate electrolytes. Hydrometallurgy 2018, 176, 201–207. [Google Scholar] [CrossRef]
- Rashkov, S.; Dobrev, T.; Noncheva, Z.; Stefanov, Y.; Rashkova, B.; Petrova, M. Lead–cobalt anodes for electrowinning of zinc from sulphate electrolytes. Hydrometallurgy 1999, 52, 223–230. [Google Scholar] [CrossRef]
- Karbasi, M.; Alamdari, E.K.; Dehkordi, E.A. Electrochemical performance of PbCo composite anode during zinc electrowinning. Hydrometallurgy 2019, 183, 51–59. [Google Scholar] [CrossRef]
- Li, H.; Chen, Z.; Yu, Q.; Zhu, W.; Cui, W. Effects of tungsten carbide on the electrocatalytic activity of PbO2-WC composite inert anodes during zinc electrowinning. J. Electrochem. Soc. 2017, 164, H1064–H1071. [Google Scholar] [CrossRef]
- Zhang, C.; Liu, J.; Chen, B. Effect of CeO2 and graphite powder on the electrochemical performance of Ti/PbO2 anode for zinc electrowinning. Ceram. Int. 2018, 44, 19735–19742. [Google Scholar] [CrossRef]
- Chen, B.; Wang, S.; Liu, J.; Huang, H.; Dong, C.; He, Y.; Yan, W.; Guo, Z.; Xu, R.; Yang, H. Corrosion resistance mechanism of a novel porous Ti/Sn-Sb-RuOx/β-PbO2 anode for zinc electrowinning. Corros. Sci. 2018, 144, 136–144. [Google Scholar] [CrossRef]
- Zhang, T.; Morimitsu, M. A novel oxygen evolution anode for electrowinning of non-ferrous metals. In Electrometallurgy 2012; John Wiley & Sons, Ltd.: Pittsburgh, PA, USA, 2012; pp. 29–34. ISBN 978-1-118-37135-0. [Google Scholar]
- Morimitsu, M. Performance and commercialization of the smart anode, MSATM, for environmentally friendly electrometallurgical process. In Electrometallurgy 2012; John Wiley & Sons, Ltd.: Pittsburgh, PA, USA, 2012; pp. 49–54. ISBN 978-1-118-37135-0. [Google Scholar]
- Ivanov, I.; Stefanov, Y.; Noncheva, Z.; Petrova, M.; Dobrev, T.; Mirkova, L.; Vermeersch, R.; Demaerel, J.-P. Insoluble anodes used in hydrometallurgy: Part II. anodic behaviour of lead and lead-alloy anodes. Hydrometallurgy 2000, 57, 125–139. [Google Scholar] [CrossRef]
- Ivanov, I.; Stefanov, Y.; Noncheva, Z.; Petrova, M.; Dobrev, T.; Mirkova, L.; Vermeersch, R.; Demaerel, J.-P. Insoluble anodes used in hydrometallurgy: Part I. corrosion resistance of lead and lead alloy anodes. Hydrometallurgy 2000, 57, 109–124. [Google Scholar] [CrossRef]
- Alfantazi, A.M.; Dreisinger, D.B. The role of zinc and sulfuric acid concentrations on zinc electrowinning from industrial sulfate based electrolyte. J. Appl. Electrochem. 2001, 31, 641–646. [Google Scholar] [CrossRef]
- Brett, C.M.A.; Brett, A.M.O. Electrochemistry: Principles, Methods, and Applications; Oxford University Press: Oxford, UK, 1993; ISBN 978-0-19-855388-5. [Google Scholar]
- Aliofkhazraei, M.; Alamdari, E.K.; Zamanzade, M.; Salasi, M.; Behrouzghaemi, S.; Heydari, J.; Haghshenas, D.F.; Zolala, V. Empirical equations for electrical conductivity and density of Zn, Cd and Mn sulphate solutions in the range of electrowinning and electrorefining electrolytes. J. Mater. Sci. 2007, 42, 9622–9631. [Google Scholar] [CrossRef]
- Mahon, M.; Wasik, L.; Alfantazi, A. Development and implementation of a zinc electrowinning process simulation. J. Electrochem. Soc. 2012, 159, D486–D492. [Google Scholar] [CrossRef]
- Nikiforov, A.F.; Natarova, E.L. A formula to calculate the specific conductivity of zinc electrolyte. Tsvetnaya Metall. 1971, 44, 28. [Google Scholar]
- Scott, A.C.; Pitblado, R.M.; Barton, G.W.; Ault, A.R. Experimental determination of the factors affecting zinc electrowinning efficiency. J. Appl. Electrochem. 1988, 18, 120–127. [Google Scholar] [CrossRef]
- Tozawa, K.; Umetsu, Y.; Su, Q. World Zinc ’93, Proceedings of the International Symposium on Zinc. Australasian Institute of Mining and Metallurgy Publication Series 7/93, Hobart, Australia, 10–13 October 1993; Australasian Institute of Mining and Metallurgy: Parkville, Australia, 1993. [Google Scholar]
- Aji, A.T.; Kalliomäki, T.; Wilson, B.P.; Aromaa, J.; Lundström, M. Modelling the effect of temperature and free acid, silver, copper and lead concentrations on silver electrorefining electrolyte conductivity. Hydrometallurgy 2016, 166, 154–159. [Google Scholar] [CrossRef] [Green Version]
- Lehtiniemi, I.; Kalliomäki, T.; Rintala, L.; Latostenmaa, P.; Aromaa, J.; Forsén, O.; Lundström, M. Validation of electrolyte conductivity models in industrial copper electrorefining. Min. Metall. Explor. 2018, 35, 117–124. [Google Scholar] [CrossRef]
- Kalliomäki, T.; Aromaa, J.; Lundström, M. Modeling the effect of composition and temperature on the conductivity of synthetic copper electrorefining electrolyte. Minerals 2016, 6, 59. [Google Scholar] [CrossRef] [Green Version]
- Eriksson, L.; Johansson, E.; Kettaneh-Wold, N.; Wikström, C.; Wold, S. Design of Experiments: Principles and Applications; MKS Umetrics AB: Umeå, Sweden, 2008; Volume 2008, p. 78. [Google Scholar]
- Aliofkhazraei, M. Study of electrical conductivity for electrolytes of electrowinning and electrorefining processes. Russ. J. Non-ferrous Metals 2009, 50, 97–101. [Google Scholar] [CrossRef]
- Barton, G.W.; Scott, A.C. A Validated mathematical model for a zinc electrowinning cell. J. Appl. Electrochem. 1992, 22, 104–115. [Google Scholar] [CrossRef]
- Hinatsu, J.T.; Tran, V.D.; Foulkes, F.R. Electrical conductivities of aqueous ZnSO4−H2SO4 solutions. J. Appl. Electrochem. 1992, 22, 215–223. [Google Scholar] [CrossRef]
- MacKinnon, D.J.; Brannen, J.M. Effect of manganese, magnesium, sodium and potassium sulphates on zinc electrowinning from synthetic acid sulphate electrolytes. Hydrometallurgy 1991, 27, 99–111. [Google Scholar] [CrossRef]
- Mahon, M.; Alfantazi, A. Manganese consumption during zinc electrowinning using a dynamic process simulation. Hydrometallurgy 2014, 150, 184–191. [Google Scholar] [CrossRef]
- Mohammadi, M.; Alfantazi, A. Evaluation of manganese dioxide deposition on lead-based electrowinning anodes. Hydrometallurgy 2016, 159, 28–39. [Google Scholar] [CrossRef]
- Booster, J.L.; Van Sandwijk, A.; Reuter, M.A. Magnesium removal in the electrolytic zinc industry. Miner. Eng. 2000, 13, 517–526. [Google Scholar] [CrossRef] [Green Version]
- Georgalli, G.A.; Eksteen, J.J.; Pelser, M.; Lorenzen, L.; Onyango, M.S.; Aldrich, C. Fluoride based control of Ca and Mg concentrations in high ionic strength base metal sulphate solutions in hydrometallurgical circuits. Miner. Eng. 2008, 21, 200–212. [Google Scholar] [CrossRef]
- Sharma, K.D. An approach to reduce magnesium from zinc electrolyte with recovery of zinc from disposed residue of an effluent treatment plant. Hydrometallurgy 1990, 24, 407–415. [Google Scholar] [CrossRef]
- Tian, L.; Xie, G.; Yu, X.-H.; Li, R.-X.; Zeng, G.-S. Effect of magnesium ion on the zinc electrodeposition from acidic sulfate electrolyte. Met. Mat Trans. A 2012, 43, 555–560. [Google Scholar] [CrossRef]
- Sorour, N.; Zhang, W.; Gabra, G.; Ghali, E.; Houlachi, G. Electrochemical studies of ionic liquid additives during the zinc electrowinning process. Hydrometallurgy 2015, 157, 261–269. [Google Scholar] [CrossRef]
- Zhang, Q.; Hua, Y. Effects of 1-Butyl-3-Methylimidazolium hydrogen sulfate-[BMIM]HSO4 on zinc electrodeposition from acidic sulfate electrolyte. J. Appl. Electrochem. 2009, 39, 261–267. [Google Scholar] [CrossRef]
- Tripathy, B.C.; Das, S.C.; Singh, P.; Hefter, G.T.; Misra, V.N. Zinc electrowinning from acidic sulphate solutions part IV1Part I, part II and part III Are Published in J. Appl. Electrochem, 27 (1997) 673, 28 (1998) 915, 29 (1999) 1229, respectively.1: Effects of Perfluorocarboxylic Acids. J. Electroanal. Chem. 2004, 565, 49–56. [Google Scholar] [CrossRef]
- Wu, X.; Liu, Z.; Liu, X. The effects of additives on the electrowinning of zinc from sulphate solutions with high fluoride concentration. Hydrometallurgy 2014, 141, 31–35. [Google Scholar] [CrossRef]
- Alfantazi, A.M.; Dreisinger, D.B. An investigation on the effects of orthophenylene diamine and sodium lignin sulfonate on zinc electrowinning from industrial electrolyte. Hydrometallurgy 2003, 69, 99–107. [Google Scholar] [CrossRef]
- Majuste, D.; Martins, E.L.C.; Souza, A.D.; Nicol, M.J.; Ciminelli, V.S.T. Role of organic reagents and impurity in zinc electrowinning. Hydrometallurgy 2015, 152, 190–198. [Google Scholar] [CrossRef] [Green Version]
- Yanqing, L.; Liangxing, J.; Jie, L.; Shuiping, Z.; Xiaojun, L.; Hongjian, P.; Yexiang, L. A novel porous Pb–Ag anode for energy-saving in zinc electrowinning: Part II: Preparation and pilot plant tests of large size anode. Hydrometallurgy 2010, 102, 81–86. [Google Scholar] [CrossRef]
- Bouzek, K. Current distribution at the electrodes in zinc electrowinning cells. J. Electrochem. Soc. 1995, 142, 64. [Google Scholar] [CrossRef]
- Huang, H.; Zhou, J.; Chen, B.; Guo, Z. Polyaniline anode for zinc electrowinning from sulfate electrolytes. Trans. Nonferrous Met. Soc. China 2010, 20, s288–s292. [Google Scholar] [CrossRef]
- Chen, B.; Yan, W.; He, Y.; Huang, H.; Leng, H.; Guo, Z.; Liu, J. Influence of F-doped β-PbO2 conductive ceramic layer on the anodic behavior of 3D Al/Sn Rod Pb−0.75%Ag for zinc electrowinning. J. Electrochem. Soc. 2019, 166, E119–E128. [Google Scholar] [CrossRef]
- Wang, S.; Zhou, X.; Chi-Yuan, M.; Long, B.; Wang, H.; Tang, J.-J.; Yang, J. Electrochemical properties of Pb-0.6 wt% Ag powder-pressed alloy in sulfuric acid electrolyte containing Cl−/Mn2+ ions. Hydrometallurgy 2018, 177, 218–226. [Google Scholar] [CrossRef]


| Parameters | Levels | Units |
|---|---|---|
| [Zn2+ ] | 50, 60, 70 | g/dm3 |
| [H2SO4 ] | 150, 175, 200 | g/dm3 |
| [Mn2+ ] | 0, 4, 8 | g/dm3 |
| [Mg2+ ] | 0, 2, 4 | g/dm3 |
| T | 30, 35, 40 | °C |
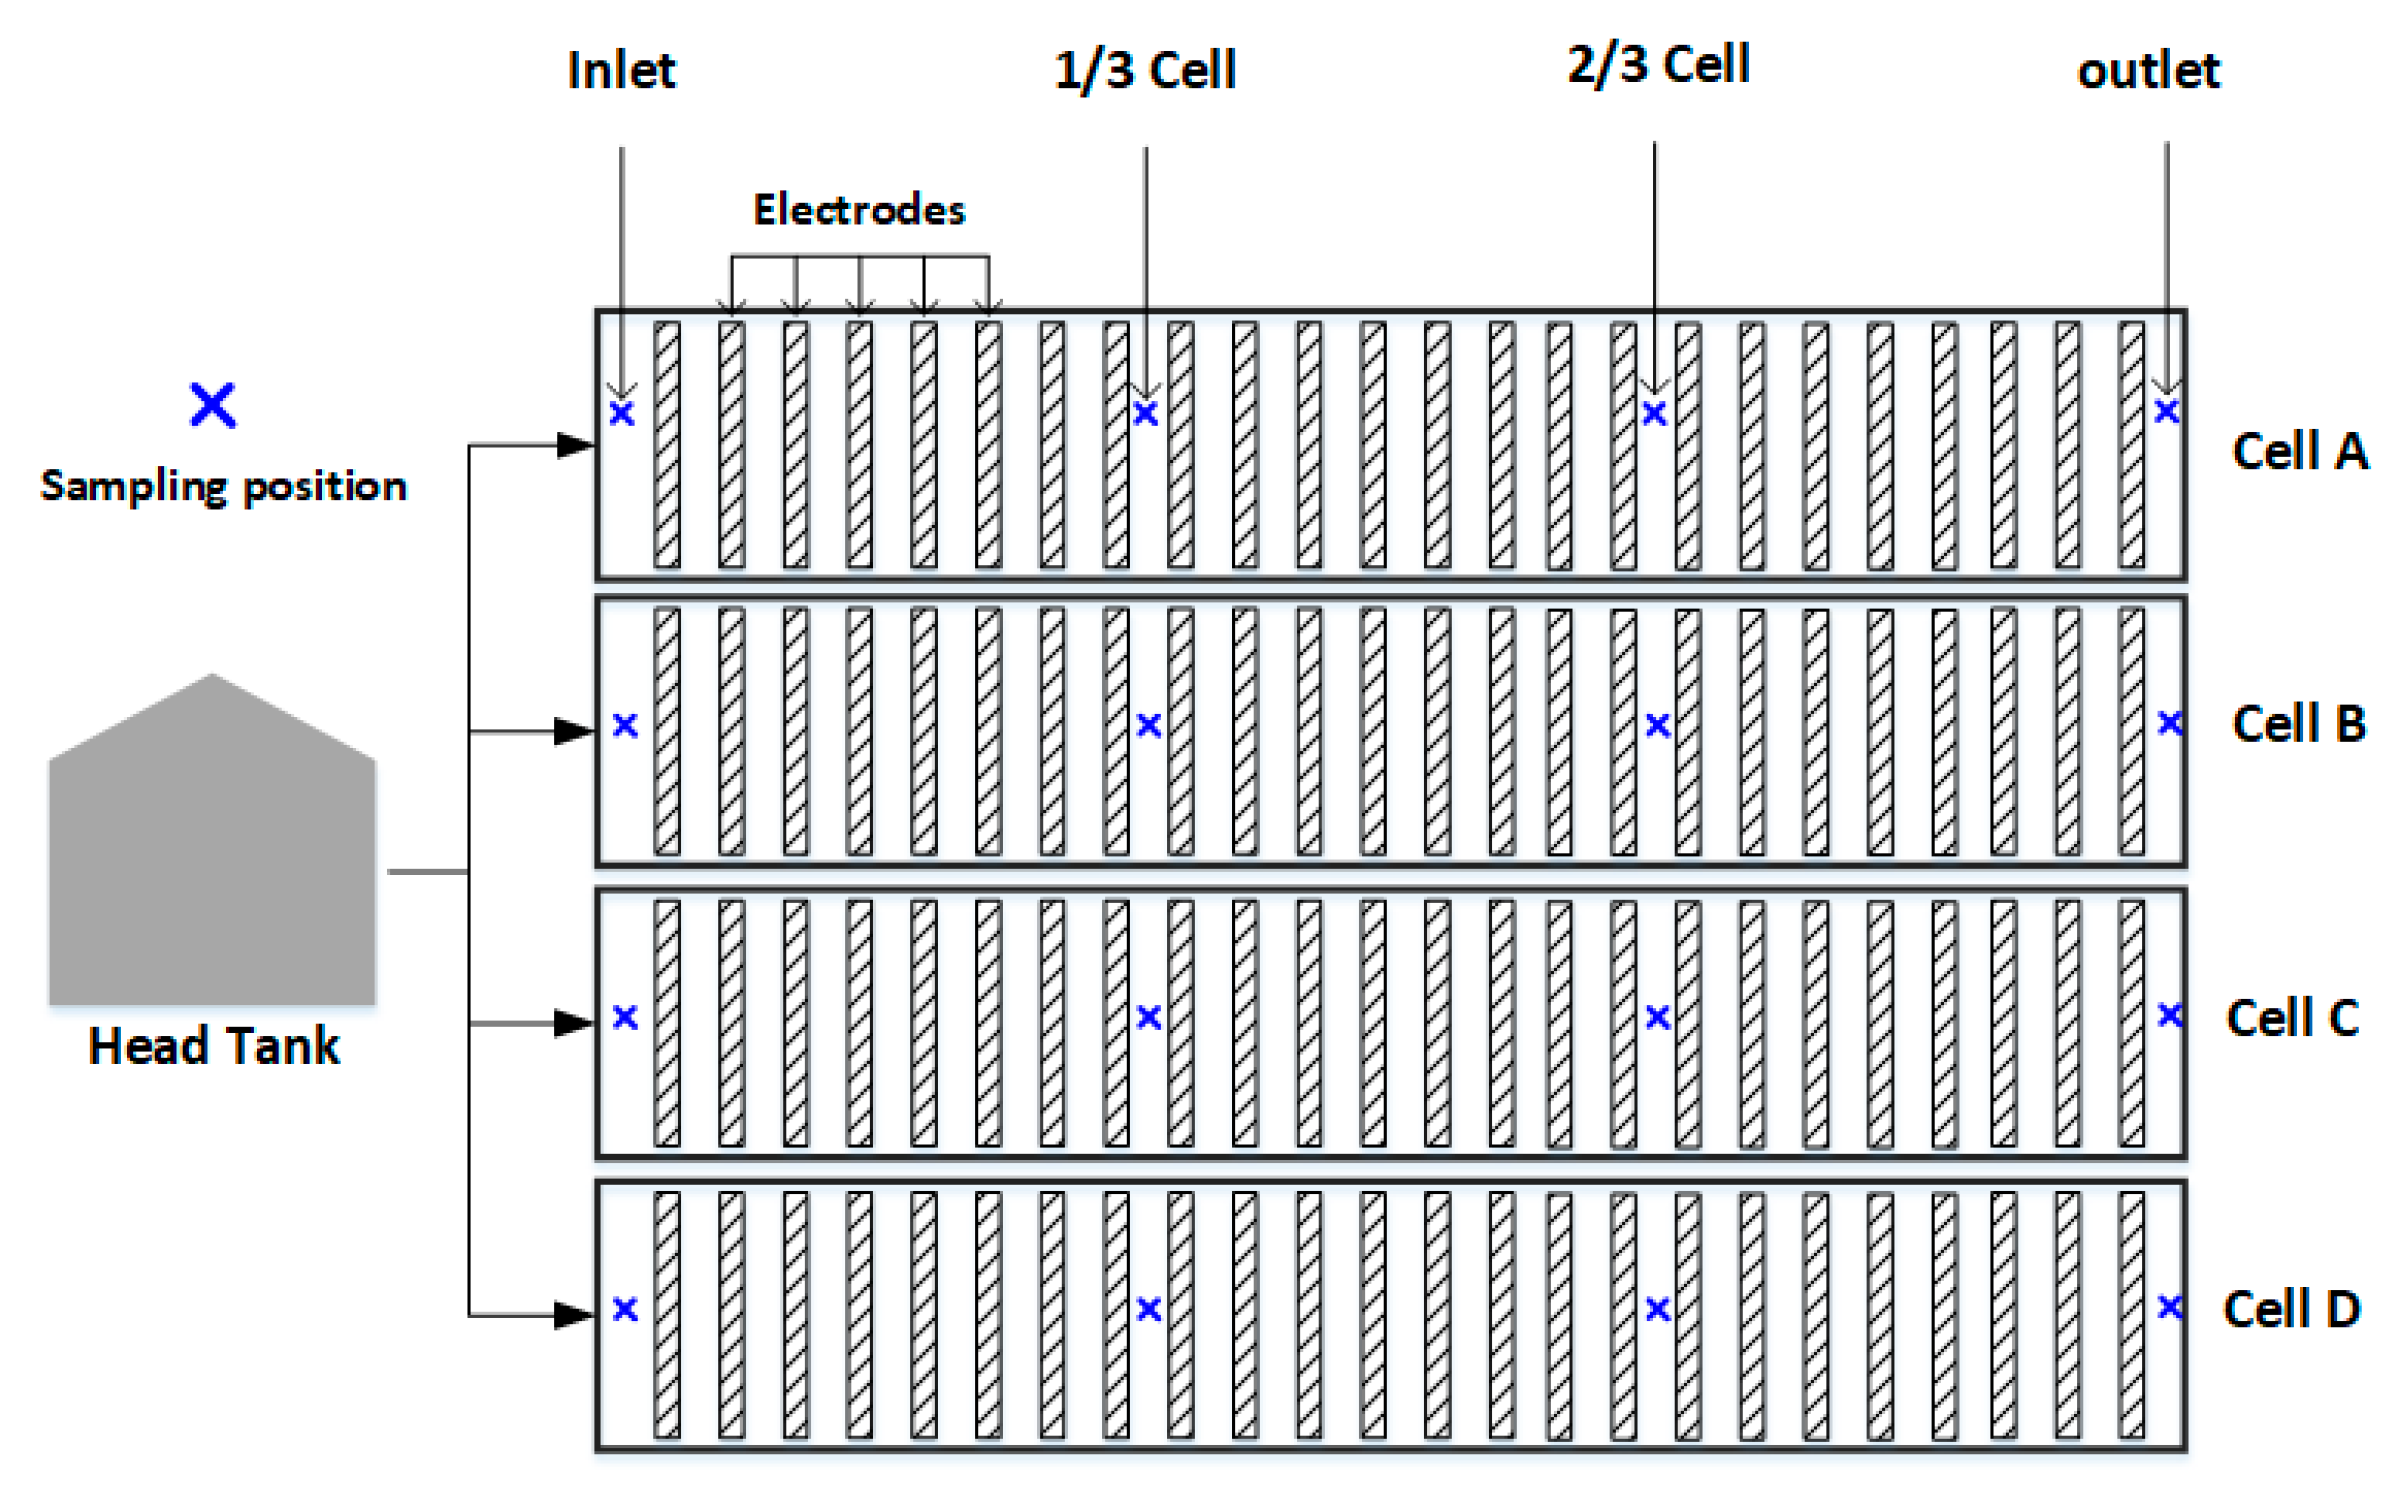
| Sample ID | Cell | Position | Composition (g/dm3) | |||||
|---|---|---|---|---|---|---|---|---|
| Zn | H2SO4 | Mg | Mn | Na | Ca | |||
| 1 | A | inlet | 52.8 | 189.6 | 11.8 | 7.3 | 2.3–2.5 | 0.4 |
| 2 | 1/3 | 49.4 | 192.2 | |||||
| 3 | 2/3 | 49.0 | 194.9 | |||||
| 4 | outlet | 50.3 | 192.2 | |||||
| 5 | B | inlet | 52.6 | 187.7 | 11.2 | 7.1 | ||
| 6 | 1/3 | 48.5 | 198.9 | |||||
| 7 | 2/3 | 48.5 | 193.2 | |||||
| 8 | outlet | 48.9 | 192.8 | |||||
| 9 | C | inlet | 54.3 | 191.0 | 11.2 | 7.2 | ||
| 10 | 1/3 | 47.2 | 194.1 | |||||
| 11 | 2/3 | 49.2 | 193.0 | |||||
| 12 | outlet | 50.1 | 193.7 | |||||
| 13 | D | inlet | 50.1 | 192.2 | 11.3 | 7.2 | ||
| 14 | 1/3 | 46.9 | 193.0 | |||||
| 15 | 2/3 | 49.4 | 195.3 | |||||
| 16 | outlet | 48.7 | 200.6 | |||||
| Parameters | Calculated Eohmic (V) | Ecell (V) | Ref. | Eohmic/Ecell (%) | ||||||
|---|---|---|---|---|---|---|---|---|---|---|
| [Zn] g/dm3 | [H2SO4] g/dm3 | T °C | Mn g/dm3 | Mg g/dm3 | l/ cm | j mA/cm2 | ||||
| 60 | 180 | 38 | 8 | 0 | 2.0 | 50 | 0.21 | 2.898 | [34] | 7.4 |
| 55 | 155 | 40 | 0 | 0 | 2.5 | 40 | 0.21 | 2.89 | [35] | 7.4 |
| 55 | 150 | 40 | 0 | 0 | 3.0 | 40 | 0.26 | 2.91–2.98 | [36] | 8.7 |
| 50 | 150 | 35 | 5 | 0 | 2.0 | 50 | 0.23 | 3.22–3.8 | [37] | 6.1 |
| 50 | 210 | 45 | 4.6 | 12.2 | 3.8 | 40 | 0.31 | 3.21 | [18] | 9.6 |
| 62 | 190 | 38 | 0 | 0 | 2.5 | 50 | 0.25 | 2.91–2.99 | [38] | 8.4–8.6 |
| 58 | 160 | 38 | 0 | 0 | 2.5 | 50 | 0.27 | 3.03 | [39] | 9 |
| 55 | 165 | 38–42 | 3.5 | 15.87 | 3 | 50 | 0.42–0.44 | 3.0–3.25 | [40] | 12.8–14.8 |
| 48–52 | 170–190 | 35 | 0 | 0 | 3.5 | 58 | 0.39–0.44 | 3.45 | [41] | 11.3–12.4 |
| 65 | 150 | 35 | 5 | 0 | 3.5 | 50 | 0.44 | 3.15 | [42] | 14.1 |
| 50 | 150 | 38 | 3 | 0 | 3.0 | 50 | 0.33 | 3.28–3.31 | [43] | 10 |
| 50 | 160 | 35 | 2 | 0 | 3.0 | 50 | 0.33 | 2.66–2.82 | [44] | 11.6–12.3 |
| 61.5 | 171 | 38 | 5.2 | 5.31 | 2.5 | 50 | 0.30 | 3.00–3.05 | [13] | 10.0–10.1 |
Publisher’s Note: MDPI stays neutral with regard to jurisdictional claims in published maps and institutional affiliations. |
© 2021 by the authors. Licensee MDPI, Basel, Switzerland. This article is an open access article distributed under the terms and conditions of the Creative Commons Attribution (CC BY) license (https://creativecommons.org/licenses/by/4.0/).
Share and Cite
Wang, Z.; Aji, A.T.; Wilson, B.P.; Jørstad, S.; Møll, M.; Lundström, M. Modelling the Effect of Solution Composition and Temperature on the Conductivity of Zinc Electrowinning Electrolytes. Metals 2021, 11, 1824. https://doi.org/10.3390/met11111824
Wang Z, Aji AT, Wilson BP, Jørstad S, Møll M, Lundström M. Modelling the Effect of Solution Composition and Temperature on the Conductivity of Zinc Electrowinning Electrolytes. Metals. 2021; 11(11):1824. https://doi.org/10.3390/met11111824
Chicago/Turabian StyleWang, Zulin, Arif Tirto Aji, Benjamin Paul Wilson, Steinar Jørstad, Maria Møll, and Mari Lundström. 2021. "Modelling the Effect of Solution Composition and Temperature on the Conductivity of Zinc Electrowinning Electrolytes" Metals 11, no. 11: 1824. https://doi.org/10.3390/met11111824