3.2. Microstructures after Post-SLM Heat Treatments
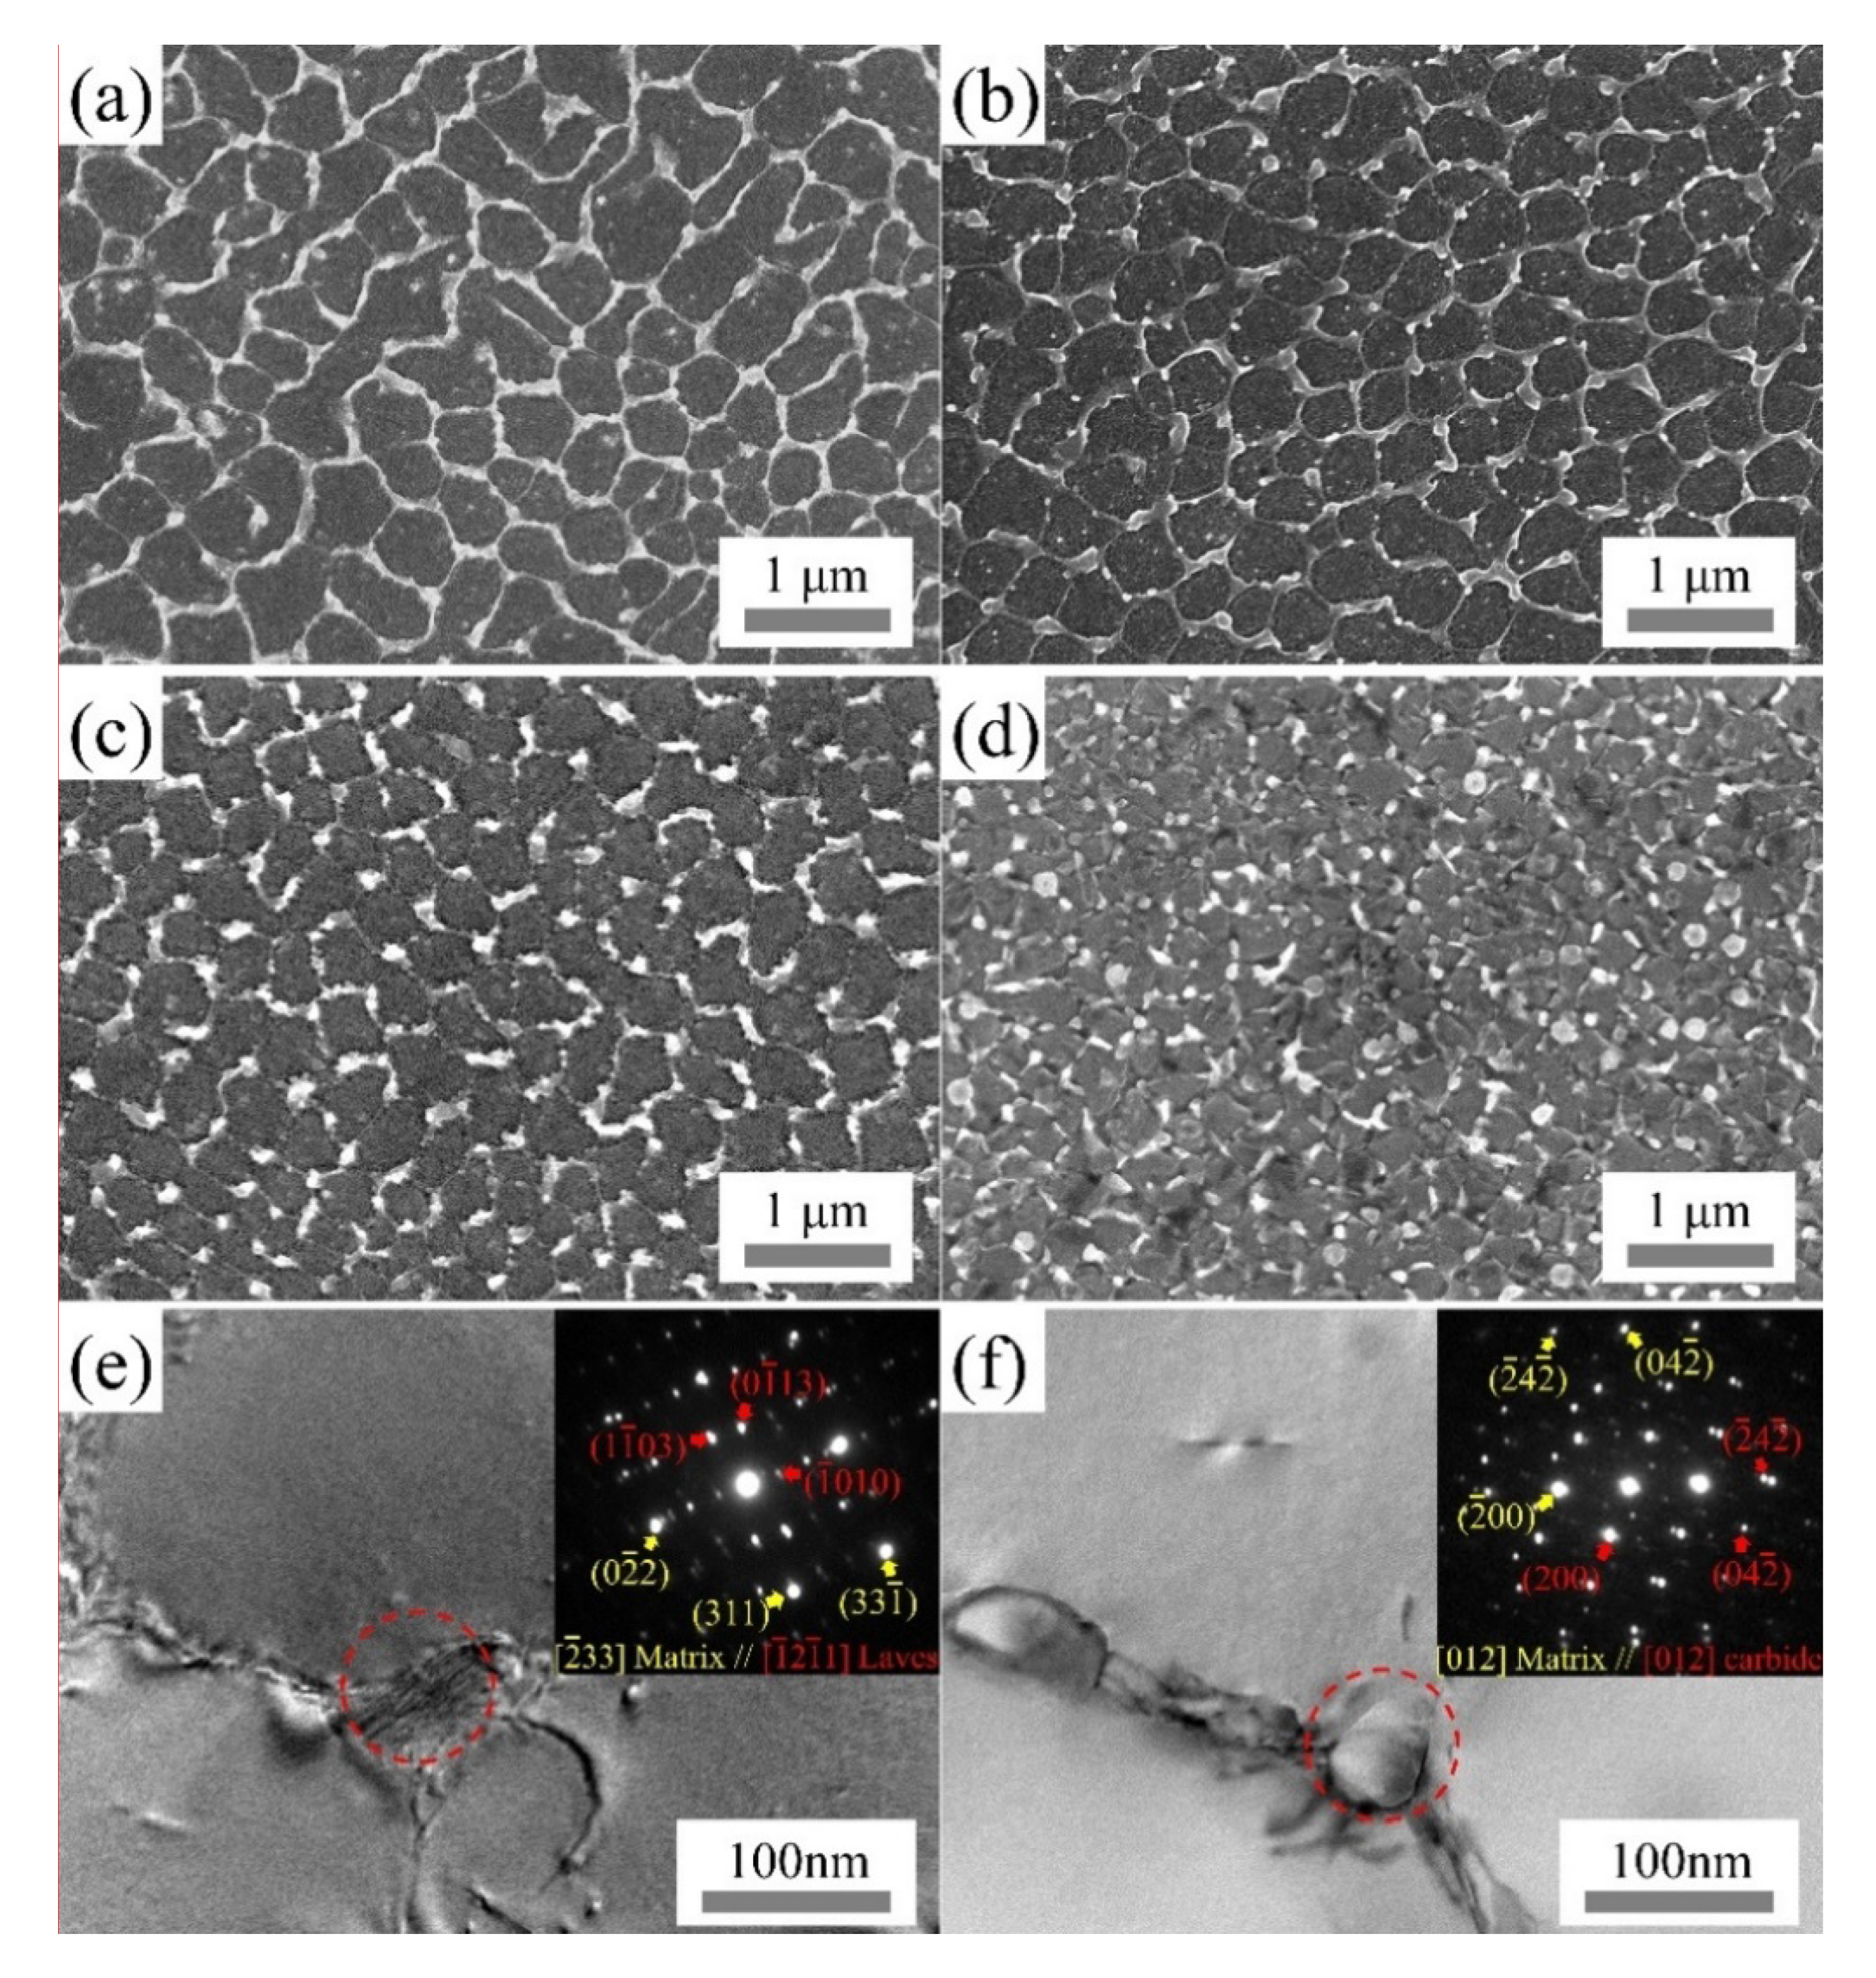
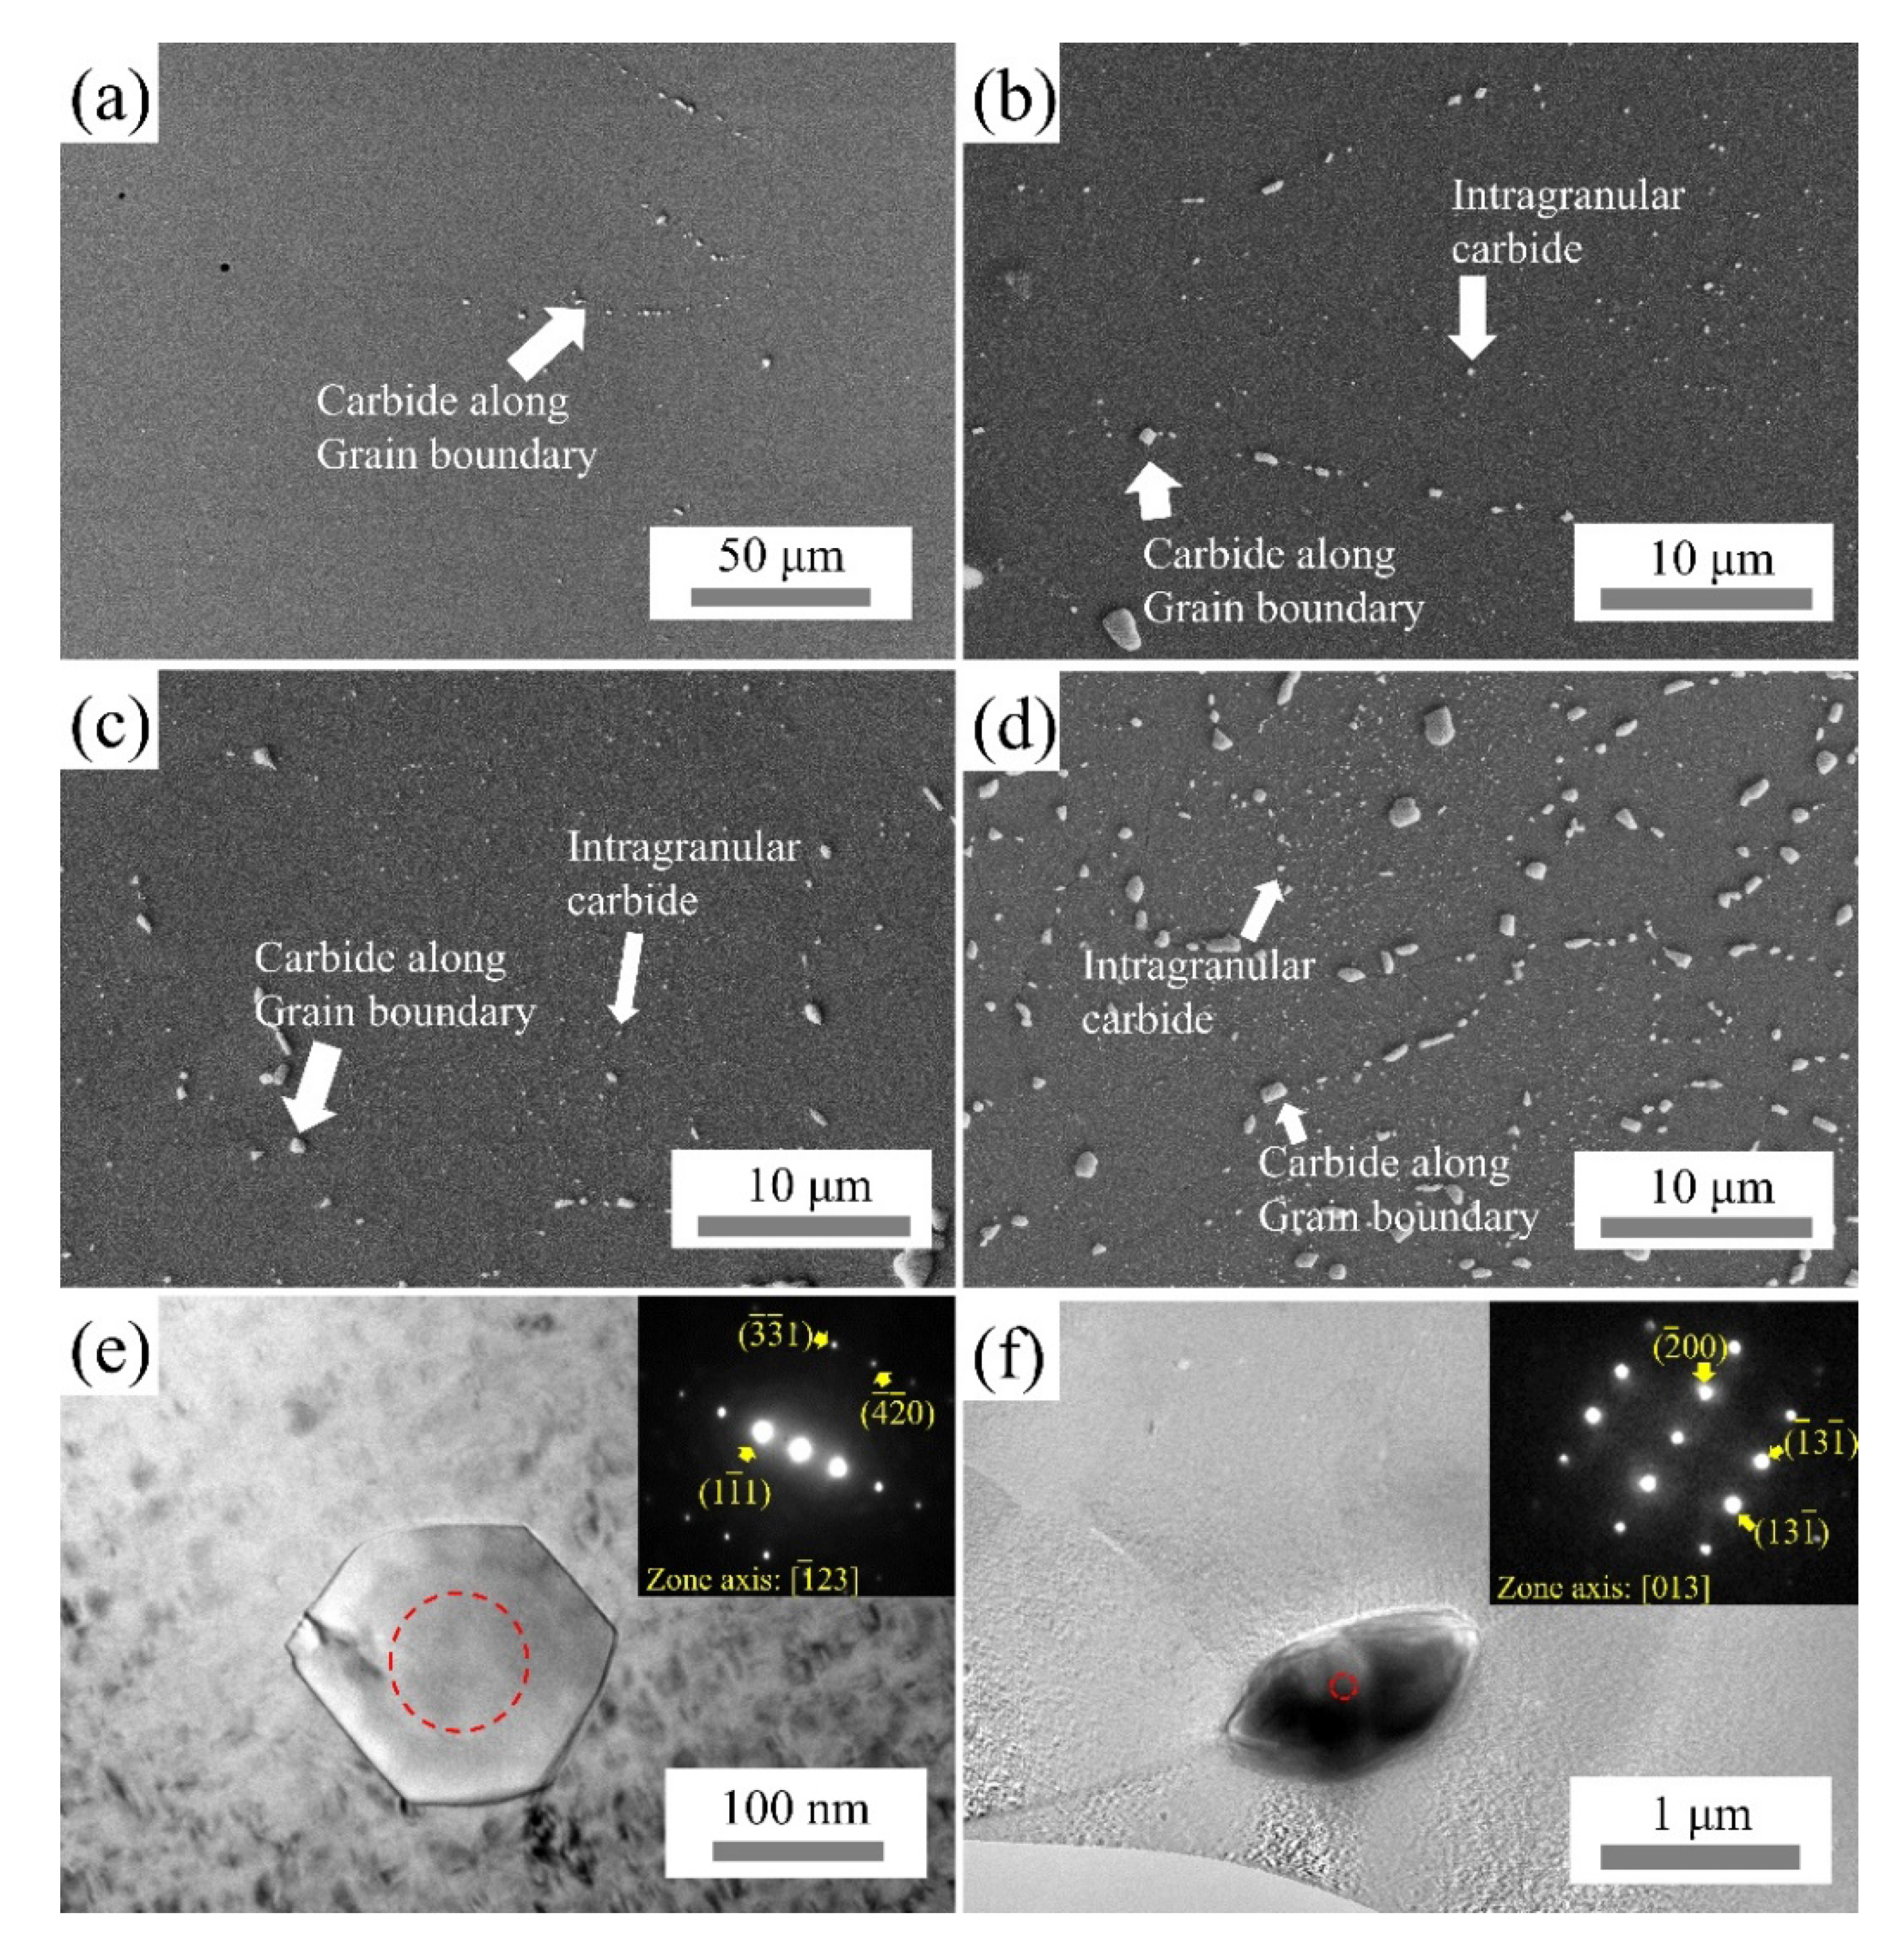
Microstructures of the samples subjected to STA heat treatment are shown in
Figure 5, and it shows that cellular walls were all eliminated; with more NbC additions, more bright particles could be observed in the microstructures,
Figure 5a–d. According to the TEM diffraction pattern in
Figure 5e,f and TEM-EDS analysis shown in
Table 3, these particles were Nb-rich FCC_B1 cubic carbides, some large ones (430 nm~628 nm) were found along grain boundaries, while smaller particles (46~57 nm) were seen within the grain.
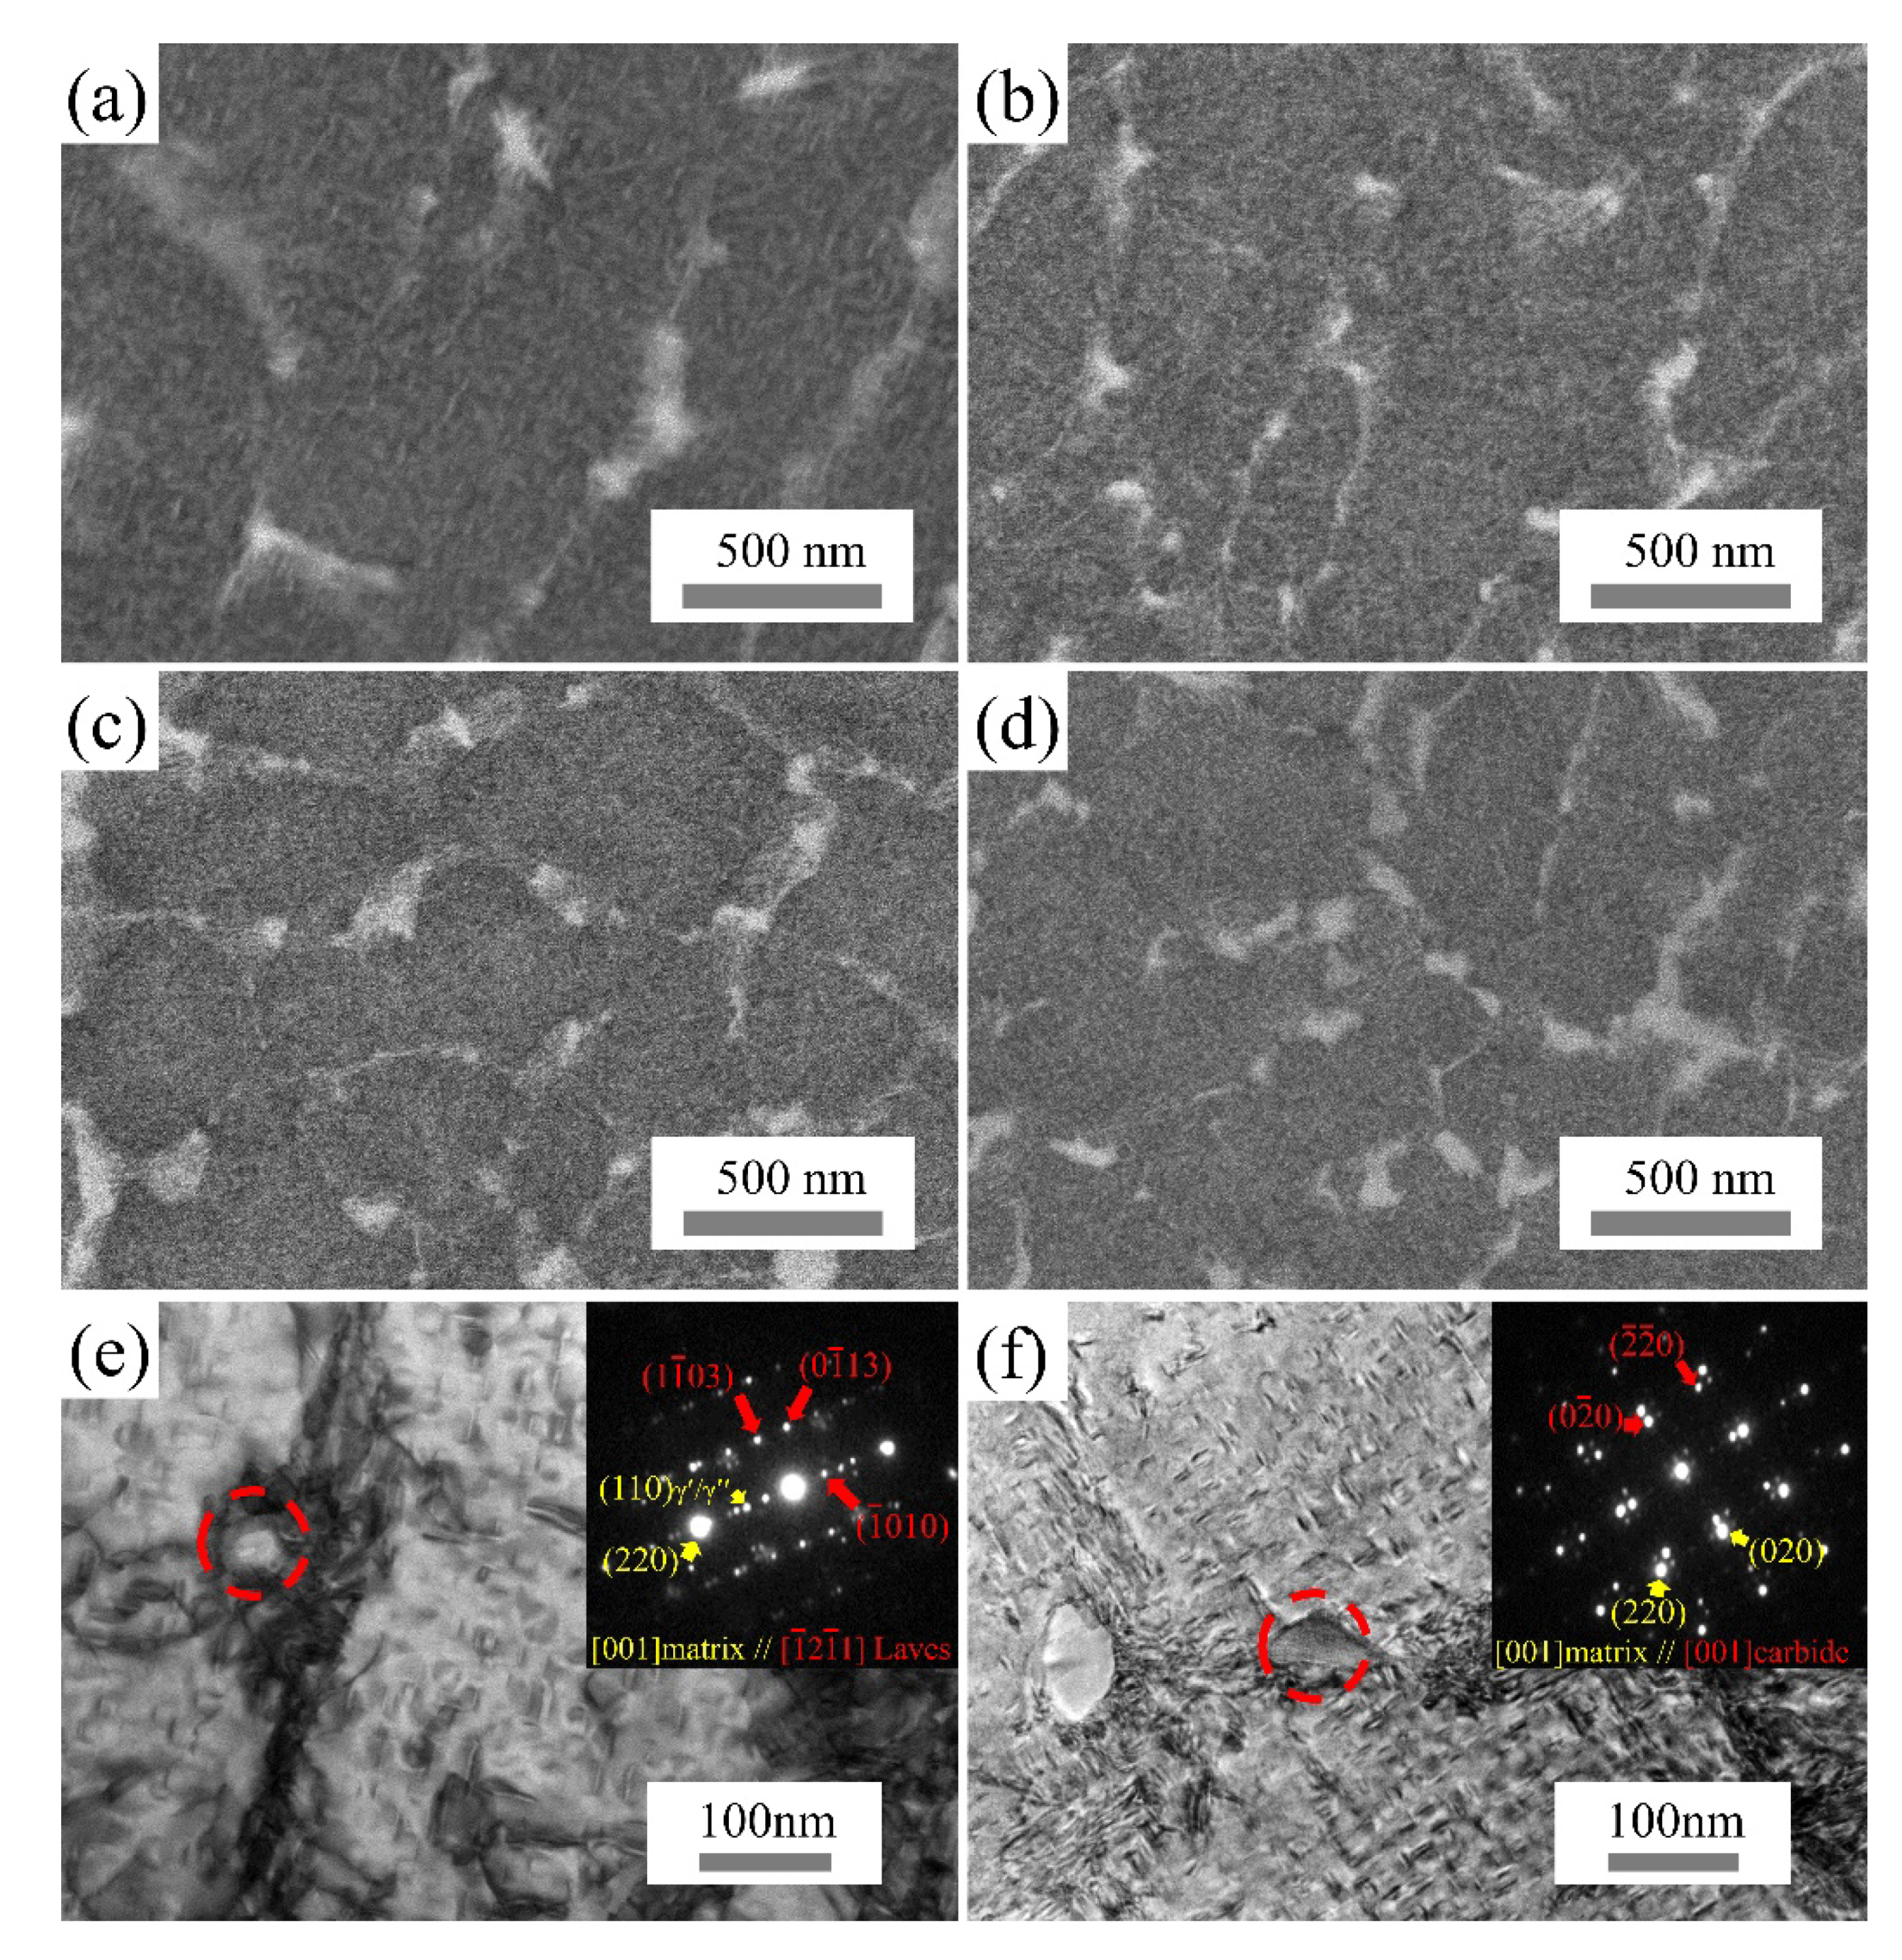
Figure 6 shows the microstructures of samples subjected to DA heat treatment, and bright particles were observed along cellular wall;
Figure 6e,f are TEM micrographs of these particles along the cellular wall, and their compositions are shown in
Table 3 to compare with that in the STA specimen. TEM analysis indicated that for the specimen without NbC addition, these particles were C14 Laves phase, while with NbC addition, particles along the cellular wall were found to be Nb-rich FCC_B1 cubic carbide. The positions, volume fractions, and diameter of these particles after STA and DA treatments are shown in
Table 4. Particles of STA specimens were categorized into “intragranular carbide” and “carbide along grain boundary” based on the observation in
Figure 5; for DA specimens, particles along cellular wall were considered and they were identical to particles along grain boundaries. It is shown that NbC addition led to carbide formation and increased particles fraction to all specimens. For DA specimens, the volume fraction of particles increased from 1.28% to 7.6% with 5.0% NbC addition. A similar result was observed in STA specimens, volume fractions of both types of carbide increased with NbC addition, from 0.11% (intragranular carbide) and 0.09% (carbide along grain boundary) of no NbC content to 3.23% (intragranular carbide) and 4.36% (carbide along grain boundary) of 5.0% NbC. It should be noted that overall volume fractions of particles in STA specimens were less than those of DA specimen, which could be associated with more homogeneous composition profile due to STA heat treatment.
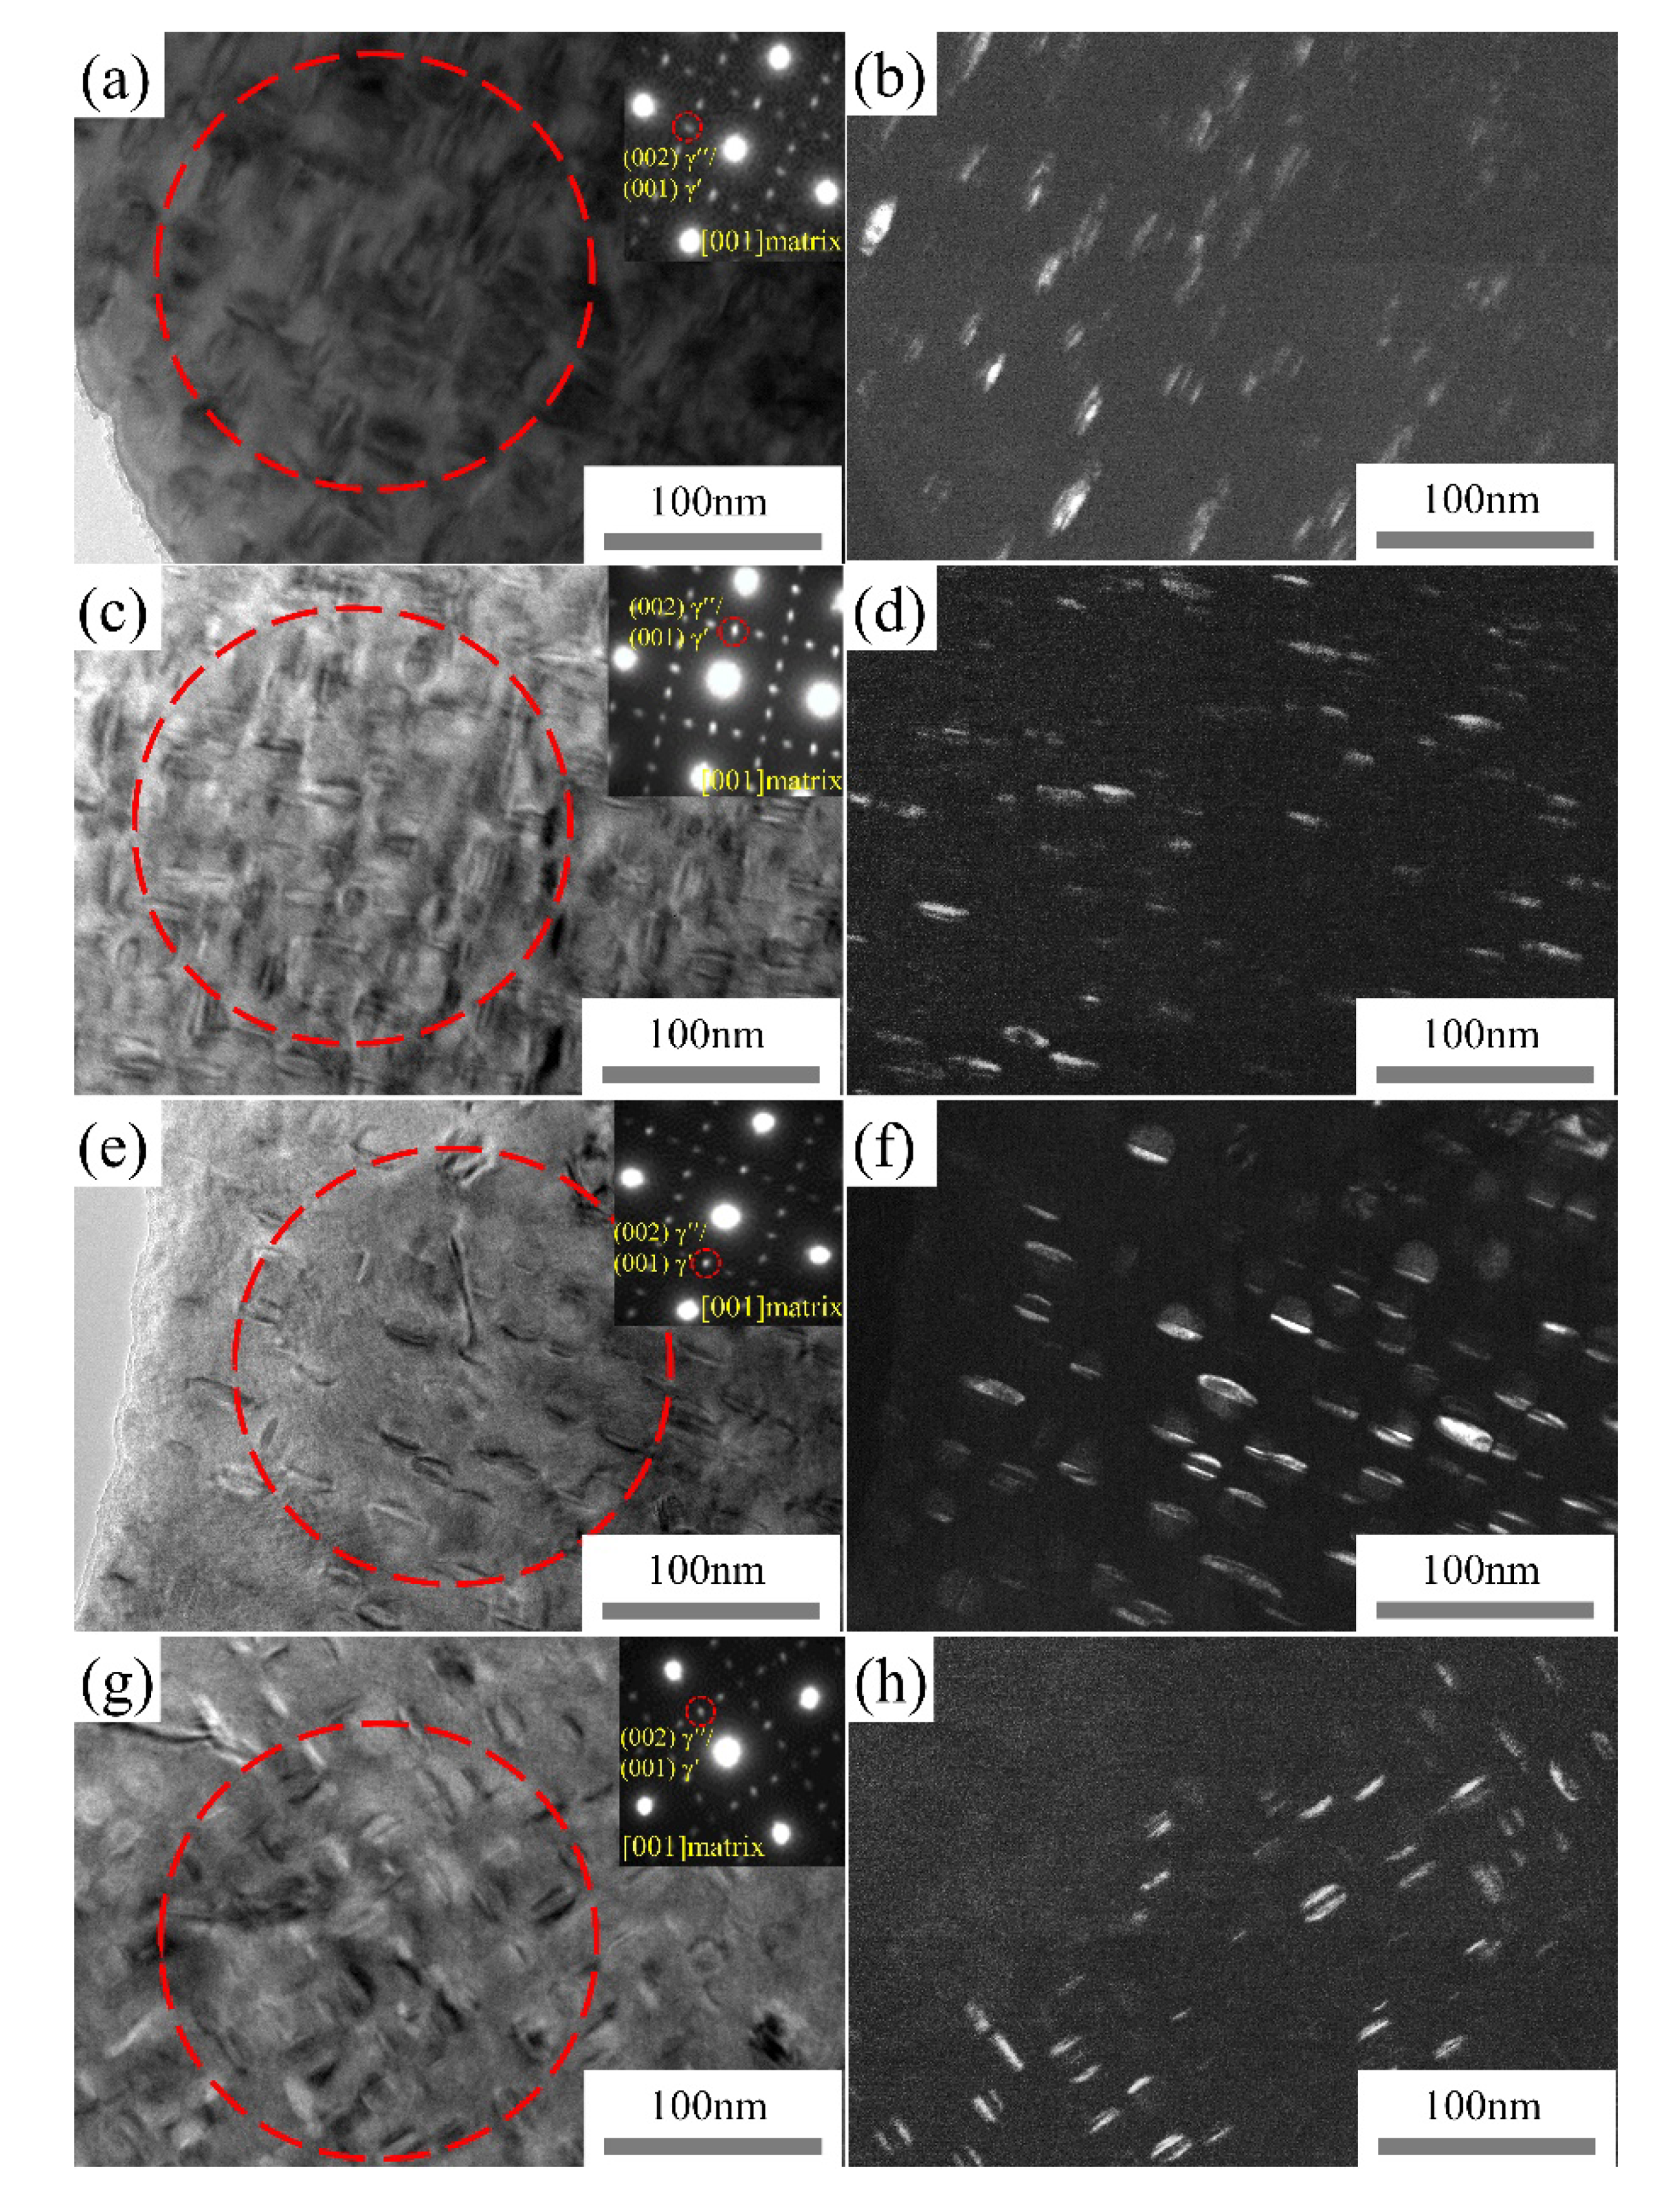
Figure 7 illustrates TEM images of precipitate in STA and DA specimens; these particles were mainly γ″ with disc-shaped morphology. Image analysis indicates that the average length along the long axis of γ″ particles was 12.8 nm for STA specimen without NbC and 12.9 nm for STA specimen with NbC additions. For DA specimen, the average length along the long axis of these particles was about 13.3 nm for DA specimen without NbC and 13.0 nm for DA specimen with NbC. It has been reported that the growth of primary strengtheners, i.e., γ′ and γ′′ in Inconel 718 could follow Lifshitz-Slyozovi-Wagner theory, which suggests coarsening rate can be determined by diffusivity, temperature, and solute concentration [
54]. Based on the as-built chemical profile of sample without NbC addition (
Table 2), although there was an obvious Nb segregation toward cell wall regions, the overall chemical compositions were not affected much by the addition of NbC. With the same aging treatment, it is expected that DA samples and STA samples possessed virtually identical sizes and fractions of primary strengtheners.
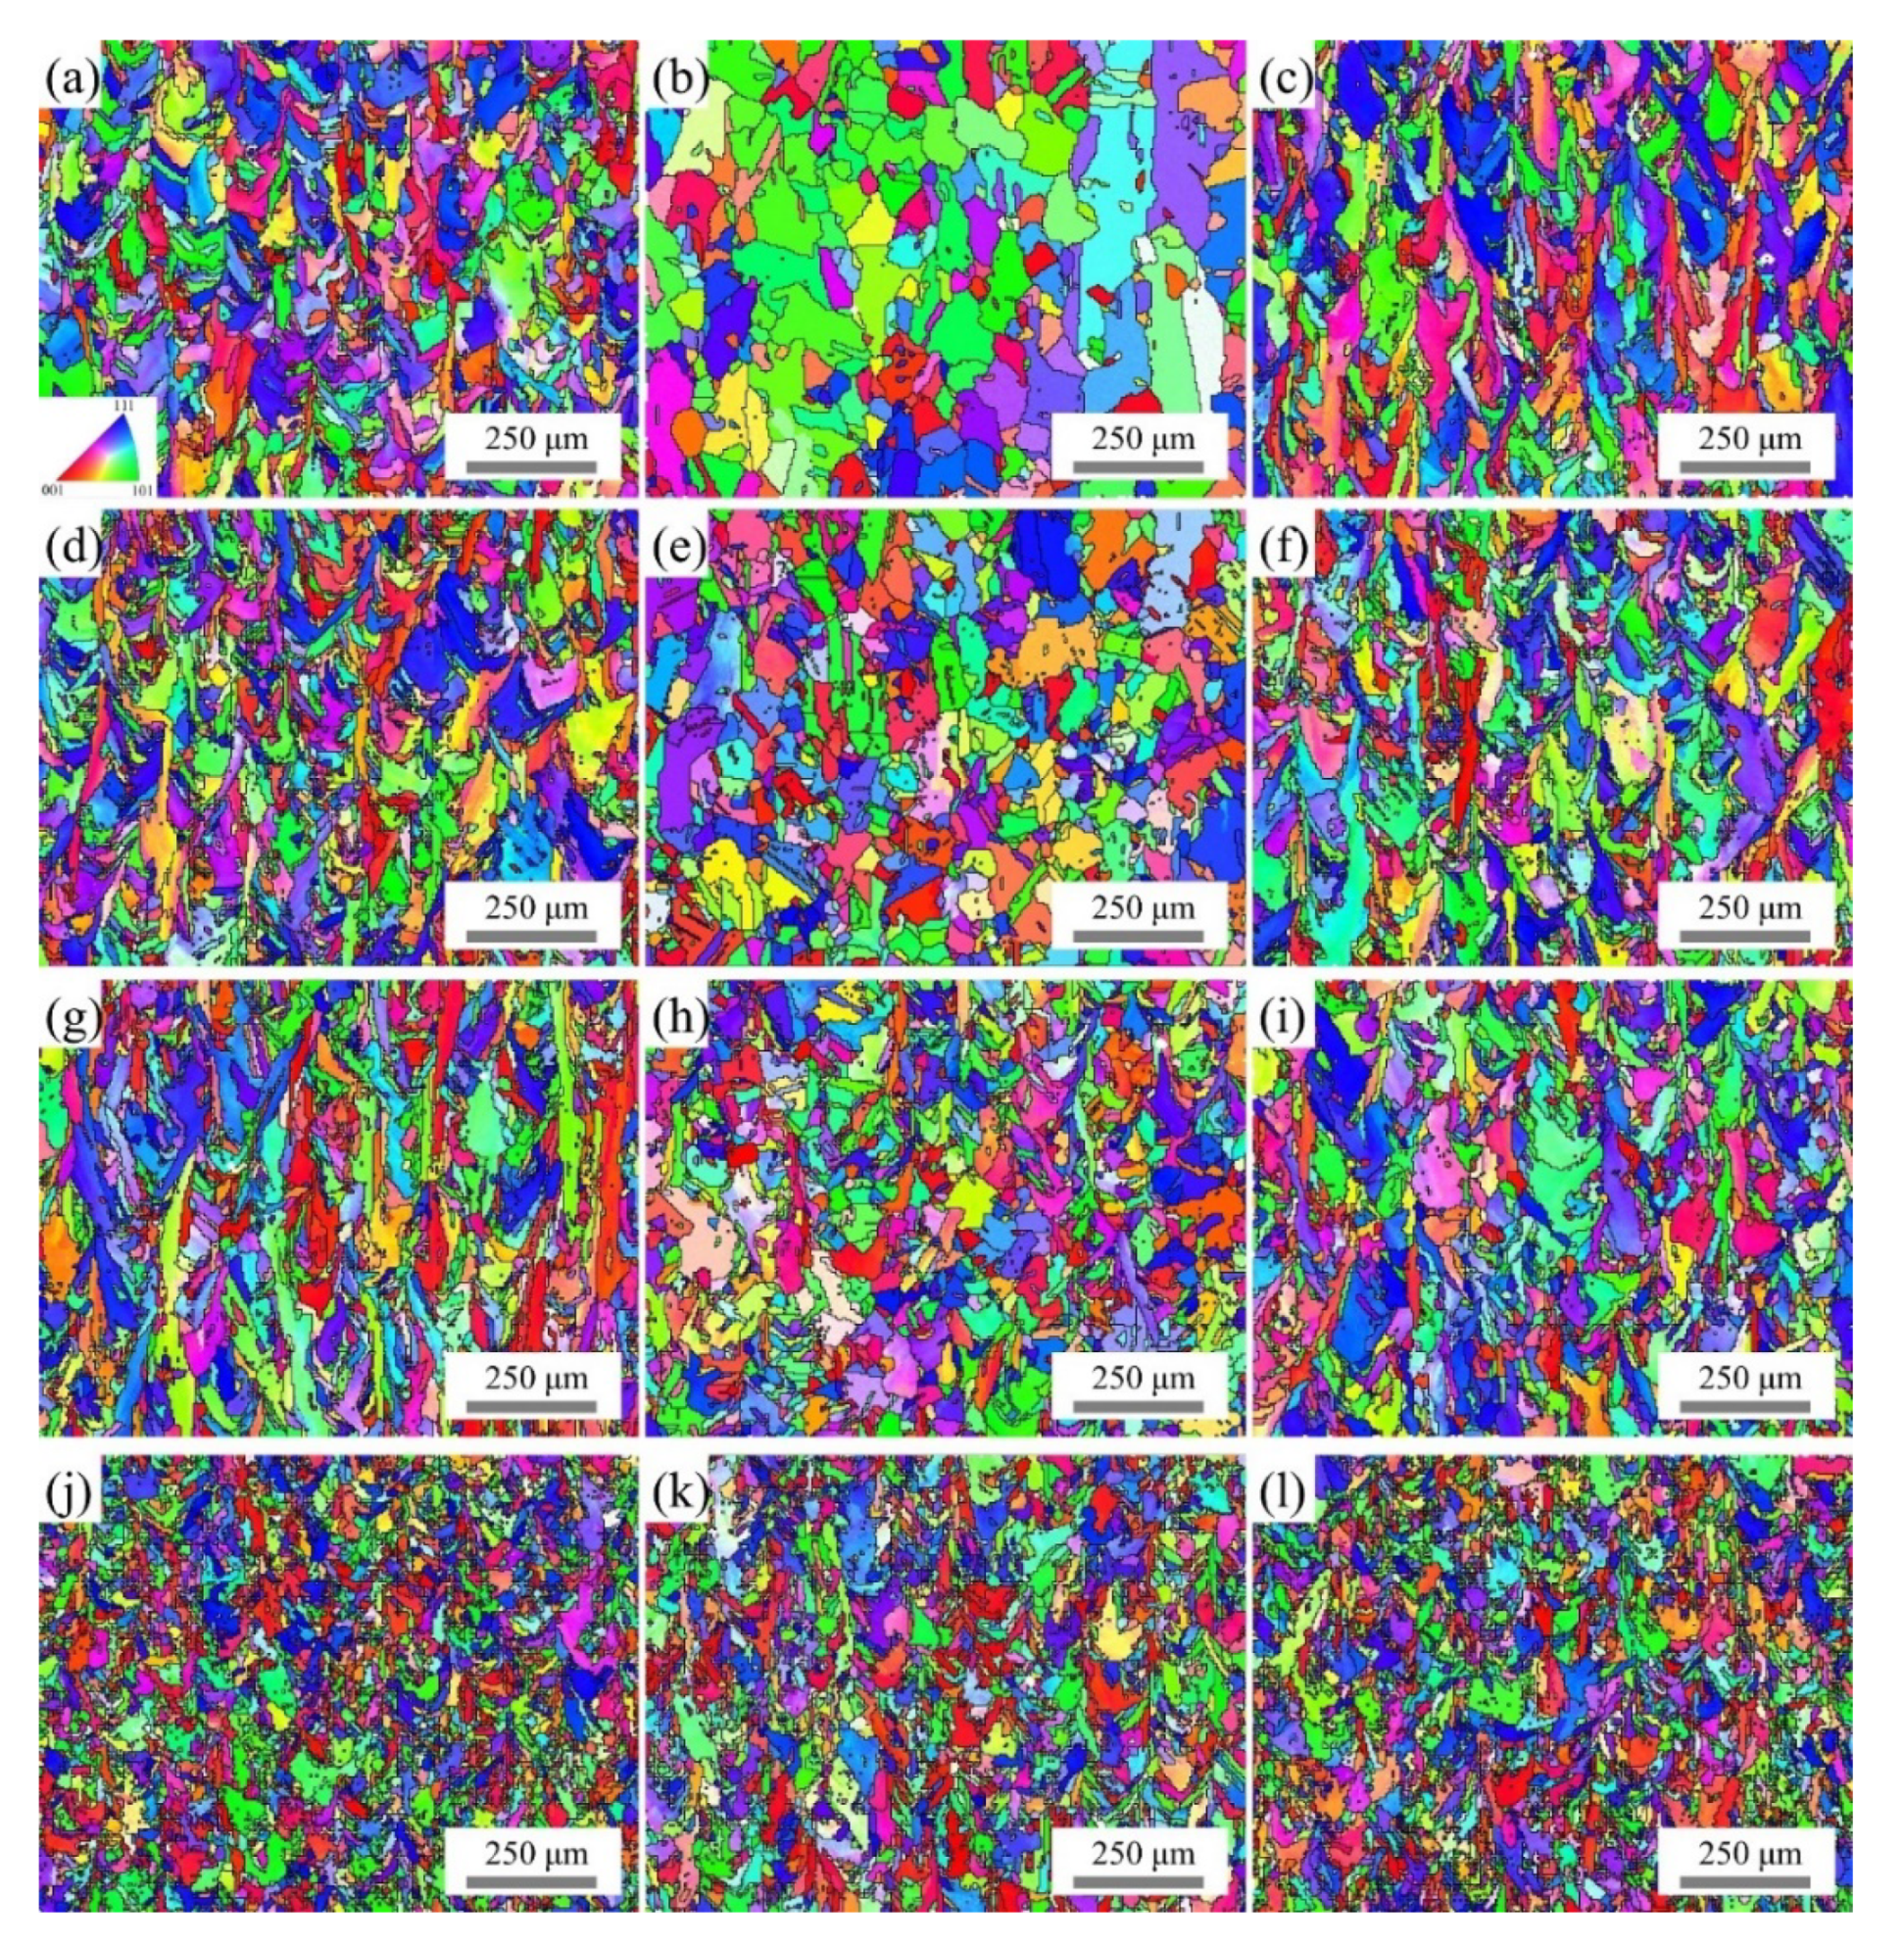
EBSD grain analysis are shown in
Figure 8. Epitaxial grains growth was present in as-built Inconel 718 with NbC addition, and columnar grains were observed. However, with NbC addition, more small grains were detected.
Table 5 shows the average grain diameter after different heat treatments. The average grain diameter of the as-built SLM samples decreased from 18.94 μm to 17.97 μm, 17.11 μm, and 10.51 μm for 0%, 0.5%, 1.0%, and 5.0% NbC addition, respectively. For specimens subjected to post-SLM heat treatments, it is found that STA could eliminate the columnar grains of as-built specimens and led to obvious grain growth. The average grain diameter of the sample without NbC addition was 44.53 μm after STA. It is found that grain growth during STA was inhibited with more NbC addition. Average grain size of STA specimens decreased to 30.85 μm with 0.5% NbC, 21.53 μm with 1.0% NbC, and 13.45 μm with 5.0% NbC addition. On the other hand, DA had less influence on grain size and grain morphology; grain structures of DA specimens were similar to those of as-built conditions.
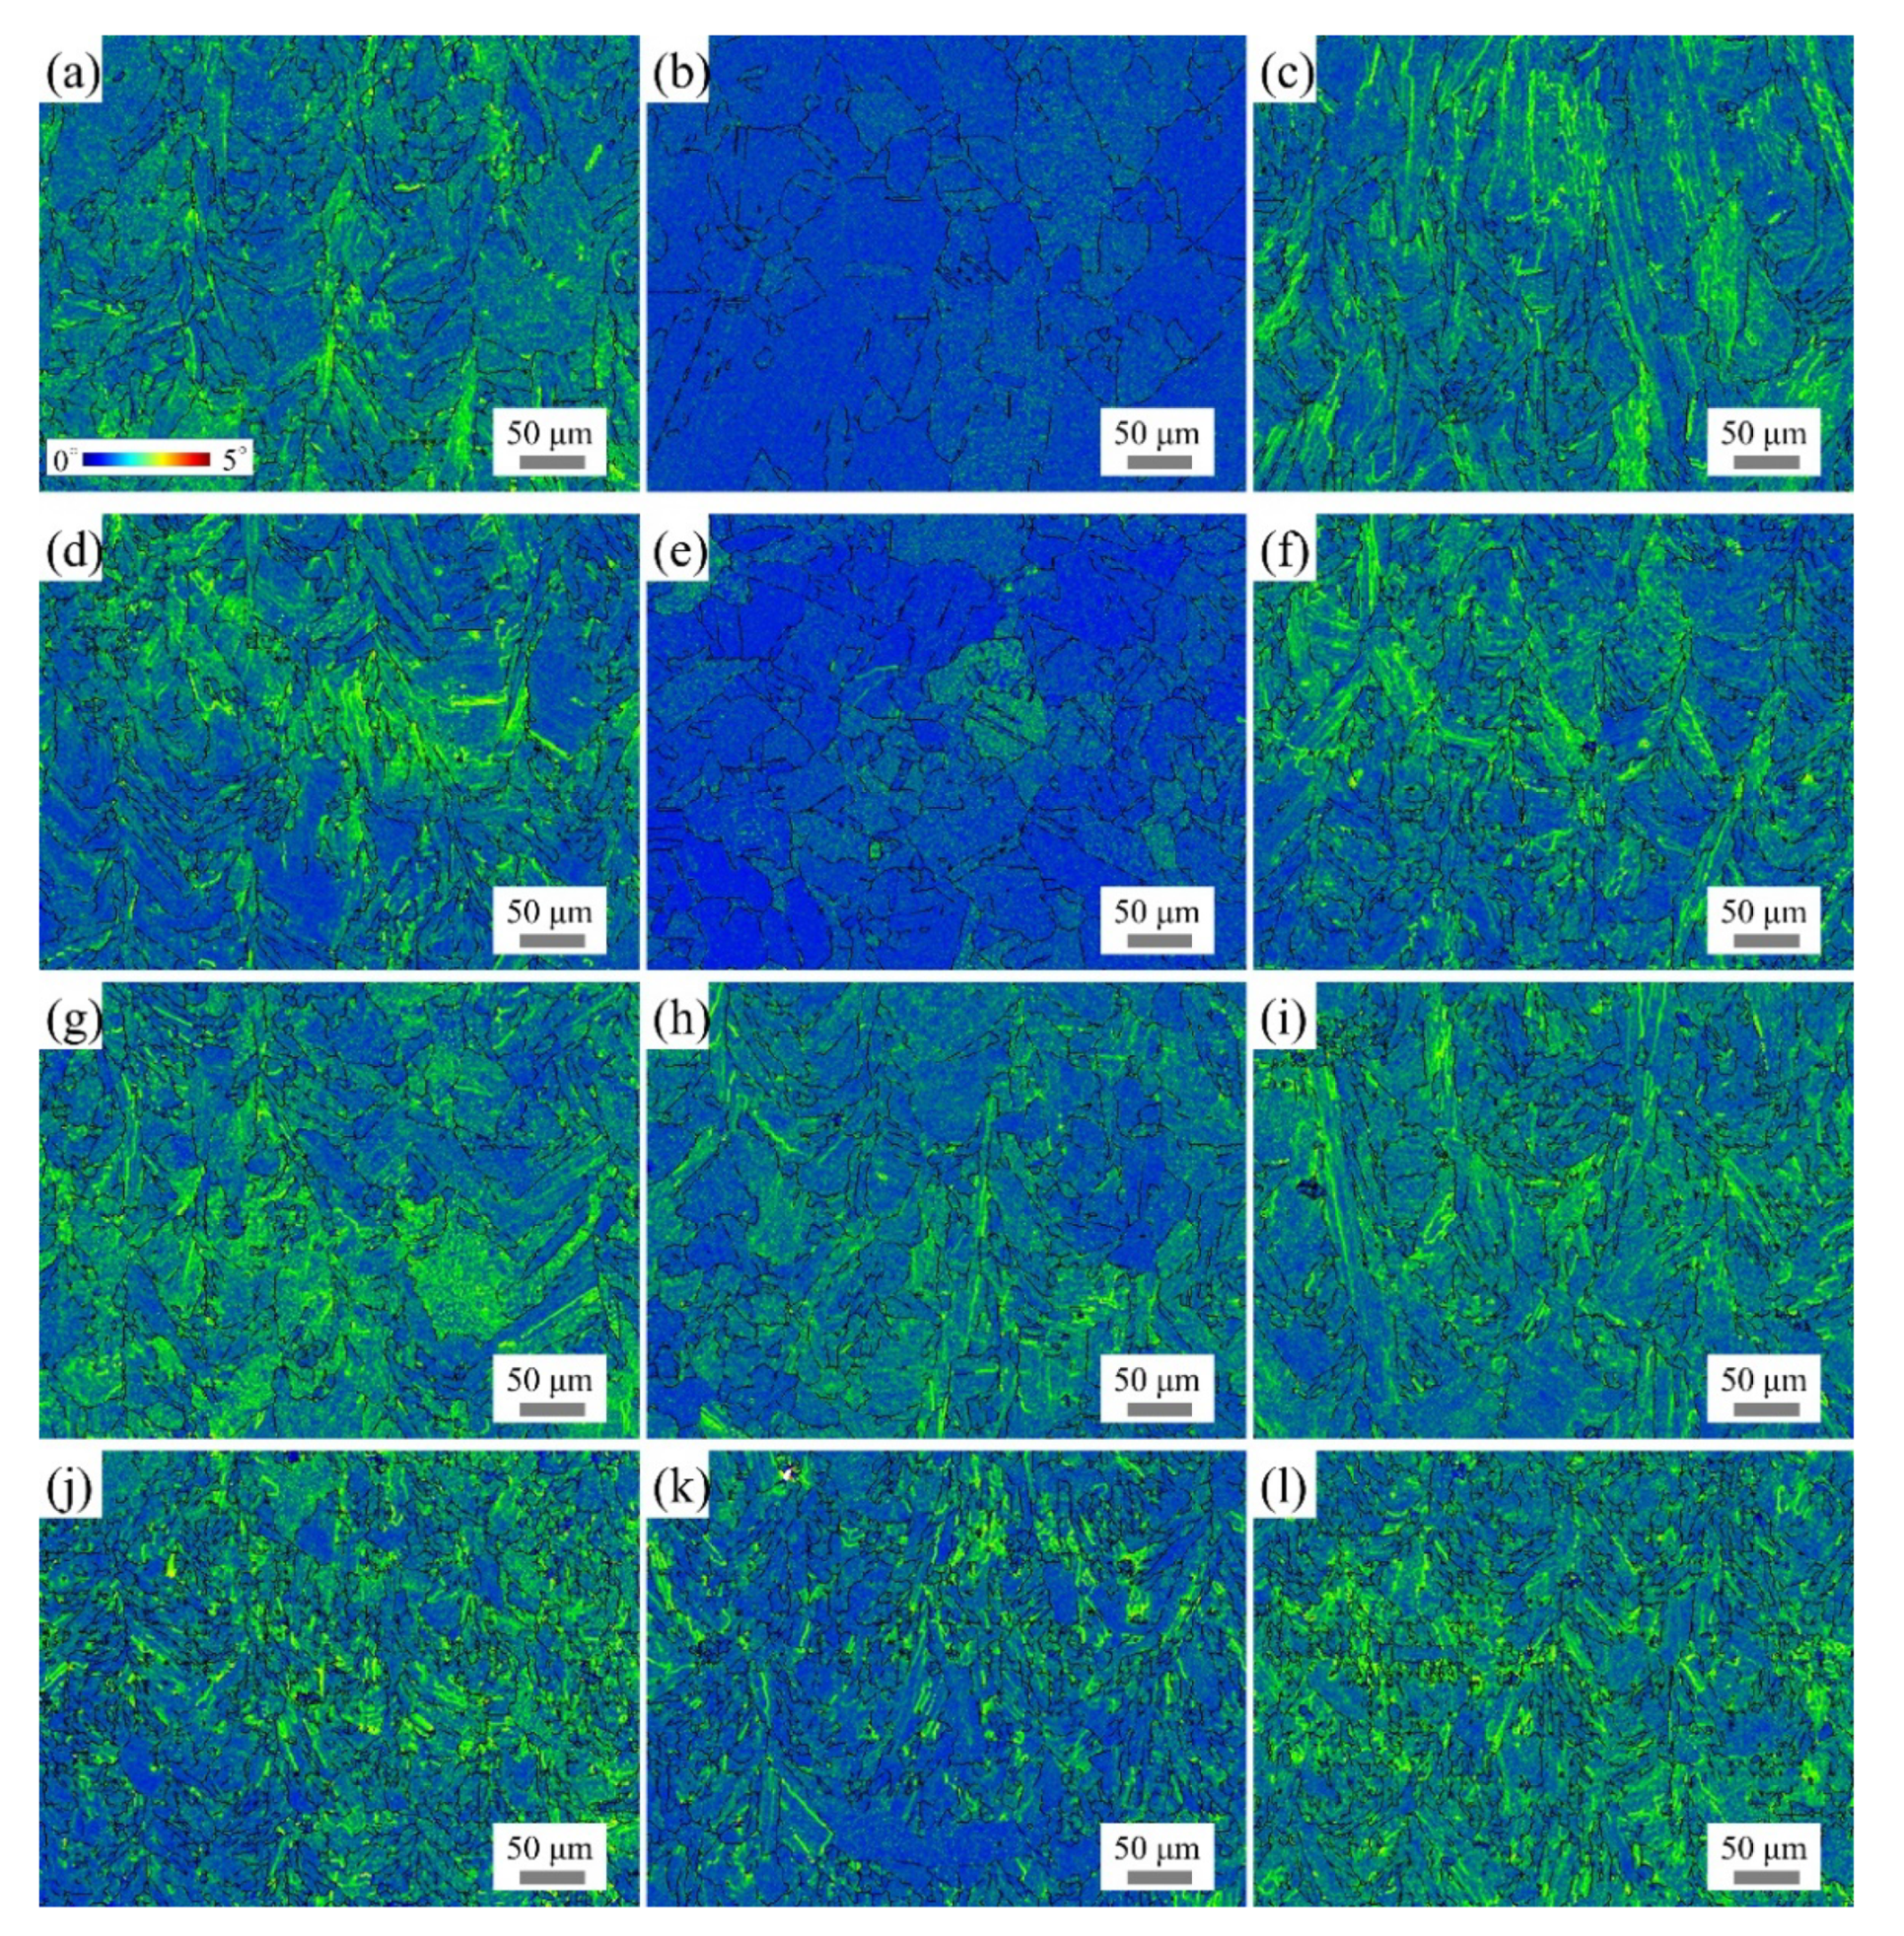
The overall GND densities of different specimens have been estimated by the method described in
Section 2.5 and results are presented in
Table 6. The corresponding KAM maps are shown in
Figure 9. All the as-built specimens had similar GND density around 4.04 × 10
13/m
2~4.54 × 10
13/m
2 and the values were independent of the contents of NbC addition. After STA heat treatment, GND density decreased from 4.18 × 10
13/m
2 to 1.31 × 10
12/m
2 for samples without NbC addition. GND density of STA specimens with NbC additions also decreased significantly due to stress relief by SHT. By contrast, DA processes did not appear to decrease the GND density dramatically for all specimens with and without NbC additions.
3.3. Tensile Properties
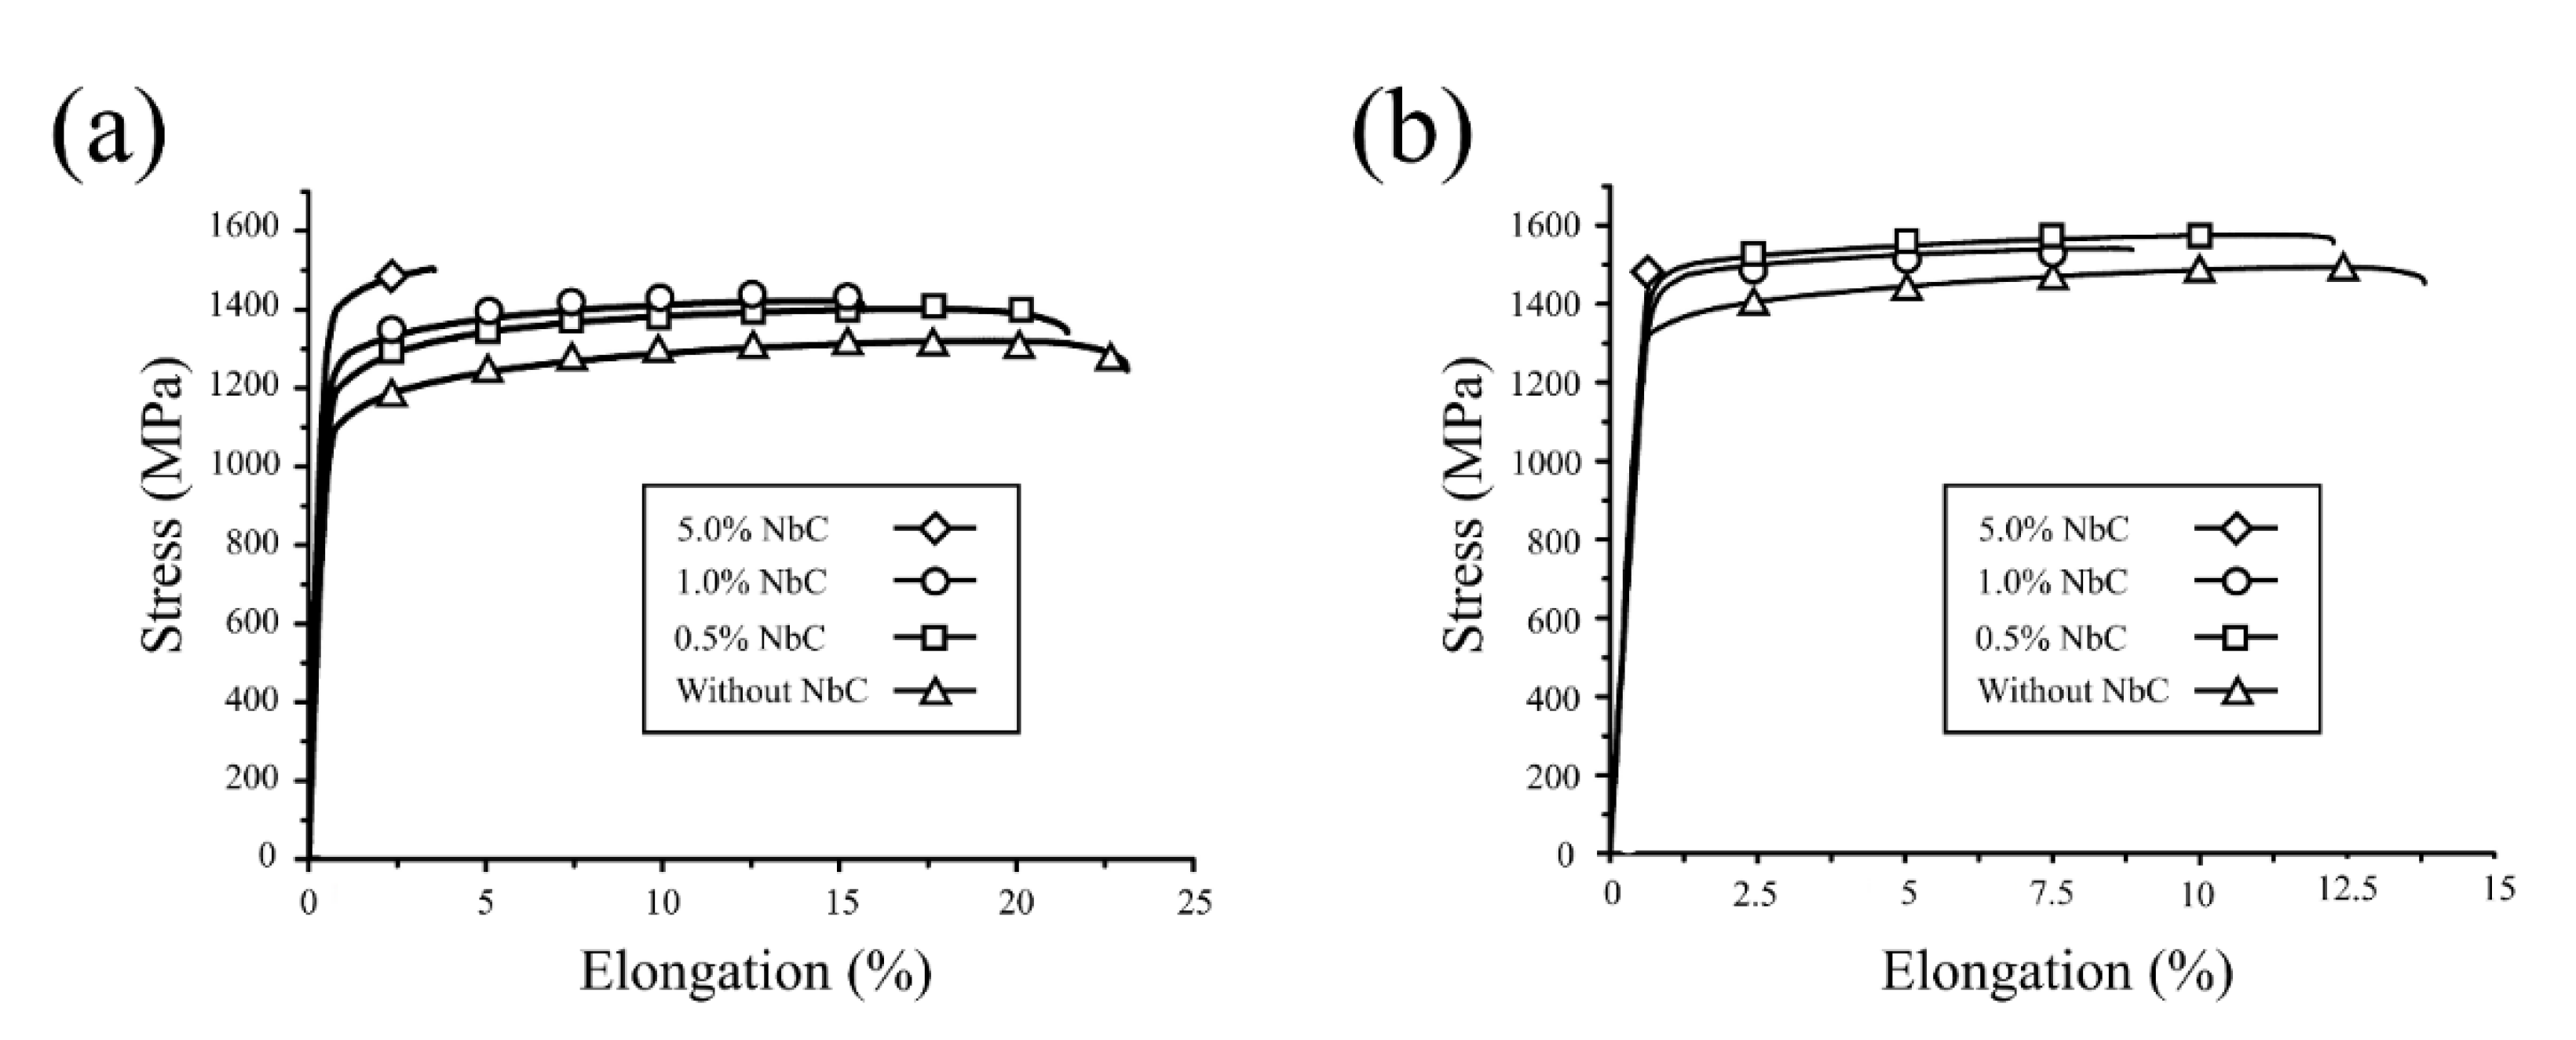
Tensile stress and strain curves are presented in
Figure 10, and the corresponding tensile properties are listed in
Table 7. For STA specimens, yield strength (YS) and ultimate tensile strength (UTS) increased gradually with NbC additions, from 1134.8 MPa and 1359.9 MPa of no NbC addition, to 1325.5 MPa and 1498.4 MPa of 5.0% NbC, respectively. After DA process, tensile strengths of samples increased significantly and the influence of NbC addition was more pronounced. Without NbC addition, YS was 1357.5 MPa and UTS was 1490.4 MPa; with 0.5% NbC addition, YS was 1461.0 MPa and UTS was 1575.2 MPa. However, for DA specimens with NbC addition of more than 1.0%, both YS and UTS were decreased compared to that of 0.5% NbC. DA specimen with 5.0% NbC addition broke without reaching the yield point. For samples without NbC addition, the elongation decreased from 23.96% to 14.59%. The elongation further decreased to 9.95% and less for samples with NbC additions greater than 1.0%. Tensile properties of as-built and as-SHT specimens without NbC addition, and as-built specimen with 0.5% NbC, are also listed in
Table 7. As-built specimen without NbC had a YS of 771.6 MPa, and 0.5% NbC addition could increase the YS to 841.4 MPa in as-built condition, while as-SHT specimen with no NbC exhibited a YS of 379.5 MPa and large elongation.
Stress-strain curves were used to calculated strain hardening exponents (
n) based on the Hollomon equation below [
55],
n values are listed in
Table 7.
where
σt is the true stress,
εt is the true strain,
k is the strength coefficient, and
n is strain hardening exponent.
n is the gradient by plotting
σt vs.
εt in logarithmic scale. It is found that strain hardening exponents decreased with NbC additions, and STA samples possessed higher
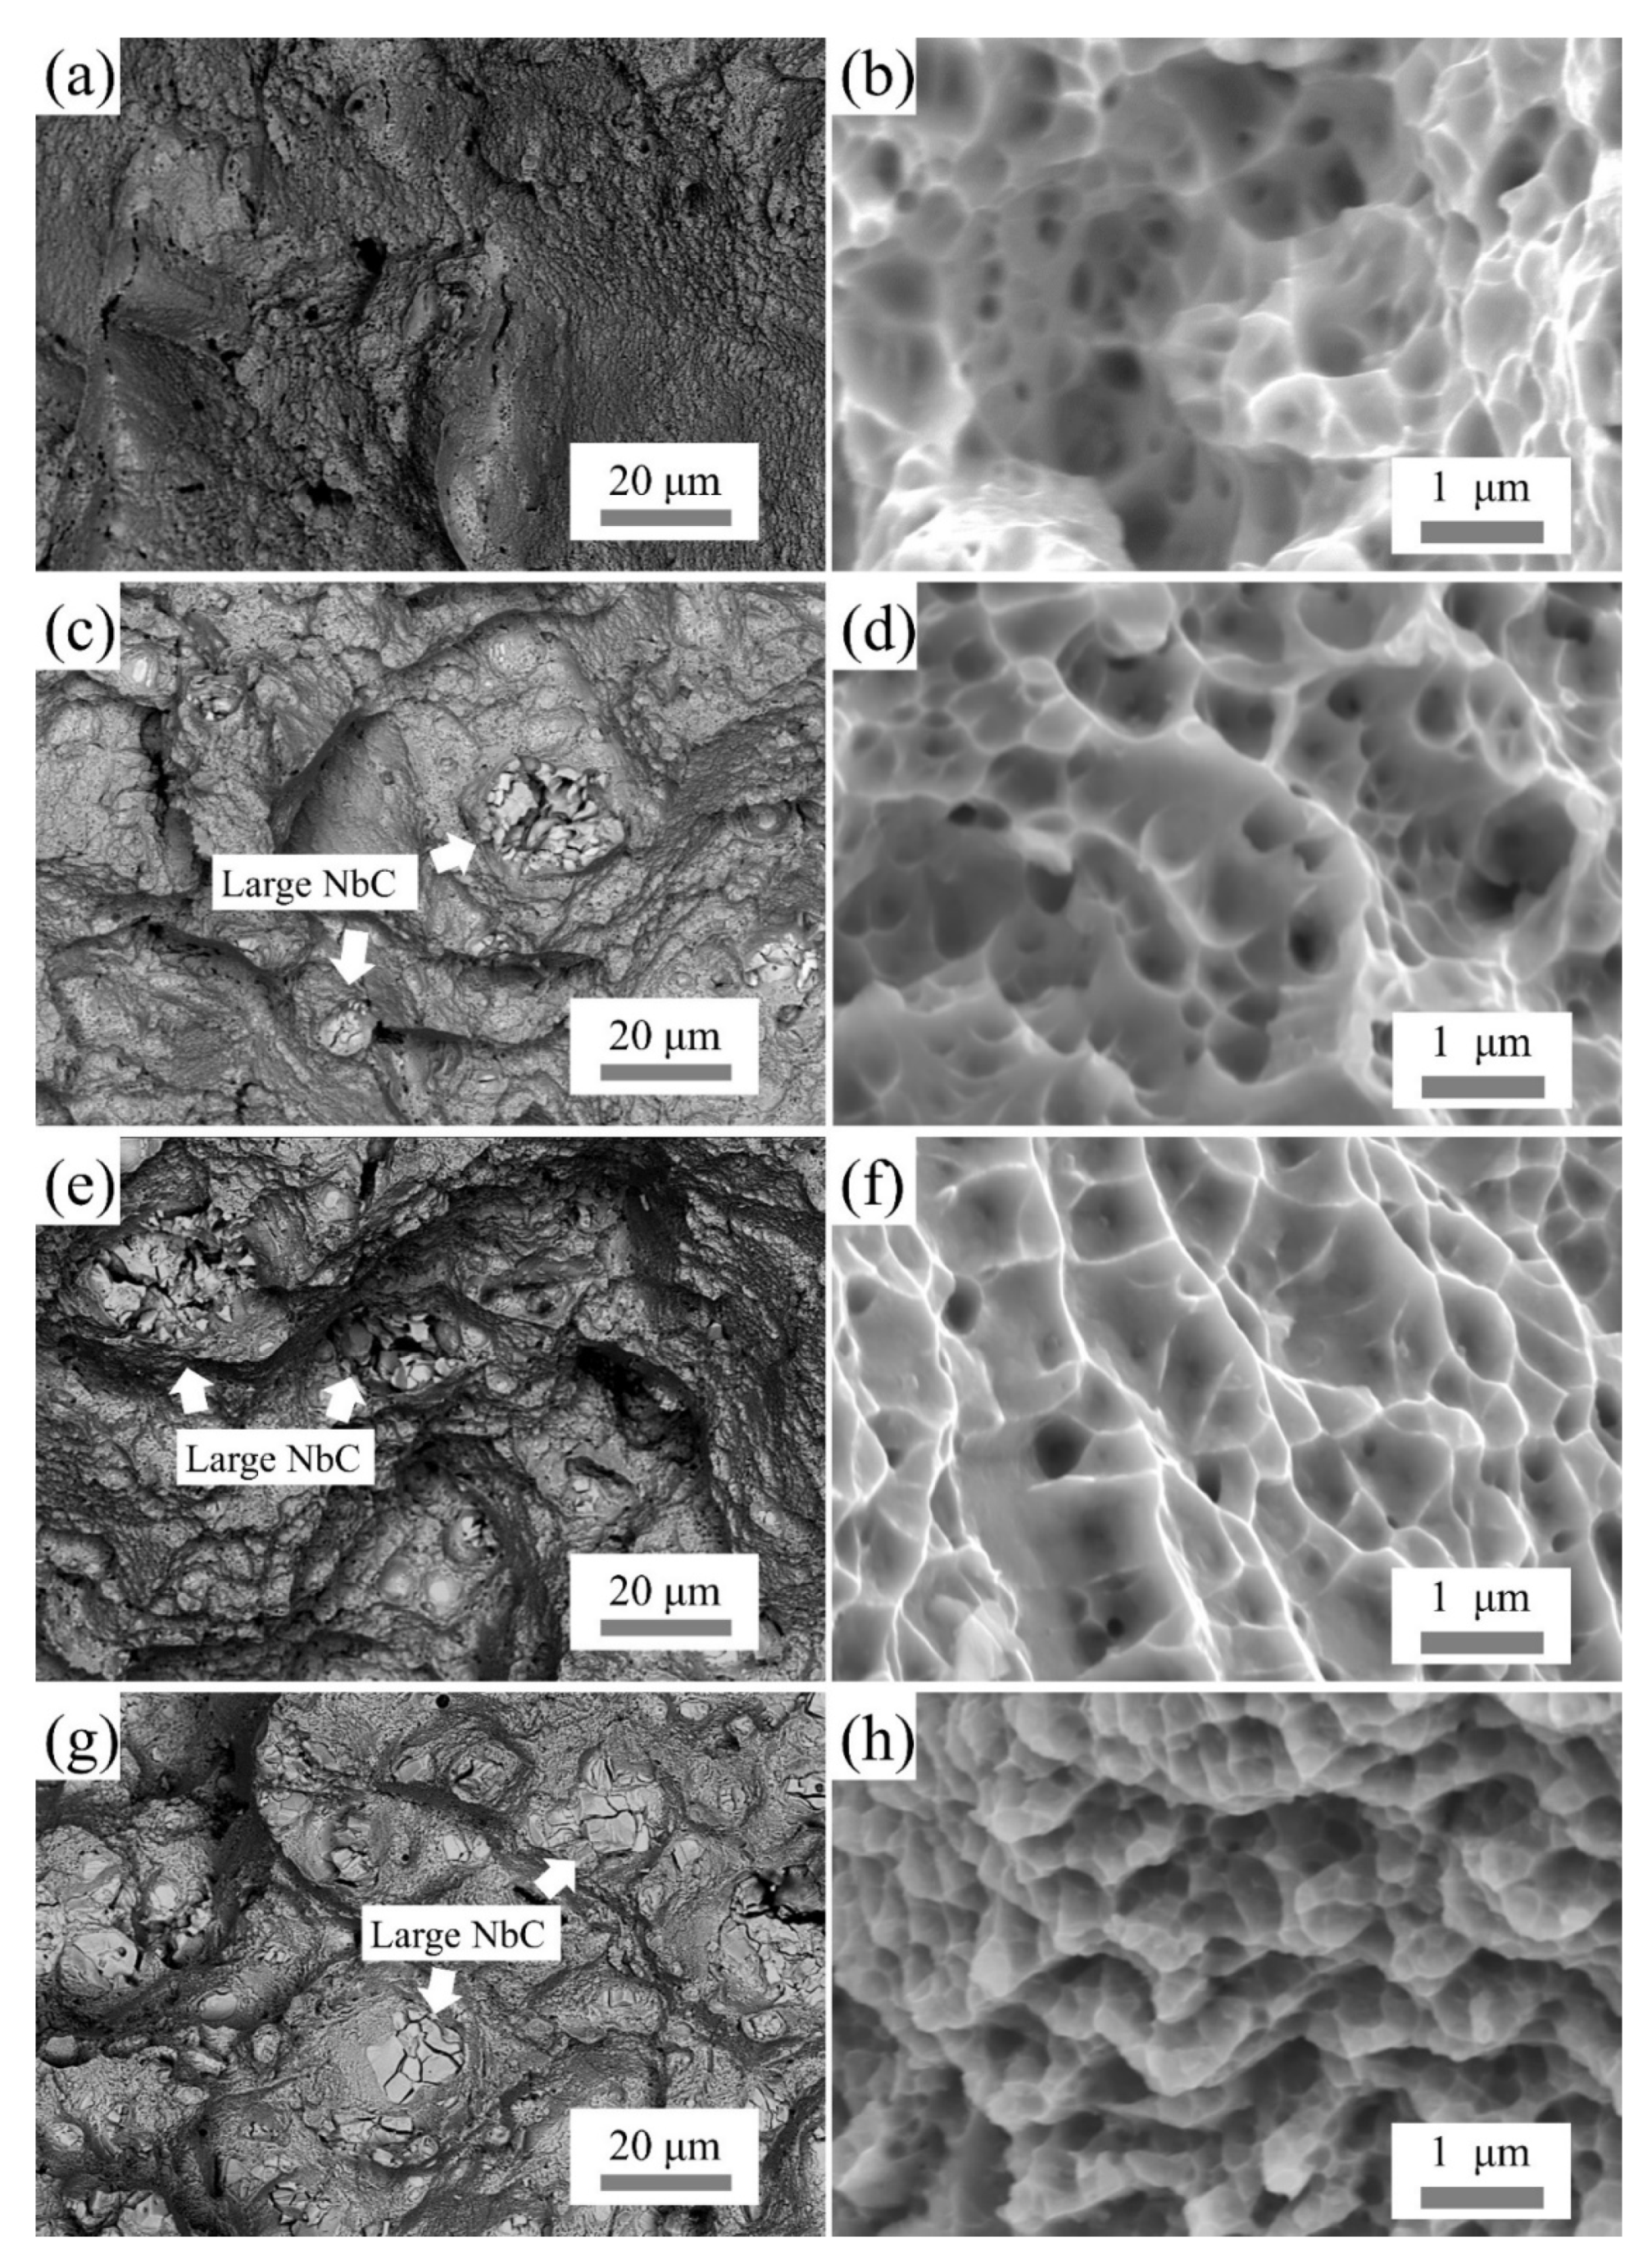
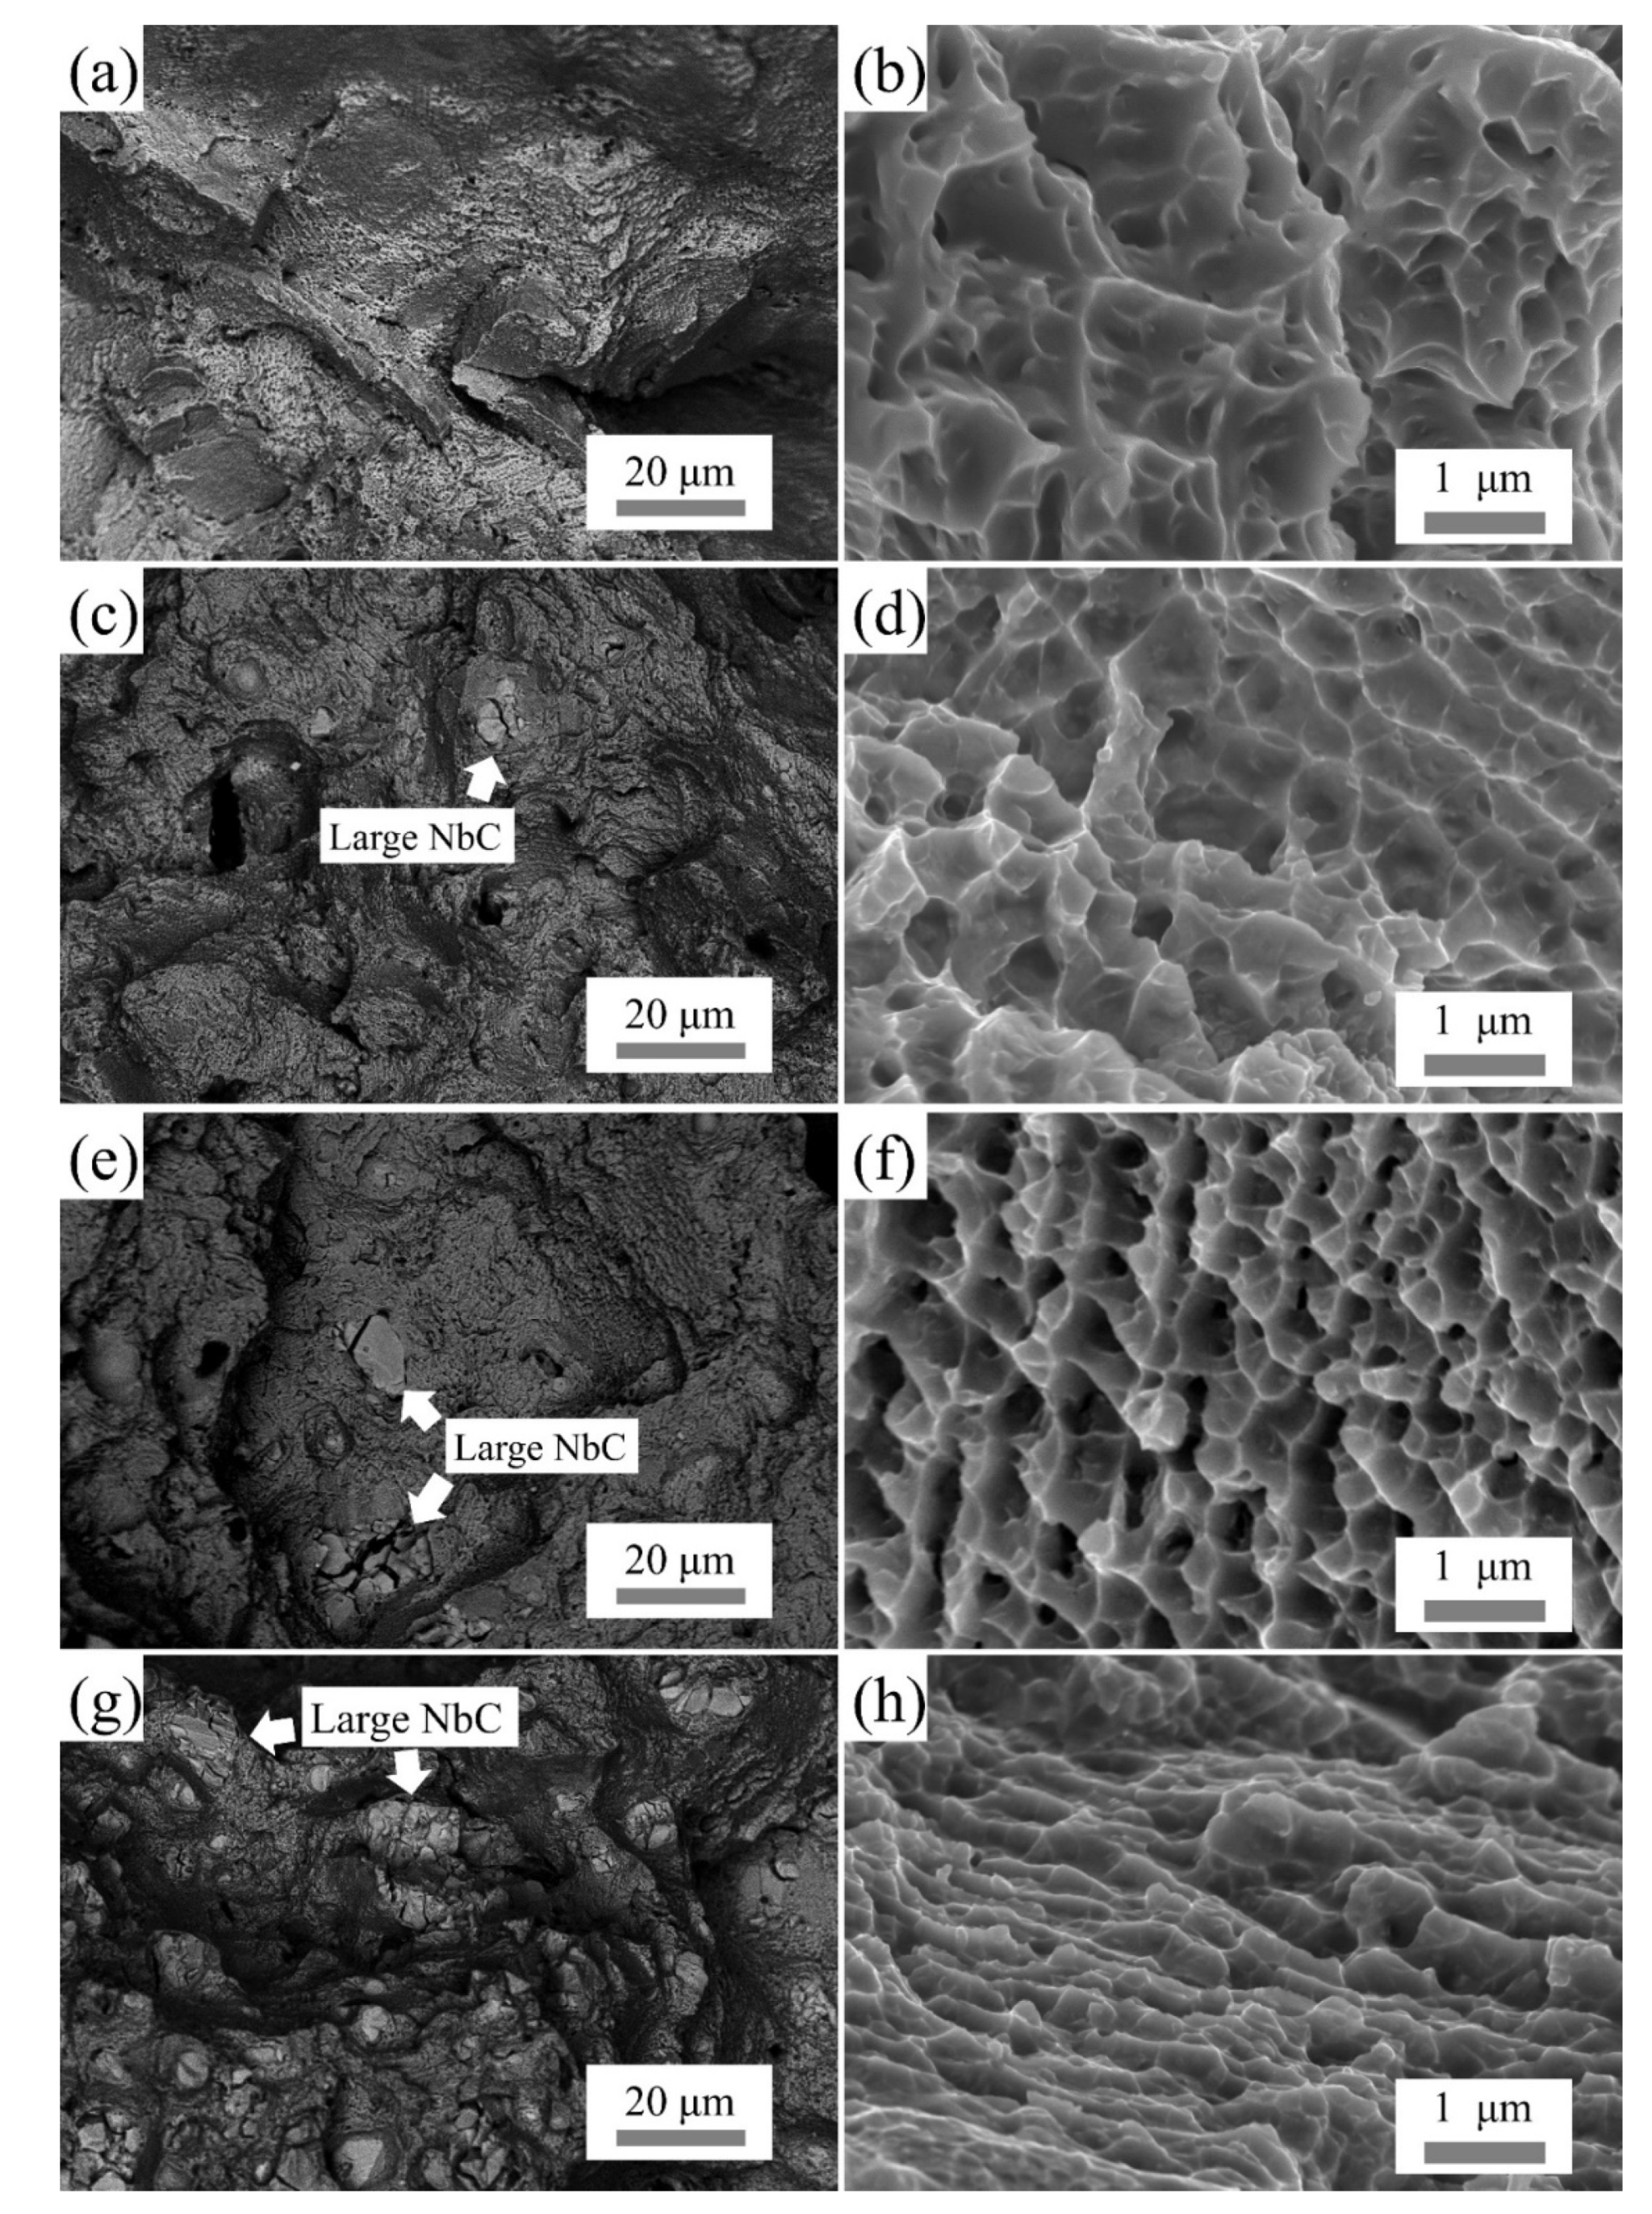
n values than that of DA samples. Fracture surfaces of tensile specimens are shown in
Figure 11 and
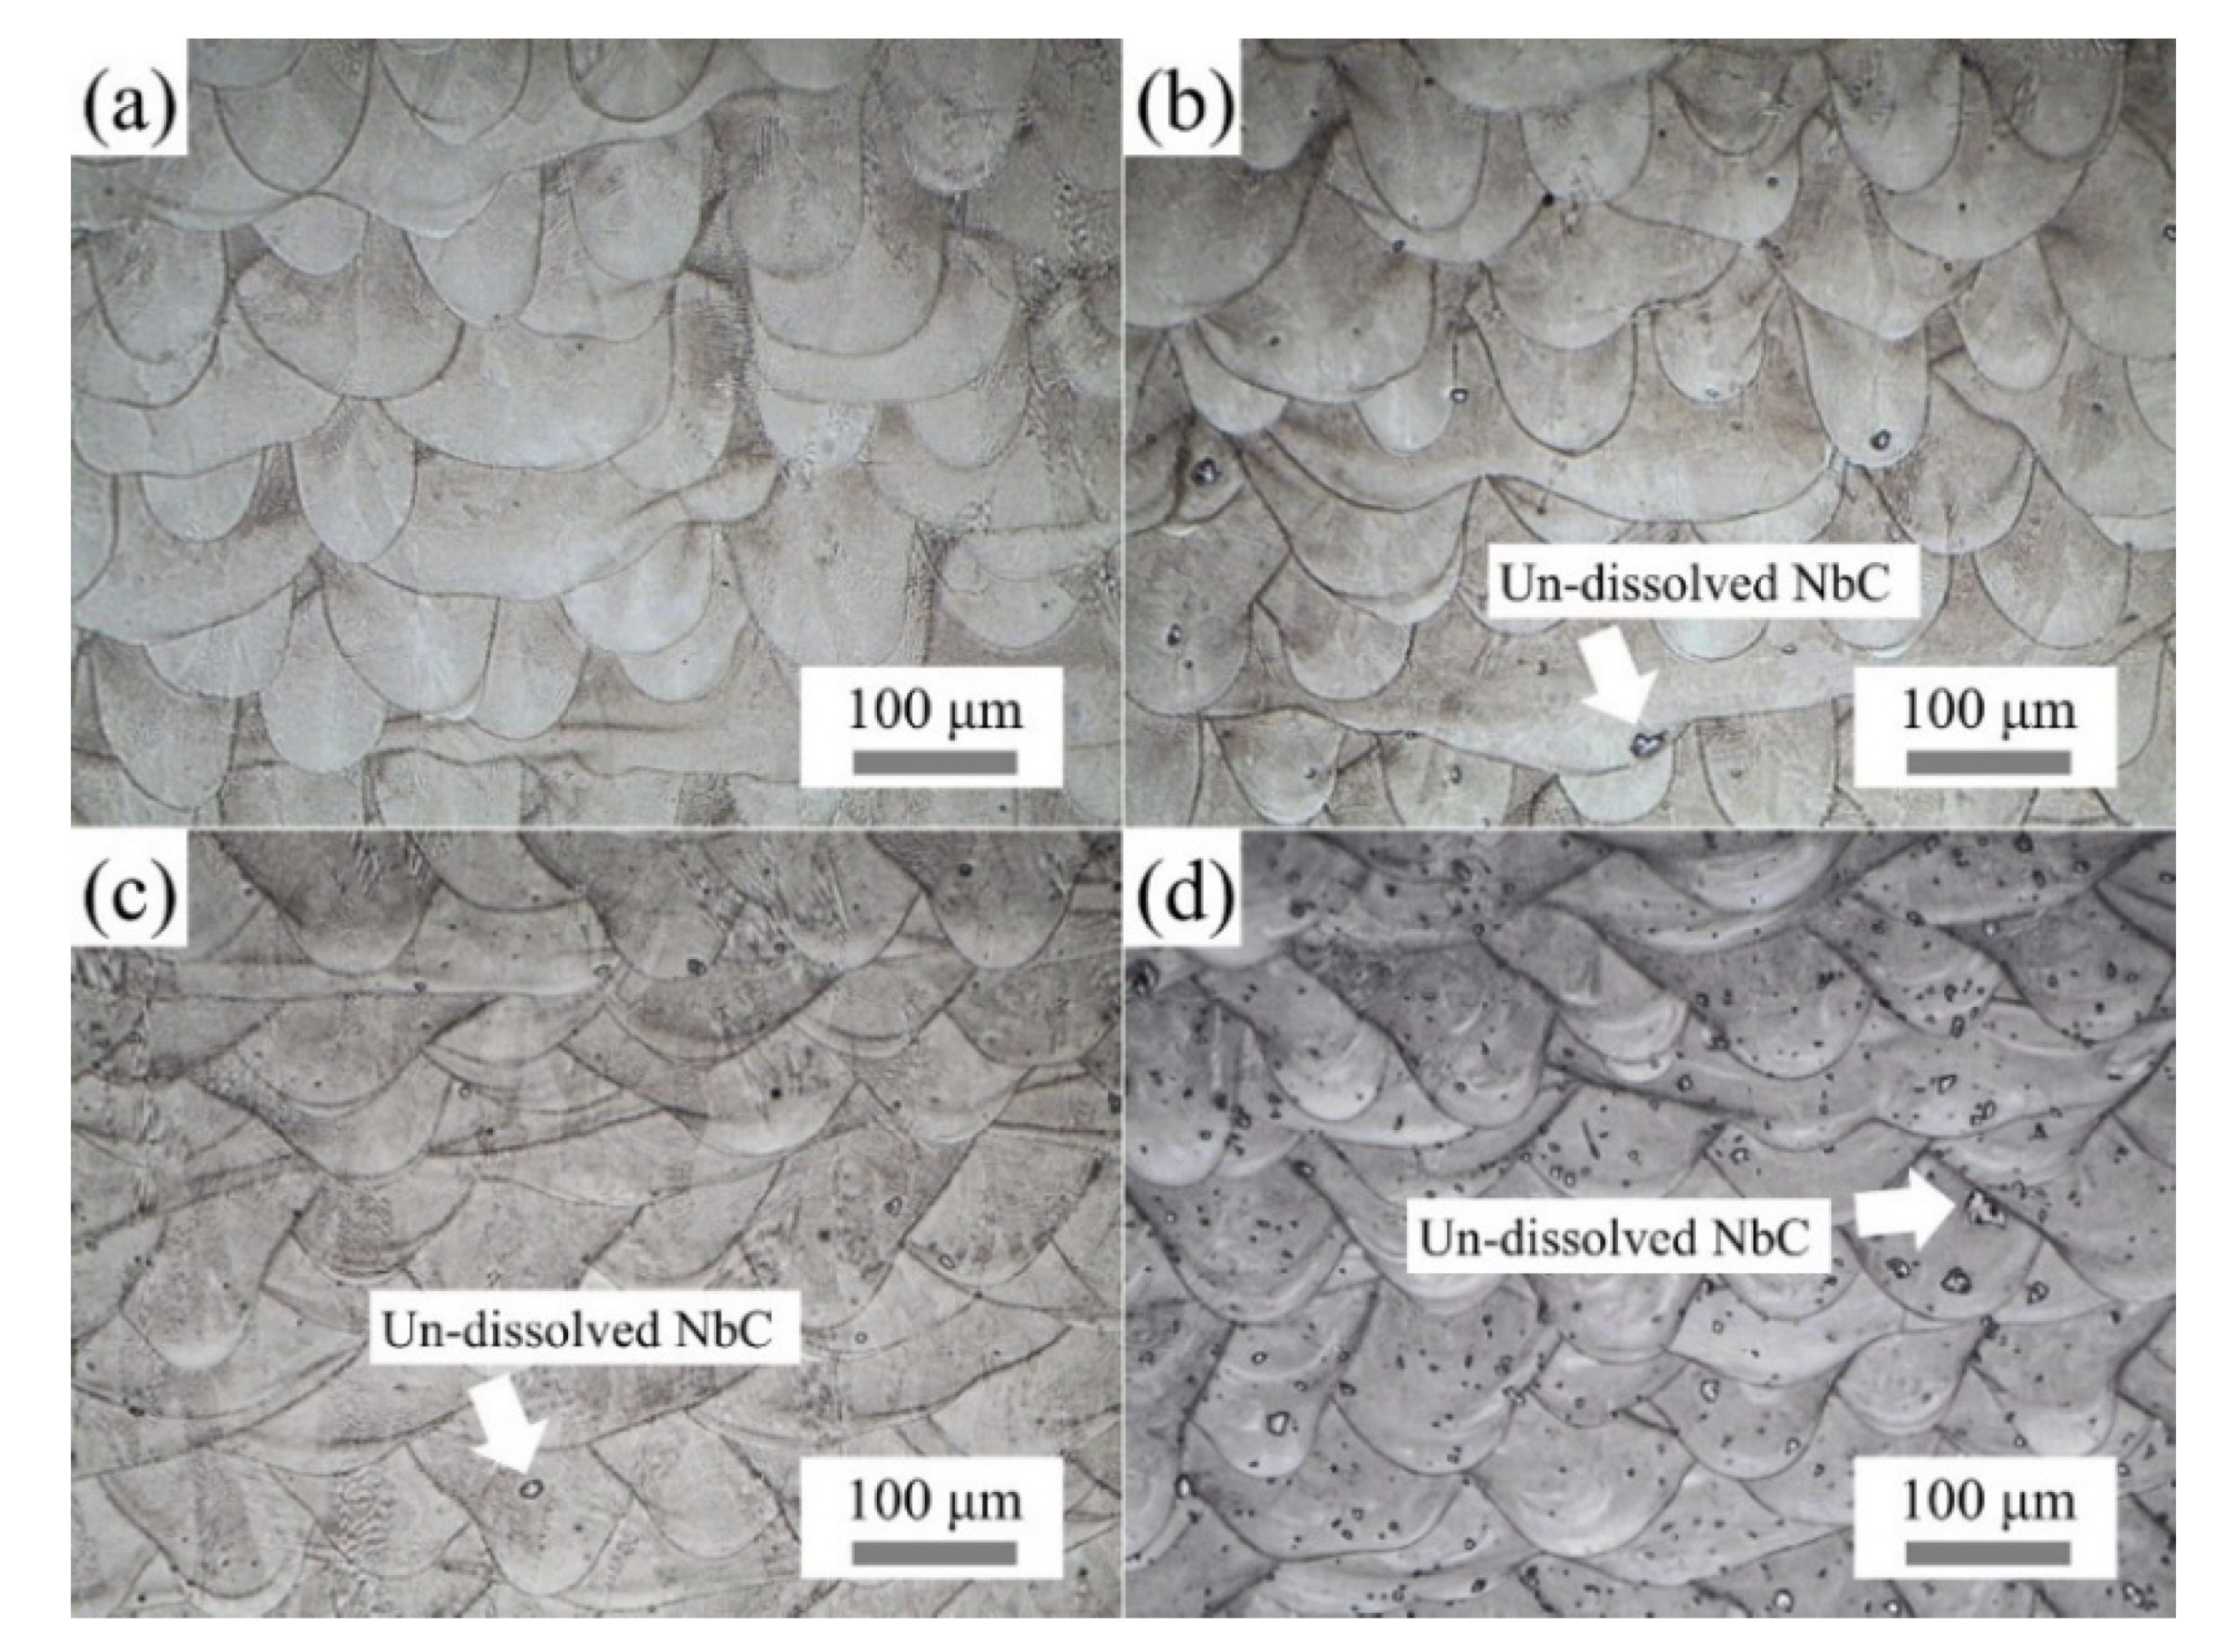
Figure 12. Dimples were observed in the matrix at most of the regions of fracture surfaces, and this suggests that the fracture of FCC matrix was ductile. However, some brittle fracture features were observed in the specimens with NbC additions. It was clear that cracks were formed associated with carbide particles; most of these cracked carbide particles with irregular morphology were the residual NbC flakes shown in
Figure 3. The fracture surfaces of DA specimens were similar to the STA specimens without NbC addition.
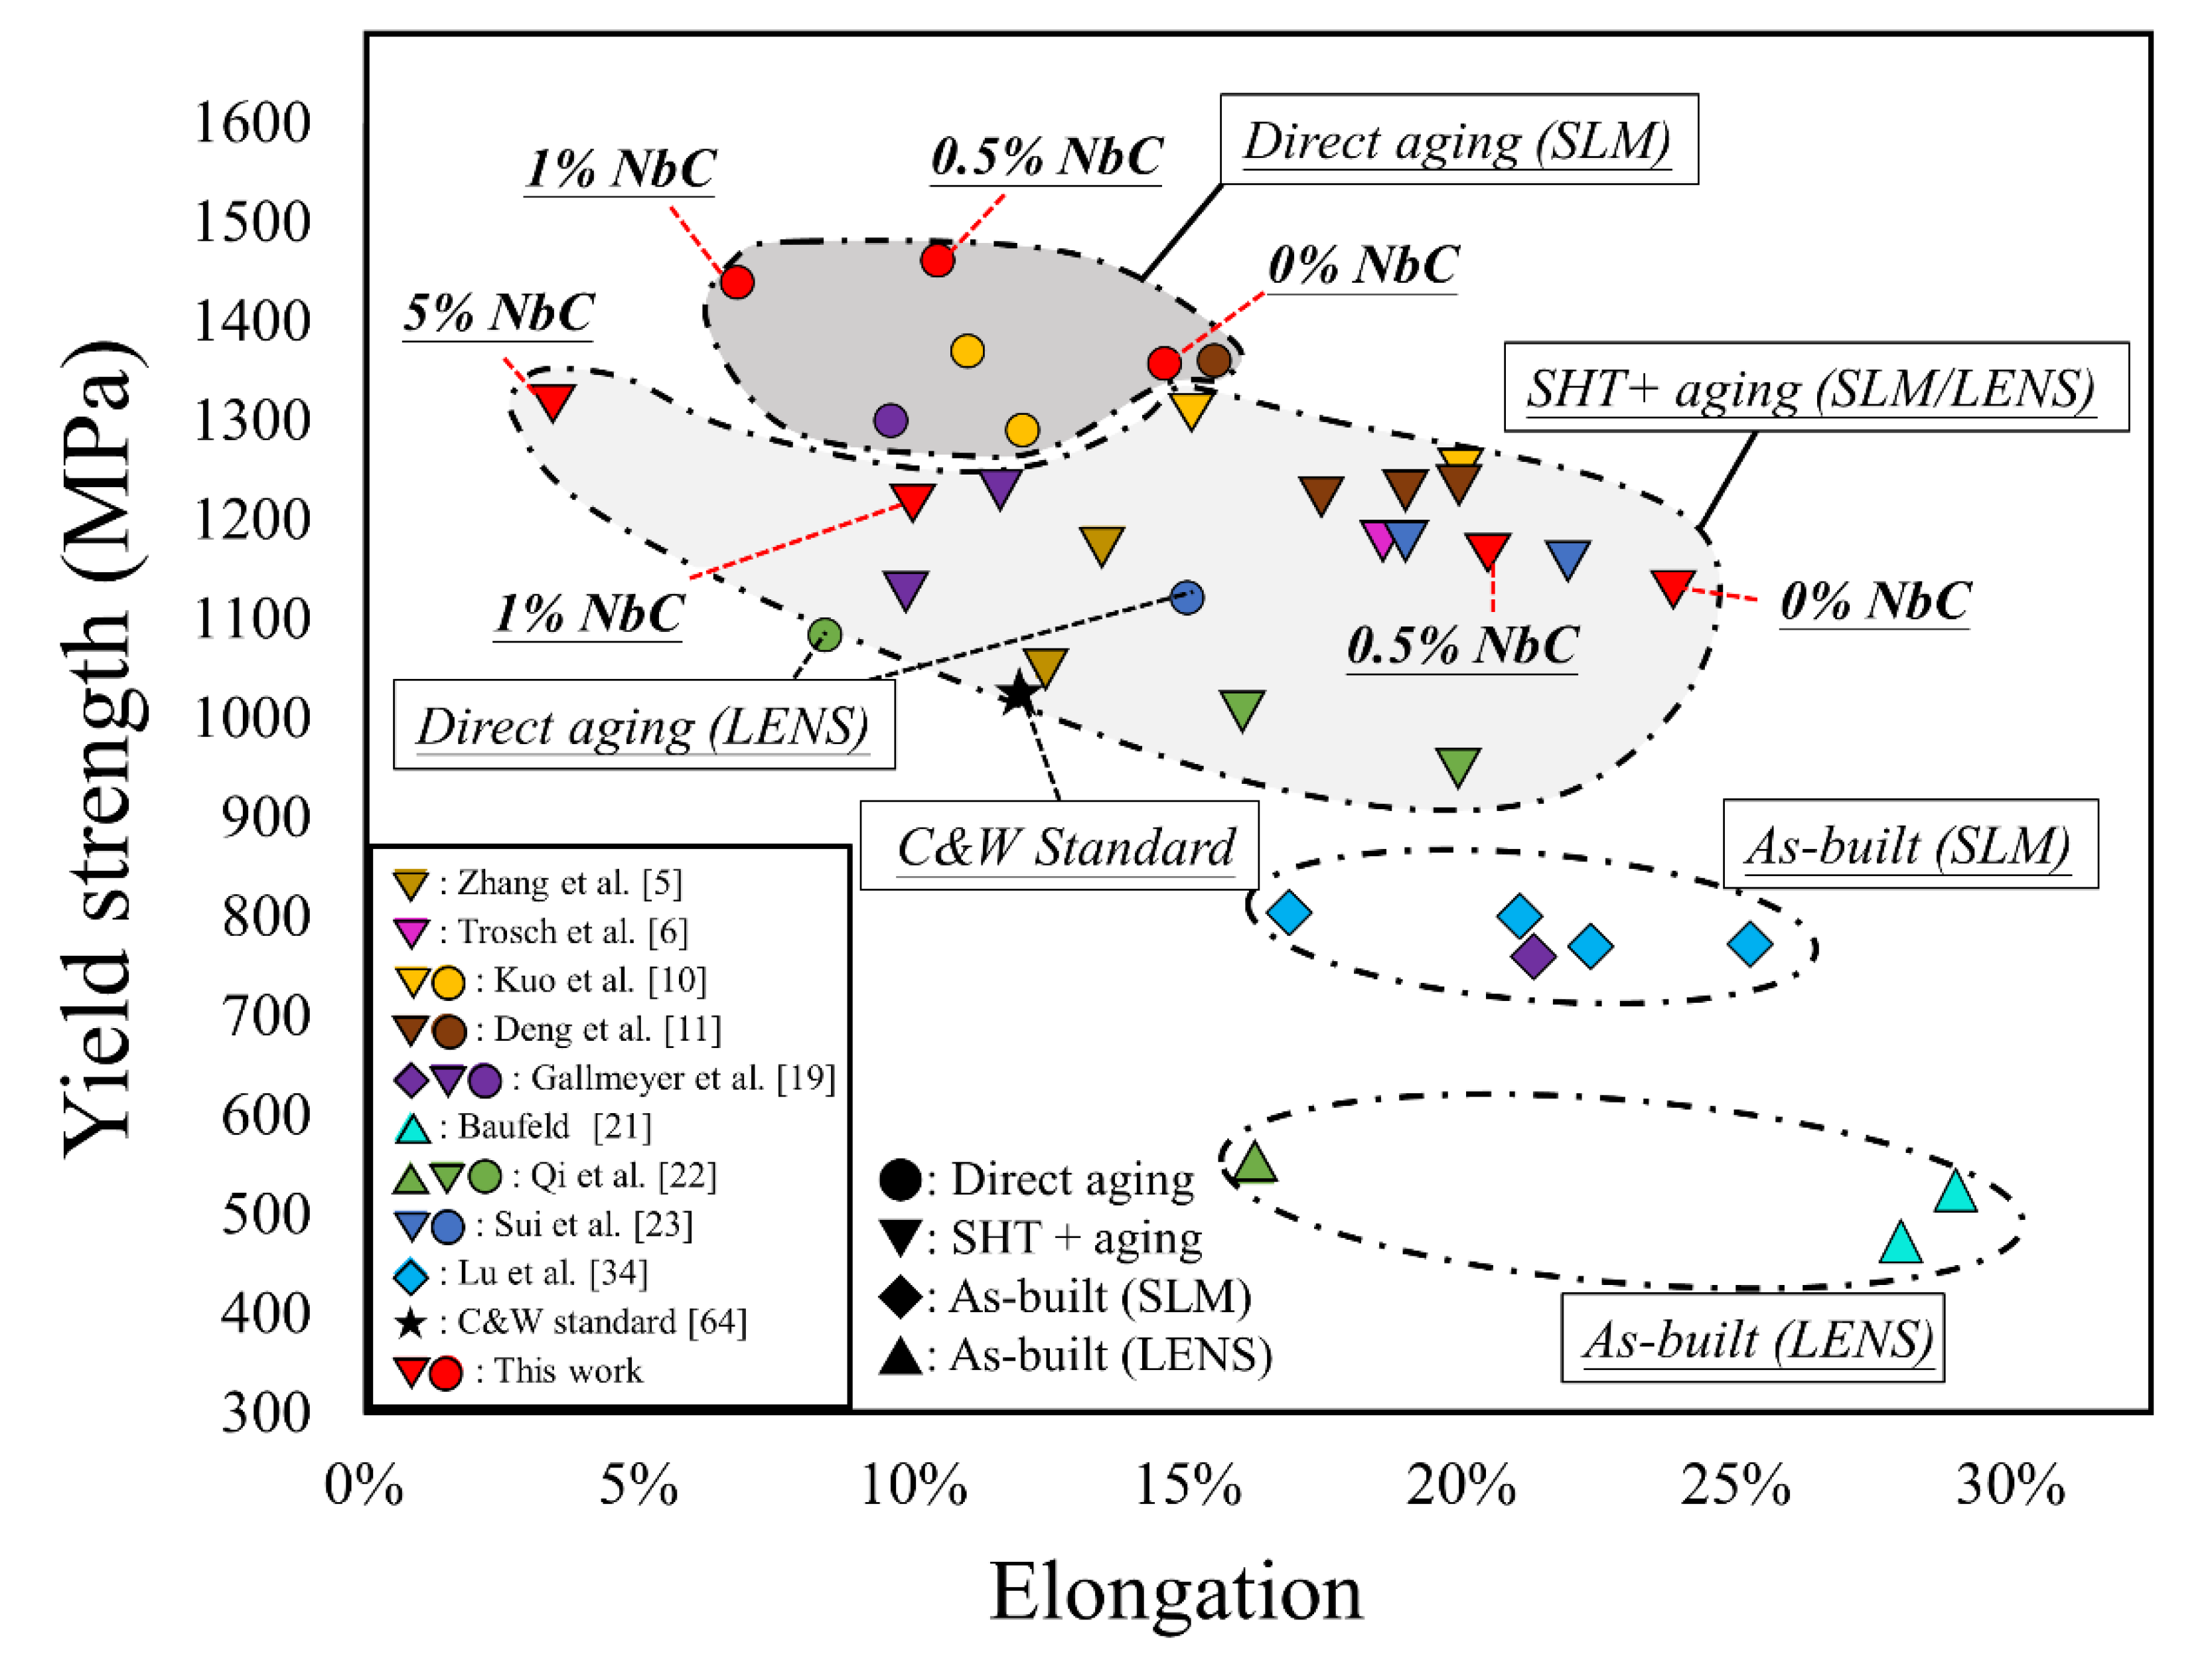
Results of tensile tests indicated that DA samples could exhibit higher strength than those of STA samples, as shown in
Figure 10, and NbC addition further increased the strength of specimens. However, degradations of strength and ductility were observed in DA specimens when NbC addition was more than 1.0%; brittle fracture occurred on large NbC particles shown in
Figure 11 and
Figure 12 were responsible for this observation. It should be noted that fracture particles larger than 10μm had multiple boundaries inside, which could also indicate that these were agglomeration of small flakes. These large NbC particles or agglomerations became stress concentration sites for brittle fracture; they broke during the tensile test, decreased the load-bearing volume. According to fracture toughness mechanism [
56], DA specimens were less ductile than STA specimens because they possessed high GND density, and stress in tension could trigger the propagation of crack along un-dissolved NbC particles without significant yielding. Because fractions of un-dissolved NbC increased with more NbC addition as shown in
Figure 3, this could lead to the degradation of mechanical properties for specimens with higher NbC contents. Analysis showed that strain hardening exponent decreased with both NbC additions and DA process,
Table 7. DA specimens had higher GND density prior to tensile test, and this implied DA specimens had been strain-hardened; hence, it could result in lower strain hardening rates and elongations. However, UTS of these DA specimens were still higher than those of STA specimens. Hence the significant strengthening in tension achieved in this work could be mainly attributed to the increase in yield strength. In the following section, 0.5% NbC specimen has been chosen for further discussion about each strengthening contributions in order to avoid the influence of un-dissolved NbC particles.
There are several factors that could affect the yield strength of alloy, and they can be expressed as the following equation [
23,
30,
57]:
where
σy is the YS of material.
σ0 is the strengthening contribution of matrix, and this term includes solid solution strengthening, stacking fault strengthening, friction stress [
29,
30,
31]. Other strengthening contributions include grain boundary
σG.B, precipitation
σγ′/σγ″, and strain hardening
σstrain. The exponent
k is a constant depending on the interaction between each factor [
57]. As shown in
Figure 8 and
Table 5, grain size changed with NbC content and heat treatment. Variation of grain size could influence tensile strength according to Hall-Petch relation; grain boundary could inhibit the movement of dislocation and hence smaller grains could provide higher strength to material [
56]. The relationship is expressed as the equation below:
where
d is grain diameter of matrix and
K is Hall-Petch coefficient related to material properties. Here,
K is chosen as 750 MPa μm
1/2 for superalloy [
58]. The average grain size in
Table 5 was used. Calculated strengthening contribution of grain boundary to STA specimens was 112.4 MPa for specimen without NbC, and the value increased to 135 MPa with 0.5% NbC addition. NbC addition also increased the strengthening contribution of grain boundary to DA specimen slightly, from 168 MPa to 174 MPa of 0.5% NbC addition. It is known that GND density could dominate the plastic deformation and working hardening of SLM FCC materials [
48], and it has also been reported that working hardening could increase proportionally with GND density [
42]. Assuming that residual strain of SLM components would not cause large distortion, then GND density data from
Table 6 could be used to estimate strengthening contribution by Taylor equation, which was used in previous studies [
30,
59,
60]. Taylor relation describes necessary shear stress to overcome stress field between each dislocation. The equation is described below [
56]:
where
M is Taylor factor (3 is assumed in this study),
G is the shear modulus of the matrix (76 GPa based on previous work [
58]),
b is Burgers vector, and
α is a value depending on the dislocation distribution. For heterogeneous distribution such as cellular structure, in which dislocations are accumulated along the cellular wall,
α value of 0.3 was used in this study [
59].
Estimated strengthening contribution of dislocation to STA specimens was 19.9 MPa for specimen without NbC and the value increased with 0.5% NbC addition to 29.3 MPa because that Zener drag could preserve some dislocation during heat treatment. On the other hand, NbC addition had less influence on strengthening contribution of dislocation to DA specimens. The strengthening contribution of dislocation to DA specimens was 110.5~117.7 MPa and was independent of NbC addition based on GND density data in
Table 6. Strengthening contribution of dislocation from thermal strain in this study was lower than previous literatures of other fused based AM processes [
29,
30,
31,
48], in which strengthening contribution of dislocation about 160~400 MPa was reported. It might be because a relatively low energy density and pre-heating baseplate were used in this study, and both could decrease the thermally induced stress during the SLM process [
61].
To estimate the strengthening contribution of primary strengtheners, i.e., γ′ and γ′′ precipitates, the following equation was used to describe the stress needed to cut through the particles [
62]:
where γ
APB is the anti-phase boundary energy (~175 mj/m
2 for γ′ and ~296 mj/m
2 for γ″ [
63]),
b is Burgers vector,
f is the volume fraction of the particle,
d is the particle diameter,
T is a tension equal to
Gb2/2, and
G is the shear modulus of the matrix. In this study, long axis diameter of particles shown in
Figure 7 is chosen as diameter to simplify the calculation (~13 nm).
It is hard to determine the volume fractions of γ′ and γ″ even with TEM images. Previous work used phase compositions to estimate the fraction of each phase in Inconel 718 [
23]. For DA specimen, γ″ fraction was about 13.9 vol% and γ′ fraction was 5.13 vol%; for STA specimens, γ″ fraction was about 16.9 vol% and γ′ fraction was 5.37 vol%. NbC addition did not influence the fractions and sizes of γ′ and γ″ particles; the strengthening contributions of γ″ and γ′ to STA specimen were about ~596 MPa and ~173 MPa, respectively. Moreover, for DA process, the values slightly decreased to ~565 MPa and ~170 MPa, respectively.
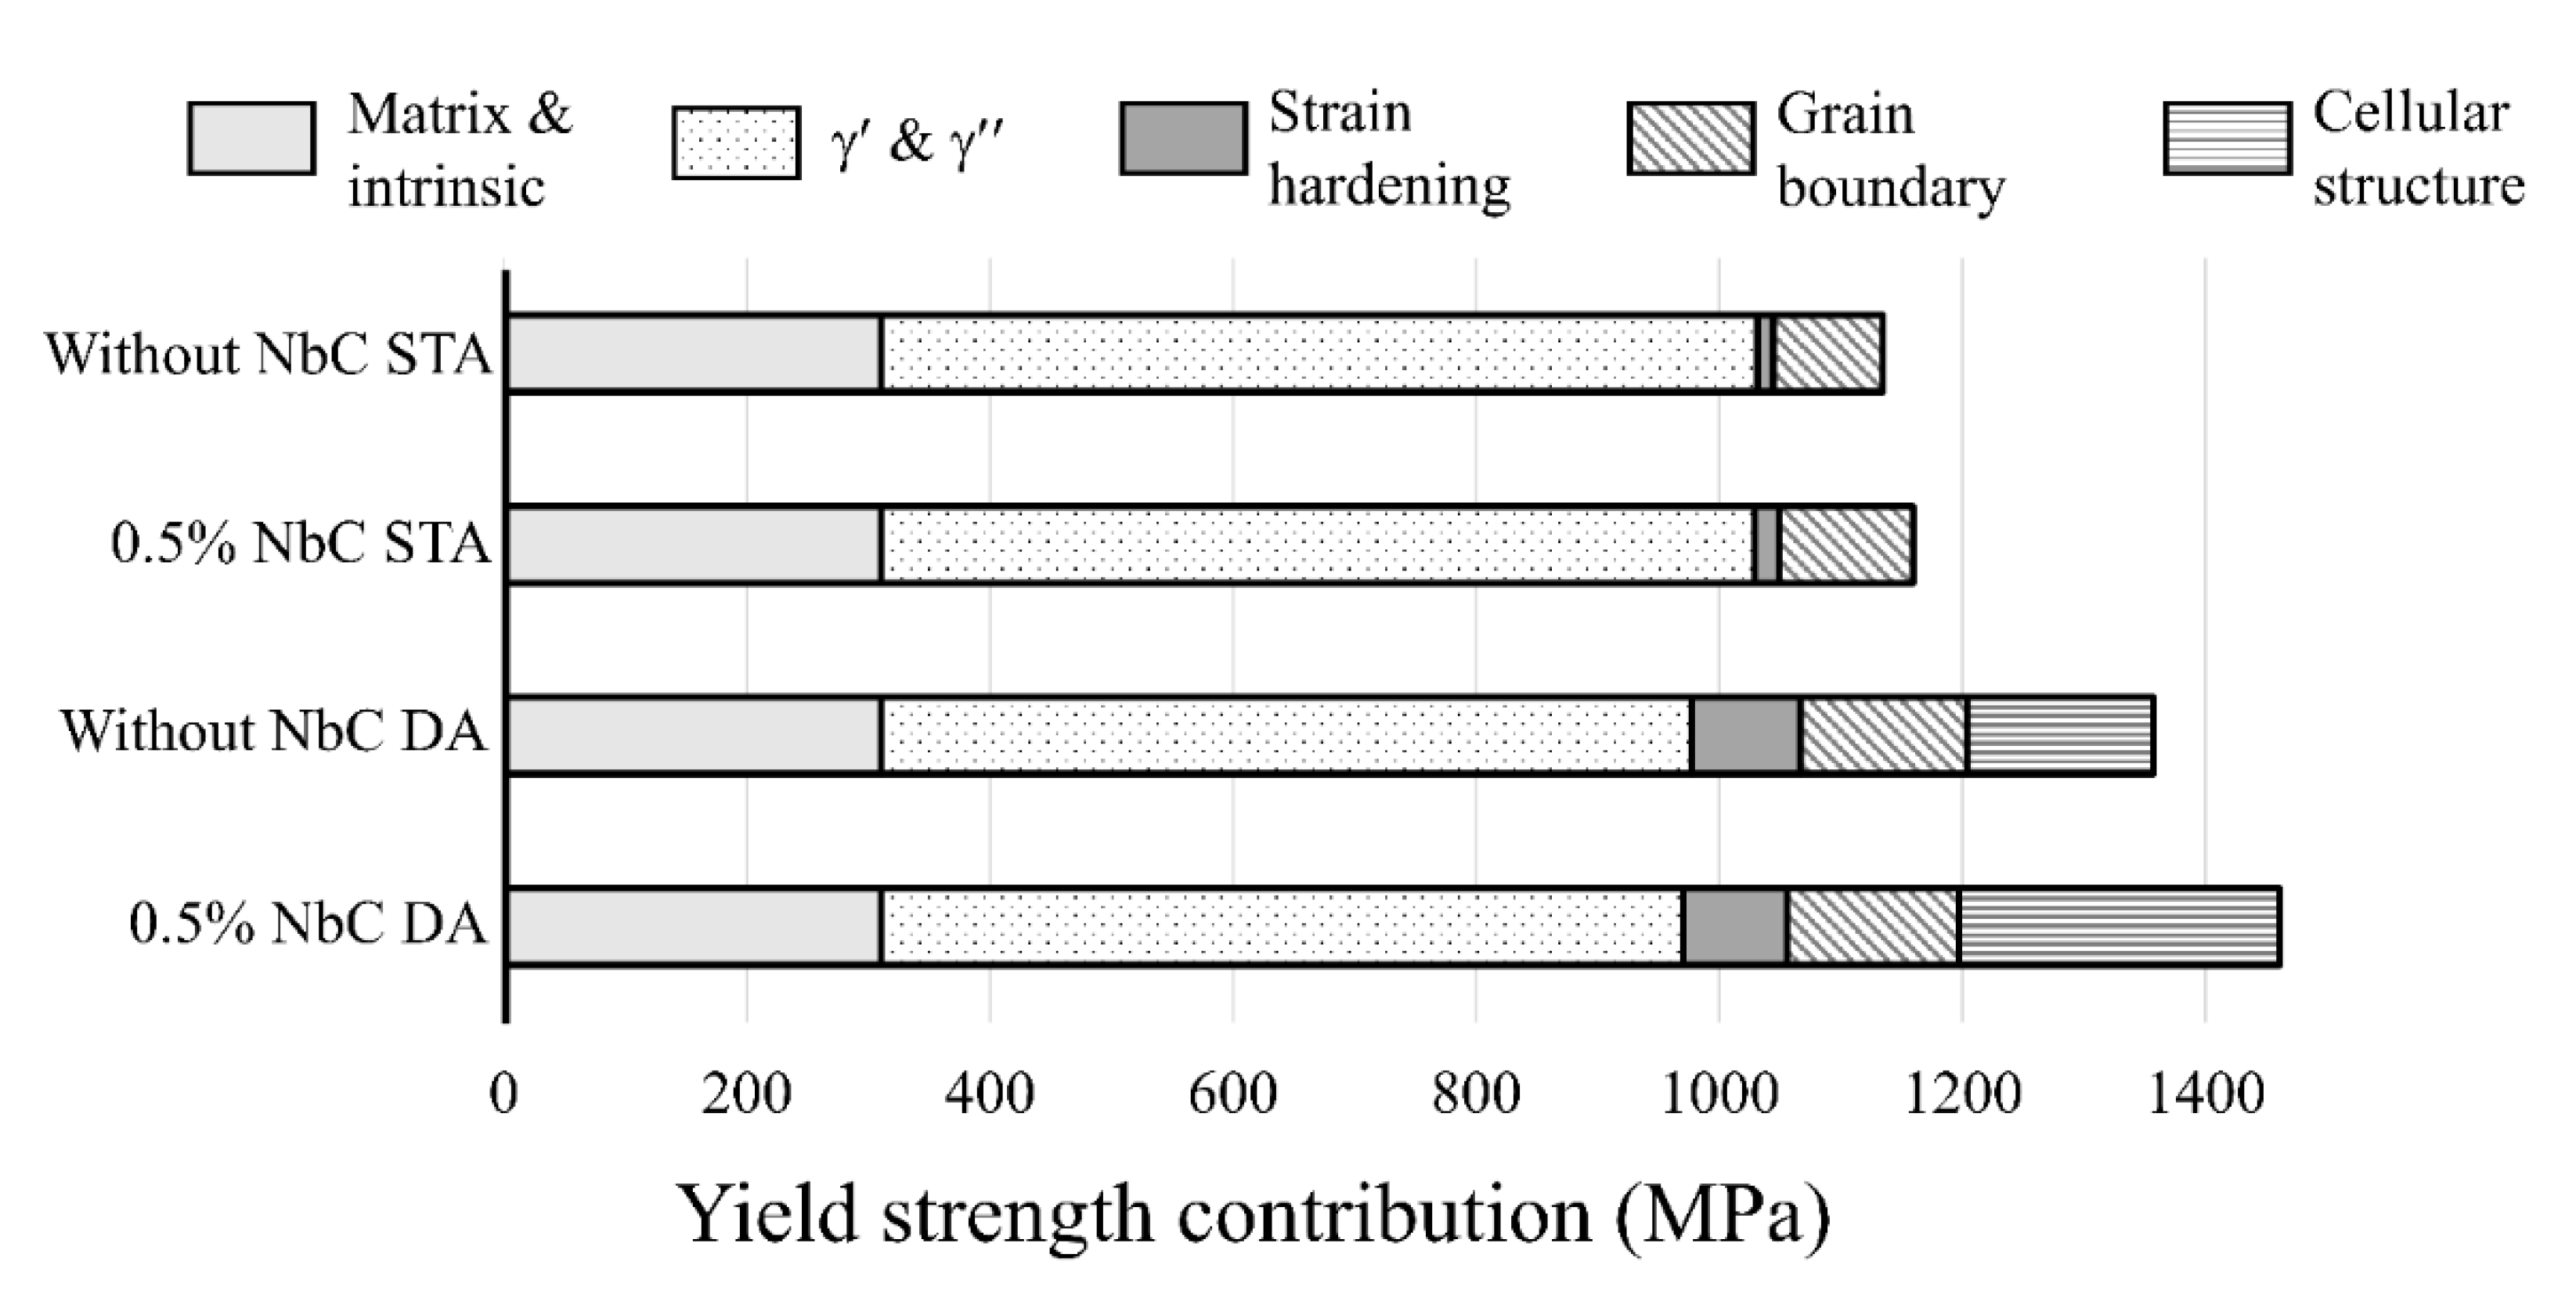
An extra factor termed “cellular structure strengthening” (
σcell) has been introduced in this work in order to describe the extra strength of DA specimen. This factor is a combination of sub-grain boundary associated with cell structure and hard particles (Laves and carbide) along cellular wall. The exponent
k in Equation (4) was adjusted based on the assumptions below: (1) DA specimens and corresponding as-built specimens had similar
σcell and (2) the estimated YS was close to the experimental data. The deduction gave an exponent
k ~1.11, which is close to that of previous work (1.14~1.17) [
23]. Hence, each strengthening contributors of STA and DA specimens can be presented in
Figure 13. Based on the deduction, it is shown that for DA specimens, in addition to primary strengtheners, grain refinement and residual strain, cellular structure could provide further strengthening to Inconel 718. Without NbC addition, DA process could increase the yield strength by 222.7 MPa compared to that of STA without NbC content; with 0.5% NbC, an increase of 326.2 MPa was achieved. Based on the deduction, it is shown that for DA specimens, in addition to primary strengtheners, grain refinement and residual strain, cellular structure could provide further strengthening to Inconel 718. Since the STA process removed the cells while DA process preserved the cellular structure, NbC addition could further refine cell size and strengthen the cell walls; hence, a significant increase in yield strength beyond 1400 MPa could be achieved.


 ,
, 


