Article

Mechanical Behavior Assessment of Ti-6Al-4V ELI Alloy Produced by Laser Powder Bed Fusion

1
Department of Materials Science and Engineering, University of Central Florida, Orlando, FL 32751, USA
2
Department of Mechanical Engineering, Marquette University, Milwaukee, WI 53233, USA
3
Fusion Energy Division, Oak Ridge National Laboratory, Oak Ridge, TN 37830, USA
4
Idaho National Laboratory, Idaho Falls, ID 83415, USA
*
Author to whom correspondence should be addressed.
Metals 2021, 11(11), 1671; https://doi.org/10.3390/met11111671
Submission received: 3 September 2021 / Revised: 8 October 2021 / Accepted: 14 October 2021 / Published: 20 October 2021

Abstract

:
The present work correlates the quasi-static, tensile mechanical properties of additively manufactured Ti-6Al-4V extra low interstitial (ELI, Grade 23) alloy to the phase constituents, microstructure, and fracture surface characteristics that changed with post-heat treatment of stress relief (670 °C for 5 h) and hot isostatic pressing (HIP with 100 MPa at 920 °C for 2 h under an Ar atmosphere). Ti-6Al-4V ELI alloy tensile specimens in both the horizontal (i.e., X and Y) and vertical (Z) directions were produced by the laser powder bed fusion (LPBF) technique. Higher yield strength (1141 MPa), higher tensile strength (1190 MPa), but lower elongation at fracture (6.9%), along with mechanical anisotropy were observed for as-stress-relieved (ASR) samples. However, after HIP, consistent and isotropic mechanical behaviors were observed with a slight reduction in yield strength (928 MPa) and tensile strength (1003 MPa), but with a significant improvement in elongation at fracture (16.1%). Phase constituents of acicular α′ phase in ASR and lamellar α + β phases in HIP samples were observed and quantified to corroborate the reduction in strength and increase in ductility. The anisotropic variation in elongation at fracture observed for the ASR samples, particularly built in the build (Z) direction, was related to the presence of “keyhole” porosity.

1. Introduction

Additive manufacturing (AM), commonly known as 3D printing, typically refers to a process in which an engineering component is built, layer-by-layer, close to their final (net) shape. This net-shape capability of manufacturing with a high degree of resolution from a computer aided design (CAD) model and the ability of powder recycling makes the AM technology an excellent route for customized manufacturing. The high cooling rates and high thermal gradient during the build, for example, through laser-based AM, leads to a very fine microstructure and the formation of columnar grains that can create anisotropy in the mechanical properties [1,2,3,4,5]. The as-built AM components can suffer from manufacturing defects such as keyhole porosity and lack-of-fusion flaws [6,7,8]. The ability to produce a fine microstructure in components can lead to a higher strength but at the expense of reduced ductility and fracture toughness. Consequently, post-AM heat treatment has become an indispensable tool for the AM components in order to reduce some of the fabrication limitations and to obtain the desired mechanical properties [9,10,11,12,13,14,15,16,17]. While the challenge in AM may be defined by manufacturing components with a combination of superior strength, ductility, and fracture toughness in the as-built state [11,18,19], heat treatment of the component has always been a part of the manufacturing process for any manufacturing process.
The high specific strength, good corrosion resistance, excellent biocompatibility, and low radioisotope transmutation under neutron bombardment of titanium alloys enable numerous applications in aerospace, biomedical, petrochemical, and specialty nuclear applications. The most popular titanium alloy, also recognized as the “workhorse alloy” in the titanium industry is Ti-6Al-4V, which consists of an α + β microstructure, where α (stabilized by Al) is the low temperature hexagonal close packed (hcp) phase and β (stabilized by V) is the high temperature body centered cubic (bcc) phase [20].
The as-built microstructure of the AM built Ti-6Al-4V components tends to be fine, needle-shaped, acicular α′ martensite because of the high cooling rate, although at times, Widmanstätten and α + β structures can be observed depending on the powder-based manufacturing process employed [17,20,21,22,23]. Columnar β grains oriented in the build direction (Z) can appear in the microstructure, which suggests that during solidification, the high temperature β phase nucleates onto itself and grows across the build layers [17,20,21,22,23]. Application of stress-relief treatment minimizes the residual stresses typically observed in the as-built [24,25,26,27,28,29] part, and hot-isostatic pressing (HIP) leads to a significant improvement in ductility and fatigue strength by closing the pores and flaws [30,31,32,33]. Qiu et al. [22] examined the anisotropy in ductility for the selective laser melting (SLM) built Ti-6Al-4V alloy, both in the as-built condition and after HIP, and reported an improvement in ductility with a reduction in strength, but anisotropy in ductility was reported to persist. Kasperovich et al. [34] reported higher % elongation at fracture of 19.4%, yield strength of 885 MPa, tensile strength of 973 MPa, and Young’s modulus of 115.4 GPa by a two-step heat treatment. Leuders et al. [32] also reported an improvement in % elongation at fracture by heat treatment and HIP of Ti-6Al-4V alloy. Vrancken et al. [35] carried out an exhaustive study on the heat treatment of SLM printed Ti-6Al-4V and was able to obtain maximum ductility of 12.84 ± 1.36% compared to 7.36 ± 1.32% for as-built parts. Cao et al. [36] reported the static coarsening mechanism of selective laser melted Ti-6Al-4V with a lamellar microstructure.
Titanium does not have a widespread use in the commercial nuclear industry (i.e., commercial power plants) due to its moderate neutron capture cross section. However, it is used in specialty nuclear research application, as it does not transmute into long-lived radioactive isotopes. In fact, Ti, Al, and V are three of the very best metals for this purpose. The purpose of this study was to correlate the quasi-static, tensile mechanical behavior of Ti-6Al-4V ELI alloy to the phase constituents and microstructure that changed after post-heat treatment of stress relief and HIP. Laser powder bed fusion (LPBF) technique was employed to build Ti-6Al-4V ELI alloy tensile specimens in both the horizontal (i.e., X and Y) and vertical (Z) directions with respect to the build direction (Z). Findings from phase constituent quantification, microstructural analysis, and fracture surface examination were correlated to the difference in mechanical behavior observed for the as-stress-relieved (ASR) and HIP Ti-6Al-4V ELI alloy specimens built in X, Y, and Z directions. Furthermore, to examine the coarsening behavior of the α + β microstructure, which may be of interest to better explore the HIP process, heat treatment was carried out for the Ti–6Al-4V ELI alloy specimens below the β transus temperatures to document the microstructure coarsening kinetics as functions of temperature and time.

2. Experimental Details

2.1. Materials and Samples

As-stress relieved (ASR) and hot isostatically pressed (HIP) Ti-6Al-4V ELI alloy tensile specimens were produced by using OEM recommended LPBF parameters on 3D Systems ProX DMP 320 (3D Systems, Rockhill, SC, USA) with LaserForm® Ti-6Al-4V ELI (Grade 23) powders (3D Systems, Rockhill, SC, USA). This instrument has a build platform of 275 mm × 275 mm × 420 mm, and is equipped with a continuous laser with a maximum power of 500 W, 1070 nm in wavelength, and 70 µm in beam size. Commercially, two types of powders can be used for the AM of Ti-6Al-4V alloy components: grade 23 Ti-6Al-4V extra low interstitial (ELI) and grade 5 Ti-6Al-4V, which differ in the reduction of oxygen content to 0.13% (maximum) in grade 23. This reduction in oxygen content in Ti-6Al-4V ELI (grade 23) powder provides an improvement in ductility and fracture toughness, however, with a minor reduction in strength [37]. LaserForm® Ti-6Al-4V ELI (Grade 23) is an extra low interstitial grade with lower iron, carbon, and oxygen content, and is known for a higher purity that yields consistent strength, ductility, and fracture toughness [37]. There were nine ASR and nine HIP specimens, built both in the horizontal (3 in X and 3 in Y) and vertical (3 in Z) directions with respect to the build direction (Z). Laser power of 270 W, scan speed of 1800 mm/s, slice thickness of 30 µm, and hatch spacing of 85 µm, as per the recommended parameters, were employed. The samples were 160 mm long, and had diameters of 8 mm and 14 mm through the gauge and grip sections, respectively. The gauge section was 60 mm. These were identified as sample series A, B, and C respectively, as listed in Table 1.
The ASR Ti-6Al-4V ELI samples underwent stress relief heat treatment, which consisted of heat treatment at 670 °C for 5 h followed by furnace cooling. HIP was performed at 920 °C for 2 h with a gas pressure of 100 MPa, followed by controlled air cooling from 920 °C to 150 °C in 12 h with an estimated cooling rate of 0.02 °C/s. All heat treatments were performed while the components were attached to the build platform.

2.2. Mechanical Testing and Heat Treatment

Tensile properties were determined for the samples produced with optimum LPBF parameters. Minor mechanical machining was carried out so that the tensile testing could be performed with digital image correlation (DIC) (e.g., painted optically smooth surface) and in accordance with the ASTM E8/E8M standards. Each sample tested had a gauge length and diameter of 60 mm and 8 mm, respectively. The total length and diameter of the sample were 160 mm and 14 mm, respectively. Room temperature uniaxial tensile tests were carried out quasi-statically using a MTS universal testing that had a 110 kN frame with a 110 kN load cell. The tensile loading rate of 0.01 mm/s was used. A quasi-static strain rate of 4 × 10⁻⁴ s−1 was applied for all tests. All deformations were recorded and measured by the DIC technique. The system consists of a Tokina AT-X Pro macro 100 mm f/2.8–d lens (Tokyo, Japan) with a resolution of 2448 × 2048 and VIC-2D 2009 software by Correlated Solutions, Inc. (Irmo, SC, USA). One DIC camera placed perpendicular to the specimen plane was used for all tests. The capture frequency was 1 Hz. Engineering stress-strain curves were obtained with a MTS machine force with a virtual extensometer through DIC analysis.
The hardness of the ASR and HIP samples was measured using a Leco (St. Joseph, MI, USA) LV700TM Vickers hardness tester with a load of 10 kgf and a dwell time of 10 s. All samples were polished down to 1 µm surface finish before the hardness measurement. Five measurements were performed on each sample for the average and standard deviation.
To investigate the coarsening behavior of the α + β microstructure in the HIP Ti-6Al-4V ELI alloy samples, heat treatment was carried out below the β transus temperature (~1000 °C). The starting α + β microstructure found in HIP samples built in the X direction (HIP-A series) was heat treated at 920, 950, and 970 °C as a function of time (i.e., 2, 5, 20, 100, and 200 h), followed by air cooling. For heat treatment, sectioned samples (discs with a diameter of 14 mm and height of 6 mm approximately) were encapsulated in a quartz tube and purged with ultra-high purity (UHP) Ar and H2 (five times each) until a vacuum of 10−6 torr was achieved. The quartz tube was eventually backfilled with UHP Ar to impart 1 atm pressure at elevated temperature before sealing with an oxy-acetylene torch. Based on the optical micrographs, lamellar width (20 readings for each sample) was quantified by ImageJ (National Institute of Health) image analysis software. The process was repeated on three optical micrographs and the average lamellar width was determined based on 60 measurements per sample.

2.3. Microstructural Characterization

Sample densities were determined first by the Archimedes method and image analysis prior to detailed microstructural characterization. The Ti-6Al-4V ELI alloy samples were sectioned by a diamond sectioning saw into XZ, YZ, and XY cross sections. Each sample sectioned was mounted in epoxy and prepared metallographically by grinding and polishing. The unetched optical micrographs were examined and analyzed with the ImageJ software to determine the number of pores/flaws. Keller’s reagent was then used to observe the cross-sectional phase constituents and microstructure by a Nikon Metaphot optical microscope.
X-ray diffraction (XRD) was carried out for phase identification and preferred crystallographic orientation analysis using a PANalytical Empyrean™ diffractometer with Cu target Kα radiation operating at 45 kV and 40 mA. A step size of 0.03° and a counting duration of 90 s were employed for good resolution and statistical significance. Quantitative phase analysis of the XRD data was performed using Rietveld refinement within Malvern Panalytical (Westborough, MA, USA) HighScore Plus software (version 4.1). The parameters required to run the Rietveld refinement for the Ti-6Al-4V ELI alloy were taken from the published crystallographic data from Springer Materials available online [38]. Corresponding weighted Rprofile (Rwp) and goodness of fit (GOF) were checked consistently after every execution of fit. Typically, in a good fit, Rwp should be less than 10% and GOF should be less than 4 [39] for consistent Rietveld refinement results.
Field emission scanning electron microscope (FE-SEM, Zeiss Ultra-55TM; Zeiss USA, White Plains, NY, USA) equipped with X-ray energy dispersive spectroscopy (XEDS) was used to examine the fracture surface morphology, cross-sectional phase constituents, and microstructure. Detailed microstructure and crystal structure of phases present were investigated by using a transmission electron microscope (TEM, FEI/Tecnai F30; Thermo Fisher Scientific, Hillsboro, OR, USA) equipped with an XEDS. In situ lift out (INLO) technique was employed to obtain site-specific TEM thin foils by using a focused ion beam (FIB, FEI TEM200; Thermo Fisher Scientific, Hillsboro, OR, USA).

3. Results and Analysis

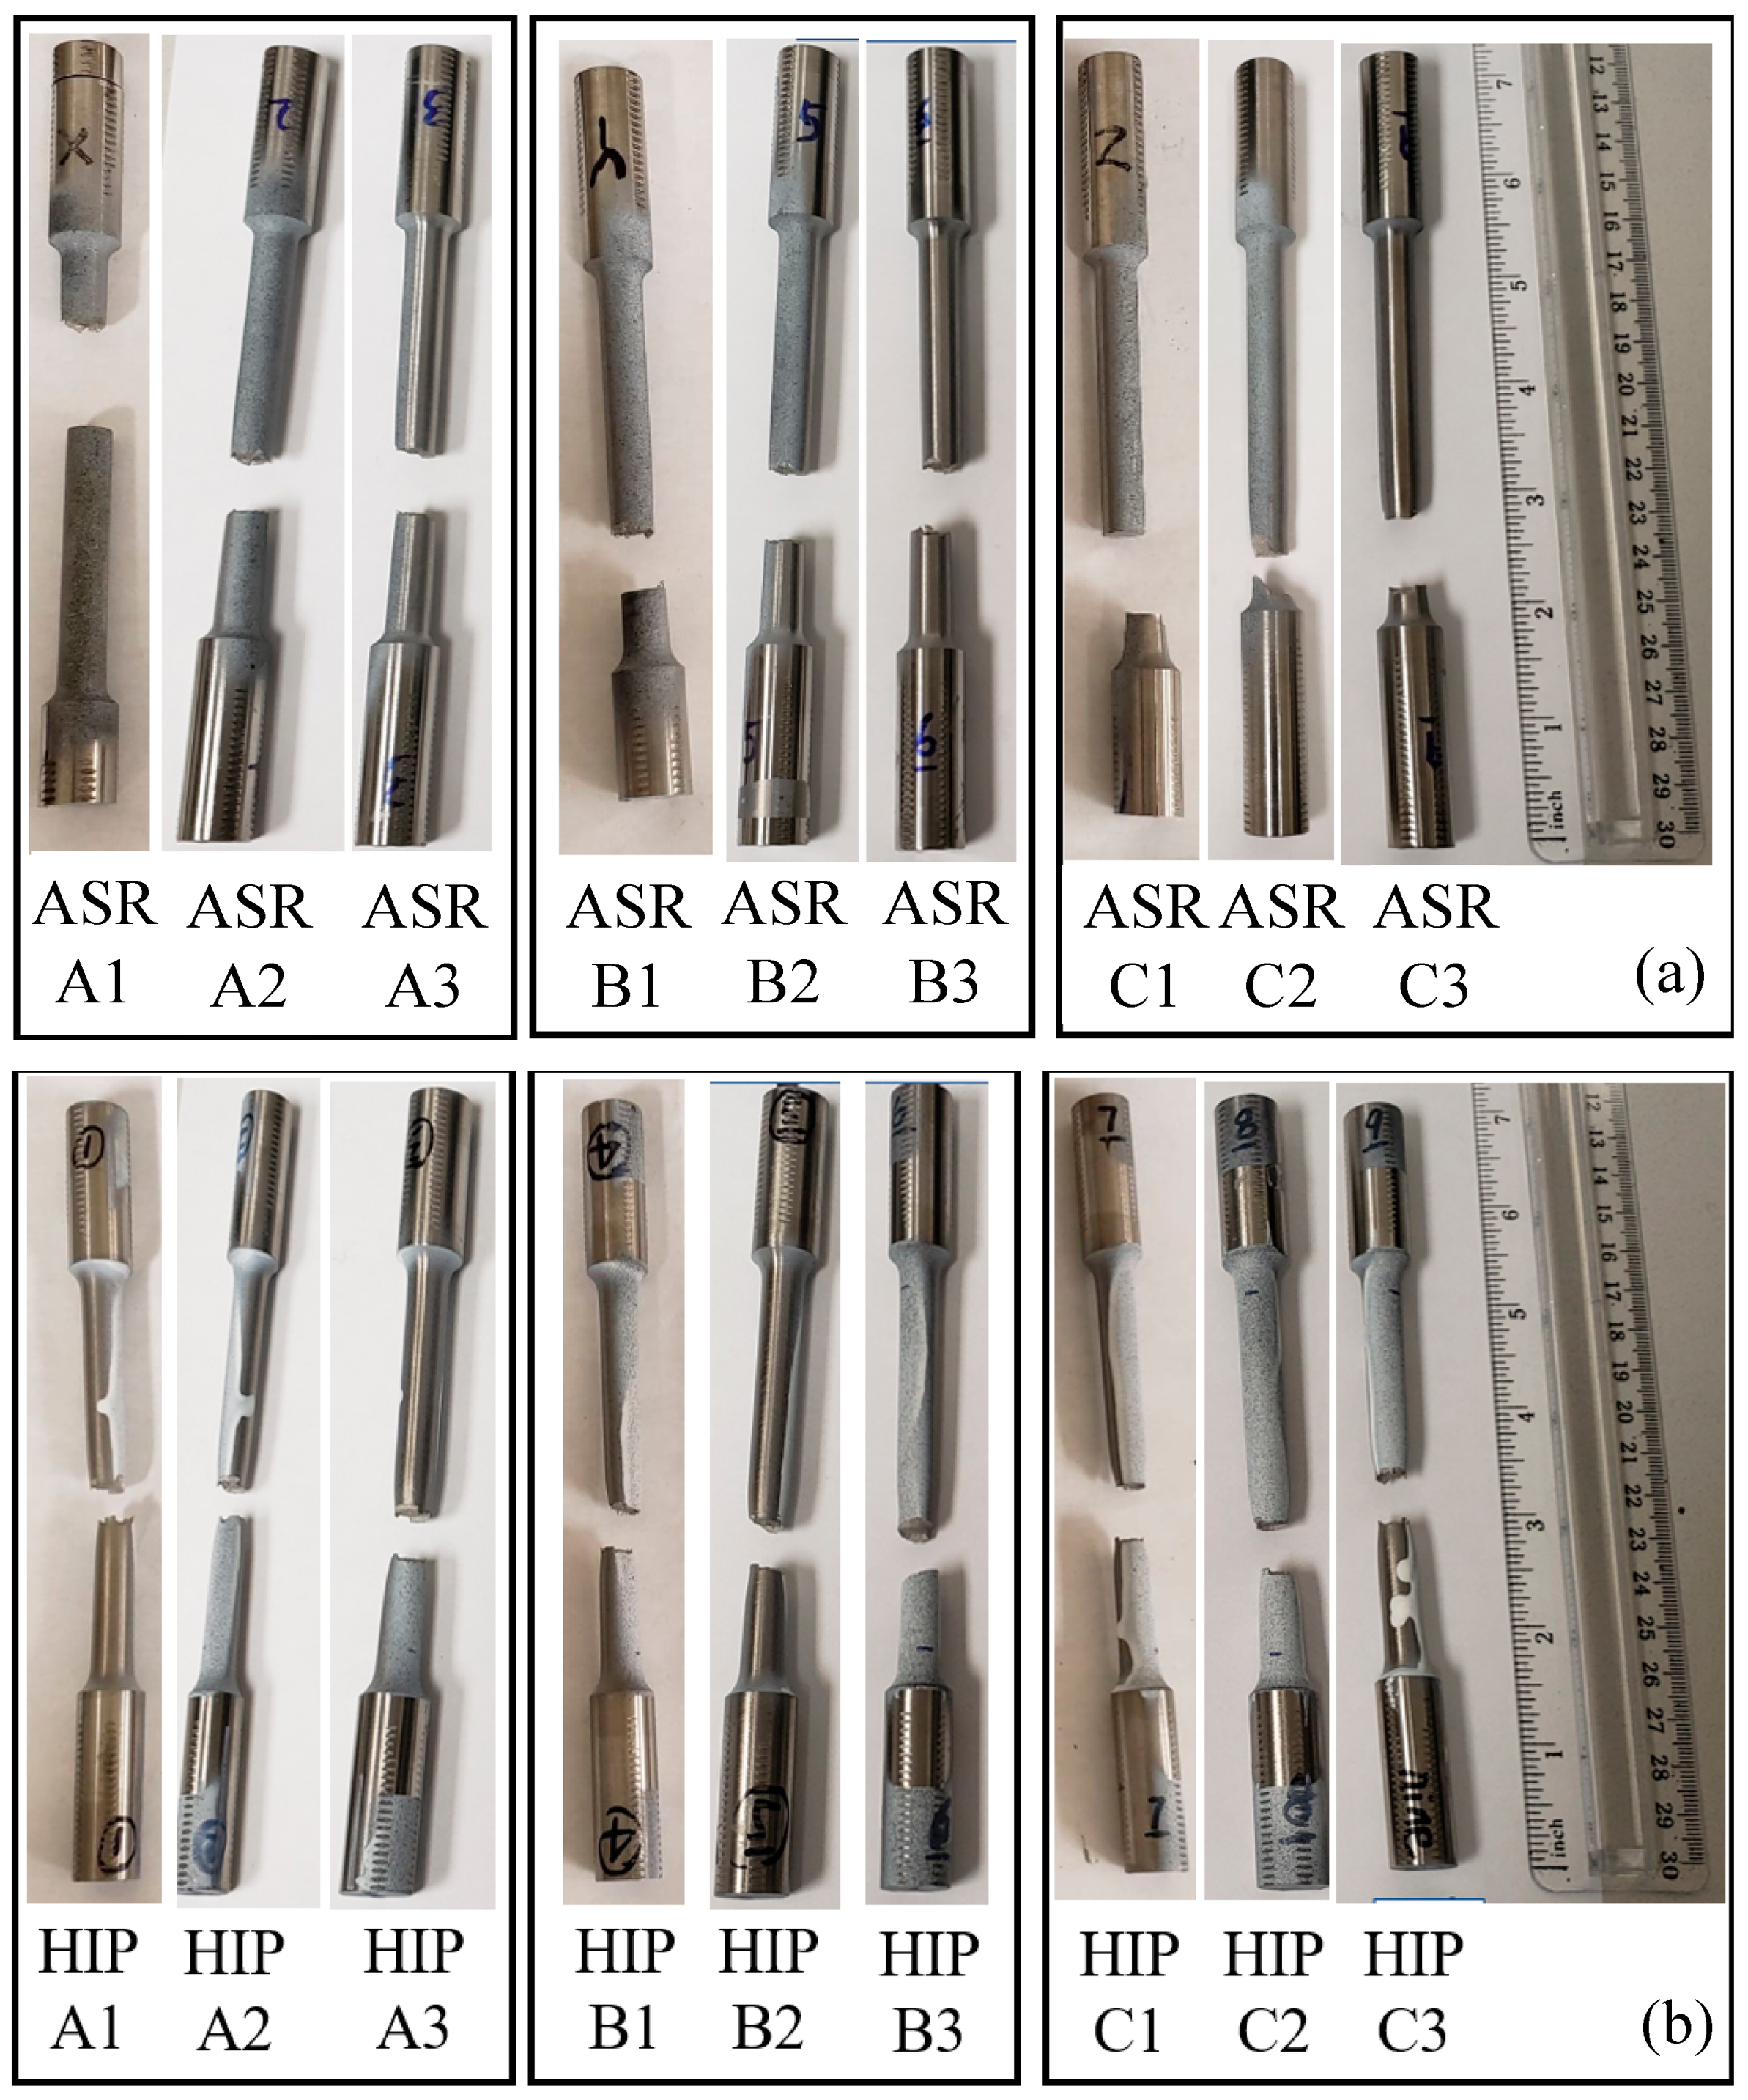
3.1. Visual Examination of Specimens after Tensile Testing

Figure 1 presents the macro photographs of the ASR and HIP Ti-6Al-4V ELI tensile specimens after fracture. Inconsistency in the location of fracture, although all within the gauge length, was observed. In particular, for the vertically built ASR samples (ASR-C1, ASR-C2, and ASR-C3), the fracture occurred away from the middle of the gauge section. On the other hand, the HIP samples fractured consistently within the middle of the gauge section, as shown in Figure 1. A close examination of these photographs also demonstrates that the HIP samples fractured after necking, while this type of plastic deformation was not visible for the ASR samples.

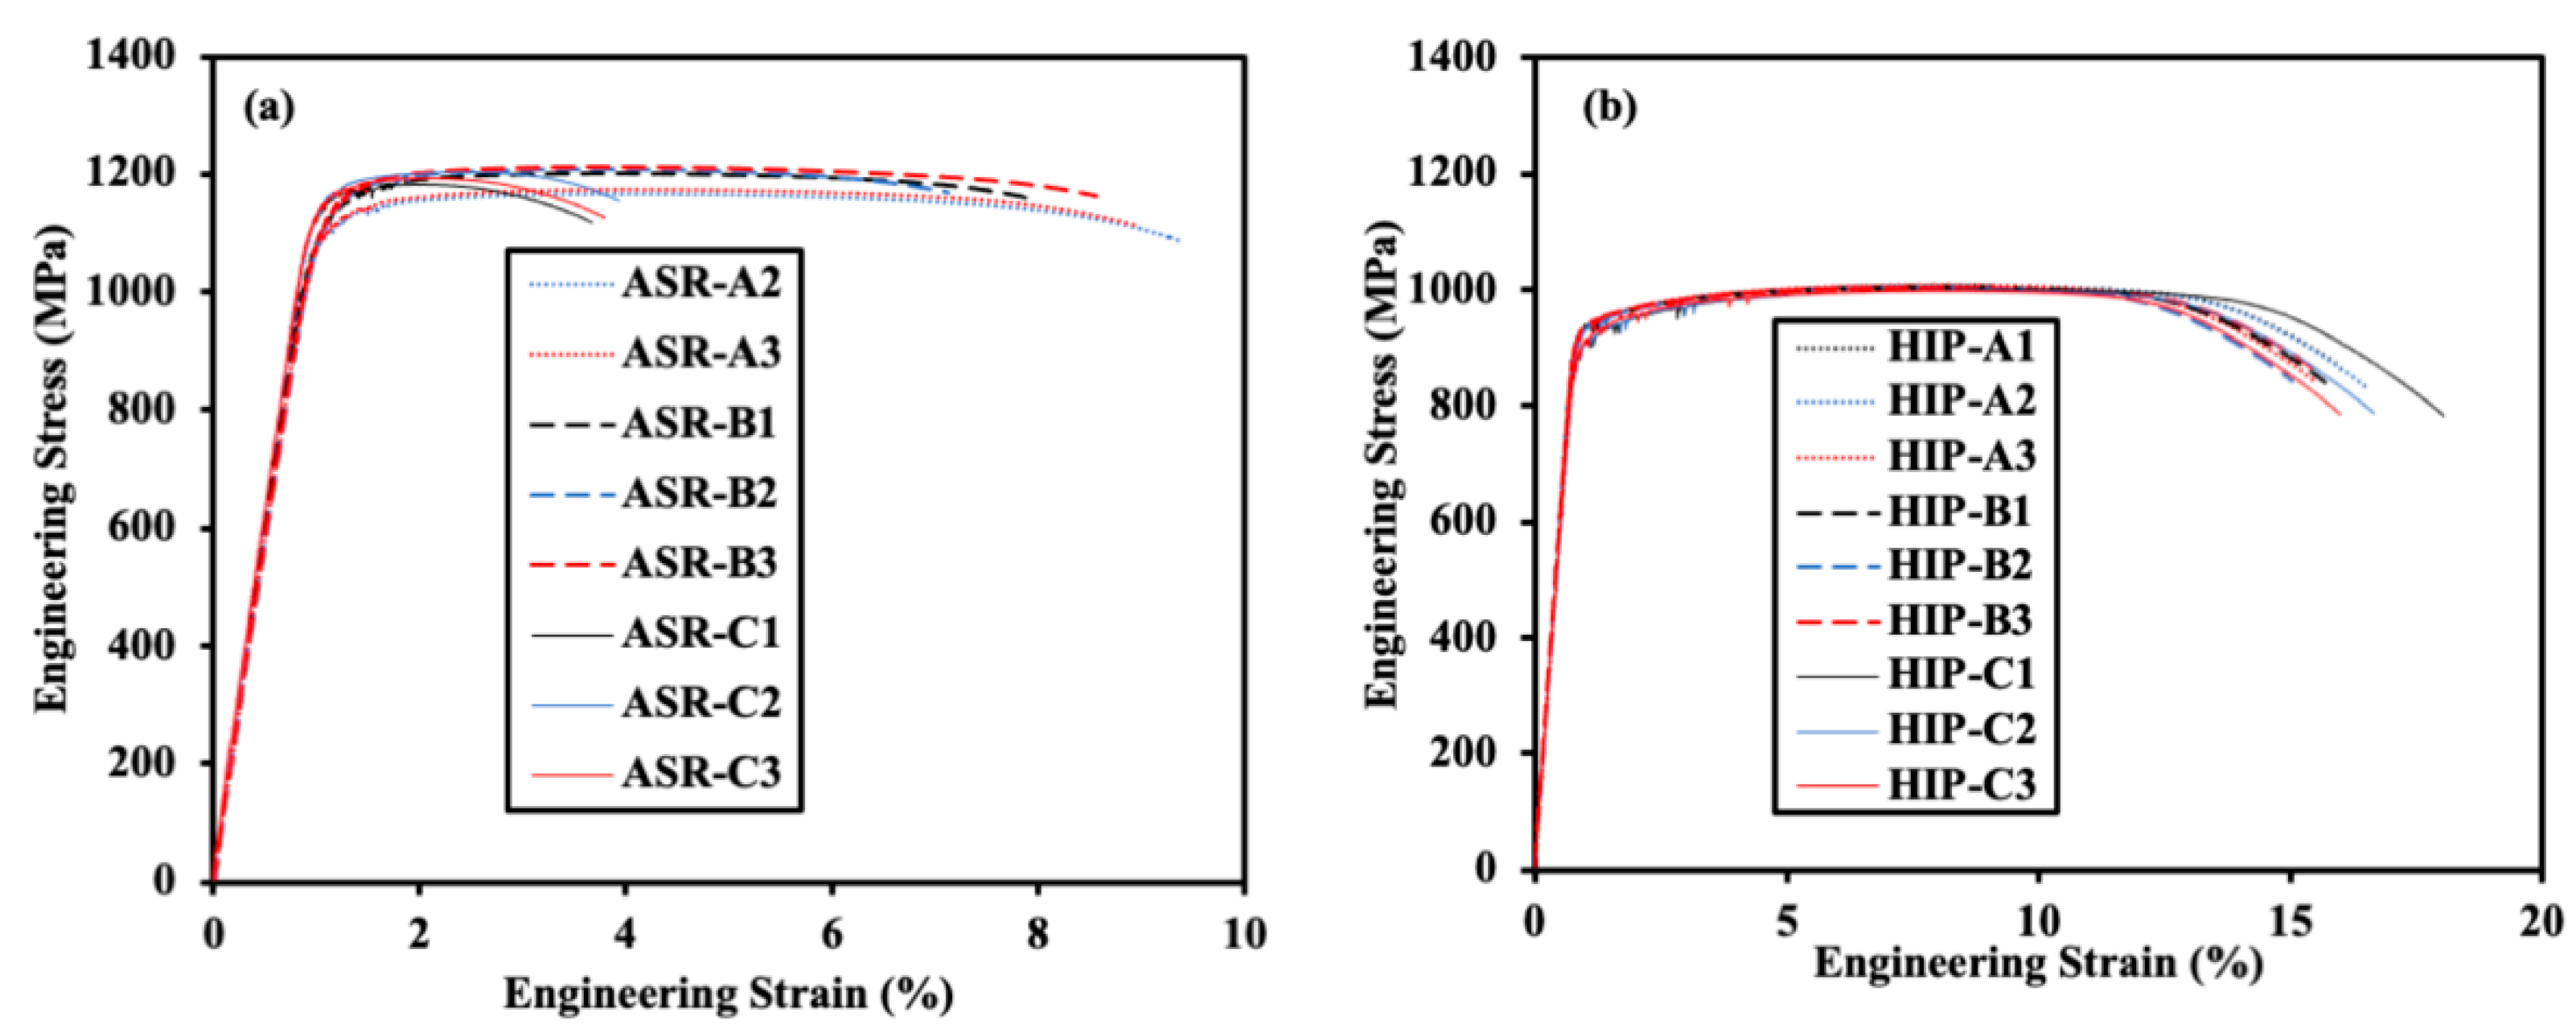
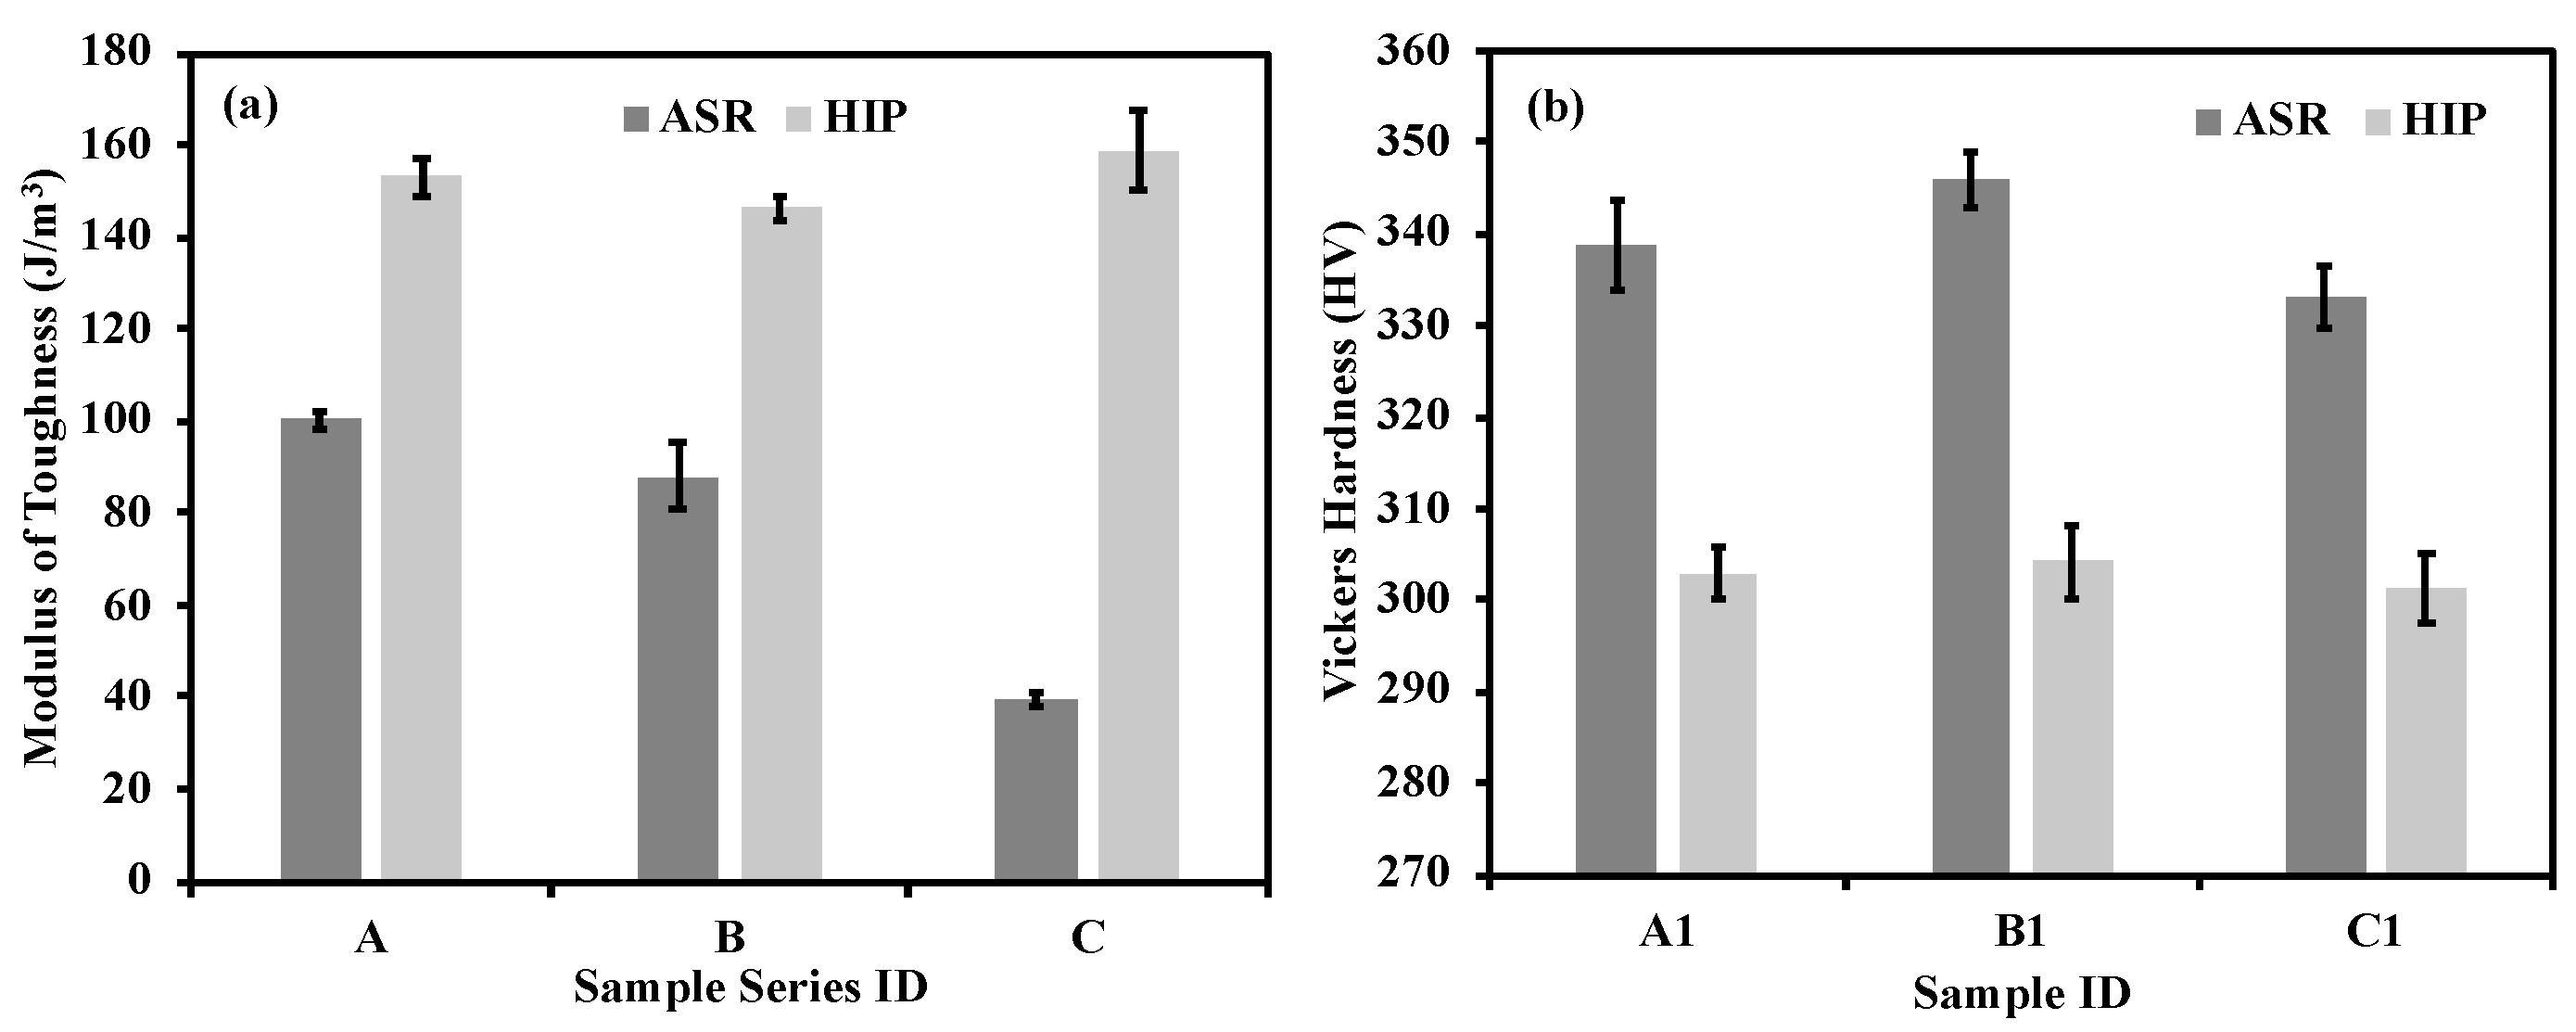
3.2. Mechanical Properties

The engineering stress-strain data obtained from all ASR and HIP samples are presented in Figure 2. Yield strength (YS), ultimate tensile strength (UTS), Young’s modulus, and % elongation at fracture were determined from the engineering stress-strain data as presented in Table 2 and Table 3, respectively, for the ASR and HIP samples. The ASR samples built in the horizontal directions, X and Y, identified as sample series A and B, had an average yield strength of 1111.74 MPa and 1146.70 MPa, respectively. The samples built in the vertical direction, Z, identified by sample series C, had an average yield strength of 1163.45 MPa. The ASR sample series A and B, respectively, had an average tensile strength of 1169.66 MPa and 1206.98 MPa, while for sample series C, it was 1192.82 MPa. The % elongation at fracture for the ASR samples A and B were 9.20% and 7.88%, respectively, however, it was only 3.81% for sample series C.
The horizontally built HIP samples in the X and Y directions (sample series A and B, respectively) had an average yield strength of 936.72 MPa and 935.48 MPa, respectively, while the C samples series vertically built in the Z direction had an average yield strength of 910.70 MPa. The horizontally built samples had an average tensile strength of 1006.94 MPa and 1003.29 MPa, respectively, for the HIP-A and HIP-B series. For sample series C built vertically, the tensile strength was 998.93 MPa after HIP. More importantly, the % elongation at fracture for samples series A, B and C were 16.03%, 15.38%, and 16.88% respectively. The yield strength, tensile strength, % elongation at fracture, and Young’s modulus showed isotropic and consistent mechanical properties, regardless of the build directions after HIP treatment.
To clearly recognize the difference in mechanical behavior of the ASR and HIP samples, each built in the X, Y, and Z-directions, the modulus of toughness (MOT; integrated area under the engineering stress-strain curve, frequently referred to as toughness) was determined, as presented in Figure 3a. The ASR samples, in general, had lower MOTs than the HIP samples. In addition, a significant anisotropic behavior was observed since the C-series samples, built along the build direction Z, had a MOT of only 39 J/m3 while the A- and B-series ASR samples, built in the X and Y directions, yielded the MOT values of 100 and 88 J/m3, respectively. However, more importantly, after the HIP, the MOTs for all samples were quite consistent and isotropic, ranging from 146 to 159 J/m3.
Vickers hardness of the ASR and HIP samples were determined from the XZ, YZ, and XY cross sections, as reported in Figure 3b. The ASR samples in general had higher hardness than the HIP samples. The ASR samples, however, showed some variation in the hardness ranging from 333 HV to 346 HV. After HIP, however, the hardness for all samples was quite consistent and isotropic, ranging from 301 to 304 HV.
Archimedes and image analysis methods were used to determine the relative density, as reported in Table 4. Density of all samples was greater than 99%. Some fine pores/flaws were occasionally observed in the unetched optical micrographs, but were rarely observed in the HIP samples. However, statistically confident analysis to distinguish the number of pores/flaws was challenging to carry out given the high density achieved by the use of optimized LPBF parameters.

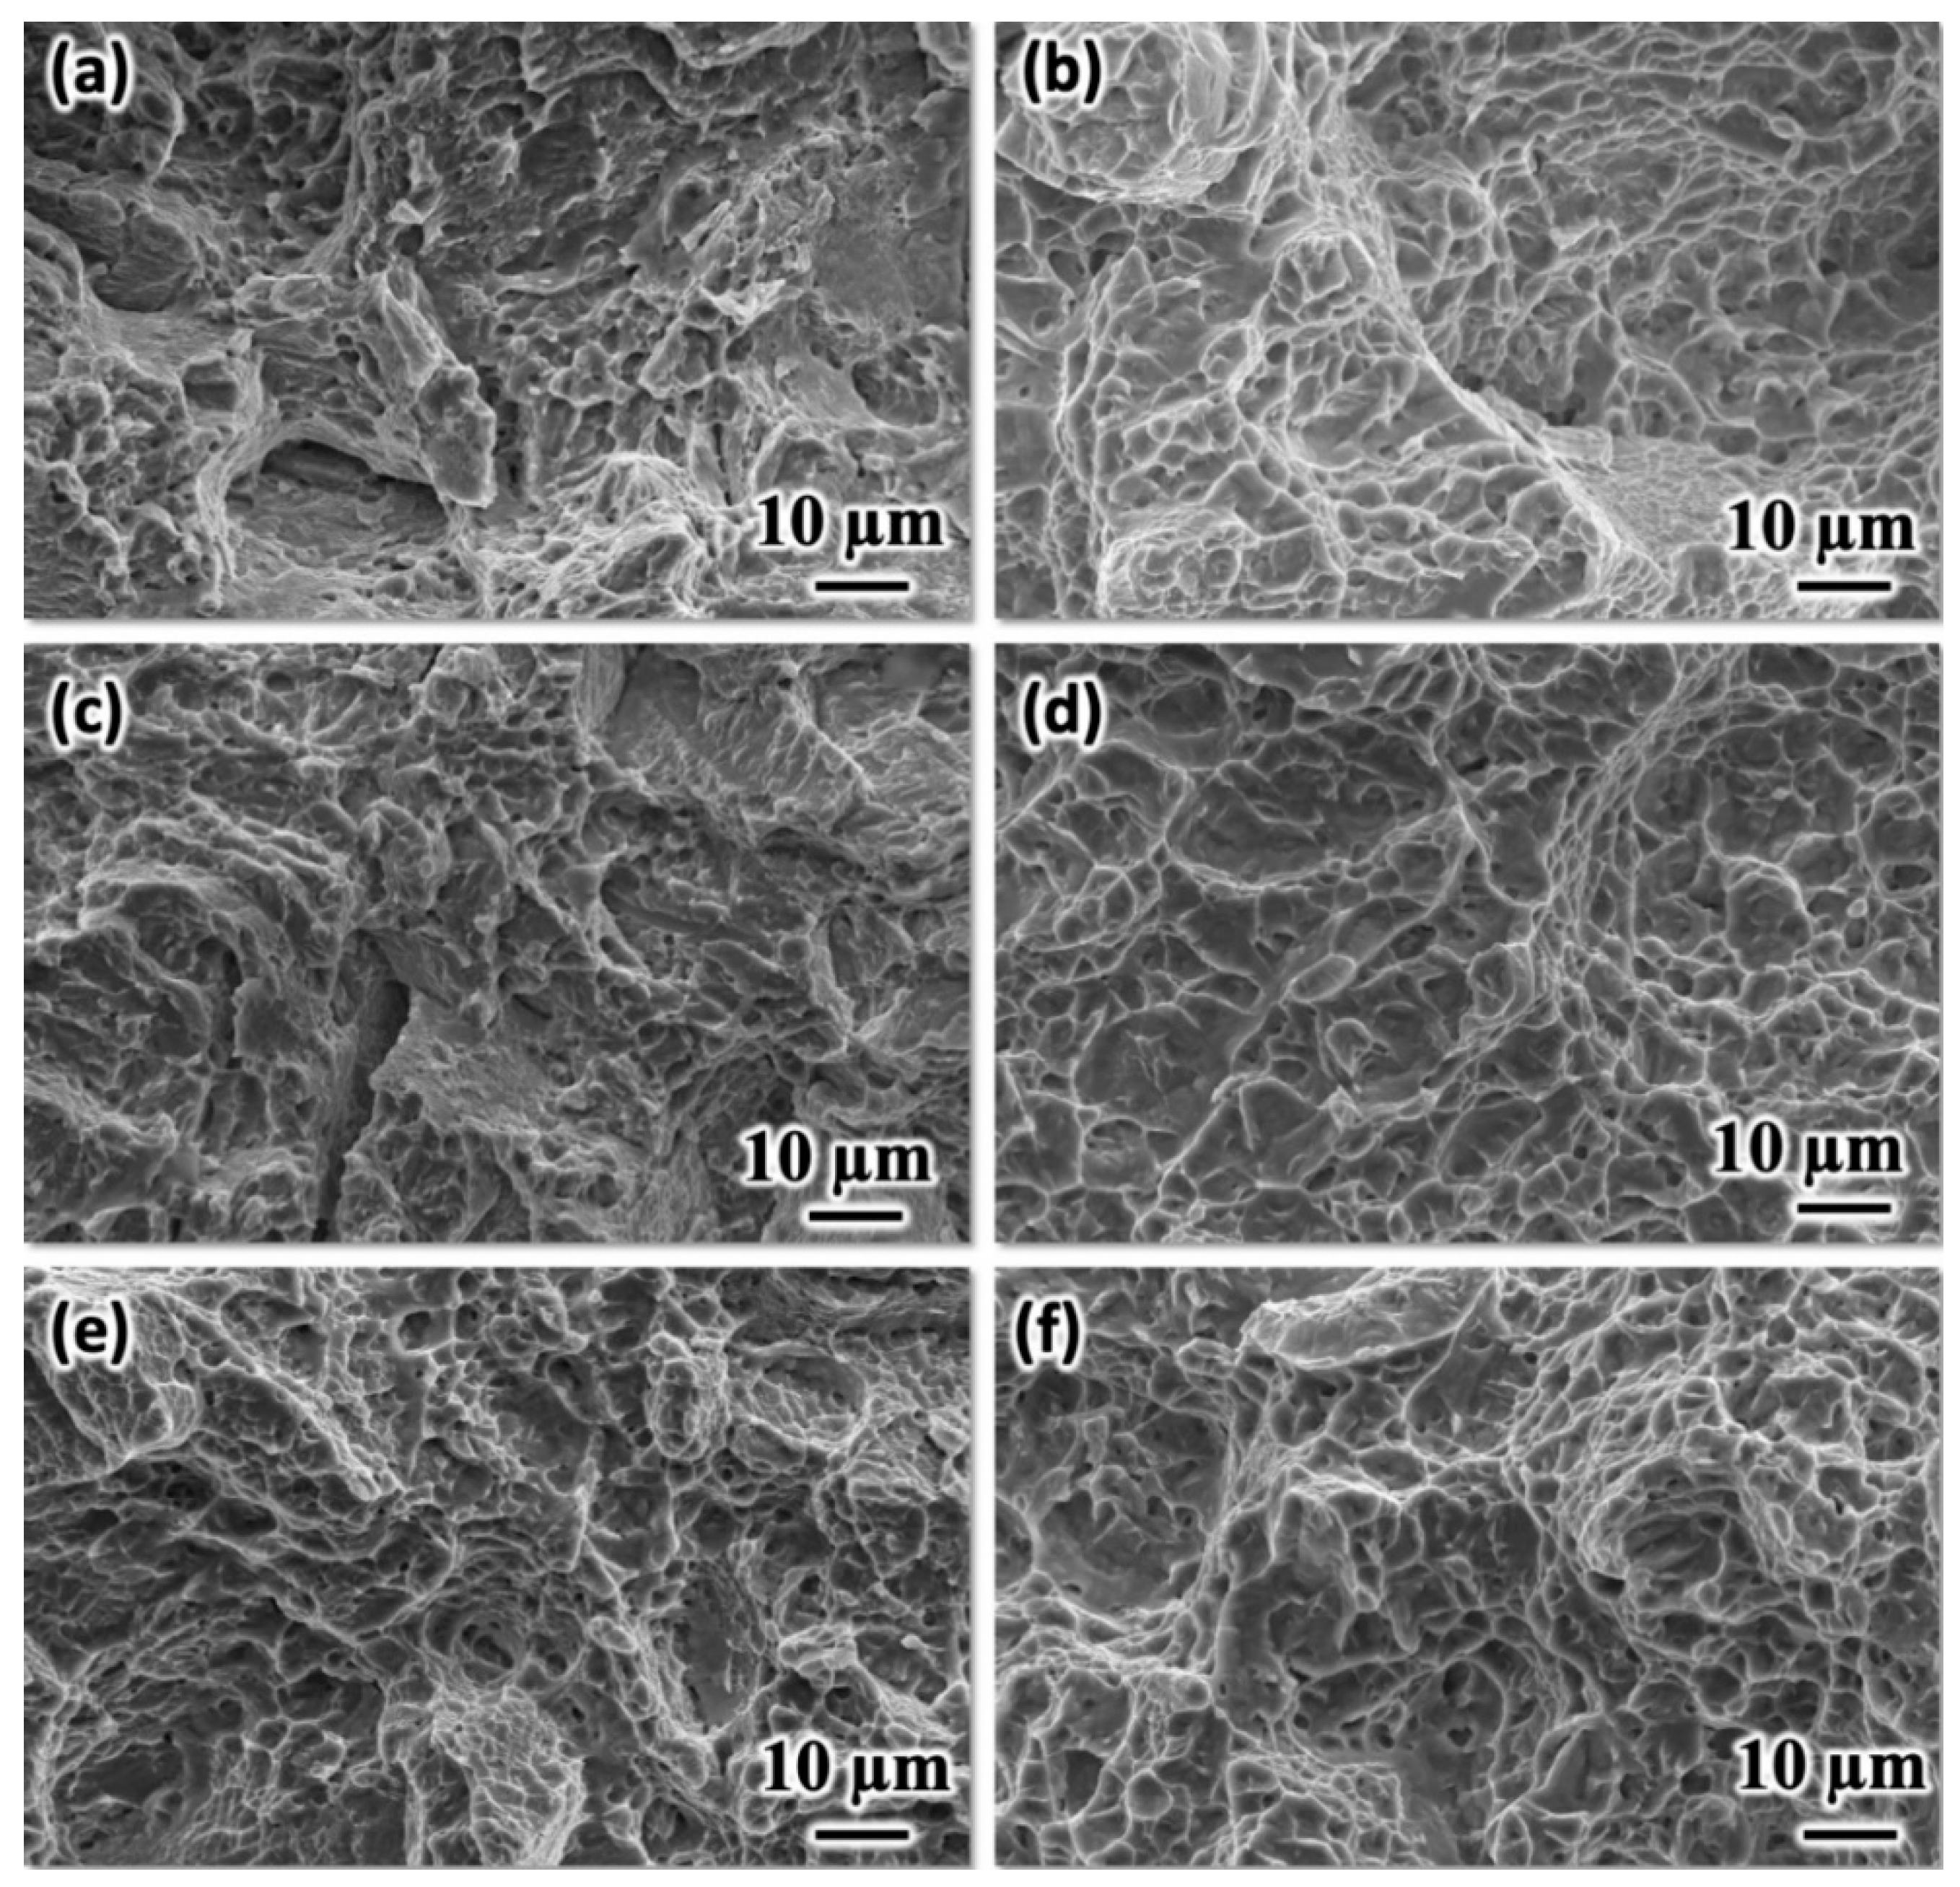
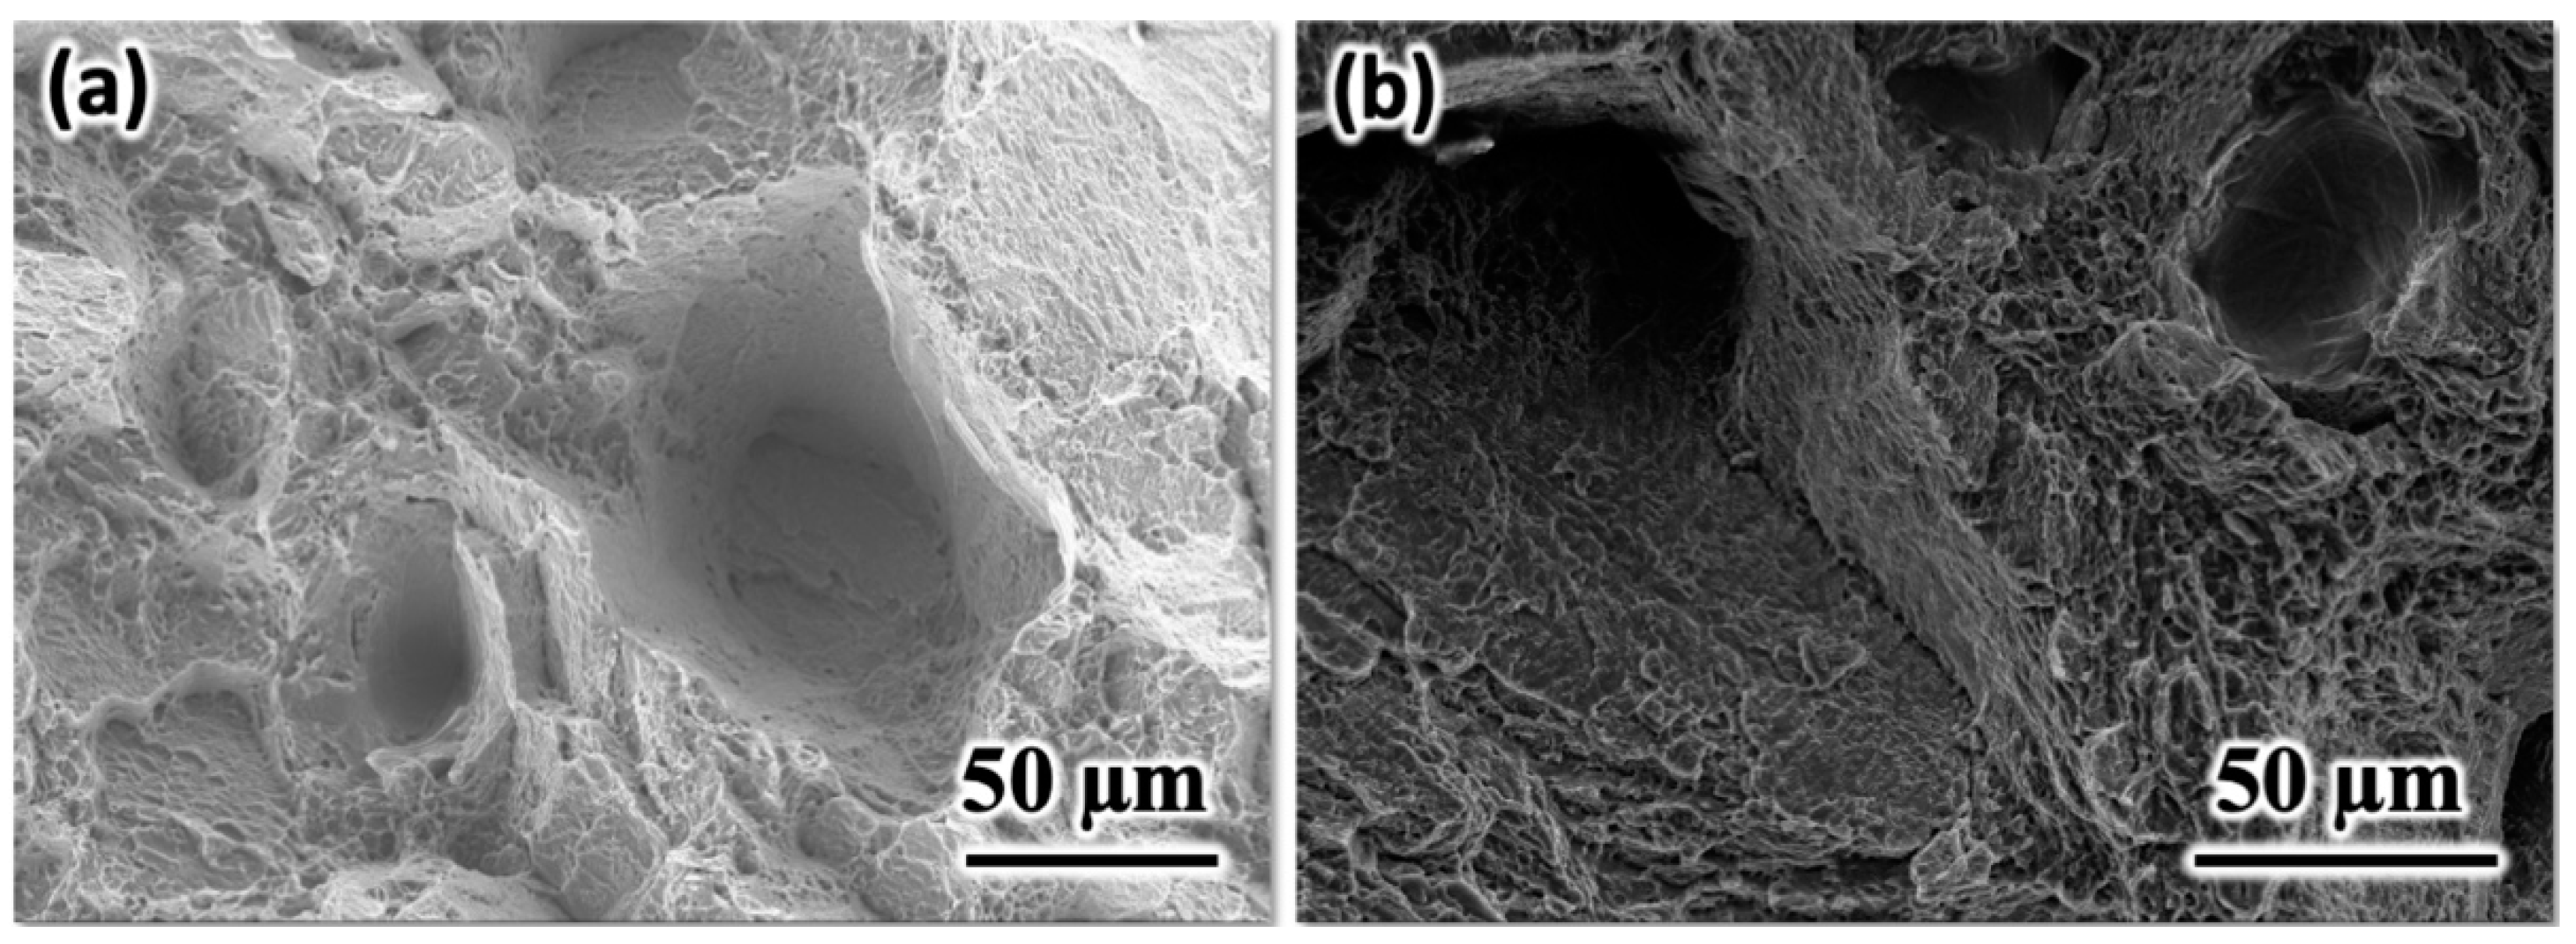
3.3. Fracture Surface Features

Secondary electron micrographs in Figure 4 show the representative details of the fracture surfaces for the horizontally and vertically built Ti-6Al-4V ELI alloy samples. These micrographs were obtained from the fractured samples: (a) ASR-A1, (b) HIP-A1, (c) ASR-B1, (d) HIP-B1, (e) ASR-C1, and (f) HIP-C1. In general, the fracture surfaces of the ASR samples presented in Figure 4a,c,e, exhibited mixed modes of ductile and brittle failure modes, while those of the HIP samples exhibited more dimples associated with ductile fracture, as shown in Figure 4b,d,f. This ductile fracture corresponds well with the mechanical properties of the HIP samples as both the horizontally (identified as sample series A and B) and vertically built samples (sample series C) exhibited isotropic and consistent elongation at fracture of 16.03%, 15.38%, and 16.88%. The fracture surfaces of the ASR samples showed fewer dimples compared to the HIP samples, and exhibited some quasi-cleavage facets closely associated with the mixed mode of ductile and brittle failure [2,7,40]. Hence, horizontally built ASR samples (ASR-A and ASR-B) had an elongation at fracture of 9.20% and 7.88%, while vertically built ASR-C samples only had an elongation at fracture of 3.81%.
One noticeable feature on the ASR-C1 sample, which was built along the Z direction (i.e., the build direction) and exhibited the lowest ductility and MOT of 3.60% and 39 J/m3, respectively, was the large pockets, as presented in Figure 5. The size of these pockets ranged from 30 to 100 μm, and corresponded well to the reported “keyhole” pores typically observed in LPBF. These would appear frequently on the fracture surface because they act as a stress-concentration point/area during tensile testing. The surface of these pores were mostly smooth, and some dendritic features were observed.

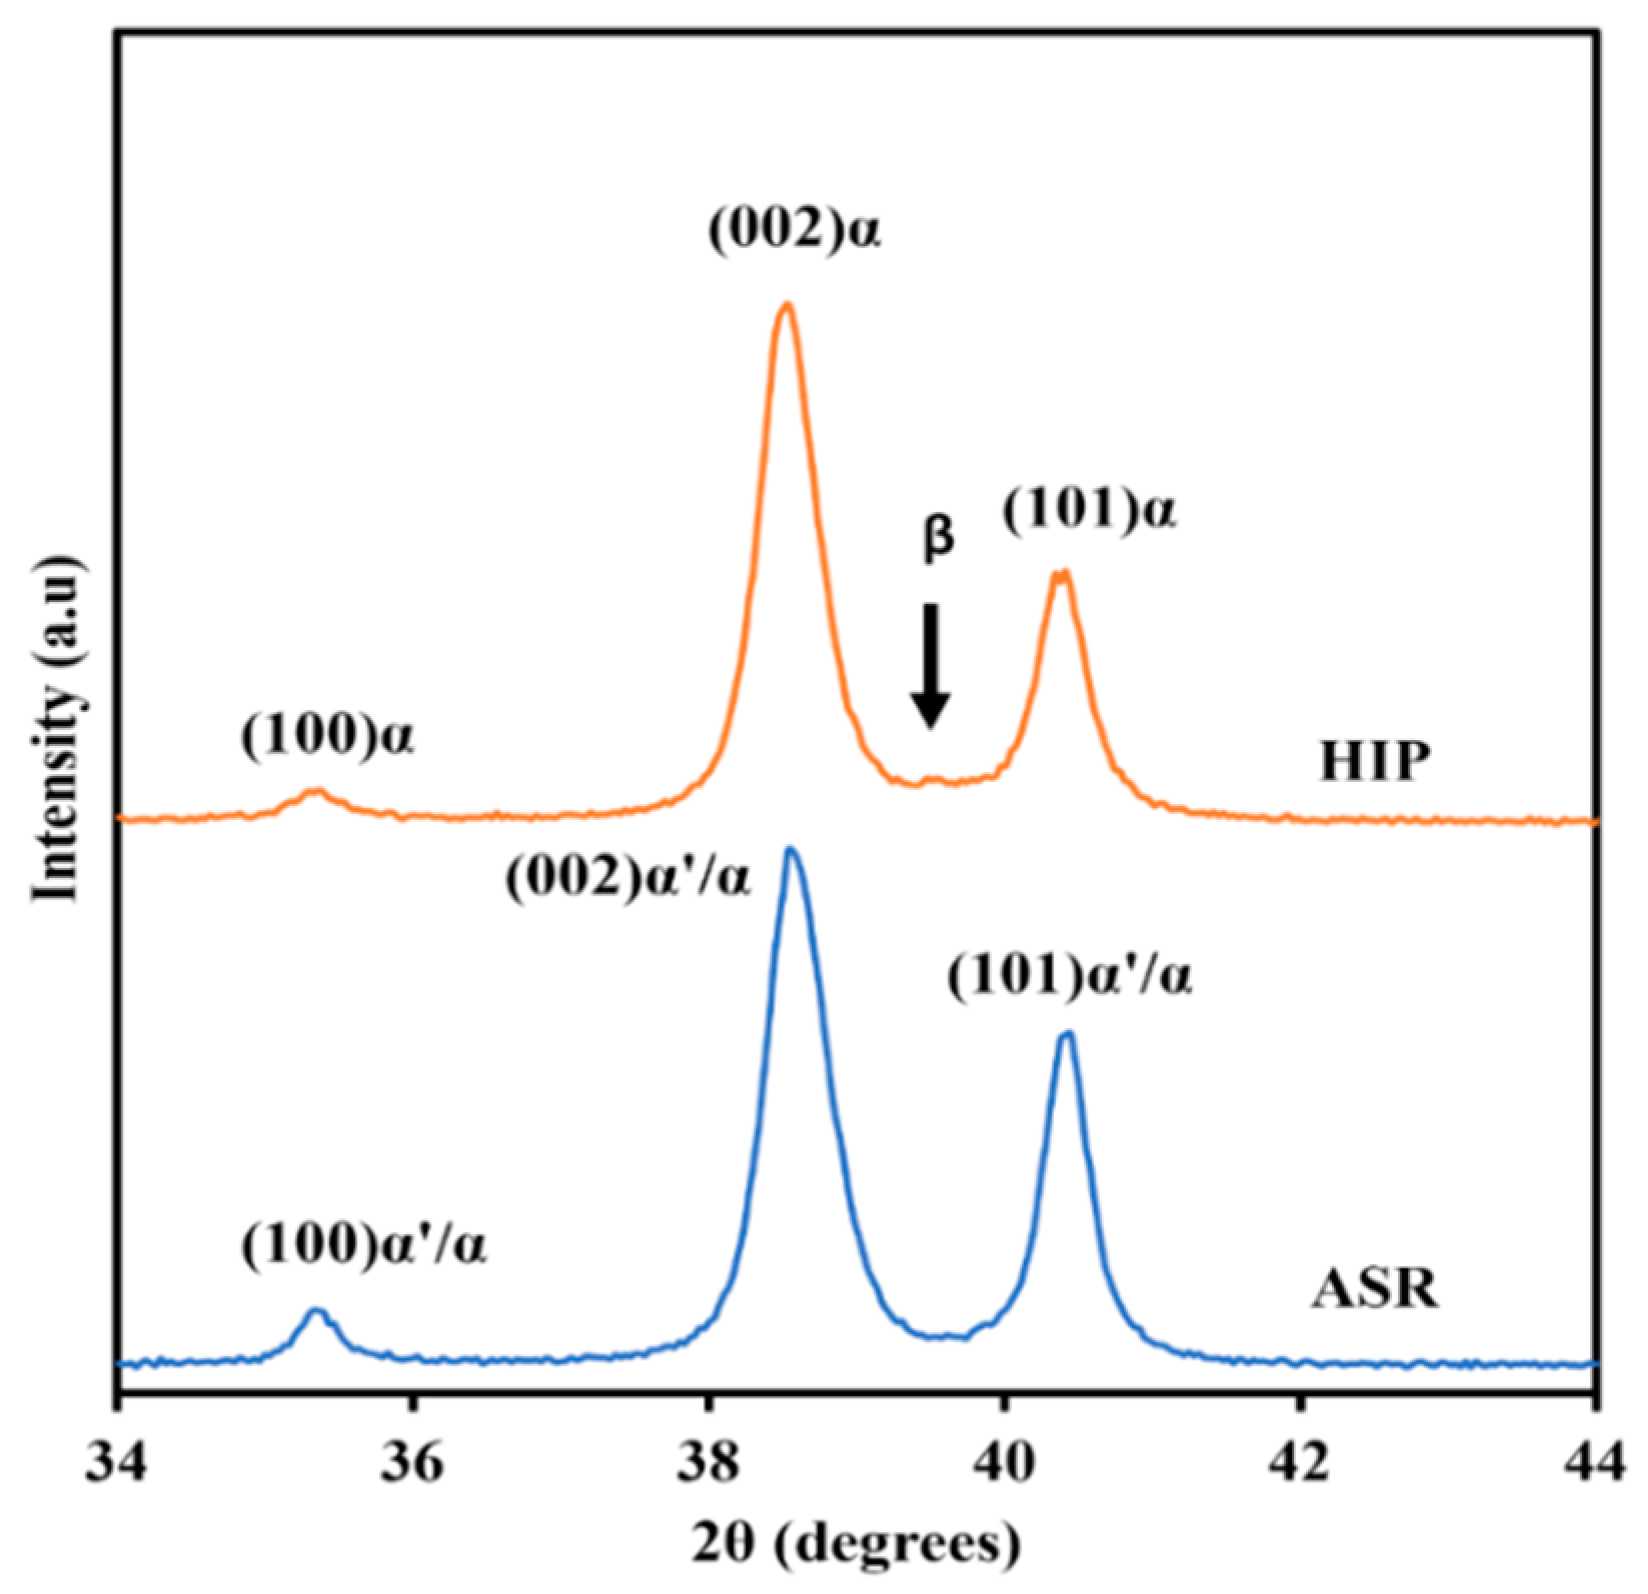
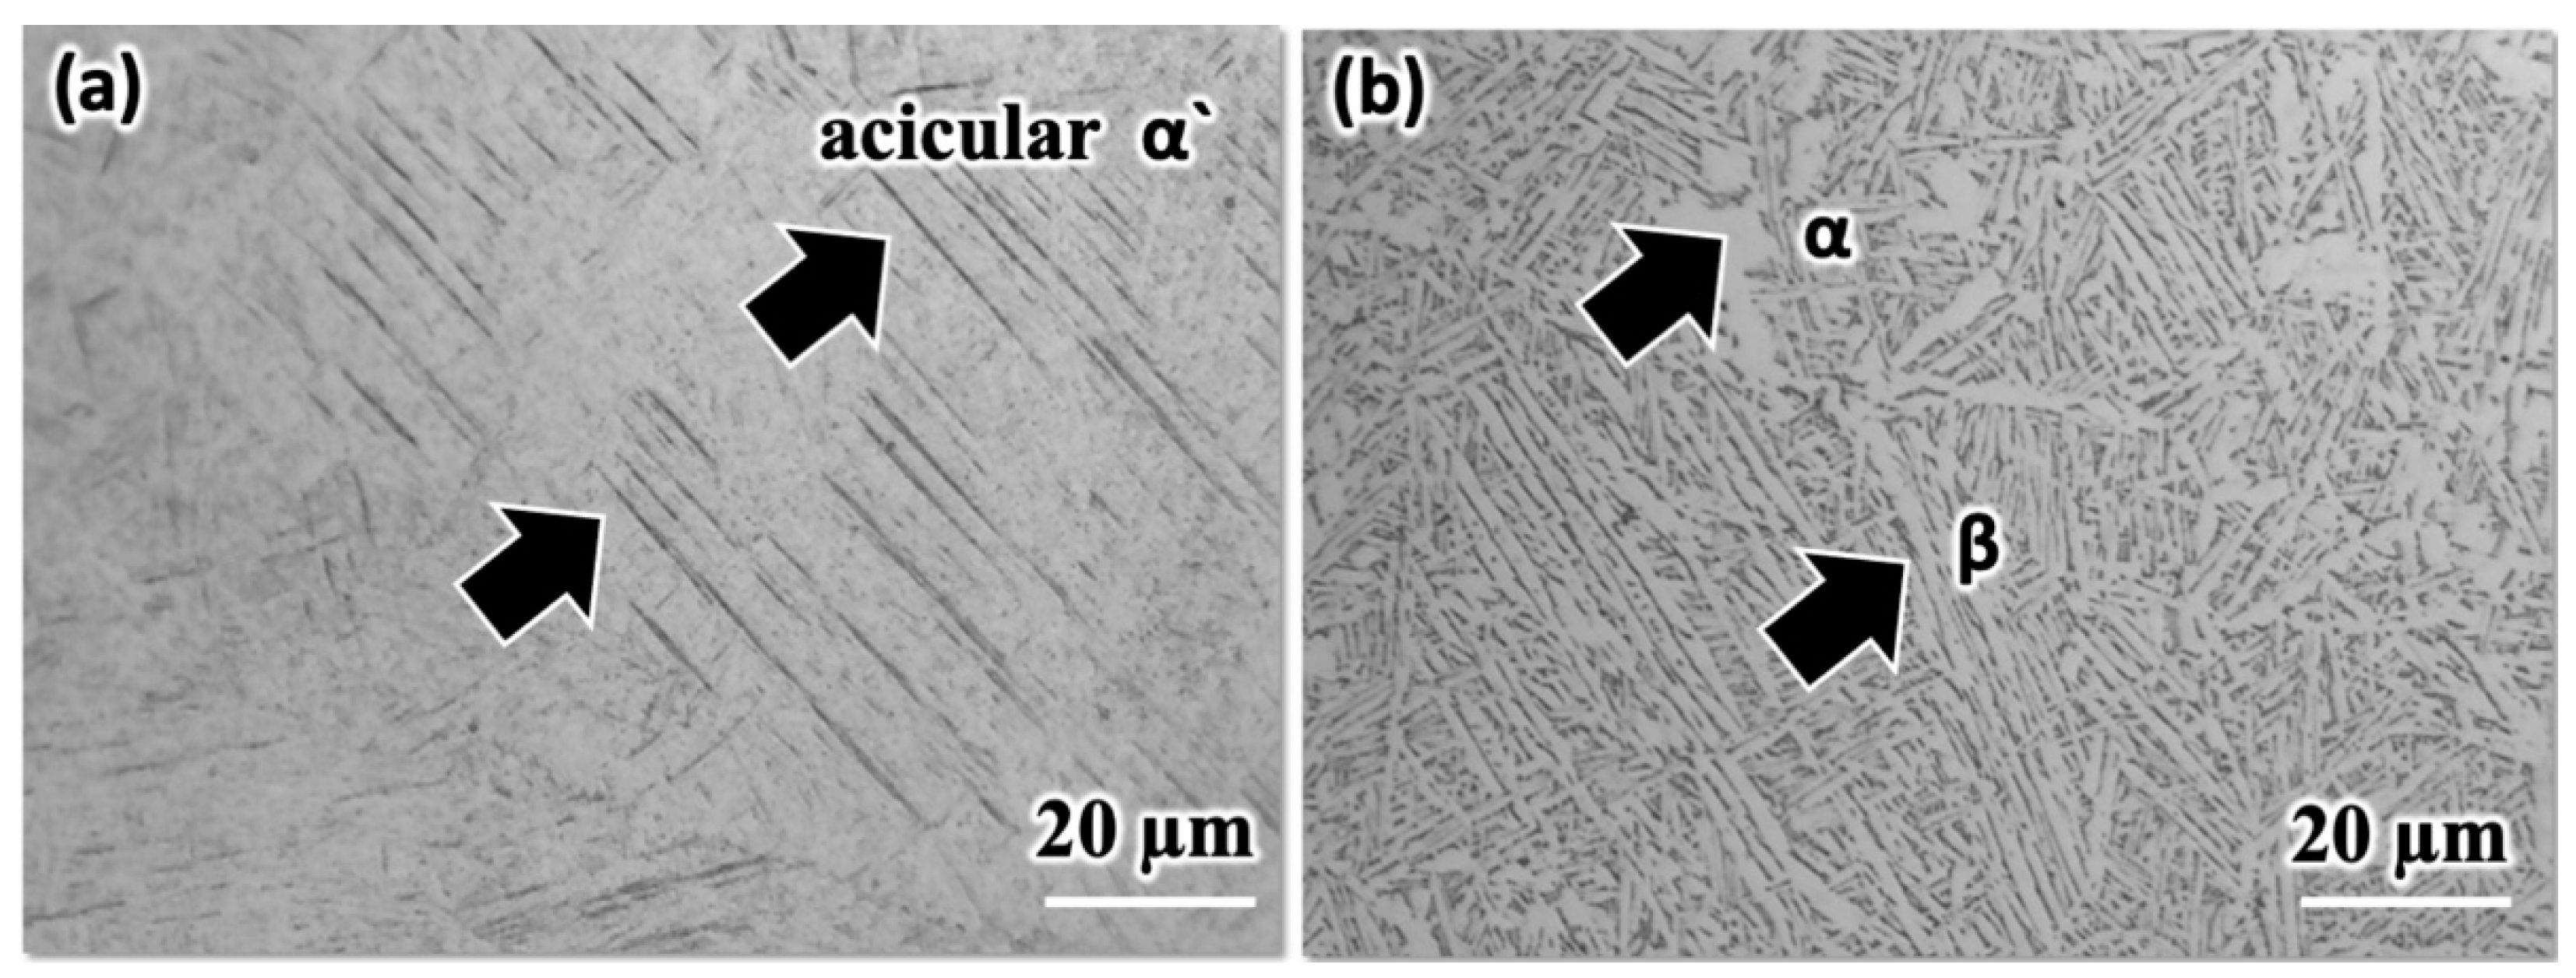
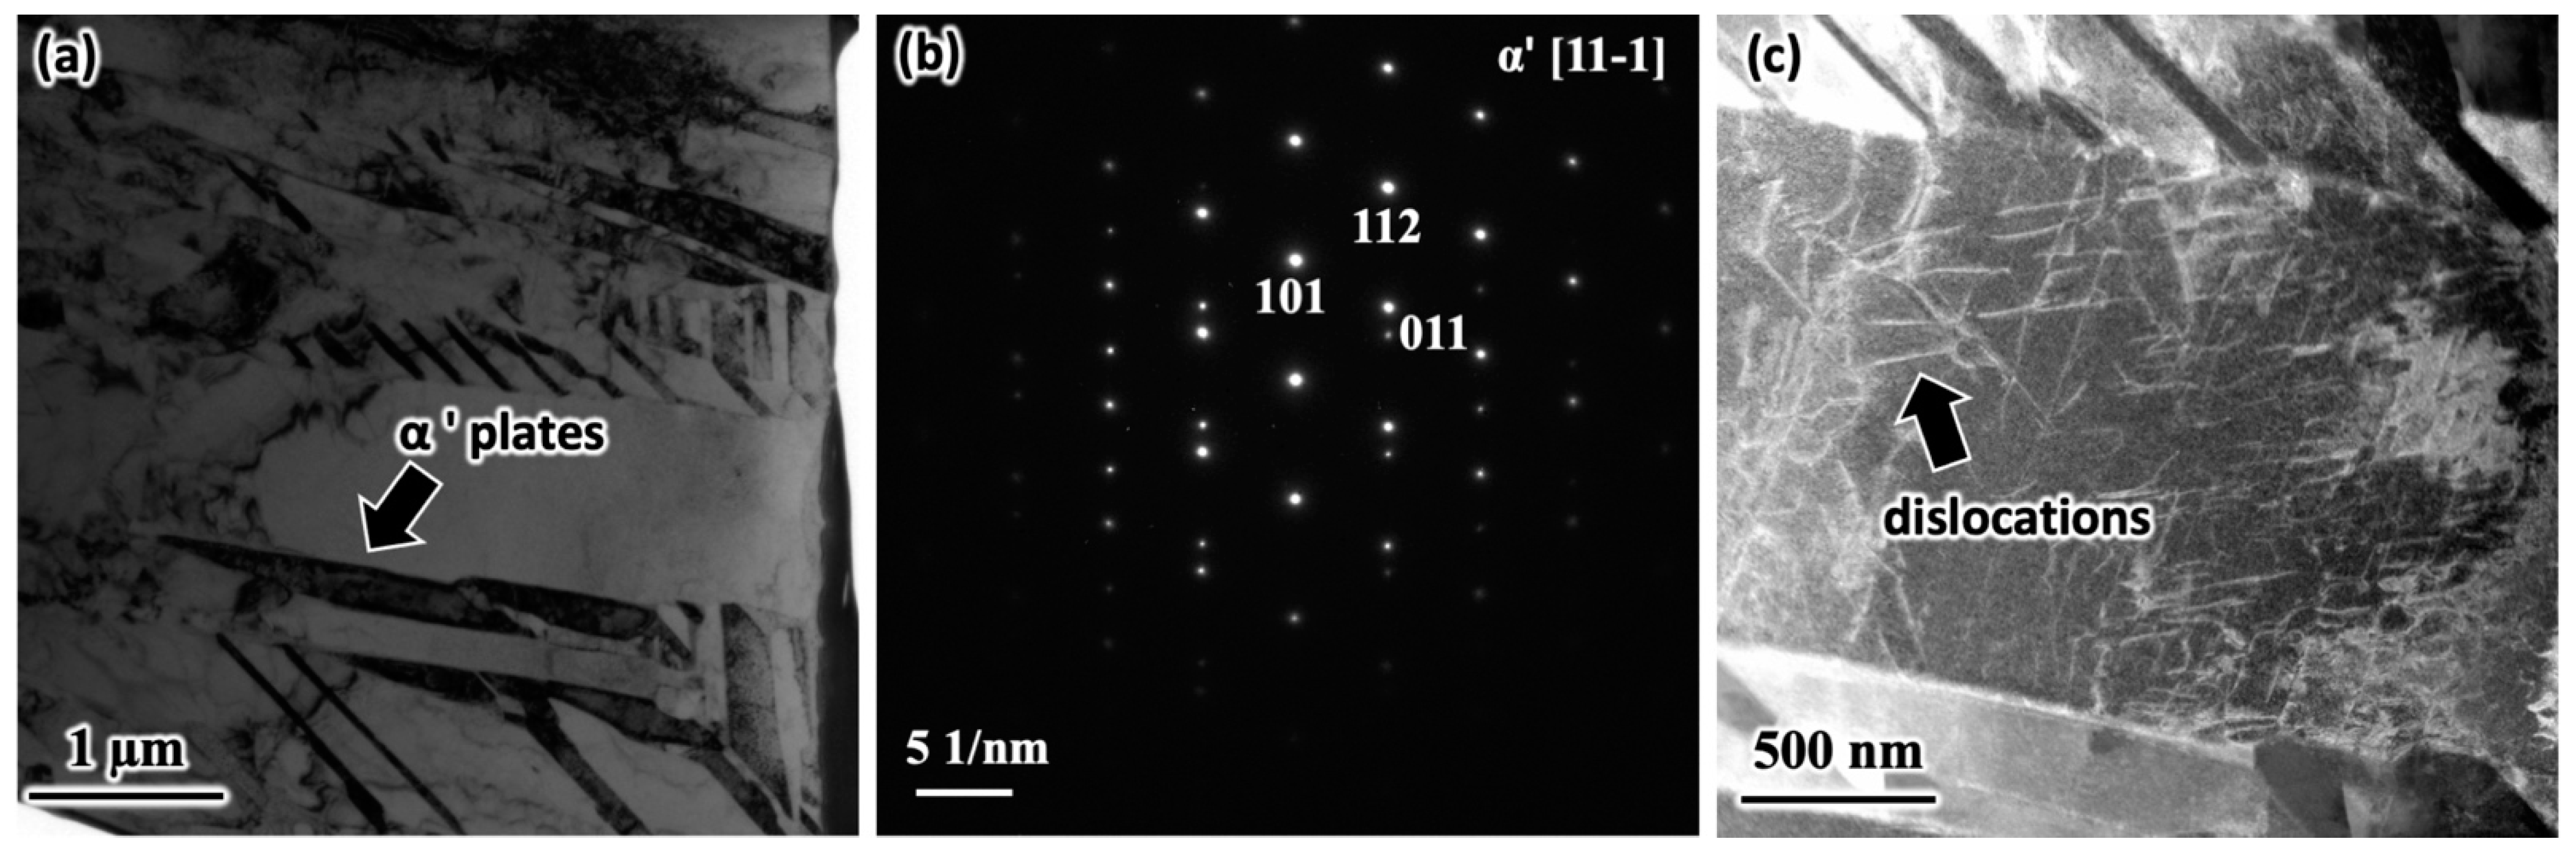
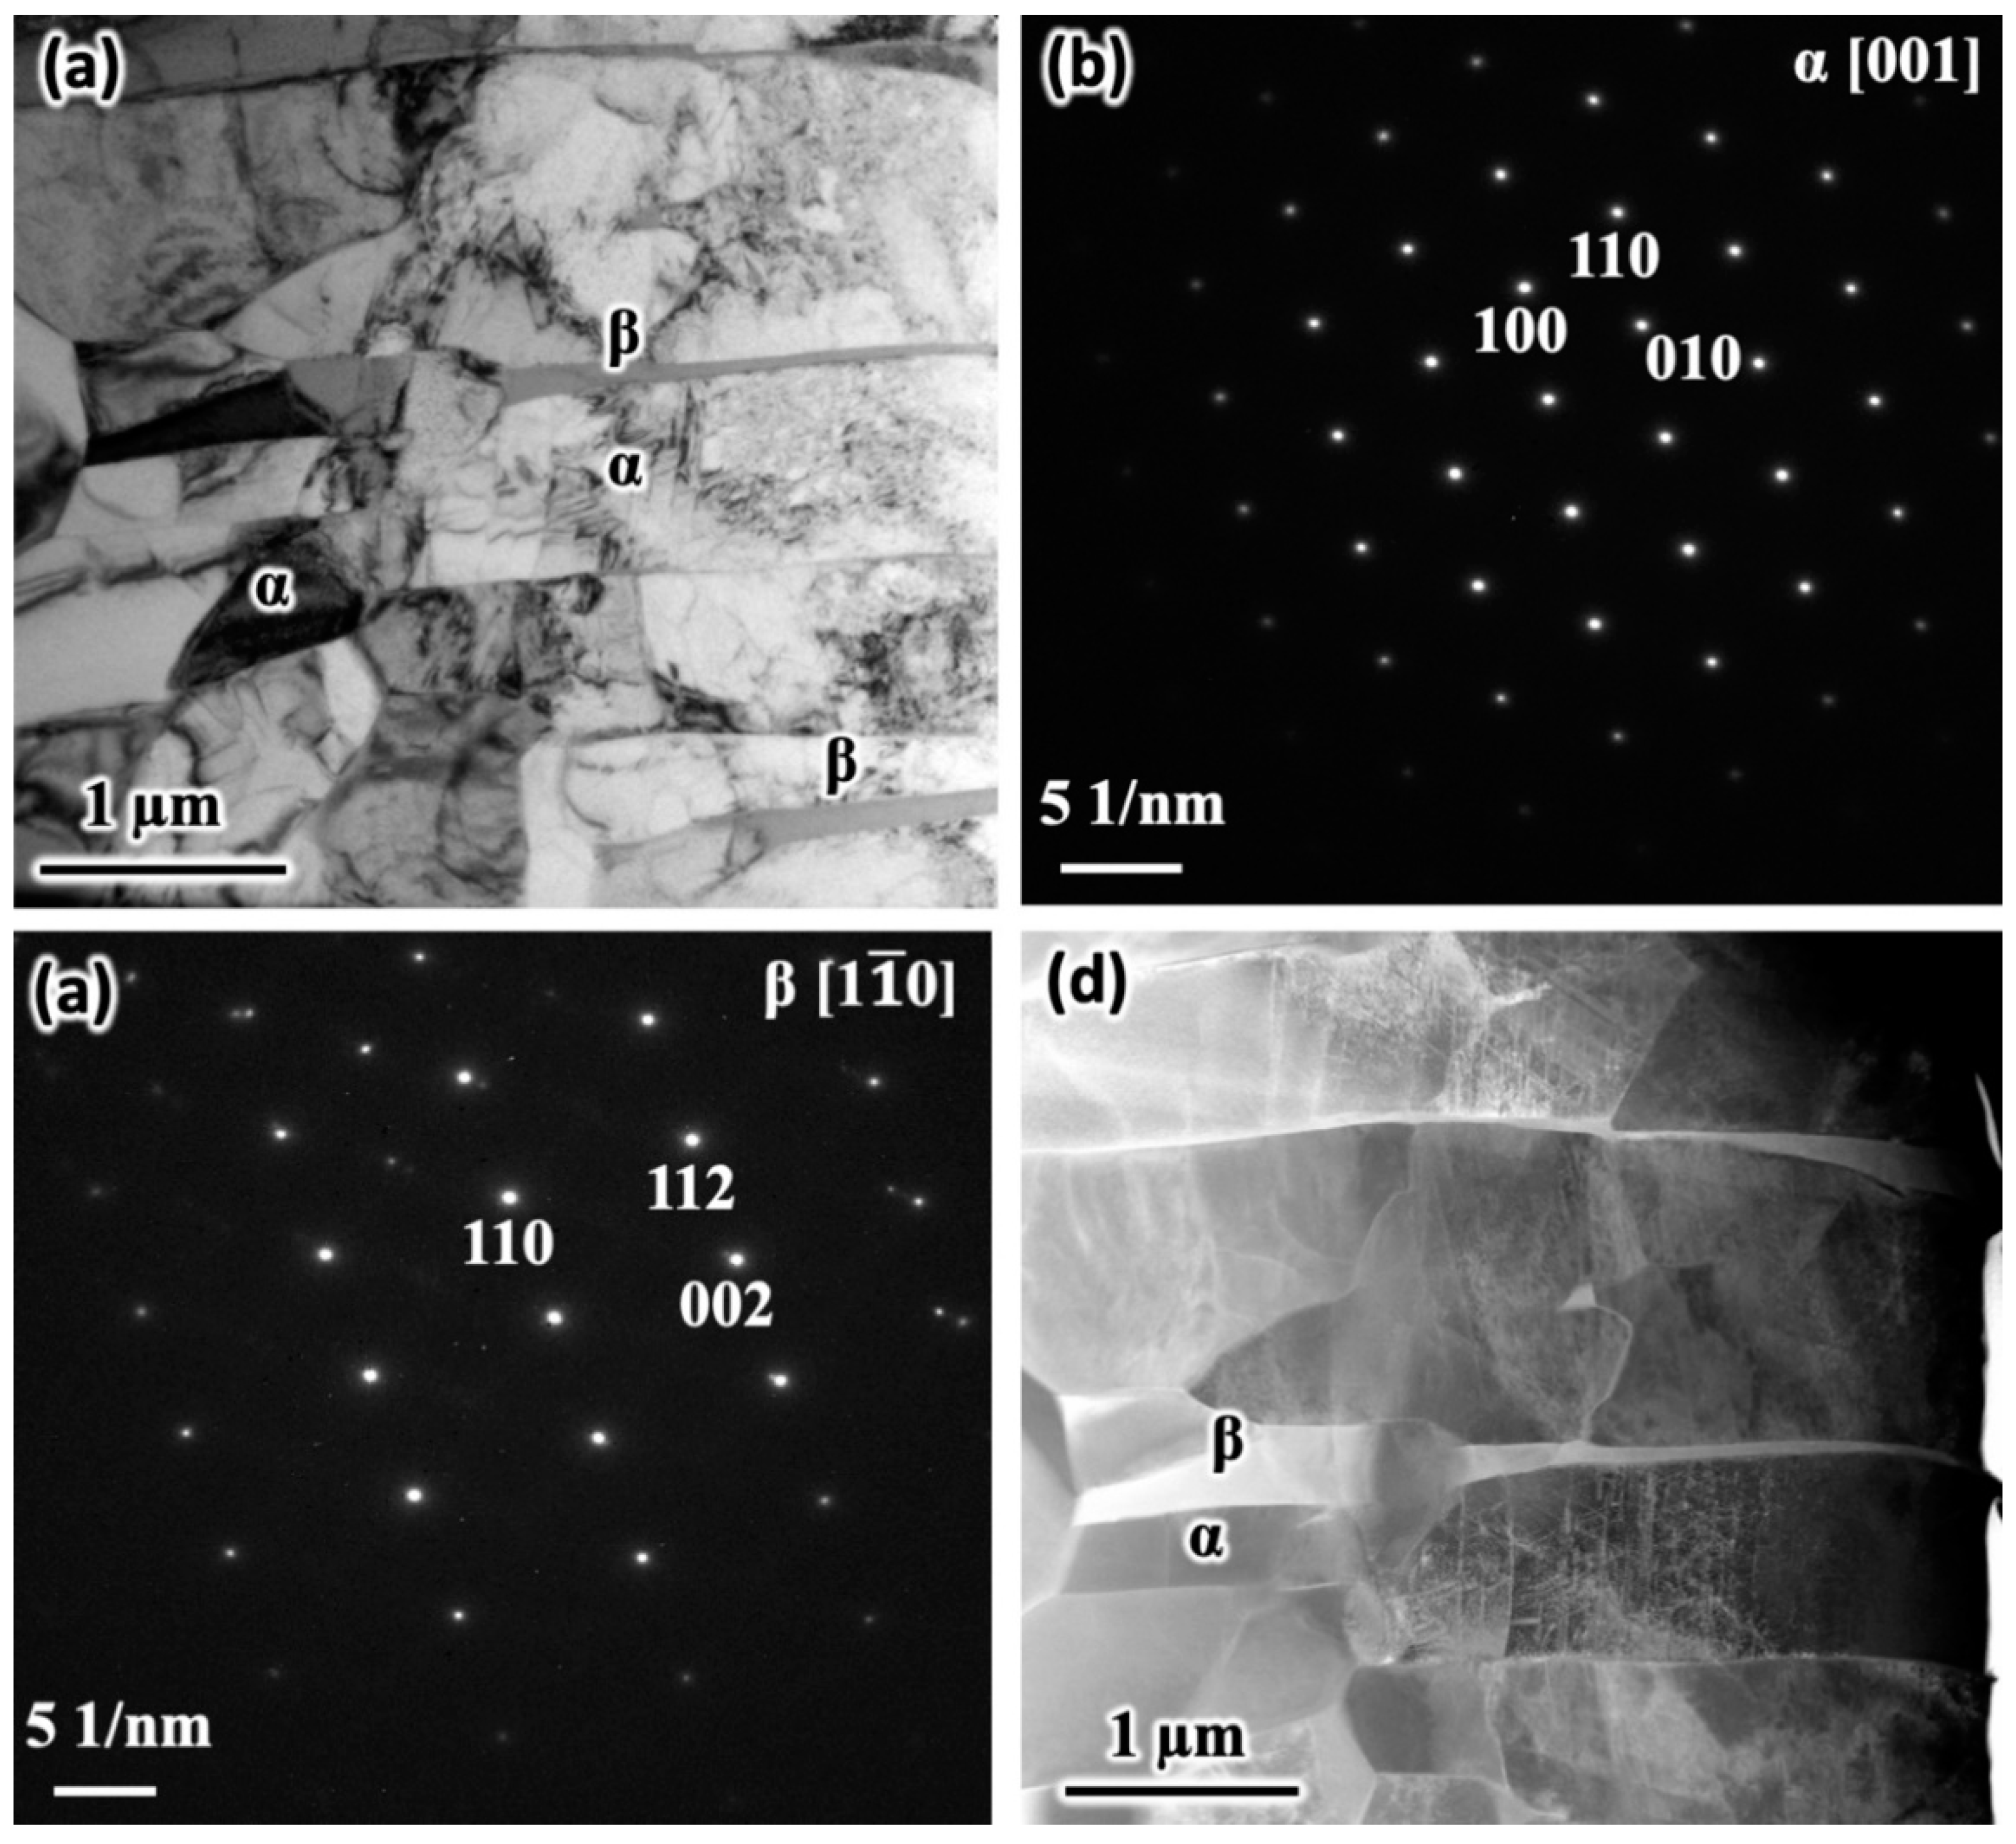
3.4. Phase Constituents and Microstructure

Representative XRD patterns collected from the XZ cross-section of ASR and HIP samples are presented in Figure 6. The main peaks observed from the ASR and HIP samples were from the α′ (hcp) phase and α (hcp) phases, respectively. In addition, a very small peak at 2θ = 39.47° was observed for the HIP samples only, which corresponded to the presence of the β phase [32]. All peaks were indexed by comparing with the International Center for Diffraction Data (ICDD) powder diffraction files through the PANalytical HighScore software (01-089-5009). The presence of the α′ phase in the ASR samples and α phase in the HIP samples was confirmed by the refined X-ray diffraction pattern using the Rietveld fit, which yielded the α′ and α phase with the hexagonal lattice of a = 2.94 Å and c = 4.68 Å, identical to the reported values of α′ in the literature [41] and space group of P63/mmc (194). This is primarily due to the fact that XRD cannot differentiate between the α′ and α phases as they have the same hcp crystal structure and very similar lattice parameters [42].
The Rietveld fit of the HIP samples also revealed the presence of the β phase with the bcc lattice parameter of a = 3.23 Å, slightly higher than the 3.18–3.21Å reported in the literature [19,43], and space group of Im 3 ¯ m (229). The presence of α and β phases, confirmed by the Rietveld refinement, indicates that the α′ → α + β phase transformation occurred during the HIP of the ASR samples. Finally, quantitative phase analysis was performed for the XRD patterns using Rietveld refinement, which resulted in 100% α′ for the ASR sample and 89.30 wt.% α and 10.70 wt.% β for the HIP-A1 sample. Similarly, quantitative phase analysis performed for the XRD patterns using Rietveld refinement for the HIP-B1 and HIP-C1 samples resulted in 90.80 wt.% α and 9.20 wt.% β (GOF: 2.09%) and 89.10 wt.% α and 10.90 wt.% β (GOF: 2.42%). The relevant parameters obtained from the Rietveld refinement are presented in Table 5.
Im 3 ¯ Figure 7 presents the optical micrographs from the cross-sectional ASR and HIP samples. Samples examined for optical microscopy were prepared from both ends of the tensile rods, but there was no significant variation in the microstructural features and their size. In addition, no significant variation was observed in the X, Y and Z directions within the tensile rods. Due to rapid solidification, followed by the addition of powders in a layer-by-layer approach, the initial microstructures in Ti-6Al-4V fabricated by AM are anisotropic and contain prior β-grains that grow epitaxially across successive build layers in the laser based additive manufacturing of metals. The microstructure contained within the prior β-grains differs depending on the cooling rate and thermal cycles. The initial microstructure of the Ti-6Al-4V alloy produced by laser powder bed fusion (PBF) typically tends to be acicular or martensitic [7,20,23].
The equilibrium microstructure of the Ti-6Al-4V alloy consists of the α (hcp) and β (bcc) phases [44]. Due to the non-equilibrium solidifications inherent to LPBF, the metastable acicular martensitic α′ (hcp) phase would form after LPBF, and it was experimentally observed to remain in the ASR samples that underwent stress-relief heat treatment at 670 °C for 5 h followed by furnace cooling, as presented in Figure 7a. These metastable acicular martensitic α′ phases are considered hard and brittle [45,46], in comparison to the equilibrium mixture of α and β phases, and would contribute to the high strength, low ductility, and low MOT observed.
As presented in Figure 7b, the fine acicular martensitic α′ phase transformed into the equilibrium lamellar α + β mixture after HIP, which was carried at 920 °C for 2 h at a pressure of 100 MPa under an Ar atmosphere followed by controlled air cooling. The lighter contrast in Figure 7b is the α phase, and the β phase appears darker. The phase transformation, α′ → α + β corresponded to, as observed in this study, significant increases in ductility, MOT, and isotropy, with a slight decrease in strength.
Figure 8 and Figure 9 present the analytical TEM results for the ASR and HIP samples. The bright field TEM micrographs in Figure 8a and Figure 9a revealed the presence of the acicular α′ phase in the ASR samples, and the α and β lamellae in the HIP samples, respectively. The crystallographic identification of the α′, α, and β phases were carried out with selected area electron diffraction (SAED) [47], and are presented in Figure 8b and Figure 9b,c, respectively. The HAADF STEM micrograph of the ASR samples revealed a high density of dislocations while a lamellar α + β mixture without significant dislocation density was observed in the HAADF STEM micrograph of the HIP samples.

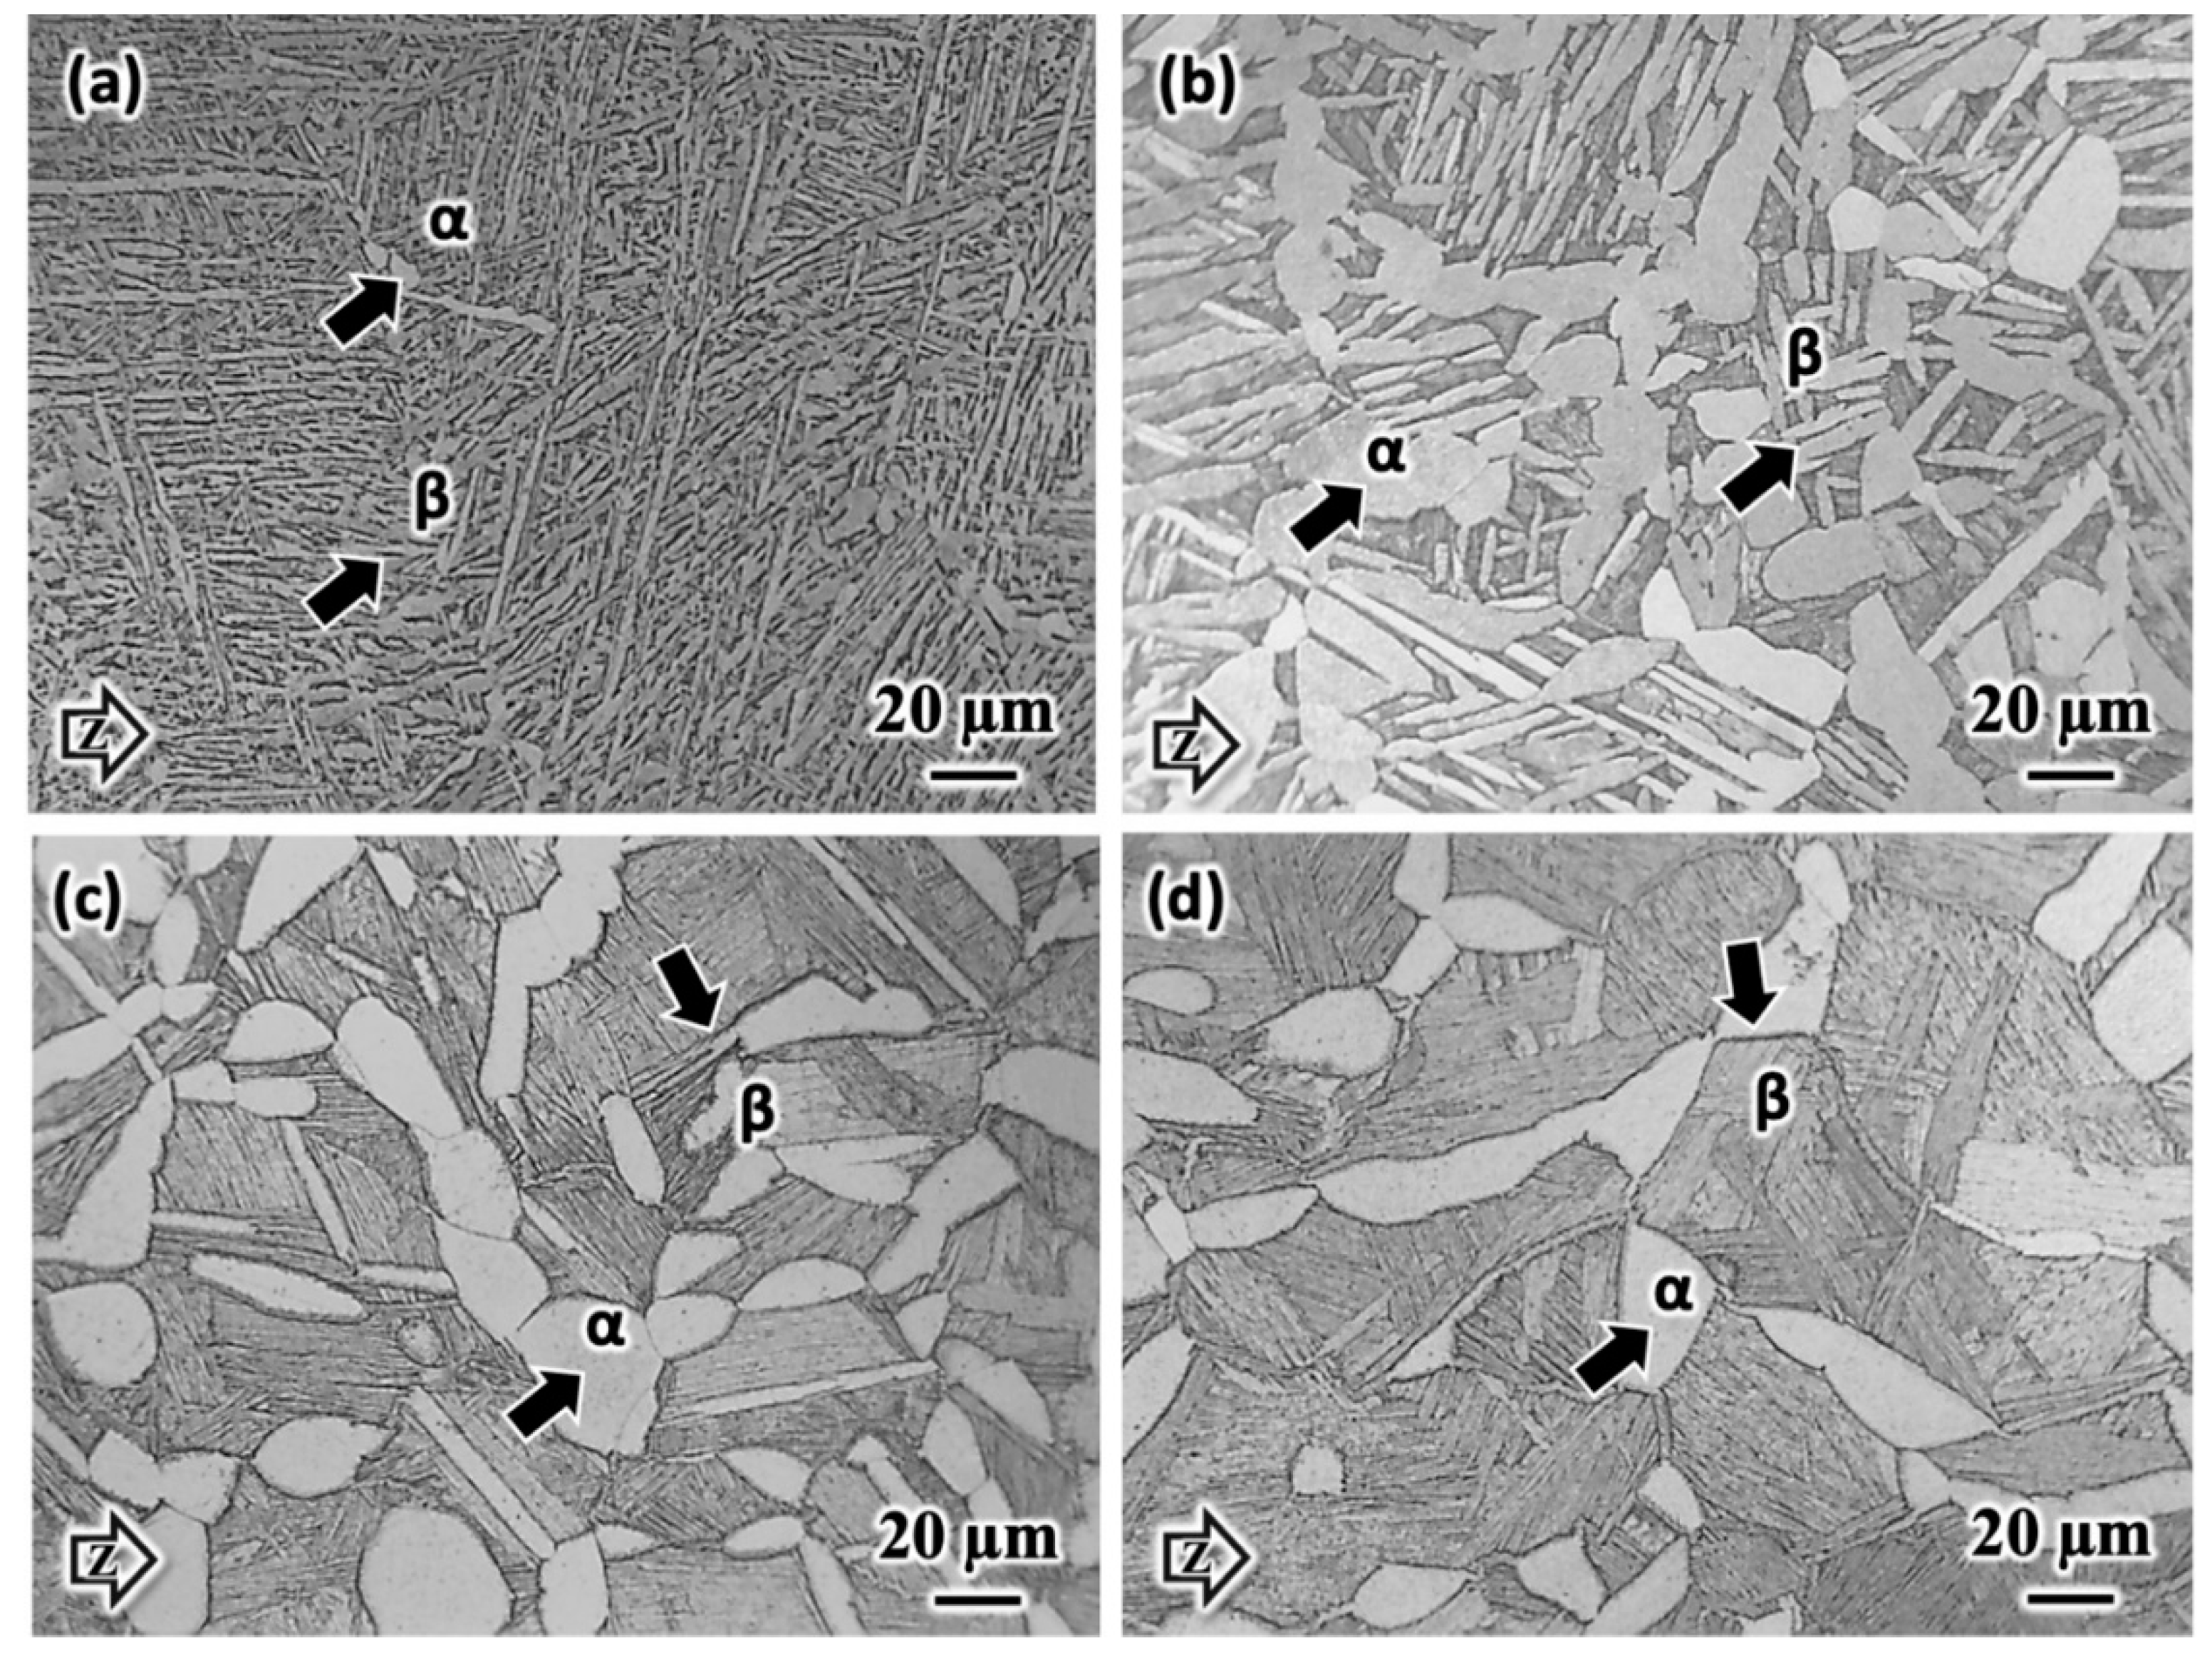
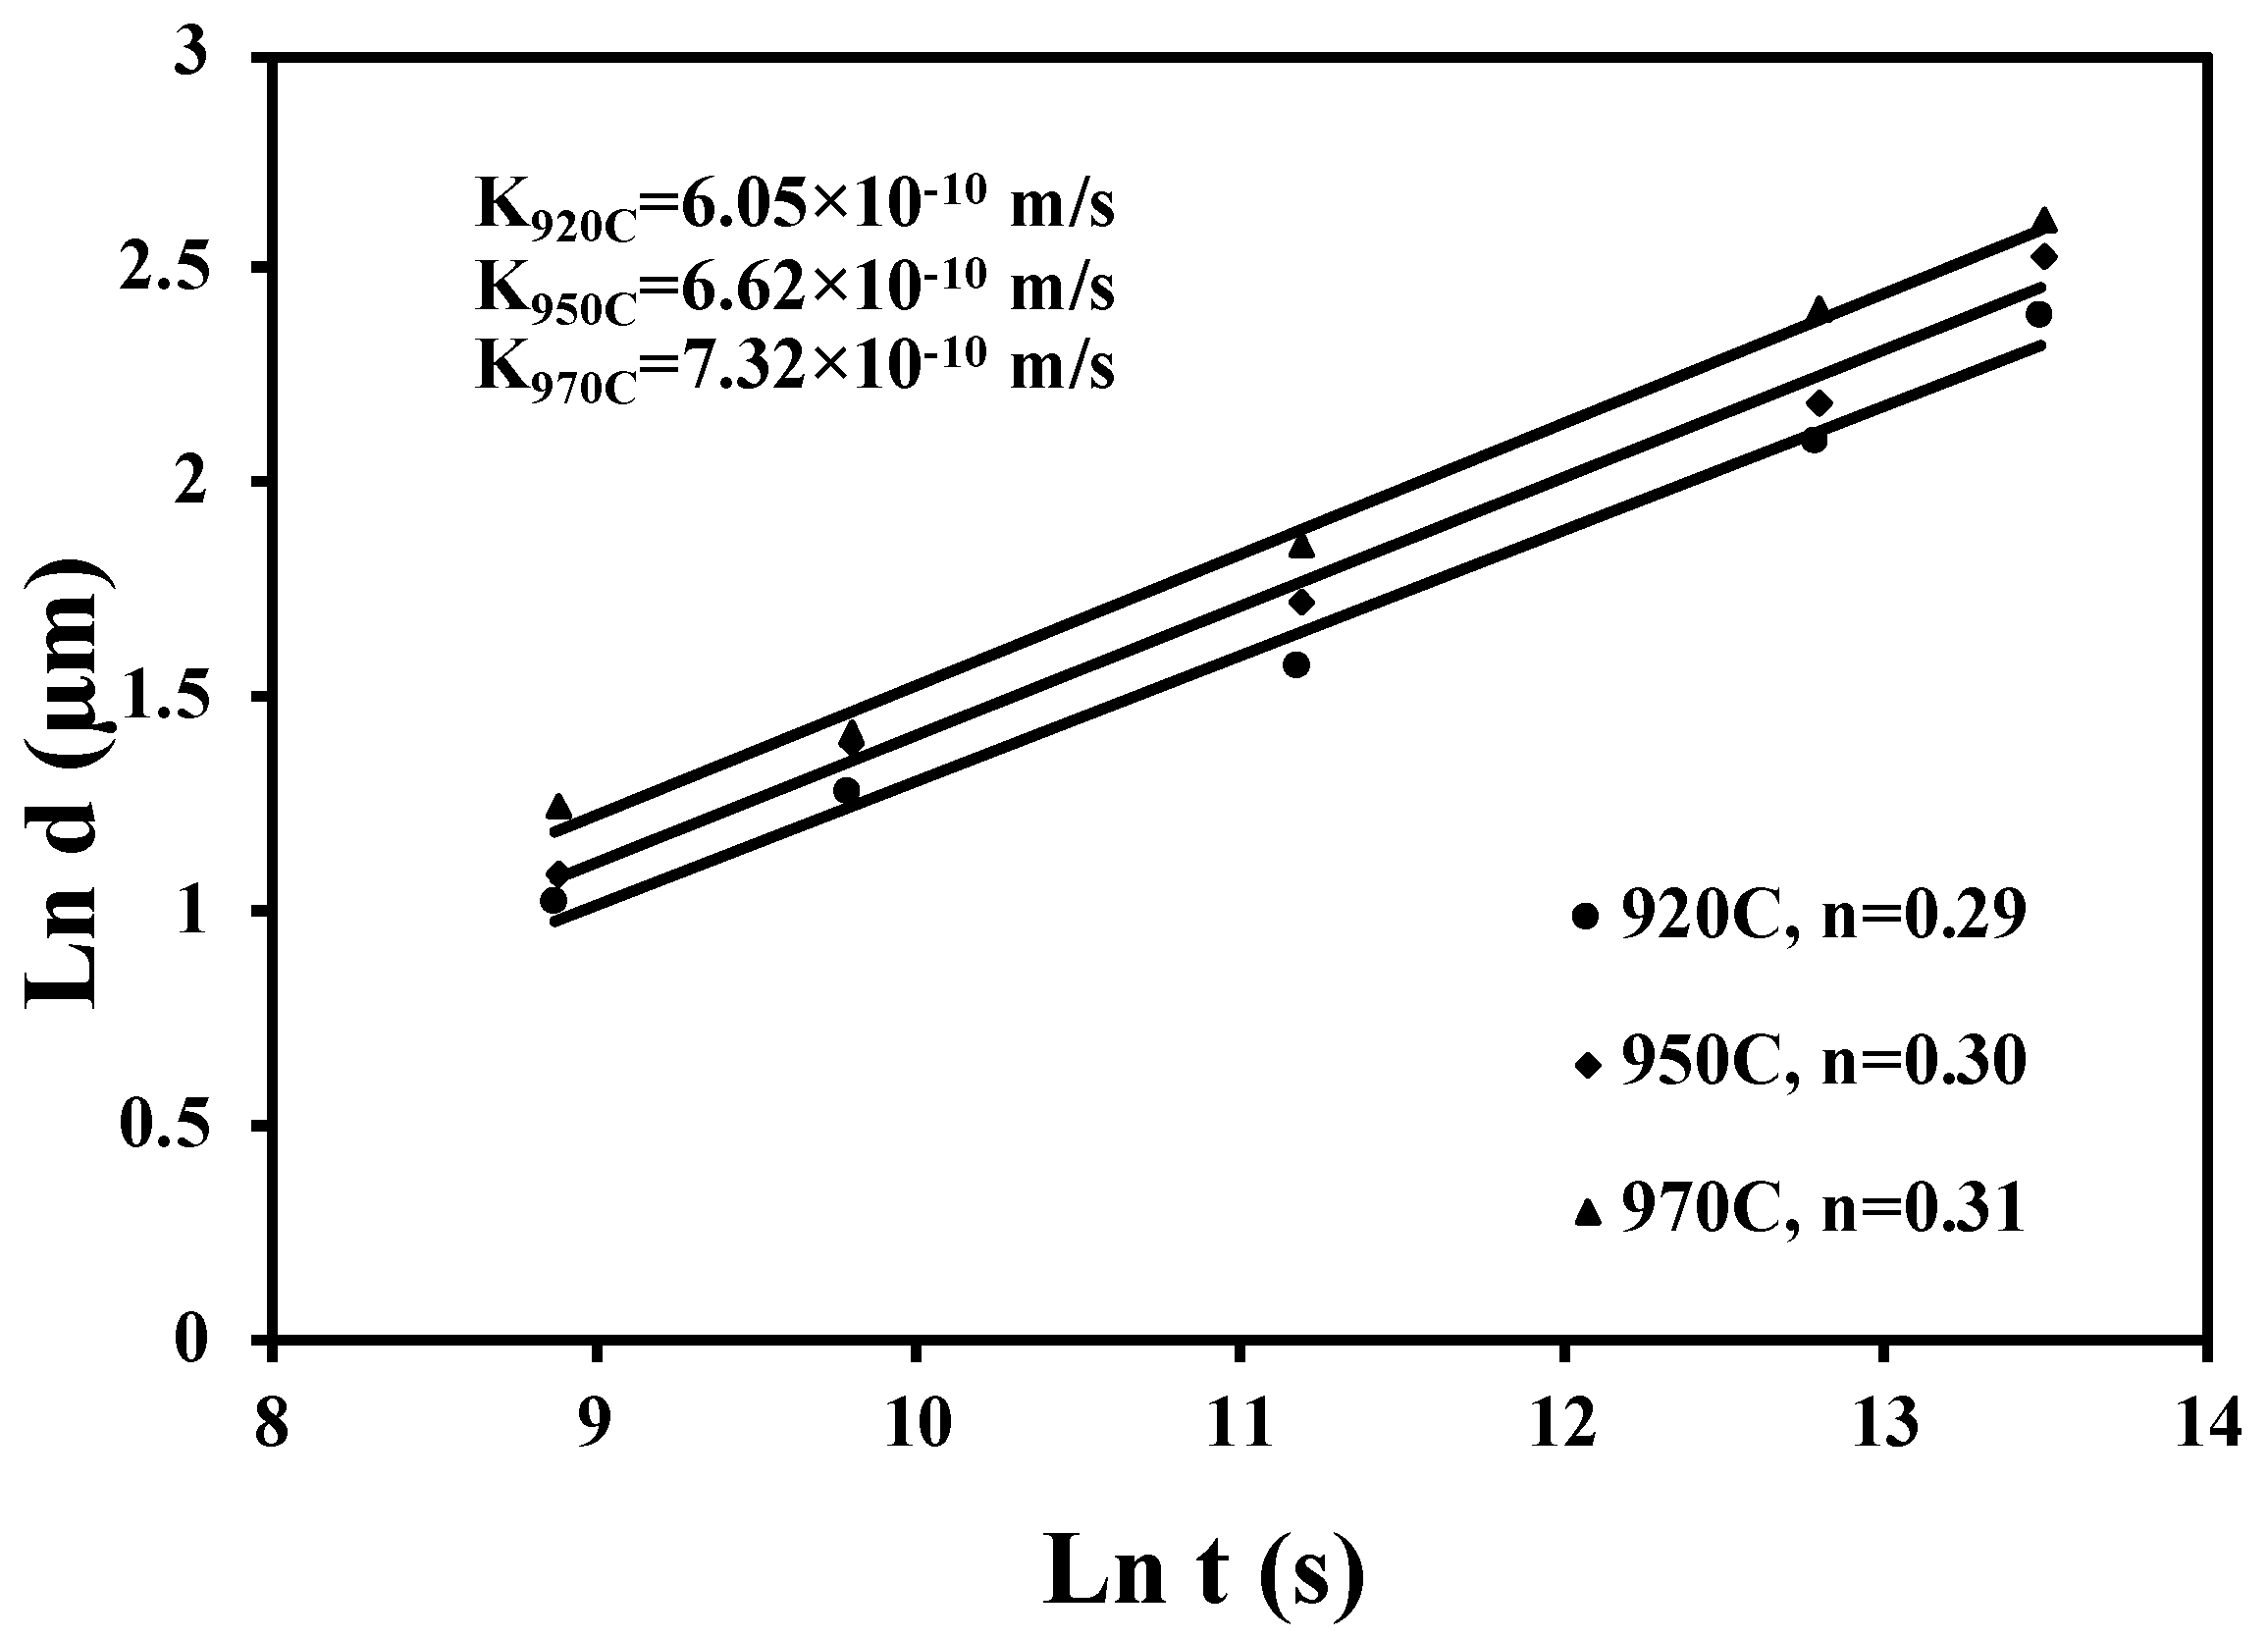
3.5. Coarsening during Heat Treatment

Figure 10 presents the microstructure of HIP Ti-6Al-4V ELI alloy samples before and after the heat treatment at 920, 950, and 970 °C for a holding time of 200 h followed by air cooling. The HIP samples used for heat treatment were the HIP samples (920 °C at 100 MPa for 2 h under an Ar atmosphere followed by controlled air cooling) that consisted of a lamellar mixture of α and β phases. These are the equilibrium phase constituents that would only coarsen at high temperature (i.e., no nucleation kinetics). Coarsening of lamellar width as functions of temperature and time was observed as reported in Table 6. The starting average lamellar width on the HIP sample was around 2.19 µm, which increased to 8.02 µm and 10.83 µm after a heat treatment at 920 °C for 100 h and 200 h, respectively. This increase in average lamellar width as a function of time was also observed at 950 and 970 °C, as reported in Table 6. Clearly, the most extensive coarsening of the lamellar mixture of α and β phases was observed at 970 °C, up to 13.54 µm after heat treatment at 970 °C for 200 h.
The coarsening theory developed by Lifshitz, Slyozov, and Wagner (LSW) theory [48,49] forms the basis when an infinitesimally small volume fraction of solid phase of essentially pure solute coarsens in a dilute terminal solid solution. Therefore, the LSW theory has been modified, and coarsening kinetics expression predicted by the LSW for the titanium alloy with an α + β microstructure can be described by [50]:
d = k t n
or ln d = ln k + n ln t
where d is the average lamellar width (µm); k is the constant of proportionality; t is the heat treatment time (s); and n is the coarsening coefficient. The experimentally measured lamellar widths (µm) and the corresponding heat treatment time t (h) reported in Table 6 were analyzed with respect to Equations (1) and (2), as presented in Figure 11. The coarsening coefficient n was determined to be 0.29, 0.30, and 0.31 for the temperatures of 920, 950, and 970 °C, respectively. Hence, the process of coarsening appears to be close to lattice diffusion controlled [51]. The values of k were determined and found to be 6.05 × 10⁻¹⁰, 6.62 × 10⁻¹⁰, and 7.32 × 10⁻¹⁰ m/s for 920, 950, and 970 °C, respectively. These coefficients would be valuable for exploring the HIP parameters (i.e., higher temperature and/or longer duration) with prior knowledge of the microstructural features.

4. Discussion

Due to the rapid cooling rate associated with the LPBF process, the microstructure in the as-built Ti-6Al-4V ELI alloy consisted of the acicular martensitic α′ phase. Liu et al. [17] reported that the metastable α′-phase with a deformed lattice structure had the highest strength among all combinations of phase constituents possible in the Ti-6Al-4V alloy, but with reduced plasticity. Heat treatment is generally applied to the Ti-6Al-4V alloy after fabrication to develop the microstructure for enhanced ductility and fracture toughness. The heat treatments applied to the Ti-6Al-4V alloy below and above the β transus (1000 °C) are referred to as sub-transus and super-transus heat treatments, respectively [35,52]. For a complete decomposition of α′, Beese et al. [20] reported the temperature required to be 780 °C, while Vilaro et al. [53] reported 800 °C. In this study, the stress relief heat treatment was carried out at 670 °C for 5 h, followed by furnace cooling, and therefore, complete decomposition was not observed. In fact, the β phase was not observed by XRD after stress relief heat treatment, potentially due to instrumental limitation, although Baghi et al. [54] reported the presence of the β phase after stress relief at 670 °C. The presence of a fine acicular α′ microstructure would contribute to the higher strength and lower ductility observed for the ASR samples [20,55]. The presence of α′ will incur lattice strains, which is why it is stronger than the lamellar α + β phase [17]. Yang et al. [56] reported that the high density of dislocations was observed in α′ martensite, which also contributes to hardening via dislocation strengthening.
HIP was performed at 920 °C for 2 h with a gas pressure of 100 MPa under an Ar atmosphere followed by controlled air cooling. The temperature of HIP was above the α′ decomposition temperature, and therefore, the HIP samples exhibited a fine lamellar mixture of α + β phases due to decomposition of the α′(hcp) phase. Due to this phase transformation, the strength of the HIP Ti-6Al-4V alloy samples decreased while ductility increased after the utilization of HIP. On average, the yield strength of the ASR samples decreased from 1141 ± 22 MPa to 928 ± 12 MPa, tensile strength decreased from 1190 ± 15 to 1003 ± 3 MPa, and ductility increased from 6.9 ± 2.3% to 16.1 ± 0.6% after HIP. Utilization of HIP would close the lack-of-fusion flaws and keyhole pores, making the alloy considerably more ductile and isotropic, however, with a slight decrease in strength due to the phase transformation.
The mechanical behavior of the HIP samples was observed to be more consistent and isotropic compared to the ASR samples. As reported in Table 3 and Figure 2 and Figure 3, all of the mechanical properties quantified including yield strength, tensile strength, elongation at fracture, Young’s modulus, modulus of toughness, and Vickers hardness were quite consistent, regardless of build directions after HIP at 920 °C for 2 h with 100 MPa under an Ar atmosphere, followed by controlled air cooling. Therefore, there was no significant mechanical anisotropy to be reported for the Ti-6Al-4V ELI alloy produced by LPBF after the proper HIP. This finding is different from the work of Qiu et al. [22], who reported that the difference in ductility between the horizontally and vertically built samples persisted even after HIP at 920 °C for 4 h at 103 MPa, followed by furnace cooling. Baghi et al. [57] recently documented the concurrent influence of machining (e.g., surface roughness) and build direction on the mechanical behavior of the Ti-6Al-4V alloy as a function of stress-relief and further thermal annealing.
Significant anisotropy in the form of low ductility and low modulus of toughness was observed in ASR samples built in the Z-direction (i.e., sample series C), as reported in Table 2 and Figure 2 and Figure 3. Fracture surfaces from the ASR sample series C with very low ductility and toughness exhibited a significant presence of pockets, as shown in Figure 5, which are keyhole pores based on the size of these pockets, ranging from 30 to 100 µm. These pockets were not observed frequently in any of the fracture surfaces of the HIP samples.

5. Summary

The present study investigated the mechanical properties, fracture surface, and microstructure of Ti-6Al-4V ELI (Grade 23) tensile rods produced by LPBF after stress-relief and hot isostatic pressing using quasi-static tension test at room temperature. The main findings from the study are:
  • Regardless of build direction, the mechanical properties of LPBF Ti-6Al-4V ELI alloy examined by quasi-static tension were consistent and isotropic after hot isostatic pressing (following stress relief treatment at 670 °C for 5 h) at 920 °C for 2 h with a pressure of 100 MPa under an Ar atmosphere.
  • The ASR samples in general had a higher strength and lower ductility along with the presence of a fine acicular α′ phase, while the HIP samples had lower strength and higher ductility. The ASR samples built in the build Z-direction had the lowest ductility at 3.8%. This significant anisotropy in ductility for ASR samples built in the Z direction was mainly due to the presence of keyhole porosity associated with the LPBF process.
  • The mechanical behavior of the HIP samples was more consistent, isotropic, and can be reported as a yield strength of 928 ± 12 MPa, tensile strength of 1003 ± 3 MPa, 16.1 ± 0.6% elongation at fracture, modulus of toughness of 153 ± 5 J/m3, Young’s modulus of 115 ± 2 GPa, and hardness of 303 ± 1 HV.
  • The microstructure of the as-stress-relieved samples was dominated by a fine acicular martensitic α′ phase due to rapid solidification associated with the LPBF. After HIP treatment at 920 °C for 2 h with 100 MPa, the fine acicular martensitic α′ transformed into a fine lamellar mixture of α and β phases. Utilization of HIP would close the lack-of-fusion flaws and keyhole pores, making the alloy considerably more ductile and isotropic, however, with a slight decrease in strength due to the phase transformations.

Author Contributions

Conceptualization, D.D.I., N.E.W., D.M.W. and Y.S.; Formal analysis, A.M. (Asif Mahmud), T.H., L.Z., H.H. and A.M. (Abhishek Mehta); Investigation, A.M. (Asif Mahmud), T.H., L.Z., H.H. and A.M. (Abhishek Mehta); Methodology, A.M. (Asif Mahmud), T.H., H.H. and A.M. (Abhishek Mehta); Writing—original draft, A.M. (Asif Mahmud) and Y.S.; Writing—review and editing, A.M. (Asif Mahmud), D.D.I., N.E.W., D.M.W. and Y.S.; Supervision, Y.S.; Funding acquisition, D.D.I., N.E.W., D.M.W. and Y.S. All authors have read and agreed to the published version of the manuscript.

Funding

This research was sponsored by the Battelle Energy Alliances, LLC under contract no. DE-AC07-05ID14517-214376 with collaboration from the authors of the Idaho National Laboratory. The views, opinions, and conclusions made in this document are those of the authors and should not be interpreted as representing the official policies, either expressed or implied, of the Battelle Energy Alliances, Idaho National Laboratory, or the U.S. Government. The U.S. Government is authorized to reproduce and distribute reprints for government purposes notwithstanding any copyright notation herein.

Data Availability Statement

The data presented in this study are available on request from the corresponding author.

Conflicts of Interest

The authors declare no conflict of interest.

References

  1. Gu, D.D.; Meiners, W.; Wissenbach, K.; Poprawe, R. Laser additive manufacturing of metallic components: Materials, processes and mechanisms. Int. Mater. Rev. 2013, 57, 133–164. [Google Scholar] [CrossRef]
  2. Simonelli, M.; Tse, Y.Y.; Tuck, C. Effect of the build orientation on the mechanical properties and fracture modes of SLM Ti–6Al–4V. Mater. Sci. Eng. A 2014, 616, 1–11. [Google Scholar] [CrossRef] [Green Version]
  3. Carroll, B.E.; Palmer, T.A.; Beese, A.M. Anisotropic tensile behavior of Ti–6Al–4V components fabricated with directed energy deposition additive manufacturing. Acta Mater. 2015, 87, 309–320. [Google Scholar] [CrossRef]
  4. Lewandowski, J.J.; Seifi, M. Metal Additive Manufacturing: A Review of Mechanical Properties. Annu. Rev. Mater. Res. 2016, 46, 151–186. [Google Scholar] [CrossRef] [Green Version]
  5. Kok, Y.; Tan, X.P.; Wang, P.; Nai, M.L.S.; Loh, N.H.; Liu, E.; Tor, S.B. Anisotropy and heterogeneity of microstructure and mechanical properties in metal additive manufacturing: A critical review. Mater. Des. 2018, 139, 565–586. [Google Scholar] [CrossRef]
  6. Frazier, W.E. Metal Additive Manufacturing: A Review. J. Mater. Eng. Perform. 2014, 23, 1917–1928. [Google Scholar] [CrossRef]
  7. Gorsse, S.; Hutchinson, C.; Goune, M.; Banerjee, R. Additive manufacturing of metals: A brief review of the characteristic microstructures and properties of steels, Ti-6Al-4V and high-entropy alloys. Sci. Technol. Adv. Mater. 2017, 18, 584–610. [Google Scholar] [CrossRef] [Green Version]
  8. DebRoy, T.; Wei, H.L.; Zuback, J.S.; Mukherjee, T.; Elmer, J.W.; Milewski, J.O.; Beese, A.M.; Wilson-Heid, A.; De, A.; Zhang, W. Additive manufacturing of metallic components—Process, structure and properties. Prog. Mater. Sci. 2018, 92, 112–224. [Google Scholar] [CrossRef]
  9. Sallica-Leva, E.; Jardini, A.L.; Fogagnolo, J.B. Microstructure and mechanical behavior of porous Ti-6Al-4V parts obtained by selective laser melting. J. Mech. Behav. Biomed. Mater. 2013, 26, 98–108. [Google Scholar] [CrossRef]
  10. Yadroitsev, I.; Krakhmalev, P.; Yadroitsava, I. Selective laser melting of Ti6Al4V alloy for biomedical applications: Temperature monitoring and microstructural evolution. J. Alloys Compd. 2014, 583, 404–409. [Google Scholar] [CrossRef]
  11. Xu, W.; Sun, S.; Elambasseril, J.; Liu, Q.; Brandt, M.; Qian, M. Ti-6Al-4V Additively Manufactured by Selective Laser Melting with Superior Mechanical Properties. J. Met. Mater. Miner. 2015, 67, 668–673. [Google Scholar] [CrossRef]
  12. Qian, M.; Xu, W.; Brandt, M.; Tang, H.P. Additive manufacturing and postprocessing of Ti-6Al-4V for superior mechanical properties. MRS Bull. 2016, 41, 775–784. [Google Scholar] [CrossRef] [Green Version]
  13. Wu, S.Q.; Lu, Y.J.; Gan, Y.L.; Huang, T.T.; Zhao, C.Q.; Lin, J.J.; Guo, S.; Lin, J.X. Microstructural evolution and microhardness of a selective-laser-melted Ti–6Al–4V alloy after post heat treatments. J. Alloys Compd. 2016, 672, 643–652. [Google Scholar] [CrossRef]
  14. Khorasani, A.; Gibson, I.; Goldberg, M.; Littlefair, G. On the role of different annealing heat treatments on mechanical properties and microstructure of selective laser melted and conventional wrought Ti-6Al-4V. Rapid Prototyp. J. 2017, 23, 295–304. [Google Scholar] [CrossRef]
  15. Wang, D.; Dou, W.; Yang, Y. Research on Selective Laser Melting of Ti6Al4V: Surface Morphologies, Optimized Processing Zone, and Ductility Improvement Mechanism. Metals 2018, 8, 471. [Google Scholar] [CrossRef] [Green Version]
  16. Khorasani, A.M.; Gibson, I.; Ghaderi, A.; Mohammed, M.I. Investigation on the effect of heat treatment and process parameters on the tensile behaviour of SLM Ti-6Al-4V parts. Int. J. Adv. Manuf. Technol. 2018, 101, 3183–3197. [Google Scholar] [CrossRef]
  17. Liu, S.; Shin, Y.C. Additive manufacturing of Ti6Al4V alloy: A review. Mater. Des. 2019, 164, 107552. [Google Scholar] [CrossRef]
  18. Xu, W.; Brandt, M.; Sun, S.; Elambasseril, J.; Liu, Q.; Latham, K.; Xia, K.; Qian, M. Additive manufacturing of strong and ductile Ti–6Al–4V by selective laser melting via in situ martensite decomposition. Acta Mater. 2015, 85, 74–84. [Google Scholar] [CrossRef]
  19. Xu, W.; Lui, E.W.; Pateras, A.; Qian, M.; Brandt, M. In situ tailoring microstructure in additively manufactured Ti-6Al-4V for superior mechanical performance. Acta Mater. 2017, 125, 390–400. [Google Scholar] [CrossRef]
  20. Beese, A.M.; Carroll, B.E. Review of Mechanical Properties of Ti-6Al-4V Made by Laser-Based Additive Manufacturing Using Powder Feedstock. J. Met. Mater. Miner. 2015, 68, 724–734. [Google Scholar] [CrossRef]
  21. Liu, J.; Jin, Y.; Fang, X.; Chen, C.; Feng, Q.; Liu, X.; Chen, Y.; Suo, T.; Zhao, F.; Huang, T.; et al. Dislocation Strengthening without Ductility Trade-off in Metastable Austenitic Steels. Sci. Rep. 2016, 6, 35345. [Google Scholar] [CrossRef]
  22. Qiu, C.; Adkins, N.J.E.; Attallah, M.M. Microstructure and tensile properties of selectively laser-melted and of HIPed laser-melted Ti–6Al–4V. Mater. Sci. Eng. A 2013, 578, 230–239. [Google Scholar] [CrossRef]
  23. Thijs, L.; Verhaeghe, F.; Craeghs, T.; Humbeeck, J.V.; Kruth, J.-P. A study of the microstructural evolution during selective laser melting of Ti–6Al–4V. Acta Mater. 2010, 58, 3303–3312. [Google Scholar] [CrossRef]
  24. Edwards, P.; Ramulu, M. Fatigue performance evaluation of selective laser melted Ti–6Al–4V. Mater. Sci. Eng. A 2014, 598, 327–337. [Google Scholar] [CrossRef]
  25. Parry, L.; Ashcroft, I.A.; Wildman, R.D. Understanding the effect of laser scan strategy on residual stress in selective laser melting through thermo-mechanical simulation. Addit. Manuf. 2016, 12, 1–15. [Google Scholar] [CrossRef] [Green Version]
  26. Mishurova, T.; Cabeza, S.; Artzt, K.; Haubrich, J.; Klaus, M.; Genzel, C.; Requena, G.; Bruno, G. An Assessment of Subsurface Residual Stress Analysis in SLM Ti-6Al-4V. Materials 2017, 10, 348. [Google Scholar] [CrossRef] [PubMed] [Green Version]
  27. Gloaguen, D.; Girault, B.; Courant, B.; Dubos, P.-A.; Moya, M.-J.; Edy, F.; Rebelo Kornmeier, J. Study of Residual Stresses in Additively Manufactured Ti-6Al-4V by Neutron Diffraction Measurements. Metall. Mater. Trans. A 2019, 51, 951–961. [Google Scholar] [CrossRef]
  28. Yadroitsev, I.; Yadroitsava, I.; Plessis, A.D.; MacDonald, E. Fundamentals of Laser Powder Bed Fusion of Metals, 1st ed.; Elsevier: Amsterdam, The Netherlands, 2021; pp. 245–276. [Google Scholar]
  29. Syed, A.K.; Ahmad, B.; Guo, H.; Machry, T.; Eatock, D.; Meyer, J.; Fitzpatrick, M.E.; Zhang, X. An experimental study of residual stress and direction-dependence of fatigue crack growth behaviour in as-built and stress-relieved selective-laser-melted Ti6Al4V. Mater. Sci. Eng. A 2019, 755, 246–257. [Google Scholar] [CrossRef]
  30. Hrabe, N.; Gnäupel-Herold, T.; Quinn, T. Fatigue properties of a titanium alloy (Ti–6Al–4V) fabricated via electron beam melting (EBM): Effects of internal defects and residual stress. Int. J. Fatigue 2017, 94, 202–210. [Google Scholar] [CrossRef] [Green Version]
  31. Wauthle, R.; Vrancken, B.; Beynaerts, B.; Jorissen, K.; Schrooten, J.; Kruth, J.-P.; Van Humbeeck, J. Effects of build orientation and heat treatment on the microstructure and mechanical properties of selective laser melted Ti6Al4V lattice structures. Addit Manuf. 2015, 5, 77–84. [Google Scholar] [CrossRef]
  32. Leuders, S.; Thöne, M.; Riemer, A.; Niendorf, T.; Tröster, T.; Richard, H.A.; Maier, H.J. On the mechanical behaviour of titanium alloy TiAl6V4 manufactured by selective laser melting: Fatigue resistance and crack growth performance. Int. J. Fatigue 2013, 48, 300–307. [Google Scholar] [CrossRef]
  33. Tao, P.; Li, H.-X.; Huang, B.-Y.; Hu, Q.-D.; Gong, S.-L.; Xu, Q.-Y. Tensile behavior of Ti-6Al-4V alloy fabricated by selective laser melting: Effects of microstructures and as-built surface quality. China Foundry 2018, 15, 243–252. [Google Scholar] [CrossRef] [Green Version]
  34. Kasperovich, G.; Hausmann, J. Improvement of fatigue resistance and ductility of TiAl6V4 processed by selective laser melting. J. Mater. Process. Technol. 2015, 220, 202–214. [Google Scholar] [CrossRef]
  35. Vrancken, B.; Thijs, L.; Kruth, J.-P.; Van Humbeeck, J. Heat treatment of Ti6Al4V produced by Selective Laser Melting: Microstructure and mechanical properties. J. Alloys Compd. 2012, 541, 177–185. [Google Scholar] [CrossRef] [Green Version]
  36. Cao, S.; Hu, Q.; Huang, A.; Chen, Z.; Sun, M.; Zhang, J.; Fu, C.; Jia, Q.; Lim, C.V.S.; Boyer, R.R.; et al. Static coarsening behaviour of lamellar microstructure in selective laser melted Ti–6Al–4V. J. Mater. Sci. Technol. 2019, 35, 1578–1586. [Google Scholar] [CrossRef]
  37. Yan, X.; Yin, S.; Chen, C.; Huang, C.; Bolot, R.; Lupoi, R.; Kuang, M.; Ma, W.; Coddet, C.; Liao, H.; et al. Effect of heat treatment on the phase transformation and mechanical properties of Ti6Al4V fabricated by selective laser melting. J. Alloys Compd. 2018, 764, 1056–1071. [Google Scholar] [CrossRef]
  38. Ti-6Al-4V (Ti0.94V0.01Al0.05 rt) Crystal Structure: Datasheet from “PAULING FILE Multinaries Edition—2012” in SpringerMaterials. Available online: https://materials.springer.com/isp/crystallographic/docs/sd_1931746 (accessed on 17 October 2020).
  39. Stephens, P.W. Rietveld Refinement. In Uniting Electron Crystallography and Powder Diffraction, 1st ed.; Kolb, U., Shankland, K., Meshi, L., Avilov, A., David, W., Eds.; Springer: Dordrecht, The Netherlands, 2011; pp. 15–26. [Google Scholar]
  40. Rafi, H.K.; Karthik, N.V.; Gong, H.; Starr, T.L.; Stucker, B.E. Microstructures and Mechanical Properties of Ti6Al4V Parts Fabricated by Selective Laser Melting and Electron Beam Melting. J. Mater. Eng. Perform. 2013, 22, 3872–3883. [Google Scholar] [CrossRef]
  41. Yu, J.; Rombouts, M.; Maes, G.; Motmans, F. Material Properties of Ti6Al4V Parts Produced by Laser Metal Deposition. Phys. Procedia 2012, 39, 416–424. [Google Scholar] [CrossRef] [Green Version]
  42. Facchini, L.; Magalini, E.; Robotti, P.; Molinari, A.; Höges, S.; Wissenbach, K. Ductility of a Ti-6Al-4V alloy produced by selective laser melting of prealloyed powders. Rapid Prototyp J. 2010, 16, 450–459. [Google Scholar] [CrossRef]
  43. Attallah, M.M.; Zabeen, S.; Cernik, R.J.; Preuss, M. Comparative determination of the α/β phase fraction in α + β-titanium alloys using X-ray diffraction and electron microscopy. Mater. Charact. 2009, 60, 1248–1256. [Google Scholar] [CrossRef]
  44. Pederson, R. Microstructure and Phase Transformation of Ti-6Al-4V. Ph.D. Thesis, Luleå University of Technology, Luleå, Sweden, 2002. [Google Scholar]
  45. Motyka, M. Martensite formation and decompostion during Traditional and AM processing of Two-Phase Titanium Alloys-An Overview. Metals 2021, 11, 481. [Google Scholar] [CrossRef]
  46. Sofinowski, K.; Šmíd, M.; Kuběna, I.; Vivès, S.; Casati, N.; Godet, S.; Van Swygenhoven, H. In situ characterization of a high work hardening Ti-6Al-4V prepared by electron beam melting. Acta Mater. 2019, 179, 224–236. [Google Scholar] [CrossRef]
  47. Fultz, J.H.B. Transmission Electron Microscopy and Diffractometry of Materials, A.6 Indexed Single Crystal Diffraction Patterns, 3rd ed.; Springer: Berlin/Heidelberg, Germany; New York, NY, USA, 2004; pp. 709–711. [Google Scholar]
  48. Lifshitz, M.; Slyozov, V.V. The kinetics of precipitation from supersaturated solid solutions. J. Phys. Chem. Solids 1961, 19, 35–50. [Google Scholar] [CrossRef]
  49. Semiatin, S.L.; Kirby, B.C.; Salishchev, G.A. Coarsening Behavior of an Alpha-Beta Titanium Alloy. Metall. Mater. Trans. A 2004, 35A, 2809–2819. [Google Scholar] [CrossRef] [Green Version]
  50. Xu, J.; Zeng, W.; Jia, Z.; Sun, X.; Zhao, Y. Coarsening Kinetics and Morphological Evolution in a Two-Phase Titanium Alloy During Heat Treatment. J. Mater. Eng. Perform. 2016, 25, 734–743. [Google Scholar] [CrossRef]
  51. Xu, J.; Zeng, W.; Sun, X.; Jia, Z.; Zhou, J. Static coarsening behavior of the lamellar alpha in Ti-17 alloy. J. Alloys Compd. 2015, 631, 248–254. [Google Scholar] [CrossRef]
  52. Zuback, J.S.; DebRoy, T. The Hardness of Additively Manufactured Alloys. Materials 2018, 11, 2070. [Google Scholar] [CrossRef] [Green Version]
  53. Vilaro, T.; Colin, C.; Bartout, J.D. As-Fabricated and Heat-Treated Microstructures of the Ti-6Al-4V Alloy Processed by Selective Laser Melting. Metall. Mater. Trans. A 2011, 42, 3190–3199. [Google Scholar] [CrossRef]
  54. Baghi, A.D.; Nafisi, S.; Hashemi, R.; Edendorff-Heiderpriem, H.; Ghomashchi, R. Effective Post Processing of SLM Fabricated Ti-6Al-4V Alloy: Machining vs Thermal Treatment. J. Manuf. Proc. 2021, 68, 1031–1046. [Google Scholar] [CrossRef]
  55. Gong, H.; Rafi, K.; Gu, H.; Janaki Ram, G.D.; Starr, T.; Stucker, B. Influence of defects on mechanical properties of Ti–6Al–4V components produced by selective laser melting and electron beam melting. Mater. Des. 2015, 86, 545–554. [Google Scholar] [CrossRef]
  56. Yang, J.; Yu, H.; Yin, J.; Gao, M.; Wang, Z.; Zeng, X. Formation and control of martensite in Ti-6Al-4V alloy produced by selective laser melting. Mater. Des. 2016, 108, 308–318. [Google Scholar] [CrossRef]
  57. Baghi, A.D.; Nafisi, S.; Hashemi, R.; Edendorff-Heiderpriem, H.; Ghomashchi, R. Experimental Realisation of Build Orientation Effects on The Mechanical Properties of Truly As-Built Ti-6Al-4V SLM Parts. J. Manuf. Proc. 2021, 64, 140–152. [Google Scholar] [CrossRef]
Figure 1. Fractured tensile specimens: (a) as-stress relieved (ASR) and (b) hot isostatically pressed (HIP) Ti-6Al-4V ELI alloy. Sample series A and B were horizontally built in X and Y direction, while C was built vertically in the Z direction, which is the build direction of the LPBF. Note that minor size variation is due to the photography and not the sample size.
Metals 11 01671 g001
Figure 2. Engineering stress-strain curves obtained from all the Ti-6Al-4V ELI tensile samples: (a) as-stress relieved (ASR) and (b) hot isostatically pressed (HIP).
Metals 11 01671 g002
Figure 3. (a) Modulus of toughness and (b) Vickers hardness determined for the as stress-relieved (ASR) and hot-isostatically pressed (HIP) Ti-6Al-4V ELI alloy samples. Uncertainty in (a) was determined from stress-strain curves (average and standard deviation from area under the curve). Standard deviation from (b) was determined from five measurements from random locations.
Metals 11 01671 g003
Figure 4. Secondary electron fractographic micrographs at higher magnification for Ti-6Al-4V ELI alloy samples after ASR and HIP: (a) ASR-A1, (b) HIP-A1, (c) ASR-B1, (d) HIP-B1, (e) ASR-C1, and (f) HIP-C1.
Metals 11 01671 g004
Figure 5. Secondary electron fractographic micrographs demonstrating the presence of large pockets in the (a,b) vertically built ASR-C1, Ti-6Al-4V ELI alloy sample.
Metals 11 01671 g005
Figure 6. Representative X-ray diffraction patterns of the ASR and HIP Ti-6Al-4V ELI alloy samples.
Metals 11 01671 g006
Figure 7. Representative optical micrographs of the Ti-6Al-4V ELI alloy samples: (a) ASR and (b) HIP.
Metals 11 01671 g007
Figure 8. TEM observations from the representative ASR sample: (a) bright field micrograph, (b) SAED pattern from the α′ phase, and (c) HAADF STEM micrograph.
Metals 11 01671 g008
Figure 9. TEM observations from the representative HIP sample: (a) bright field micrograph, (b) SAED pattern from the α phase, (c) SAED from the β phase, and (d) HAADF STEM micrograph.
Metals 11 01671 g009
Figure 10. Optical micrographs of the HIP Ti-6Al-4V ELI alloy samples before and after heat treatment, followed by air cooling: (a) before heat treatment, (b) 920 °C for 200 h, (c) 950 °C for 200 h, and (d) 970 °C for 200 h.
Metals 11 01671 g010
Figure 11. Plots of ln d vs. ln t to determine n and k at 920, 950, and 970 °C for the coarsening of the α + β microstructure in the LPBF Ti-6Al-4V ELI alloy.
Metals 11 01671 g011
Table 1. Sample identification employed in this study.
SampleBuild Direction
Horizontal—XHorizontal—YVertical—Z
As stress relieved (ASR)ASR-A1ASR-B1ASR-C1
ASR-A2ASR-B2ASR-C2
ASR-A3ASR-B3ASR-C3
Hot isostatically pressed (HIP)HIP-A1HIP-B1HIP-C1
HIP-A2HIP-B2HIP-C2
HIP-A3HIP-B3HIP-C3
Table 2. Tensile properties determined from the as-stress relieved (ASR) Ti-6Al-4V ELI alloy samples.
SampleYS, σ0.2%
(MPa)
UTS
(MPa)
%
EL at Fracture
Young’s Modulus
(GPa)
ASR-A21107.521164.619.40115.75
ASR-A31115.961175.719.00115.00
Average and Standard
deviation for ASR-A
1111.74 ± 4.221169.66 ± 5.059.20 ± 0.20115.88 ± 0.13
ASR-B11137.381200.477.95116.18
ASR-B21149.131209.027.13113.68
ASR-B31153.601211.458.57113.38
Average and Standard
deviation for ASR-B
1146.70 ± 6.841206.98 ± 4.717.88 ± 0.59114.75 ±1.05
ASR-C11157.111182.573.68121.53
ASR-C21169.931203.253.95120.23
ASR-C31163.301192.643.80121.62
Average and Standard
deviation for ASR-C
1163.45 ± 5.231192.82 ± 8.443.81 ± 0.11121.13 ± 0.64
Table 3. Tensile properties determined from the hot isostatically pressed (HIP) Ti-6Al-4V ELI alloy samples.
SampleYS, σ0.2%
(MPa)
UTS
(MPa)
%
EL at Fracture
Young’s Modulus (GPa)
HIP-A1937.401006.9416.05115.87
HIP-A2936.691006.3316.55115.36
HIP-A3936.081007.5715.49115.34
Average and Standard
deviation for HIP-A
936.72 ± 0.541006.94 ± 0.5116.03 ± 0.43115.5 ± 0.25
HIP-B1933.551003.5515.68118.60
HIP-B2933.801003.8215.02114.15
HIP-B3939.091002.5015.44117.88
Average and Standard
deviation for HIP-B
935.48 ± 2.551003.29 ± 0.5715.38 ±0.27116.88 ± 1.95
HIP-C1907.721000.2718.03112.98
HIP-C2908.70998.8516.64113.32
HIP-C3915.68997.6715.97112.97
Average and Standard
deviation for HIP-C
910.70 ± 3.54998.93 ± 1.0616.88 ± 0.86113.09 ± 0.16
Table 4. Density of the ASR and HIP Ti-6Al-4V ELI alloy samples.
Sample IDDensity by Image Analysis (%)Archimedes Density (%)
ASR-A199.97 ± 0.0199.37 ± 0.03
ASR-B199.96 ± 0.0199.60 ± 0.05
ASR-C199.95 ± 0.0199.54 ± 0.05
HIP-A199.99 ± 0.0199.22 ± 0.06
HIP-B199.99 ± 0.0199.05 ± 0.09
HIP-C199.98 ± 0.0299.19 ± 0.07
Table 5. Parameters for the Rietveld refinement of XRD patterns from the ASR (α′ phase) and HIP (α + β phases) Ti-6Al-4V ELI alloy samples.
Parametersα′ Phaseα Phaseβ Phase
ICDD database code01-089-500901-089-500901-081-9813
ICSD database code76,26576,265187,067
Volume percent10098.591.41
Weight per cent10089.3010.70
Space group (No.)P63/mmc (194)P63/mmc (194)Im 3 ¯ m (229)
Lattice parameter: a2.9440 Å2.9440 Å3.2322 Å
Lattice parameter: c4.6780 Å4.6780 Å3.2322 Å
R (weighted profile)7.05%8.41%8.41%
Goodness of fit (GOF)1.902.352.35
Table 6. Average lamellar width after heat treatment at 920, 950, and 970 °C as a function of time.
Heat Treatment Time (hours)920 °C950 °C970 °C
Lamellar Width (µm)
02.19 ± 0.552.19 ± 0.552.19 ± 0.55
2 h2.74 ± 0.572.95 ± 0.673.45 ± 0.46
5 h3.56 ± 1.153.99 ± 1.214.1 ± 0.82
20 h4.78 ± 1.325.6 ± 2.416.34 ± 2.31
100 h8.02 ± 3.418.88 ± 4.6710.99 ± 3.71
200 h10.83 ± 3.9012.54 ± 4.7913.54 ± 4.2
Publisher’s Note: MDPI stays neutral with regard to jurisdictional claims in published maps and institutional affiliations.

