
New Approach in Research of Quartzes and Quartzites for Ferroalloys and Silicon Production


1
Faculty of Materials, Metallurgy and Recycling, Technical University of Kosice, Letná, 9-042-00 Košice, Slovakia
2
Institute of Geotechnics, Slovak Academy of Sciences, Watsonova, 45-040-01 Košice, Slovakia
*
Author to whom correspondence should be addressed.
Metals 2021, 11(4), 670; https://doi.org/10.3390/met11040670
Submission received: 19 March 2021
/
Revised: 13 April 2021
/
Accepted: 15 April 2021
/
Published: 20 April 2021
Abstract
:This article deals with material research of selected types of quartz and quartzites in order to determine the priority of their use in the production of ferrosilicon and pure silicon, respectively. The highest quality quartzes and quartzites are commonly used in metallurgy, but not all types of these silicon raw materials are suitable for the production of ferrosilicon and pure silicon, despite their similar chemical composition. Behavior differences can be observed in the process conditions of heating and carbothermic production of ferrosilicon and silicon. These differences depend, in particular, on the nature and content of impurities, and the granularity (lumpiness) and microstructure of individual grains. The research focused primarily on determining the physicochemical and metallurgical properties of silicon raw materials. An integral part of the research was also the creation of a new methodology for determining the reducibility of quartzes (or quartzites), which could be used for real industrial processes and should be very reliable. The results of the laboratory experiments and evaluation of the physicochemical and metallurgical properties of the individual quartzes (or quartzites) are presented in the discussion. Based on comparison of the tested samples’ properties, their priority of use was determined. This research revealed the highest quality in quartzite from Sweden (Dalbo deposit) and Ukraine (Ovruč deposit) and quartz from Slovakia (Švedlár deposit). The use of these raw materials in industrial conditions is expected to result in the achievement of better production parameters, such as higher yield and product quality and lower electricity consumption.
1. Introduction
The principles for the production of ferrosilicon (FeSi) and metallurgical grade silicon (MG-Si) are similar, and both involve the reduction of quartzes (or quartzites) with carbon in a submerged arc furnace (SAF). The main difference is that iron material is added to the charge in the ferrosilicon process. Quartzes and quartzites belong among the sediments with grain size between 0.05 to 2 mm where the individual grains are layered and form a variable structure. While quartz is classed as a mineral, quartzite is included among the ores. Quartzites contain mainly quartz grains, which make up to 95% of all grains. The difference between them is mainly in the content of impurities. Quartz may contain individual trace amounts of impurities including aluminum, iron, magnesium, calcium, titanium, potassium, lithium and boron, whereas quartzite contains quantifiable amounts of impurities which also form individual mineral-based compounds in the ore (e.g., calcite, hematite or dolomite) [1]. The main types of deposits for lump metallurgical quartz in geological terms are quartzite, hydrothermal quartz and pegmatite quartz (rock quartz) and fluvial quartz (gravel quartz) [2].
Silicon is reduced from silicon dioxide by solid carbon, whereby, prior to the carbothermic reduction of SiO2 to Si, the phase transformations of silica also take place (Table 1). These phase transformations also significantly affect the reduction of quartz or quartzite.
The possible reactions represent only the basic part of the reactions, which actually take place in the EAF during the production of silicon or ferrosilicon (Figure 1). Table 2 gives basic information about the carbothermic reduction of SiO2 (Equations (1)–(7)). It is evident that the carbothermic reduction of SiO2 is a chemically, thermodynamically and energetically very intense process which is affected by a large number of factors (e.g., thermodynamic conditions, input materials quality, reactor type and process control) [4,5,6,7,8,9]. Depending on these factors, the creation of SiO(g) can take place as well as further chemical reactions producing silicon carbide and silicon. Formation of SiO(g) is very important and consumes a large amount of energy, then SiO(g) reacts with the carbon of the reducing agent to SiC, or with the SiC, thus forming Si(l).
Carbothermic production of FeSi and silicon is carried out by the reduction route using carbonaceous reductants (e.g., coke, coal, anthracite, charcoal or semi-coke) (Figure 1). Reduction processes take place at high temperatures between 1400 and 1900 °C with very high energy demand (11–13 MWh per ton of Silicon) and many intermediate reactions [4,5,6,8].
In addition to the majority reaction in the reduction of SiO2 with carbon, a number of complex reactions take place in which SiC and Si act as reducing agents in the reaction zone [4]. Reduction through gaseous phase CO(g) does not occur, since thermodynamic calculations show the impassability of the chemical reaction even at temperatures of 1877 °C, and in high-temperature experiments it was found that a gaseous mixture containing almost 100% CO(g) does not act reductively on SiO2 at temperatures of approx. 1800–2000 °C. The presence of SiO(g) monoxide in the reaction zone, in addition to the reduced Si and SiC, can reduce the silicon yield and complicate the determination of the reducibility of quartzes and quartzites.
In the production of silicon and ferrosilicon, different types of quartz are used. The industry has defined these requirements for the quartzes and quartzites that must be achieved in order for the process to be optimized: [7]
- ▪
- Chemistry (trace element content, e.g., Al, Ti, B, P, Fe, Ca);
- ▪
- Lump size (typically 10–150 mm);
- ▪
- Mechanical strength (a measurement of the degree of crushing and fines generation during handling and transport);
- ▪
- Thermal strength (a measurement of the degree of fines generation during heating);
- ▪
- Softening and melting properties;
- ▪
- Reducibility.
Reviews from studies from around the world show that much of the discussion about “good” and “bad” quartz has been related to the explosive disintegration of some quartz types at 850 to 1000 °C. In general, increased temperature and holding time will increase the transformation from quartz to cristobalite. The different reasons discussed are the generation of tridymite and the alkali impurities that must join this phase transformation, as well as the influence of mica on the thermal stability of the quartz [7,10,11,12]. Pegmatitic and hydrothermal quartzes show low thermal stability. Fluid inclusions in quartz are also a possible factor that influences the thermal properties [7]. Higher amounts of alkali and alkaline earth elements would catalyze the transformation from quartz to cristobalite. The explanation is that the impurities will create liquids with melting points well below the melting point of silica [13]. High temperature stability is a very important characteristic of quartzes and quartzites because it can decrease the permeability of the burden in SAF, and deterioration of the reducing reactions takes place. The measurement of the degree of fines generation during heating can be realised with many methods: the Elkem Method (Fiskaa Method), Friability index and dust index, and the Spigerverket method [2]. The determination of the softening and melting temperature of quartzes and quartzites represents very important information in terms of the reaction mechanism and power consumption. Reducibility is one of the most important properties on which the chemical reaction mechanism, yield and other technological-economic parameters can be determined [4]. Table 3 gives specifications of the methodologies for determining the reducibility of quartzes (or quartzites) [10,14,15,16,17,18]. Analysis of these methodologies shows that there is no unified methodology that might be used in several countries under a certified standard [7,8,9,10,11,12]. The methodologies most closely approaching the real conditions in the EAF have been developed in highly advanced research centers (e.g., in Norway-Elkem, NTNU and SINTEF). In particular, Tangstad’s methodology was the guide for the creation of our own methodology, which can also be used in the evaluation of the reducibility of quartzes or quartzites in the future.
2. Materials and Methods
The experimental work was carried out in accordance with the methodology (Figure 2) consisting of:
- Screening test for determination of particle size distribution;
- Analysis of chemical composition and homogeneity;
- Specification of microstructural composition (microstructure of grains, detail of impurities);
- Determination of high temperature stability (including determination of HI and TSI index);
- Determination of high temperature reducibility (ground and grain state, microstructure of SiC).
A total of eight samples were used in our experimental study, four of which can be included among quartzes and four samples among quartzites (Figure 3). Chemical composition was determined with a Niton XL3 Gold XRF spectrometer (Thermo Fisher Scientific, Waltham, MA, USA) and using Thermo Scientific ICE 3500 AAS (Thermo Fisher Scientific, Waltham, MA, USA) elemental analysis. Average analytical samples were prepared from the supplied samples. As part of the optical observation of each delivered sample, selected samples with different appearances were prepared in order to assess their chemical differences. Due to the fact that the structural state (grain character and orientation, grain irregularity and isotropy, impurities at the grain boundaries, porosity) affects the high-temperature stability and reducibility of quartzes (or quartzites), a microscopic study was carried out. Analysis of the samples was conducted by means of EDX analysis using a Tescan MIRA 3 microscope (Tescan Orsay Holding, Brno, Czech Republic), using point and surface elemental analysis of selected microstructures.
2.1. Determination of High-Temperature Stability
The heating of granulometrically adjusted samples with input grain sizes of about 30–40 mm was carried out under pre-specified conditions in an electric resistance furnace (type VT1700, LAC, Czech Republic) with controlled temperature heating to the required temperature levels (1300 °C, 1450 °C, and 1600 °C), with a holding time of one hour and subsequent controlled cooling (heating and cooling rate was from 3 to 5 °C/min). After removal, the samples were subjected to visual inspection and mechanical stress testing in a drum (geometry: d = 200 mm, w = 100 mm, 2 bars) at 200 rotations over 5 min (40 rpm). The high-temperature stability of the samples was evaluated on the basis of screen analysis (Laboratory Test Sieves ASTM AG2000-A) of the thermally and mechanically stressed samples (Figure 4). The evaluating parameters were the cumulative and distribution curves of the materials, depending on the intensity of the heat stress and the change in the average grain size. The degree of thermal and mechanical resistance was expressed through the so-called Heat Index (HI) and Thermal Strength Index (TSI). The HI index expresses the resistance to disintegration, i.e., in our case, the percentage of the fraction +16 mm after the thermal stress (8):
HI = (m+16/M)·100 (%)
m+16 = mass of fraction + 16 mm (kg), M = mass of all fractions (kg)
m+16 = mass of fraction + 16 mm (kg), M = mass of all fractions (kg)
The modified TSI index was determined after the drum test of the entire volume of thermally stressed samples (9):
TSI = (%+16 + %10–16 + %5–16 + %2–16)/4 (%)
%+16 = percentage of fraction +16 mm (%),
%10–16 = percentage of fraction 10–16 mm (%),
%5–16 = percentage of fraction 5–16 mm (%),
%2–16 = percentage of fraction 2–16 mm (%)
The mean grain size in each sample was determined as the weighted average of the percentage of individual grain size classes.
2.2. Determination of High-Temperature Reducibility
The experiments within the high-temperature reduction testing of quartzes (or quartzites) were performed in a high-frequency electric HFR furnace (Rajmont, Czech Republic) at 1650–1900 °C (Figure 5). Charcoal was used as the reducing agent (CFIX = 87.5%, ash = 2.8%, volatile combustible = 9.7%). For carbothermic reduction, we used modified samples of quartzes or quartzites in two granulometric classes: below 0.5 mm and 1–5 mm. The mass ratio of quartz (or quartzite) to charcoal was 10:6. The experiments were carried out in two test modes: homogeneous state (homogenized quartz or quartzite with charcoal) and segregated state (bottom layer of quartz or quartzite, top layer of charcoal). After weighing, the samples were placed in graphite crucibles, either four-hole or single-hole. Subsequently, the graphite crucibles were placed in an electric induction furnace where heating was carried out up to the test temperature, with holding times of 15–30 min. In the course of the experiment, the induction furnace was closed with a graphite cover with a small central opening (diameter = 1 cm), through which the temperature measurements were performed. Temperatures were contactless measured on the surface of the crucibles. Based on the induction heating temperature gradient, temperatures at the bottom of the crucibles (reaction zone) were predicted and calculated to be 100 °C higher. Monitoring of CO(g) over the crucibles was recorded during the individual experiments. The main evaluation parameter of the experiments was the amount and structure of the silicon carbide formed, and this parameter was chosen due to the simplest formation of silicon carbide in a short time and at relatively low temperatures.
3. Results and Discussion
3.1. Chemical Composition
Comparison of the physicochemical properties (Figure 3, Table 4) and chemical homogeneity of the individual quartz and quartzite samples revealed the most homogeneous structure in quartz from Spain and quartzite from Sweden, and the least homogeneous were quartz from Macedonia and quartzite from Slovakia. In the case of the quartzite Slovakia samples, there were several modifications of the quartzites with different shapes and colors.
Comparison of the chemical compositions of the analyzed quartzes and quartzites resulted in the highest SiO2 content being found in the quartz Spain sample (99.32%) and in quartz Slovakia (99.25%). The lowest SiO2 content was analyzed in samples of quartzite Slovakia (97.18%) and Ukraine (97.04%). These quartzite samples also visibly had the highest content of impregnated grains. In terms of FeTOT content, the lowest contents were found in the samples of quartz Spain and Russia (approx. 0.2%), while the highest FeTOT occurred in quartzites Slovakia and Ukraine (approx. 0.6%). The lowest Al2O3 content was analyzed in the samples of quartz Spain and Macedonia (approx. 0.12–0.14%), while the highest Al2O3 content was analyzed in the samples of quartzite Slovakia and Ukraine (approx. 1.25–1.4%). Quartzite Ukraine may have a high content of Al2O3 impurities, which form continuous and separate large chains inside quartz grains, but these chains are segregated in larger units and well separated. From the point of view of the high-temperature treatment of this quartzite, the higher content of Al2O3 may not deteriorate conditions for the reduction of SiO2. Quartzites Sweden and Slovakia had a higher content of K2O (approx. 0.2–0.4%). All analyzed quartzes and quartzites had very low phosphorus contents. The smallest quantities of P were in quartz Russia (0.003%), and the highest quantities of P were in quartzites Slovakia and Ukraine (approx. 0.02%).
3.2. Microstructural Composition
Due to the fact that the structural state (grain character and orientation, grain irregularity and isotropy, impurities at grain boundaries, and porosity) affected the high-temperature stability and the reducibility of the quartzites (or quartzes), a microscopic study was performed. Microstructure analysis of the quartzes and quartzites showed high correlation in terms of the chemical composition of the delivered samples (Figure 6). The highest homogeneity (grain regularity) in the microstructure was found in quartzes Spain and Slovakia, and the lowest homogeneity in quartz Russia and quartzites Slovakia and Poland. All samples of quartzes and quartzites had grains bounded by discontinuities, except for quartz Spain and quartzite Ukraine. Quartzes Slovakia, Spain and Russia were characterized by fine isotropic structure with minimum (quartz Spain) or small occurrence (quartz Russia) of impurities at the grain boundaries.
Coarse isotropic structure with low impurities was observed in quartz Macedonia and quartzite Sweden, while more impurities were found in quartzite Ukraine. The latter also had a high content of Al2O3 impurities (this is in accordance with the chemical analysis), which formed continuous large chains inside the quartz grains. These chains were segregated into larger units and well defined. Quartzites Slovakia and Poland had coarse anisotropic structures, which were very irregular at the grain boundaries. Quartzite Slovakia mainly contained a complex of compounds K2O·Al2O3 as impurities (this is in accordance with the chemical analysis). Iron oxides were also found separately in several samples, with the highest concentrations in the quartzite Slovakia sample. From the point of view of the observed microstructure of the delivered samples, it is possible to predict more significant differences in determined reducibility of quartzes and quartzites. From a theoretical point of view, coarse anisotropic compounds are less liable to be reduced in thermal reactions than fine anisotropic and isotropic ones. The alkaline component K2O may, under certain conditions, act as a catalyst for the reduction reaction, unless the prior reduction of potassium occurs at lower temperatures (approx. 1200–1400 °C), turning it into gaseous (K(g)) [3]. The prevalence of the complex compound K2O·Al2O3 in the structure of the quartzite Slovakia means that, in this case, a positive effect of K2O on the SiO2 reduction process can be predicted.
3.3. High Temperature Stability Test
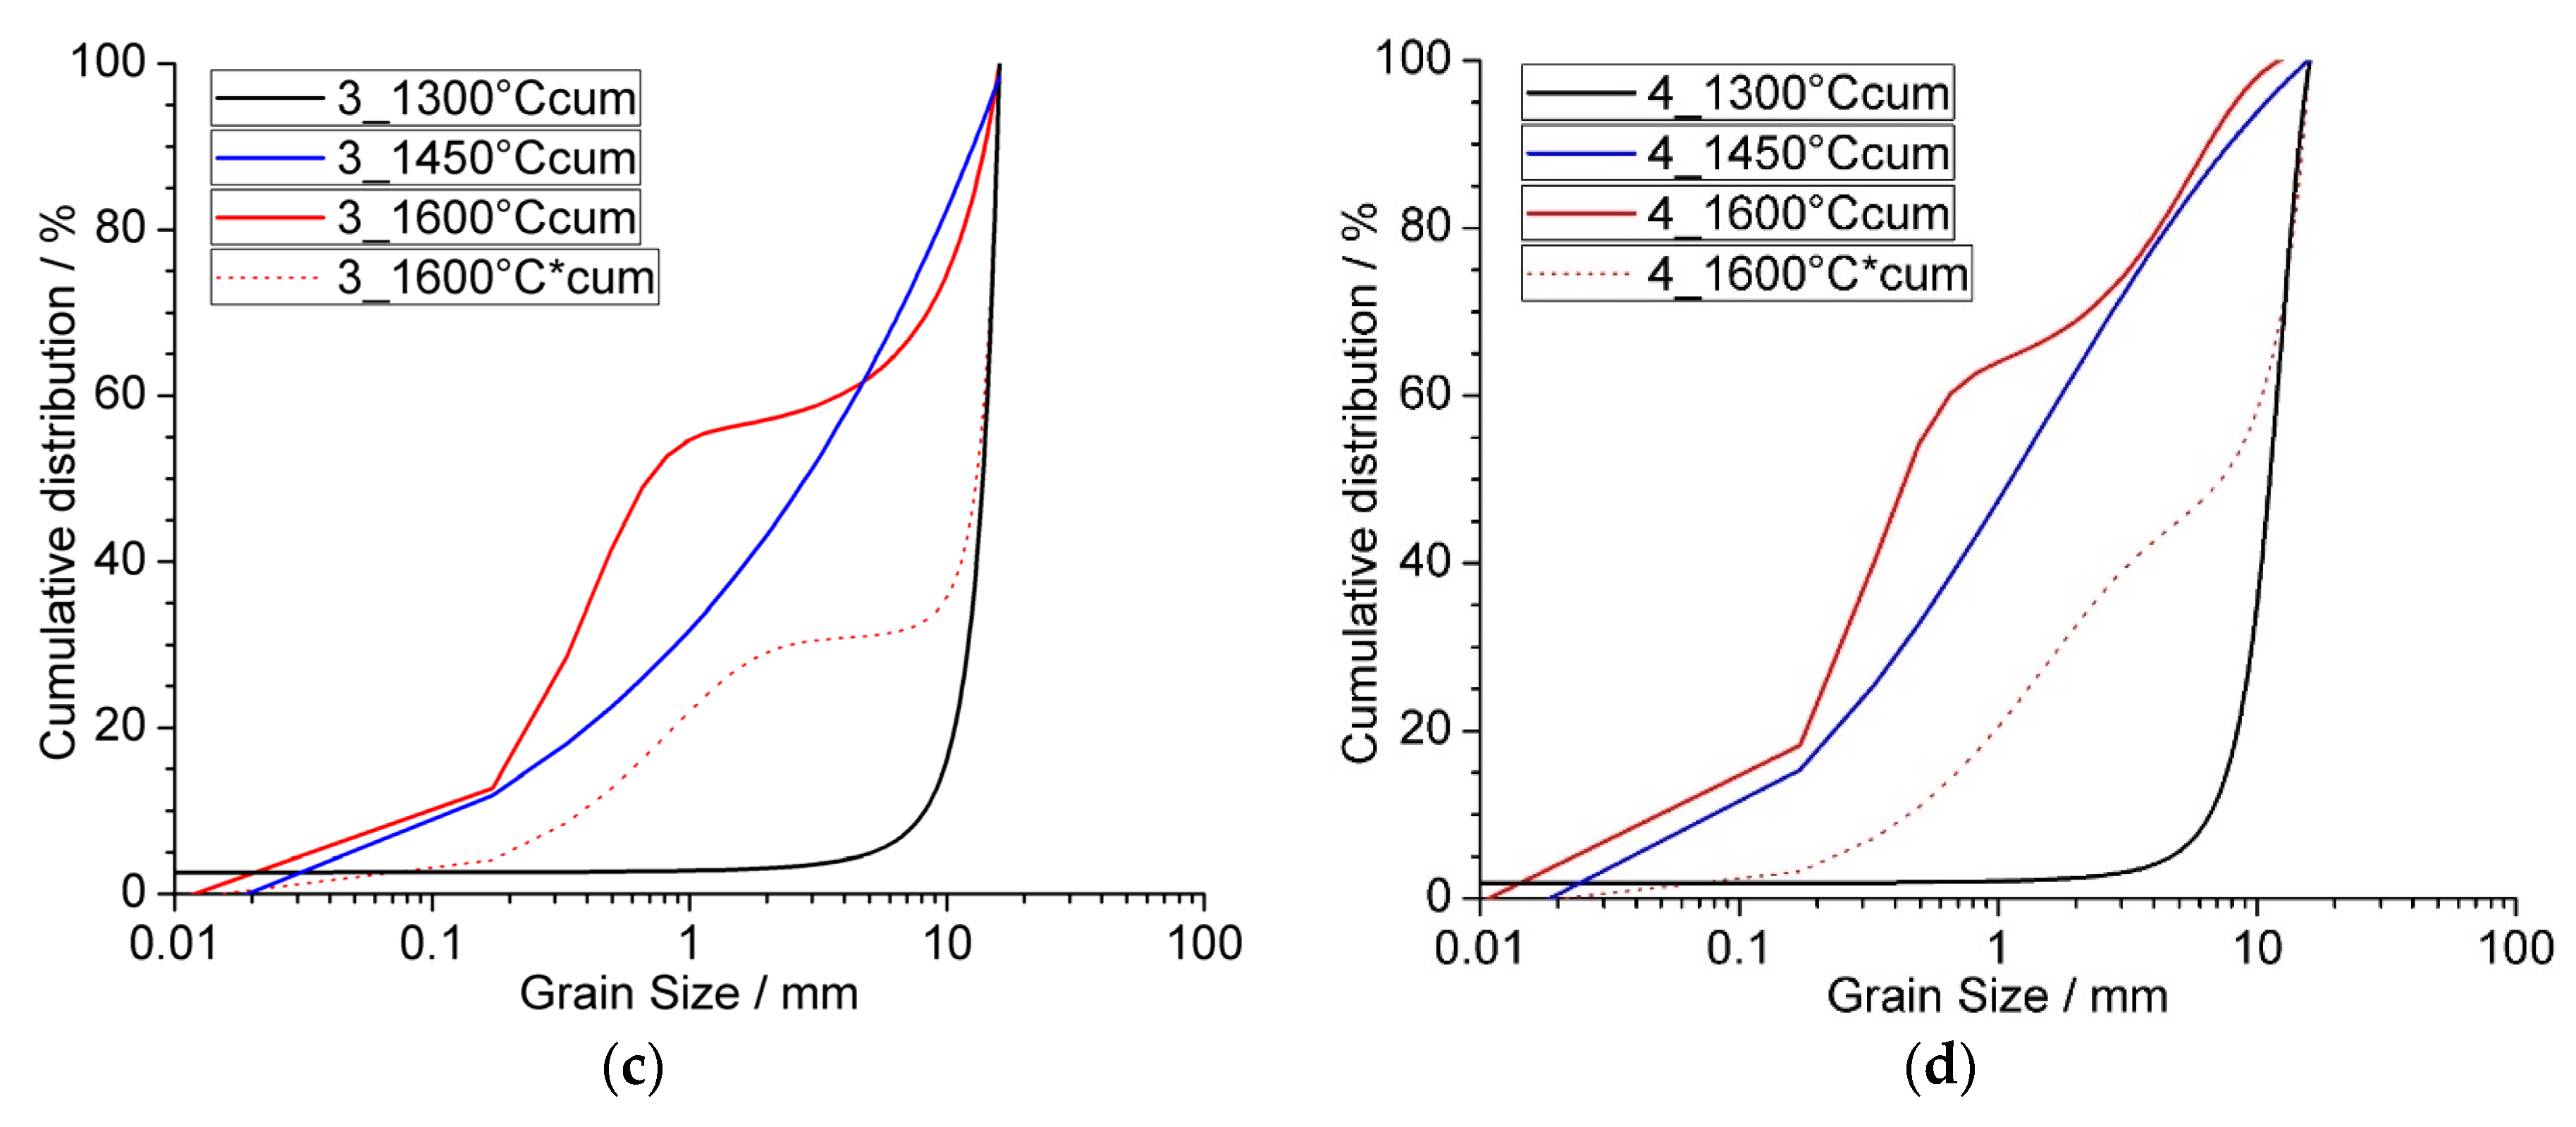
The thermal heating tests revealed, in the first approximation, differences in the stability of individual test samples. The prediction, based on the knowledge of the phase changes, is that crystal structure changed from trigonal in α-quartz to hexagonal in β-quartz. The α-quartz structure was interpreted as a distortion of the β-quartz structure. Furthermore, the transformations from β-quartz to tridymite or β-cristobalite took place at 870 and 1470 °C, respectively [2]. These aggregates were stable and did not show any macroscopic structural failure up to 750 °C [19]. Optical observation confirmed good stability of all samples at temperatures up to 1300 °C, where the influence of thermal stress in the oxidation atmosphere of the air did not degrade the grains, and the samples remained without significant disintegration (Figure 7 and Figure 8). At 1450 °C, there was more significant degradation of all quartzes. This temperature appears to be critical for these quartzes, at which their spontaneous disintegration related to phase transformation (β-quartz to β-cristoballite) occurs during heating and cooling of the main SiO2 component. The quartzite samples were relatively stable even at 1450 °C. The temperature of 1600 °C was critical not only for the quartzes, but also for quartzites Sweden and Poland. Minority components of present impurities also play a certain role in the degradation [20]. When assessing the disintegration, only TSI indexes were assigned due to the good thermal stability of samples up to 1450 °C. From the functional trend lines, a logical dependence of the decreases in the index on increases in temperature was noticeable, corresponding to the courses of the relevant granulometric curves. In the case of temperatures of 1300 and 1450 °C, the cumulative curves were composed after thermo-mechanical stressing, and, in the case of the highest temperature of 1600 °C, the cumulative curves were evaluated after thermal stress (before mechanical stressing in a drum–dashed red line) and after mechanical stressing (red line). The aim was to better understand the relationship between thermal and mechanical stress and to calculate HI (Formula (8)) and TSI (Formula (9)) indexes. The cumulative curves after thermo-mechanical stressing clearly show the differences in stability of the quartz samples (Figure 7). It turns out that quartzes not only have low high-temperature stability but also tend to undergo higher grain degradation due to mechanical activity (drum test). Quartzites Slovakia and Ukraine appeared to be stable in the whole assessed temperature range (1300–1600 °C) (Figure 8). These quartzites were also stable under subsequent mechanical action.
When comparing the changes in granulometry due to mechanical stress at 1600 °C, we noticed differences in the growth of fine-grained fractions in the samples. The calculated HI (Formula (8)) and TSI (Formula (9)) indexes confirmed this stability trend (Figure 9). Disintegration of the samples after thermo-mechanical stress was also reflected in a change in the average grain size. Granulometric analysis of quarzites (or quartzes) at 1300 °C and 1450 °C was conducted only after mechanical stressing. At 1600 °C temperature, granulometric analysis was carried out immediately after high-temperature testing and, subsequently, after mechanical stressing. The high temperature stability test showed that quartzites were generally more stable than quartzes due to the fact that they were more predisposed to phase conversion of β-quartz to β-cristobalite, which takes place at about 1.470 °C [2].
3.4. Thermodynamic Study of Reduction Reactions
For the basic chemical reactions (Table 2), standard Gibbs energy values were calculated. Thermodynamic data were obtained from the HSC Chemistry software (version 9, Outokumpu Research Oy, Pori, Finland). Using the HSC thermodynamic program, the Gibbs equilibrium diagrams for quartzite Slovakia reduction were calculated according to three models of reductant content (deficiency, stoichiometric amount, and excess). The following conclusions can be drawn from the thermodynamic analysis:
- ▪
- With a deficiency of reductant (20 kg C per 97 kg SiO2), approximately 23% of SiO2 will not be reduced.
- ▪
- With the stoichiometric amount of reducing agent (38 kg C per 97 kg SiO2), the total amount of SiO2 is reduced, with less than 5% residual carbon in the system (Figure 10).
- ▪
- With an excess of reductant (60 kg C per 97 kg SiO2), the total amount of SiO2 is reduced, with more than 10% carbon remaining in the system (Figure 11).
- ▪
- The primary product of the carbothermic reduction is silicon carbide (SiC), the maximum amount of which is reached at about 1600 °C.
- ▪
- The amount of silicon carbide at equilibrium increases with the amount of reductant.
- ▪
- By increasing the amount of reducing agent, the starting temperatures of SiC and Si formation are shifted to lower values.
- ▪
- The amount of Si(l) at the stoichiometric amount and in excess of the amount of reducing agent increases nearly linearly with temperature.
- ▪
- By increasing the amount of reducing agent, the production of SiO(g) is significantly reduced.
These thermodynamic calculations are valid for equilibrium conditions only. They also include the activities of impurity elements which were present in quartzite Slovakia–Fe, Al, Ca, K (or their oxidic compounds). Whether or not the reaction takes place, and whether it continues up to equilibrium state is determined by kinetic relations. Figure 10 and Figure 11 show the considered model cases.
3.5. High-Temperature Reducibility Test
The aim of the first experiments with carbothermic reduction of quartzes and quartzites was to establish and optimize a methodology for determination of the reducibility of silicon raw materials. Depending on the experimental conditions, the reduction reactions produced the following substances (Figure 12) (with XRF analyse):
- ▪
- Gray crystals—melted quartzite (or quartz) with partial reduction of SiO2 to Si;
- ▪
- Solidified melt—melted quartzite (or quartz) with partial reduction of SiO2 to Si;
- ▪
- Gray solid grains—SiC, which were not melted, so it is likely that, during the reduction, the formation of silicon carbide (SiC) with a high melting point (2830 °C) took place;
- ▪
- Gray-green grains—probably SiC, formed after the reaction of gaseous SiO(g) with charcoal when passing through the reducing agent layer;
- ▪
- Silver-gray metal—reduced silicon (over 95 wt% Si) with reduced impurities (mainly Fe and Al);
- ▪
- Black grains—unreacted charcoal.
There was strong correlation between weight loss and Si content in the samples after carbothermic reduction; greater weight loss was also reflected in increased Si content in the reduction reaction products. There was some relation between several other parameters: e.g., the increase in reduction temperature was reflected in higher Si content in the products, and the increase in reaction time was associated with higher Si content in the products.
From the point of view of comparison of the reducibility of the eight types of quartzes (or quartzites) after carbothermic reduction testing at 1750 °C (milled sample, segregated), the product parameters are listed in Table 5. This table gives the ranking of the quartzes (or quartzites) after the reduction test at 1750 °C.
Description of measured values in Table 5:
- ▪
- Content of SiTOT—analyzed by XRF spectrometry in the whole sample;
- ▪
- Content of SiC—analyzed gravimetrically, the carbon contained in SiC was determined by the method determining the total carbon after the flame annealing at 750 °C, then was calculated the content corresponding to SiC;
- ▪
- Content of CFREE—analyzed using IR absorption methodology.
The ranking of samples after reduction was implemented based on its own algorithm in a statistical program where three evaluation parameters (SiTOT, SiC and CFREE) were considered. The sample with the highest ranking had the highest content of SiTOT and SiC and the lowest CFREE content.
Due to the presence of quartzes or quartzites in lump form under EAF operating conditions, experiments were carried out on the granular burden, which more realistically simulates the conditions in the carbothermic furnace. From the point of view of comparison of the reducibility of the eight types of quartzes (or quartzites) after carbothermic reduction testing at 1800 °C (granular sample, homogenous), the product parameters are listed in Table 6. This table gives the ranking of the quartzes (or quartzites) after the reduction test at 1800 °C.
At carbothermal reduction of the samples in granular form, high-temperature disintegration was observed in some grains of quartzites Macedonia, Russia, Poland and partly Spain, which confirmed the results of the high-temperature stability testing. Another important phenomenon after the reduction was the presence of unreacted charcoal in some reduction reaction products. These were from quartzes Macedonia and Russia and quartzite Poland. In these samples, we also found the lowest weight losses and the lowest levels of SiTOT (Table 6). All reduction products of quartzes or quartzites are based on silicon carbide (SiC). The transformation of quartz (α-quartz→β-quartz→β-cristobalite) occurred up to about 1500 °C, then silicon carbide began to form. The mechanism of SiC formation varied for the individual samples, and during the carbothermic reduction it appeared as follows:
- A.
- transformation β-cristobalite→SiCsolid (Poland, Spain, Macedonia, Ukraine, Sweden);
- B.
- transformation β-cristobalite→SiO2liquid→SiCsolid (Slovakia, Russia).
For quartzes Slovakia and Spain, quartzites Sweden, Slovakia and Ukraine, a structure close to the tetragonal to cubic crystallographic system was observed, which is typical for silicon carbide produced by carbothermic reduction of silica [10]. The individual grains were well defined and had relatively constant interplanar distances that are characteristic for their size. In simple terms, in the reduction of quartzes Slovakia and Spain (as well as quartzites Sweden, Slovakia and Ukraine) silicon carbide-based products were obtained with microstructure advancing towards ideal silicon carbide crystals, and silicon carbide was the best reduced. In the case of silicon carbide created after the reduction of quartzite Ukraine (Table 7), particles of reduced aluminum were also present in the SiC structure, which was related to the highest Al2O3 content in quartzite Ukraine as compared to the other samples. In the structure of other samples from Poland, Macedonia (Table 8) and Russia, fewer transformed silicon carbide grains based on the hexagonal and trigonal crystallographic systems were observed, indicating the incompleteness (or deterioration) of the carbothermic reduction. These were mostly non-homogeneous SiC grains (in the case of quartzite Macedonia), among which unreacted charcoal was present, which confirmed the visual characteristics of the products after carbothermic reduction (Table 9).
Comparing the reducibilities of individual samples in granular state (lumpy ore simulation in EAF), quartzite Slovakia had higher reducibility than quartzes Spain and Russia and quartzite Poland (which were better reduced in the milled state). We noticed some association with the high-temperature disintegration of these raw materials, which became unstable at temperatures above 1450 °C and disintegrated.
3.6. Discussion
This study focused primarily on determining the reducibility of input silicon raw materials for FeSi (or silicon) production. The research also included the complex characteristics of quartzes and quartzites. Comparison of the physicochemical properties of the tested quartzes and quartzites revealed that quartzes Spain and Slovakia had the best quality. From the point of view of the resulting homogeneity, Slovakian quartzite and Macedonian quartz represented the highest risk in terms of efficient long-term processing, so it will be necessary to test these quartzite sources more frequently. Quartzite Slovakia and Poland had coarse anisotropic structures, while the other quartzes and quartzites had isotropic structures (fine and coarse). The research of high-temperature stability also involved mechanical stressing of the quartz and quartzite samples after thermal stressing. All quartzites (except Poland) had high thermal stability, but, on the other hand, all quartzes had worse thermal stability. Their spontaneous disintegration related to phase transformation occurred during heating and cooling of the main SiO2 component (Table 1).
For a realistic assessment of the reducibility of different types of quartzes and quartzites, it was necessary to establish a material balance of silicon after the reduction process. This means that, based on the knowledge of quantities and chemical analysis of inputs on the one hand and the actual products on the other, it was possible to obtain information on the distribution or behavior of silicon during carbothermic reduction. There appeared to be very close correlation between weight loss and SiTOT content in the reduction products, whereby greater weight loss was reflected in increased SiTOT content in the products of carbothermic reduction. In some studies, weight losses during carbothermic reduction were considered to be due to formation of a gaseous reduction product (CO(g)), and based on calculations of the amount of removed oxygen, researchers estimated the degree of reduction of the given quartz and quartzite [4,5,9,18]. In fact, as thermodynamic analyses have shown, there is another gaseous product of reduction besides carbon monoxide, which is SiO(g) [21]. In order to obtain a coherent model of the behavior of different types of quartzes and quartzites during carbothermic reduction, we subjected the reaction products to chemical analysis of SiC and free carbon content. Silicon carbide was the major chemical compound in the carbothermic reduction products in most experiments. Although reduced metallic silicon (up to 95% Si) also appeared among these products, the character of the experiments (temperature and reaction times) and, especially, the small sample amounts contributed to the fact that the main evaluated parameter, besides the total silica content (SiTOT), was the amount and structure of the reduced SiC. The aim of our carbothermal reduction experiments was to compare the reduction process on a homogeneous sample (milled state) and a granular sample (conservation of the original grains, as in a real EAF). The highest reducibility was achieved by quartz Slovakia and quartzites Sweden and Ukraine, which was valid for samples in milled and granular states. Differences in reducibility compared to the milled state appeared in some samples. Comparing the reducibility of individual samples in granular form (simulation of lumpy ore in EAF), quartzite Slovakia had higher reducibility than quartzes Spain and Russia. There was a certain association with the high-temperature disintegration of quartzes Spain, Macedonia and Russia, which became unstable at high temperatures (above 1450 °C) and disintegrated. On the other hand, quartzite Slovakia remained stable even at 1600 °C. The lowest reducibility in both cases was found in quartz Macedonia. By explaining the above-mentioned knowledge from the process of carbothermic reduction of quartzes and quartzites, it is, at the same time, possible to answer the question of reviewing the suitability of the analyzed raw materials for the production of ferrosilicon (or silicon) in terms of their reducibility. This means evaluating the reducibility based on the amount of reduced or volatilized silicon. Based on the results from our balance analysis, it is possible to state that the parameter which uniquely determines the relationship between the amount of volatilized SiO(g) and silicon metal (SiMET) produced is the thermal stability of silicon carbide (SiC). For this reason, the criterion of reducibility of quartzes and quartzites under the given laboratory conditions may be the amount of volatilized silicon (which is also associated with the weight loss).
Another parameter used to evaluate reducibility in this research was the microstructure of the products after carbothermic reduction. Quartzites (as well as quartzes), as a raw material for the production of silicon and different types of ferro-silicon, have a crystallographic system which is far from the ideal lattice of pure silica (trigonal system). This lattice may contain a variety of defects, it may vary with different distances of the planes, and there may be admixtures of elemental atoms [10]. Similarly, in the reduction process, these quartzes and quartzites may form qualitatively different carbides with different properties, i.e., carbides which may also be characterized with different thermal stability [4,10]. Since the ratio between silicon carbide and silicon metal is thermodynamically determined under given conditions, the residual portion of silicon then takes the form of gaseous monoxide (SiO(g)). To put it simply, the lower the carbide thermal stability, the smaller the amount of metallic silicon and the greater the amount of volatilized silicon (in the form of SiO(g)) will be in the equilibrium state. From the point of view of the efficiency of quartzes and quartzites as raw materials for silicon and ferrosilicon production, the preferred product is silicon carbide with its higher thermal stability. The most stable carbides with microstructure most closely approximating the ideal silicon carbide crystals (i.e., best reduced silicon carbide with grains arranged in a tetragonal to cubic crystallographic system) were evaluated after carbothermal reduction was produced by the quartzites Ukraine, Sweden and Slovakia and the quartzes Slovakia and Spain (Figure 13a–c). Figure 13d, for comparison, shows the microstructure of silicon carbide formed in the industrial EAF for the production of ferrosilicon at the Finnfjord plant [4,5]. Table 10 gives an overall comparison of all tested quartzes and quartzites, as well as correlation with the production of FeSi 75 in a ferroalloy plant. In this comparison, all properties which were assigned importance were considered. Evaluation and comparison of the operating parameters of FeSi 75 production shows that the best production parameters (i.e., highest yield and purity of products and lowest electricity consumption) are achieved using the best tested samples (quality class A). Comprehensive testing of quartzes and quartzites in laboratory conditions sufficiently predicts the priority of the commodities used, thus eliminating the risks associated with their operational testing in an industrial EAF.
4. Conclusions
This research has focused on the determination and comparison of high-temperature stability and reducibility of individual samples of quartz and quartzite. On the basis of the results and analyses, the following conclusions can be made from the complete problem solution:
- ▪
- Testing the suitability of quartzes and quartzites for the production of ferrosilicon (or silicon) only on the basis of their chemical composition is insufficient. These raw materials need to be regularly tested for their microstructure, high-temperature stability and reducibility.
- ▪
- From the point of view of chemical purity, quartzes Spain and Slovakia had the highest quality. These had isotropic structure, but they were unstable at high temperature and disintegrated at 1450 °C.
- ▪
- Quartzites Ukraine and Slovakia had coarse isotropic and anisotropic structures, which ensured their high thermal stability. These quartzites did not disintegrate during the phase changes of the quartz mineral modifications. Quartzites Ukraine and Slovakia remained stable and did not disintegrate after high-temperature testing at 1600 °C, and not even after mechanical stressing in the drum.
- ▪
- Comparison of the reducibility of the eight quartz and quartzite samples revealed that quartzites Sweden and Ukraine had the highest reducibility, and quartz Macedonia the lowest. This applied to both milled and granular forms (simulation of lumpy ore in EAF).
- ▪
- The results of our laboratory evaluation of the quality of quartzes and quartzites show high correlation with the results from production of FeSi 75 in a ferroalloy plant.
Author Contributions
J.L., R.F., B.B. and J.B. performed experimental analysis; J.L. carried out investigation, conceptualization, writing—original draft preparation, and writing—review and editing; R.F. carried out investigation and validation; B.B. performed high-temperature experiments, visualization, and project administration; J.B. carried out investigation and validation. All authors have read and agreed to the published version of the manuscript.
Funding
This research was funded by OFZ, a.s. Slovak Republic.
Data Availability Statement
Data are the exclusive right of OFZ, a.s. and are not listed in any publications or databases.
Conflicts of Interest
The authors declare no conflict of interest.
References
- Lin, M.; Pei, Z.; Lei, S. Mineralogy and Processing of Hydrothermal Vein Quartz from Hengche, Hubei Province (China). Minerals 2017, 7, 161. [Google Scholar] [CrossRef] [Green Version]
- Aasly, K. Properties and Behavior of Quartz for the Silicon Process. Ph.D. Thesis, Norwegian University of Science and Technology, Trondheim, Norway, August 2008. [Google Scholar]
- HSC Chemistry 9, Version 9; Thermodynamic Software for Process Simulation; Outokumpu Research Oy: Pori, Finland, 2018.
- Ringdalen, E.; Tangstad, M. Reaction Mechanisms in Carbothermic Production of Silicon, Study of Selected Reactions. In International Smelting Technology Symposium: Incorporating the 6th Advances in Sulfide Smelting Symposium; The Minerals, Metals & Materials Society (TMS): Pittsburgh, PA, USA, 2012; pp. 195–203. [Google Scholar] [CrossRef]
- Andersson, M. Reaction Mechanisms in the Ferrosilicon Production Process. Master’s Thesis, Lulea University of Technology, Luleå, Sweden, 2009. [Google Scholar]
- Tangstad, M.; Ksiazek, M.; Andersen, V.; Ringdalen, E. Small scale laboratory experiments simulating an industrial silicon furnace. In Proceedings of the Twelfth International Ferroalloys Congress, Sustainable Future, Helsinki, Finland, 6–9 June 2010; pp. 661–670. [Google Scholar]
- Schei, A.; Tuset, J.K.; Tveit, H. Production of High Silicon Alloys; Tapir Forlag: Trondheim, Norway, 1998. [Google Scholar]
- Tranell, G.; Andersson, M.; Ringdalen, E.; Ostrovski, O.; Stenmo, J.J. Reaction zones in a FeSi75 furnace—Results from an industrial excavation. INFACON 2010, 12, 709–715. [Google Scholar]
- Węgrzyn, J. Comparison of mass loss rate in reaction of silica with carbon from different investigation results. Metalurgija 2015, 54, 579–582. [Google Scholar]
- Tangstad, M. Chapter 6—Ferrosilicon and Silicon Technology. In Handbook of Ferroalloys: Theory and Technology; Elsevier S & T (USD): New York, NY, USA, 2013. [Google Scholar]
- Schei, A. Ferrosilisiumprosessens Metallurgi; Elkem Spigerverket a/s, R & D Center for A/S FESIL & CO: Norway, 1977. [Google Scholar]
- Malvik, T.; Lund, B. Problems involved with quartzite as a raw material for FeSi and Si metal production. Process Mineral. IX Miner. Met. Mater. Soc. 1990, 9, 499–508. [Google Scholar]
- Schneider, H.; Majdic, A.; Vasudevan, R. Kinetics of the quartz—Cristobalite transformation in refractory-grade silica materials. Mater. Sci. Forum 1986, 7, 91–102. [Google Scholar] [CrossRef]
- Videm, T. Reaction rate of reduction materials for the (Ferro) Silicon process. In Proceedings of the INFACON 7, International Ferroalloys Congress, Trondheim, Norway, 11–14 June 1995; pp. 221–230. [Google Scholar]
- Myrvagnes, V. Analyses and Characterization of Fossil Carbonaceous Material for Silicon Production. Ph.D. Thesis, Norwegian University of Science and Technology, Trondheim, Norway, 2008. [Google Scholar]
- Mekhtiev, A.D.; Tolymbekov, M.J.; Kim, A.V.; Zholdubaeva, Z.D.; Issin, D.K.; Issagulov, A.Z.; Issin, B.D. Silicon production using long flaming coal and improvement of its quality indicators. Metalurgija 2014, 53, 563–566. [Google Scholar]
- Li, X.; Zhang, G.; Tronstad, R.; Ostrovski, O. Reduction of quartz to silicon monoxide by methanehydrogenmixtures. Metall. Mater. Trans. B Process Metall. Mater. Process. Sci. 2016, 478, 2197–2204. [Google Scholar] [CrossRef] [Green Version]
- Bao, S.; Tangstad, M.; Tang, K.; Ringdalen, E. Production of SiO gas in the silicon process. In Proceedings of the Thirteenth International Ferroalloys Congress, Almaty, Kazakhstan, 9–13 June 2013; pp. 273–282. [Google Scholar]
- Niry, R.; Beaucour, A.-L.; Hebert, R.; Noumowé, A.; Ledésert, B.; Bodet, R. Thermal stability of different siliceous and calcareous aggregates subjected to high temperature. RMATEC Web Conf. 2013, 6, 07001. [Google Scholar] [CrossRef]
- Knipe, R.J. Distribution of impurities in deformed quartz and its implications for deformation studies. Tectonophysics 1980, 64, T11–T18. [Google Scholar] [CrossRef]
- Vangskasen, J.; Tangstad, M. Condensate in the metallurgical silicon process reaction mechanisms. In Proceedings of the Thirteenth International Ferroalloys Congress Efficient Technologies in Ferroalloy Industry, Almaty, Kazakhstan, 9–13 June 2013. [Google Scholar]
Figure 1.
Ilustration of carbothermic reduction of SiO2 in EAF (created by authors according to [4,5,6]).

Figure 2.
Methods for the evaluation of quartzes or quartzites.

Figure 3.
Illustration of samples for experimental study. Legend to Figure 3: quartz Slovakia = Švedlár, quartz Spain = Erimsa, quartz Russia = Tačalin, quartz Macedonia = Stepanci, quartzite Slovakia = Krnča, quartzite Sweden = Dalbo, quartzite Poland = Bukowá Góra, quartzite Ukraine = Ovruč.
Figure 3.
Illustration of samples for experimental study. Legend to Figure 3: quartz Slovakia = Švedlár, quartz Spain = Erimsa, quartz Russia = Tačalin, quartz Macedonia = Stepanci, quartzite Slovakia = Krnča, quartzite Sweden = Dalbo, quartzite Poland = Bukowá Góra, quartzite Ukraine = Ovruč.

Figure 4.
High-temperature stability test overview.

Figure 5.
High temperature reducibility test overview.

Figure 6.
Microstructures of quartzes and quartzites.

Figure 7.
Cumulative curves after thermal and mechanical stressing of quartzes. (a) Quartz Slovakia; (b) quartz Spain; (c) quartz Russia; (d) quartz Macedonia.
Figure 7.
Cumulative curves after thermal and mechanical stressing of quartzes. (a) Quartz Slovakia; (b) quartz Spain; (c) quartz Russia; (d) quartz Macedonia.


Figure 8.
Cumulative curves after thermal and mechanical stressing of quartzites. (a) Quartzite Slovakia; (b) quartzite Sweden; (c) quartzite Poland; (d) quartzite Ukraine.
Figure 8.
Cumulative curves after thermal and mechanical stressing of quartzites. (a) Quartzite Slovakia; (b) quartzite Sweden; (c) quartzite Poland; (d) quartzite Ukraine.

Figure 9.
Calculated indexes HI (a) and TSI (b) for samples at 1600 °C.

Figure 10.
Gibbs equilibrium diagram of carbothermic reduction of quartzite Slovakia at the stoichiometric amount of reductant.
Figure 10.
Gibbs equilibrium diagram of carbothermic reduction of quartzite Slovakia at the stoichiometric amount of reductant.

Figure 11.
Gibbs equilibrium diagram of carbothermic reduction of quartzite Slovakia with an excess of reductant.
Figure 11.
Gibbs equilibrium diagram of carbothermic reduction of quartzite Slovakia with an excess of reductant.

Figure 12.
Schematic illustration of products after reduction of quartzite Slovakia.

Figure 13.
Microstructure comparison of silicon carbide formed in the tests: quartzite Ukraine (a), quarzite Slovakia (b), quartz Spain (c), and in the industrial EAF [5] (d).
Figure 13.
Microstructure comparison of silicon carbide formed in the tests: quartzite Ukraine (a), quarzite Slovakia (b), quartz Spain (c), and in the industrial EAF [5] (d).


| Type of Transformation | Phase Transformations | |
|---|---|---|
| Temperature (°C) | Heat (J/mol) | |
| α-quartz→β-quartz | 575 | 879 |
| β-quartz→β-cristobalite | 1470 | 6154 |
| β-cristobalite→SiO2liquid | 1710 | 8792 |
| Sisolid→Siliquid | 1414 | 39,649 |
| Possible Reactions in Reaction Zone | SiO2(Q) + 2C = Si(l) + 2CO(g) ∆H1700°C = 708.14 kJ/mol | (1) |
| SiO2(l) + Si(l) = 2SiO(g) ∆H1800°C = 598.32 kJ/mol | (2) | |
| SiO(g) + 2C = SiC(s) + CO(g) ∆H1000°C = −75.64 kJ/mol | (3) | |
| 2SiO(g) = SiO2(s, l) + Si(l) ∆H1800°C = −598.32 kJ/mol | (4) | |
| SiO2 + 3C = SiC + 2CO(g) ∆H1500°C = 589.93 kJ/mol | (5) | |
| SiO(g) + SiC(s) = 2Si(l) + CO(g) ∆H2000°C = 171.33 kJ/mol | (6) | |
| 2SiO2(l) + SiC(s) = 3SiO(g) + CO(g) ∆H1900°C = 1360.55 kJ/mol | (7) | |
| Amount of Carbon for Reduction | 40% per 100% of pure SiO2 (i.e., 40 kg per 100 kg pure SiO2) in real conditions about 50 kg per 100 kg of quartz | |
| Products of Carbothermal Reduction | SiO2–unreacted in liquid and solid state Si—in liquid state SiC—in solid state SiO(g)—escapes in gaseous form | |
| Melting Temperatures | SiO2 (pure state) = 1720 °C real quartzes = 1680–1750 °C real quartzites = 1630–1700 °C Si (pure state) = 1414 °C SiC (pure state) = 2813 °C |
| Method | Sample | Conditions | Evaluation | Reference |
|---|---|---|---|---|
| ELKEM (Norway) | pellets quartz + SiC + coke | 1690 °C 87 min | reactivity of the reductants | [14] |
| NTNU (Norway) | pressed tablet quartz + SiC | 1800–2000 °C 100 min | structure of product | [15] |
| Mekhtiev (Russia) | original quartz + coke | 1600 °C 60 min | purity of silicon | [16] |
| Wollongong (Australia) | milled quartz + CH4 + H2 | 1350–1500 °C 120 min | kinetics of reactions | [17] |
| SINTEF (Norway) | briquettes SiO2 + SiC | 1550–1820 °C 60–120 min | TGA analysis, amount of SiO(g) | [18] |
| Tangstad (Norway) | pellets quartz + carbon | 1700 °C 60 min | amount of SiC | [10] |
Table 4.
Average chemical composition of tested samples determined by XRF.
| No. | Sample | SiO2 | FeTOT | CaO | Al2O3 | K2O | TiO2 | P | Cl | S |
|---|---|---|---|---|---|---|---|---|---|---|
| (wt%) | ||||||||||
| 1 | quartz Slovakia | 99.254 | 0.263 | 0.120 | 0.174 | 0.005 | 0.007 | 0.005 | 0.015 | 0.015 |
| 2 | quartz Spain | 99.324 | 0.240 | 0.024 | 0.121 | 0.005 | 0.005 | 0.011 | 0.008 | 0.011 |
| 3 | quartz Russia | 99.129 | 0.217 | 0.052 | 0.234 | 0.021 | 0.028 | 0.003 | 0.012 | 0.009 |
| 4 | quartz Macedonia | 99.219 | 0.349 | 0.068 | 0.135 | 0.004 | 0.019 | 0.009 | 0.009 | 0.013 |
| 5 | quartzite Slovakia | 97.180 | 0.621 | 0.082 | 1.254 | 0.364 | 0.045 | 0.017 | 0.018 | 0.079 |
| 6 | quartzite Sweden | 98.612 | 0.281 | 0.060 | 0.721 | 0.211 | 0.007 | 0.005 | 0.021 | 0.013 |
| 7 | quartzite Poland | 98.121 | 0.383 | 0.055 | 0.427 | 0.035 | 0.051 | 0.012 | 0.018 | 0.025 |
| 8 | quartzite Ukraine | 97.041 | 0.572 | 0.068 | 1.410 | 0.018 | 0.049 | 0.015 | 0.015 | 0.033 |
Table 5.
Product parameters after carbothermic reduction test at 1750 °C, 15 min (milled sample, segregated).
Table 5.
Product parameters after carbothermic reduction test at 1750 °C, 15 min (milled sample, segregated).
| No. | Sample | Δm (%) | SiTOTAL (wt%) | SiC (wt%) | CFREE (wt%) | Ranking after Reduction |
|---|---|---|---|---|---|---|
| 1 | quartz Slovakia | 68.13 | 78.54 | 67.74 | 12.99 | 1 |
| 2 | quartz Spain | 58.75 | 69.91 | 54.64 | 18.42 | 4 |
| 3 | quartz Russia | 59.91 | 64.77 | 50.71 | 19.82 | 7 |
| 4 | quartz Macedonia | 51.25 | 56.57 | 35.05 | 31.44 | 8 |
| 5 | quartzite Slovakia | 58.44 | 65.42 | 52.10 | 18.75 | 6 |
| 6 | quartzite Sweden | 65.31 | 75.47 | 63.51 | 14.05 | 2 |
| 7 | quartzite Poland | 58.07 | 67.17 | 52.76 | 19.09 | 5 |
| 8 | quartzite Ukraine | 65.12 | 71.55 | 63.47 | 15.61 | 3 |
Table 6.
Product parameters after carbothermic reduction test at 1800 °C, 15 min (granular sample).
| No. | Sample | Δm (%) | SiTOTAL (wt%) | SiC (wt%) | CFREE (wt%) | Ranking after Reduction |
|---|---|---|---|---|---|---|
| 1 | quartz Slovakia | 66.67 | 76.07 | 64.36 | 14.55 | 3 |
| 2 | quartz Spain | 65.34 | 71.91 | 58.32 | 19.07 | 5 |
| 3 | quartz Russia | 58.99 | 68.05 | 50.01 | 23.54 | 6 |
| 4 | quartz Macedonia | 50.19 | 59.49 | 39.47 | 26.73 | 8 |
| 5 | quartzite Slovakia | 69.06 | 73.66 | 60.27 | 17.18 | 4 |
| 6 | quartzite Sweden | 67.21 | 78.15 | 66.12 | 13.12 | 1 |
| 7 | quartzite Poland | 55.85 | 67.83 | 50.34 | 21.99 | 7 |
| 8 | quartzite Ukraine | 67.29 | 75.23 | 65.91 | 13.45 | 2 |
Table 7.
Microscopic analysis of product (Silicon Carbide–SiC) after carbothermic reduction of quartzite Ukraine at 1800 °C.
Table 7.
Microscopic analysis of product (Silicon Carbide–SiC) after carbothermic reduction of quartzite Ukraine at 1800 °C.
| Position of analysis |  |  | ||
| Maps of elements |  |  | ||
Table 8.
Microscopic analysis of product (Silicon Carbide—SiC) after carbothermic reduction of quartz Macedonia at 1800 °C.
Table 8.
Microscopic analysis of product (Silicon Carbide—SiC) after carbothermic reduction of quartz Macedonia at 1800 °C.
| Position of analysis |  |  | ||
| Maps of elements |  |  | ||
Table 9.
Microscopic analysis of product (unreacted charcoal) after carbothermic reduction of quartz Macedonia at 1800 °C.
Table 9.
Microscopic analysis of product (unreacted charcoal) after carbothermic reduction of quartz Macedonia at 1800 °C.
| Position of analysis |  |  | ||
| Maps of elements |  |  |  | |
Table 10.
Ranking of quartz and quartzite samples in comprehensive evaluation (according to Figure 2).
Table 10.
Ranking of quartz and quartzite samples in comprehensive evaluation (according to Figure 2).
| Laboratory Testing. | Plant Production (FeSi 75) | ||||
|---|---|---|---|---|---|
| Rank | Sample | Photo | Quality | Yield (%) | Energy (kWh/t FeSi 75) |
| 1. | quartzite Sweden |  | A | 91–93 | 8700–9100 |
| 2. | quartzite Ukraine |  | |||
| 3. | quartz Slovakia |  | |||
| 4. | quartz Spain |  | B | 87–90 | 9300–9800 |
| 5. | quartzite Slovakia |  | |||
| 6. | quartz Russia |  | |||
| 7. | quartzite Poland |  | C | 80–85 | 10,100–10,500 |
| 8. | quartz Macedonia |  | |||
Publisher’s Note: MDPI stays neutral with regard to jurisdictional claims in published maps and institutional affiliations. |
© 2021 by the authors. Licensee MDPI, Basel, Switzerland. This article is an open access article distributed under the terms and conditions of the Creative Commons Attribution (CC BY) license (https://creativecommons.org/licenses/by/4.0/).
Share and Cite
MDPI and ACS Style
Legemza, J.; Findorák, R.; Buľko, B.; Briančin, J. New Approach in Research of Quartzes and Quartzites for Ferroalloys and Silicon Production. Metals 2021, 11, 670. https://doi.org/10.3390/met11040670
AMA Style
Legemza J, Findorák R, Buľko B, Briančin J. New Approach in Research of Quartzes and Quartzites for Ferroalloys and Silicon Production. Metals. 2021; 11(4):670. https://doi.org/10.3390/met11040670
Chicago/Turabian StyleLegemza, Jaroslav, Róbert Findorák, Branislav Buľko, and Jaroslav Briančin. 2021. "New Approach in Research of Quartzes and Quartzites for Ferroalloys and Silicon Production" Metals 11, no. 4: 670. https://doi.org/10.3390/met11040670
Note that from the first issue of 2016, this journal uses article numbers instead of page numbers. See further details here.