
The Influence of Initial Purity Level on the Refining Efficiency of Aluminum via Zone Refining


1
State Key Laboratory of Advanced Special Steel, School of Materials Science and Engineering, Shanghai University, Shanghai 200444, China
2
IME Process Metallurgy and Metal Recycling, RWTH Aachen University, 52056 Aachen, Germany
*
Author to whom correspondence should be addressed.
†
These authors contributed equally to this work.
Metals 2021, 11(2), 201; https://doi.org/10.3390/met11020201
Submission received: 7 December 2020
/
Revised: 17 January 2021
/
Accepted: 18 January 2021
/
Published: 22 January 2021
(This article belongs to the Special Issue 10th Anniversary of Metals: Metallurgy and Metal Technology)
Abstract
:Zone refining is a well-known technique, usually using pure initial materials to produce high purity metals. However, the effectiveness of zone refining in the purification of different purity levels of metals as well as its feasibility for use as a recycling technique for low quality metals are rarely investigated. In this work, conducted at IME/RWTH Aachen University, three kinds of Al with different purities, i.e., three-layer electrolysis (4N), commercial pure (2N8) and recycled Al (1N7), were put on focus to address the above-mentioned issue. The experiments were conducted with an optimized zone length combination at the moving rate of 1.2 mm/min for five zone passes. The results showed that the 4N pure initial Al was improved to 5N5 after five passes, much higher than the results for commercial pure- or recycled Al, where less than 50% reduction of total impurities was achieved.
1. Introduction
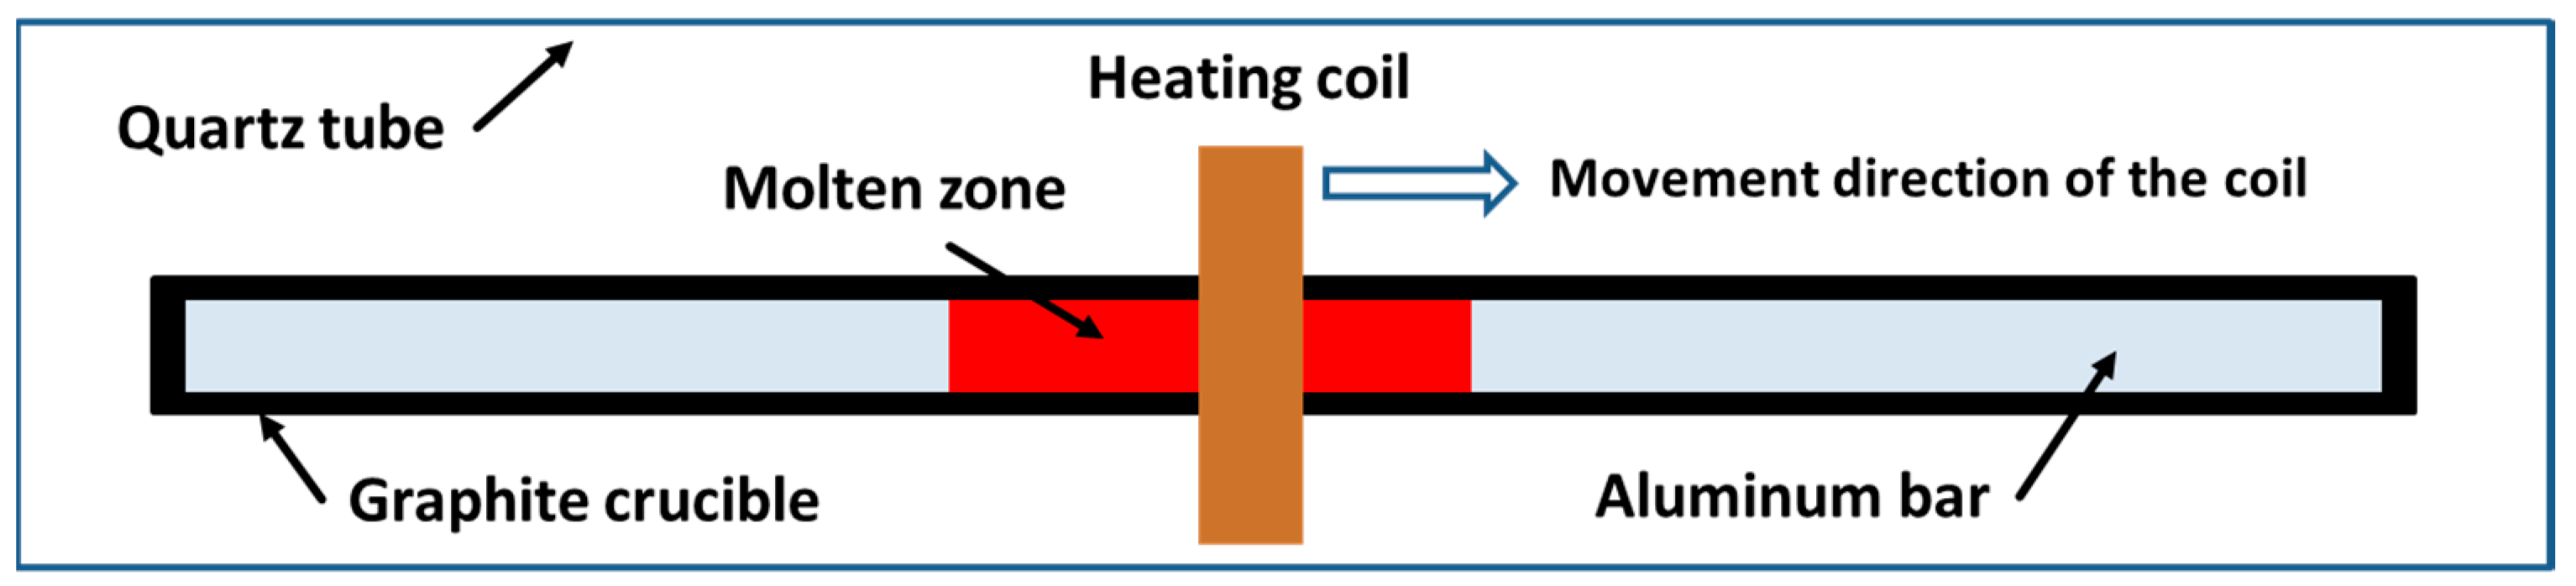
Zone refining is an effective methodology to produce high purity metals, which enables the distribution of impurities based on the principle of crystallization. As shown in Figure 1, it works by repeatedly moving one or a series of molten zones very slowly along a solid bar. Similar to other crystallization technologies, this process can be applied to refine any metals in which the distribution coefficients (k, the ratio of the concentration of an impurity in the solid phase to that in the liquid phase) of the impurities are smaller or bigger than unity. The bigger the difference from the unity k is, the higher the tendency of the impurities is to separate from the base metal. For example, the impurities of Fe, Cu, Ni, Ca, Ga, Ti, Si, Sb and Na in aluminum can be easily removed according to the values of their distribution coefficients in Table 1.
Zone refining has been applied for the production of highly pure metals such as from gallium [3], aluminum [4], up to tellurium [5], cadmium [6] and germanium [7] since the early 1950s [8]. A rule is that a high initial purity of the materials is already demanded. On one hand, the refining efficiency of one impurity usually increases with decreasing concentration [1,9]; on the other hand, purer raw materials lead to higher productivity and purity, which possess higher additional value and enable offsetting the drawbacks of the low production and high time-consumption. The commonly applied initial purity differs depending on type of metals treated and depends on the targeted final purity, as seen in Table 2. Lower purity metals such as commercial pure metals (cp) or secondary (recycled) metals are rarely purified by zone refining. However, it deserves a substantial attention nowadays under the circular economy targets. Therefore, a guideline towards the feasibility of zone refining is needed to purify the increasing volumes of secondary metals. In this paper, aluminum is closely brought into consideration to develop a rational initial purity selection methodology based on the targeted purity for the future production process. The increasing application of high purity aluminum in high-tech areas, such as semiconductor, super conductor and capacitor foil, as well as the huge generation of Al waste, will lead to significantly varying purity levels. Additionally, this work explores the possibility of the removal of Fe from secondary Al through zone refining, as there is no effective method up to now for Fe removal from this Al-quality industrially.
2. Experiments
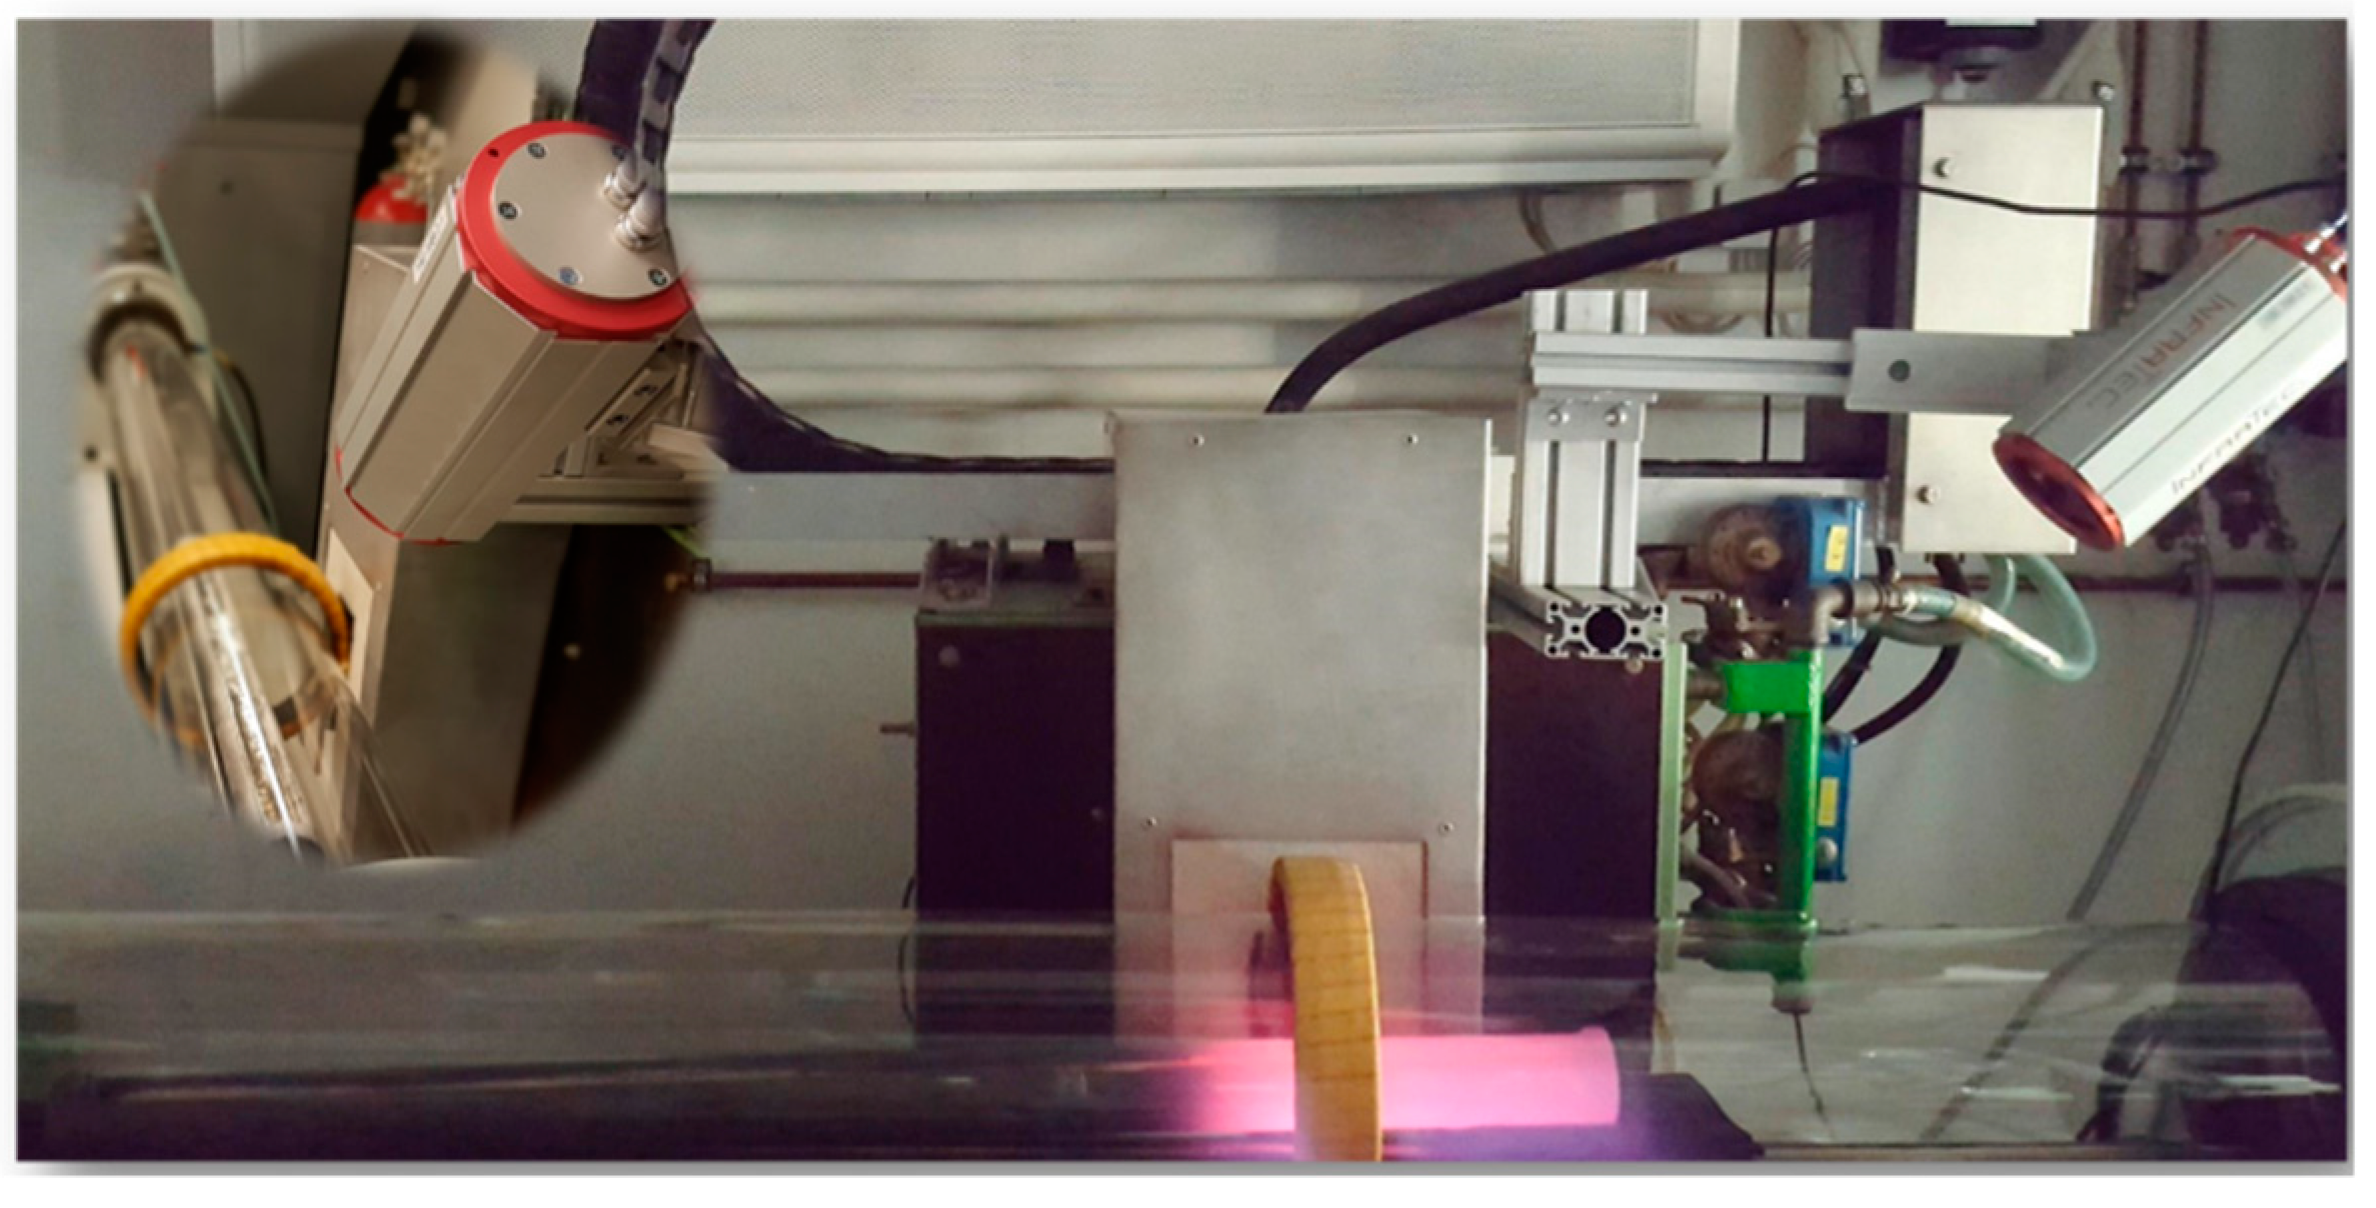
The zone refining apparatus at IME/RWTH Aachen University with an inductive heater and an infrared camera (details presented in [16]) was utilized in this work, as shown in Figure 2. It is capable of generating up to 45 kW with a maximum frequency of 10 kHz. One-meter-long graphite crucible (ash content <200 ppm) was used simultaneously as the susceptor due to the weak inductive coupling between Al and the electromagnetic field. Three different purity-levels of aluminum, the product after three-layer electrolysis (4N), commercial pure (2N8) as well as a self-made secondary Al (1N7, from recycling of UBCs via salt bath smelting) were used as the starting point in this study, whose main compositions are presented in Table 3.
The feasibility of the zone length during the zone refining process has often been investigated, e.g., [10,17,18,19,20,21]. The latest result about the theoretical optimum zone length combination [10] based on the so called Spim model [17] was applied also in the present study. However, the real zone lengths deviated from the expected values, due to the limitation of the conditions of the used apparatus, by which the zone length is controlled by the inductive power and natural cooling. Table 4 shows the difference between the theoretical (calculated) and real (measured) zone lengths. The equipped single inductive heater could not realize the whole Al-bar in molten state, which was desired in the first pass based on the theoretical zone lengths scheme. Instead, the maximum of zone length achievable was around 35 cm (0.35 L, L represents the real length of the Al bar used in this work, 100 cm). Moreover, the zone length frequently varied even under the stable heater power and a constant heater movement velocity due to the high thermal conductive charge and crucible, leading the frequent failure of heat balance at the solid/liquid interface [6]. Therefore, a frequent adjustment of the power had to be carried out manually, according to the real zone length detected by an Infrared camera [16,22]. This allowed for a comparatively stable zone length as the heater moved. Nevertheless, the real zone length still varied to an extent of >20%, as seen in Table 4. A heater moving velocity of 1.2 mm/min was adopted in this study in view of the balance of high refining efficiency and low time-consumption in one single pass. A small tilting angle of 3–5° calculated based on the empirical equation [19] was set to suppress the commonly appeared mass transfer phenomenon during zone refining. Five passes were executed on each sample. The specimens of commercial pure and recycled Al bars after zone refining were taken every 10 cm (10% of total length) starting 2 cm from front edge after 1st, 3rd and 5th zone passes and were analyzed by ICP-OES. For the already 4N-pure Al, the impurity concentration after each zone pass was not determined by ICP-OES (detection limit of 10 ppm). Instead, only the bar after the fifth zone pass was analyzed by Glow Discharge Mass Spectrometry (GDMS), due to its higher precision and lower detection limit.
3. Results and Discussion
3.1. Refining Efficiency of 4N Pure Al
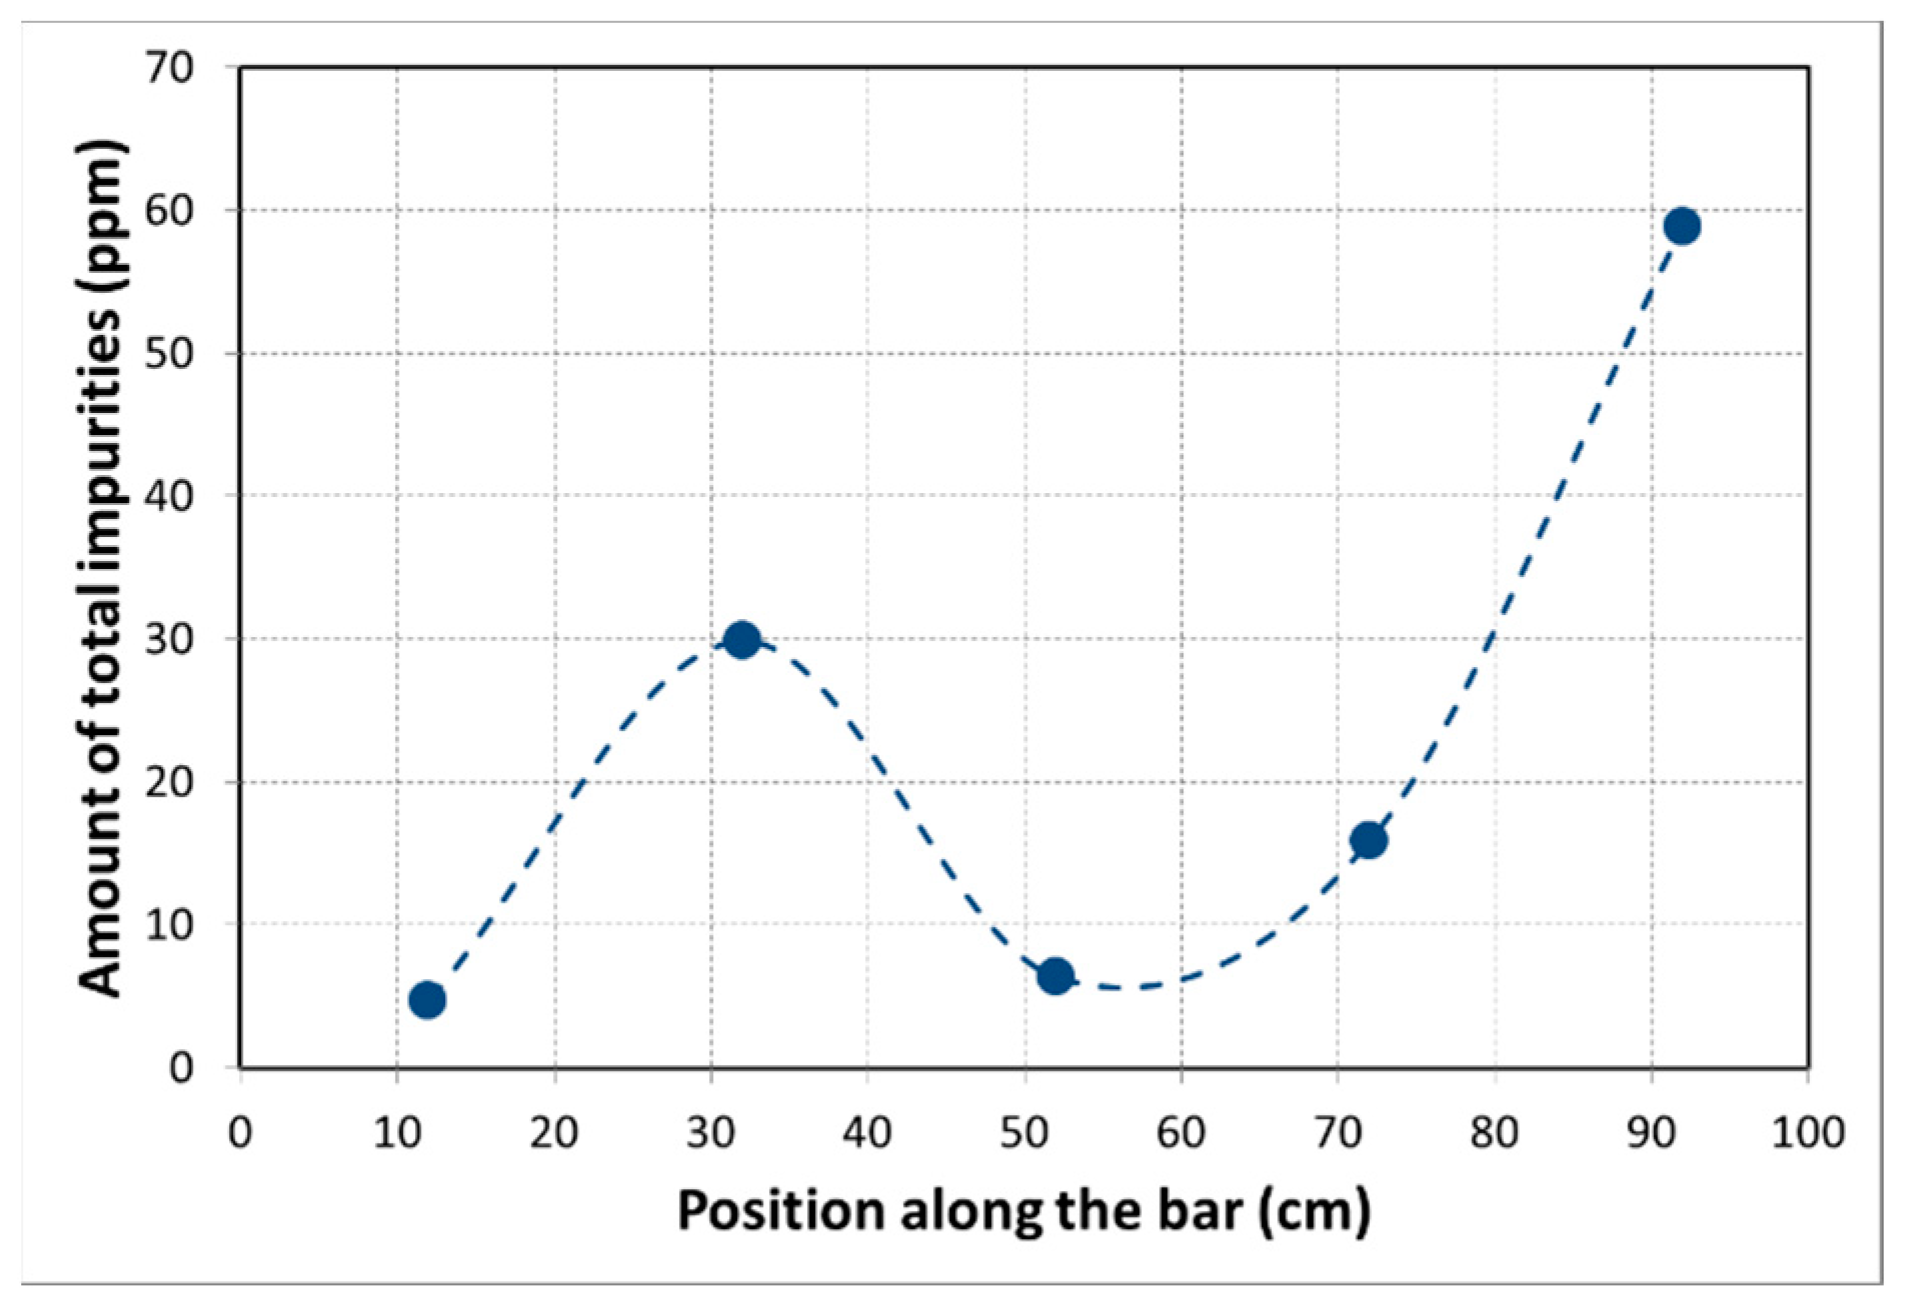
The impurity concentrations along the bar after five passes are presented in Table 5. It shows that a purity of 5N5 could be achieved after five passes, manifesting the effectiveness of zone refining deployed to purify the 4N pure Al. Most of the impurities except for Na, Ti, Sn and Zn were significantly moved from the beginning to the end of the bar, resulting in a higher purity of Al at the beginning of the bar. The purity of Al in the impurity-enriched end (4N4) is strangely even higher than the initial purity of 4N (analyzed by spark spectrometer), which might be due to the difference of precision between these two analysis methods or the evaporation of some impurities with low vapor pressure, such as Na, Zn, P. The significant purification effect can be shown anyway by the clear impurity concentration gradients of the bar after refinement, as presented in Figure 3. The peak of the impurity level at 32 cm can be contributed to the high crystallization rate at this moment (this unstable crystallization effect was already addressed above).
3.2. Refining Efficiency of 2N8 Pure Al
The average concentrations of impurities in the first half of the bar after each pass are presented in Table 6 (more detail of impurity concentration distribution after each pass can be seen in the Appendix A—Table A1). It shows that Si was significantly removed from the first half of the bar, while the reduction of Fe and Ni is lower. On the contrary, Ti and V were accumulated there due to their large distribution coefficients (see Table 1). The removal of Ga showed the biggest challenge amongst the whole impurities, only 26% removed after fifth pass, opposite to expectation due to the low value of k. In general, the reduction percentages of total impurities in the first half of the bar were 11%, 21% as well as 39% after 1st, 3rd and 5th zone passes respectively. Such levels of reduction are not sufficient enough in view of the cost of zone refining. Although the impurity concentrations in the cleanest parts (usually at the beginning of the bar) after each zone pass are much lower than the average in the first half of the bar, as seen in Table 7, the conclusion is the same in a general view.
3.3. Refining Efficiency of Recycled Al (1N7)
The elements Mn and Mg represent the highest content as impurities in the recycled UBCs. The low reduction of these two elements–only 31% and 46% reduced after five passes–has limited the final purification effect, as seen in Table 8 and Table 9. Low removing efficiency (≤50% after five passes) was observed also for Si, Fe and Cu. Cr and Ti moved in the opposite direction to the heater because of their k higher than one. The average concentration of Ga in the first half of the bar and its concentration in the purest part are both unexpectedly higher than the initial concentration considering its k smaller than one. However, the decreasing tendency of its concentrations after each pass can demonstrate the removal effect it should have revealed after the first pass. The results also show that the existence of Ti, Cr and Ga would be detrimental when using zone refining to clean recycling-pure aluminum. More data on impurity concentration distribution after each pass for zone refining of recycled Al can be seen in the Appendix A—Table A2.
As presented in Table 8 and Table 9, the reduction percentage of the total impurities in the first half of the bar as well as in the purest part of the bar stepwise but slightly increases when the number of passes increases. However, only 40% and 47% of all impurities were removed in the first half of the bar and in the purest part of the bar respectively after five passes. This result implies a low economic situation to purify such recycling-level purity of Al with the purpose to produce significantly higher purity levels of the metal, using zone refining process. It proves however to be effective, if the target is just to reduce partly some certain impurities or some amounts of total impurities of the recycled aluminum. For example, Fe is the most troublesome impurity for the application of the secondary Al. The only way to reduce the amount of Fe to an accepted level in the industry is to dilute secondary Al in a raw pure Al, as there is no appropriate method to effectively remove Fe. However, zone refining showed a good separation effect for Fe, i.e., almost one fourth and half of Fe in the first half of the bar were separated after first and fifth pass respectively, as seen in Table 8.
3.4. Comparison of Refining Efficiency among Zone Refining of Different Initial Purity-Levels of Al
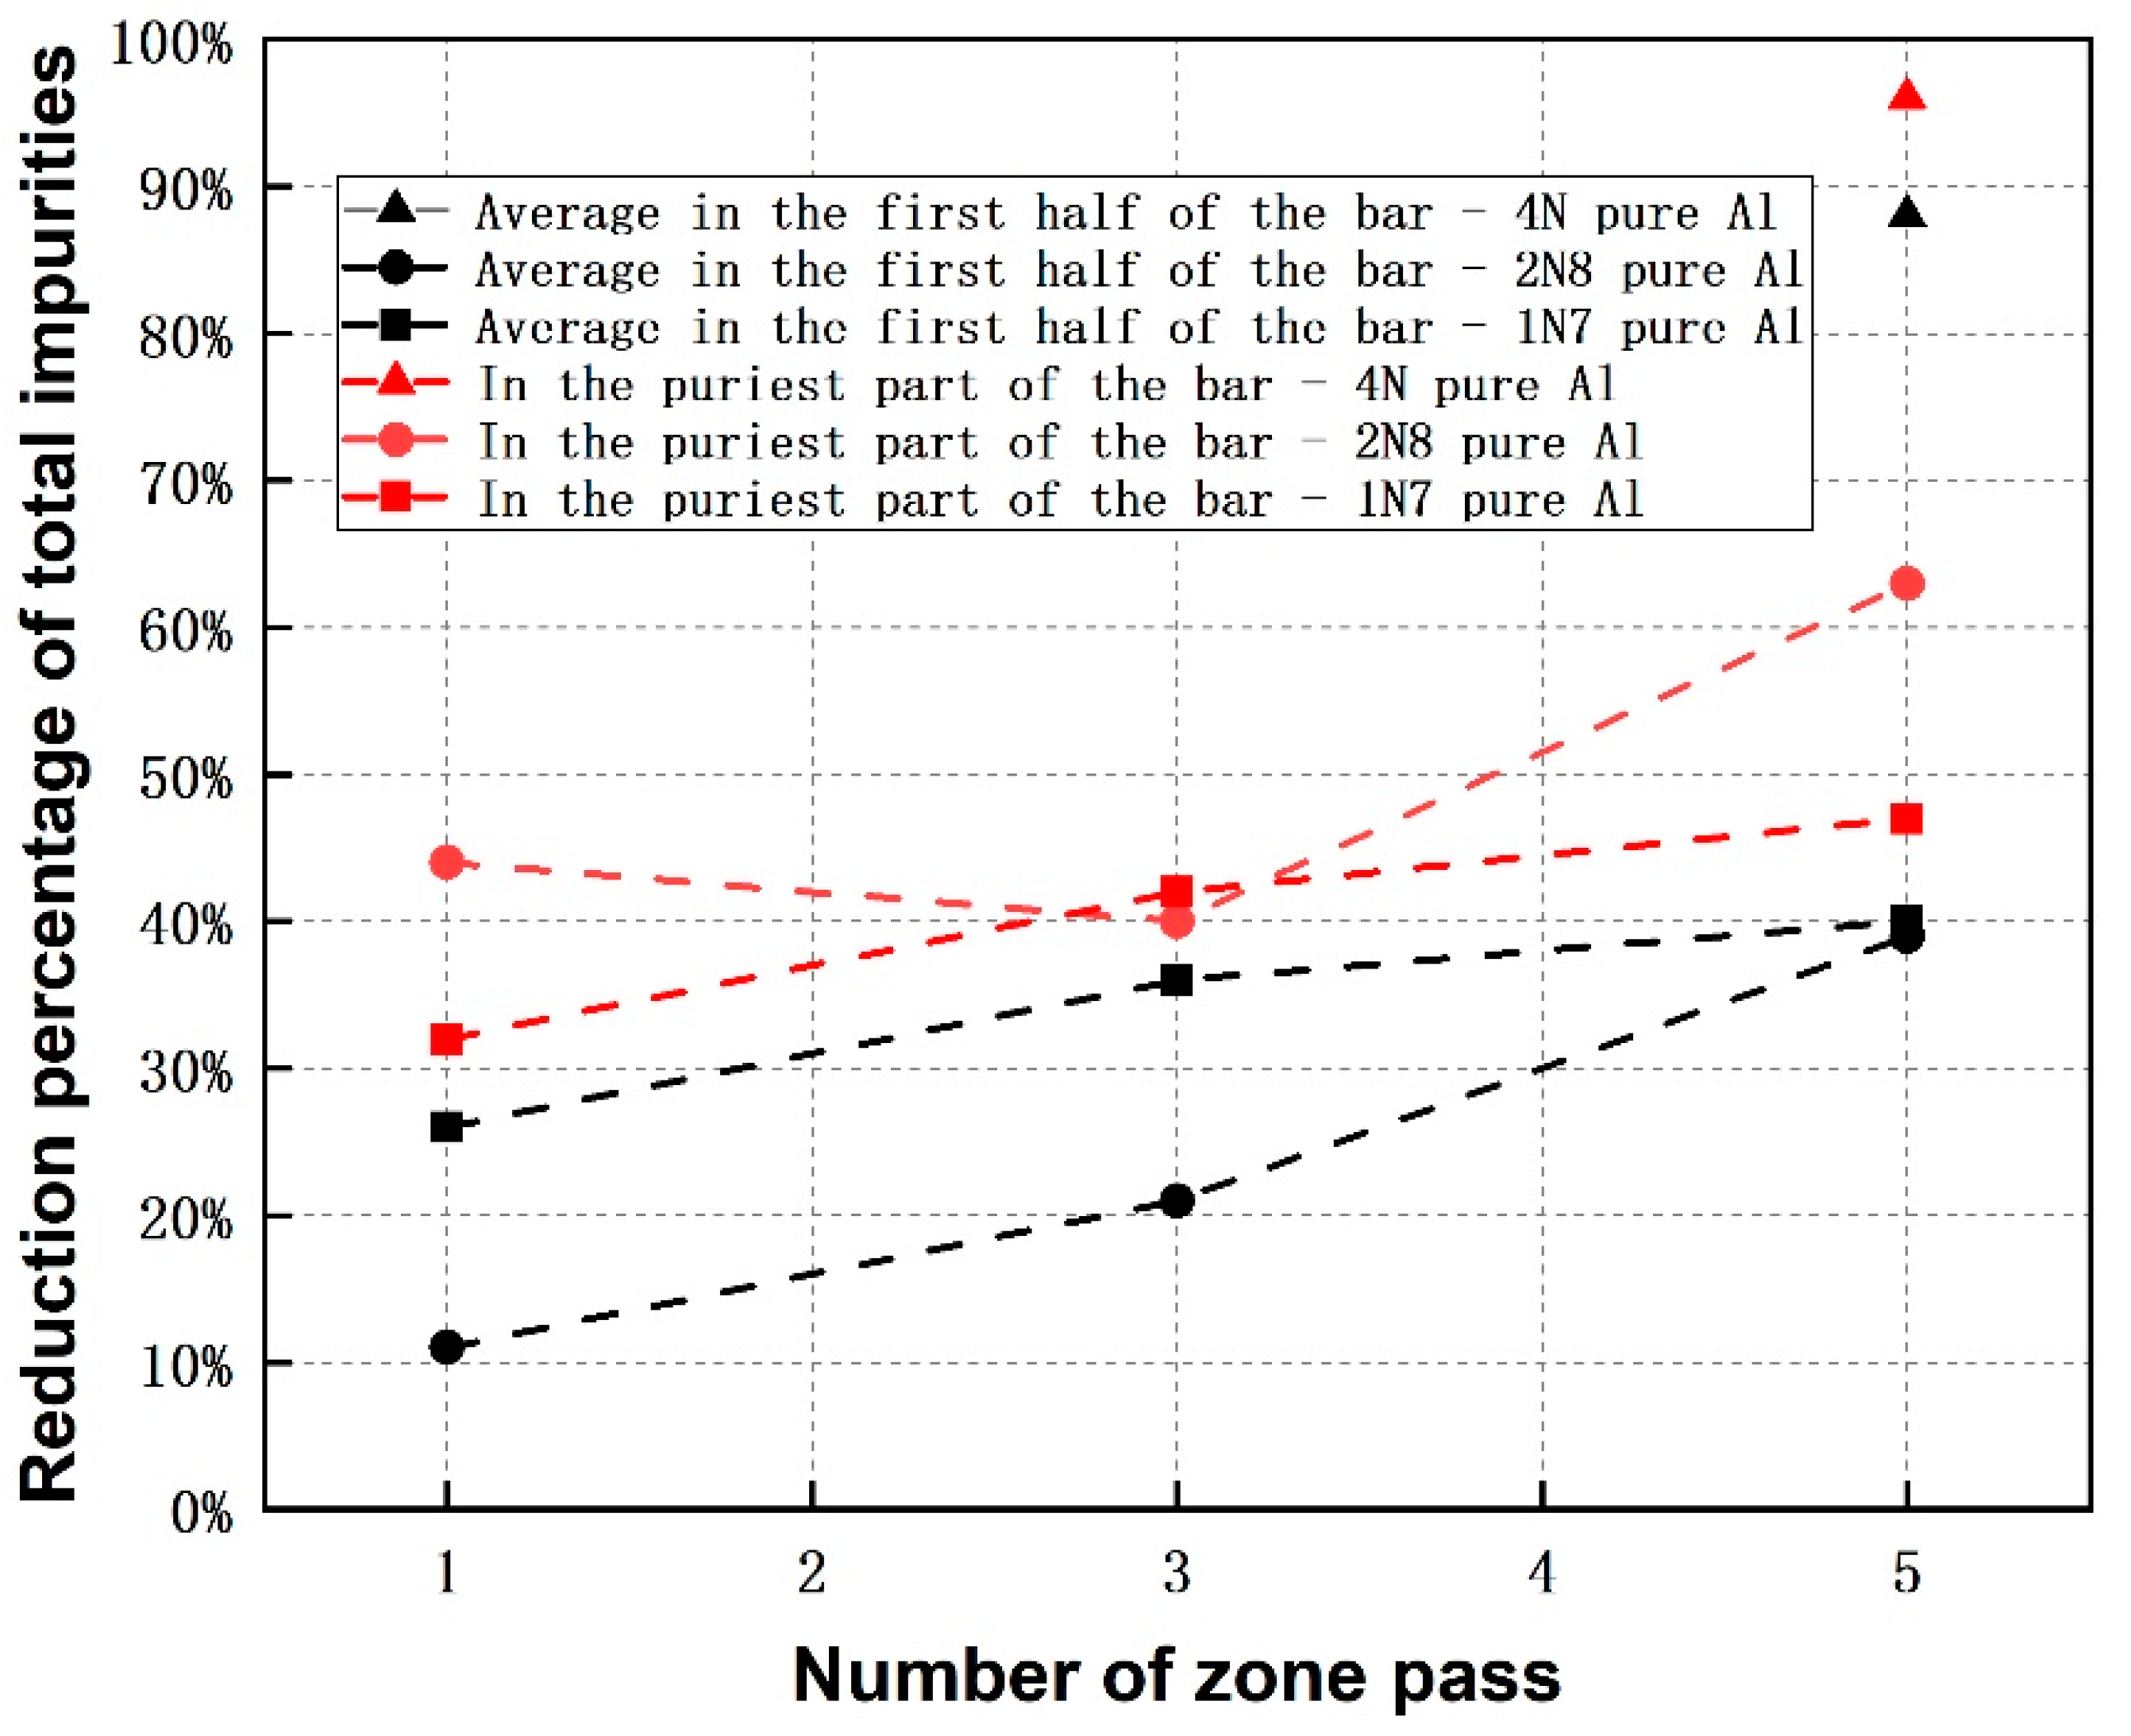
Comparing the zone refining of 4N-, 2N8- as well as 1N7-Al (see Figure 4) showed that the reduction of impurity level in the first half of the bar for 4N-Al after fifth pass is much higher than that of the other two. Regarding to each zone refining pass, the reduction of impurity for 1N7-Al is more intensive in comparison to the case of 2N8-Al, but the slope of the trend-line is lower. The low reduction of all impurities in the first half of the bar for 2N8-Al in the first three passes originates from the insufficient refining efficiency of the main impurity Fe (i.e., 10% and 17% of reduction percentage after 1st and 3rd passes), as presented in Table 6. That could be due to the more unstable zone length appearing in the experiments, as seen in Table 4. Focusing on the purest part of the bar, the impurity reduction percentage of 4N-Al is much higher than that of 2N8- and 1N7-Al, similar to the case of the first half of the bar, as seen in Figure 4. While, 2N8-Al shows a higher impurity reduction than the 1N7-Al, which is opposite to the case of the first half of the bar.
Overall and as a conclusion, the results indicate that if refined with a high number of zone passes (≥5), the Al with a higher initial purity level has a higher refining efficiency regarding to the purest part of the bar or to the average values in the first half of the bar.
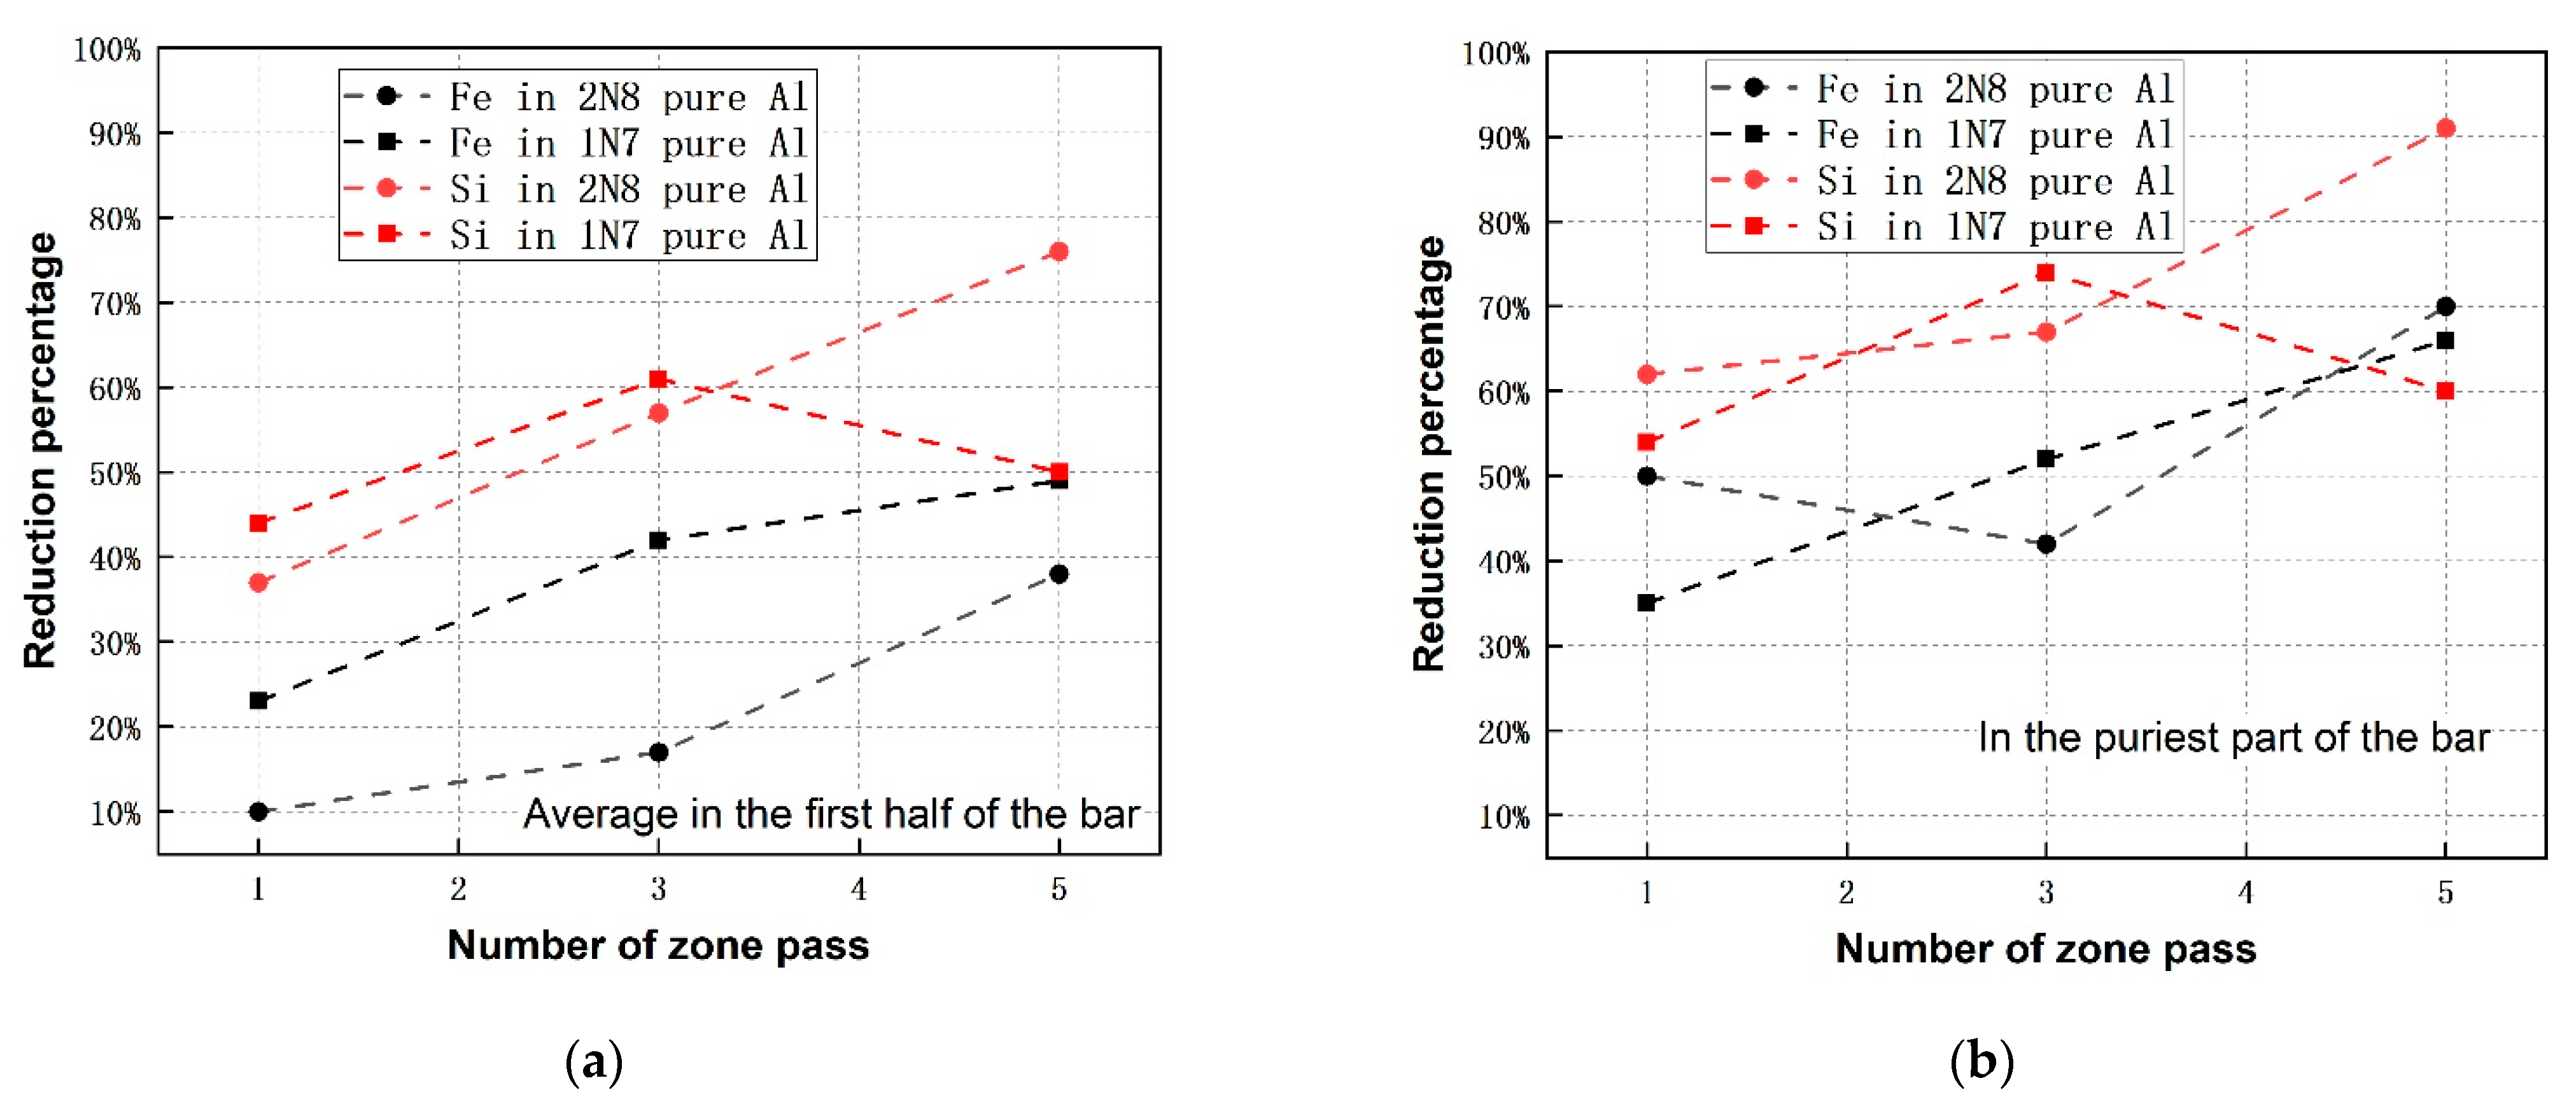
The impact of initial elementary concentration on the achievable refining efficiencies is hard to identify and therefore a safe conclusion cannot be drawn based on the present results. For example, Fe and Si show lower reduction efficiency in the first half of the bar in 2N8 pure Al compared to that in purified 1N7 pure Al, as seen in Figure 5a. It is opposite to the conclusion that the removal efficiencies of Fe and Si increase with their decreasing concentration, reported in reference [9]. Their refining efficiency in the purest part of the bar, however, seems not to have a relation to the initial concentrations, manifested in Figure 5b. The phenomenon is supposedly caused by the influence of the other co-existed impurities, which would affect the refining efficiency, through, e.g., forming an intermetallic compound or eutectic among them. Nevertheless, it can be found that the lower impurity concentration is favorable to obtain higher refining efficiency after increasing passes, e.g., the reduction percentage of Si in 2N8 pure Al after five passes is much higher than that in the recycled Al. This tendency was ascertained again by the extremely high refining efficiency of Fe or Si during the purification of 4N pure Al, as presented in Table 5.
4. Assessment and Conclusions
Aluminum with three different purity levels (4N (three-layer electrolysis Al), 2N8 (commercial pure Al) and 1N7 (recycled Al from UCBs)) was used to investigate the influence of initial purity of Al on zone refining efficiency (as example for crystallization methods) as well as to assess the feasibility of using this methodology to purify recycled Al especially regarding Fe. The results showed that Al with initial 4N purity had the highest refining efficiency of 96%, i.e., it was improved to 5N5 purity after five zone passes. However, the commercial pure- and recycled Al both showed impurity reduction percentage of less than 50%, measured in samples of the first half of the bar after five passes. The purification potential for these two Al raw materials is poor and do not allow considering commercial transfer, especially considering the low production yield and high time-consumption for zone refining.
Scientifically spoken, the correlation between the refining efficiency of each individual element (e.g., Fe and Si) could not be identified clearly in the conducted preliminary passes when observing the results of commercial pure and recycled Al. However, generally, an impurity with a lower initial concentration shows a higher potential to be removed (in terms of reduction percentage), but using high number of passes. The refining efficiency of the impurities with a very low concentration in 4N-pure Al was much higher than the refining efficiency of them in commercial pure and recycled Al, demonstrating again the benefit of lower initial concentration to the refining efficiency. Therefore, it is suggested to apply the zone refining process only when an already pure Al is used as the initial material.
Author Contributions
B.F., was the principal investigator and final proof reader; X.Z. and S.F., conceived and designed the experiments, analyzed the data as well as wrote and edited the manuscript. All authors have read and agreed to the published version of the manuscript.
Funding
This research received no external funding.
Institutional Review Board Statement
Not applicable.
Informed Consent Statement
Not applicable.
Data Availability Statement
Not applicable.
Acknowledgments
The authors would like to thank CSC—China Scholarship Council for the financial support of Xiaoxin Zhang, who conducted the investigation of this work in the frame of his PhD project at IME/RWTH Aachen University.
Conflicts of Interest
The authors declare no conflict of interest.
Appendix A

Table A1.
Impurity concentration along the bar after five passes of zone refining using commercial pure Al as initial material analyzed by ICP-OES.
Table A1.
Impurity concentration along the bar after five passes of zone refining using commercial pure Al as initial material analyzed by ICP-OES.
| 1.2 mm/min | Position (cm) | Fe | Si | Ga | V | Ni | Ti | Total Impurities | Al |
|---|---|---|---|---|---|---|---|---|---|
| % | ppm | ppm | ppm | ppm | ppm | % | % | ||
| Initial composition | 0.145 | 354 | 77 | 51 | 35 | 26 | 0.20 | 99.8 | |
| 1st pass | 2 | 0.16 | 228 | 95 | 73 | 34 | 29 | 0.21 | 99.8 |
| 12 | 0.14 | 170 | 78 | 84 | 26 | 37 | 0.18 | 99.8 | |
| 22 | 0.14 | 209 | 86 | 74 | 26 | 30 | 0.18 | 99.8 | |
| 32 | 0.072 | 136 | 61 | 116 | <10 | 66 | 0.11 | 99.9 | |
| 42 | 0.10 | 220 | 82 | 96 | 18 | 47 | 0.15 | 99.9 | |
| 52 | 0.17 | 370 | 131 | 72 | 47 | 29 | 0.23 | 99.8 | |
| 62 | 0.088 | 118 | 89 | 95 | 12 | 47 | 0.12 | 99.9 | |
| 72 | 0.14 | 222 | 65 | 103 | 30 | 55 | 0.19 | 99.8 | |
| 82 | 0.22 | 335 | 124 | 62 | 54 | 20 | 0.28 | 99.7 | |
| 92 | 0.23 | 479 | 167 | 57 | 65 | 14 | 0.31 | 99.7 | |
| 3rd pass | 2 | 0.13 | 199 | 81 | 89 | 30 | 43 | 0.17 | 99.8 |
| 12 | 0.11 | 131 | 62 | 92 | 17 | 45 | 0.14 | 99.9 | |
| 22 | 0.13 | 143 | 78 | 81 | 26 | 36 | 0.17 | 99.8 | |
| 32 | 0.13 | 119 | 71 | 85 | 21 | 39 | 0.16 | 99.8 | |
| 42 | 0.15 | 196 | 89 | 70 | 32 | 26 | 0.19 | 99.8 | |
| 52 | 0.084 | 118 | 67 | 100 | 14 | 49 | 0.12 | 99.9 | |
| 62 | 0.16 | 251 | 107 | 56 | 34 | 13 | 0.21 | 99.8 | |
| 72 | 0.33 | 541 | 189 | 31 | 94 | <10 | 0.42 | 99.6 | |
| 82 | 0.32 | 440 | 195 | 27 | 91 | <10 | 0.40 | 99.6 | |
| 92 | 0.50 | 990 | 312 | 14 | 162 | <10 | 0.55 | 99.5 | |
| 98 | 1.05 | 2500 | 599 | 15 | 382 | <10 | 1.15 | 98.9 | |
| 5th pass | 2 | 0.095 | 97 | 55 | 99 | 13 | 48 | 0.13 | 99.9 |
| 12 | 0.044 | 33 | 31 | 139 | <10 | 88 | 0.07 | 99.9 | |
| 22 | 0.097 | 118 | 57 | 91 | 13 | 42 | 0.13 | 99.9 | |
| 32 | 0.069 | 29 | 47 | 111 | <10 | 59 | 0.09 | 99.9 | |
| 42 | 0.11 | 106 | 75 | 82 | 24 | 35 | 0.14 | 99.9 | |
| 52 | 0.12 | 130 | 79 | 77 | 21 | 30 | 0.15 | 99.8 | |
| 62 | 0.17 | 246 | 112 | 52 | 39 | 10 | 0.22 | 99.8 | |
| 72 | 0.19 | 338 | 125 | 54 | 46 | 11 | 0.25 | 99.8 | |
| 82 | 0.35 | 538 | 211 | 28 | 103 | <10 | 0.44 | 99.6 | |
| 92 | 0.38 | 758 | 256 | 36 | 126 | <10 | 0.50 | 99.5 | |
| 98 | 0.51 | 1400 | 348 | 13 | 171 | <10 | 0.56 | 99.4 | |
Table A2.
Impurity concentration along the bar after five passes of zone refining using recycled Al as initial material analyzed by ICP-OES.
Table A2.
Impurity concentration along the bar after five passes of zone refining using recycled Al as initial material analyzed by ICP-OES.
| 1.2 mm/min | Position (cm) | Mg | Mn | Fe | Si | Cu | Zn | Ti | Cr | Ga | Total Impurities | Al |
|---|---|---|---|---|---|---|---|---|---|---|---|---|
| % | % | % | % | % | ppm | ppm | ppm | ppm | % | % | ||
| Initial composition | 0.99 | 0.86 | 0.42 | 0.18 | 0.15 | 310 | 180 | 140 | 90 | 2.66 | 97.3 | |
| 1st pass | 2 | 0.73 | 0.60 | 0.32 | 0.093 | 0.12 | 403 | 251 | 197 | 156 | 1.96 | 98.0 |
| 12 | 0.69 | 0.61 | 0.31 | 0.092 | 0.11 | 394 | 270 | 203 | 153 | 1.91 | 98.1 | |
| 22 | 0.74 | 0.62 | 0.34 | 0.095 | 0.12 | 411 | 212 | 197 | 159 | 2.01 | 98.0 | |
| 32 | 0.80 | 0.63 | 0.36 | 0.11 | 0.14 | 438 | 196 | 196 | 172 | 2.14 | 97.9 | |
| 42 | 0.66 | 0.60 | 0.27 | 0.082 | 0.11 | 375 | 272 | 202 | 149 | 1.82 | 98.2 | |
| 52 | 0.72 | 0.61 | 0.31 | 0.12 | 0.12 | 368 | 255 | 199 | 157 | 1.98 | 98.0 | |
| 62 | 0.69 | 0.60 | 0.28 | 0.10 | 0.11 | 340 | 277 | 201 | 151 | 1.88 | 98.1 | |
| 72 | 0.88 | 0.63 | 0.43 | 0.13 | 0.17 | 356 | 137 | 186 | 187 | 2.33 | 97.7 | |
| 82 | 0.90 | 0.65 | 0.44 | 0.16 | 0.17 | 325 | 145 | 189 | 191 | 2.41 | 97.6 | |
| 92 | 0.99 | 0.67 | 0.50 | 0.16 | 0.20 | 307 | 100 | 186 | 212 | 2.60 | 97.4 | |
| 98 | 1.19 | 0.70 | 0.66 | 0.15 | 0.27 | 339 | 35 | 171 | 256 | 3.05 | 96.9 | |
| 3rd pass | 2 | 0.61 | 0.60 | 0.24 | 0.064 | 0.094 | 339 | 352 | 204 | 136 | 1.71 | 98.3 |
| 12 | 0.55 | 0.58 | 0.21 | 0.048 | 0.080 | 313 | 391 | 210 | 129 | 1.57 | 98.4 | |
| 22 | 0.54 | 0.58 | 0.20 | 0.047 | 0.080 | 297 | 405 | 212 | 129 | 1.55 | 98.4 | |
| 32 | 0.64 | 0.61 | 0.26 | 0.066 | 0.10 | 314 | 280 | 203 | 142 | 1.77 | 98.2 | |
| 42 | 0.60 | 0.59 | 0.21 | 0.091 | 0.089 | 277 | 200 | 199 | 133 | 1.66 | 98.3 | |
| 52 | 0.69 | 0.61 | 0.30 | 0.093 | 0.12 | 273 | 179 | 191 | 152 | 1.89 | 98.1 | |
| 62 | 0.72 | 0.63 | 0.33 | 0.11 | 0.12 | 238 | 131 | 190 | 158 | 1.98 | 98.0 | |
| 72 | 1.03 | 0.68 | 0.58 | 0.20 | 0.21 | 245 | 49 | 173 | 212 | 2.77 | 97.2 | |
| 82 | 1.09 | 0.68 | 0.62 | 0.22 | 0.24 | 220 | 34 | 169 | 233 | 2.92 | 97.1 | |
| 92 | 1.12 | 0.65 | 0.60 | 0.18 | 0.25 | 216 | 34 | 170 | 248 | 2.87 | 97.1 | |
| 98 | 1.27 | 0.68 | 0.72 | 0.20 | 0.31 | 233 | 15 | 161 | 283 | 3.25 | 96.8 | |
| 5th pass | 2 | 0.44 | 0.56 | 0.14 | 0.071 | 0.062 | 261 | 694 | 227 | 119 | 1.40 | 98.6 |
| 12 | 0.50 | 0.58 | 0.17 | 0.089 | 0.070 | 278 | 417 | 217 | 122 | 1.51 | 98.5 | |
| 22 | 0.45 | 0.58 | 0.16 | 0.072 | 0.07 | 244 | 445 | 219 | 117 | 1.43 | 98.6 | |
| 32 | 0.54 | 0.59 | 0.22 | 0.092 | 0.08 | 255 | 256 | 204 | 130 | 1.61 | 98.4 | |
| 42 | 0.61 | 0.61 | 0.27 | 0.10 | 0.10 | 235 | 156 | 200 | 143 | 1.76 | 98.2 | |
| 52 | 0.65 | 0.62 | 0.30 | 0.094 | 0.11 | 217 | 126 | 193 | 151 | 1.84 | 98.2 | |
| 62 | 0.70 | 0.64 | 0.35 | 0.11 | 0.12 | 208 | 79 | 190 | 163 | 1.98 | 98.0 | |
| 72 | 0.84 | 0.68 | 0.46 | 0.16 | 0.16 | 195 | 63 | 185 | 188 | 2.36 | 97.6 | |
| 82 | 1.10 | 0.66 | 0.63 | 0.23 | 0.25 | 202 | 18 | 164 | 245 | 2.93 | 97.1 | |
| 92 | 1.19 | 0.64 | 0.64 | 0.22 | 0.28 | 201 | 15 | 158 | 267 | 3.03 | 97.0 | |
| 98 | 1.35 | 0.61 | 0.71 | 0.20 | 0.34 | 217 | <5 | 149 | 306 | 3.28 | 96.7 | |
References
- Curtolo, D.; Friedrich, S.; Bellin, D.; Nayak, G.; Friedrich, B. Definition of a First Process Window for Purification of aluminum via “Cooled Finger” Crystallization Technique. Metals 2017, 7, 341. [Google Scholar] [CrossRef]
- Pearce, J.V. Distribution coefficients of impurities in metals. Int. J. Thermophys. 2014, 35, 628–635. [Google Scholar] [CrossRef]
- Huntley, D.A.; Shah, J.S. High resistance ratio antimony. J. Cryst. Growth 1970, 6, 216–218. [Google Scholar] [CrossRef]
- Hashimoto, E.; Ueda, Y. Zone Refining of high-purity aluminum. Mater. Trans. 1994, 35, 262–265. [Google Scholar] [CrossRef] [Green Version]
- Munirathnam, N.R.; Prasad, D.S.; Sudheer, C.; Prakash, T.L. Purification of tellurium to 6N + by quadruple zone refining. J. Cryst. Growth 2003, 254, 262–266. [Google Scholar] [CrossRef]
- Munirathnam, N.R.; Prasad, D.S.; Sudheer, C.H.; Rao, J.V.; Prakash, T.L. Zone refining of cadmium and related characterization. Bull. Mater. Sci. 2005, 28, 209–212. [Google Scholar] [CrossRef] [Green Version]
- Yang, G.; Guan, Y.T.; Jian, F.Y.; Wagner, M.D.; Mei, H.; Wang, G.J.; Howard, S.M.; Mei, D.M.; Nelson, A.; Marshal, J.; et al. Zone Refinement of Germanium Crystals. J. Phys. Conf. Ser. 2015, 606, 012014. [Google Scholar] [CrossRef] [Green Version]
- Pfann, W.G. Principles of zone melting. Trans. AIME 1952, 194, 747. [Google Scholar] [CrossRef]
- Vigdorovich, V.N. Purification of Metals and Semiconductors by Crystallization; Freund Publishing Houste: Moscow, Russia, 1969. [Google Scholar]
- Ghosh, K.; Mani, V.N.; Dhar, S. A modeling approach for the purification of group III metals (Ga and In) by zone refining. J. Appl. Phys. 2008, 104. [Google Scholar] [CrossRef]
- Ghosh, K.; Mani, V.N.; Dhar, S. Numerical study and experimental investigation of zone refining in ultra-high purification of gallium and its use in the growth of GaAs epitaxial layers. J. Cryst. Growth 2009, 311, 1521–1528. [Google Scholar] [CrossRef]
- Kino, T.; Kamigaki, N.; Yamasaki, H.; Kawai, J.; Deguchi, Y.; Nakamichi, I. Zone Refining in aluminum. Trans. Jpn. Inst. Met. 1976, 17, 645–648. [Google Scholar] [CrossRef] [Green Version]
- Nakamura, M.; Watanabe, M.; Tanaka, K.; Kirihata, A.; Sumomogi, T.; Hiroaki, H.; Tanaka, I. Zone Refining of aluminum and its Simulation. Mater. Trans. 2014, 55, 664–670. [Google Scholar] [CrossRef] [Green Version]
- Yang, G.; Govani, J.; Mei, H.; Guan, Y.; Wang, G.; Huang, M.; Mei, D. Investigation of influential factors on the purification of zone-refined germanium ingot. Cryst. Res. Technol. 2014, 49, 269–275. [Google Scholar] [CrossRef]
- Munirathnam, N.R.; Prasad, D.S.; Sudheer, C.; Singh, A.J.; Prakash, T.L. Preparation of high purity tellurium by zone refining. Bull. Mater. Sci. 2002, 25, 79–83. [Google Scholar] [CrossRef]
- Curtolo, D.; Zhang, X.; Rojas, M.; Friedrich, S.; Friedrich, B. Realization of the Zone Length Measurement during Zone Refining Process via Implementation of an Infrared Camera. Appl. Sci. 2018, 8, 875. [Google Scholar] [CrossRef] [Green Version]
- Spim, J.A.; Bernadou, M.J.S.; Garcia, A. Numerical modeling and optimization of zone refining. J. Alloy. Compd. 2000, 298, 299–305. [Google Scholar] [CrossRef]
- Leslie Burris, J.; Stockman, C.H.; Dillon, I.G. Contribution to mathematics of zone refining. J. Miner. Met. Mater. Soc. 1955, 7, 1017–1023. [Google Scholar] [CrossRef]
- Pfann, W.G. Zone Melting, 2nd ed.; John Wiley and Sons Inc.: New York, NY, USA, 1966. [Google Scholar]
- Ho, C.; Yeh, H.; Yeh, T. Numerical analysis on optimal zone lengths for each pass in multipass zone-refining processes. Can. J. Chem. Eng. 1998, 76, 3–9. [Google Scholar] [CrossRef]
- Rodway, G.H.; Hunt, J.D. Optimizing zone refining. J. Cryst. Growth 1989, 97, 680–688. [Google Scholar] [CrossRef]
- Zhang, X.; Friedrich, S.; Friedrich, B. Characterization and interpretation of the aluminum zone refining through infrared thermographic analysis. Materials 2018, 11, 2039. [Google Scholar] [CrossRef] [PubMed] [Green Version]
Figure 1.
Diagram of zone refining of aluminum.

Figure 2.
Zone refining device, equipped with an inductive heater and an infrared camera.

Figure 3.
The distribution of the amount of all impurities along the Al bar after five zone passes using 4N pure Al as initial material.
Figure 3.
The distribution of the amount of all impurities along the Al bar after five zone passes using 4N pure Al as initial material.

Figure 4.
Comparison of reduction percentage of all impurities after each pass among zone refining of 4N-, 2N8- and 1N7 pure Al (the chemical composition of the Al after 1st and 3rd passes for zone refining of 4N pure Al were not analyzed in the present work, considering the huge probability of introducing contamination during sampling such high purity Al in the middle zone passes).

Figure 5.
Comparison of remaining percentages of impurities Fe and Si after zone refining between commercial pure Al and recycled Al: (a) average in the first half of the bar; (b) in the purest part of the bar.
Figure 5.
Comparison of remaining percentages of impurities Fe and Si after zone refining between commercial pure Al and recycled Al: (a) average in the first half of the bar; (b) in the purest part of the bar.

| Element | Range of k | Element | Range of k |
|---|---|---|---|
| Ti | 7–11 | Cu | 0.15–0.153 |
| V | 3.3–4.3 | Si | 0.082–0.12 |
| Zr | 2.3–3 | Ga | 0.11 |
| Cr | 1.8 | Sb | 0.09 |
| Sc | 0.9 | Ni | 0.004–0.09 |
| Mn | 0.55–0.9 | Ca | 0.006–0.08 |
| K | 0.56 | Fe | 0.018–0.053 |
| Mg | 0.29–0.5 | Na | 0.013 |
| Zn | 0.35–0.47 | P | <0.01 |
| Ag | 0.2–0.3 | Pb | 0.0007 |
| Au | 0.18 | - | - |
Table 2.
Exemplary high purity metals produced through zone refining shown with their initial and final purities.
Table 2.
Exemplary high purity metals produced through zone refining shown with their initial and final purities.
| Purity | Ga | Al | Ge | Te | ||||
|---|---|---|---|---|---|---|---|---|
| Initial | 4N6 | 5N2 | 5N | 6N | 5N | 5N | 4N | 5N |
| Final | 6N5 [10] | 7N2 [11] | 6N [12] | 7N [4,13] | 5N5 [7] | 7N [14] | 5N5 [15] | 6N [5] |
Table 3.
Chemical composition of the different purity levels of Al, applied in this work (ppm).
| Three-layer electrolysis Al 1 | Si | Na | Ti | Fe | Sn | Zn | Cu | P | Pb | Total impurities | Al (%) |
| <5 | 18 | 9 | <5 | 19 | 23 | 8 | 15 | 24 | 116 | 99.99 | |
| Commercial pure Al 2 | Fe | Ga | Ni | Si | Ti | V | - | - | - | Total impurities | Al (%) |
| 1450 | 77 | 35 | 354 | 26 | 51 | - | - | - | 1993 | 99.8 | |
| Recycled Al 2 | Si | Fe | Cu | Mn | Mg | Cr | Zn | Ti | Ga | Total impurities | Al (%) |
| 1790 | 4150 | 1500 | 8550 | 9900 | 140 | 310 | 180 | 90 | 26,610 | 97.3 |
Note: 1 analyzed by spark spectrometer, while, 2 analyzed by Inductively Coupled Plasma Optical Emission Spectrometer (ICP-OES), according to the required detection precision.
Table 4.
Experimental parameters, applied on different initial purity levels.
| Zone Pass | Optimum Zone Length [10] | Zone Length (Practical) * | Length of Al Bar (L) | Moving Velocity | ||
|---|---|---|---|---|---|---|
| 4N-Pure Al | 2N8-Pure Al | 1N7 Pure Al | ||||
| 1st | 1 L | 0.24–0.34 L | 0.17–0.36 L | 0.23–0.32 L | 100 cm | 1.2 mm/min |
| 2nd | 0.35 L | 0.17–0.30 L | 0.17–0.30 L | 0.14–0.29 L | ||
| 3rd | 0.25 L | 0.17–0.28 L | 0.20–0.30 L | 0.20–0.30 L | ||
| 4th | 0.20 L | 0.16–0.25 L | 0.14–0.23 L | 0.12–0.24 L | ||
| 5th | 0.15 L | 0.15–0.25 L | 0.12–0.25 L | 0.18–0.25 L | ||
Note: L represents the length of the Al bar; * the practical zone length was measured by hand according to the clear interface between solid and liquid states of Al.
Table 5.
Impurity concentration along Al bar after five passes of zone refining with 4N pure Al as initial purity analyzed by GDMS (ppm).
Table 5.
Impurity concentration along Al bar after five passes of zone refining with 4N pure Al as initial purity analyzed by GDMS (ppm).
| Position (cm) | Si | Na | Ti | Fe | Sn | Zn | Cu | P | Pb | Total Impurities | Al (%) |
|---|---|---|---|---|---|---|---|---|---|---|---|
| Initial * | <5 | 18 | 9 | <5 | 19 | 23 | 8 | 15 | 24 | 116 | 99.99 |
| 12 | 0.98 | 0.06 | 0.10 | 0.03 | 1.50 | 1.49 | 0.22 | 0.04 | 0.01 | 4.69 | 99.9995 |
| 32 | 2.05 | 0.15 | 0.25 | 3.45 | 0.04 | 20.95 | 1.62 | 0.09 | 1.09 | 29.86 | 99.997 |
| 52 | 1.49 | 0.12 | 0.15 | 1.45 | 0.08 | 1.32 | 1.21 | 0.07 | 0.44 | 6.34 | 99.9994 |
| 72 | 4.01 | 0.04 | 0.04 | 0.76 | 0.01 | 10.56 | 0.28 | 0.09 | 0.00 | 15.86 | 99.998 |
| 92 | 30.37 | 0.04 | 0.03 | 16.54 | 1.28 | 2.93 | 2.22 | 4.96 | 0.51 | 58.89 | 99.994 |
Note: * it was analyzed by spark spectrometer.
Table 6.
Impurity reduction in the first half of the bar after five passes of zone refining using 2N8 pure Al as initial material, analyzed through ICP-OES (ppm).
Table 6.
Impurity reduction in the first half of the bar after five passes of zone refining using 2N8 pure Al as initial material, analyzed through ICP-OES (ppm).
| Impurity Elements | Fe | Si | Ga | V | Ni | Ti | Total Impurities |
|---|---|---|---|---|---|---|---|
| Initial material | 1450 | 354 | 77 | 51 | 35 | 26 | 1993 |
| 1st pass | 1300 | 222 | 89 | 86 | 30 | 40 | 1767 |
| 3rd pass | 1200 | 151 | 75 | 86 | 23 | 40 | 1575 |
| 5th pass | 900 | 86 | 57 | 100 | 18 | 50 | 1211 |
| Reduction (1st pass) | 10% | 37% | −16% | −69% | 14% | −54% | 11% |
| Reduction (3rd pass) | 17% | 57% | 3% | −69% | 34% | −54% | 21% |
| Reduction (5th pass) | 38% | 76% | 26% | −96% | 49% | −92% | 39% |
Table 7.
Impurity concentration at the purest part of the bar after each pass of zone refining using 2N8 pure Al as initial material, analyzed through ICP-OES (ppm).
Table 7.
Impurity concentration at the purest part of the bar after each pass of zone refining using 2N8 pure Al as initial material, analyzed through ICP-OES (ppm).
| Impurity Elements | Fe | Si | Ga | V | Ni | Ti | Total Impurities |
|---|---|---|---|---|---|---|---|
| Initial material | 1450 | 354 | 77 | 51 | 35 | 26 | 1993 |
| 1st pass (at 32 cm) | 720 | 136 | 61 | 116 | <10 | 66 | 1099 |
| 3rd pass (at 52 cm) | 840 | 118 | 67 | 100 | 14 | 49 | 1188 |
| 5th pass (at 12 cm) | 440 | 33 | 31 | 139 | <10 | 88 | 731 |
| Reduction (1st pass) | 50% | 62% | 21% | −127% | >71% | −154% | 44% |
| Reduction (3rd pass) | 42% | 67% | 13% | −96% | 60% | −88% | 40% |
| Reduction (5th pass) | 70% | 91% | 60% | −173% | >71% | −238% | 63% |
Table 8.
Impurity reduction in the first half of the bar after five passes of zone refining using 1N7 pure Al as initial material, analyzed through ICP-OES (ppm).
Table 8.
Impurity reduction in the first half of the bar after five passes of zone refining using 1N7 pure Al as initial material, analyzed through ICP-OES (ppm).
| Impurity Elements | Mg | Mn | Fe | Si | Cu | Zn | Ti | Cr | Ga | Total Impurities |
|---|---|---|---|---|---|---|---|---|---|---|
| Initial material | 9900 | 8550 | 4150 | 1790 | 1500 | 310 | 180 | 140 | 90 | 26,610 |
| 1st pass | 7200 | 6100 | 3200 | 1000 | 1200 | 398 | 243 | 199 | 158 | 19,698 |
| 3rd pass | 6100 | 6000 | 2400 | 700 | 900 | 302 | 301 | 203 | 137 | 17,043 |
| 5th pass | 5300 | 5900 | 2100 | 900 | 800 | 248 | 349 | 210 | 130 | 15,937 |
| Reduction (1st pass) | 27% | 29% | 23% | 44% | 20% | −28% | −35% | −42% | −76% | 26% |
| Reduction (3rd pass) | 38% | 30% | 42% | 61% | 40% | 3% | −67% | −45% | −52% | 36% |
| Reduction (5th pass) | 46% | 31% | 49% | 50% | 47% | 20% | −94% | −50% | −44% | 40% |
Table 9.
Impurity concentration at the purest part of the bar after each pass of zone using 1N7 pure Al as initial material, analyzed through ICP-OES (ppm).
Table 9.
Impurity concentration at the purest part of the bar after each pass of zone using 1N7 pure Al as initial material, analyzed through ICP-OES (ppm).
| Impurity Elements | Mg | Mn | Fe | Si | Cu | Zn | Ti | Cr | Ga | Total Impurities |
|---|---|---|---|---|---|---|---|---|---|---|
| Initial material | 9900 | 8550 | 4150 | 1790 | 1500 | 310 | 180 | 140 | 90 | 26,610 |
| 1st pass (at 42 cm) | 6600 | 6000 | 2700 | 820 | 1100 | 375 | 272 | 202 | 149 | 18,218 |
| 3rd pass (at 22 cm) | 5400 | 5800 | 2000 | 470 | 800 | 297 | 405 | 212 | 129 | 15,513 |
| 5th pass (at 2 cm) | 4400 | 5600 | 1400 | 710 | 620 | 261 | 694 | 227 | 119 | 14,031 |
| Reduction (1st pass) | 33% | 30% | 35% | 54% | 27% | −21% | −51% | −44% | −66% | 32% |
| Reduction (3rd pass) | 45% | 32% | 52% | 74% | 47% | 4% | −125% | −51% | −43% | 42% |
| Reduction (5th pass) | 56% | 35% | 66% | 60% | 59% | 16% | −286% | −62% | −32% | 47% |
Publisher’s Note: MDPI stays neutral with regard to jurisdictional claims in published maps and institutional affiliations. |
© 2021 by the authors. Licensee MDPI, Basel, Switzerland. This article is an open access article distributed under the terms and conditions of the Creative Commons Attribution (CC BY) license (http://creativecommons.org/licenses/by/4.0/).
Share and Cite
MDPI and ACS Style
Zhang, X.; Friedrich, S.; Friedrich, B. The Influence of Initial Purity Level on the Refining Efficiency of Aluminum via Zone Refining. Metals 2021, 11, 201. https://doi.org/10.3390/met11020201
AMA Style
Zhang X, Friedrich S, Friedrich B. The Influence of Initial Purity Level on the Refining Efficiency of Aluminum via Zone Refining. Metals. 2021; 11(2):201. https://doi.org/10.3390/met11020201
Chicago/Turabian StyleZhang, Xiaoxin, Semiramis Friedrich, and Bernd Friedrich. 2021. "The Influence of Initial Purity Level on the Refining Efficiency of Aluminum via Zone Refining" Metals 11, no. 2: 201. https://doi.org/10.3390/met11020201
Note that from the first issue of 2016, this journal uses article numbers instead of page numbers. See further details here.