Plastically-Induced Volume Deformation of Nanocrystalline α-Fe with a <110> Columnar Structure


1
TECNUN—University of Navarra, P. Manuel de Lardizabal 13, E-20018 San Sebastián, Spain
2
Ceit Technology Center, University of Navarra, P. Manuel de Lardizabal 15, E-20018 San Sebastián, Spain
3
Centro de Física de Materiales (CSIC-UPV/EHU)-MPC, P. Manuel de Lardizabal 5, E-20018 San Sebastián, Spain
*
Author to whom correspondence should be addressed.
Metals 2020, 10(12), 1649; https://doi.org/10.3390/met10121649
Submission received: 7 November 2020
/
Revised: 26 November 2020
/
Accepted: 4 December 2020
/
Published: 7 December 2020
(This article belongs to the Special Issue Computational Modeling and Numerical Simulation in Mechanical Behavior of Metallic Materials)
Abstract
:Volume changes accompanying the plastic deformation at 300 K of nanocrystalline samples of α-Fe with a columnar grain structure possessing a random fiber texture has been obtained from molecular dynamics (MD) simulations. The samples were strained in tension along the common axial direction of the columnar grains. After removal of the elastic volume change, the evolution of plastic volume strain was obtained. Small but non-negligible volume dilations or contractions are observed depending on size (samples of very small grain size show volume contraction). The rate of volume change is high during the first 10% plastic deformation and continues at a low pace thereafter; the first 10% deformation represents a transient in the stress–strain behavior too. The complex behavior observed is reasonably explained by the superposition of contributions from different plastically-induced structural changes to the mass density change: Mainly from changes of grain size, grain boundary structure, dislocation density and density of point-defects. The results are of interest for the development of crystal plasticity theories not restricted by the volume conserving assumption.
1. Introduction
Volume invariance by plastic deformation of fully dense crystalline materials is commonly assumed in continuum theories of deformation. For most engineering applications such an assumption is reasonable. Standard experimental techniques of density measurement (hydrostatic weighing, helium pycnometry) detect small changes after moderate/large strains (e.g., increasing dilations in unidirectional strain paths or in fatigue). These changes are partly (but not exclusively) due to nucleation and growth of microscopic internal discontinuities (cracks or voids) covered by the term “structural damage” (strongly dependent on the material “cleanliness”). The existence and effects of such “structural damage”, linked to initial porosity or to ongoing brittle or ductile local fractures, is effectively considered by ad hoc modifications of continuum plastic theories [1]. It is well known, however, that crystal plasticity micro-mechanisms involve the presence and evolution of concentrations of lattice defects with associated volume strain [2,3,4,5,6]. The proper inclusion of such volume changes in dislocation-based continuum crystal plasticity theories has recently roused interest [7]. The last reference is mainly motivated by the implications of plastic volume changes associated with point defects (mainly, vacancies and their clusters); however, volume changes are associated to practically all defects of the crystal lattice besides vacancies, vacancy clusters or interstitials (dislocations, grain boundaries, etc.). As the volume density of these other defects evolves with both the amount of plastic strain and the strain path, their implication on plastic volume deformation should be considered too in crystal plasticity theories.
In this note we present results on plastic volume strains incurred by nanostructured αFe samples deformed by unidirectional elongation up to moderate/large total strains of about 50% at room temperature (300 K) under zero hydrostatic external pressure. The results come from molecular dynamics (MD) simulations performed at a constant total strain rate = 108 s−1. The use of such a high strain rate in the simulations is inherent to conventional MD calculations; thus, care must be taken when comparing the results with figures obtained from experiments performed under quasi-static conditions. The calculations were performed with the LAMMPS code [8], making use of the Mendelev potential for αFe [9]. During simulations, the integration time was 1 fs per step and files were saved each 103 steps. The initial, unrelaxed structure was relaxed, unstressed, at 300 K during 0.2 ns, i.e., 2 × 10⁵ ksteps. Full detail of the MD simulations and an analysis of their results, focused on the stress–strain behavior and its underlying structural changes, have been published elsewhere [10,11].
2. Model and Results
Cuboid calculation cells of a single crystal sample and four polycrystalline samples nanostructured with a near equiaxed columnar structure of different sized crystal domains (fibers separated by grain or subgrain tilt boundaries possessing a random fiber texture) were built, relaxed at 300 K and elongated in the common axial direction of the fibers (z direction). Periodic structural and mechanical boundary conditions were imposed to the cuboid cells along the three space directions. Such periodicity eliminates any free-surface effects (e.g., size-effects on volume from the surface tension).
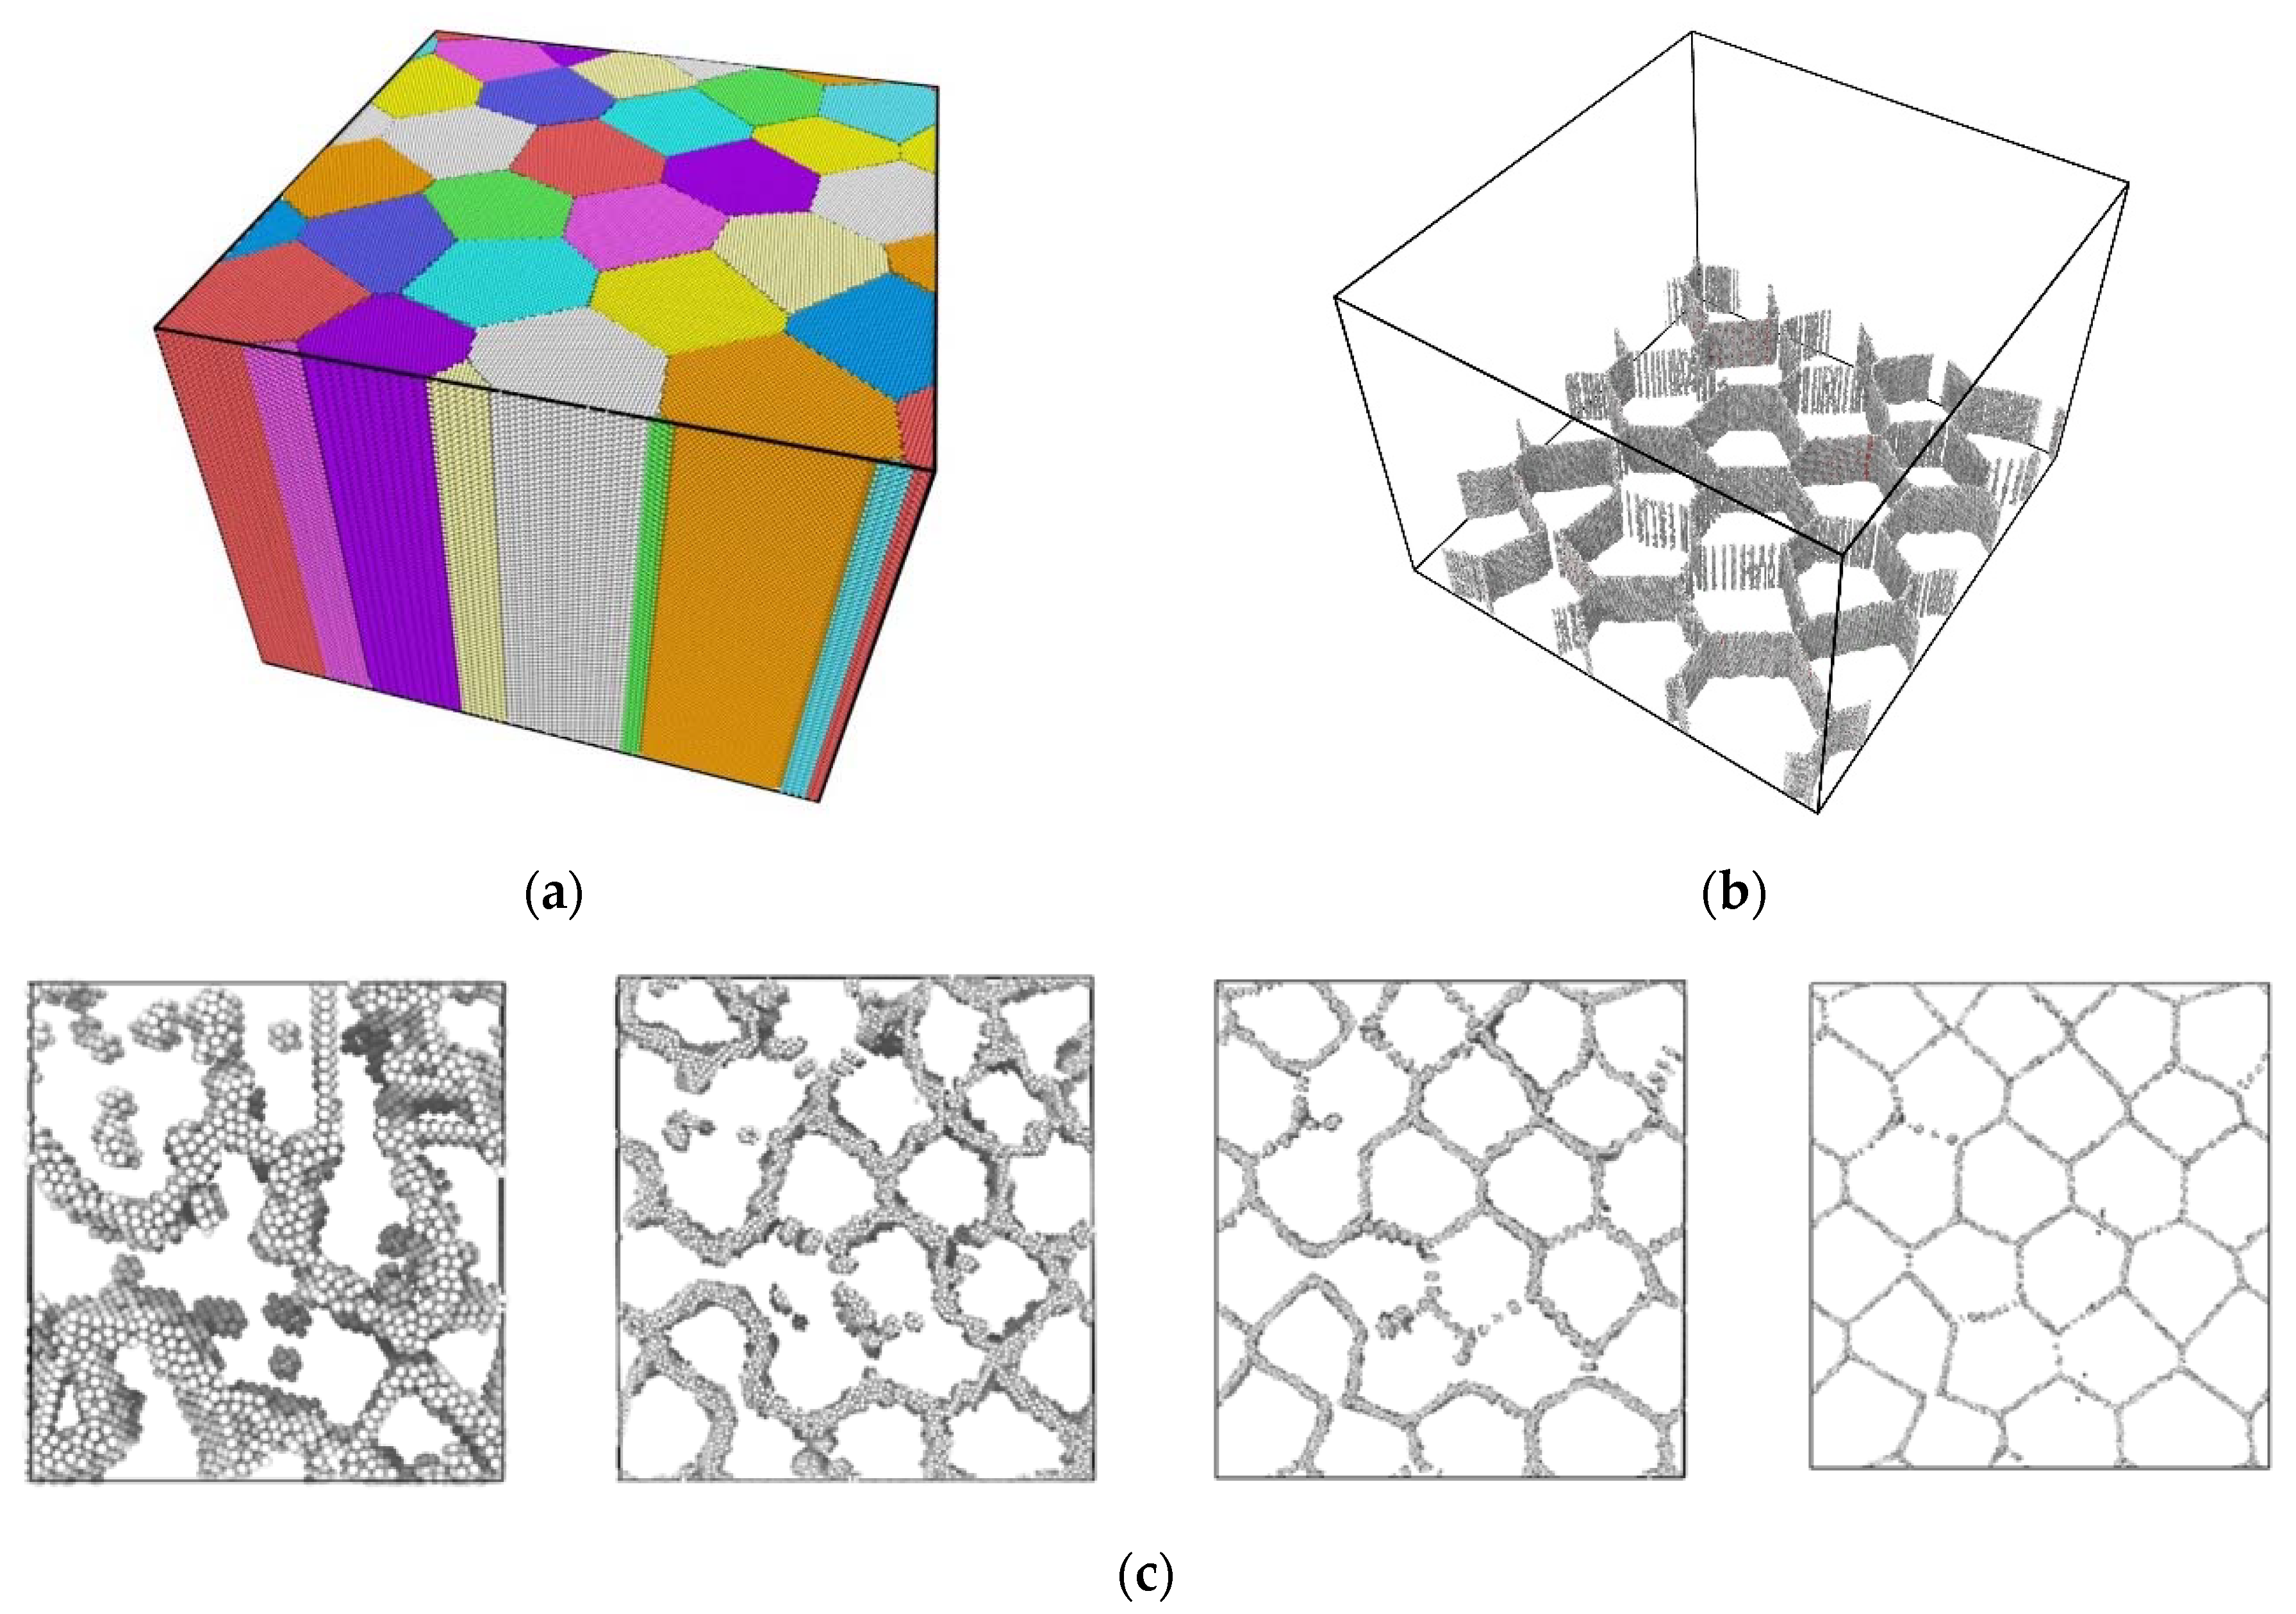
The initial (unrelaxed) nanostructured calculation cells were geometrically self-similar at macro and meso-level (external size and internal fiber size); of course, the self-similarity did not hold at micro-level (atomistic structure of the grain boundaries, GB). After relaxation at 300 K, the ideal geometry of the columnar structures, identical for the four sizes, was partially lost, although a rather perfect axially aligned structure was retained in all samples (Figure 1); some structural re-organization and annihilation was suffered by their fiber boundaries; smaller samples, relatively, lost more fiber wall surfaces. Dimensions of the calculation cells are given in Table 1.
The single crystal sample was only stressed before its yield point and for the purpose of this note is only meant as a reference for the atomic volume of the perfect lattice at 300 K.
The tensile stress–strain behavior of the nanostructured samples shows an elastoplastic transient (a peak of the flow stress) before reaching an approximate steady-state beyond a total strain 0.1 where the flow stress oscillates around a slightly decreasing mean value [10,11]. The value of the mean flow stress and the amplitude of its oscillations increase as the sample size decreases. During the transient, a dynamically stable complex structure involving a skeleton of defective fiber walls, a pattern of internal stresses and a dislocation density in the finer interiors is built which allows for the subsequent continuous nucleation, propagation and annihilation of dislocations carrying the imposed strain under the plateau of the oscillating flow stress. The traffic of dislocation lines inside the fibers lefts a continuously increasing density of point defects in their volume. The fiber walls retain, remarkably, its axial orientation in the deformation range explored.
The evolution of the total volume strain as a function of the total or the plastic axial tensile strain has been obtained from the evolution of the dimensions of the cuboid cells (from an initial volume to a final one ; the plastic volume strain is obtained by removal of the elastic volume strain as
The elastic behavior of our nanostructured samples is visibly non-linear because of their high yield and flow stresses; the instantaneous elastic volume strain has been obtained from a fitting, with a third order polynomial, of the initial elastic volume strain vs. hydrostatic stress curves in the 0 6.5 GPa range; the plastic strain-induced change of the bulk modulus beyond the initial relaxed structure has been neglected.
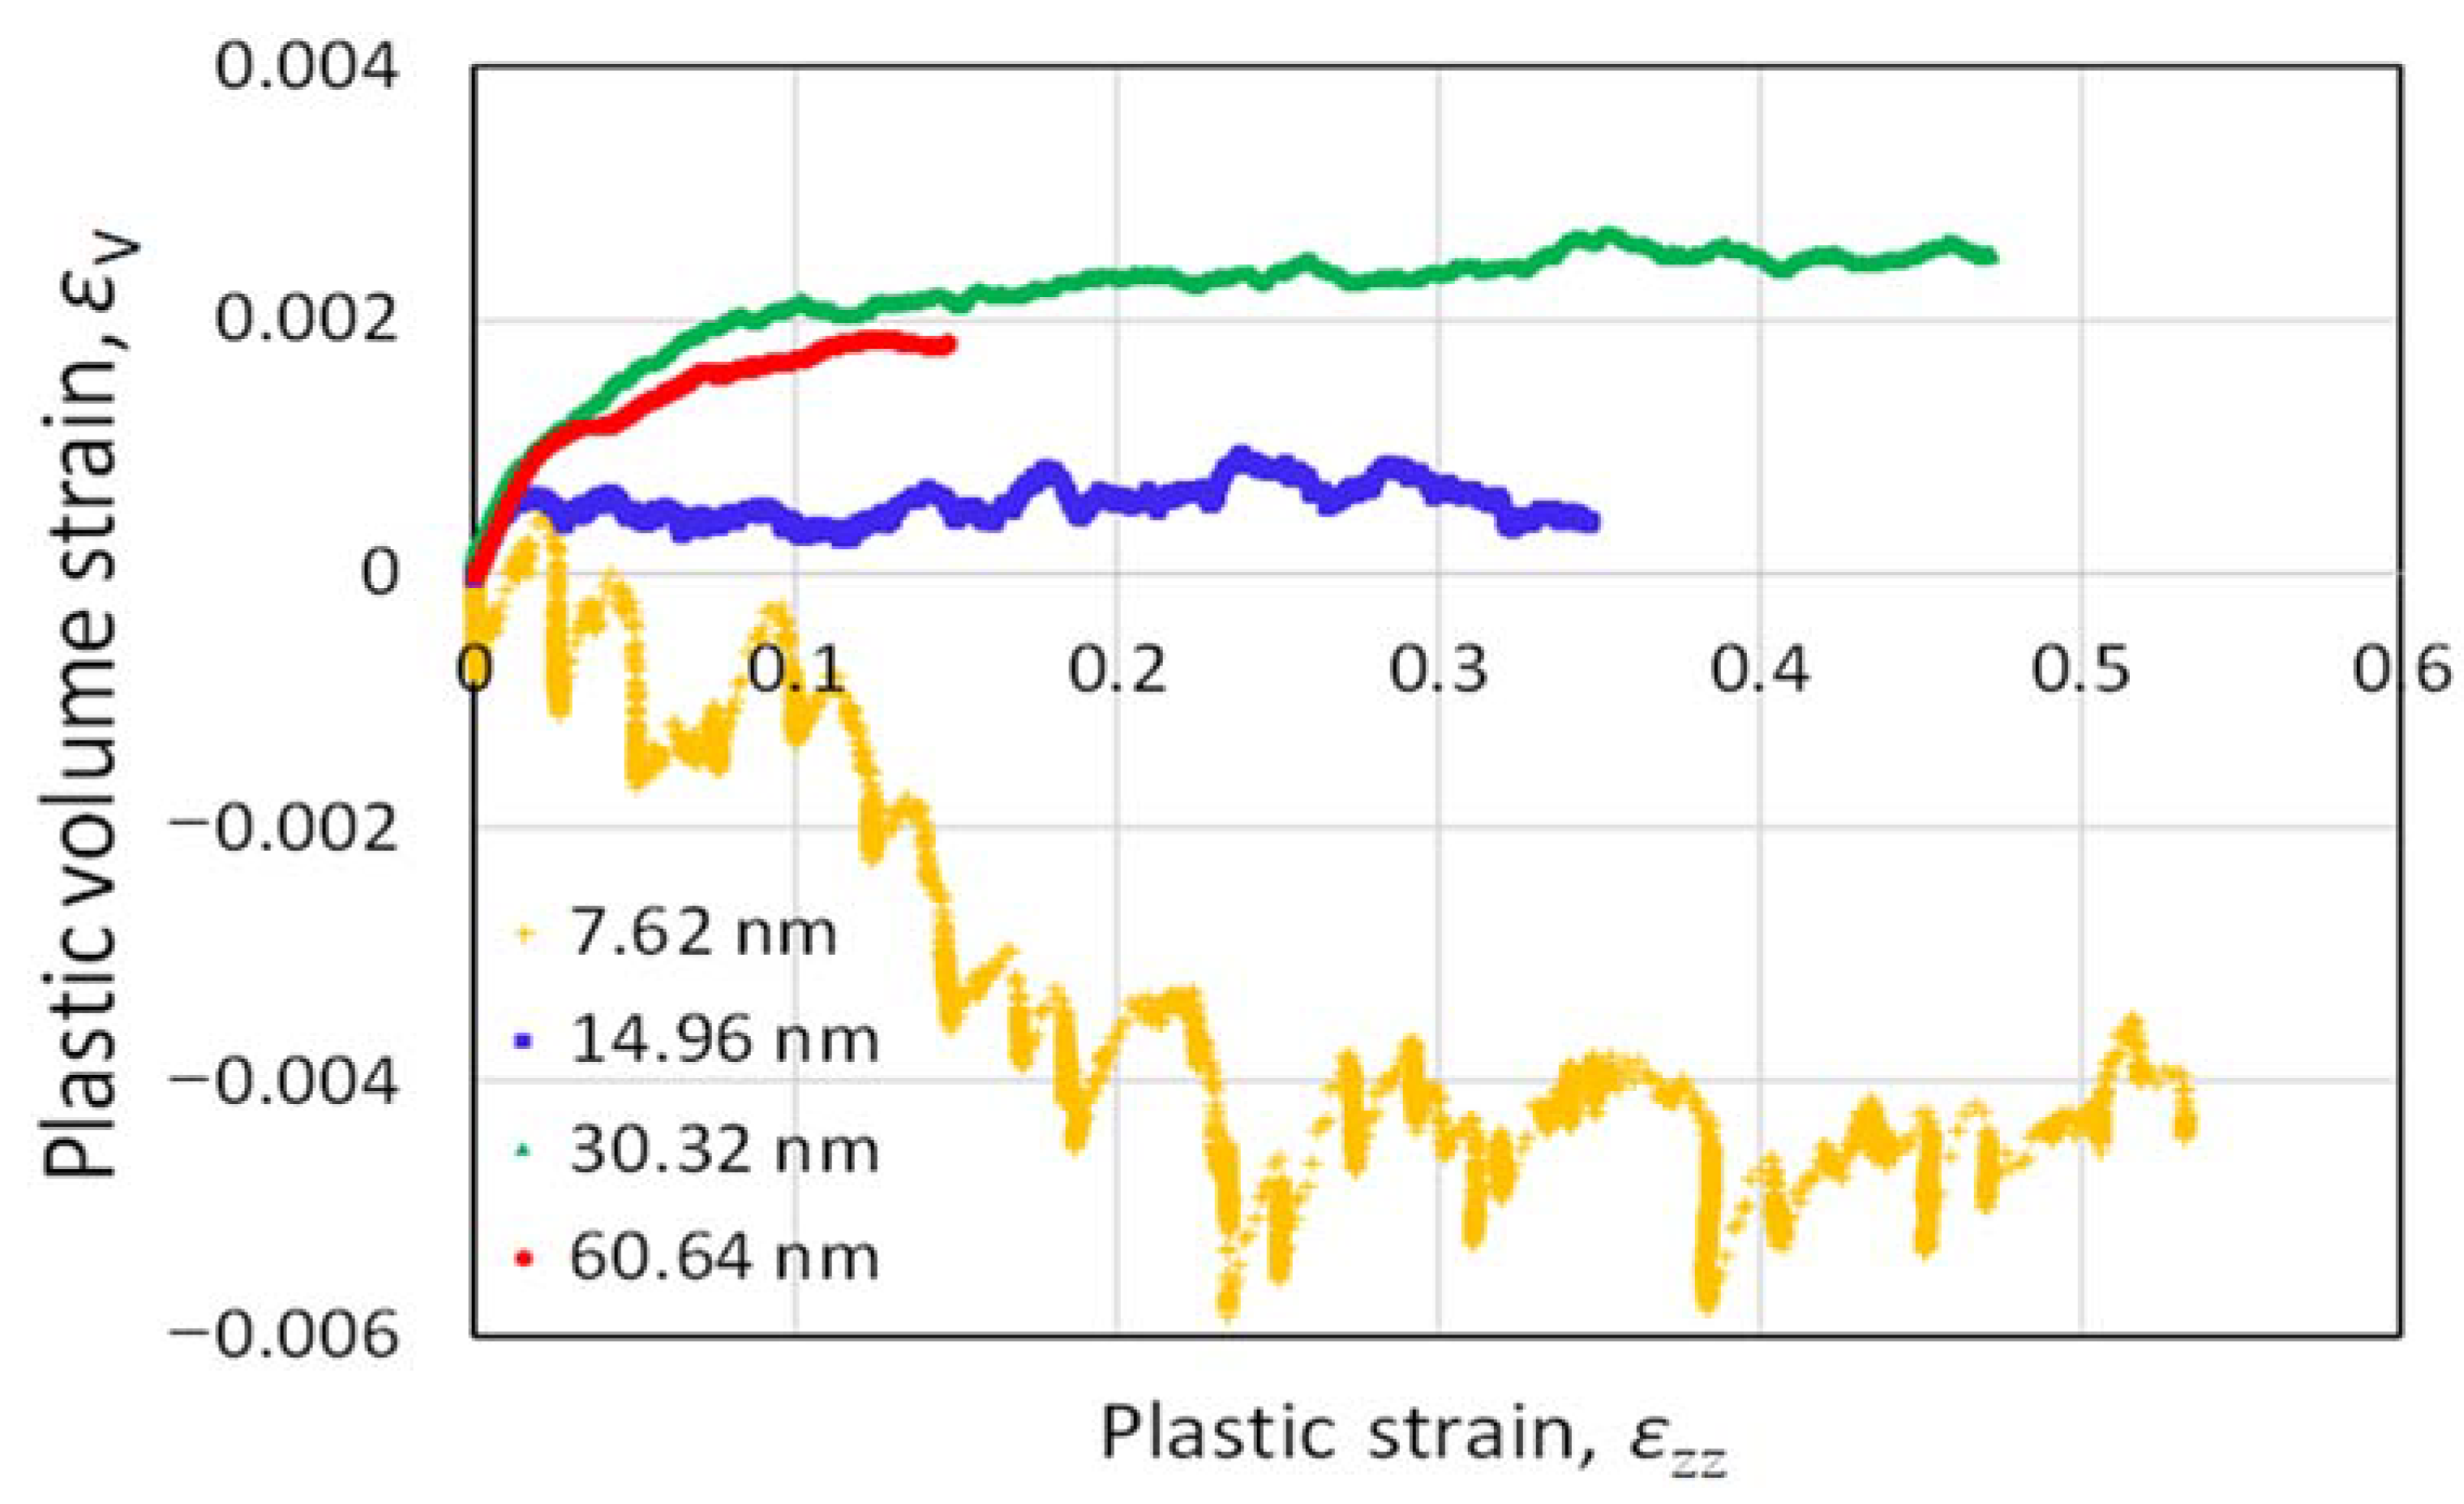
Figure 2 shows the progress of the plastic volume strain as a function of the plastic tensile deformation. The rate of volume change is high during the first ~10% plastic deformation and continues at a low pace thereafter; note that the first ~10% deformation represents a transient in the stress–strain behavior too [10,11]. A distinct size dependence (a transition from dilation for the larger grain sizes to contraction for the smaller grain size) is observed.
3. Discussion
At first sight the observed behavior may be surprising, but it can be understood bearing in mind both; the initial volume strain of the samples relative to the unstressed perfect lattice and the subsequent structural changes induced by plastic deformation.
3.1. Initial Volume Strain of the Samples
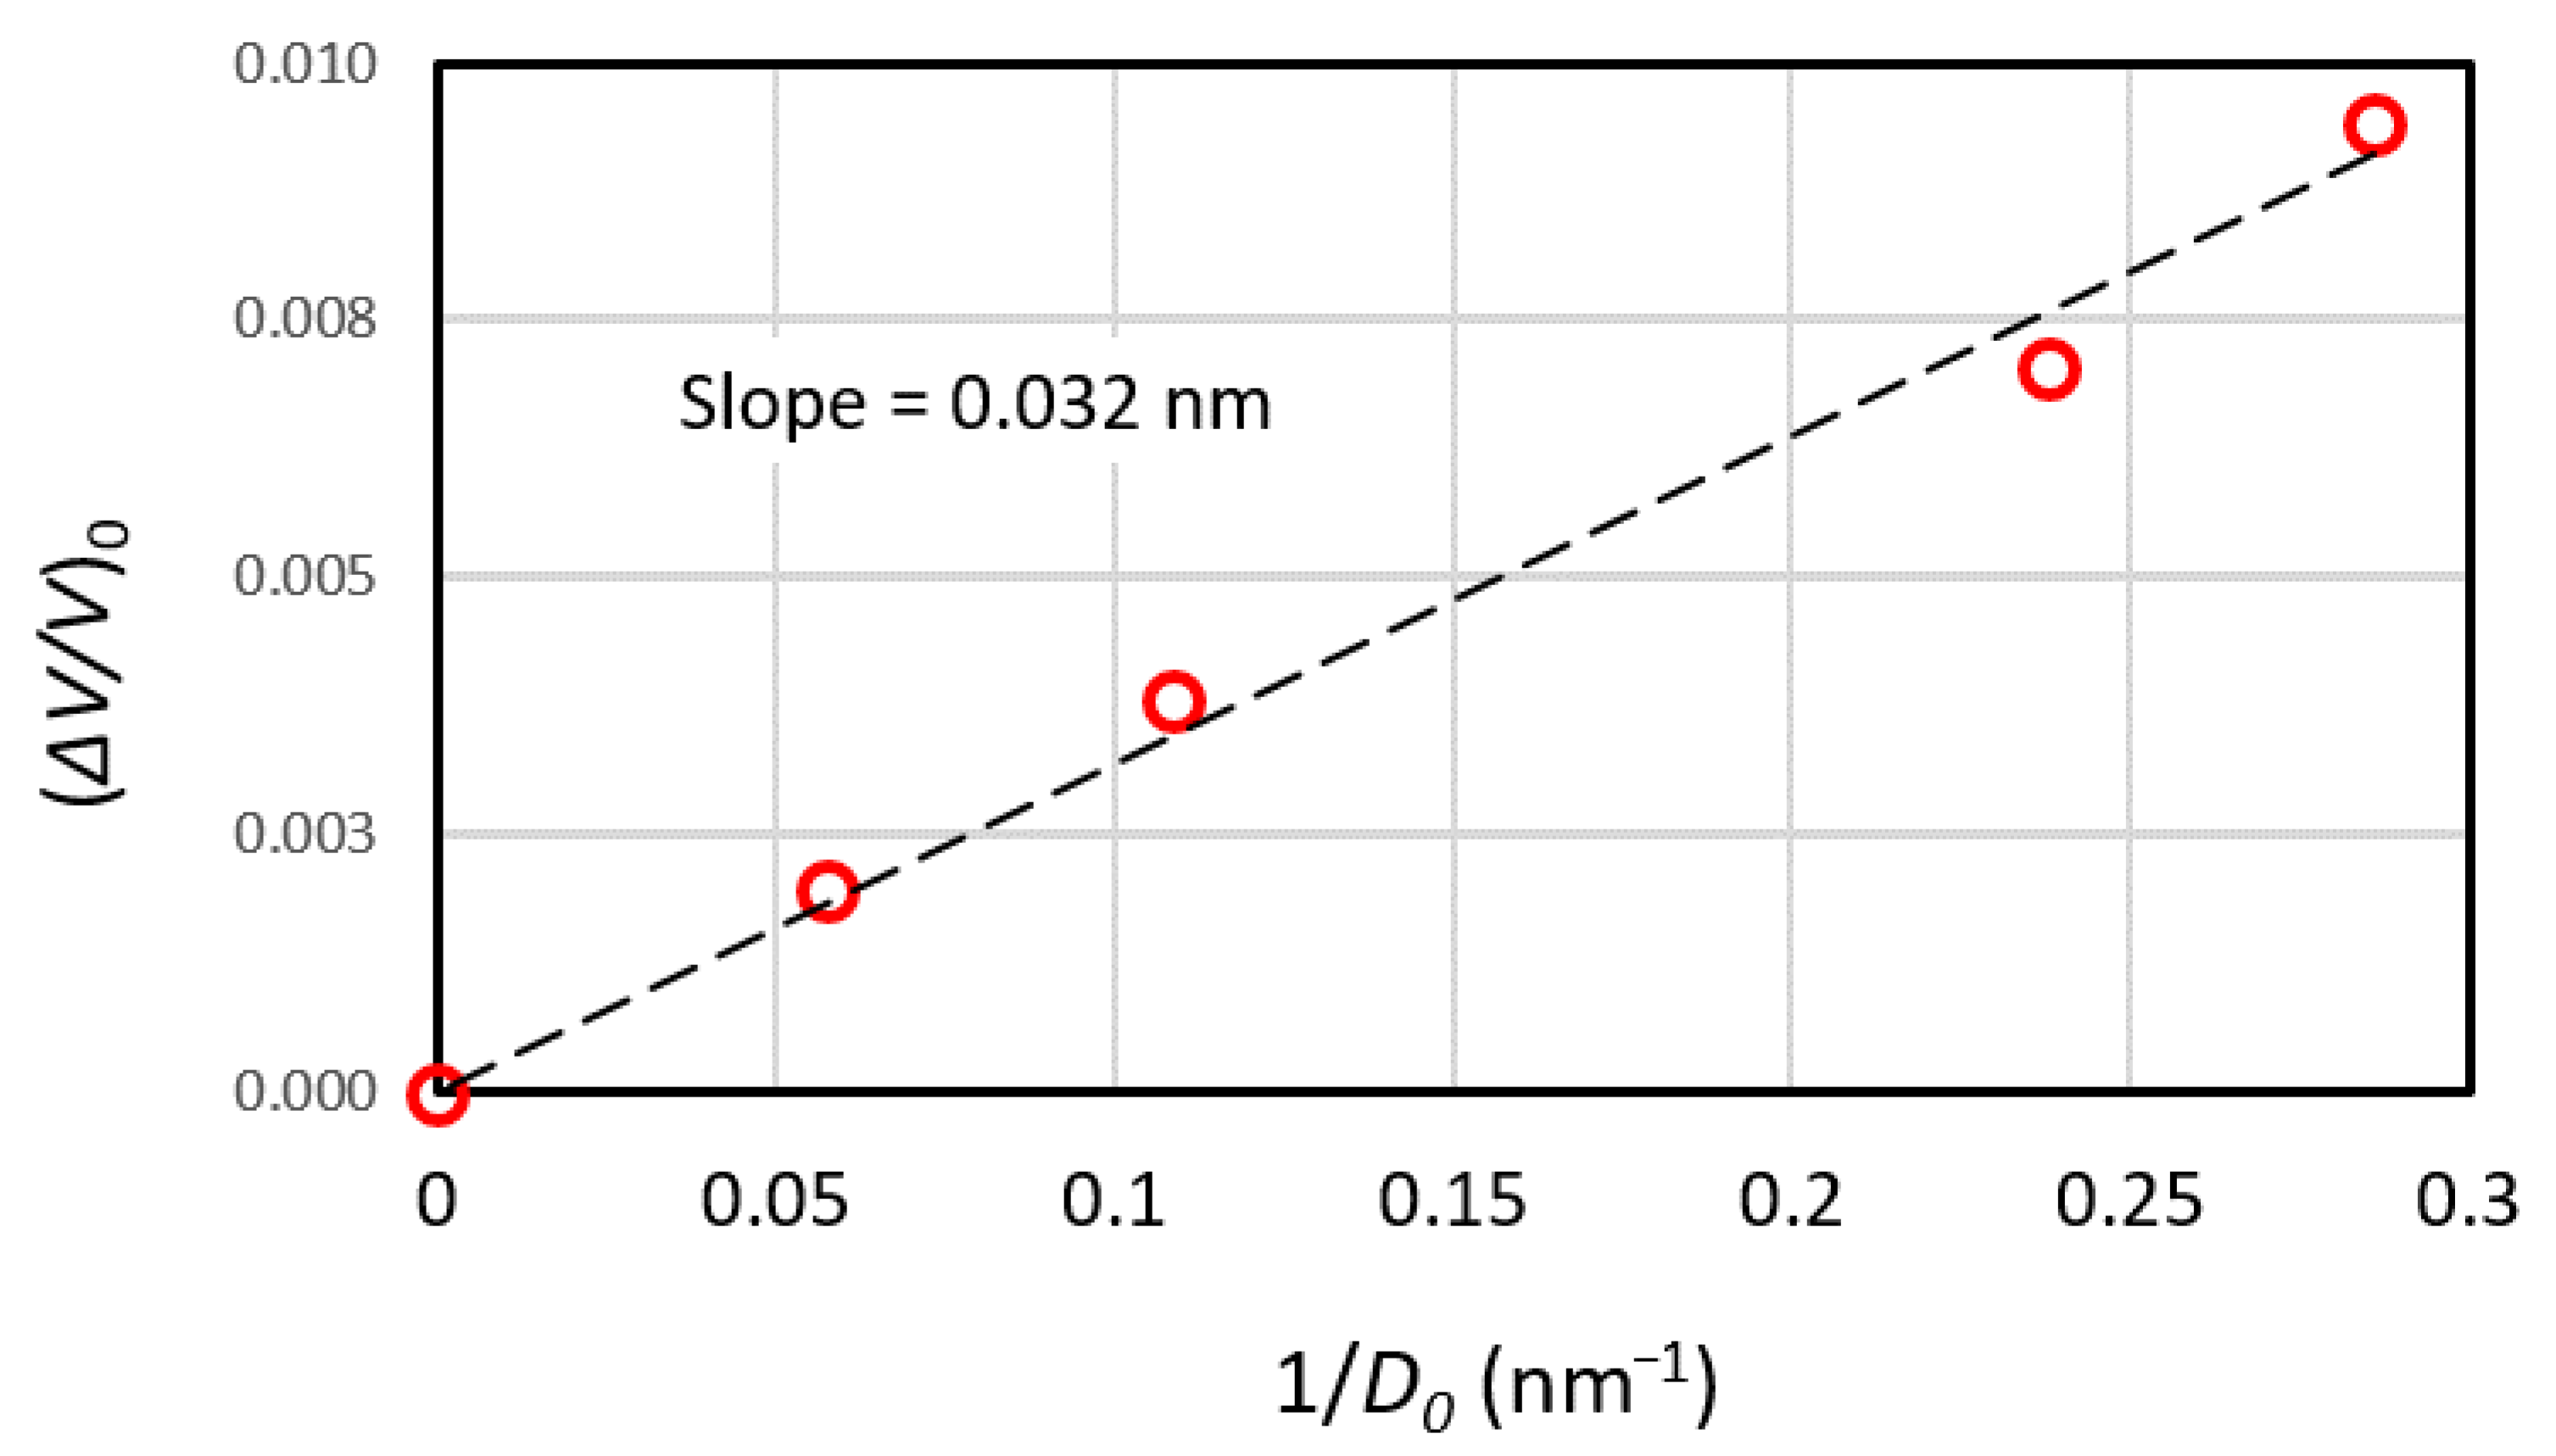
Figure 3 shows the volume increase of the four columnar samples relative to the sample with a perfect lattice. It bears a linear relationship with the inverse of the grain size of the fibers, , measured as the mean random linear intercept on their cross-section, i.e., a proportionality with the surface per unit volume of tilt walls, , because
is an exact stereological relationship for an aligned structure [13]. Assuming all the volume change of the nanostructured columnar samples are attributable to the fiber walls (i.e., neglecting the contribution of triple edges and other possible present lattice defects), the slope in Figure 3 represents an average excess volume for the relaxed tilt boundaries that amounts to = 0.016 nm, in good agreement with published experimental or calculated values (e.g., Table 2 in ref. [10]). Re-plotting now in Figure 4 the results of Figure 2 but taking into account the initial excess volume of the samples seen in Figure 3, the pattern of plastic volume strains is easily understandable: The dynamic evolution of plastic volume strains stems from the superposition of several size-dependent processes of structural alterations.
3.2. Active Plastic Deformation Mechanisms
Plastic deformation of our nano-grain αFe at 300 K and 108 s−1 is mediated by dislocation glide, by shear-coupled tilt GB migration (SCM) and, possibly, by grain boundary slip (GBS) too. We did not observe any contribution from deformation twinning. Dislocations are intermittently emitted from non-repetitive GB sources, they glide inside the grain interiors and they are received on the surrounding fiber boundaries; dislocation glide is the main contribution to axial elongation of our structures. SCM of the perfectly oriented tilt boundaries of our columnar structure cannot contribute to its axial elongation (it only furnishes planestrain on the cross-section, letting invariant the length in the axial direction). However, it contributes to the redundant deformations necessary for compatible deformation of neighboring fibers (relevant for the elongation of bcc polycrystals with random fiber texture, which induces the well-known “curling” of the fiber grains in their cross-section after large strains [14]). The same considerations apply to grain boundary slip, GBS (kinematically it is a limit case of SCM). In a polycrystal, although both SCM and GBS are hindered by the edges and corners of the grain structure, these two mechanisms can cooperate for allowing some strain-induced displacement of grain boundaries, i.e., to dynamic recovery (some annihilation of GB surface).
3.3. Expected Plastic Volume Strain Contributed by Strain-Induced Changes of GB Surface
Assuming homogeneous deformation of the grain structure, there would be a trivial increase of because of the imposed elongation strain, i.e., there would be a positive contribution to the plastic volume strain from the imposed macroscopic shape change in the absence of other effects. With respect to the initial state, the GB surface per unit volume would change as
If the initial GB structure were invariant to the distortion, considering Equation (1) the homogeneous strain contribution to plastic volume strain would be
The initial grain size in the cross-section is and Ω is the average excess-volume of the GB (assumed, for the moment, constant). However, the evolution of the GB inter-fiber surface density and structure is not a mere homogeneous distortion: The specific surface may change because of both, the activity of SCM and GBS processes, and the creation of new boundaries; moreover, the boundary structure is modified by incorporation of gliding dislocation lines. We pass to comment on these effects below.
The results of our MD simulations show a decrease of as deformation proceeds, much more marked for the sample with the smallest grain size (Figure 5). Such size-dependency is quite understandable, at least qualitatively, because the strain contribution of GB processes, ignoring the hindering effect of grain edges, is proportional to the specific volume swept by mobile GB per unit elongation strain, itself proportional to . We can thus explain the strong volume contraction experienced by the sample of smallest size during its initial deformation stage: For this sample, the elimination of excess volume associated with the eliminated GB density is able to defeat the increase from the homogeneous distortion and from other effects. The opposite appears to occur for the samples of larger sizes. An elimination of 50% of the initially present GBs (or less, if the elimination were selective, preferring the GB possessing larger excess volume) would justify the contraction of the sample of smallest size.
Apparently, in our unidirectional deformation simulations the GB structure and density attain a steady-state after 10% or 20% deformation; any important developments, like the creation of new fiber walls, are absent thereafter. The creation of new GB at large strains in deforming crystals of conventional size is due to the formation of dislocation walls from dislocation tangling inside the grains and their progressive transformation in GB by dynamic recovery; however, for a similar dislocation density, the frequency of dislocation interactions is small in nanograins with respect to large size grains, which might explain why we have not observed a build-up of new GB in our simulations. It seems we can thus discard, here, the contribution from this source to plastic volume strain.
3.4. Volume Variation from Strain-Induced Changes of the GB Structure
The strain-induced modification of the excess volume of the relaxed GB by incorporation of gliding dislocation lines may be important. The inter-fiber pristine walls become loaded with defects, residues from reactions with dislocation segments that give way to GB dislocations. Some of them move on the wall and, after perhaps reacting with other GB defects, become sources for emission of lattice dislocation lines into the neighboring fiber (in general, because of the crystallographic mismatch, direct crossing of high-angle boundaries by dislocations is not possible). Thus, as strain goes on, the walls become loaded with lattice (extrinsic) dislocation segments stuck on them plus several possible GB defects, as steps, and different types of GB (intrinsic) dislocations, until a dynamic steady-state balancing the dislocation reception/emission is reached. We can make a rough upper-bound estimation of the effect of dislocation trapping on the inter-fiber GB by assuming the walls were totally non-penetrable and neglecting any dynamic recovery processes near to or in the boundaries, as follows. Assuming cylindrical fibers of instantaneous diameter D (the grain size in the cross-section) with walls non-penetrable by dislocation lines, if the effective inclination of the slip planes with the fiber axis is , the volume dislocation density due to the dislocation storage on the inter-fiber GB, , evolves as
The factor 2 stems from the wall receiving dislocation lines gliding in the two neighboring fibers sharing a GB; is the orientation factor. Assuming and an excess volume due to dislocations ΔV/V0 0.5b2ρ (see Vetter et al. [15] and references therein),
For small strains, Equation (6) represents a dilatation two orders of magnitude larger than that given by Equation (4) due to the GB increase by mere homogeneous elongation. Although Equation (6) is an upper-bound estimation, it suggests that the strain-induced structural changes of the GB play an important role in the volume changes associated with the initial stage of plastic deformation of nanostructured materials.
3.5. Effect of the Dislocation Density Stored inside the Fibres
Finally, let us consider the volume strain contributed by the dislocation density stored inside the grains as the total strain goes on.
As mentioned above, the volume expansion related to the presence of a dislocation density in a crystal is ΔV/V0 0.5b2ρ. The evolution with strain of the dislocation density inside the fiber grains was measured for the sample of = 30.3 nm initial length [11]; it rapidly grows during the initial deformation stage but appears to saturate early when reaching 2 × 10¹⁶ nm−2 (Supplementary material Figure S1 and Table S1). Such dislocation density is of the order of the maximum densities reported after very large strains of metallic crystals, of αFe in particular; only after the passage of shock wave fronts higher dislocation density levels are observed in MD simulations ( ~1018 nm−2), but they swiftly decay to ~1016 nm−2 after relaxation (see [16] and references therein). This is a high dislocation density for polycrystals of conventional grain size; however, its contribution to the observed plastic volume changes would be very small, 0.0003 (see Figure 4).
3.6. Effect of the Density of Point-Like Defects Induced by Plastic Strain
Lastly, from our simulations we have obtained some information on the relevance of the continuous production and accumulation of point-defects on the plastic volume strain during dislocation-mediated deformation. Using the point-counting method of quantitative metallography, we have measured the evolution of the volume density of point-defects inside the grains of 100 nm thick slices of the sample of = 30.3 nm initial length in the range of deformation covered in the MD simulations (Supplementary material Figure S1 and Table S2). The point-like defects are uniformly distributed in the volume and their density steadily increases as deformation increases, as expected from their alleged origin: Vacancy formation from debris left by gliding of dislocation lines containing jogs produced by interaction with other non-coplanar dislocation lines and, in our case of very high strain rate deformation of α-iron at 300 K (mainly by self-pinning of gliding screw dislocation lines), roughened by the mechanism dubbed cross-kinking (without any interaction with other dislocation lines [17,18]). Assuming a free-volume per point-like defect counted, we estimate only a weak constant dilatation rate from this contribution to plastic volume strain, compatible with the rate shown by our samples at large strains, Figure 4. Severe plastic deformations (an order of magnitude larger than 0.5) would be needed for this effect to be relevant.
4. Conclusions
Our analysis of the plastic volume strains occurring in dislocation-mediated plastic deformation of crystalline solids, although based on results from MD simulations of a polycrystal with a simple nano-fibered structure of textured grains, allows for deducing some general conclusions together with, obviously, other conclusions solely applying to the material, structure and deformation conditions studied (αFe deformed at 300 K and 108·s−1):
In general:
- Dislocation-mediated plastic deformation of crystalline solids is not strictly volume-invariant. The structural changes inherent to it imply plastic volume strains (i.e., these volume strains are practically driven by the applied strain, at least at low temperature of deformation).
- As several structural items are simultaneously and independently being affected by plastic strain, the observed plastic strains are dependent on the initial material structure and can be complex (e.g., dilations or contractions, with transitions from rapid to slow variation with respect to the applied strain).
- The magnitude of the plastic volume strains will be very small but for initially nanostructured polycrystals or, for materials with conventional grain size, only after severe plastic deformations. Even for the latter materials or strains their magnitude will only be of the order of 10−2.
- The most obvious structural items involved in plastic volume changes are the density and structure of grain boundary surfaces and the densities of dislocations and point-defects. The strain-induced changes of the first two of them are grain size-dependent and relevant for nanograin materials and small plastic strains of the order of 10%. The effect of an increasing density of dislocations at low temperature deformation will be of minor importance (a saturation density is approached at moderate strains); the increasing density of point defects may be relevant after severe plastic strains (as supported by published experimental measurements).
In particular, in our simulations of axial elongation of nano-fibered αFe:
- We have observed a transition from dilation to contraction for grain size (fiber cross-section) smaller than 15 nm. The transition occurs when the annihilation of grain boundaries by SCM compensates for both, the boundary surface density increase associated to the shape change of the fibers and the progressive transformation of the GB structures by dislocation capture and emission (creation of new boundaries by dislocation tangling and dynamic recovery deemed to be insignificant in our particular structure). For equiaxed nanograin structures the transition is expected to occur for larger grain sizes, our combination of geometry of the structure with the chosen strain path does not favors the effectivity of SCM processes.
- The combined effects of strain-induced changes of GB surface density an GB structure are rapid in the first 10% elongation. A near-steady-state develops beyond such deformation where a weak dilation is observed to remain, compatible with the contributions of dislocation and point-defect densities to volume strain.
Supplementary Materials
The following are available online at https://www.mdpi.com/2075-4701/10/12/1649/s1, Sample of initial length (L0)z = 30.3 nm. Figure S1: Contribution of point defects and dislocation density to volume deformation as a function of plastic elongation, Table S1: DISLOCATIONS. Data from measurements of dislocation density ρ inside the grains, Table S2: POINT DEFECTS. Data from measurements of point defects density NV inside the grains.
Author Contributions
Conceptualization, supervision and original draft, J.G.S.; methodology, analysis, final writing and editing, J.G.S. and J.A.; resources, software and data curation, I.A. All authors have read and agreed to the published version of the manuscript.
Funding
This research received no external funding
Conflicts of Interest
The authors declare no conflict of interest.
References
- Cazacu, O.; Revil-Baudard, B.; Chandola, N. Plasticity-Damage Couplings: From Single Crystal to Polycrystalline Materials; Springer Int. Publishing: New York, NY, USA, 2019; Volume 253. [Google Scholar]
- Zehetbauer, M.J.; Steiner, G.; Schafler, E.; Korznikov, A.; Korznikova, E. Deformation induced vacancies with severe plastic deformation: Measurements and modelling. Mater. Sci. Forum 2006, 503–504, 57–64. [Google Scholar] [CrossRef]
- Oberdorfer, B.; Lorenzoni, B.; Unger, K.; Sprengel, W.; Zehetbauer, M.J.; Pippan, R.; Würschum, R. Absolute concentration of free volume-type defects in ultrafine-grained Fe prepared by high-pressure torsion. Scr. Mater. 2010, 63, 452–455. [Google Scholar] [CrossRef] [PubMed] [Green Version]
- Cízek, J.; Janecek, M.; Krajnak, T.; Straska, J.; Hruska, P.; Gubicza, J.; Kim, H.S. Structural characterization of ultrafine-grained interstitial-free steel prepared by severe plastic deformation. Acta Mater. 2016, 105, 258–272. [Google Scholar] [CrossRef]
- Cízek, J.; Janecek, M.; Vlasák, T.; Smola, B.; Melikhova, O.; Islamgaliev, R.K.; Dobatkin, S.V. The development of vacancies during severe plastic deformation. Mater. Trans. 2019, 60, 1533–1542. [Google Scholar] [CrossRef] [Green Version]
- Gubicza, J. Lattice defects and their influence on the mechanical properties of bulk materials processed by severe plastic deformation. Mater. Trans. 2019, 60, 1230–1243. [Google Scholar] [CrossRef] [Green Version]
- Hochrainer, T.; Weger, B. Is crystal plasticity non-conservative? Lessons from large deformation continuum dislocation theory. J. Mech. Phys. Solids 2020, 141, 103957. [Google Scholar] [CrossRef]
- LAMMPS Molecular Dynamics Simulator. Available online: http://lammps.sandia.gov (accessed on 7 November 2020).
- Mendelev, M.I.; Han, S.; Srolovitz, D.J.; Ackland, G.J.; Sun, D.Y.; Asta, M. Development of new interatomic potential appropriate for crystalline and liquid iron. Philos. Mag. 2003, 83, 3977–3994. [Google Scholar] [CrossRef]
- Gil Sevillano, J.; Aldazabal, I.; Luque, A.; Aldazabal, J. Atomistic simulation of the elongation response of a <011> oriented columnar nano-grain polycrystalline sample. Meccanica 2016, 51, 401–413. [Google Scholar] [CrossRef] [Green Version]
- Aldazabal, J.; Aldazabal, I.; Gil Sevillano, J. Elasto-plastic behaviour of a columnar structure of nanocrystalline iron with sharp <011> texture. Materialia 2018, 2, 218–230. [Google Scholar] [CrossRef]
- Stukowski, A. OVITO. The Open Visualization Tool. Model. Simul. Mater. Sci. Eng. 2010, 18, 015012. Available online: https://ovito.org/ (accessed on 7 November 2020). [CrossRef]
- Underwood, E.E. Quantitative Stereology; Addison-Wesley Publ.: Boston, MA, USA, 1970. [Google Scholar]
- Gil Sevillano, J.; González, D.; Martínez-Esnaola, J.M. Heterogeneous deformation and internal stresses developed in BCC wires by axisymmetric elongation. Mater. Sci. Forum 2007, 550, 75–84. [Google Scholar] [CrossRef]
- Vetter, R.; Fasteanau, R.H.J.; Baskes, M.I. Atomistic computer calculation of the dilatation caused by a <111> (110) edge dislocation in molybdenum. Phys. Stat. Sol. A 1981, 67, 585–589. [Google Scholar] [CrossRef]
- Gil Sevillano, J. On the limits of strain hardening by plastic deformation. In Proceedings of the International Symposium on Plastic Deformation and Texture Analysis, Alcoi, Spain, 24–25 September 2012; Amigó Borrás, V., Ed.; Editorial Univ. Politécnica de Valencia: Valencia, Spain, 2012; pp. 25–36. Available online: https://riunet.upv.es/handle/10251/21023 (accessed on 7 November 2020).
- Marian, J.; Cai, W.; Bulatov, V.V. Dynamic transitions from smooth to rough to twinning in dislocation motion. Nat. Mater. 2004, 3, 158–163. [Google Scholar] [CrossRef] [PubMed]
- Dutta, A. Compressive deformation of Fe nanopillar at high strain rate: Modalities of dislocation. Acta Mater. 2017, 125, 219–230. [Google Scholar] [CrossRef]
Figure 1.
(a) the ideal initial (unrelaxed) structure of the largest sample and (b) a partial view of it after relaxation at 300 K with atoms depicted according to a coordination code, bcc atoms made invisible [12]. (c) a top view of the four samples (in order of increasing size); relaxed state with bcc atoms made invisible (the size of figures has been normalized).

Figure 2.
Plastic volume strain as a function of the plastic elongation (logarithmic strains) of the four samples (their initial axial lengths are indicated in the figure).
Figure 2.
Plastic volume strain as a function of the plastic elongation (logarithmic strains) of the four samples (their initial axial lengths are indicated in the figure).

Figure 3.
Relative volume increase of oriented fibered structures with respect to the perfect lattice volume as a function of inverse of their grain size (, relaxed state). Grain size measured as mean linear intercept in the cross-section of the columnar samples.
Figure 3.
Relative volume increase of oriented fibered structures with respect to the perfect lattice volume as a function of inverse of their grain size (, relaxed state). Grain size measured as mean linear intercept in the cross-section of the columnar samples.

Figure 4.
Evolution of the volume strain of the samples relative to the perfect crystal volume (their initial axial lengths are indicated in the figure). The contribution from changes of density of dislocations and point defects inside the grains of the sample of initial length = 30.3 nm is shown in the figure too (see Supplementary Material).

Figure 5.
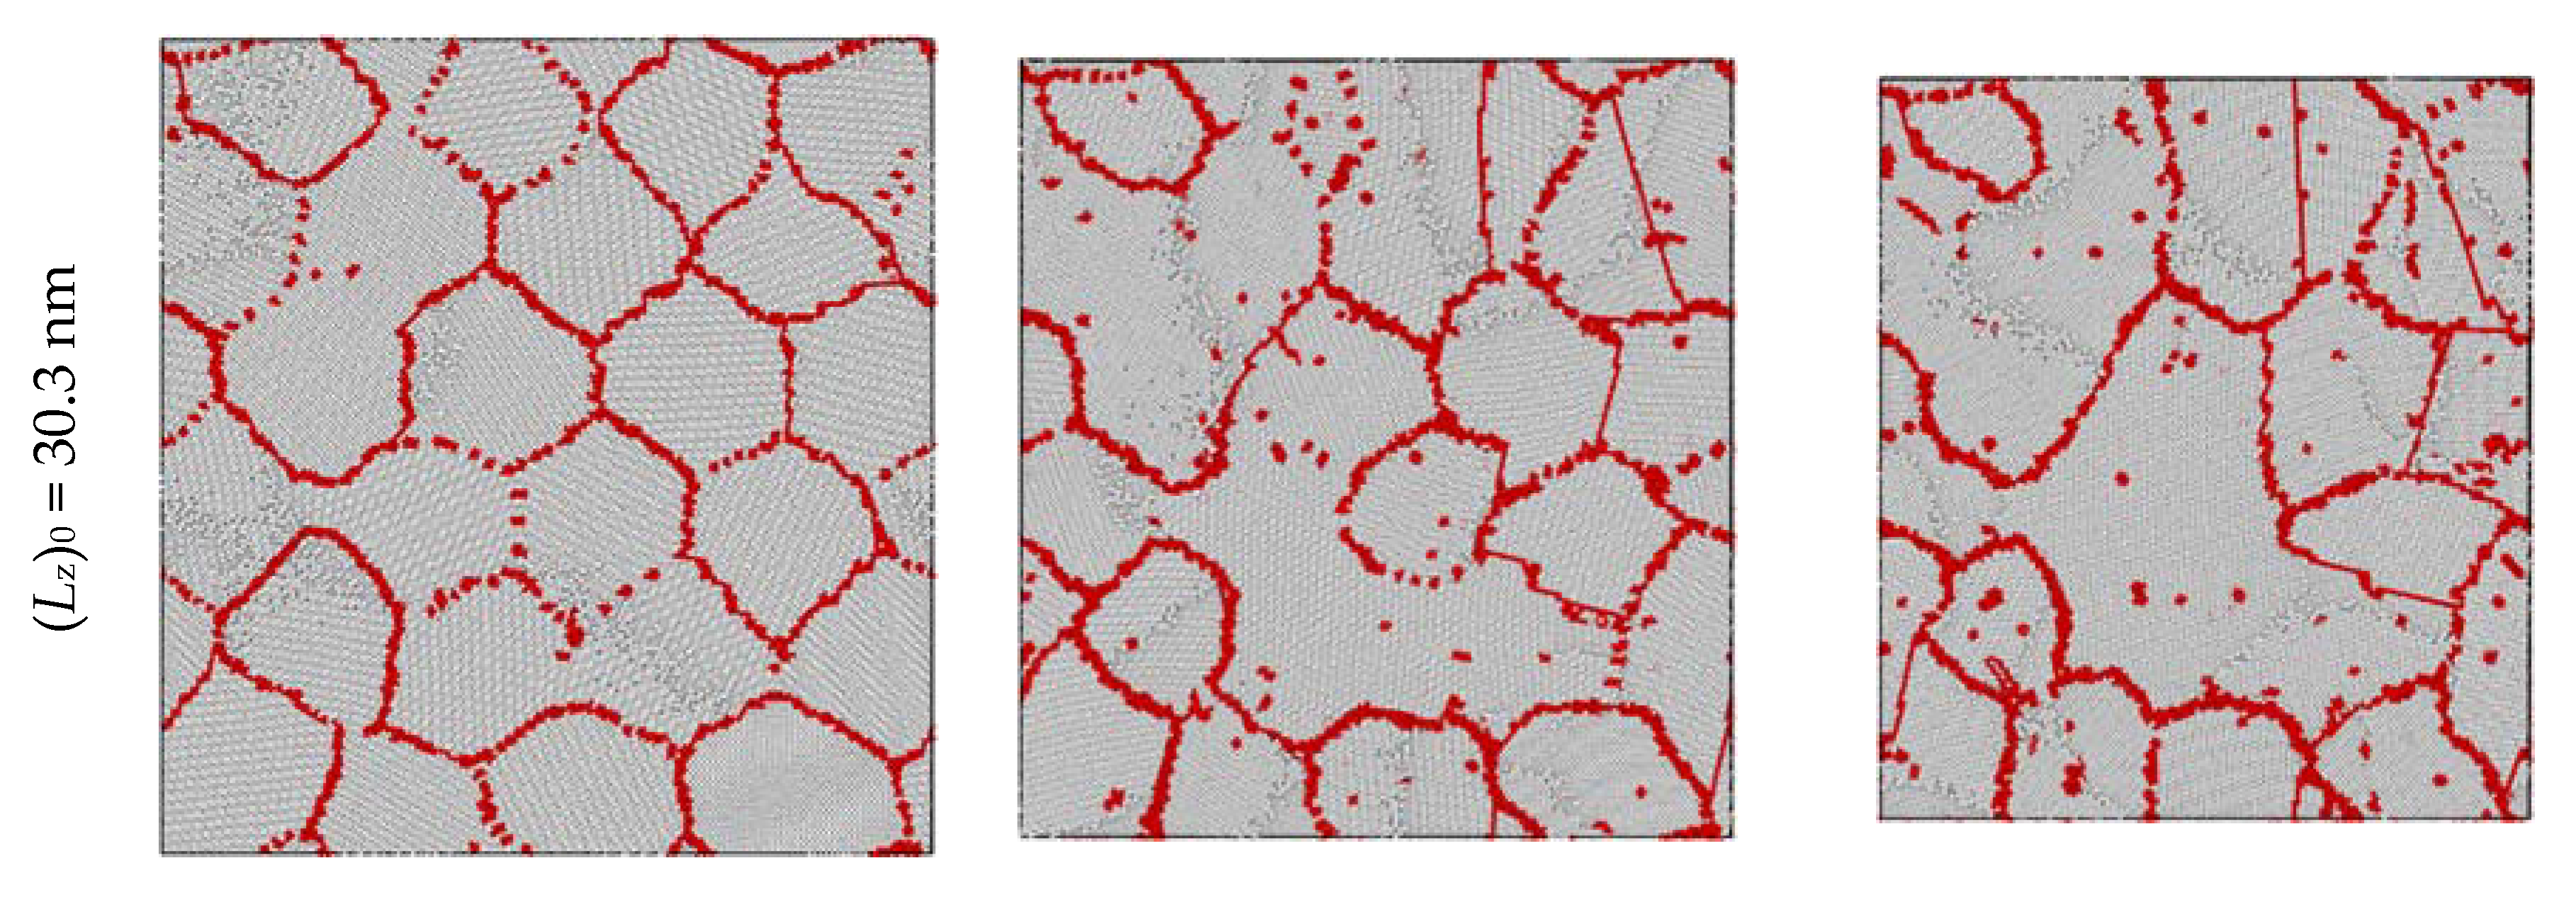
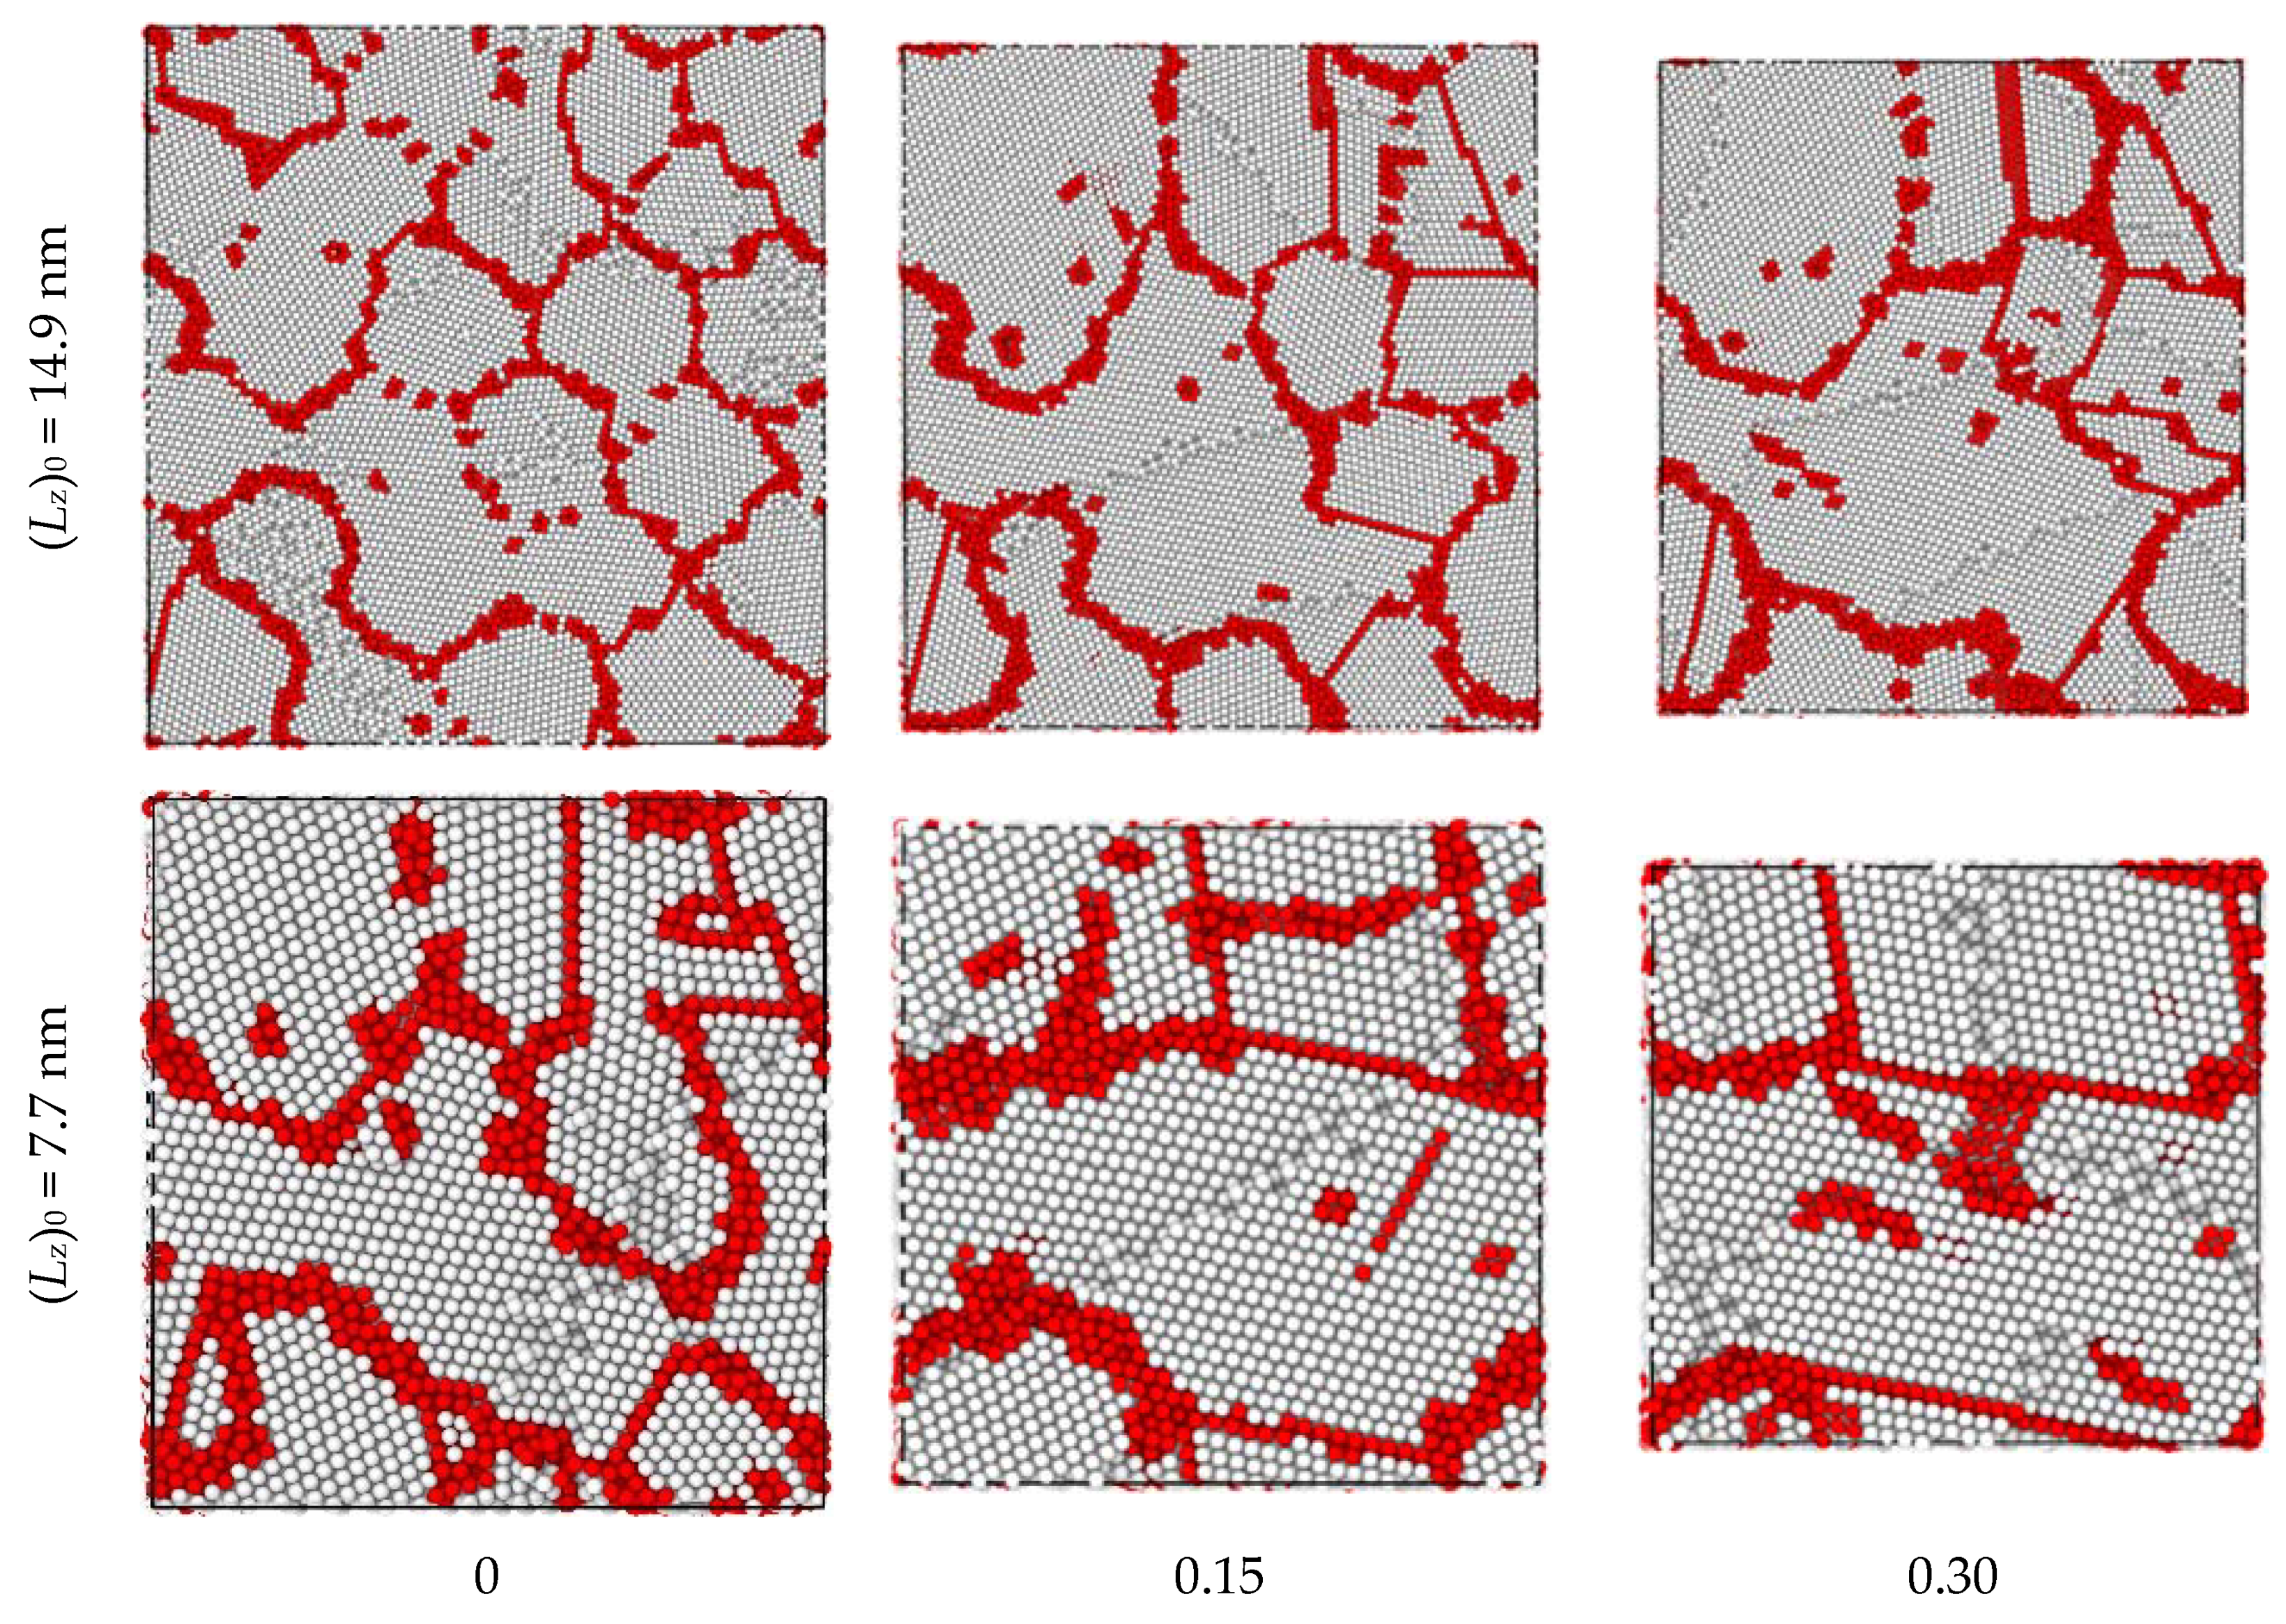
Sections of samples of initial length 30.3, 14.9 and 7.7 nm at three deformation levels. Main structural changes (dissolution of subgrain boundaries, wall annihilation by GB migration shear-coupled tilt GB migration (SCM) and increased presence of low-energy twin boundaries by grain rotation) occur for deformations smaller than 0.15.
Figure 5.
Sections of samples of initial length 30.3, 14.9 and 7.7 nm at three deformation levels. Main structural changes (dissolution of subgrain boundaries, wall annihilation by GB migration shear-coupled tilt GB migration (SCM) and increased presence of low-energy twin boundaries by grain rotation) occur for deformations smaller than 0.15.


Table 1.
Data of molecular dynamics (MD) calculation cells after 298 K relaxation.
| Cell Dimensions, nm | Grain Size, nm | N° Atoms in Cell | ||
|---|---|---|---|---|
| (Lx)0 | (Ly)0 | (Lz)0 | D0 (st. dev) | N |
| 9.58 | 10.11 | 7.68 | 3.5 (0.6) | 63061 |
| 19.6 | 20.7 | 14.96 | 4.8 (0.6) | 515151 |
| 39.54 | 41.89 | 30.32 | 9.2 (0.9) | 4282650 |
| 79.52 | 84.25 | 60.64 | 17.4 (1.5) | 34703100 |
| 40.02 | 42.45 | 30.32 | Single crystal | 4410000 |
Publisher’s Note: MDPI stays neutral with regard to jurisdictional claims in published maps and institutional affiliations. |
© 2020 by the authors. Licensee MDPI, Basel, Switzerland. This article is an open access article distributed under the terms and conditions of the Creative Commons Attribution (CC BY) license (http://creativecommons.org/licenses/by/4.0/).
Share and Cite
MDPI and ACS Style
Gil Sevillano, J.; Aldazabal, I.; Aldazabal, J. Plastically-Induced Volume Deformation of Nanocrystalline α-Fe with a <110> Columnar Structure. Metals 2020, 10, 1649. https://doi.org/10.3390/met10121649
AMA Style
Gil Sevillano J, Aldazabal I, Aldazabal J. Plastically-Induced Volume Deformation of Nanocrystalline α-Fe with a <110> Columnar Structure. Metals. 2020; 10(12):1649. https://doi.org/10.3390/met10121649
Chicago/Turabian StyleGil Sevillano, J., I. Aldazabal, and J. Aldazabal. 2020. "Plastically-Induced Volume Deformation of Nanocrystalline α-Fe with a <110> Columnar Structure" Metals 10, no. 12: 1649. https://doi.org/10.3390/met10121649
Note that from the first issue of 2016, this journal uses article numbers instead of page numbers. See further details here.