Optimization of Niobium Content in Direct Quenched High-Strength Steels


Materials and Mechanical Engineering, Faculty of Technology, University of Oulu, P.O. Box 4200, 90014 Oulu, Finland
*
Author to whom correspondence should be addressed.
Metals 2020, 10(6), 807; https://doi.org/10.3390/met10060807
Submission received: 22 May 2020
/
Revised: 5 June 2020
/
Accepted: 15 June 2020
/
Published: 17 June 2020
(This article belongs to the Special Issue Microstructure Evolution and Mechanical Properties of Microalloyed Steels)
Abstract
:This paper focuses on understanding the effect of niobium content on the phase transformation behavior and resultant mechanical properties of thermomechanically rolled and direct-quenched low carbon steels containing 0.08 wt.% carbon. Investigated steels contained three different levels of niobium: 0, 0.02 and 0.05 wt.%. The continuous cooling transformation (CCT) diagrams covering cooling rates in the range 3–96 °C/s constructed based on the dilatometer studies showed only a minor effects of Nb on the phase transformation characteristics. In addition, experiments were performed for reheating and soaking the slabs at 1050–1200 °C and the results revealed that for these low-carbon steels, Nb failed to prevent the austenite grain growth during slab reheating. In the case of hot rolling trials, two different finish rolling temperatures of 820 °C and 920 °C were used to obtain different levels of pancaking in the austenite prior to direct quenching. The resultant microstructures were essentially mixtures of autotempered martensite and lower bainite imparting yield strengths in the range 940–1070 MPa. The lower finish rolling temperature enabled better combinations of strength and toughness in all the cases, predominantly due to a higher degree of pancaking in the austenite. The optimum level of Nb in the steel was ascertained to be 0.02 wt.%, which resulted not only in marginally higher strength but also without any significant loss of impact toughness.
1. Introduction
The use of high-strength steel is continuously growing due to several benefits achievable compared to the traditional lower strength steel grades. In order to decrease the environmental burden in respect of ever-increasing greenhouse gases, high strength steel offers great possibilities, especially in the transportation industry. For instance, the use of high strength steels allows lightweight constructions of vehicles leading to lower fuel consumption and higher load capacity. In terms of producing high strength steels in the steel industry, the process of direct quenching can lead to the desirable combination of strength and toughness, combined with relatively low energy consumption, compared to the traditional reheating and quenching process. To achieve desirable properties, the use of microalloying, such as niobium, in direct quenched steels can be an efficient way. However, for example, the amount of microalloying or proper processing route to achieve the highest benefit of microalloying can be challenging and needs metallurgical understanding.
The purpose of this research study was to explore the possibilities for optimizing the strength-toughness balance of a potential low carbon (0.08 wt.%) structural steel, which is known to provide a good basis for tough, direct-quenched martensite [1]. In the case of direct quenching, enhanced strength together with good low temperature toughness can be obtained by straining the austenite, in the no-recrystallization regime below the recrystallization stop temperature (RST) prior to quenching [2]. In this way, the hardness of the transformed martensite exceeds the hardness achievable in the steel with the same carbon content after simply reheating and quenching [3,4]. Therefore, microalloying with different levels of niobium was chosen to raise the RST and enable the possibility of controlled rolling wider dimensional ranges thus providing adequate pancaking through reduced rolling loads [5,6]. Small additions of Nb in the steel are known to be beneficial for achieving a finer grain structure because of its ability to control the austenite grain size during slab reheating by the pinning effect of NbC precipitates, and also refining the grain size during subsequent deformation and recrystallization in the hot rolling stage [7,8]. In addition, the effect of niobium on hardenability is relevant in the case of direct quenching and has been investigated in this study by determining continuous cooling transformation (CCT) diagrams. It has been reported that Nb can improve hardenability in solid solution, but the formation of niobium-carbides, if any, can be counterproductive thus decreasing the hardenability [9,10]. For example, Carpenter et al. [11] showed that niobium as a solute strongly suppress the ferrite formation and shifts the nose of the ferrite curve to lower cooling rates in CCT diagrams. Therefore, as a processing point of view, it is important to maintain niobium in solution during slab soaking and hot rolling to ensure the effectiveness of niobium on hardenability. However, it is not fully understood the effectiveness of niobium on steels at the yield strength level of 1000 MPa or even higher.
2. Materials and Methods
The materials used in the present investigation were three low carbon (~0.08 wt.%) boron steels with different levels of Nb-microalloying containing high manganese and chromium contents to impart sufficient hardenability. The compositions studied covered niobium levels at 0, 0.025 and 0.05 wt.%. In addition, the boron level was maintained constant at about ~25 ppm in the three steels. Titanium and nitrogen contents were kept constant at approximately 170 and 23–30 ppm respectively. Table 1 gives the chemical compositions as determined using optical emission spectroscopy. The chosen compositions were vacuum-cast into approximately 70 kg slabs by the Tornio Research Centre of Outokumpu Oyj, Finland. Blocks of ~180 mm × 80 mm × 55 mm cut from the castings were soaked at 1250 °C for 2 h, thermomechanically rolled to approximately 6 mm thick plates according to the rolling schedule given in Table 2 and subsequently water quenched to room temperature at an average cooling rate of ~90 °C/s. Referring to Table 2, two different finish rolling temperatures (FRTs) of 820 °C (low) and 920 °C (high) were planned to achieve different levels of pancaking of the austenite prior to direct quenching to room temperature.
In order to construct the continuous cooling transformation diagrams (CCT) diagrams, dilatation tests were carried out using a Gleeble® 3800 thermomechanical simulator (a registered trademark of Dynamic Systems Inc., Poestenkill, NY, USA) for generating the phase transformation data as a function of linear cooling paths at different rates. Cylindrical specimens of dimensions 5 mm diameter × 7.5 mm height were machined from solution treated at 1250 °C and water quenched laboratory rolled samples. For CCT tests without prior deformation, samples were heated at 10 °C/s to 1150 °C, held for 2 min, cooled to 1000 °C, held 2 min prior to cooling at different linear rates in the range 3–96 °C/s to room temperature, Figure 1a. In the case of CCT tests with prior straining, samples were cooled to 850 °C following soaking at 1150 °C for 2 min and compressed with three hits each having a strain of ~0.2 at a strain rate of 1 s−1. The time between hits was 25 s. The specimens were then held for 25 s after the last compression hit before cooling at various linear rates in the range 3–96 °C/s, as illustrated in Figure 1b. These two sets of experiments were meant to simulate quenching after hot rolling without and with controlled rolling finishing at low temperatures.
The effect of different niobium contents on austenite grain growth behavior in the as-cast material was also studied. Four different target peak temperatures were used to cover the range of reheating temperatures that could be used in practice, i.e., 1050, 1100 1150 and 1200 °C. Such a range of temperatures will affect the degree to which niobium is taken into solution. The heating rate used was decreasing towards the peak temperature, starting at ~25 °C/min, and in case of the last 50 °C, the heating rate was ~2 °C/min to simulate actual industrial slab reheating. To reach the peak temperature, the total time was approximately 120 min. Holding time at the peak temperature was approximately 3 min before water quenching. The samples for metallography were prepared according to the standard procedure and etched with saturated aqueous picric acid with a soap solution as a wetting agent to reveal the prior austenite grain boundaries.
Longitudinal tensile tests and Charpy-V impact tests were performed to evaluate the strength and low temperature toughness properties. Tensile tests were performed using three flat bar specimens for each variant according to the standard ISO 6892-1:2016 [12]. Charpy-V impact tests were performed at various temperatures (two specimens/temperature) according to the European standard EN 148-1:2016 [13] using 5 mm × 10 mm × 55 mm specimens. Transition curves were drawn using a tanh fitting procedure described in [14,15]. Vickers hardness measurements were carried out on all the CCT specimens executing five measurements for each sample with 10 kg load and dwell time of 10 s.
Microstructural characterization was carried out using light optical microscopy (LOM) and field-emission scanning electron microscopy combined with electron backscatter diffraction (FESEM-EBSD) (Carl Zeiss AG, Oberkochen, Germany). Prior austenite grain sizes were determined using the linear intercept method applied to the laser scanning confocal microscopy (LSCM) images of specimens examined at the quarter-thickness of the specimens in all the three directions: the rolling direction (RD), transverse to rolling direction (TD) and in the plate normal direction (ND). Based on these measurements, the aspect ratio (r), total reduction below the recrystallization temperature (Rtot.), the surface area per unit volume (Sv) and average grain size (d) were determined using the equations shown in Table 3 [16].
Electron backscatter diffraction (EBSD) measurements and analyses were performed using the EDAX-OIM acquisition and analysis software (7.1.0, Amatek Inc., Berwyn, PA, USA). The FESEM was operated at 15 kV using a step size of 0.2 μm for the EBSD measurements. Lath and effective grain sizes were determined as equivalent circle diameter (ECD) values corresponding to the low-angle (2.5–15°) and high-angle boundary misorientation (>15–65°), respectively.
3. Results and Discussion
3.1. CCT Diagrams
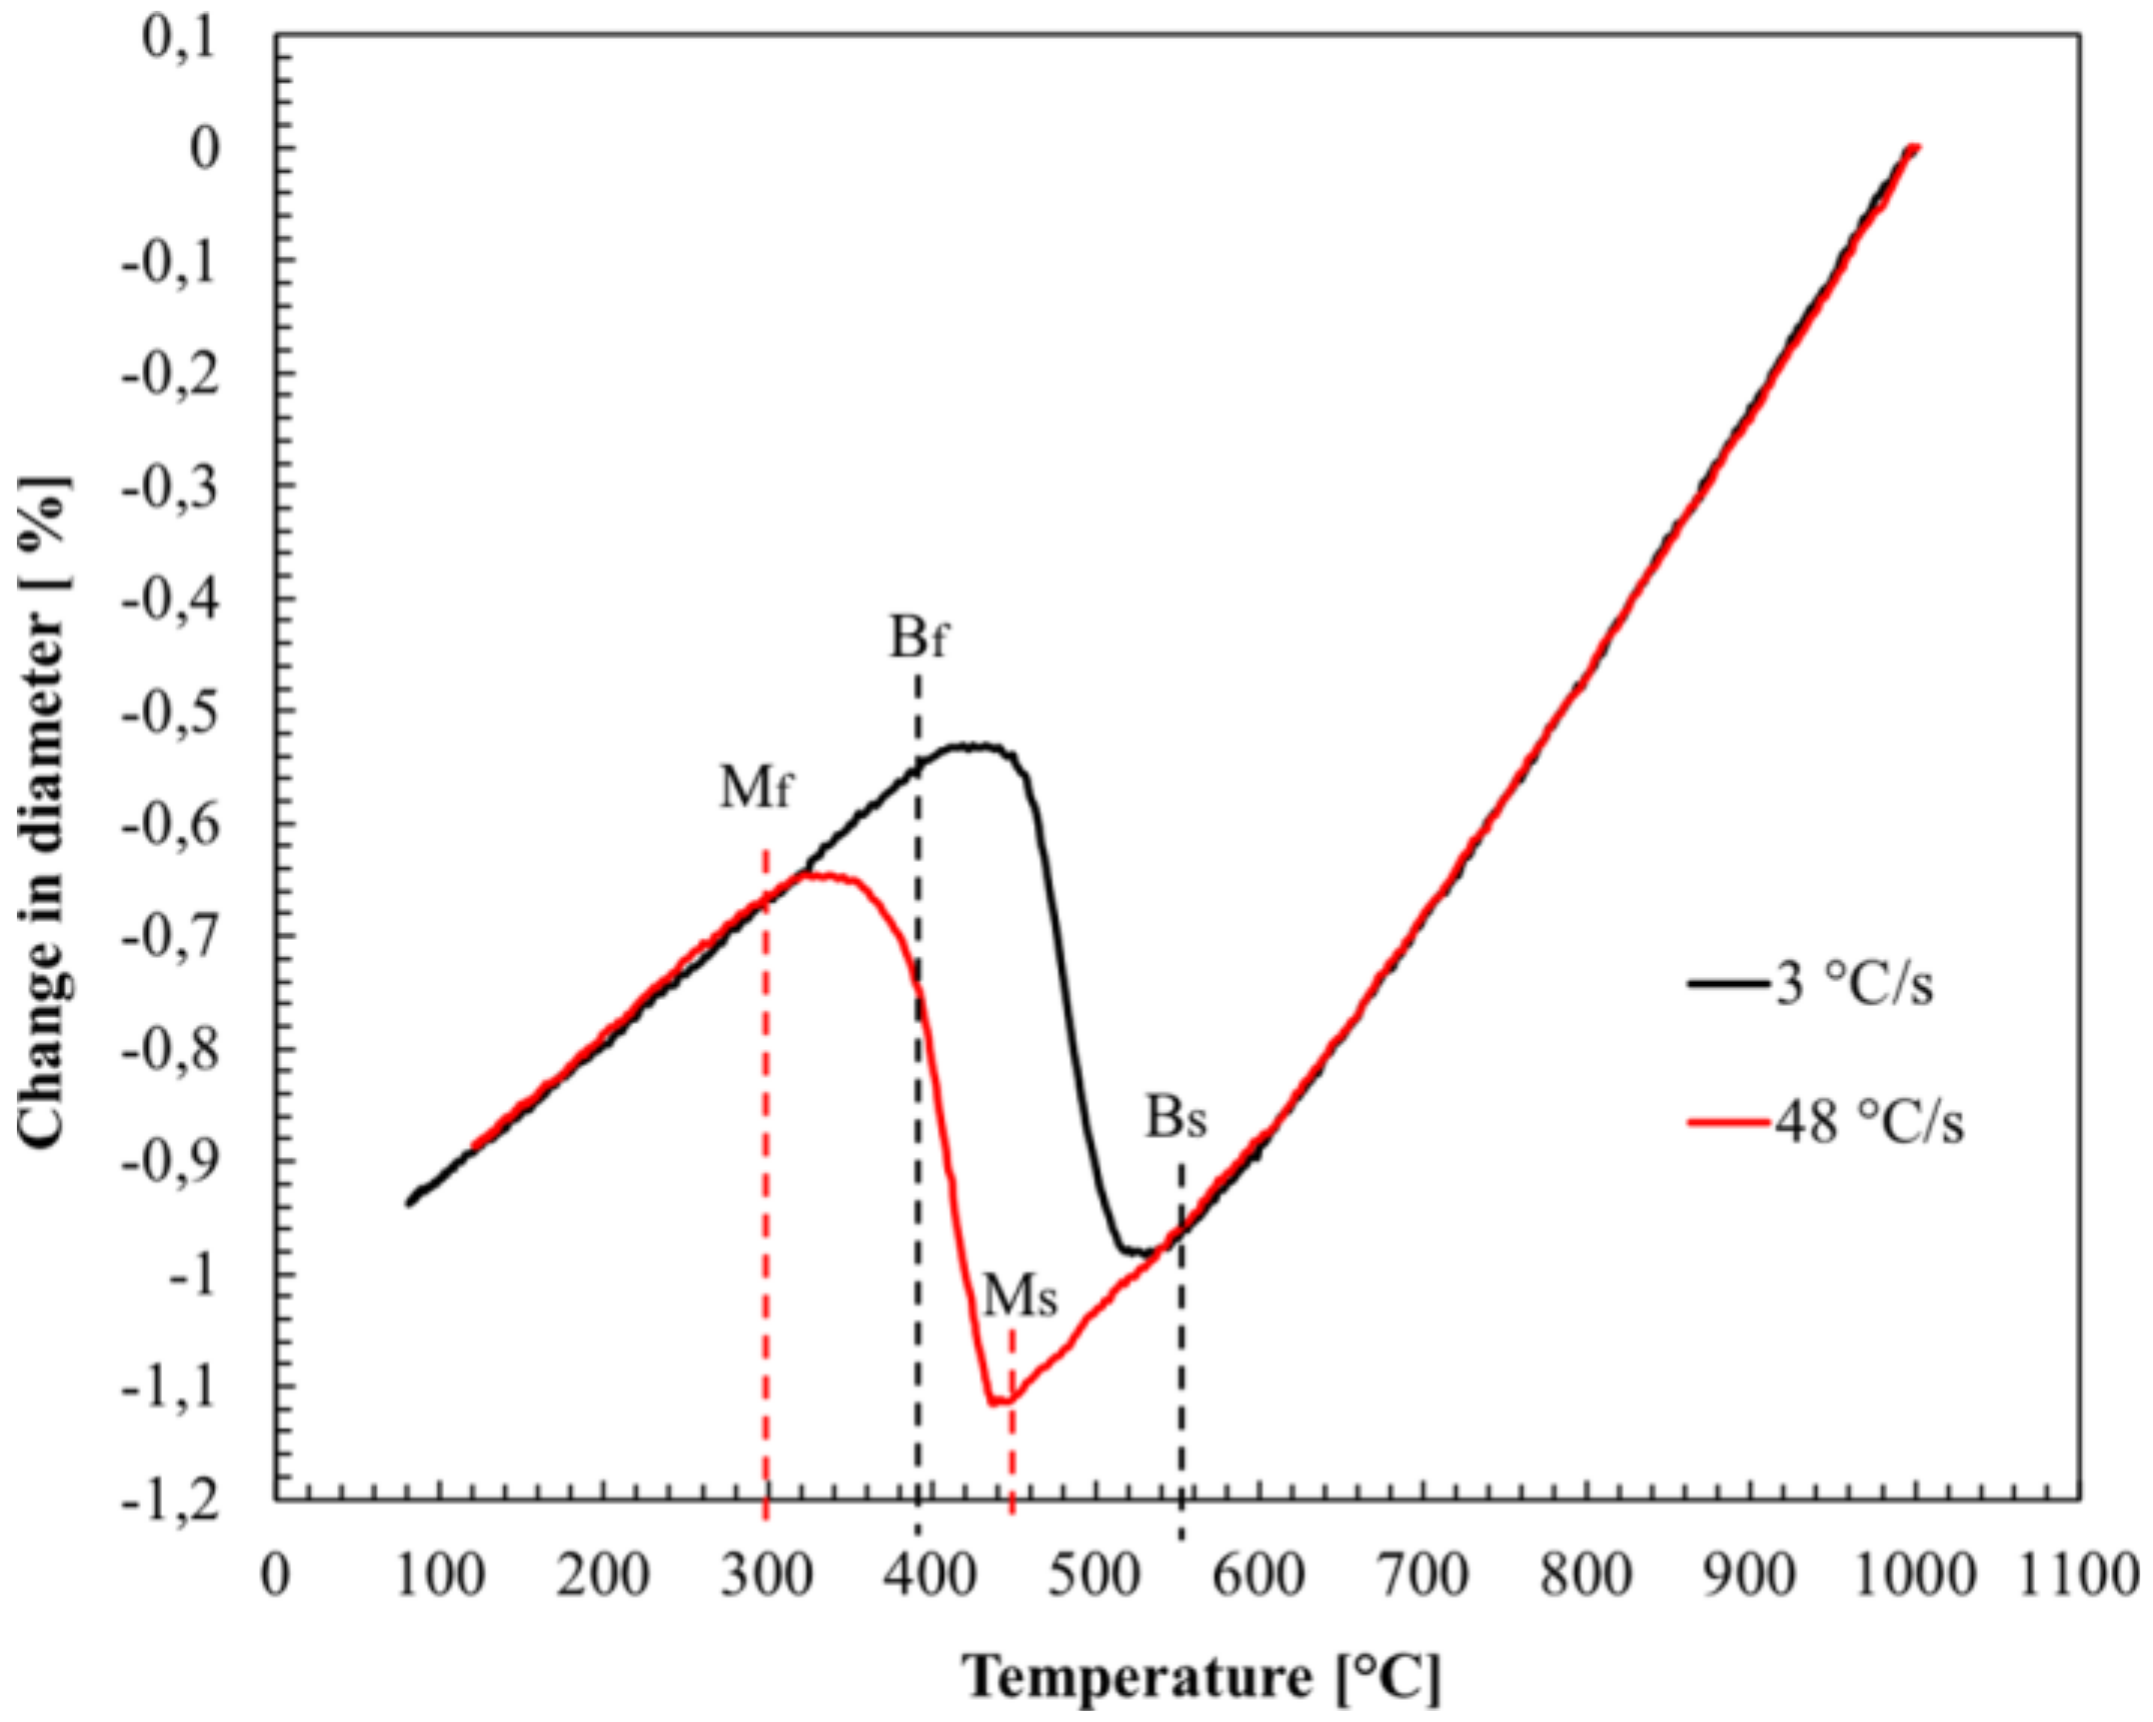
CCT diagrams were constructed using dilatometry data from Gleeble tests and comparing the results to the microstructures of simulated samples after nital etching. Figure 2 shows an example of a dilatometry curve for undeformed austenite. Phase transformations during cooling are seen as changes in the sample diameter. With a cooling rate of 3 °C/s, bainite appeared in the final microstructure, whereas for a cooling rate of 48 °C/s, the transformation shifted to lower temperatures leading to martensitic transformation.
Figure 3 shows the constructed CCT diagrams of the investigated steels. Generally, the microstructures consist of bainite and martensite depending on the cooling rate and the composition. A comparison of the transformation behavior at high cooling rates of CCT diagrams with and without deformation (12–96 °C/s) showed that there were no significant differences in hardness values or phase constituents, irrespective of the Nb contents. However, with low cooling rates (3–6 °C/s), the addition of niobium clearly increased the hardness for all the CCT specimens with or without deformation, and the highest increase was in case of deformed CCT tests, where hardness increased more than 30 HV10 compared to non-alloyed version (cooling rate 6 °C/s). Referring to Figure 3, the CCT diagrams show that straining the austenite prior to cooling tends to increase the hardness at high cooling rates, but reduce the hardness at lower cooling rates, although the phase transformation start temperatures were not greatly affected. The combination of prior straining in the austenite and Nb alloying resulted in the highest hardness values obviously due to the elongated austenite structure because of the ability of niobium to raise the no-recrystallization temperature (TNR) leading to extensive pancaking of austenite during deformation [17]. In our study, the effect of Nb on the phase transformation kinetics was not appreciably large, as seen in other studies [4,18]. However, these studies have shown that in low hardenability steels, Nb can hinder ferrite formation and promote bainitic microstructure, unlike in our study, where steels have high enough hardenability to promote the formation of bainitic/martensitic microstructure even without Nb alloying. The strongest effect of Nb on improving the hardenability can be seen in the case of a cooling rate of 6 °C/s, where the microstructure is mostly bainitic. In addition, other studies have shown that Nb in solid solution does not improve hardenability at high cooling rates. Instead, the hardenability is increased when the driving force for transformation is low even at low cooling rates [19]. It can be assumed that the effectiveness of hardenability at low cooling rates was based on the effect of Nb in solution and not as Nb(CN) precipitates. Carpenter et al., have shown that the formation of Nb precipitates was evident with a cooling rate of 1 °C/s and with an Nb amount of 0.08 wt.%, but here Nb levels were lower and cooling rates higher.
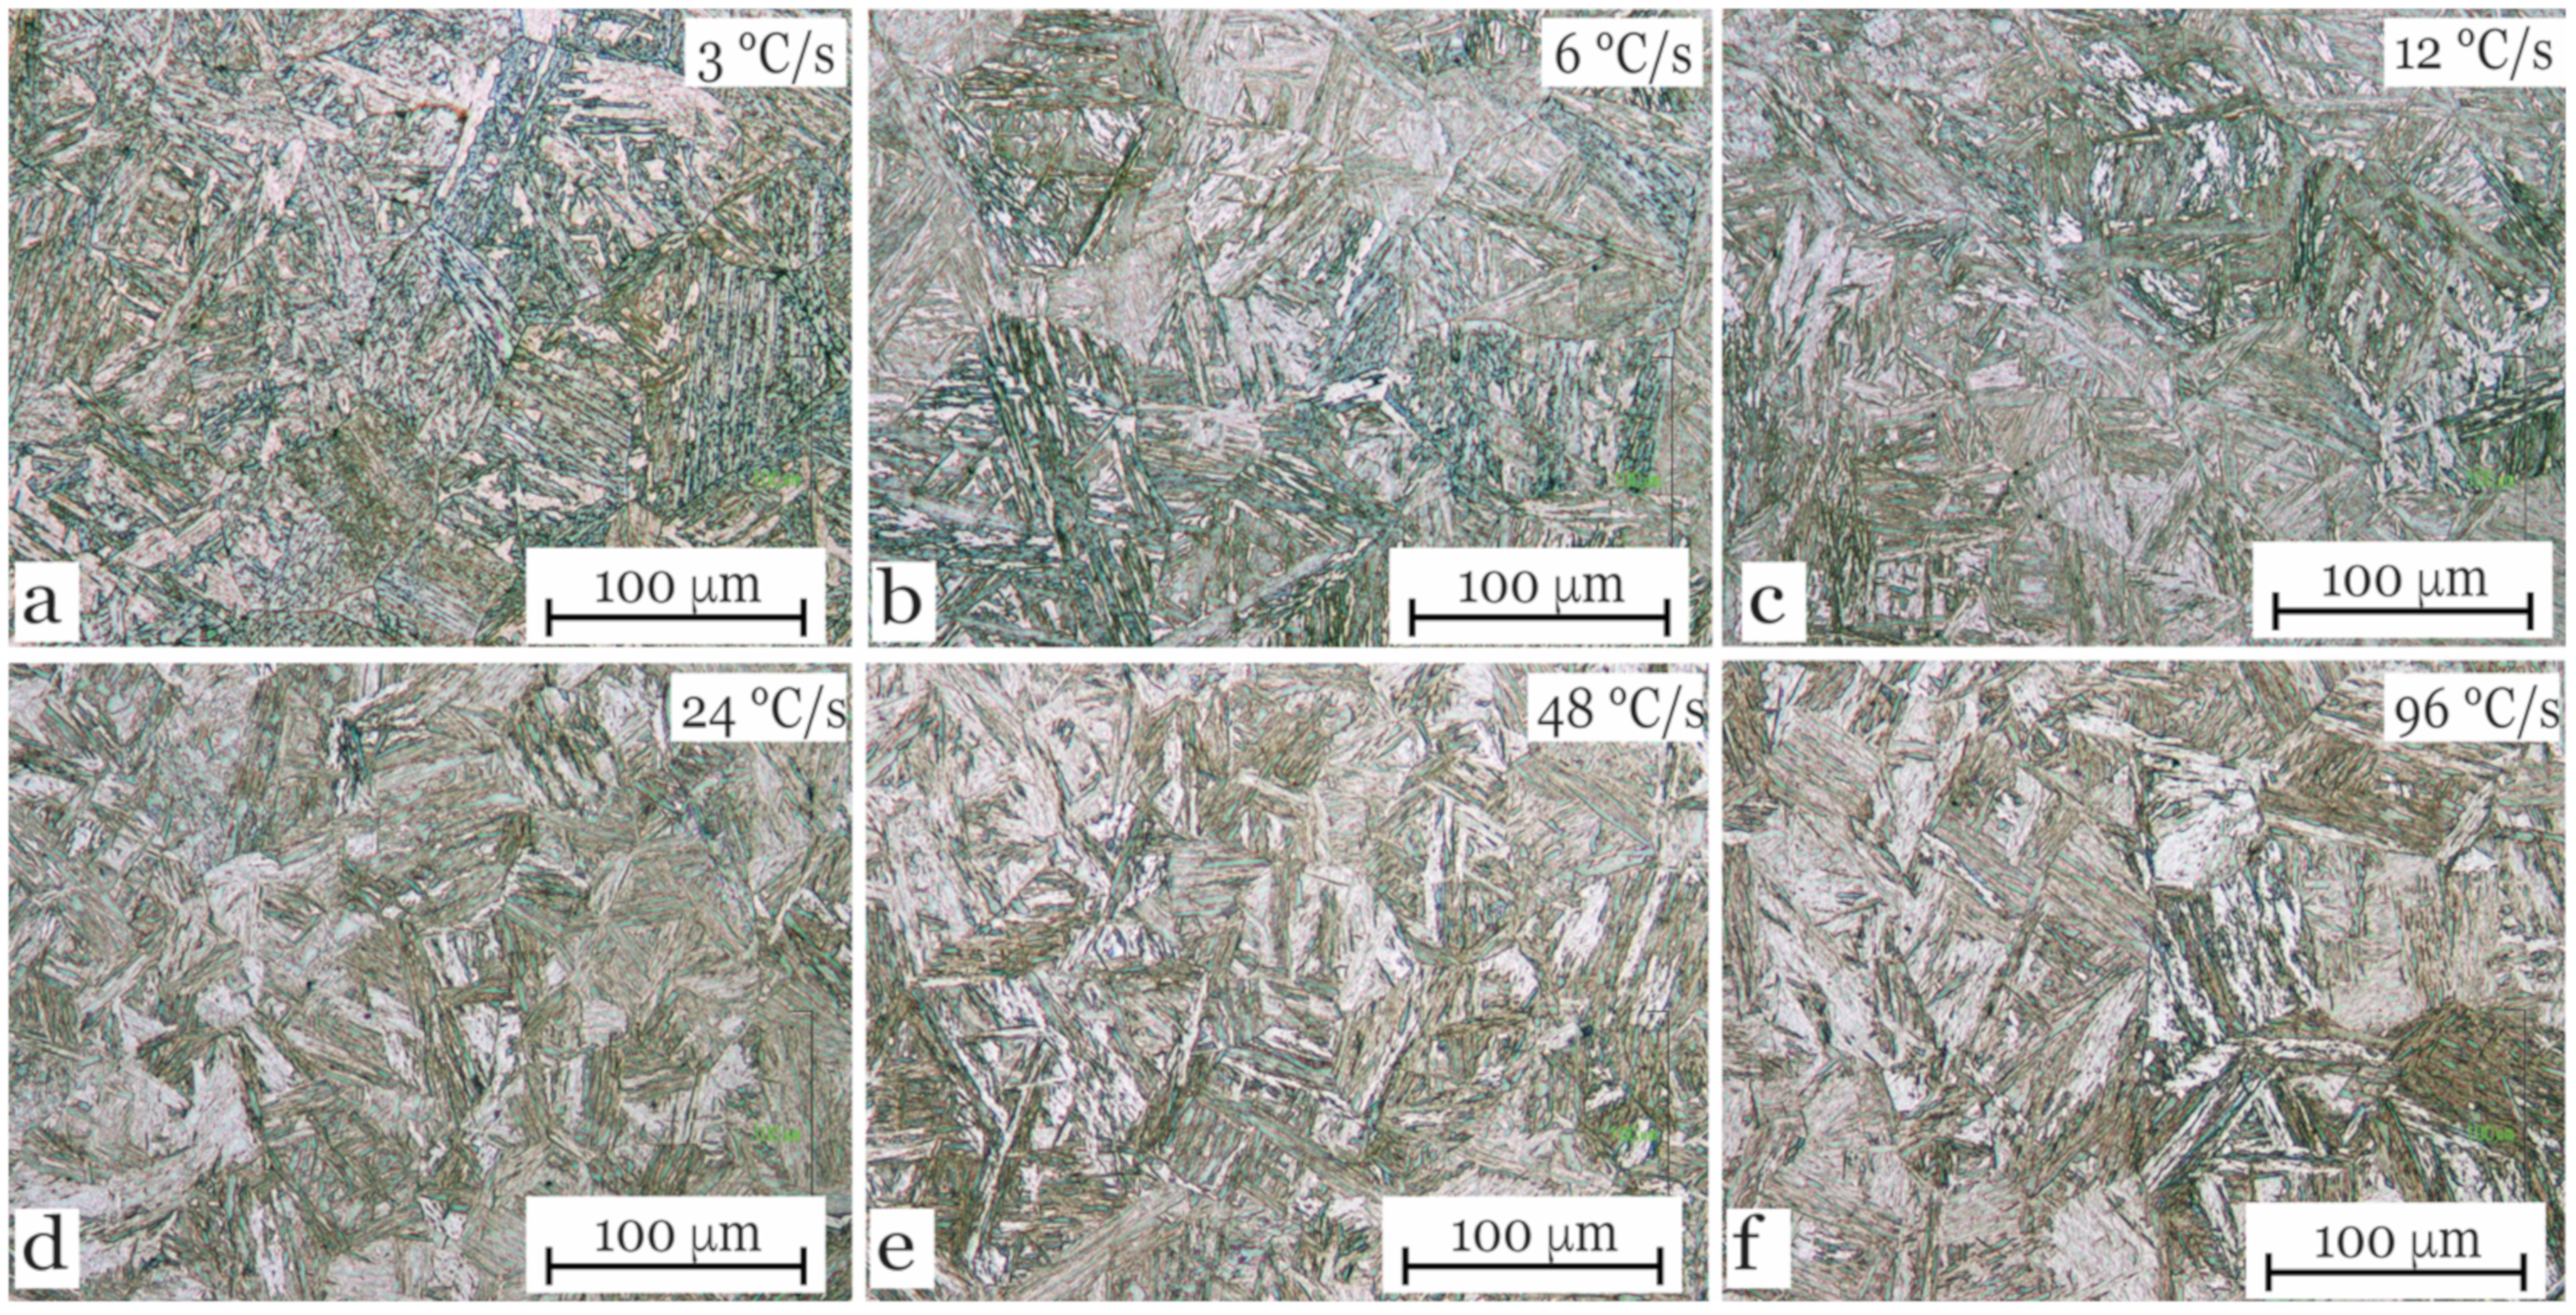
Figure 4 presents representative microstructures of the CCT specimens at different cooling rates without the addition of Nb. The bainitic microstructure dominates at low cooling rates 3 and 6 °C/s, however, the microstructure is mainly martensitic at relatively higher cooling rates of 12°/s and 24 °C/s (Figure 4d). With still higher cooling rates of 48 °C/s and 96 °C/s, a fully martensitic microstructure was observed, as also corroborated by the dilatation curves and hardness values.
3.2. Prior Austenite Grains after Soaking Treatments
Austenite grain growth behavior was studied using relatively slow heating rates to simulate the actual slab soaking treatment. The average prior austenite grain sizes were relatively large at all the soaking temperatures (1050, 1100, 1150 and 1200 °C) in the range 325–420 μm, as illustrated in Figure 5. Surprisingly, already at a 1050 °C soaking temperature, Nb-alloyed variants showed grain sizes comparable to the non-alloyed variants. The results point to the fact that niobium did not show any clear systematic effect on austenite grain size after the slab soaking treatments of 2 h in the range 1050–1200 °C. Figure 6 shows examples of prior austenite grain boundaries revealed in the investigated steels corresponding to the soaking temperatures of 1050 °C and 1200 °C. Coarse grains were evident at both the temperatures.
To evaluate the effectiveness of niobium on grain growth at high temperatures, the amount of Nb in solution at different temperatures has been calculated for Nb-containing variants. All the steels contained well above the stoichiometric amounts of Ti with respect to TiN formation. Therefore, it can be assumed that NbC precipitates might have formed during reheating or processing and not the Nb(CN) precipitates. However, in the presence of B, the precipitates could also be of the Nb(CB) type. Djahazi et al. [20] detected (Nb,Ti)(CNB) precipitates in low-carbon bainitic steels containing Ti, Nb and B using the electron energy loss spectroscopy (EELS). They also observed that the addition of boron accelerated strain-induced precipitate formation, thus raising the nose of the precipitation C-curve. On the other hand, boron has also been found to have a pronounced effect on the recrystallization temperature of Nb-microalloyed steels [21]. However, to the best of our knowledge, there is no solubility data for Nb(CB) precipitates. Figure 7 shows the results of Thermo-Calc simulations to estimate the dissolution of different precipitates under equilibrium conditions. Figure 7a shows that for the Nb-free steel, there is no NbC of course. However, the Ti and N present in all the compositions leads to the predicted presence of TiN, which should dissolve entirely at around 1270 °C in the Nb-free composition and 1300 °C in the two Nb-alloyed compositions (Figure 7b,c). In the case of Nb-alloyed variants (Figure 7b,c), NbC precipitates should exist up to dissolution temperatures of around 1100 °C for the steel with 0.02 wt.% Nb and 1160 °C for the steel with 0.05 wt.% Nb. It is known that both Nb and Ti containing precipitates hinder grain growth [22] [23,24]. On the basis of the thermodynamic simulations, one would expect both TiN and NbC precipitates to have a pinning effect on austenite grain boundaries at least at the low soaking temperatures (1050–1100 °C). However, the large measured grain sizes imply that this was not the case. The Ti/N ratios of the present compositions were between 6 and 7.5, which is much higher than the stoichiometric 3.42 that is optimal for TiN stability and maximal pinning [23], but TiN will be operating in all the steel compositions studied. The reason for the similarity of the austenite grain sizes after slab reheating simulation is probably due to a memory effect that has been observed in steels martensitic or bainitic steels. In the as-cast slab material that is characterized by a coarse prior austenite grain size, small quantities of the austenite are stabilized and on reheating these grow and tend to reform the original coarse austenite grain structure [25,26]. This mechanism leads to coarse austenite grains irrespective of the presence of pinning precipitates since the pinning forces are only relevant to the grain growth situation and not in the presence of the large driving forces that arise with the ferrite to austenite phase transformation. Boron alloying has been found to promote this phenomenon [25]. In addition, other alloying elements, such as manganese and molybdenum promote this austenite grain memory effect by stabilizing cementite particles, which does not dissolve before the ferrite to austenite transformation and does not promote the formation of normal globular austenite grains [26].
3.3. Prior Austenite Grain Structure after Hot Rolling
The no-recrystallization temperatures (TNR) of the investigated steels, as shown in Table 4, were calculated using the following equation [27]:
TNR = 887 + 464*C + (6445*Nb − 644*√Nb) + (732*V − 230*√V) + 890*Ti + 363*Al − 357*Si.
TNR predictions using Equation (1) may not be very accurate but can be useful in estimating the amount of reduction or straining in the no-recrystallization regime, following controlled rolling, although it should also be remembered that the RST is marginally lower than the TNR. Referring to Table 4, a high TNR value of 1062 °C for the steel DQ + 0.05Nb is well above the recrystallization limit temperature (RLT) of Nb-bearing steels, suggesting that there must be an upper saturation limit for Nb microalloying, beyond which the TNR may not increase further. Notwithstanding this discrepancy, a preliminary calculation suggests that the DQ+0.05Nb steel should provide a fairly large rolling reduction for both FRTs, i.e., 820 °C and 920 °C, i.e., from the thickness 21.5 mm to 6 mm (see Table 2) corresponding to a true strain of ≈1.3, if TNR falls somewhere close to about 1000 °C. DQ steel without any microalloying will undergo the least rolling reduction in the no-recrystallization regime resulting in about 0.4 strain at the low FRT of 920 °C and should have a partially recrystallized structure at the higher FRT of 920 °C, with little or no residual strain in the austenite.
Table 5 shows the measured average prior austenite grain sizes in three different directions, calculated Sv values and corresponding total reduction percentages in the no-recrystallization regime at the FRTs of 820 °C and 920 °C. As expected, higher Sv values and reductions in the no-recrystallization regimes were generally achieved with Nb microalloying. The higher FRT of 920 °C imparted only a slightly pancaked austenite and partial recrystallization occurred in the case of the Nb microalloyed steels, see Table 5 and Figure 8. A comparison of the amount of strain in the matrix estimated using the rolling schedule and the TNR predictions (Table 2 and Table 4), with that of the assessed values from Rtot (Table 5) suggest reasonably good agreement for the Nb-free steel irrespective of the FRT and somewhat lower residual strains on the basis of Rtot for the DQ + 0.02Nb steel. In addition, the presence of fine grains or slightly skewed/kinked grains seen in the microstructures (Figure 8) may have affected the estimation of Rtot. On the contrary, calculations using the TNR predictions may overestimate the strain in the matrix, as TNR lies slightly above the RST. All the same, the Rtot values for DQ + 0.05Nb steel suggest relatively low strain in the matrix (≈0.5 and 0.9 strains at FRTs of 820 °C and 920 °C, respectively) compared to that estimated using TNR predictions (≈1.3). Despite the possibility of slight overestimation of the strains using the TNR predictions as discussed above, the low strain at 920 °C is difficult to explain.
The lower FRT of 820 °C clearly produced more severely pancaked austenite in all cases compared to that at higher FRT of 920 °C, as seen from Table 5 and Figure 8. Nb microalloying led to an increase in calculated Rtot. and Sv. Again, the calculated values of Rtot appeared rather small when compared to the rolling schedules and the calculated TNR values, especially when the effect of boron on TNR and RST were taken into account. This may be explained by the presence of randomly scattered very small grains and also very coarse elongated grains.
3.4. Transformed Microstructure
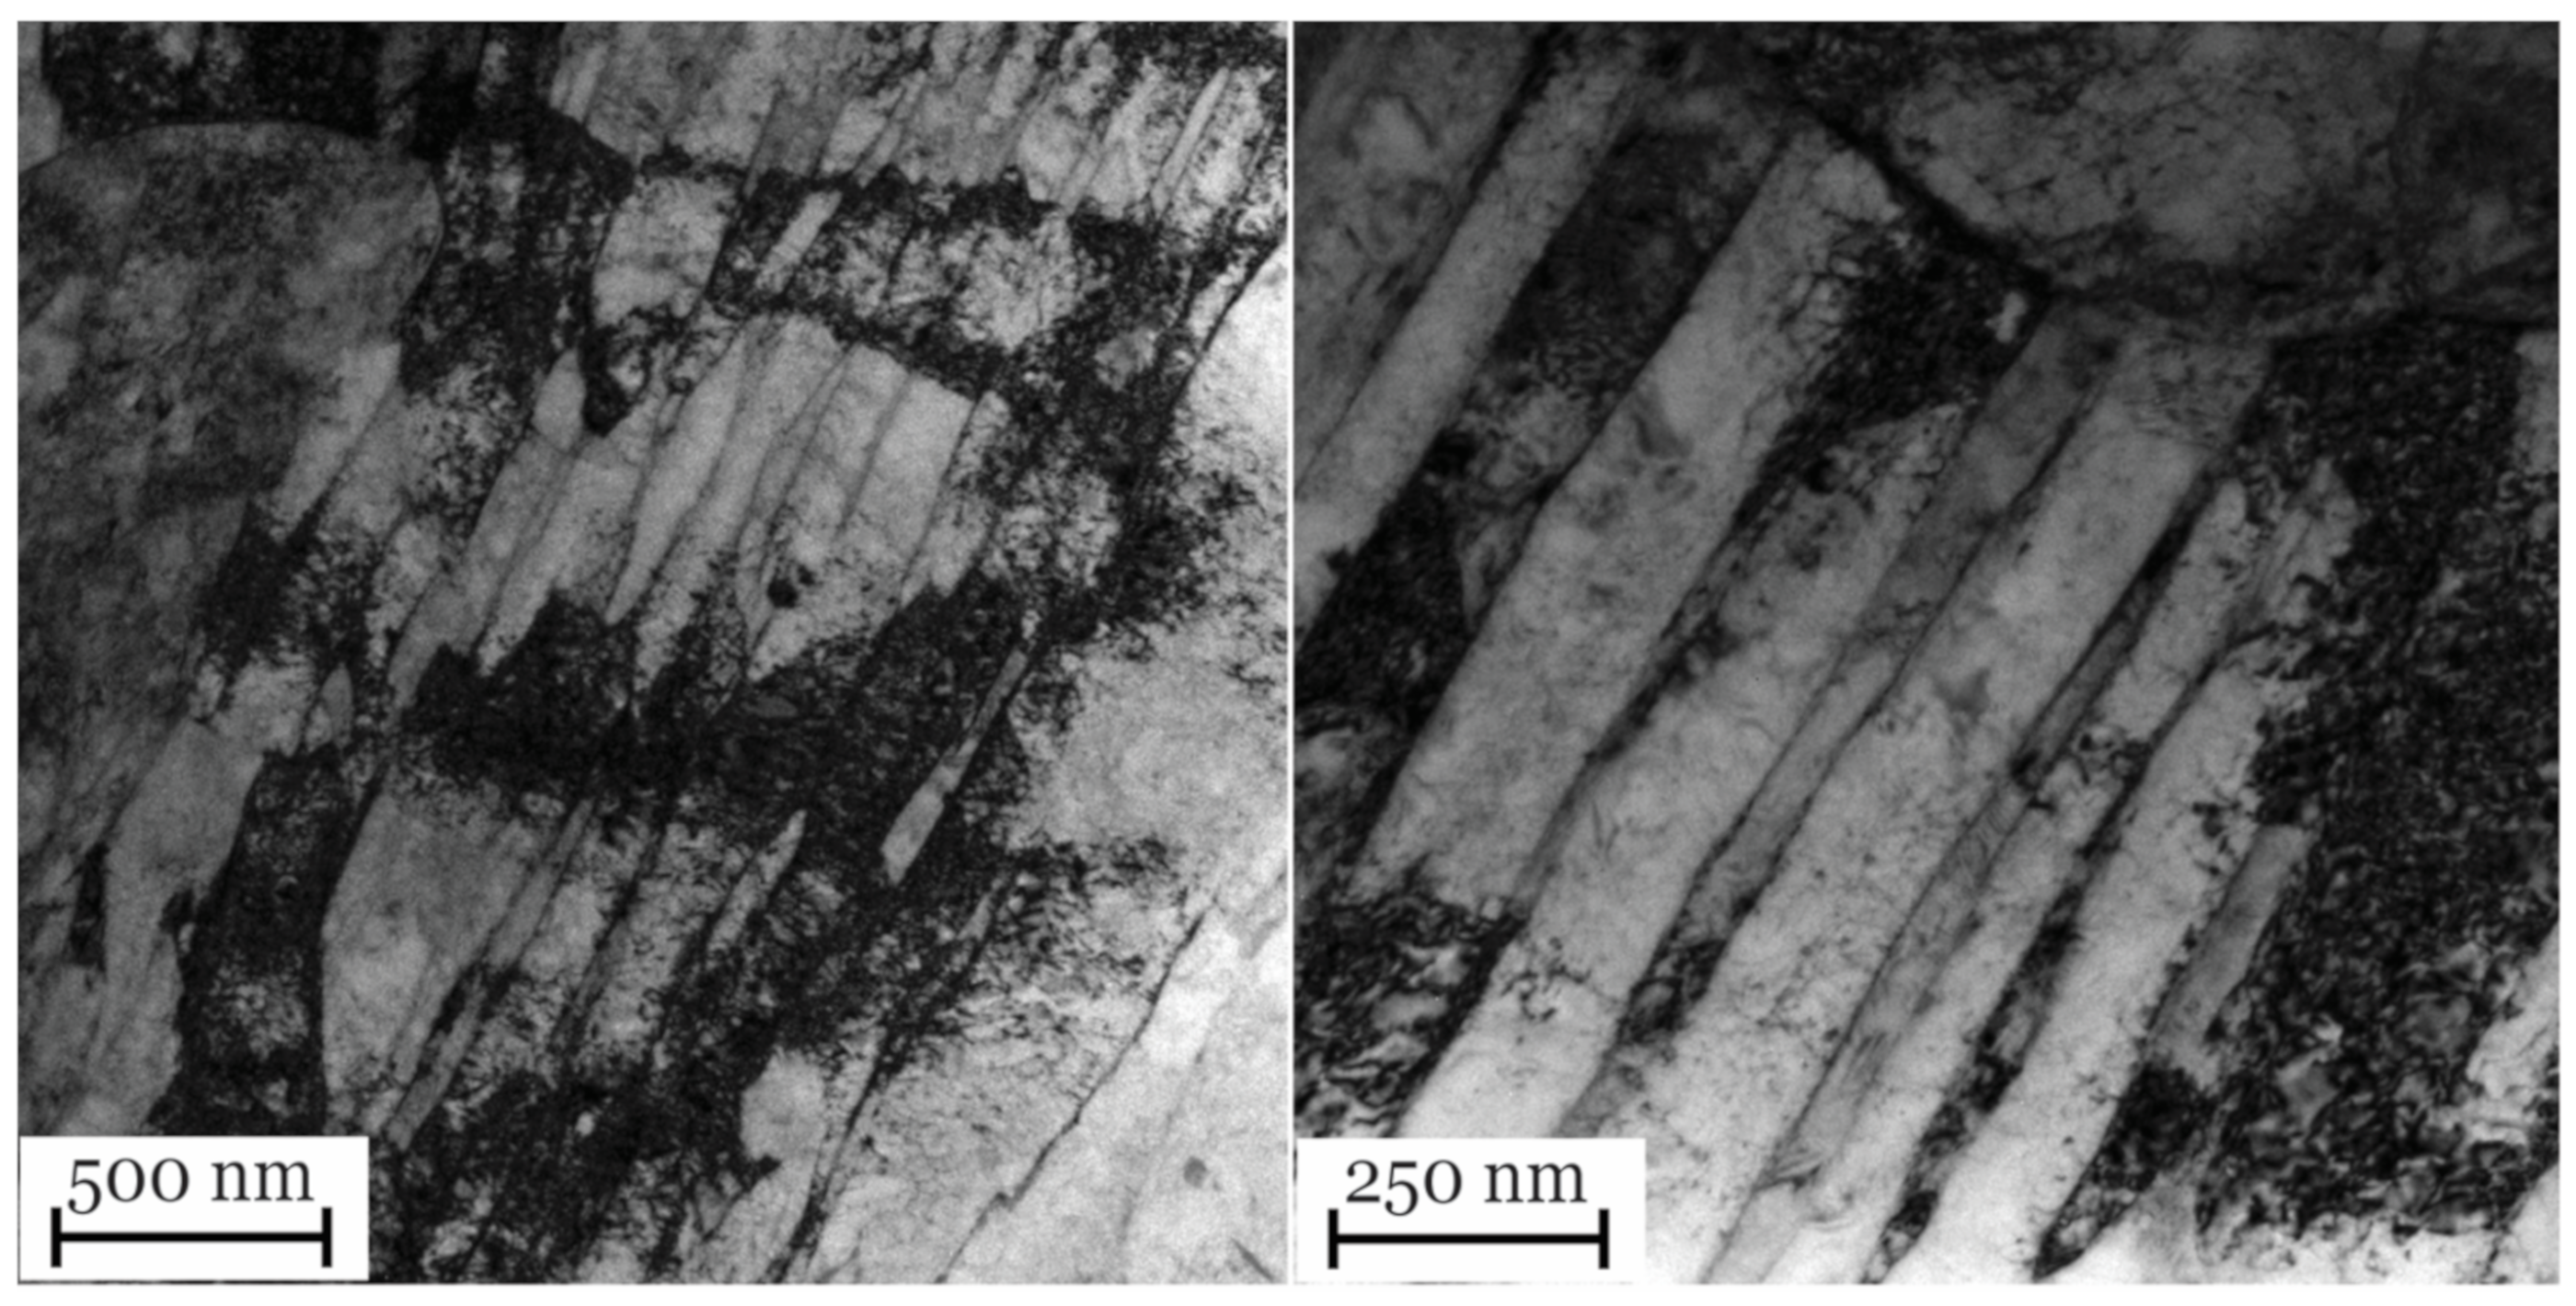
Figure 9 presents typical microstructures of the investigated steels at the ¼ depth of the samples for both the FRTs. The microstructures consisted of fine packets and blocks of martensitic laths oriented in different directions. Autotempering of the martensite leading to the precipitation of fine carbides in the martensite laths was also evident in some areas (red arrows in Figure 9). Based on the microstructural characterization, both the FRTs produced mainly martensitic microstructures in all cases. The elongated martensitic structure can be seen especially in the case of 0.05Nb steel prior to being strained with low FRT (Figure 9f). Figure 10 presents one example of a lath martensite structure investigated by the transmission electron microscopy (TEM) of DQ + 0.02Nb steel with the FRT of 820 °C. The martensite lath structure can be seen with typical lath width of 50–100 nm combined with high density of dislocation networks throughout the sample. A similar microstructure was observed also in other investigated steels with practically no significant differences.
Effective grain (>15 deg) and lath sizes (2.5–15 deg), determined as equivalent circle diameters (ECD) from EBSD measurements, are presented in Figure 11. Lower FRT and higher amounts of Nb produced slightly smaller mean grain sizes owing to the higher degree of austenite pancaking. The effective grain sizes at 90% in the cumulative size distribution (d90%) are also shown in the figure. It is clear that the 90th percentile effective high-angle grain size varies considerably more than the mean values and that its behavior as a function of Nb content depends on the FRT.
Figure 12 shows the misorientation distributions of the investigated steels with respect to the finish rolling temperatures. In the case of both FRT’s, four different misorientation peaks can be detected, which are discernible at ~7.5°, 16°, 52.5° and 59°. Typically, peaks with misorientation less than 10° correspond to sub-block boundaries and peaks with misorientation higher than 40° correspond to packet or block boundaries [28]. Earlier studies have shown that these peaks found in the current study are typical of martensitic microstructures [28,29,30]. The absence of significant peaks in the misorientation range 15–50° indicates that there are no other phases formed at higher temperatures compared to martensite, such as upper bainite, granular bainite or ferrite [29,31]. Based on misorientation distributions shown in Figure 12, both FRTs resulted in similar microstructures with no clear differences. In addition, the effect of Nb on the misorientation distributions was rather low indicating that all steels had practically similar microstructures, as was also obvious in the microstructural characterization (Figure 8).
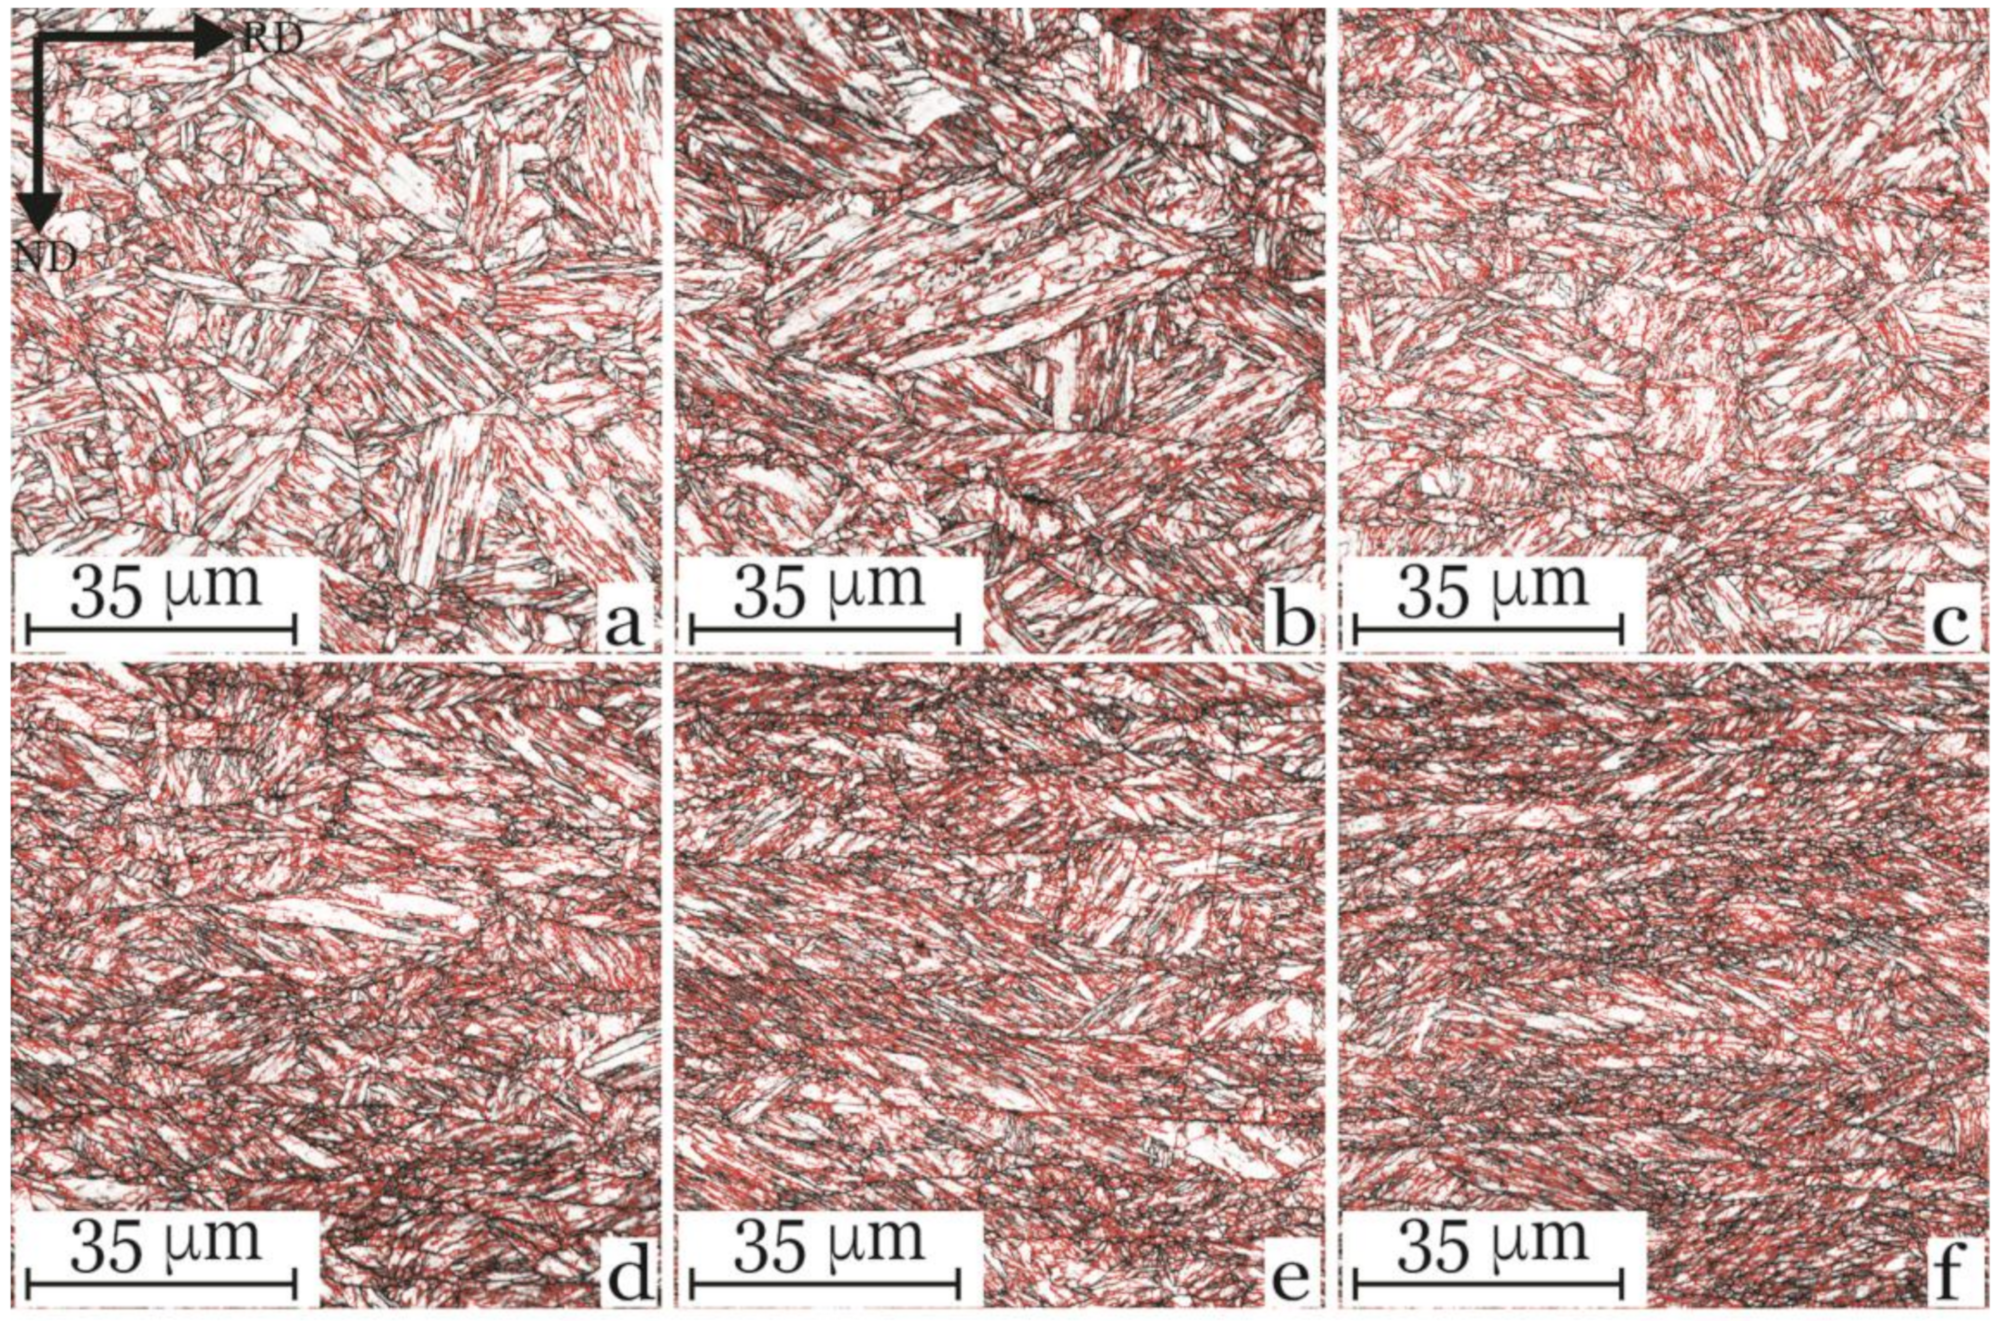
Figure 13 shows the low and high angle boundaries of the investigated steels based on the EBSD analysis. The higher amount of low angle boundaries (red lines) was achieved with the lower FRT and higher Nb content. The formation of the highly pancaked austenite structure increased the number of low angle boundaries of the martensitic structure, as seen clearly in Figure 13f.
3.5. Mechanical Properties
The tensile test results of the investigated steels are presented in Table 6. The FRT of 820 °C produced yield strength (Rp0.2) over 1000 MPa in all the cases and marginally higher strength values were achieved by Nb microalloying. The low FRT developed high Sv values in all cases, i.e,. highly elongated austenite, which did not clearly reveal the effectiveness of Nb. In contrast, the greatest effect of Nb on strength was revealed when the FRT was 920 °C, where the effect of Nb on austenite pancaking was strongest. A higher degree of deformation in austenite was achieved by Nb alloying at higher FRT (see Table 5), which resulted in a noticeable increase in yield (Rp0.2 ) and tensile strength (Rm). Adding more than 0.02 wt.% Nb provided no additional benefit with respect to the yield strength and only a small improvement in the tensile strength, Table 6. In all cases, elongation (A) to fracture values are in line with the tensile strengths achieved, as demonstrated by the constancy of Rm * A in Table 6. Overall, the benefits of Nb on strengthening can be achieved using the high FRT.
Tensile strength and mid-thickness Vickers hardness values of the investigated steels are presented in Figure 14. Hardness values over 400 HV10 were achieved with the Nb microalloying as well as FRT of 820 °C. Hardness values correlate well with the tensile test results giving Rm/HV10 ratios of 3–3.1 in all cases. The hardness of the DQ steel without Nb, rolled with a high FRT has a hardness of 382 HV10, close to the theoretical hardness (378 HV) predicted for a steel containing 0.071 wt.% C following reheating and quenching. The present results, therefore, show that pancaking the austenite prior to direct quenching increases the hardness marginally over the theoretical hardness that can be achieved by reheating and quenching.
Figure 15 shows Charpy V impact test results and fitted transition curves according to the procedure described in References [14,15]. Table 7 gives a summary of important values of the curves. Slightly better impact toughness properties were achieved with the FRT of 820 °C in comparison to those at 920 °C. Considering the investigated steels and various levels of Nb, the transition temperatures are very close to each other for a given FRT. A slight deterioration of the impact toughness properties can be seen at the higher Nb content of 0.05%, presumably as a result of increased tendency of microsegregation. Note that the apparent deviation of the fitted curves from the data points in the transition temperature data range in Figure 15 is caused by the fitting tanh procedure used.
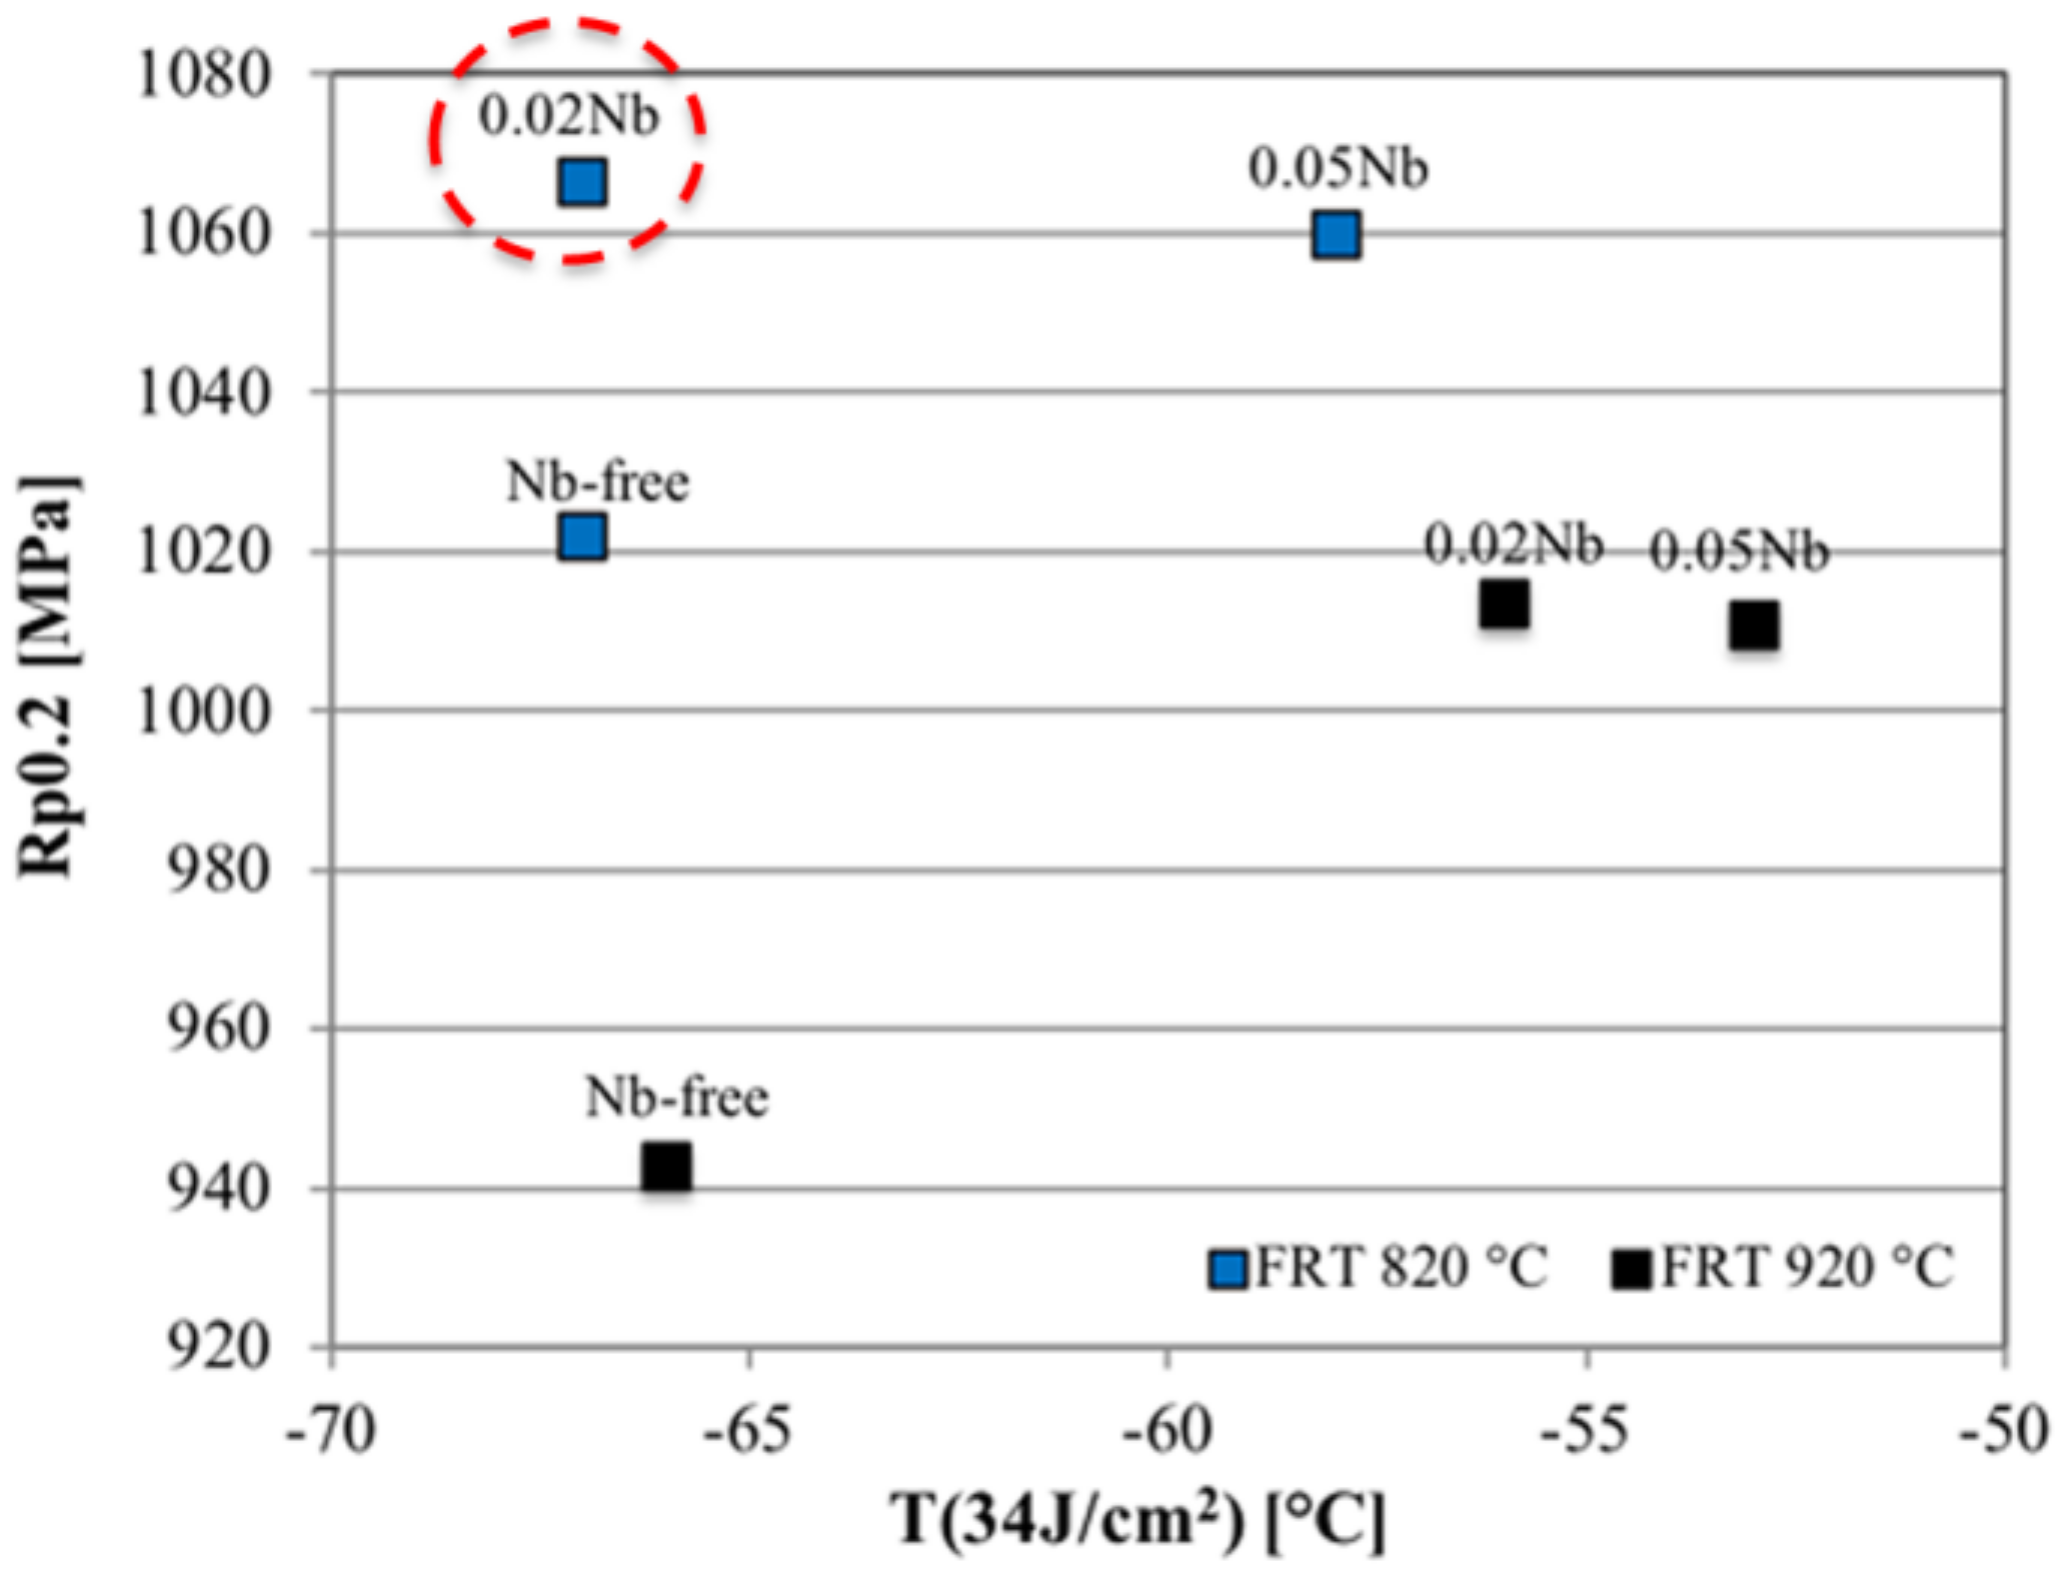
Figure 16 shows a summary of the combinations of yield strength and 34 J/cm2 transition temperature obtained with the cases studied. For a given microstructure, the transition temperature is often improved by reducing the strength, which is evident, when the FRT is 920 °C. However, in the case of the lower FRT 820 °C, the transition temperature was improved without a decrease in the yield strength in the case of 0.02Nb steel. Generally, it can be concluded that the lower finish rolling temperature of 820 °C imparted better overall mechanical properties, particularly with an optimized level of 0.02Nb steel.
4. Summary and Conclusions
The effect of niobium on the microstructures and mechanical properties of laboratory hot rolled and direct-quenched 6 mm thick steels containing 0.08 wt.% C has been studied. Prior to this, CCT diagrams were constructed for the three steels with (DQ + 0.02Nb and DQ + 0.05Nb) or without (DQ) Nb-microalloying using the simulated CCT tests conducted on a Gleeble simulator to understand the phase transformation behavior. Finish rolling temperatures of 820 °C and 920 °C were used to obtain different levels of pancaking in the austenite and the rolled plates were direct-quenched to room temperature at ~90 °C/s. Based on the results, the following conclusions can be drawn for the compositions and conditions studied:
- Nb did not have a significant effect on phase transformation based on the constructed CCT diagrams. Only at low cooling rates, Nb decreased the proportion of bainite formation leading to higher hardness values, as a consequence of improved hardenability of Nb-bearing steels.
- Prior austenite grain growth studies at high temperatures showed that for these low-carbon B-microalloyed steels, austenite grain size after slab reheating is large even for low reheating temperatures despite the expected presence of Nb and Ti containing precipitates. The result is consistent with observations elsewhere and imply the presence of an austenite memory effect of martensitic steels due to suitable alloying contents resulting in the presence of some retained austenite remaining in the slabs, and also stabilizing the cementite particles.
- As expected, Nb microalloying raised the TNR leading to a more pancaked austenite structure especially at higher FRTs.
- The microstructures of direct quenched samples consisted of lath martensite and some lower bainite. Smaller lath and effective grain sizes were achieved with higher Nb content and the lower finish rolling temperature of 820 °C. Nb alloying also increased the amount of low-angle boundaries in the microstructure.
- Nb microalloying leads to improved strength in these steels. The greatest effect of Nb on strength was observed at the higher FRT of 920 °C, where the effect of Nb on austenite pancaking was strongest. When low FRT was used (820 °C), high strengths were achieved even in the case of Nb-free steel and the effect of Nb was smaller. Addition of 0.02 wt.% of niobium combined with low FRT produced the overall best mechanical properties and can be considered to be in high level compared to steels with similar strength class.
Author Contributions
Writing—Original draft, J.H.; writing—Review and editing, A.K., D.P., and M.S.; supervision, J.K. All authors have read and agreed to the published version of the manuscript.
Funding
This research was funded by SSAB Europe Oy.
Acknowledgments
Financial support of the SSAB Europe Oy is gratefully acknowledged.
Conflicts of Interest
The authors declare no conflict of interest.
References
- Hemmilä, M.; Laitinen, R.; Liimatainen, T.; Porter, D.A. Mechanical and technological properties of ultra high strength Optim steels. In Proceedings of the 1st International Conference “Super-High Strength Steels”, Associazone Italiana di Metallurgica—AIM, Rome, Italy, 2–4 November 2005. [Google Scholar]
- Kaijalainen, A.J.; Suikkanen, P.P.; Limnell, T.J.; Karjalainen, L.P.; Kömi, J.I.; Porter, D.A. Effect of austenite grain structure on the strength and toughness of direct-quenched martensite. J. Alloy. Compd. 2013, 577, S642–S648. [Google Scholar] [CrossRef]
- Somani, M.C.; Porter, D.A.; Pyykkönen, J.M.; Tarkka, J.M.; Kömi, J.I.; Intonen, T.A.; Karjalainen, L.P. Effect of composition on phase transformation temperatures and hardenability in direct quenching. In Proceedings of the International Conference on Microalloyed Steels: Processing, Microstructure, Properties and Performance, Pittsburgh, PA, USA, 16–19 July 2007; Association for Iron & Steel Technology: Warrendale, PA, USA, 2007; pp. 95–106. [Google Scholar]
- Piette, M.; Dubrelle-Prat, E.; Perdrix, C.; Schwinn, V.; Streisselberger, A.; Hulka, K. Effect of 0-0.1 % Nb additions on mechanical properties of plates processed by thermomechanically controlled pocessing and accelerated cooling. Ironmak. Steelmak. 2001, 28, 175. [Google Scholar] [CrossRef]
- Klinkenberg, C. Niobium in Microalloyed Structural and Engineering Steels. Mater. Sci. Forum 2007, 539–543, 4261–4266. [Google Scholar] [CrossRef]
- Mapelli, C.; Riva, R.F. Fundamentals of steel microalligation. Metall. Ital. 2008, 100, 33–42. [Google Scholar]
- Maccagno, T.M.; Jonas, J.J.; Yue, S.; McCrady, B.J.; Slobodian, R.; Deeks, D. Determination of Recrystallization Stop Temperature from Rolling Mill Logs and Comparison with Laboratory Simulation Results. ISIJ Int. 1994, 34, 917–922. [Google Scholar] [CrossRef]
- Niakan, H.; Najafizadeh, A. Effect of niobium and rolling parameters on the mechanical properties and microstructure of dual phase steels. Mater. Sci. Eng. A 2010, 527, 5410–5414. [Google Scholar] [CrossRef]
- Fossaert, C.; Rees, G.; Maurickx, T.; Bhadeshia, H.K.D.H. The effect of niobium on the hardenability of microalloyed austenite. Metall. Mater. Trans. A 1995, 26, 21–30. [Google Scholar] [CrossRef]
- Deardo, A.J. Niobium in modern steels. Int. Mater. Rev. 2003, 48, 371–402. [Google Scholar] [CrossRef]
- Carpenter, K.; Killmore, C. The Effect of Nb on the Continuous Cooling Transformation Curves of Ultra-Thin Strip CASTRIP© Steels. Metals 2015, 5, 1857–1877. [Google Scholar] [CrossRef]
- ISO. Metallic Materials—Tensile Testing—Part 1: Method of Test at Room Temperature; ISO 6892-12016; ISO: Geneva, Switzerland, 2016. [Google Scholar]
- ISO. Metallic Materials—Charpy Pendulum Impact Test—Part 1: Test Method; ISO 148-12016; ISO: Geneva, Switzerland, 2016. [Google Scholar]
- Oldfield, W. Curve fitting impact test data: A statistical procedure. ASTM Stand. News 1975, 3, 24–29. [Google Scholar]
- EricksonKirk, M.A.; EricksonKirk, M.T.; Rosinski, S.; Spanner, J. A Comparison of the tanh and Exponential Fitting Methods for Charpy V-Notch Energy Data. J. Press. Vessel Technol. 2009, 131, 031404. [Google Scholar] [CrossRef]
- Higginson, R.L.; Sellars, C.M. Worked Examples in Quantitative Metallography; Maney: London, UK, 2003; ISBN 1902653807. [Google Scholar]
- Miao, C.L.; Shang, C.J.; Zurob, H.S.; Zhang, G.D.; Subramanian, S.V. Recrystallization, Precipitation Behaviors, and Refinement of Austenite Grains in High Mn, High Nb Steel. Metall. Mater. Trans. A 2012, 43, 665–676. [Google Scholar] [CrossRef]
- Lee, Y.K.; Hong, J.-M.; Choi, C.S.; Lee, J.K. Continuous Cooling Transformation Temperatures and Microstructures of Niobium Bearing Microalloyed Steels. Mater. Sci. Forum 2005, 475–479, 65–68. [Google Scholar]
- Rees, G.I.; Perdrix, J.; Maurickx, T.; Bhadeshia, H.K.D.H. The effect of niobium in solid solution on the transformation kinetics of bainite. Mater. Sci. Eng. A 1995, 194, 179–186. [Google Scholar] [CrossRef]
- Djahazi, M.; He, X.L.; Jonas, J.J.; Sun, W.P. Influence of boron on nature and distribution of strain induced precipitates in (Ti, Nb) high strength low alloy steels. Mater. Sci. Technol. 1992, 8, 628–636. [Google Scholar] [CrossRef]
- Suikkanen, P. Development and Processing of Low Carbon Bainitic Steels; University of Oulu: Oulu, Finland, 2009; ISBN 9789514292569. [Google Scholar]
- Ogino, Y.; Tanida, H.; Kitaura, M.; Adachi, A. Effect of Niobium Addition on Austenite Grain Size in Steels. Tetsu to Hagane 1971, 57, 533–546. [Google Scholar] [CrossRef] [Green Version]
- Wang, S.C. The effect of titanium and nitrogen contents on the austenite grain coarsening temperature. J. Mater. Sci. 1989, 24, 105–109. [Google Scholar] [CrossRef]
- Adrian, H.; Pickering, F.B. Effect of titanium additions on austenite grain growth kinetics of medium carbon V–Nb steels containing 0·008–0·018%N. Mater. Sci. Technol. 1991, 7, 176–182. [Google Scholar] [CrossRef]
- Matsuda, S.; Okamura, Y. The Later Stage of Reverse Transformation in Low-carbon Low Alloy Steel. Trans. Iron Steel Inst. Japan 1974, 14, 444–449. [Google Scholar] [CrossRef]
- Hara, T.; Maruyama, N.; Shinohara, Y.; Asahi, H.; Shigesato, G.; Sugiyama, M.; Koseki, T. Abnormal αto γtransformation behavior of steels with a martensite and bainite microstructure at a slow reheating rate. ISIJ Int. 2009, 49, 1792–1800. [Google Scholar] [CrossRef] [Green Version]
- Boratto, F.; Barbosa, R.; Yue, S.; Jonas, J.J. Effect of chemical composition on critical temperature of microalloyed steels. In Proceedings of the International Conference on Physical Metallurgy of Thermomechanical Processing of Steels and Other Metals (THERMEC‘88), Tokyo, Japan, 6–10 June 1988; pp. 383–390. [Google Scholar]
- Guo, H.; Sun, X.R.; Yang, S.W.; Wang, X.M.; Shang, C.J. A Study on Cu and Nb Precipitation during High Temperature Tempering in Low Carbon Steels. Adv. Mater. Res. 2012, 430–432, 453–457. [Google Scholar] [CrossRef]
- Zajac, S.; Schwinn, V.; Tacke, K.H. Characterisation and Quantification of Complex Bainitic Microstructures in High and Ultra-High Strength Linepipe Steels. Mater. Sci. Forum 2005, 500–501, 387–394. [Google Scholar] [CrossRef]
- Hannula, J.; Porter, D.; Kaijalainen, A.; Somani, M.; Kömi, J. Mechanical Properties of Direct-Quenched Ultra-High-Strength Steel Alloyed with Molybdenum and Niobium. Metals 2019, 9, 350. [Google Scholar] [CrossRef] [Green Version]
- Kaijalainen, A.; Vähäkuopus, N.; Somani, M.; Mehtonen, S.; Porter, D.; Kömi, J. The Effects of Finish Rolling Temperature and Niobium Microalloying on the Microstructure and Properties of a Direct Quenched High-Strength Steel. Arch. Metall. Mater. 2017, 62, 619–626. [Google Scholar] [CrossRef]
Figure 1.
Gleeble simulation test plans for CCT diagrams: (a) without deformation, (b) with 3 × 0.2 prior deformation.
Figure 1.
Gleeble simulation test plans for CCT diagrams: (a) without deformation, (b) with 3 × 0.2 prior deformation.

Figure 2.
Dilatometry curves of DQ steel from CCT Gleeble tests without deformation.

Figure 3.
CCT diagrams of investigated steels, (a,d) DQ, (b,e) DQ + 0.02Nb, (c,f) DQ + 0.05 Nb. Upper row: no deformation; lower row: 3 × 0.2 prior deformation.
Figure 3.
CCT diagrams of investigated steels, (a,d) DQ, (b,e) DQ + 0.02Nb, (c,f) DQ + 0.05 Nb. Upper row: no deformation; lower row: 3 × 0.2 prior deformation.

Figure 4.
Microstructures of DQ steel after CCT tests in the Gleeble simulator, no deformation. Cooling rates 3–96 °C/s (a–f).
Figure 4.
Microstructures of DQ steel after CCT tests in the Gleeble simulator, no deformation. Cooling rates 3–96 °C/s (a–f).

Figure 5.
Average prior austenite grain sizes of investigated steels at different soaking temperatures.
Figure 5.
Average prior austenite grain sizes of investigated steels at different soaking temperatures.

Figure 6.
Prior austenite grains after soaking treatments. (a,d) DQ steel, (b,e) DQ + 0.02Nb, (c,f) DQ + 0.05Nb. Upper row 1050 °C, lower row 1200 °C. Grain boundaries highlighted.
Figure 6.
Prior austenite grains after soaking treatments. (a,d) DQ steel, (b,e) DQ + 0.02Nb, (c,f) DQ + 0.05Nb. Upper row 1050 °C, lower row 1200 °C. Grain boundaries highlighted.

Figure 7.
Thermo-Calc simulations under equilibrium conditions for (a) DQ, (b) DQ + 0.02Nb and (c) DQ + 0.05Nb steels.
Figure 7.
Thermo-Calc simulations under equilibrium conditions for (a) DQ, (b) DQ + 0.02Nb and (c) DQ + 0.05Nb steels.

Figure 8.
Prior austenite grain boundaries of investigated steels; upper row: FRT 920 °C, lower row: FRT 820 °C. (a,d) DQ, (b,e) DQ+0.02Nb, (c,f) DQ+0.05Nb. Picral etching.
Figure 8.
Prior austenite grain boundaries of investigated steels; upper row: FRT 920 °C, lower row: FRT 820 °C. (a,d) DQ, (b,e) DQ+0.02Nb, (c,f) DQ+0.05Nb. Picral etching.

Figure 9.
Typical microstructures of investigated steels recorded by FESEM; upper row: FRT 920 °C, lower row: FRT 820 °C. (a,d) DQ, (b,e) DQ + 0.02Nb, (c,f) DQ + 0.05Nb. Nital etching.
Figure 9.
Typical microstructures of investigated steels recorded by FESEM; upper row: FRT 920 °C, lower row: FRT 820 °C. (a,d) DQ, (b,e) DQ + 0.02Nb, (c,f) DQ + 0.05Nb. Nital etching.

Figure 10.
Transmission electron microscopy (TEM) microstructures of DQ + 0.02Nb steel with FRT of 820 °C.
Figure 10.
Transmission electron microscopy (TEM) microstructures of DQ + 0.02Nb steel with FRT of 820 °C.

Figure 11.
Effective grain, lath sizes and coarsest grains (d90%) of the specimens. (a) FRT 920 °C, (b) 820 °C.
Figure 11.
Effective grain, lath sizes and coarsest grains (d90%) of the specimens. (a) FRT 920 °C, (b) 820 °C.

Figure 12.
Grain boundary misorientation distributions (>2.5 deg) of investigated steels. (a) 920 °C, (b) 820 °C.
Figure 12.
Grain boundary misorientation distributions (>2.5 deg) of investigated steels. (a) 920 °C, (b) 820 °C.

Figure 13.
Low angle (2.5–15°, red lines) and high angle (>15°, black lines) boundaries of the investigated steels; upper row: FRT 920 °C, lower row: FRT 820 °C. (a,d) DQ, (b,e) DQ + 0.02Nb, (c,f) DQ + 0.05Nb.
Figure 13.
Low angle (2.5–15°, red lines) and high angle (>15°, black lines) boundaries of the investigated steels; upper row: FRT 920 °C, lower row: FRT 820 °C. (a,d) DQ, (b,e) DQ + 0.02Nb, (c,f) DQ + 0.05Nb.

Figure 14.
Tensile strength and mid-thickness Vickers hardness (HV10) values of investigated steels.
Figure 14.
Tensile strength and mid-thickness Vickers hardness (HV10) values of investigated steels.

Figure 15.
Longitudinal Charpy V-transition curves of investigated steels, (a) 920 °C, (b) 820 °C. Half-size Charpy specimens.
Figure 15.
Longitudinal Charpy V-transition curves of investigated steels, (a) 920 °C, (b) 820 °C. Half-size Charpy specimens.

Figure 16.
Relationship between 34 J/cm2 transition temperatures (longitudinal RD specimens) and yield strengths.
Figure 16.
Relationship between 34 J/cm2 transition temperatures (longitudinal RD specimens) and yield strengths.


Table 1.
Chemical compositions of the investigated steels in wt.%.
| Steel Code | C | Si | Mn | P | S | Cr | Mo | Ti | Nb | Al | B | N |
|---|---|---|---|---|---|---|---|---|---|---|---|---|
| DQ | 0.071 | 0.24 | 1.87 | 0.004 | 0.003 | 1.1 | 0.15 | 0.017 | 0.003 | 0.061 | 0.0026 | 0.0026 |
| DQ+0.02Nb | 0.077 | 0.25 | 1.82 | 0.004 | 0.003 | 1.1 | 0.15 | 0.018 | 0.025 | 0.061 | 0.0024 | 0.0030 |
| DQ+0.05Nb | 0.078 | 0.26 | 1.91 | 0.004 | 0.003 | 1.0 | 0.15 | 0.017 | 0.053 | 0.063 | 0.0024 | 0.0023 |
Table 2.
Hot rolling pass schedules.
| Pass # | Thickness [mm] | Temperature [°C] | Rolling Reduction [%] |
|---|---|---|---|
| - | 55 | 1250 | |
| 1 | 45 | 1200 | 18 |
| 2 | 30 | 1150 | 33 |
| 3 | 21.5 | 1040/1100 | 28 |
| 4 | 14.5 | 970/1070 | 33 |
| 5 | 9 | 900/1000 | 38 |
| 6 | 6 | 820/920 | 33 |
Note: Low FRT on the left and high FRT on the right of passes # 3–6.
Table 3.
Austenite grain structure parameters, data from reference [10].
Table 3.
Austenite grain structure parameters, data from reference [10].
| Parameter | Equation |
|---|---|
| r | dRD/dND |
| Rtot. | 1− √(1/r) |
| Sv | 0.429 × (1/dRD) + 0.571 × (1/dTD) + (1/dND) |
| d | (dRD × dTD × dND)⅓ |
Table 4.
Calculated non-recrystallization temperatures (TNR) of the investigated steels.
| Steel | TNR [°C] |
|---|---|
| DQ | 856 |
| DQ+0.02Nb | 931 |
| DQ+0.05Nb | 1062 |
Table 5.
Prior austenite grain structure parameters and estimated total reduction in the TNR regime.
Table 5.
Prior austenite grain structure parameters and estimated total reduction in the TNR regime.
| FRT | Steel | dRD [μm] | dND [μm] | dTD [μm] | d [μm] | Sv [mm2/mm3] | Rtot. [%] |
|---|---|---|---|---|---|---|---|
| 920 °C | DQ | 14.4 ± 0.6 | 11.4 ± 0.5 | 14.0 ± 0.6 | 13.2 ± 0.3 | 158 | 11.1 |
| DQ+0.02Nb | 16.1 ± 0.7 | 7.3 ± 0.3 | 12.8 ± 0.5 | 11.5 ± 0.3 | 208 | 32.6 | |
| DQ+0.05Nb | 19.2 ± 0.9 | 6.9 ± 0.3 | 13.2 ± 0.6 | 12.1 ± 0.3 | 210 | 40.0 | |
| 820 °C | DQ | 13.3 ± 0.6 | 5.4 ± 0.2 | 13.1 ± 0.6 | 9.8 ± 0.2 | 260 | 36.2 |
| DQ+0.02Nb | 17.2 ± 0.7 | 4.8 ± 0.1 | 12.2 ± 0.5 | 10.0 ± 0.2 | 282 | 47.4 | |
| DQ+0.05Nb | 26.0 ± 1.3 | 4.4 ± 0.1 | 16.2 ± 0.6 | 12.3 ± 0.3 | 278 | 58.8 |
Table 6.
Tensile properties of the investigated steels.
| FRT | Steel | Rp0.2 [MPa] | Rm [MPa] | A [%] | Agt [%] | Rp0.2/Rm | Rm.A [MPa%] |
|---|---|---|---|---|---|---|---|
| 920 °C | DQ | 943 ± 20 | 1151 ± 11 | 12.2 ± 0.3 | 3.1 ± 0.1 | 0.82 | 14036 |
| DQ+0.02Nb | 1014 ± 6 | 1195 ± 8 | 11.2 ± 0.4 | 3.1 ± 0.0 | 0.85 | 13384 | |
| DQ+0.05Nb | 1011 ± 14 | 1208 ± 10 | 12.2 ± 0.7 | 3.0 ± 0.1 | 0.84 | 14738 | |
| 820 °C | DQ | 1022 ± 3 | 1215 ± 1 | 12.2 ± 0.6 | 2.8 ± 0.1 | 0.84 | 14756 |
| DQ+0.02Nb | 1067 ± 8 | 1245 ± 8 | 12.2 ± 0.2 | 2.7 ± 0.1 | 0.86 | 15189 | |
| DQ+0.05Nb | 1060 ± 10 | 1262 ± 6 | 12.2 ± 1.1 | 3.1 ± 0.1 | 0.84 | 15396 |
Agt is the total (elastic + plastic) uniform elongation (as defined in ISO 6892-1:2009).
Table 7.
Charpy V impact properties of the investigated steels in rolling direction.
| FRT | Steel | T34J/cm2 [°C] | TUS [°C] | EUS [J/cm2] |
|---|---|---|---|---|
| 920 °C | Nb-free | −66 | 50 | 130 |
| DQ + 0.02Nb | −56 | 50 | 121 | |
| DQ + 0.05Nb | −53 | 50 | 112 | |
| 820 °C | Nb-free | −67 | 20 | 107 |
| DQ + 0.02Nb | −67 | 20 | 112 | |
| DQ + 0.05Nb | −58 | 20 | 103 |
T34J/cm2 = 34 J/cm2 transition temperature, TUS = Upper shelf temperature, EUS = Upper shelf energy.
© 2020 by the authors. Licensee MDPI, Basel, Switzerland. This article is an open access article distributed under the terms and conditions of the Creative Commons Attribution (CC BY) license (http://creativecommons.org/licenses/by/4.0/).
Share and Cite
MDPI and ACS Style
Hannula, J.; Porter, D.; Kaijalainen, A.; Somani, M.; Kömi, J. Optimization of Niobium Content in Direct Quenched High-Strength Steels. Metals 2020, 10, 807. https://doi.org/10.3390/met10060807
AMA Style
Hannula J, Porter D, Kaijalainen A, Somani M, Kömi J. Optimization of Niobium Content in Direct Quenched High-Strength Steels. Metals. 2020; 10(6):807. https://doi.org/10.3390/met10060807
Chicago/Turabian StyleHannula, Jaakko, David Porter, Antti Kaijalainen, Mahesh Somani, and Jukka Kömi. 2020. "Optimization of Niobium Content in Direct Quenched High-Strength Steels" Metals 10, no. 6: 807. https://doi.org/10.3390/met10060807
Note that from the first issue of 2016, this journal uses article numbers instead of page numbers. See further details here.