Research on Failure Mechanisms of Broken Strands of Jumper Wires for EHV Transmission Lines in Strong-Wind Areas

1
Power and Mechanical Engineering, Wuhan University, Wuhan 430072, China
2
Electric Power Research Institute, State Grid Fujian Electric Power Company Limited, Fujian 350007, China
3
Electric Power Research Institute, State Grid Xinjiang Electric Power Company Limited, Xinjiang 830000, China
*
Author to whom correspondence should be addressed.
Metals 2020, 10(1), 39; https://doi.org/10.3390/met10010039
Submission received: 19 November 2019
/
Revised: 15 December 2019
/
Accepted: 23 December 2019
/
Published: 24 December 2019
Abstract
:The jumper wires of an extra-high voltage (EHV) transmission line in strong-wind areas in Northwest China frequently break down. We installed some acquisition devices to collect the data of the jumper wires and wind speed in the fault area of one 750-kV transmission line. We also developed a swing simulation machine based on the collected data. The machine could simulate the swing condition of the jumper wires under various wind speeds. We analyzed the broken aluminum wires obtained from the simulation experiment of jumper wires. Yield lines appeared on the surface of the broken aluminum wires in the simulation experiment. Proliferation of dislocation and grain deformation occurred in the broken aluminum wires using transmission electron microscopy observation. The results show that the aluminum wires in the experiment under a Level-6 wind and above were in a full yield state and demonstrated strain-fatigue failure condition. The fracture of the broken aluminum wires showed distinct strain-fatigue fracture characteristics using the scanning electron microscope fracture morphology analysis. From the combination of the abovementioned research, we conclude that the failure mechanism of the broken strands of the jumper wires of the EHV transmission line in the strong-wind area is mainly a strain-fatigue failure mechanism.
1. Introduction
China’s West to East power transmission project has transmitted the abundant electric energy in the west to the developed areas in Eastern China. To improve transmission efficiency, many extra-high voltage (EHV) transmission lines have been built along the way [1], such as 750-kV transmission lines. These transmission lines pass through strong-wind areas in Northwest China. The transmission lines located in the strong-wind areas frequently break down, which cause large economic losses [2,3,4]. By considering the breakage of a 750-kV transmission line as an example, the economic loss can reach 9 million yuan daily.
The common failure mechanisms of broken conductor strands caused by wind load include aeolian vibration [5,6,7], subspan oscillation [8,9], and ice coating galloping [10,11,12]. Ma and Fadel studied the fretting wear behaviors of aluminum cable steel reinforced under different conditions by making the special fatigue experiment machine; Qi et al. [7] put forward a scheme of using vibration damper and damping wires to eliminate the adverse effect of aeolian vibration. Matsumiya and Diana studied the oscillations of multi bundled conductors through wind tunnel simulation tests. Lu, Zhang, [10] and Zhou [12] studied the characteristics of iced conductors galloping through carrying out wind tunnel tests and numerical simulation. These were instructive to the design of our research methods. Research on these mechanisms has been thorough, and relevant measures to prevent broken strand of conductors are relatively perfect. However, according to statistics, the jumper wires in strong-wind areas still frequently break down. Through analysis, we determined that the breakage of jumper wires does not belong to the conditions of the abovementioned conductor-failure mechanisms. The difference is that strong-wind condition is the main factor that causes the jumper wires to break. Therefore, we believe that the breakage of jumper wires in strong-wind areas may have been caused by another failure mechanism that has not yet been taken seriously.
In the present study, we analyzed typical jumper-wire-breakage accidents, collected key data in the fault area, developed a simulation machine for simulation experiment of the jumper-wire swing, and conducted many characterization analyses on broken aluminum wires obtained from the simulation experiment. We finally determined the actual jumper-wire-failure mechanism of EHV transmission lines in strong-wind areas and put forward the corresponding control measures.
The project involved in this paper is to research the failure mechanism of EHV transmission lines in strong-wind areas and propose control measures. The research works of the failure mechanism involve two parts: One is to build a simulation machine, mainly for simulation experiment; the other is to build a finite element model, mainly for numerical simulation. These two parts of research works are closely related, and their research results can be mutually corroborated. This paper mainly involves the first part of the research works.
2. Materials and Methods
2.1. Analysis of Typical Accidents
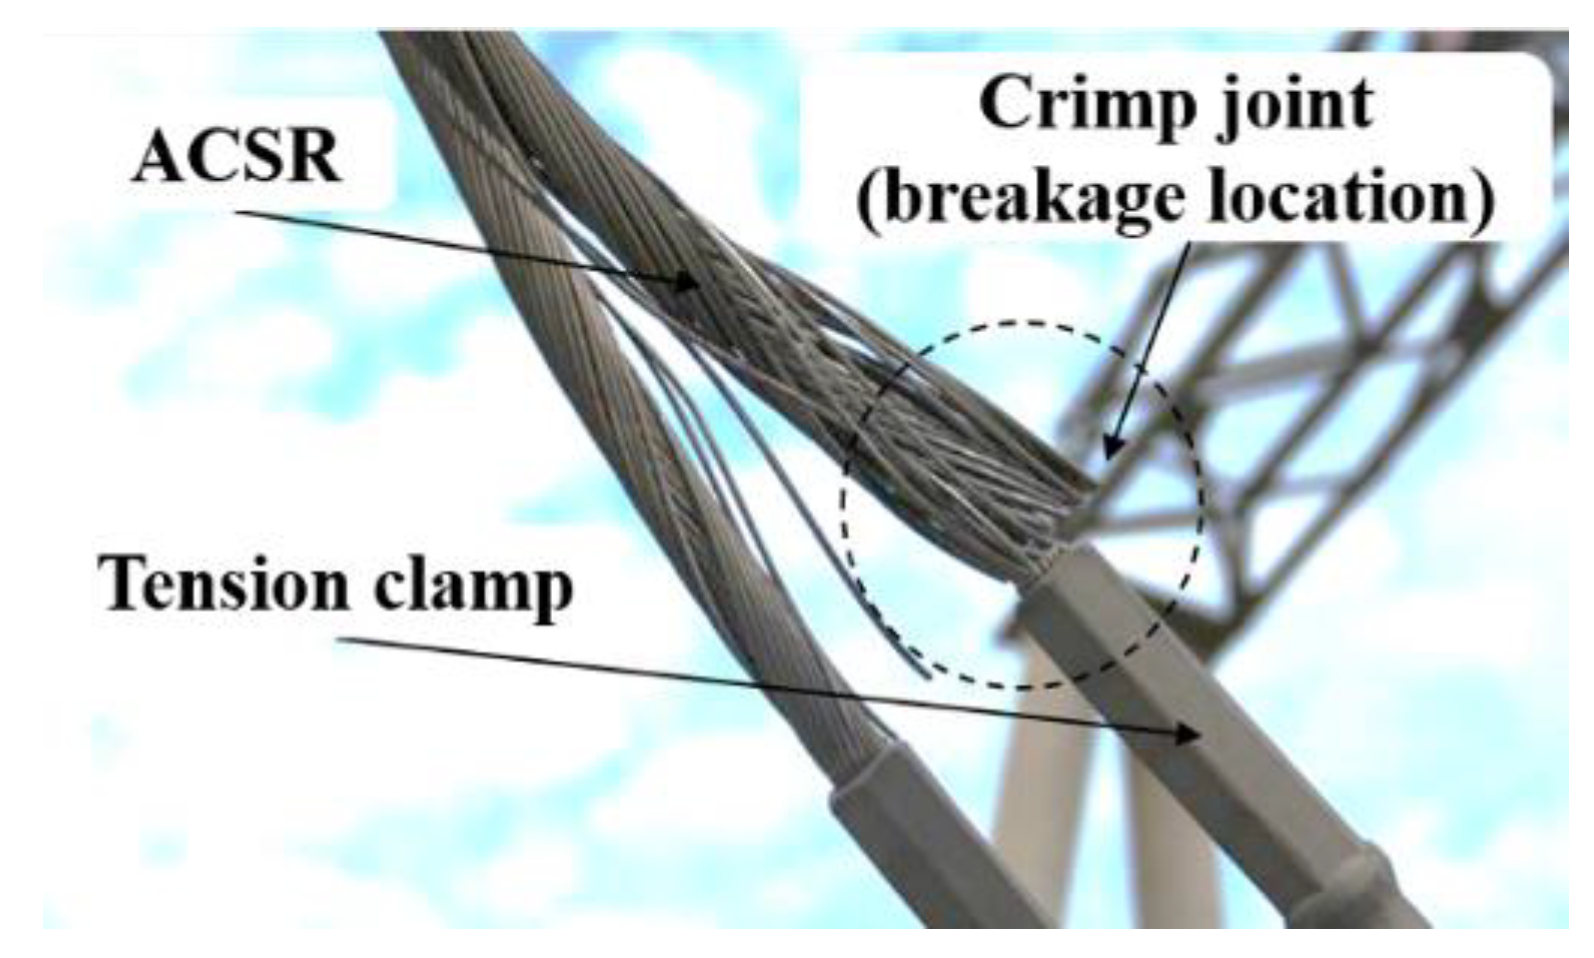
Through image analysis of the fault areas, we find that the jumper wires have been swaying for a long time under the influence of strong winds. The jumper wire is a type of aluminum conductor steel reinforced (ACSR) composed of internal steel cores and external aluminum wires. Figure 1 shows one typical case of broken strand of ACSR in strong-wind areas. Its real configuration is in the failure area within the dotted circle in Figure 2. The mid-phase jumpers and long-span wires are ACSR, which are connected by tension clamps. The breakage location (Figure 1) of the jumper wires is near the crimp joint between the ACSR and tension clamp. The breakage location here refers to the stress point of the ACSR. The broken strand of the jumper wires actually refers to the breakage of the ACSR aluminum wires. There is contact stress between the aluminum wires in ACSR.
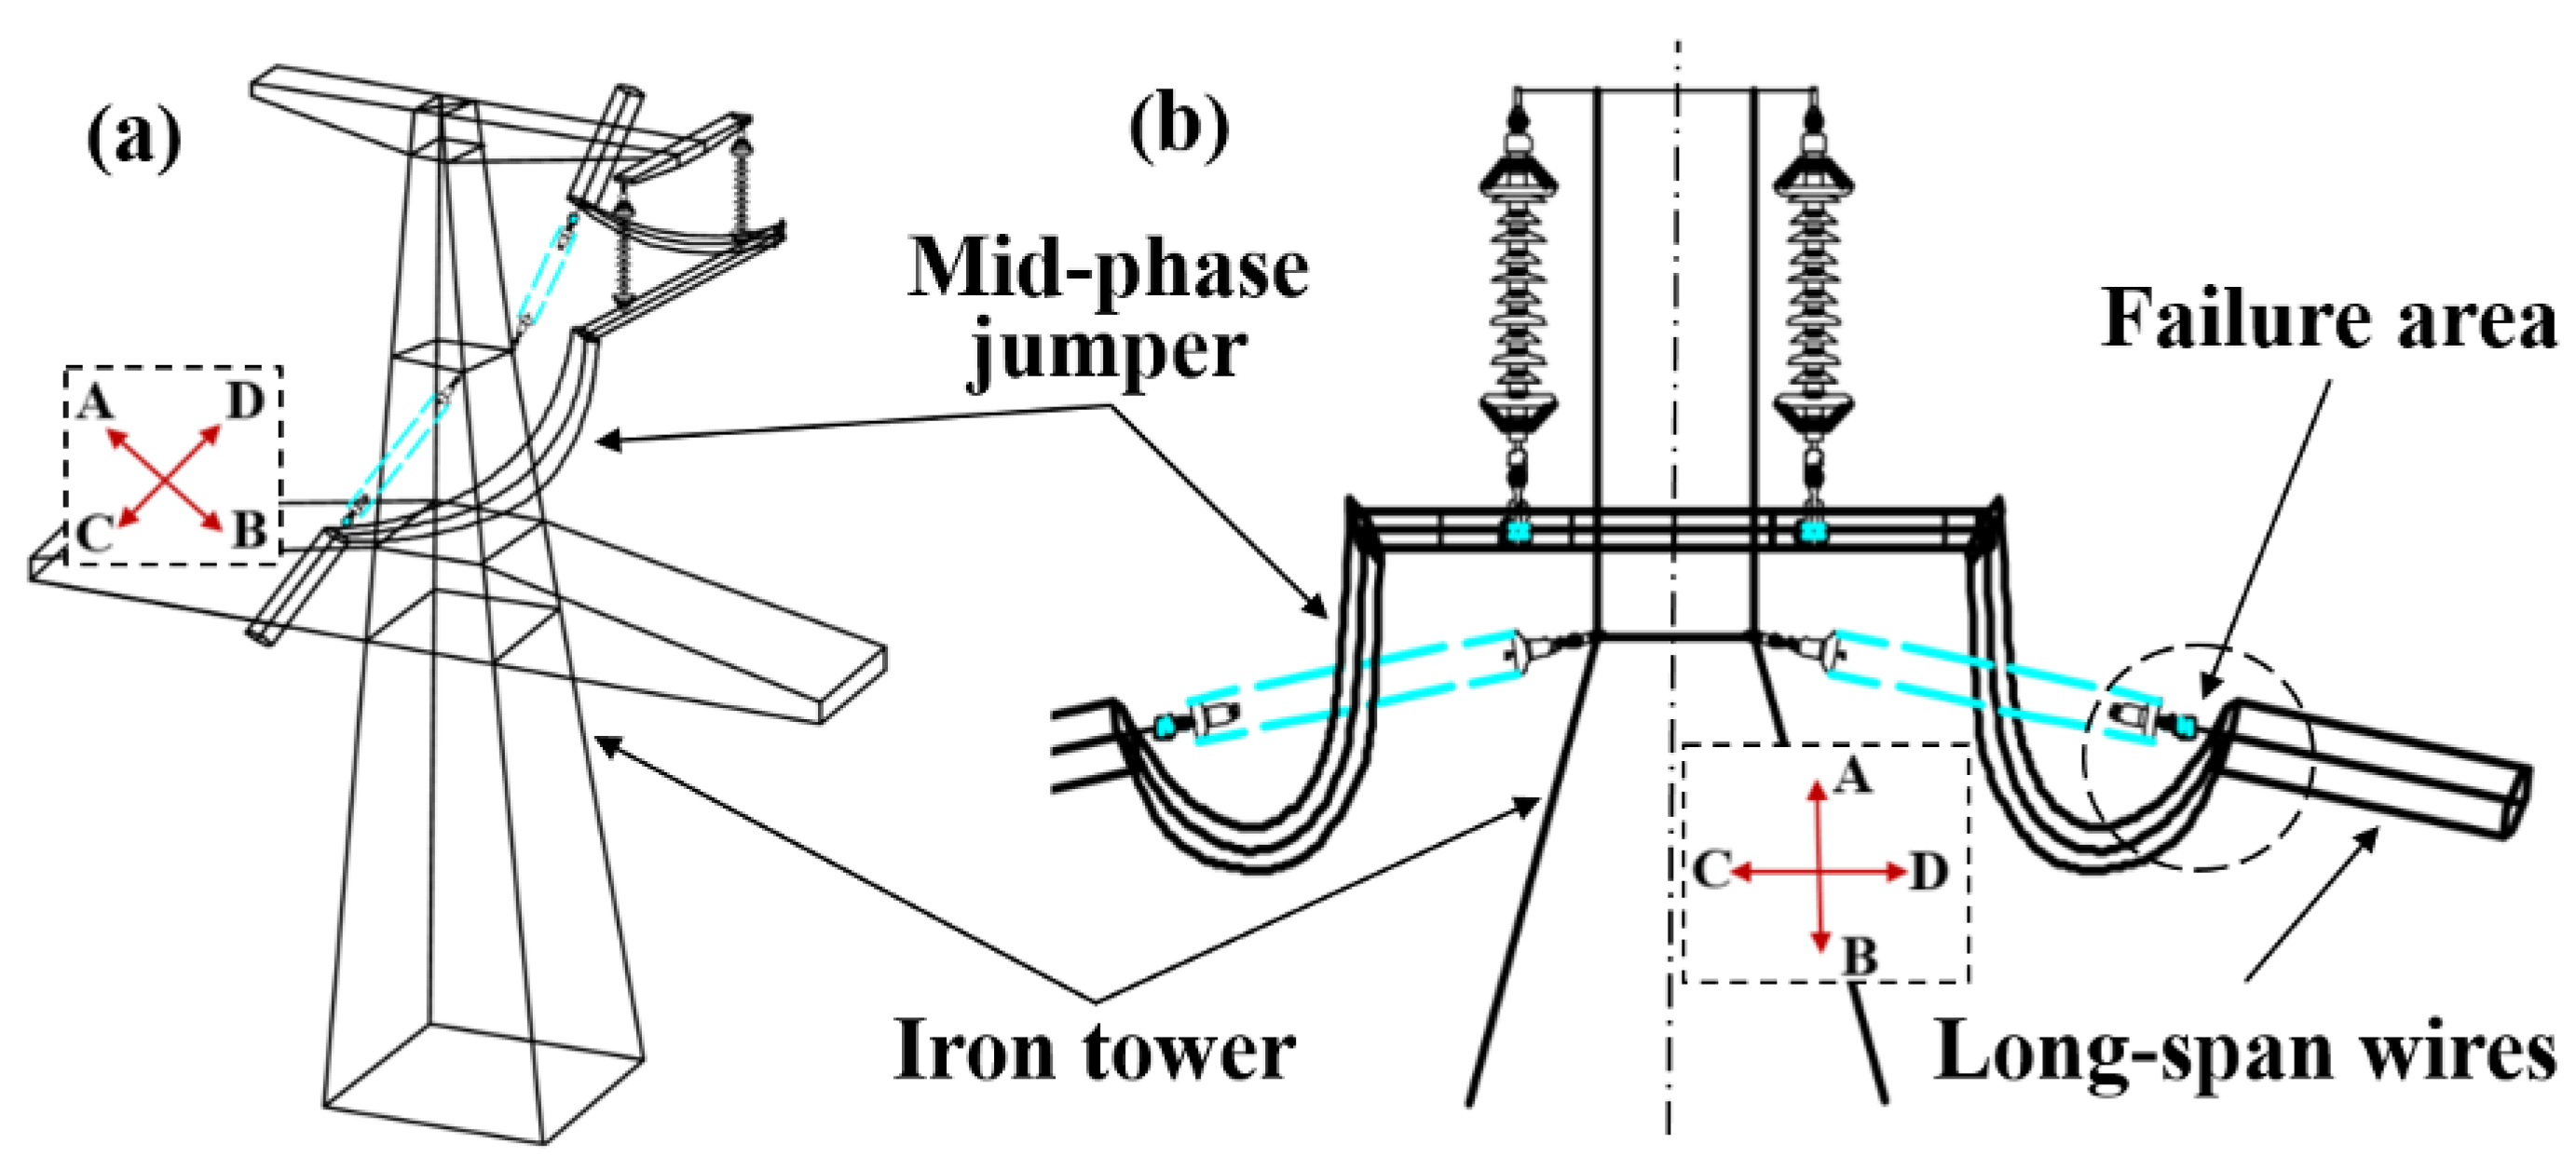
In this study, we researched the breakage of a mid-phase jumper to determine the failure mechanism of jumper wires in strong-wind areas. In 750-kV transmission lines, all lines consist of six multiple conductors composed of six ACSR wires. Figure 2 shows the installation diagram of the mid-phase jumper and long-span wire in one 750-kV transmission line. To prevent arcing between the wire and tower due to windage yaw, the mid-phase jumper is bent around the tower from one side [13]. We find that the mid-phase jumper and long-span wire form an approximate vertical relationship in space.
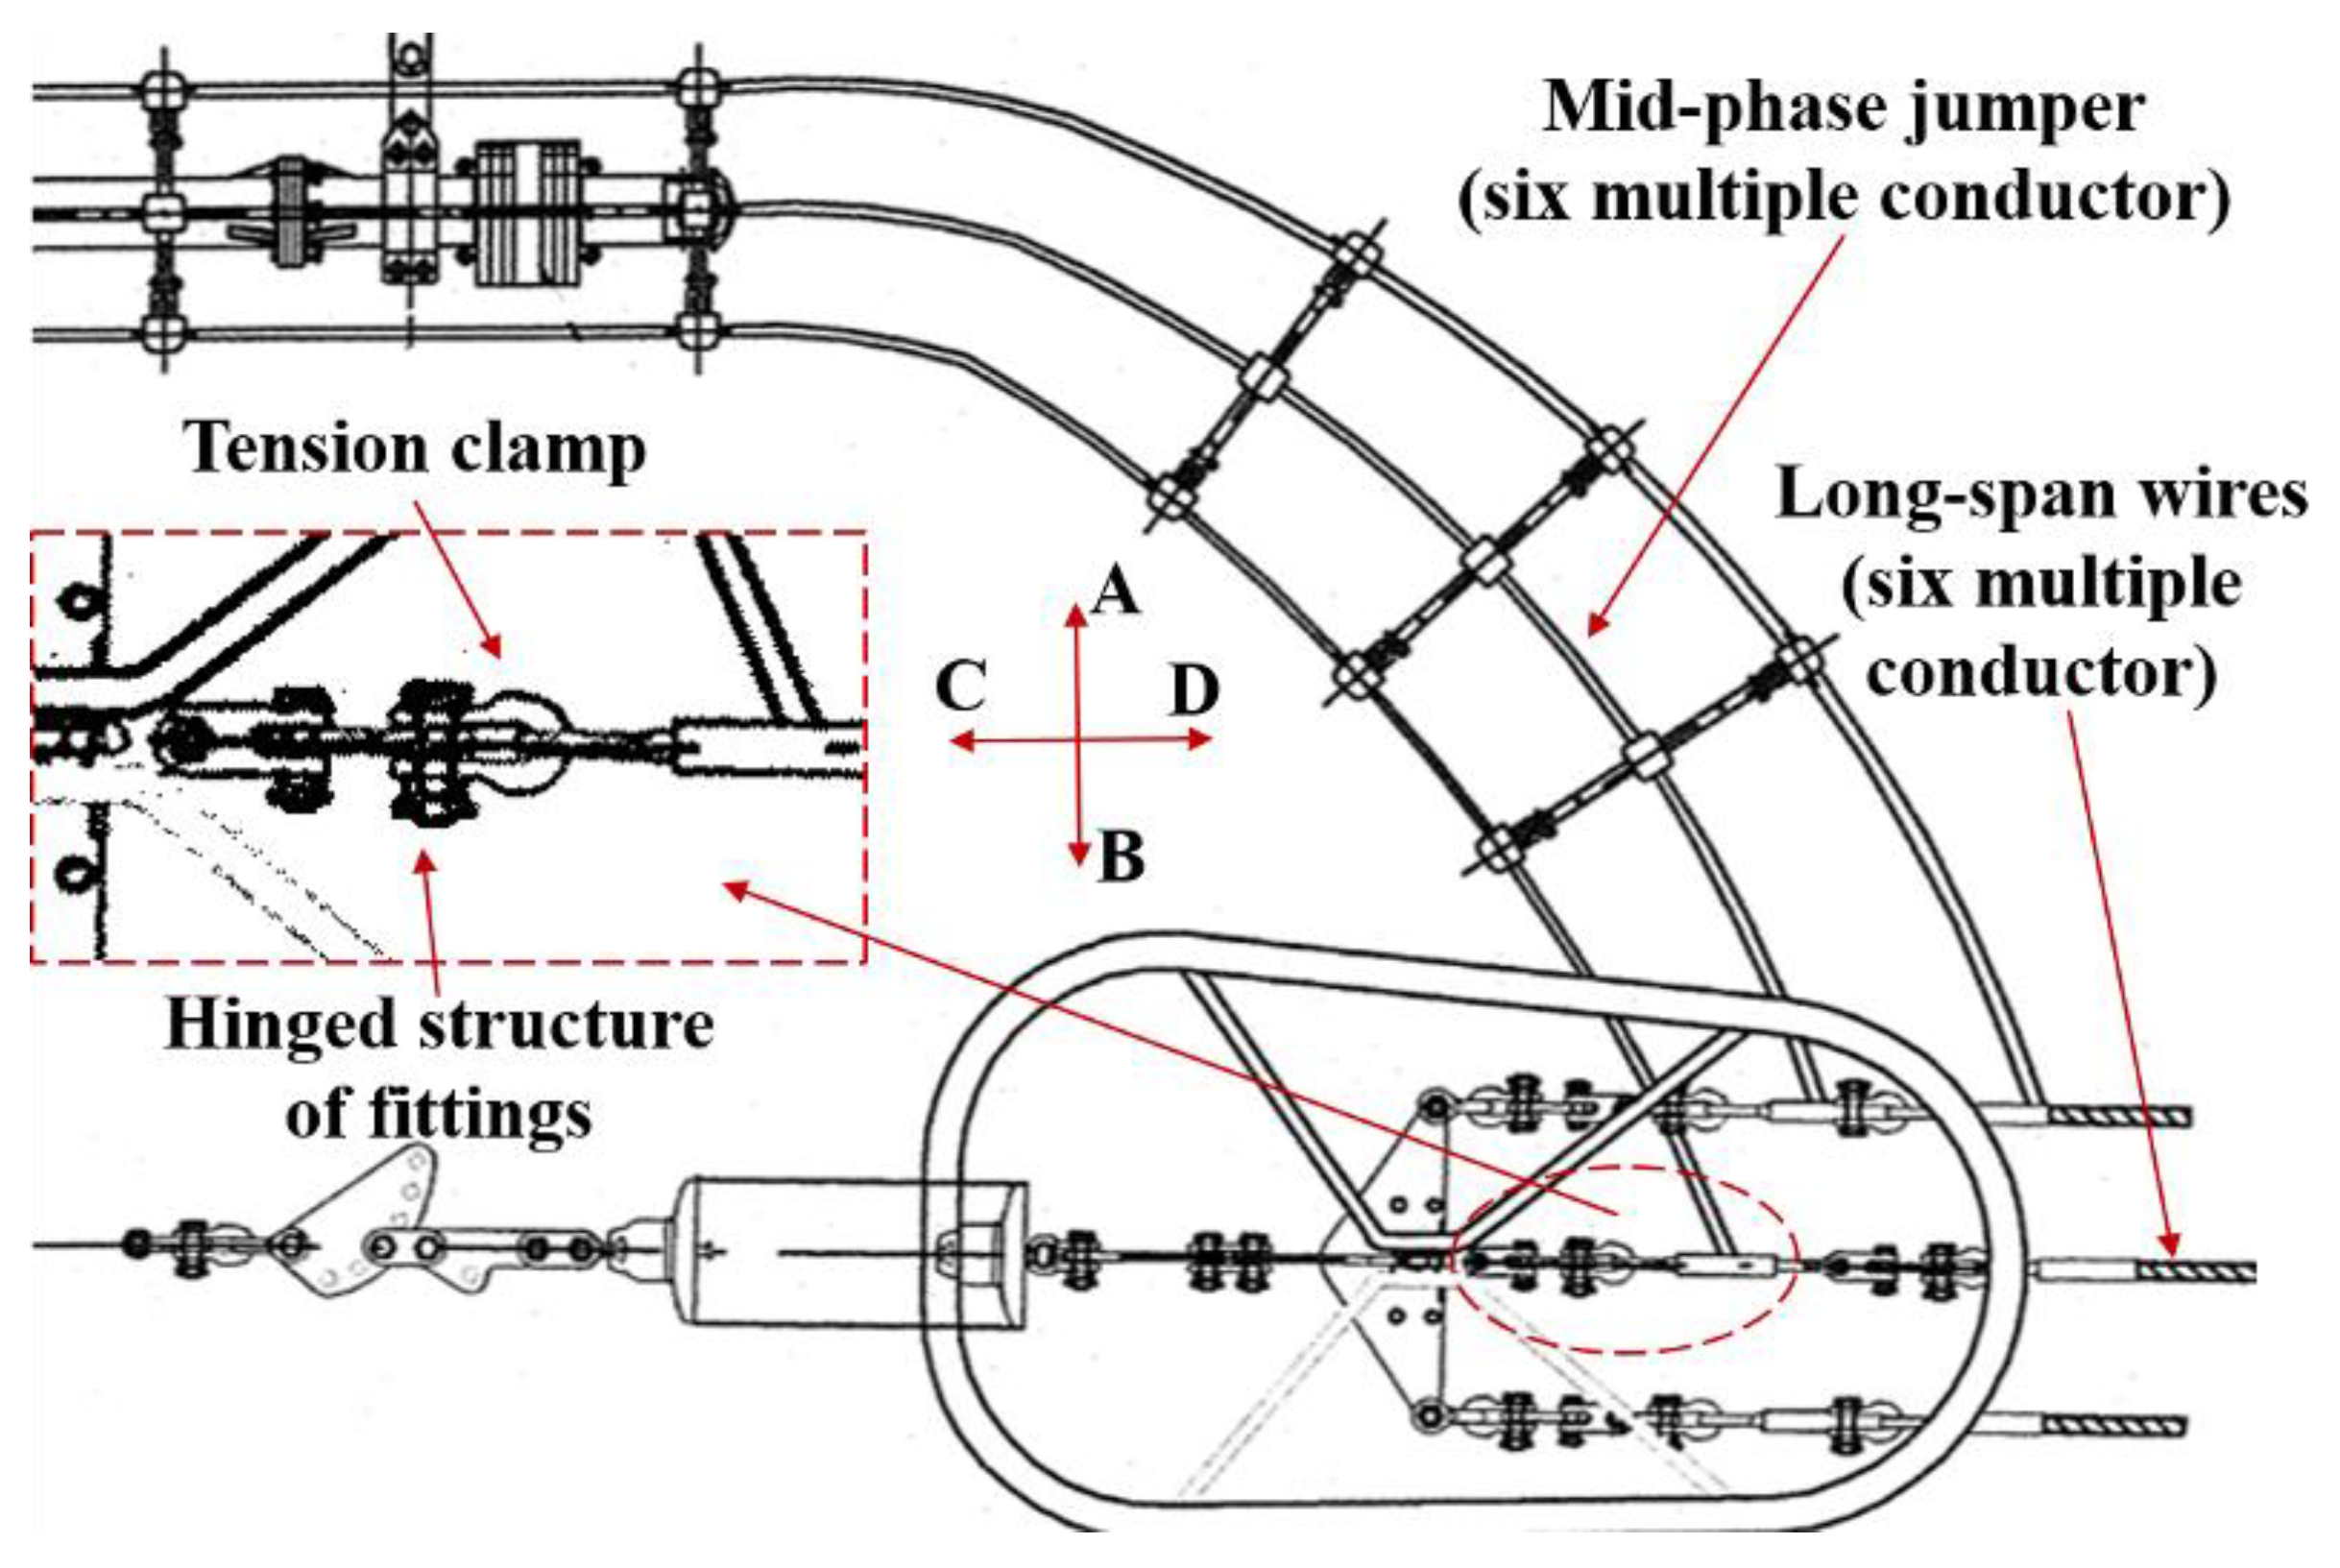
The hardware string in the dotted circle shown in Figure 3 is composed of a hanging ring, a hook, and a hanging plate (Figure 4), which is equivalent to a hinge connection structure [13]. When the long-span wires substantially swing under the influence of a strong wind, the hinge structure can produce a relative rotation in the A–B direction. The rotation in the A–B direction can effectively buffer the stress concentration caused by the swing between the end of the long-span wires and tension clamp.
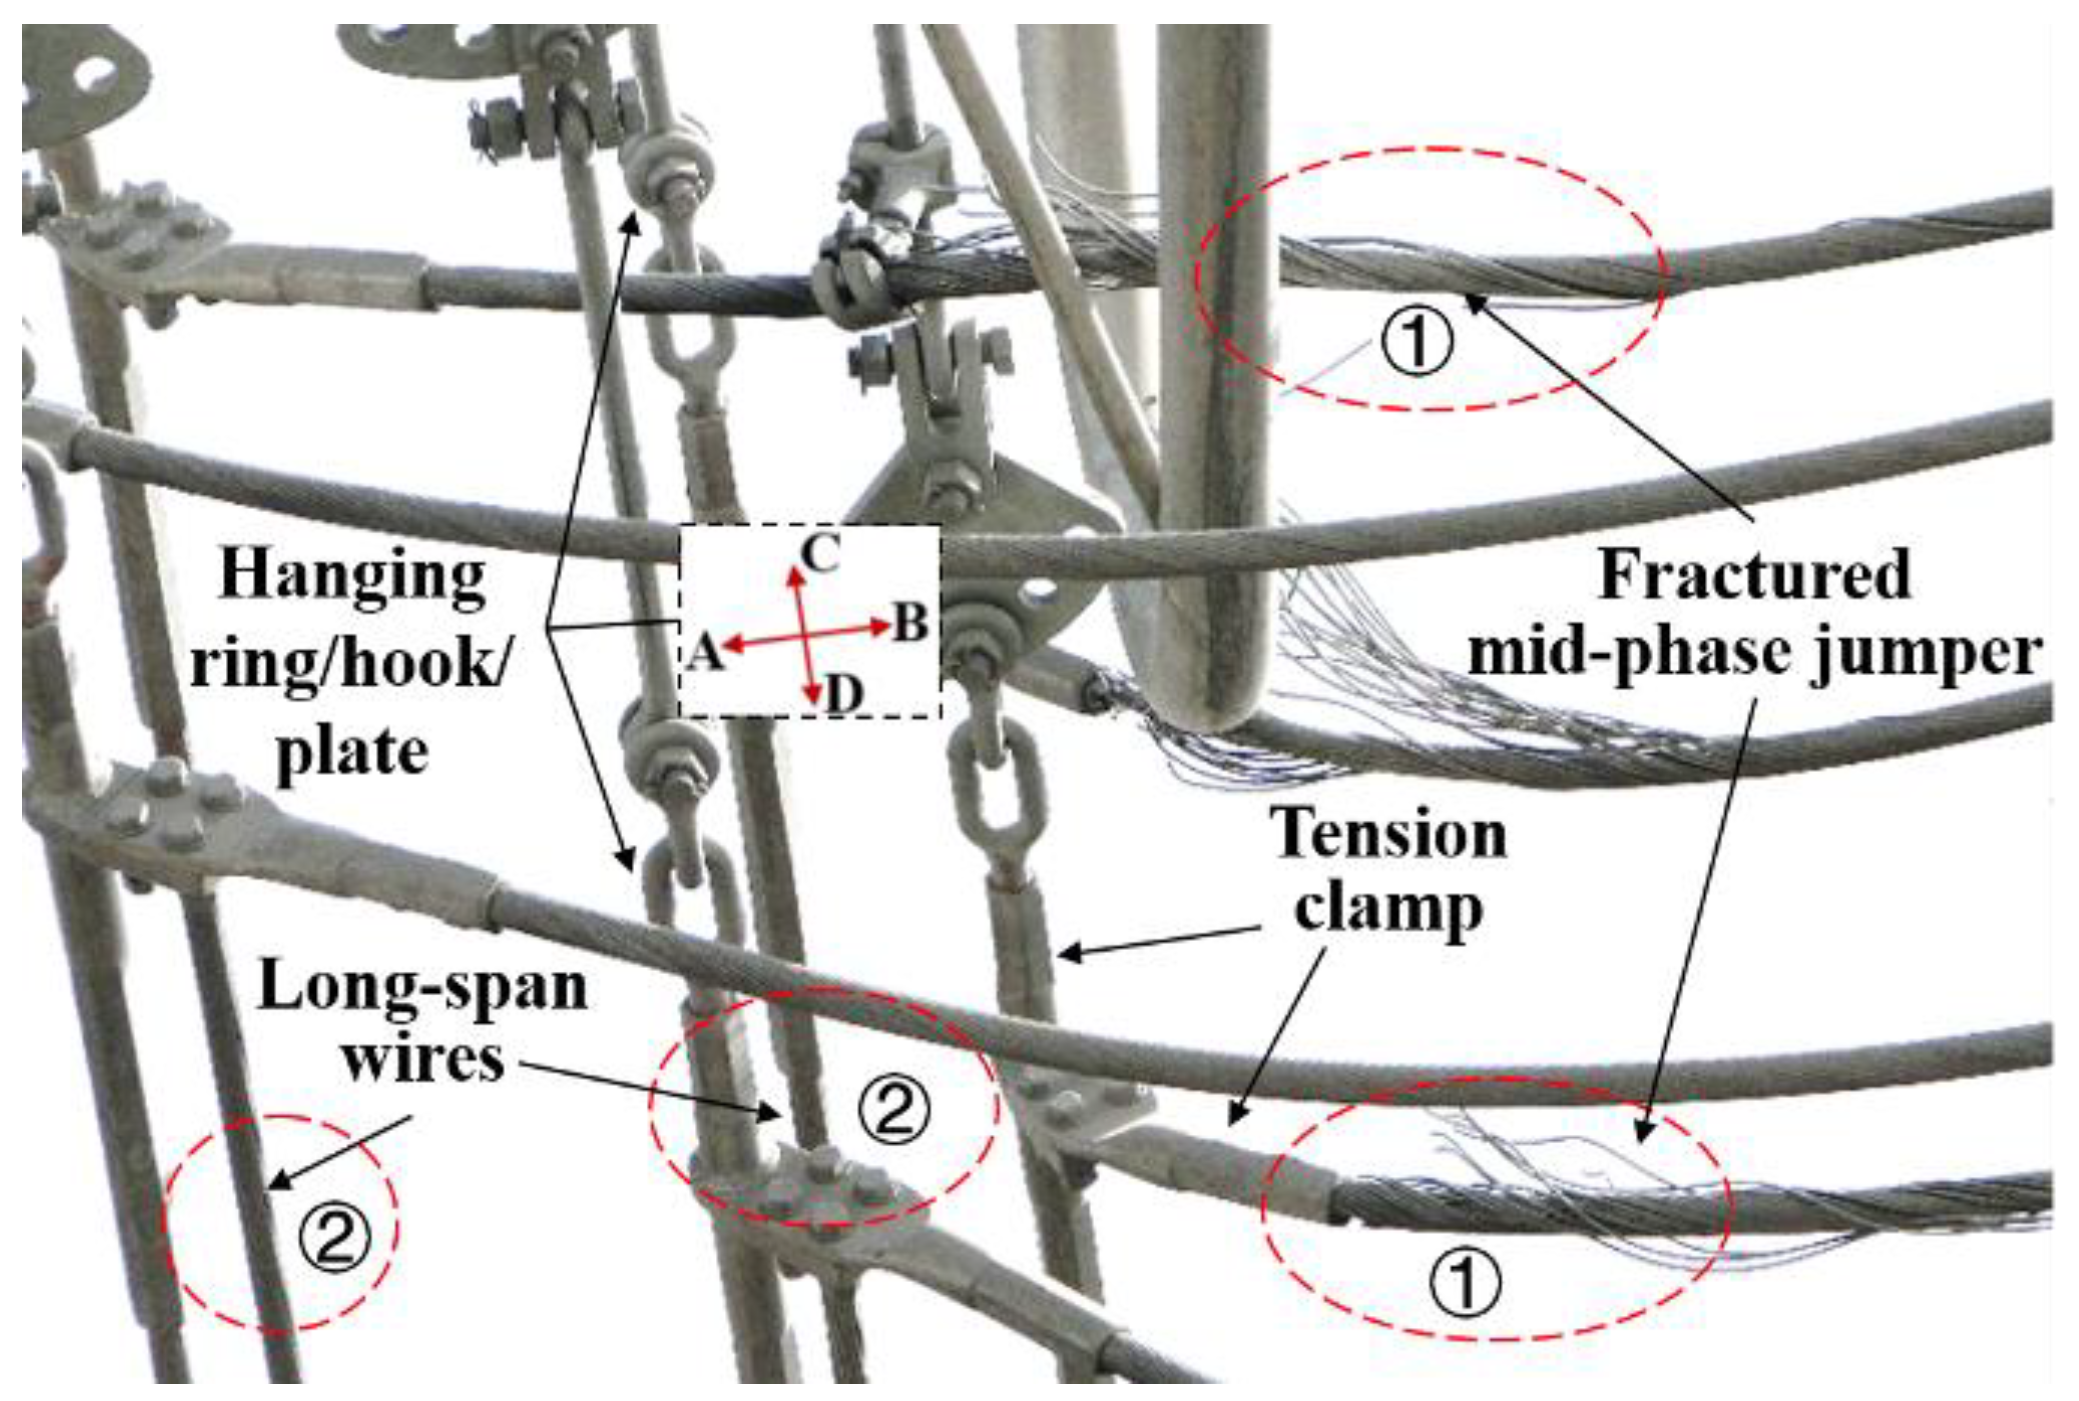
However, the hinge structure suffers from the difficulty of producing a relative rotation in the C–D direction because of the large tension in the long-span wires. Therefore, the buffering effect in the C–D direction basically fails when the mid-phase jumper wire substantially swings. Therefore, the crimping joint between the mid-phase jumper and tension clamp suffers from a greater stress concentration. The special structural conditions lead to different stress conditions at the end of the mid-phase jumper and that of the long-span wires. As shown in Figure 4, the final result is that the jumper wires at ① break, whereas the long-span wires at ② do not break.
2.2. Verification Method
According to the mechanics and motion analysis of the mid-phase-jumper fracture, we considered that the broken strand of the jumper wires in strong-wind areas could be due to a fatigue failure mechanism. However, the specific fatigue mechanism needs further research. Because of bad weather conditions and remote geographical location, we could not carry out long-term and effective experimental research in the fault site of the 750-kV transmission line. Therefore, we developed a swing-simulation machine to simulate the working conditions of the mid-phase jumper wires under various wind speeds to investigate the failure mechanism.
2.2.1. Jumper-Swing Monitoring System
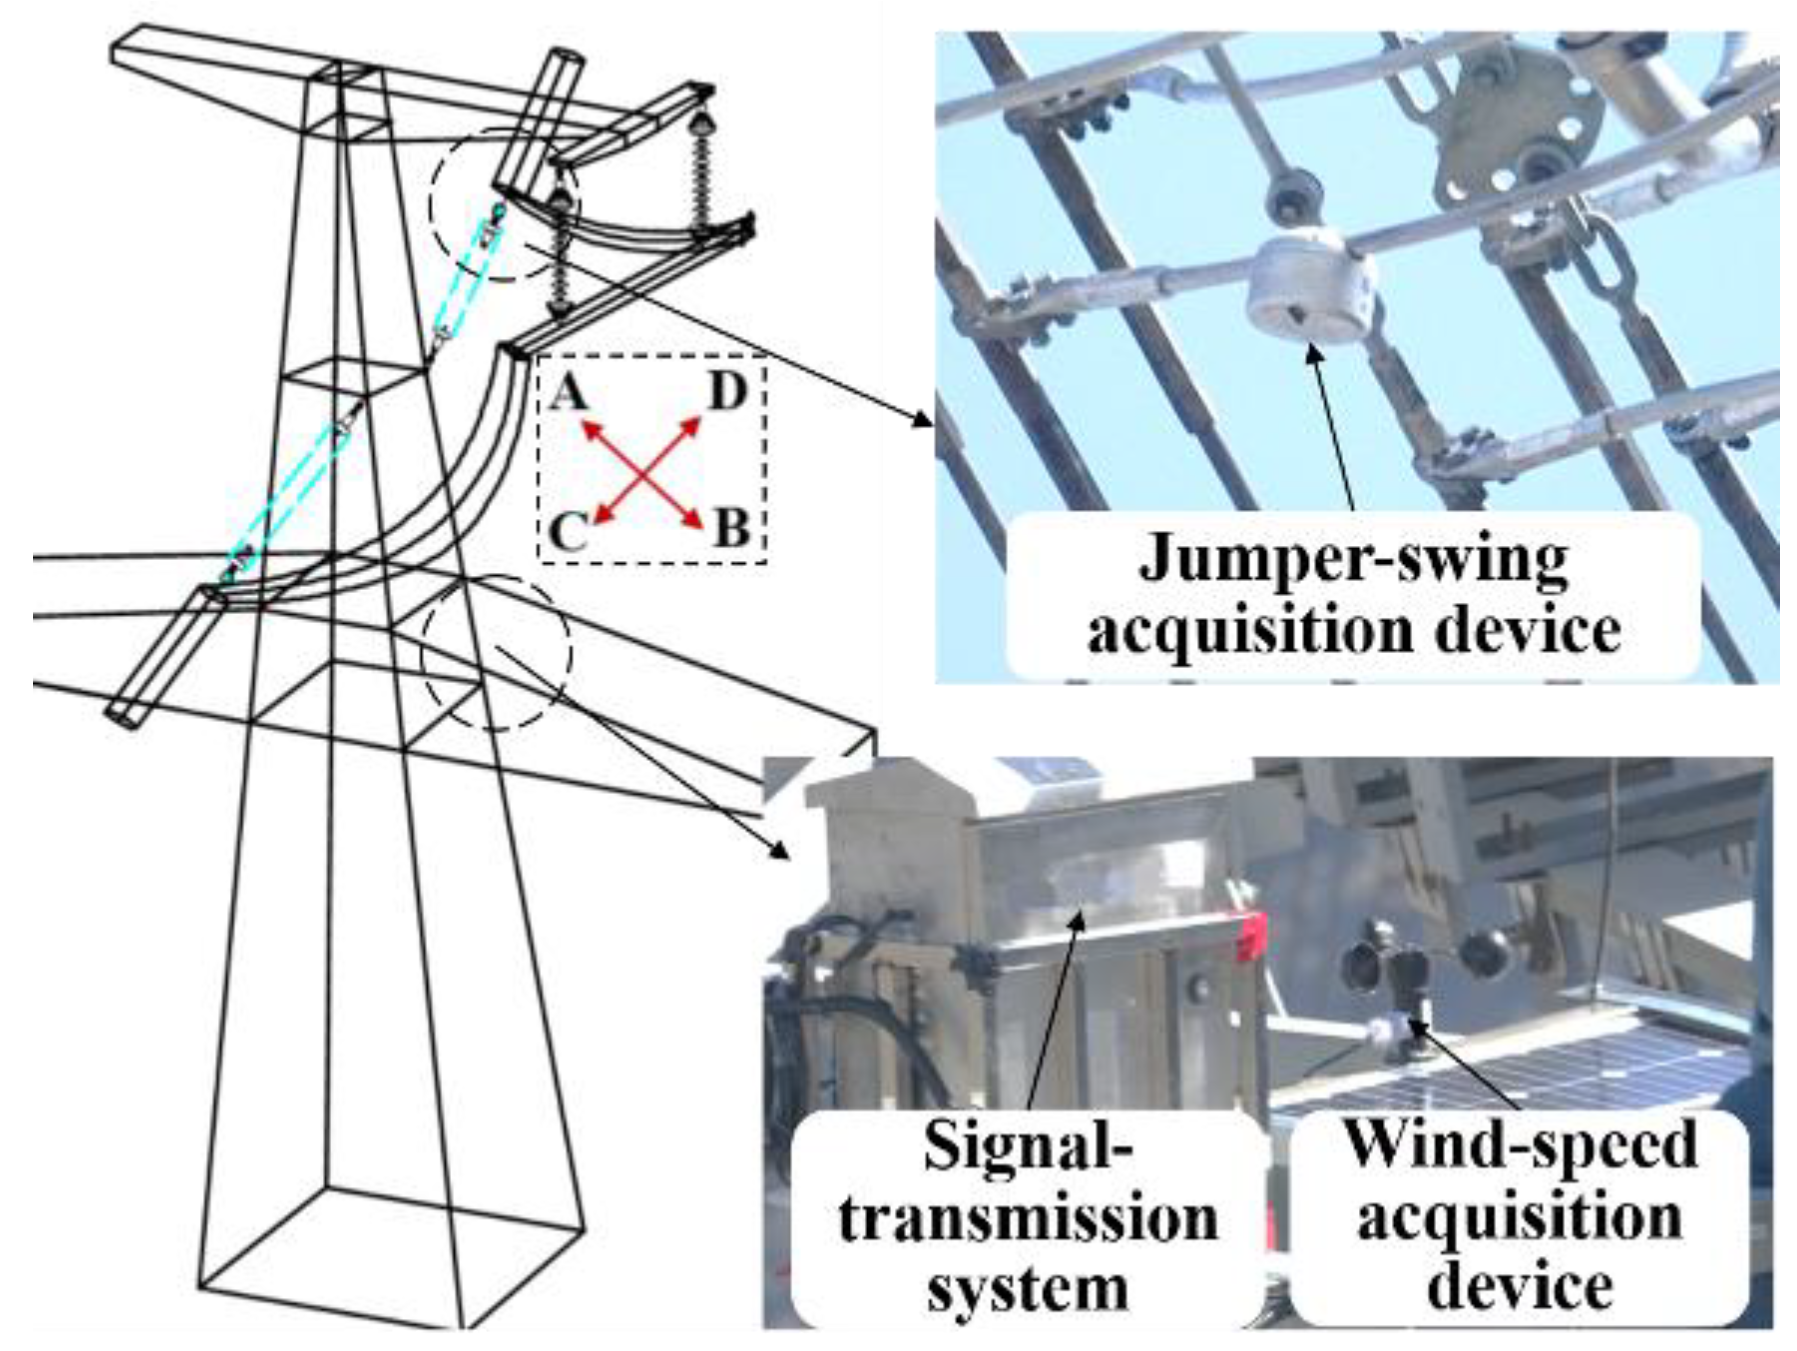
To ensure the accuracy of the swing-simulation machine, we needed to collect some key data of the fault area. Therefore, we designed and installed a set of jumper-swing monitoring system. The system, which was installed in the fault area of the 750-kV transmission line, could collect data on wind speed, swing angle, and swing frequency of the jumper.
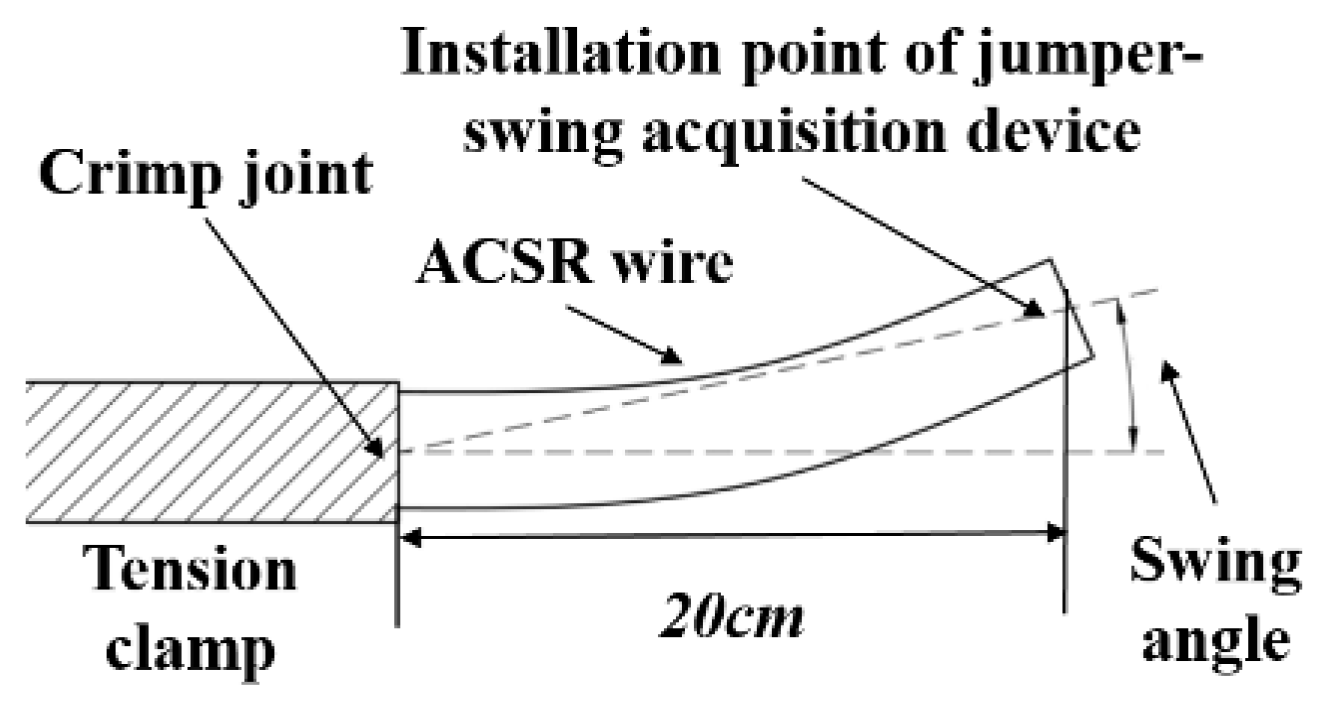
The system (Figure 5) included the jumper-swing acquisition device, wind-speed acquisition device, and signal-transmission system [14,15,16]. The jumper-swing acquisition device was installed in the mid-phase jumper 20 cm from the tension clamp (Figure 6). The swing frequency and swing angle of the mid-phase jumper under different wind speeds were collected by the swing acquisition device. The core component of the swing acquisition device is the acceleration sensor. The maximum swing angle and time of each swing cycle are calculated by a specific algorithm. One swing cycle means that the ACSR wire starts to swing from the highest point on one side until it returns to the highest point on the same side again. The swing frequency is calculated according to the time of one swing cycle. Figure 6 shows the definition of the swing angle.
The inner part of the swing acquisition device is sealed, and the outer part is aluminum alloy shell, which can ensure that the device works normally in the harsh climate environment. Each measurement time of the swing acquisition device is 1 min. The measurement interval and frequency can be controlled remotely according to the wind speed. Its battery can supply power effectively for 12 months. The wind-speed acquisition device was installed at the iron tower near the mid-phase jumper, and the wind-speed data were collected. In addition, a terminal for receiving the data was also set up in the laboratory [17,18].
2.2.2. Analysis of the Collected Data
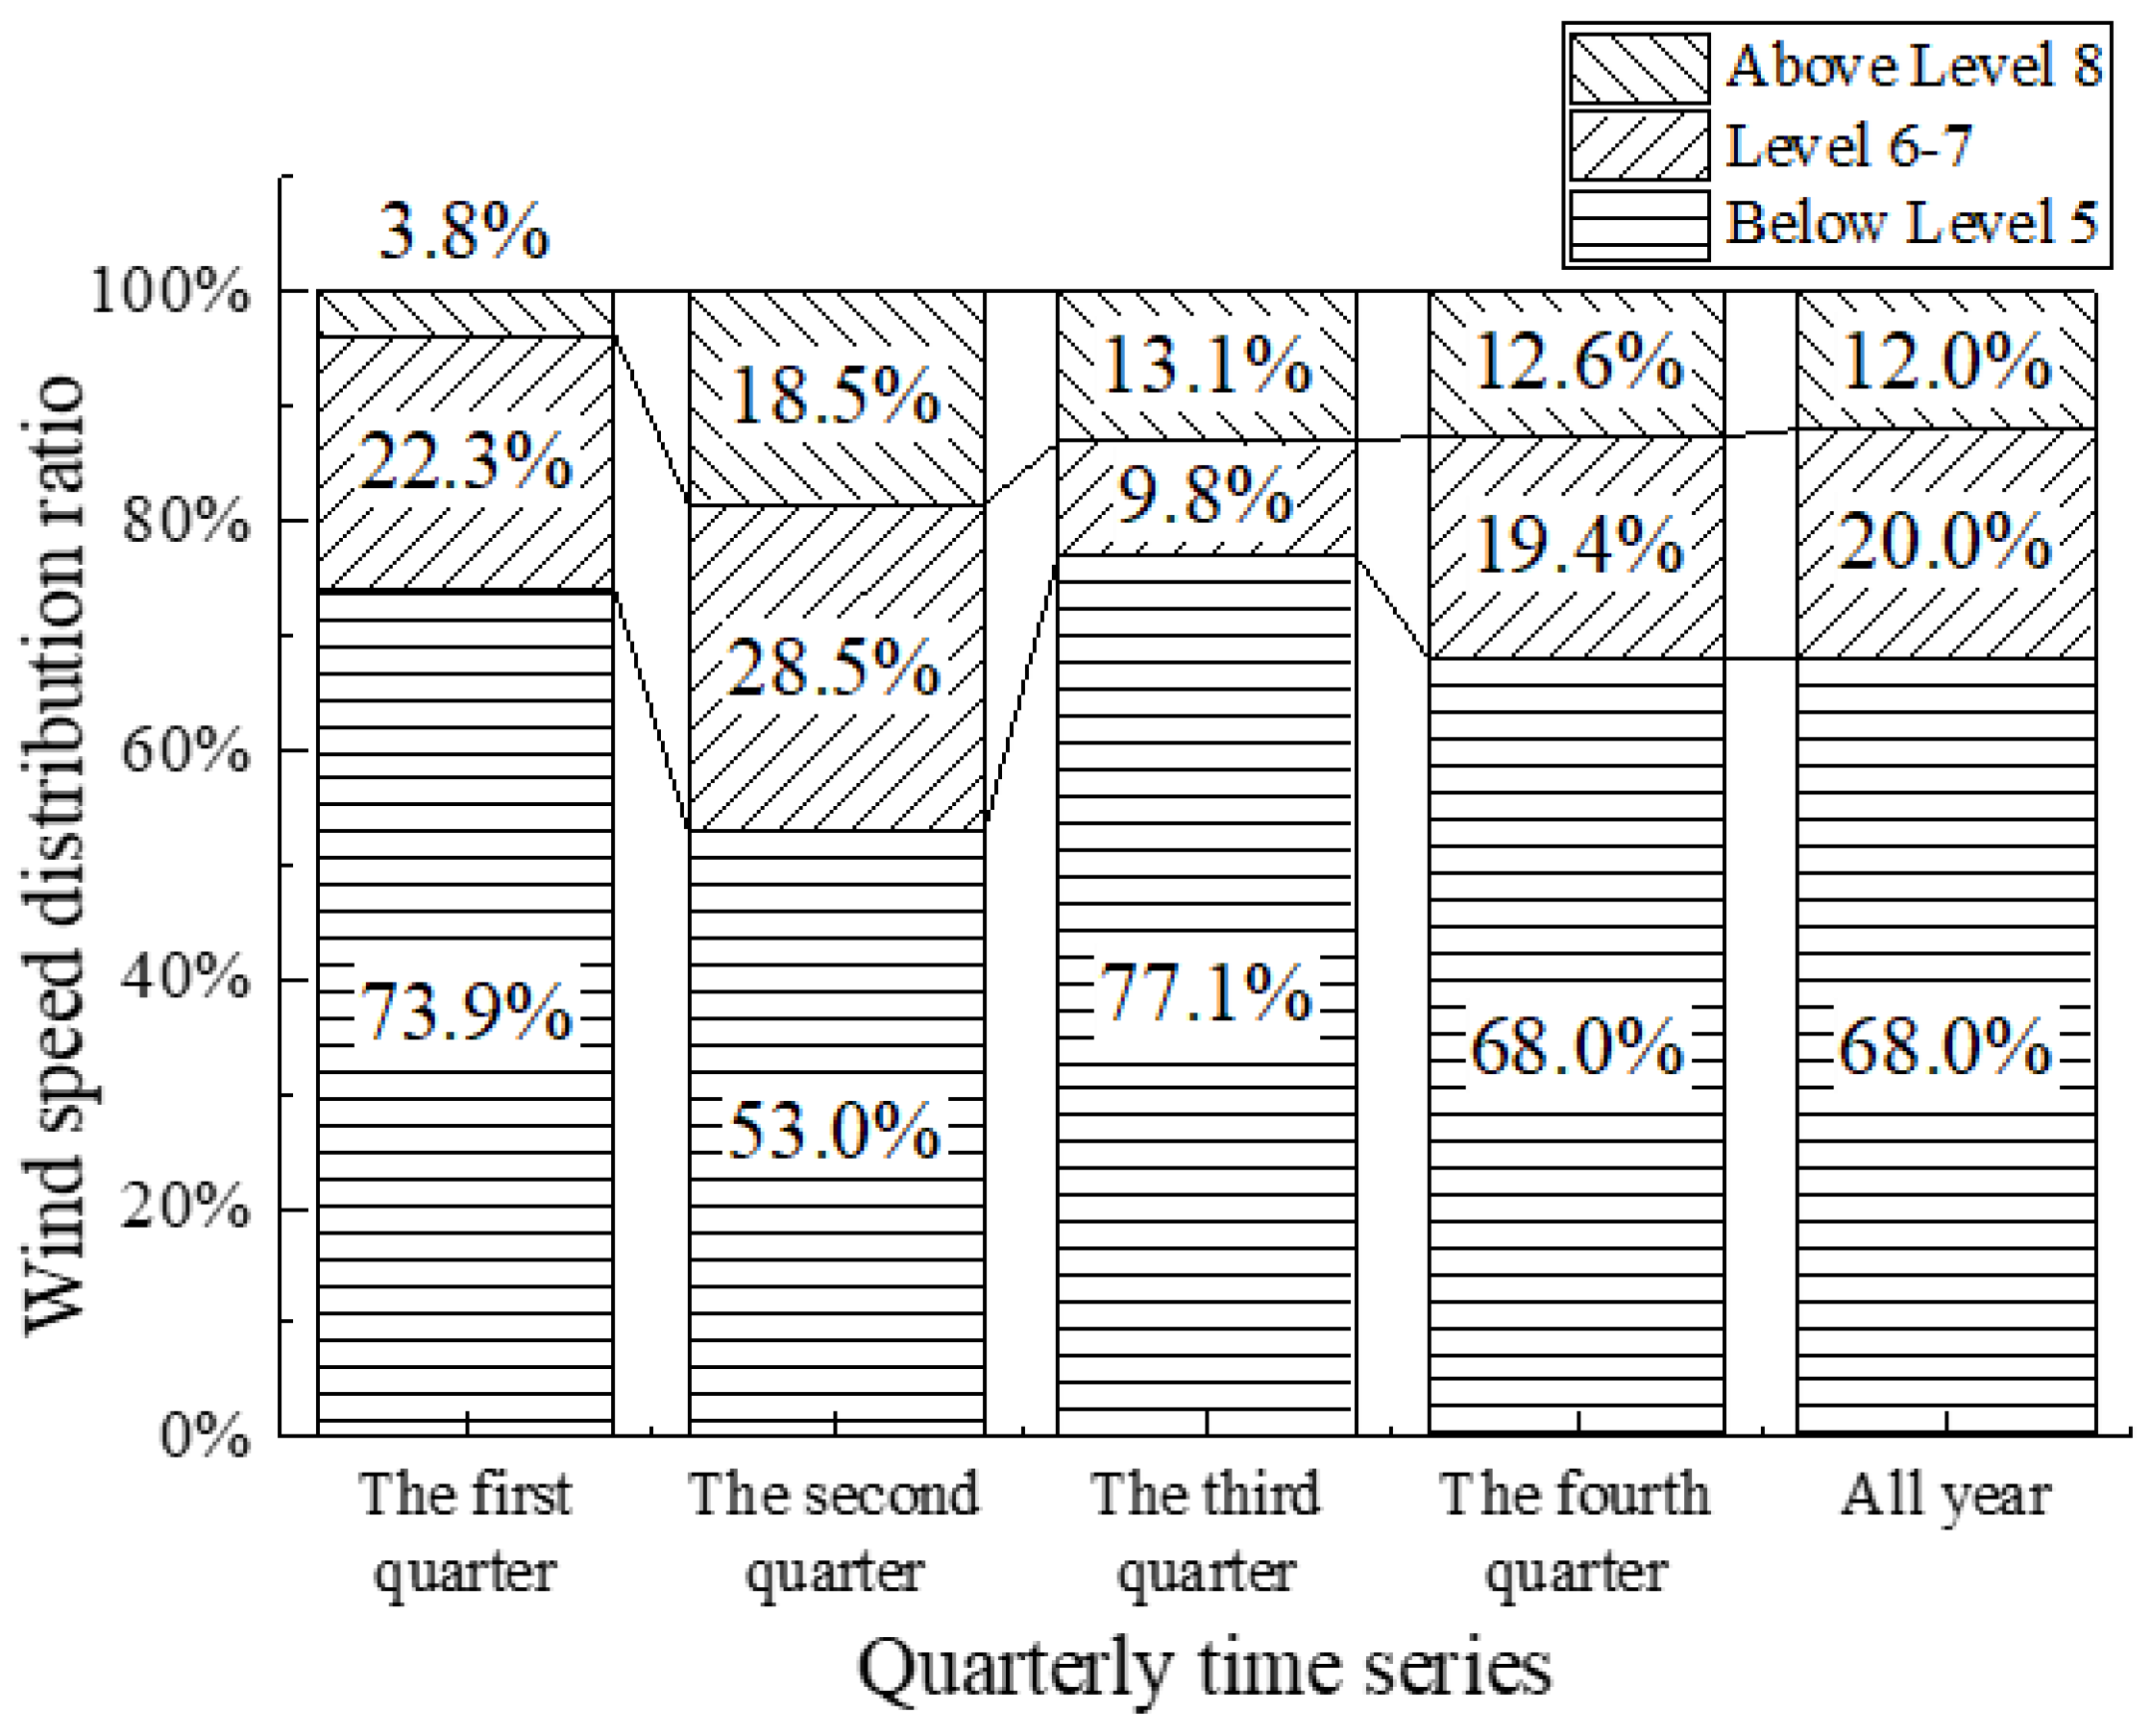
The collected data were analyzed. Figure 7 shows that we obtained the wind-speed distribution in each quarter. We found that wind speed below Level 5 accounted for the highest proportion, but wind speed of Level 6 and above accounted for 32%, which was much higher than that in other wind areas.
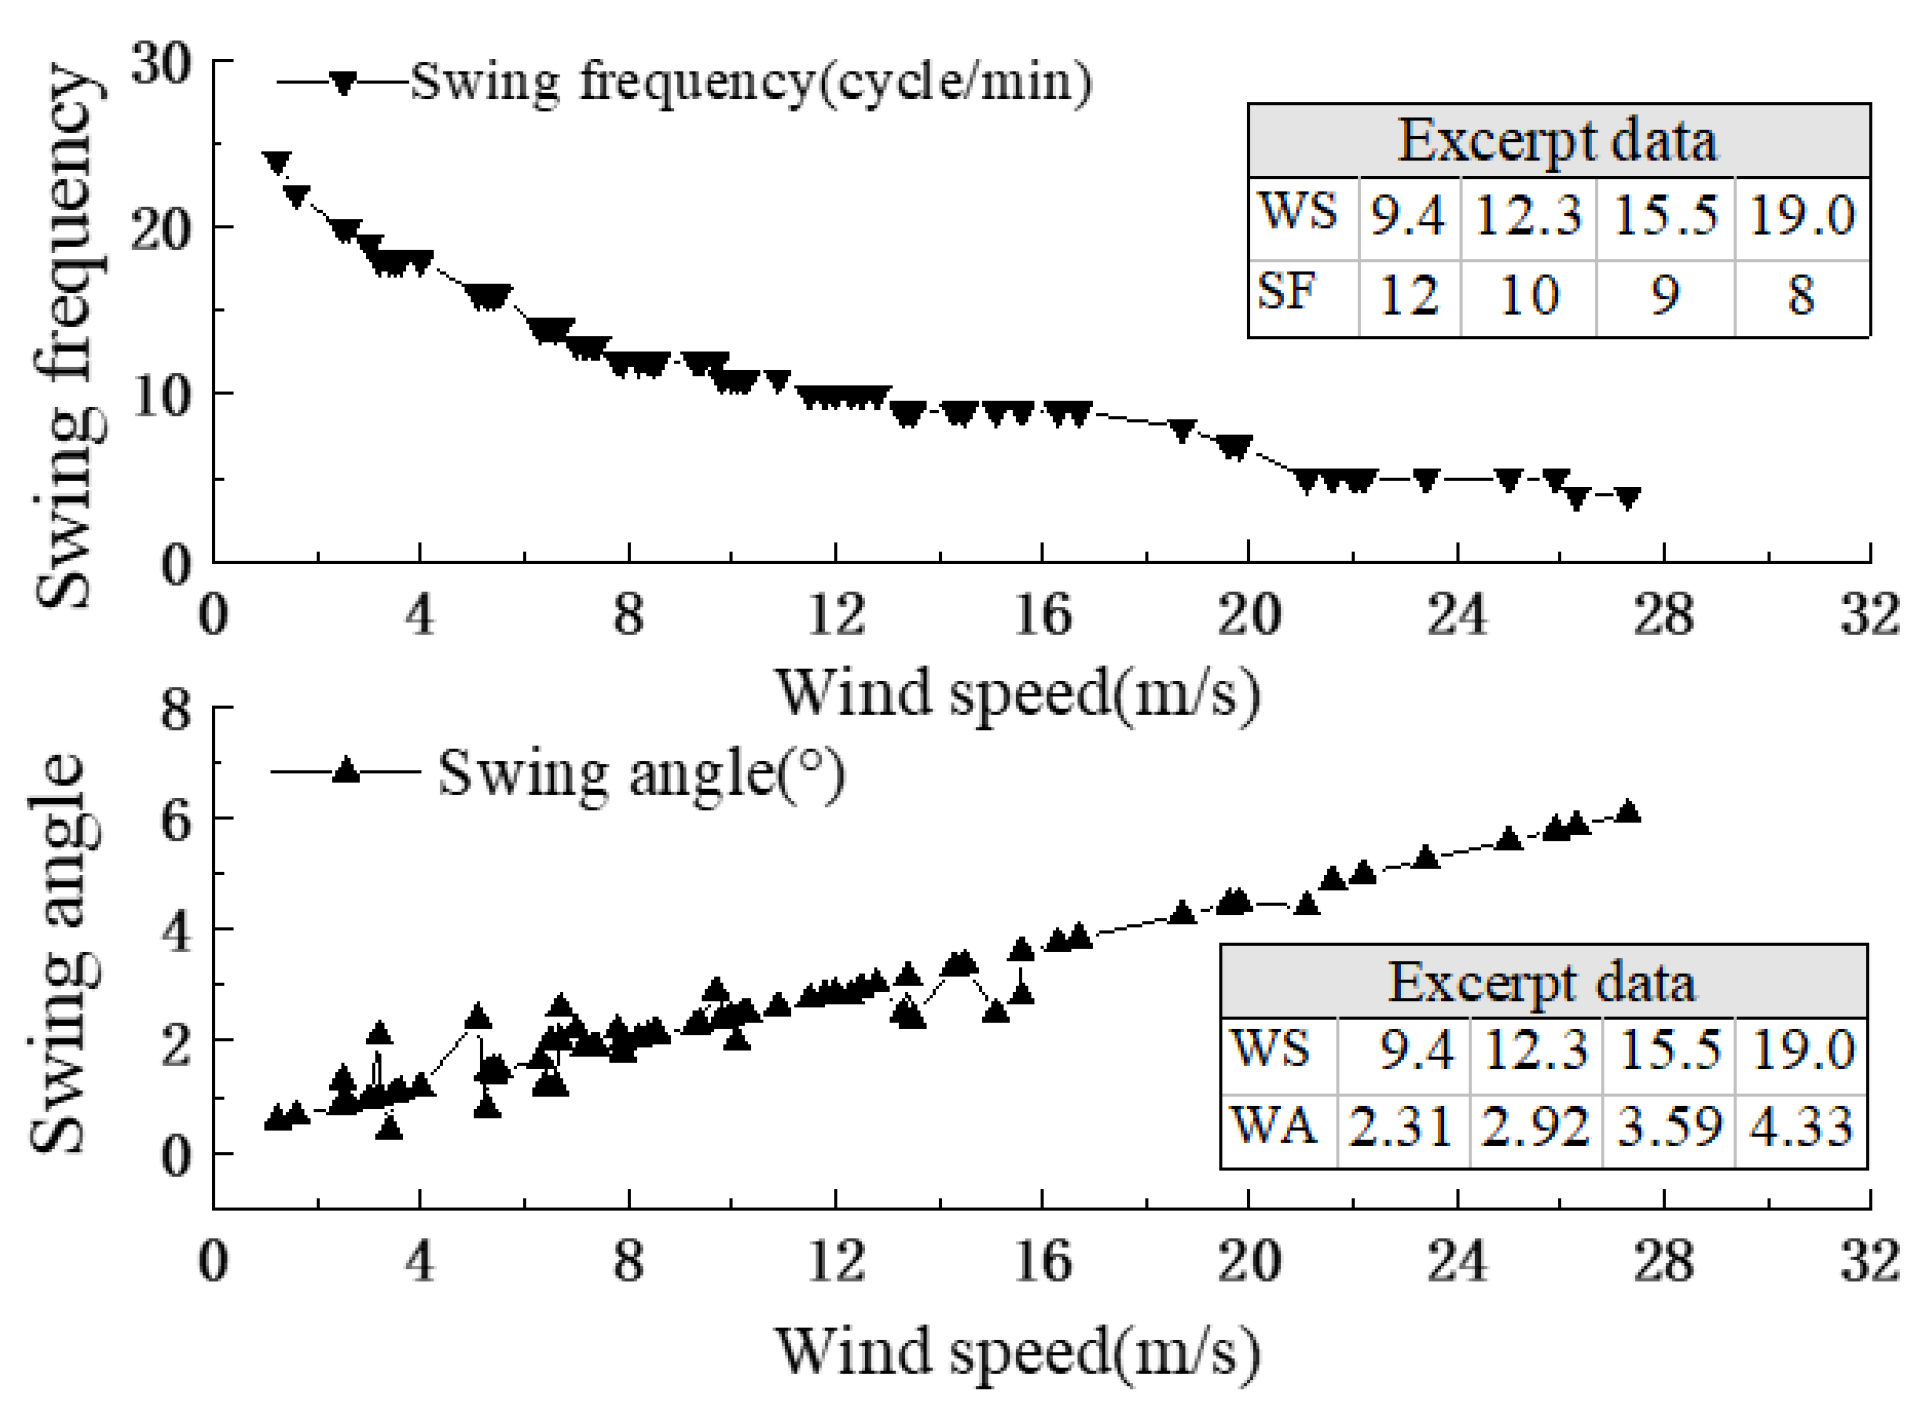
Combined with the data of the swing acquisition device, we obtained the condition of the swing angle and swing frequency of the mid-phase jumper under various wind speeds, as shown in Figure 8. For example, the swing frequency (SF) is 12 cycles per minute and the swing angle (SA) is 2.31° when the wind speed (WS) is 9.4 m/s. These data are used for the parameter setting in the simulation experiment.
2.2.3. Simulation Machine of the Jumper Swing
The simulation experiment for simulating the jumper swing is equivalent to a fatigue experiment. Thus, the simulation machine is, in essence, a fatigue machine. This fatigue machine considers the actual prototype structure of broken jumper wires (ACSR) as the direct experimental object, which is different from the conventional fatigue machine that does not consider the structural effects [19,20,21,22,23].
Figure 9 shows the main function template of the simulation machine. The combination fixture can fix one 1.8-m ACSR on the simulation machine. The suspension adjustment mechanism can adjust the transition angle between the ACSR and tension clamp. The pretension adjustment mechanism can apply pretension force to the ACSR in accordance with the requirements of site construction standards. The transverse swing device uses the principle of the crank slider and can make the ACSR move back and forth in the X direction at different amplitudes by adjusting the eccentricity to simulate the swing of the jumper wire under different wind speeds. The program-controlled motor can output power based on the predetermined experimental parameters.
Figure 10 shows the schematic diagram of the simulation machine. Under the influence of wind speed 1, the jumper swings to a certain extent, and the swing acquisition device measures the determined swing angle 1. First, we install a crank slider mechanism with adjustable eccentricity on the simulation machine. By adjusting the eccentricity 1 of the mechanism, the jumper wires on the simulation machine is made to swing to a certain extent. Thus, the jumper wire has the same swing angle 1. Therefore, by generating the same swing angle, the machine can reproduce the swing condition of the jumper under the same wind speed [24,25].
The same wind angle can produce very different stress conditions, depending on the wire pretension and on the span between constraints. We believe that the influence of wire pretension and span on the breakage location of wire is mainly reflected in the effective tension. Therefore, we established a finite element model to calculate the effective tension of the breakage location. As shown in Figure 11, the sizes and constraints of the finite element model are consistent with the actual configuration of the mid-phase jumper. Therefore, the effective tension of the wire calculated by the finite element method can be applied to the simulation machine. According to the calculation results, the effective tension value of the ACSR wire applied to the simulation machine is 250 N [26].
2.2.4. Experimental Parameters
According to the actual situation, we designed four experimental schemes. Each experimental scheme was performed three times. The relevant experimental parameters are listed in Table 1.
3. Results and Discussion
3.1. Results of Simulation Experiment
The simulation experiment yielded the broken ACSR under various wind speeds. In the experiment, the state of the ACSR surface was observed and recorded by an endoscope. The state of the ACSR surface in the simulation experiments using wind speed of Levels 5 and 8 are shown in Figure 12, which clearly shows the whole process of crack initiation, propagation, and fracture.
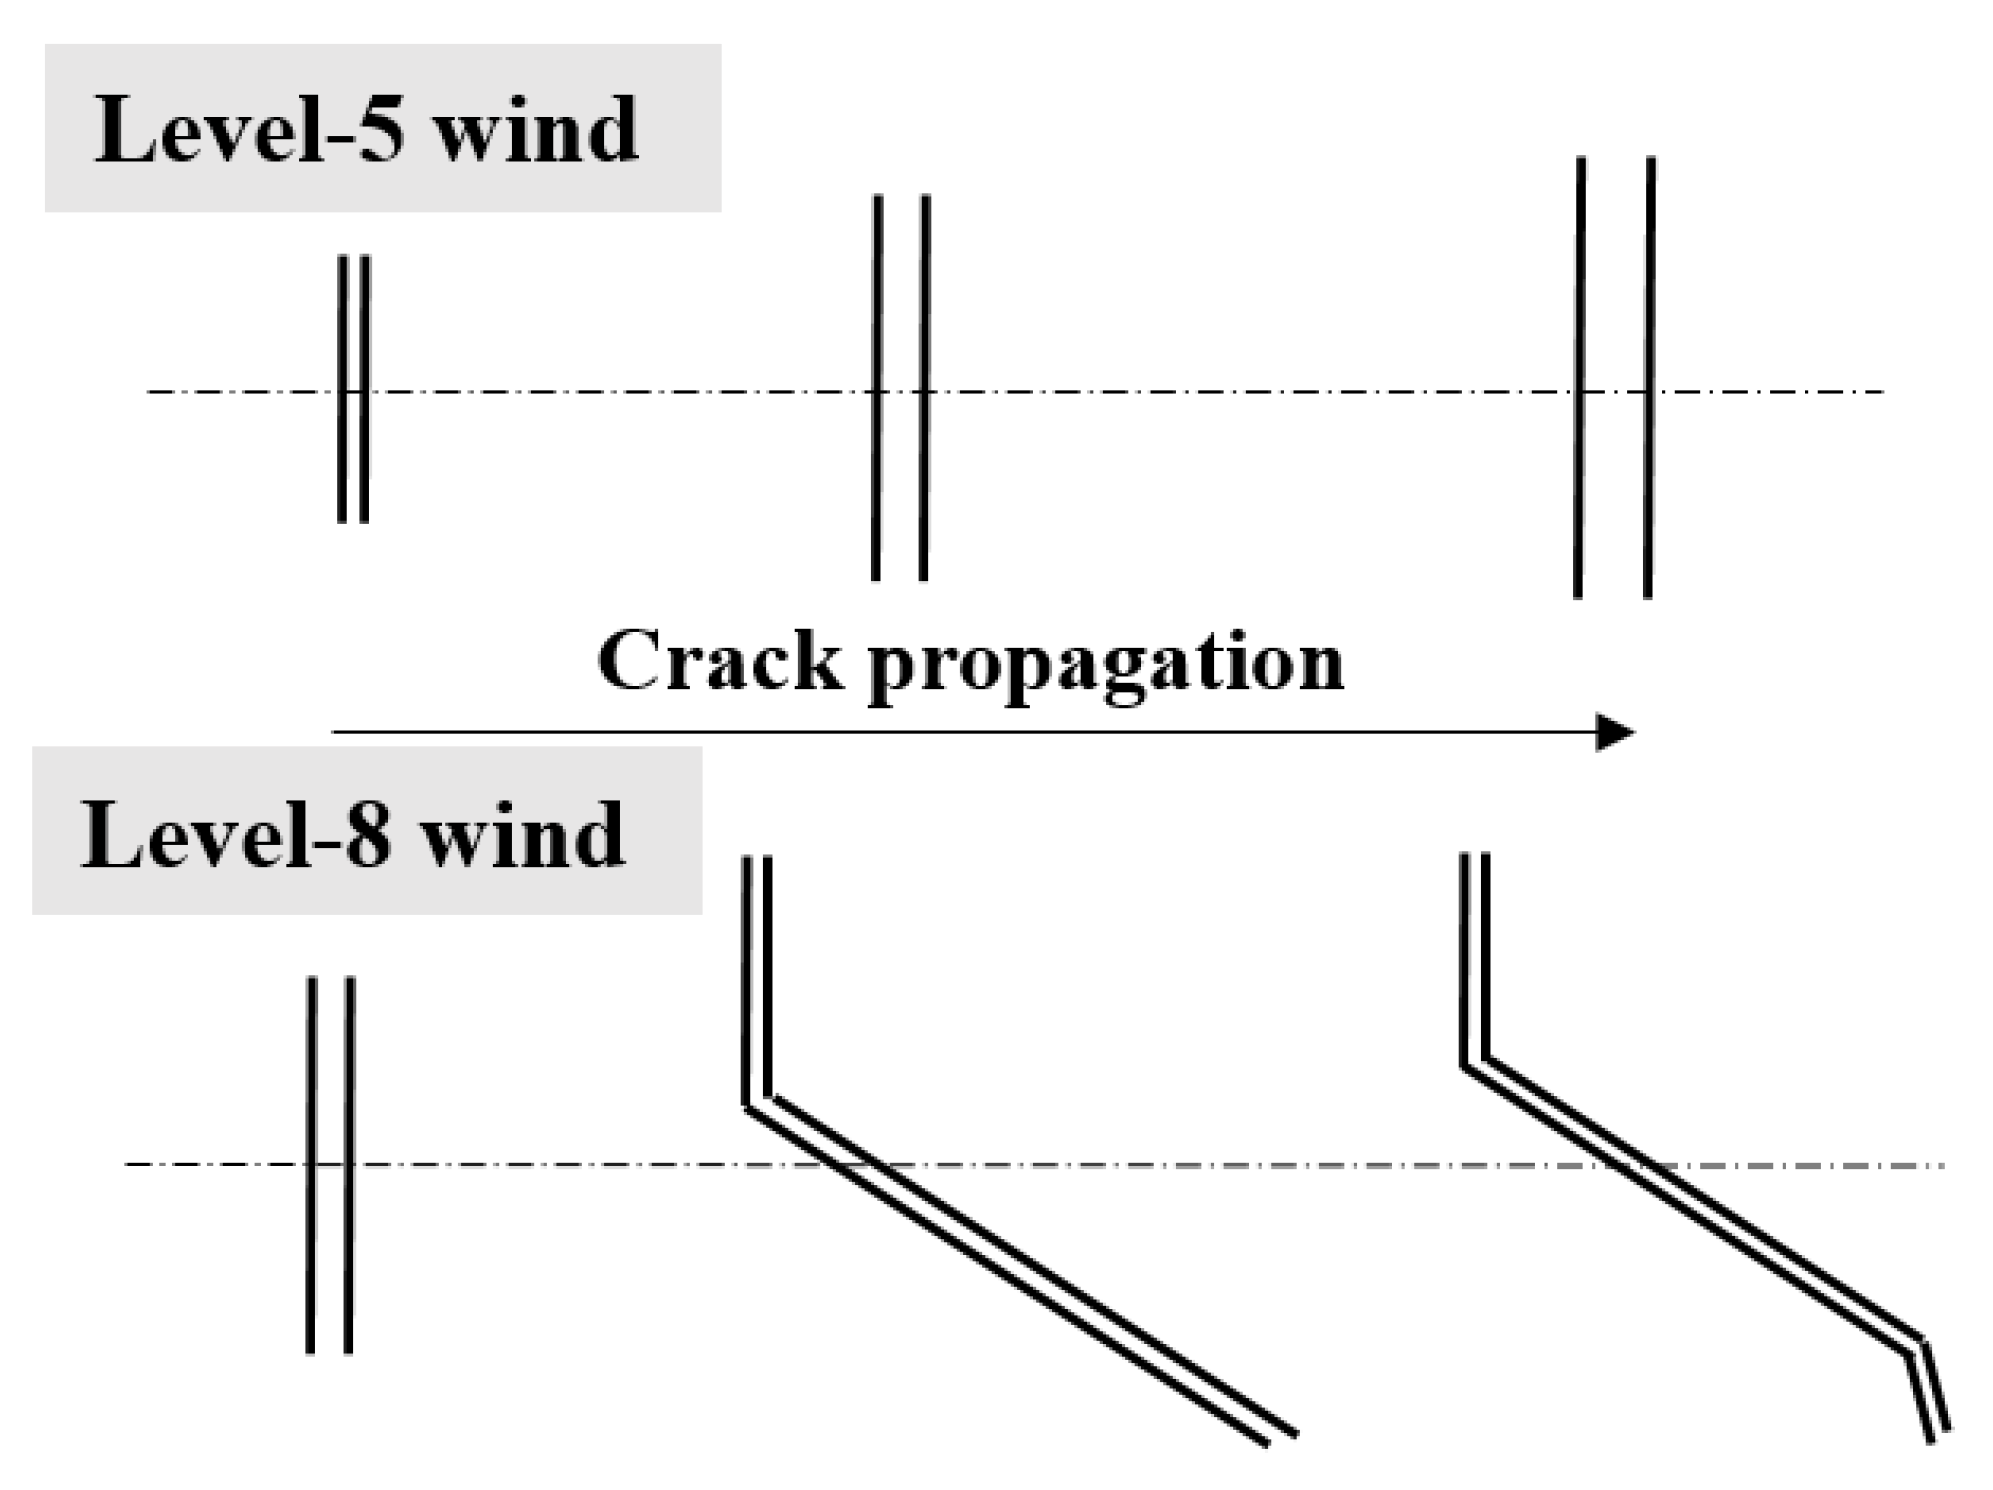
Figure 13 shows that under the Level 5 wind, the crack in the wires basically propagated in the direction perpendicular to the axial direction. Under the Level 8 wind, the crack initially propagated perpendicular to the axis and then along the direction 45° to the axis for a long time. Finally, it slightly changed at the moment of instantaneous break [27,28,29].
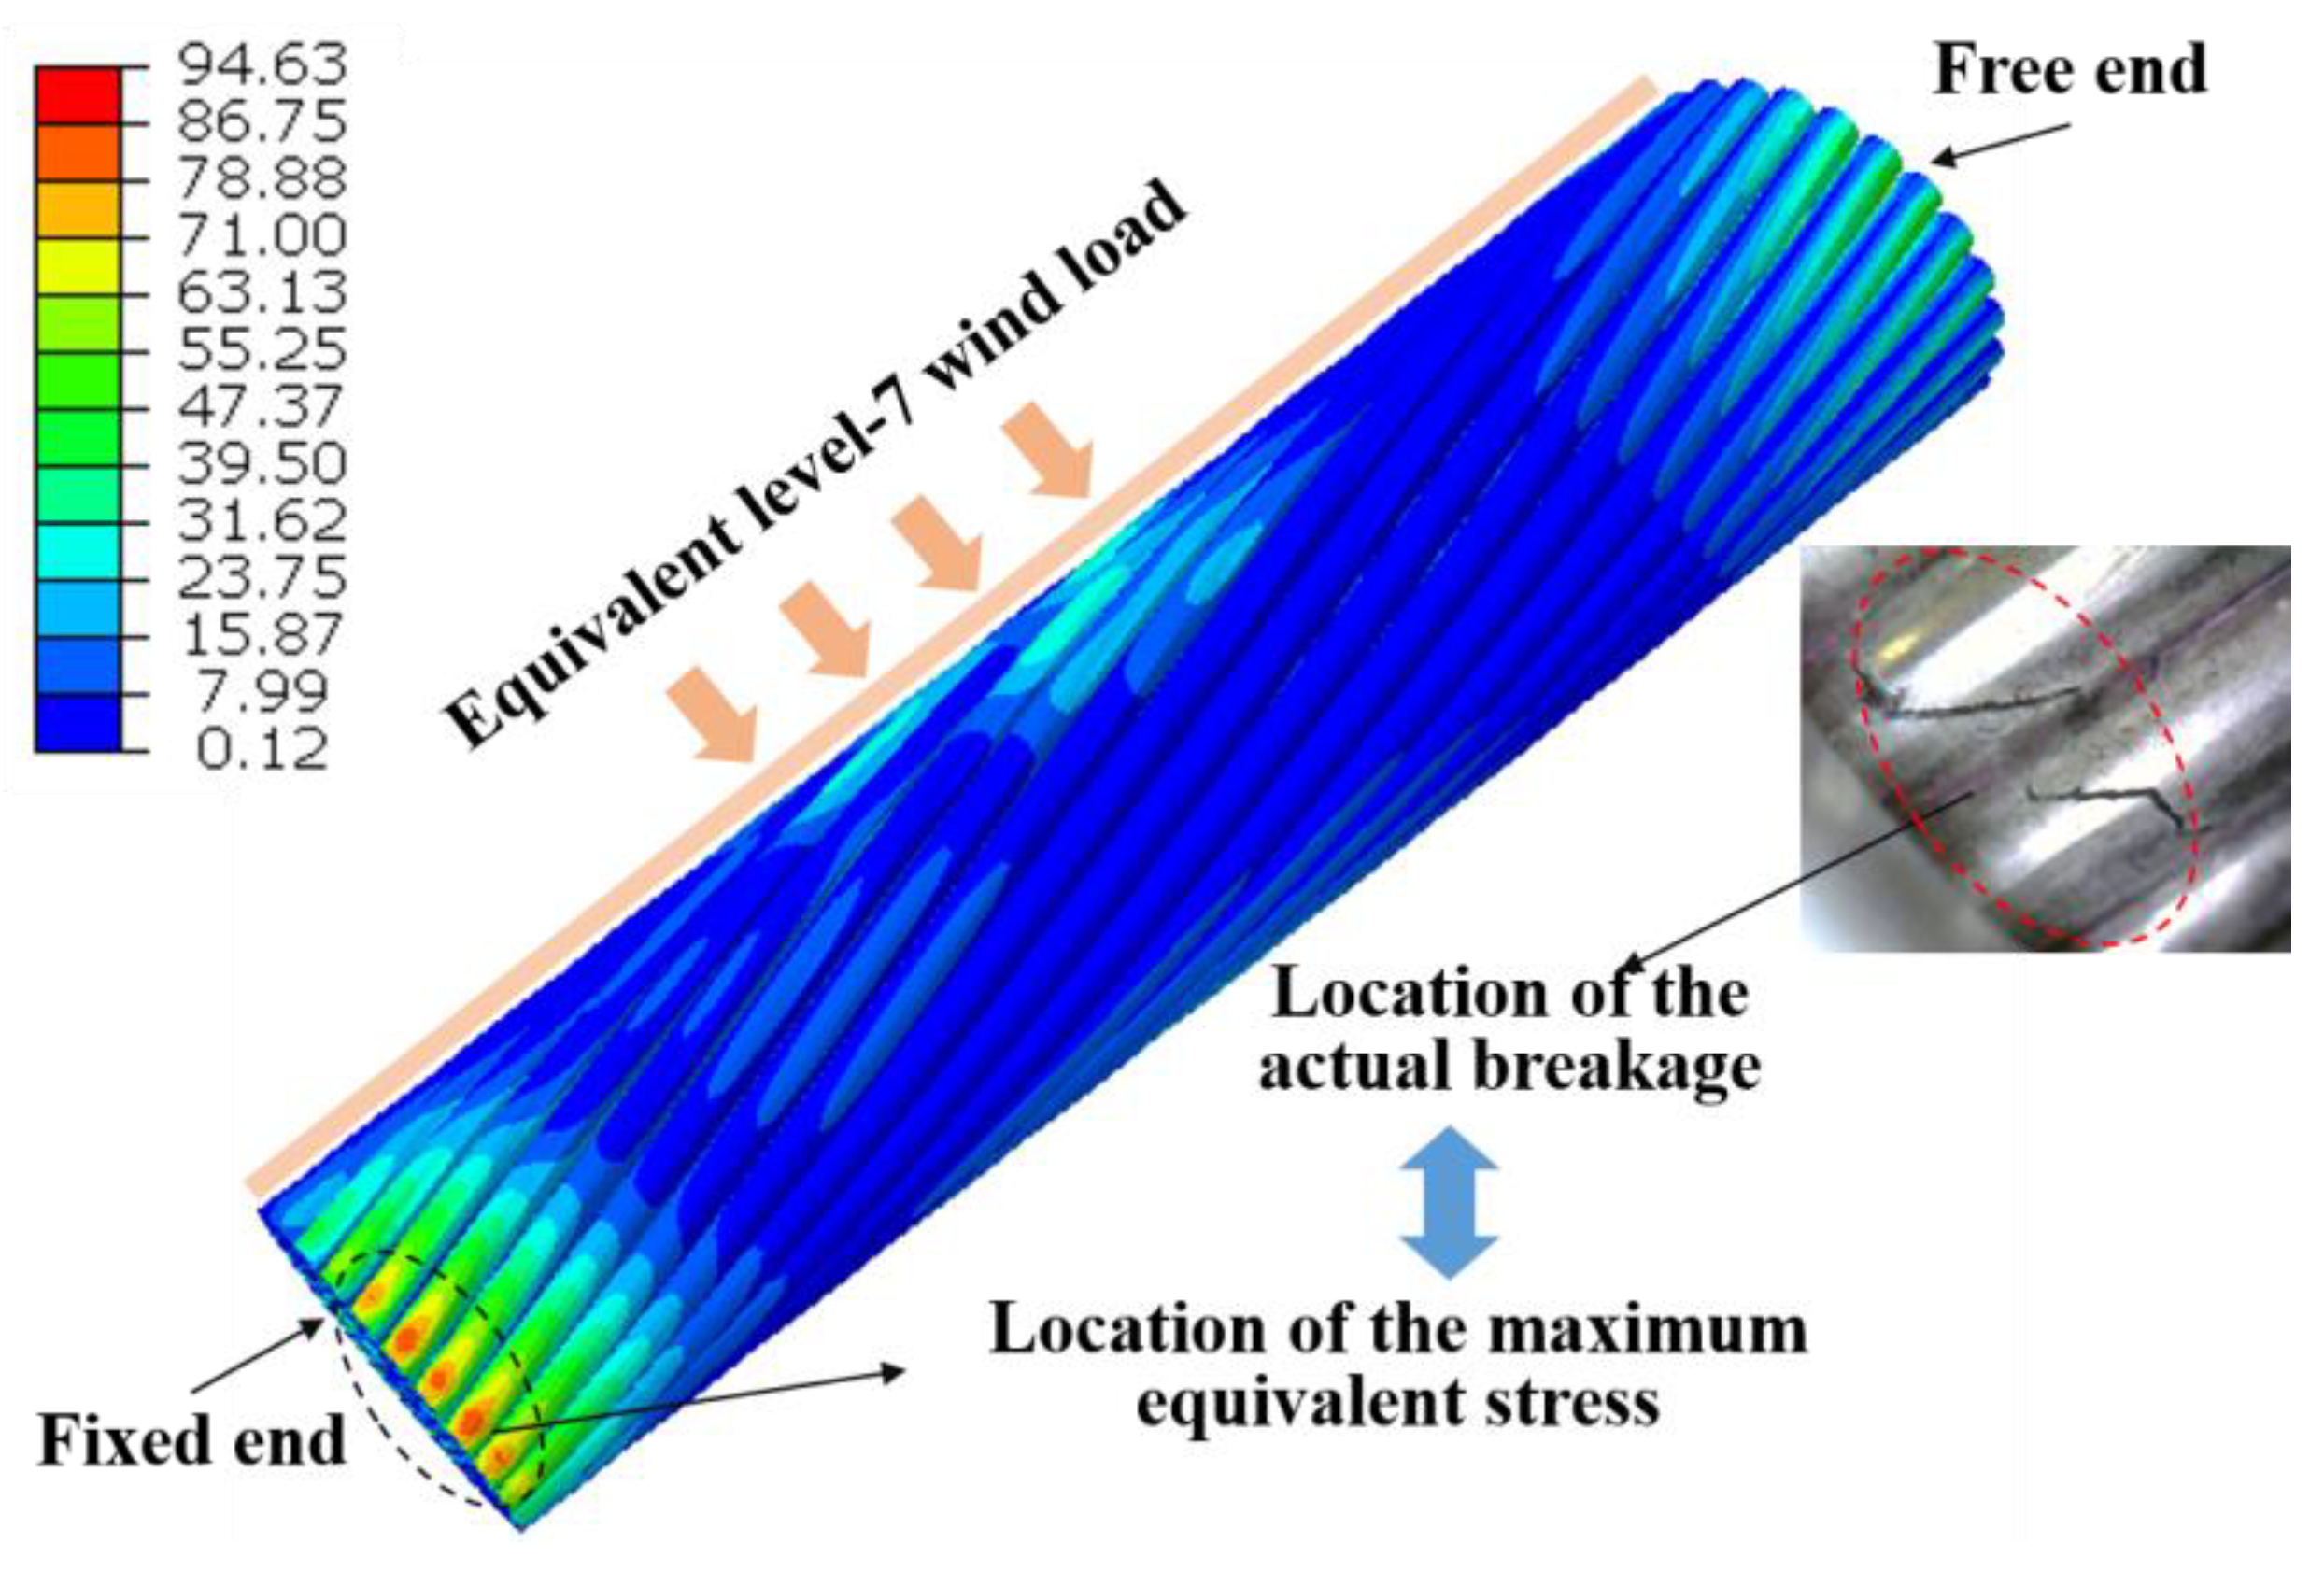
In addition, the micro finite element model of wires was established. This model is a section of 200-mm ACSR, and its structure and material are consistent with the actual ACSR wires. We fixed one end of the model and applied the equivalent Level 7 wind load to calculate the stress condition. Figure 14 shows that the maximum equivalent stress at the fixed end of the model is up to 94 MPa, which has exceeded the yield limit of the aluminum wires. We found that the location of the maximum stress in finite element model is exactly the actual breakage location of the ACSR wires in the simulation experiments [26].
3.2. Surface Yield Line of Aluminum Wires
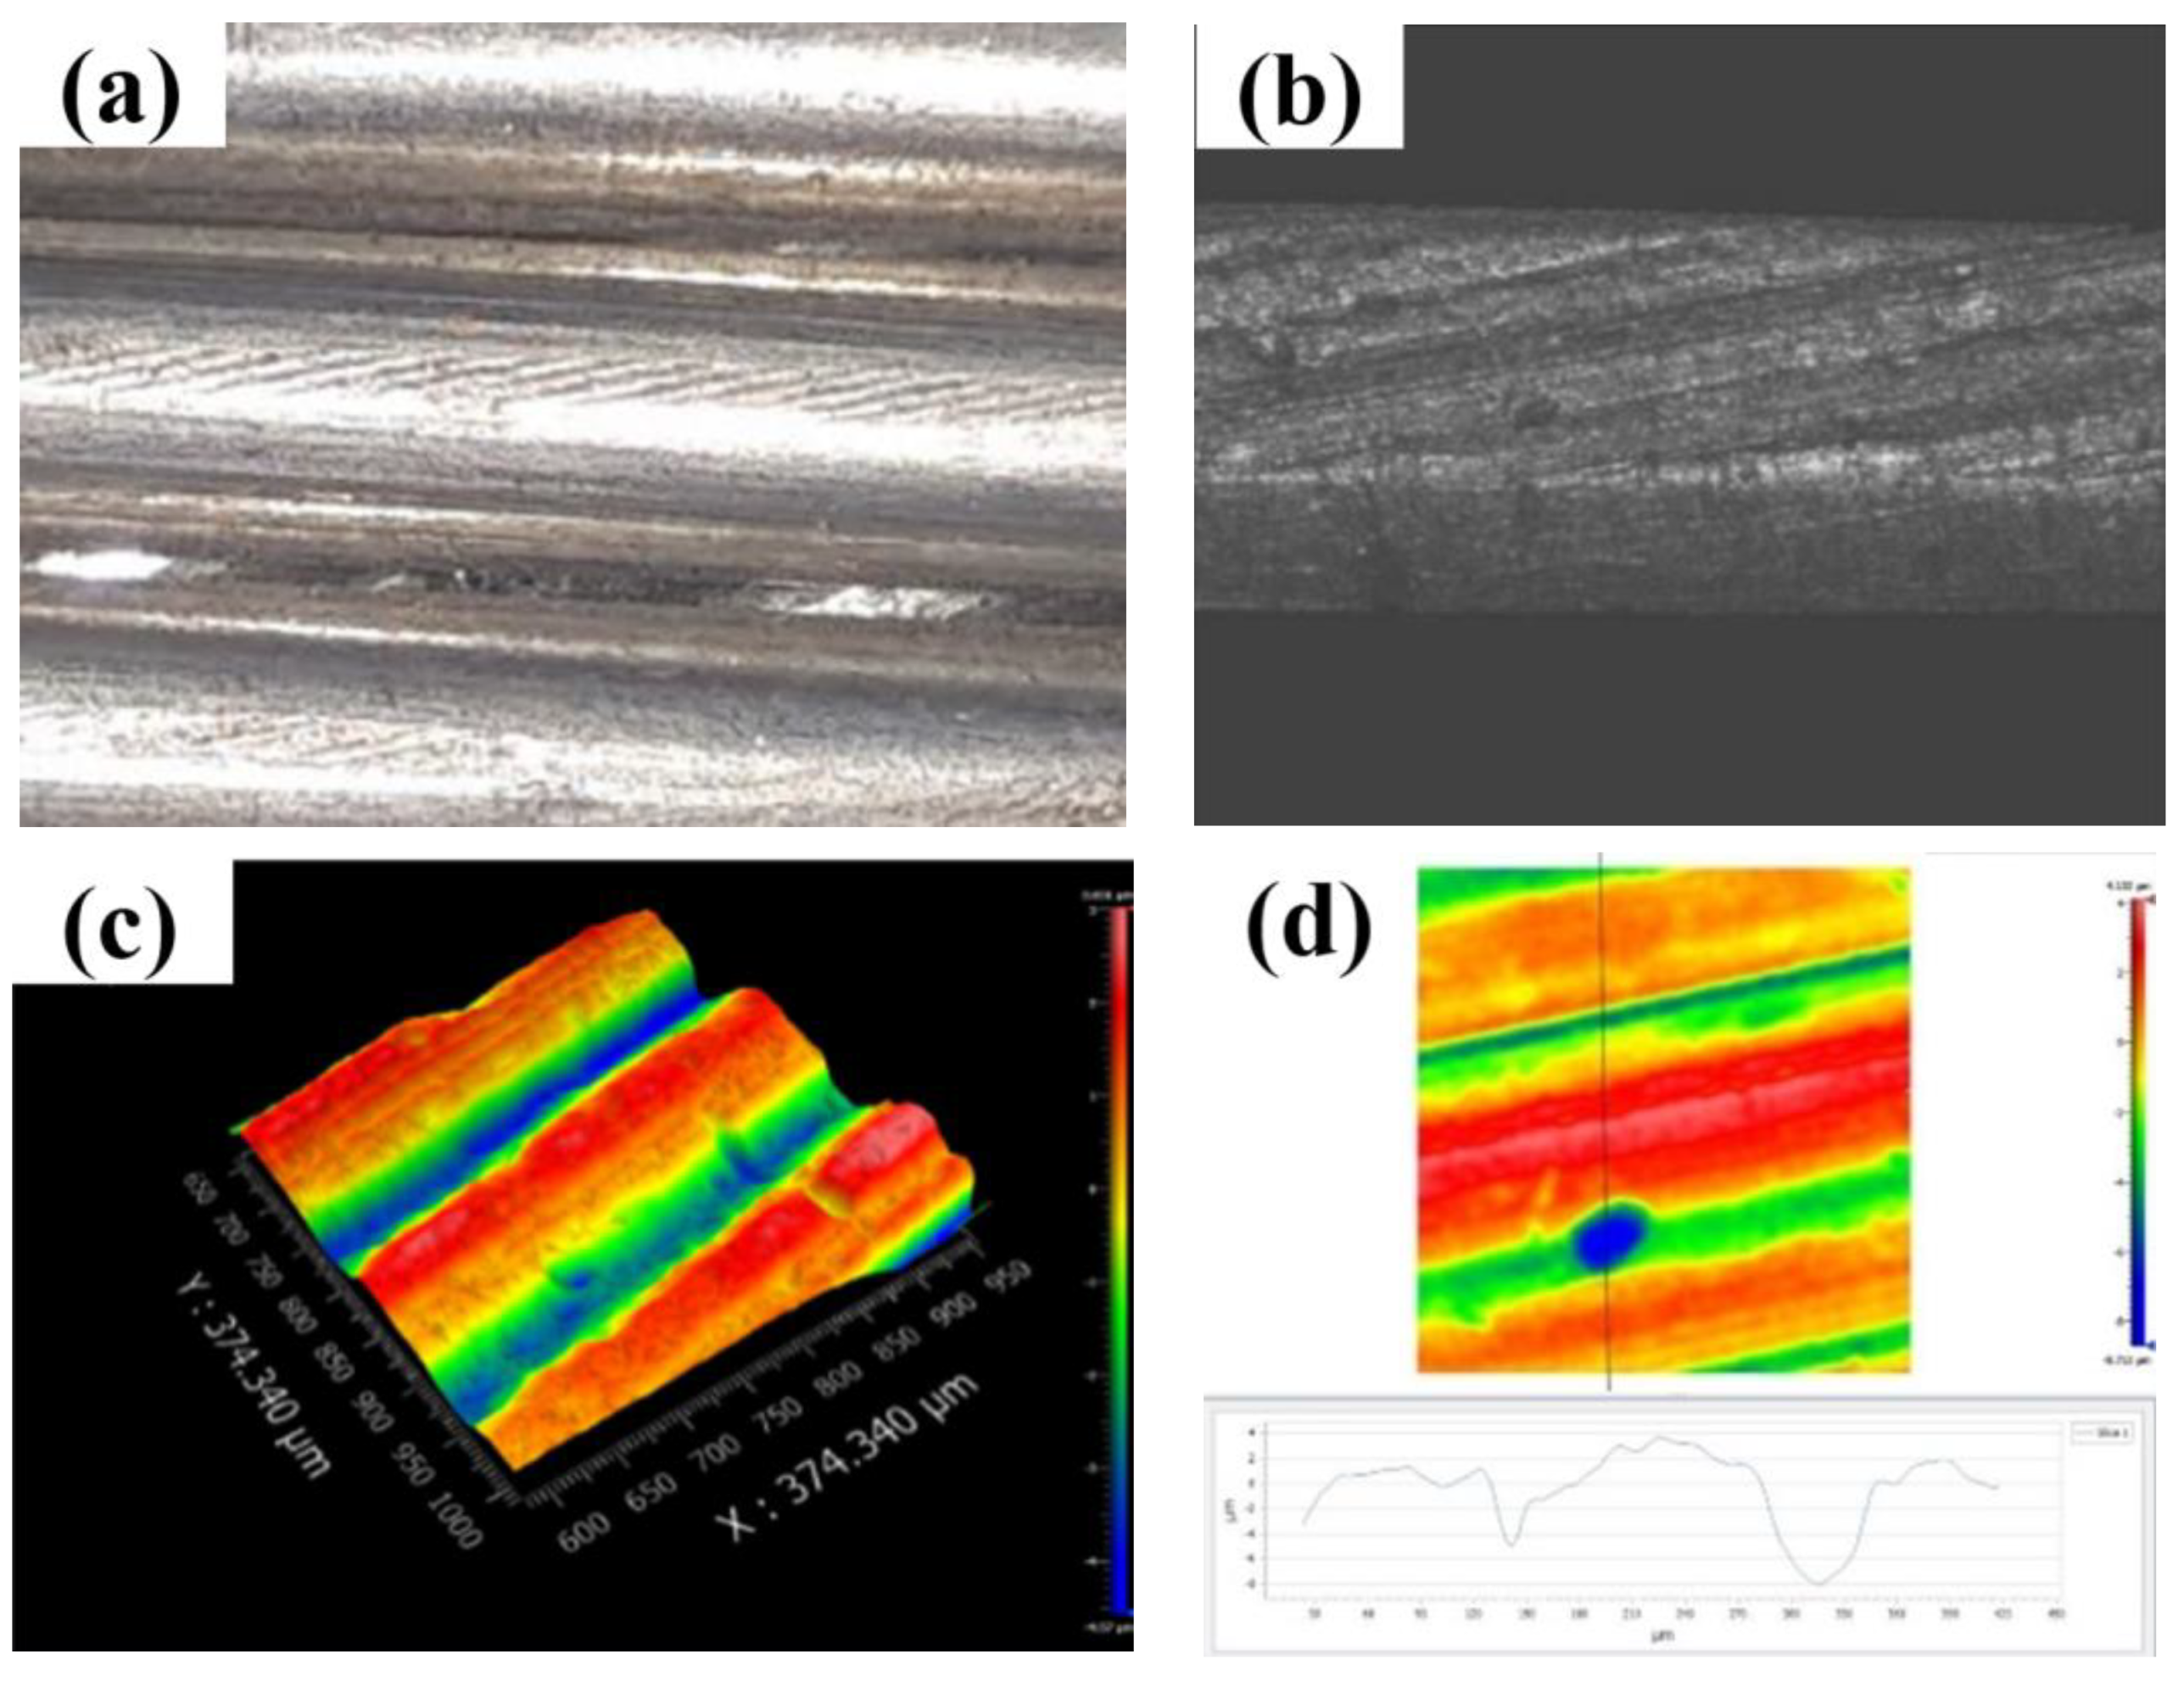
Figure 15a,b shows that some macroscopic persistent slip lines occur on the surface of the broken aluminum wires in the simulation experiment under a Level-6 wind. There are persistent slip marks and persistent slip bands on the surface when fatigue damage accumulates. These slip lines tend to widen with the increase in the level of simulated wind speed, indicating that the yield degree of the aluminum-wire surface increases [21,24]. From the 3D profilometer measurement shown in Figure 15c,d, the depth difference in the yield line is up to 5–10 μm, and the width is up to 30–50 μm, which is way above the 1-μm scale of normal roughness of a new aluminum-wire surface.
3.3. TEM Observation and Analysis of Aluminum Wires
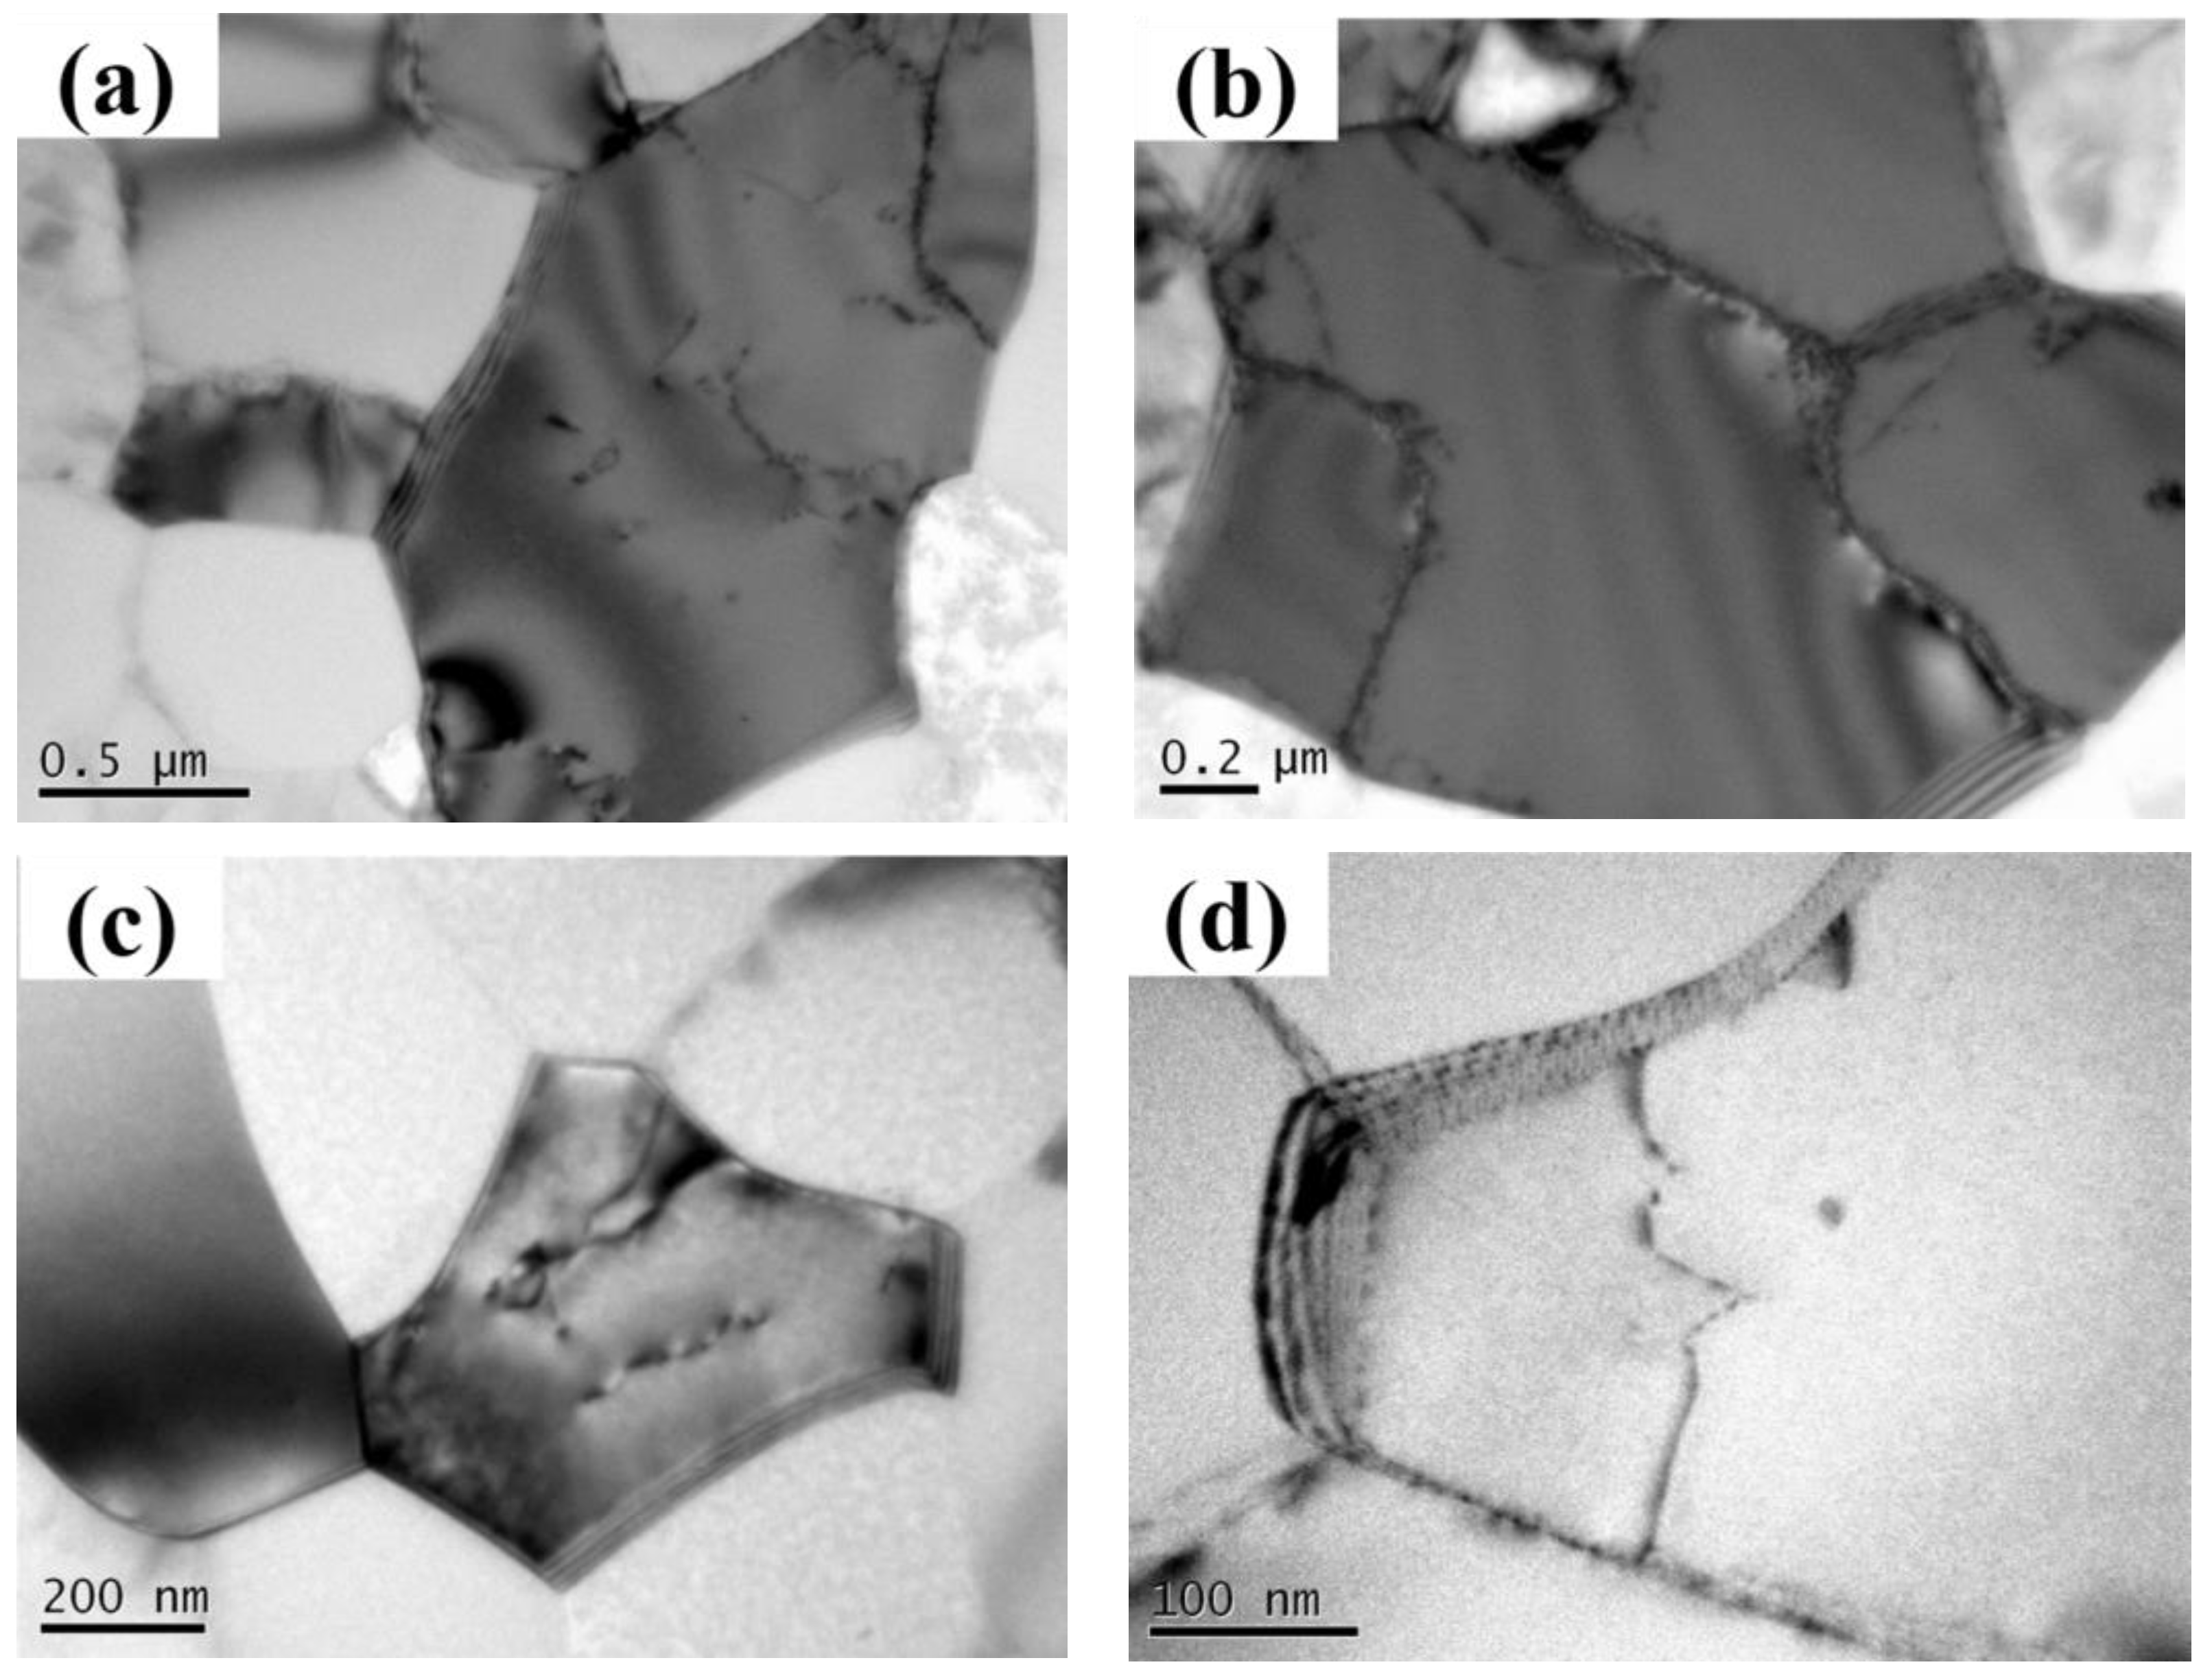
Figure 16 shows the transmission electron microscope (TEM) photographs of the possible broken position of the new aluminum wires that have only been crimped. The grains of the new aluminum wires are basically equiaxed with no large deformation and dislocation in most areas, as shown in Figure 16a. A small number of short dislocations are shown in Figure 16b. Figure 16c,d shows that the grain boundaries of the new aluminum wire are clear. From the shape of the micro-grains and the number of dislocations, we can see that the new aluminum wires exhibit slight plastic deformation but no distinct yield.
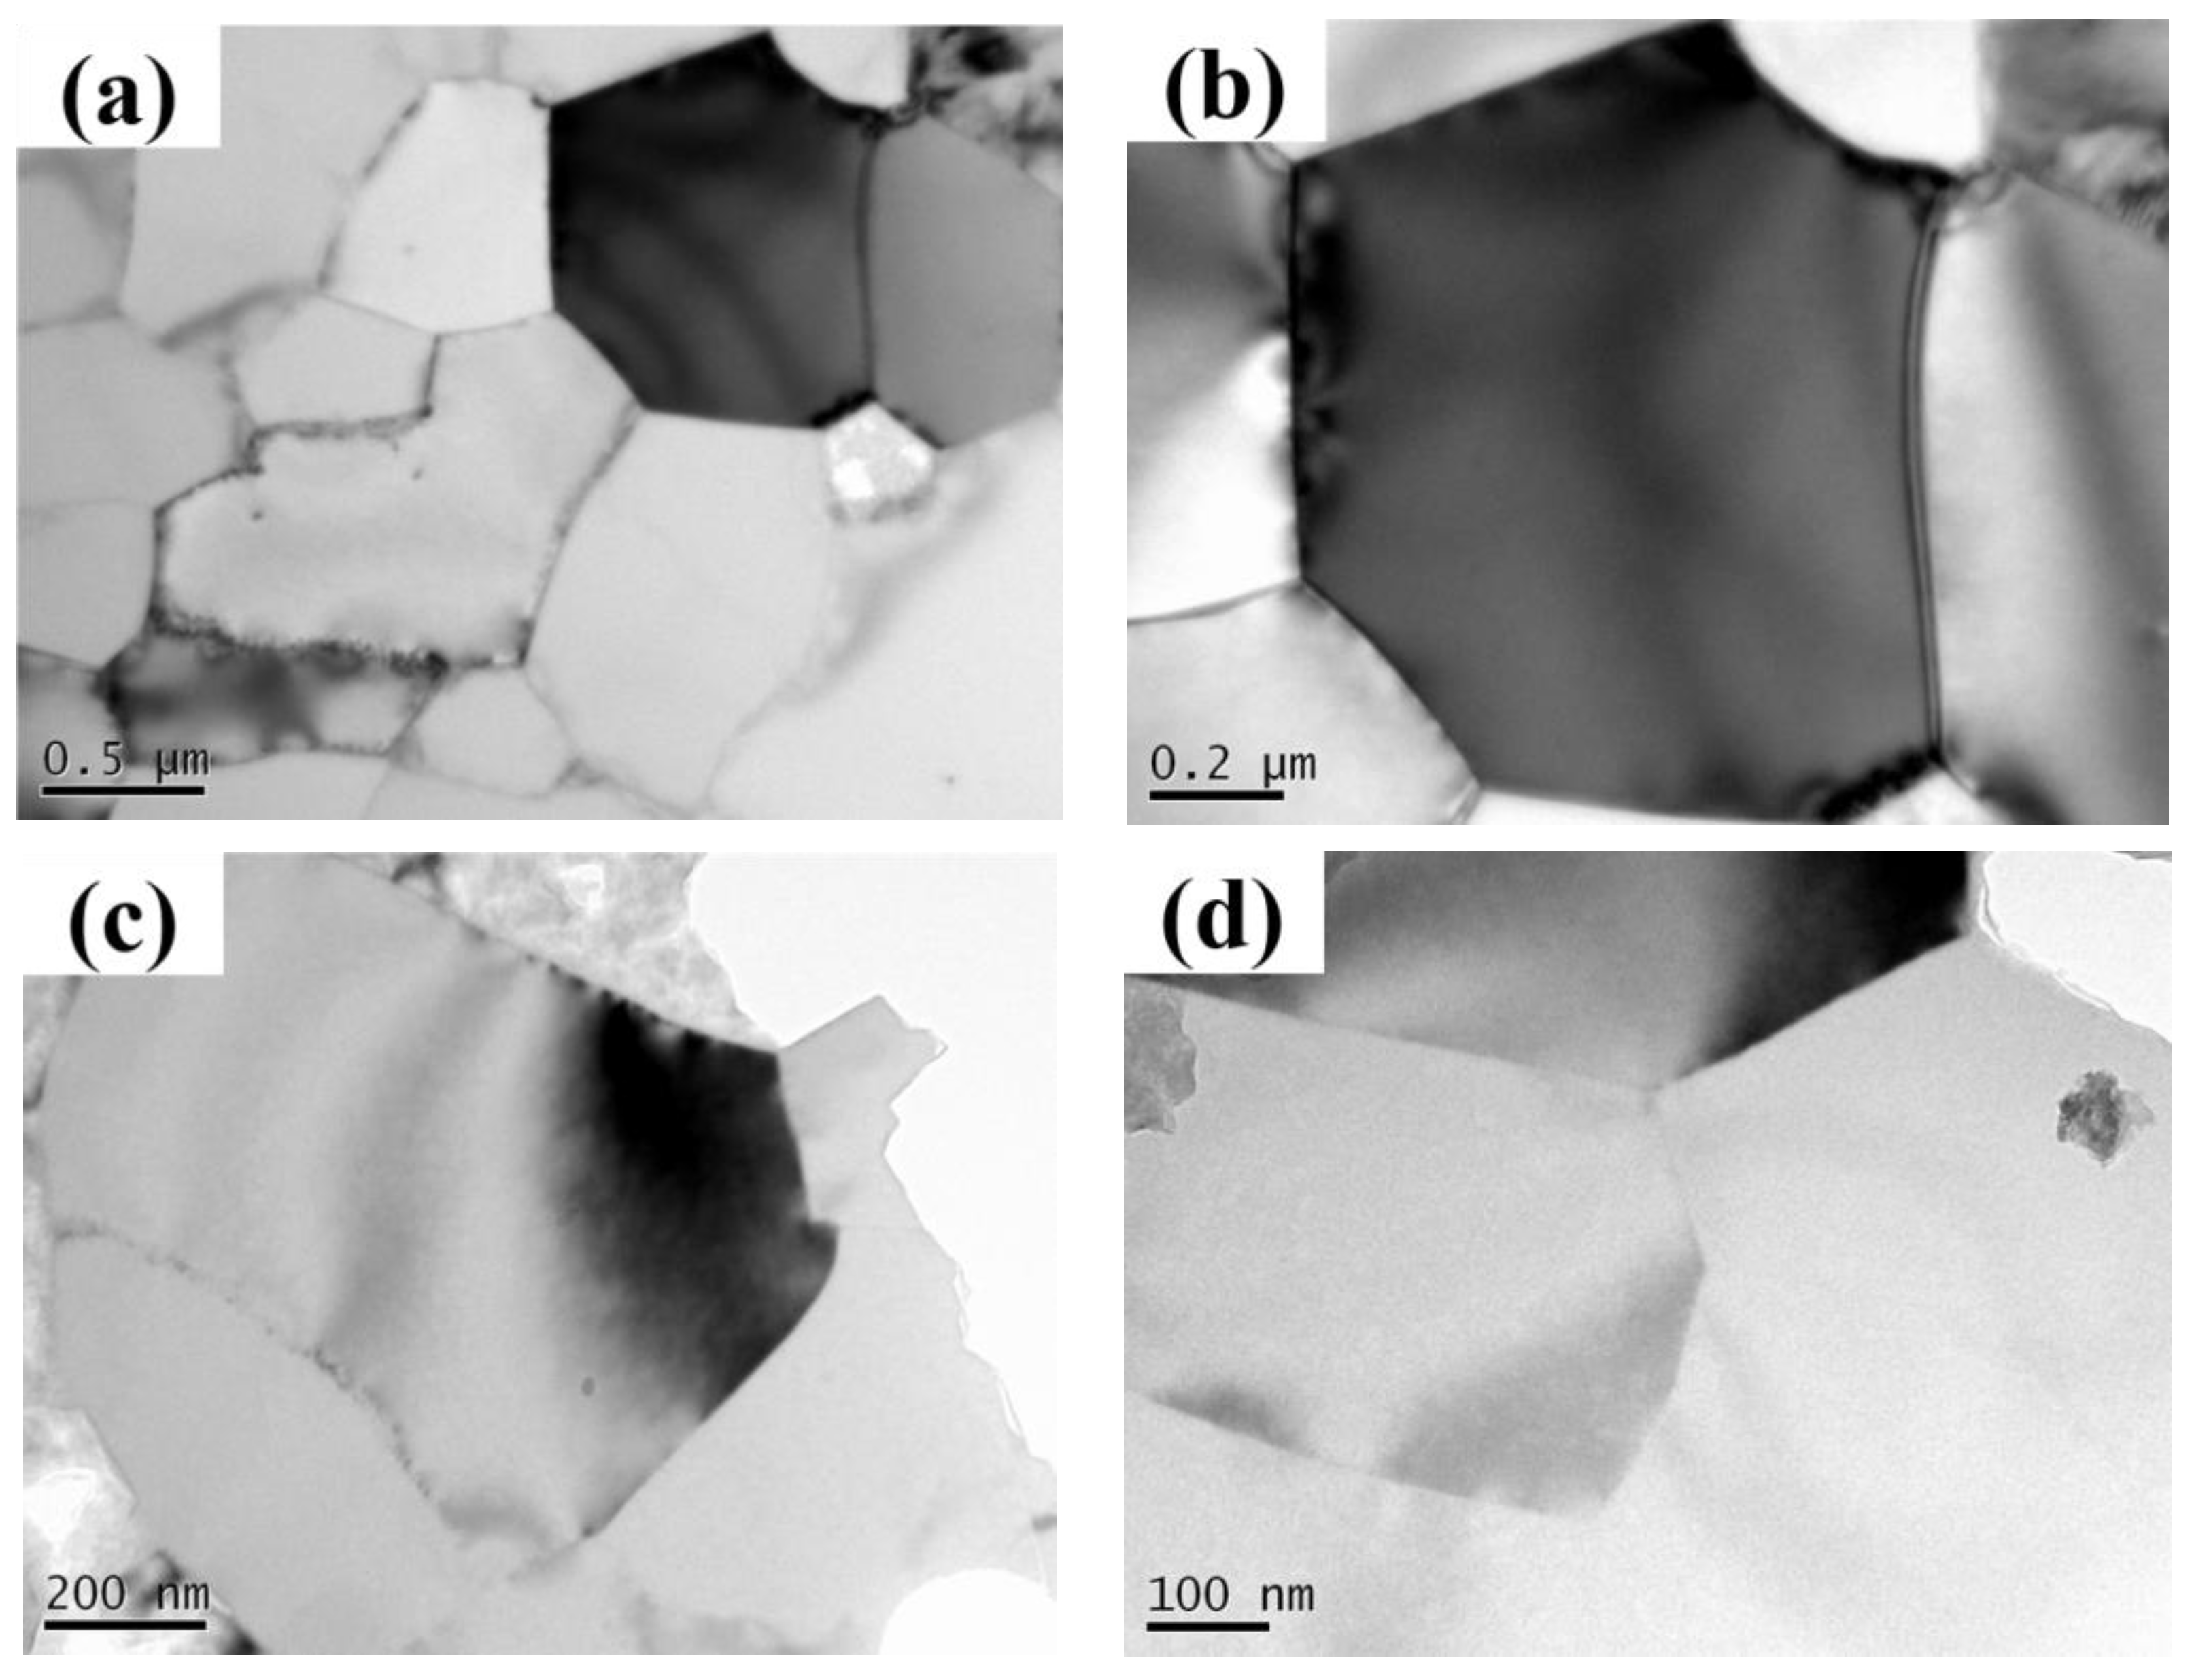
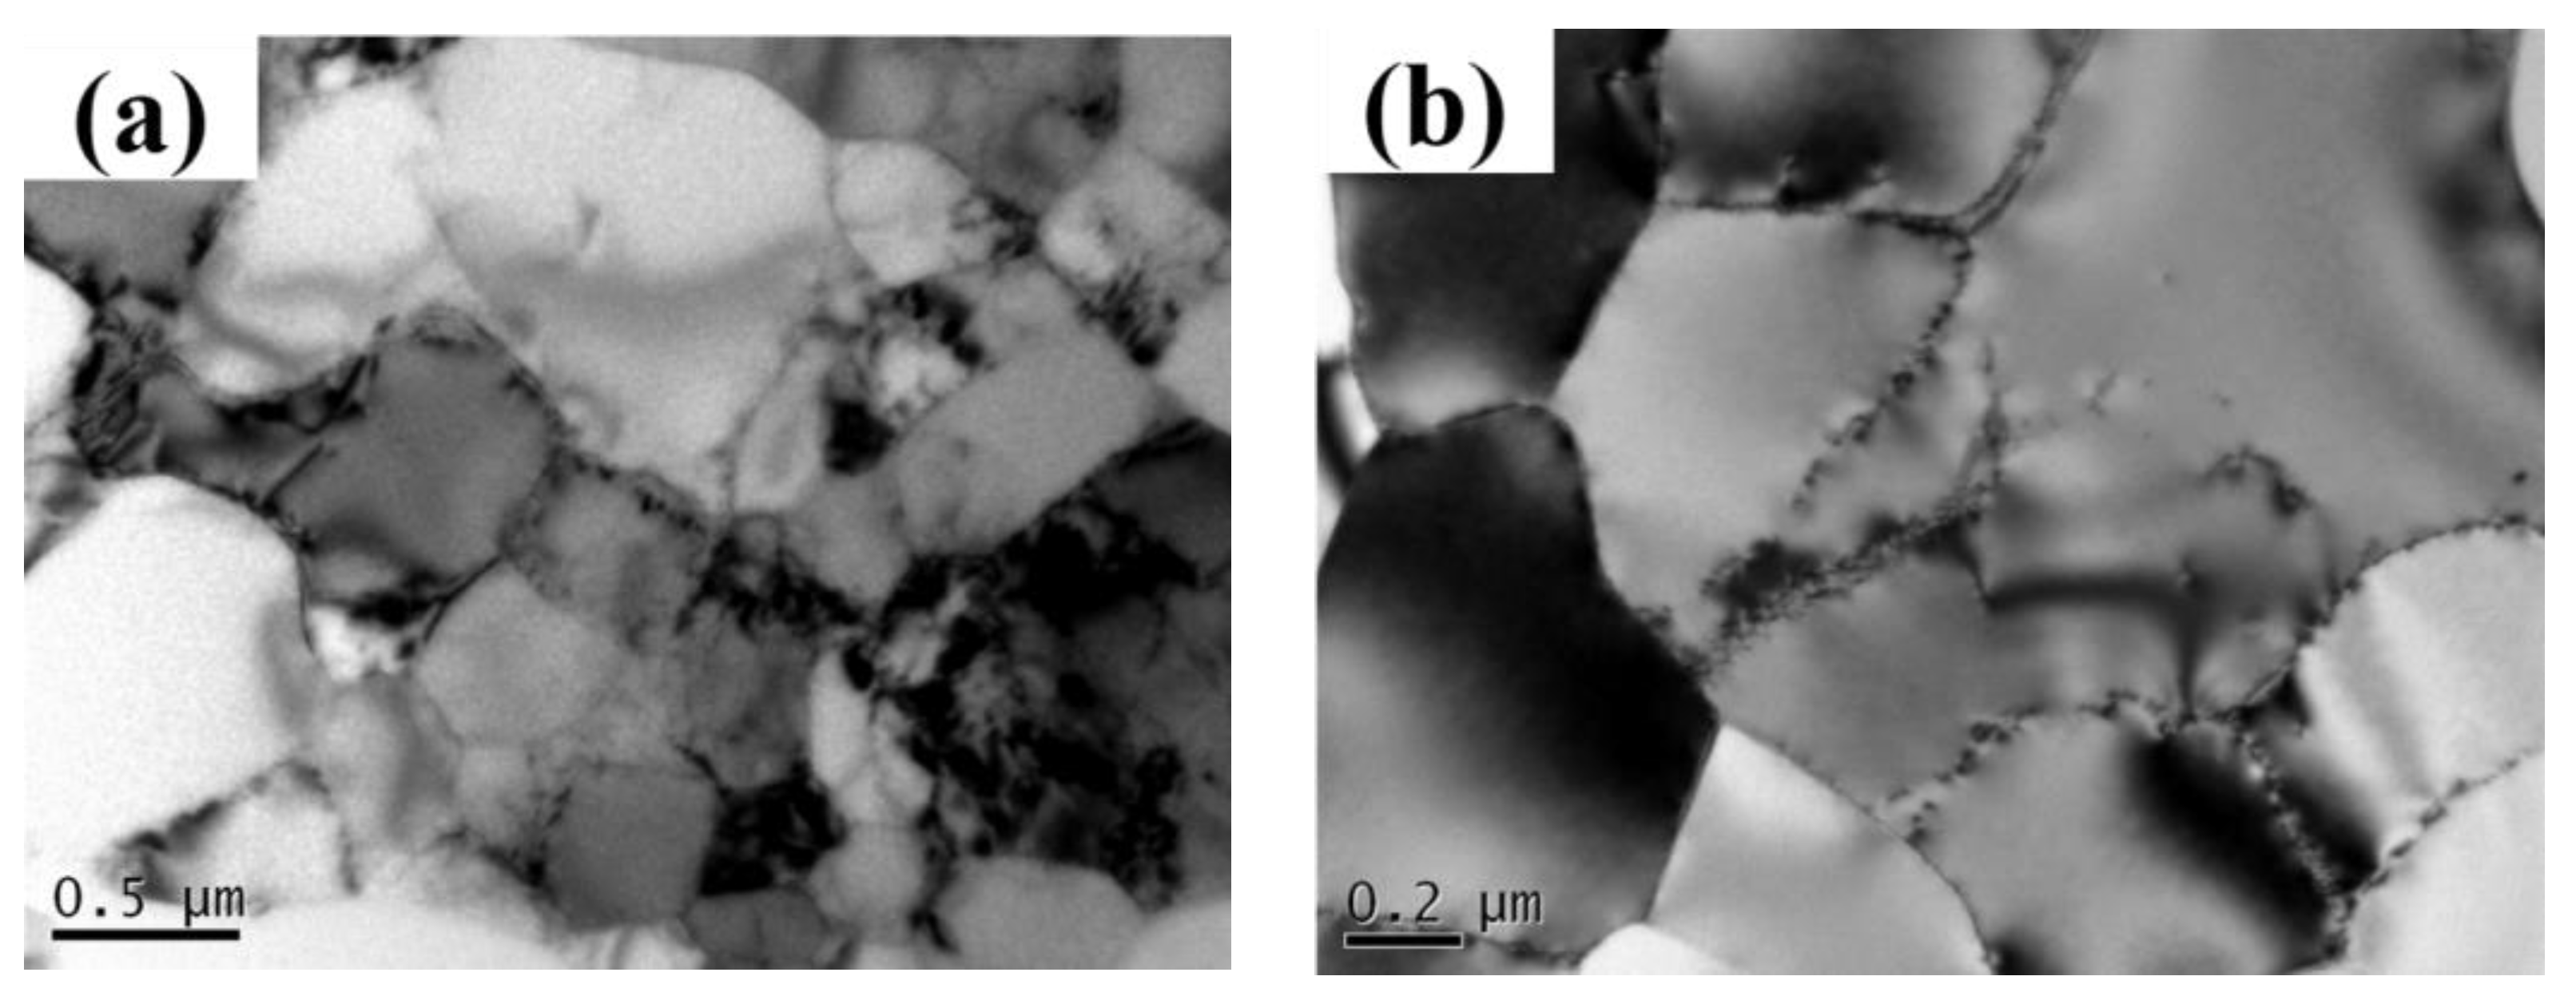
Figure 17 shows the TEM photographs of the aluminum wire near the fracture position in the Level 6 wind simulation experiment. Figure 17a,b shows the presence of a pronounced short dislocation plug in the grain interior and boundary in this group of aluminum wires. Figure 17c,d shows that the grains are not only basically equiaxed, but also deformed to some extent, which implies that the grains inside the aluminum wires had undergone plastic deformation in the simulation experiment under Level 6 wind.
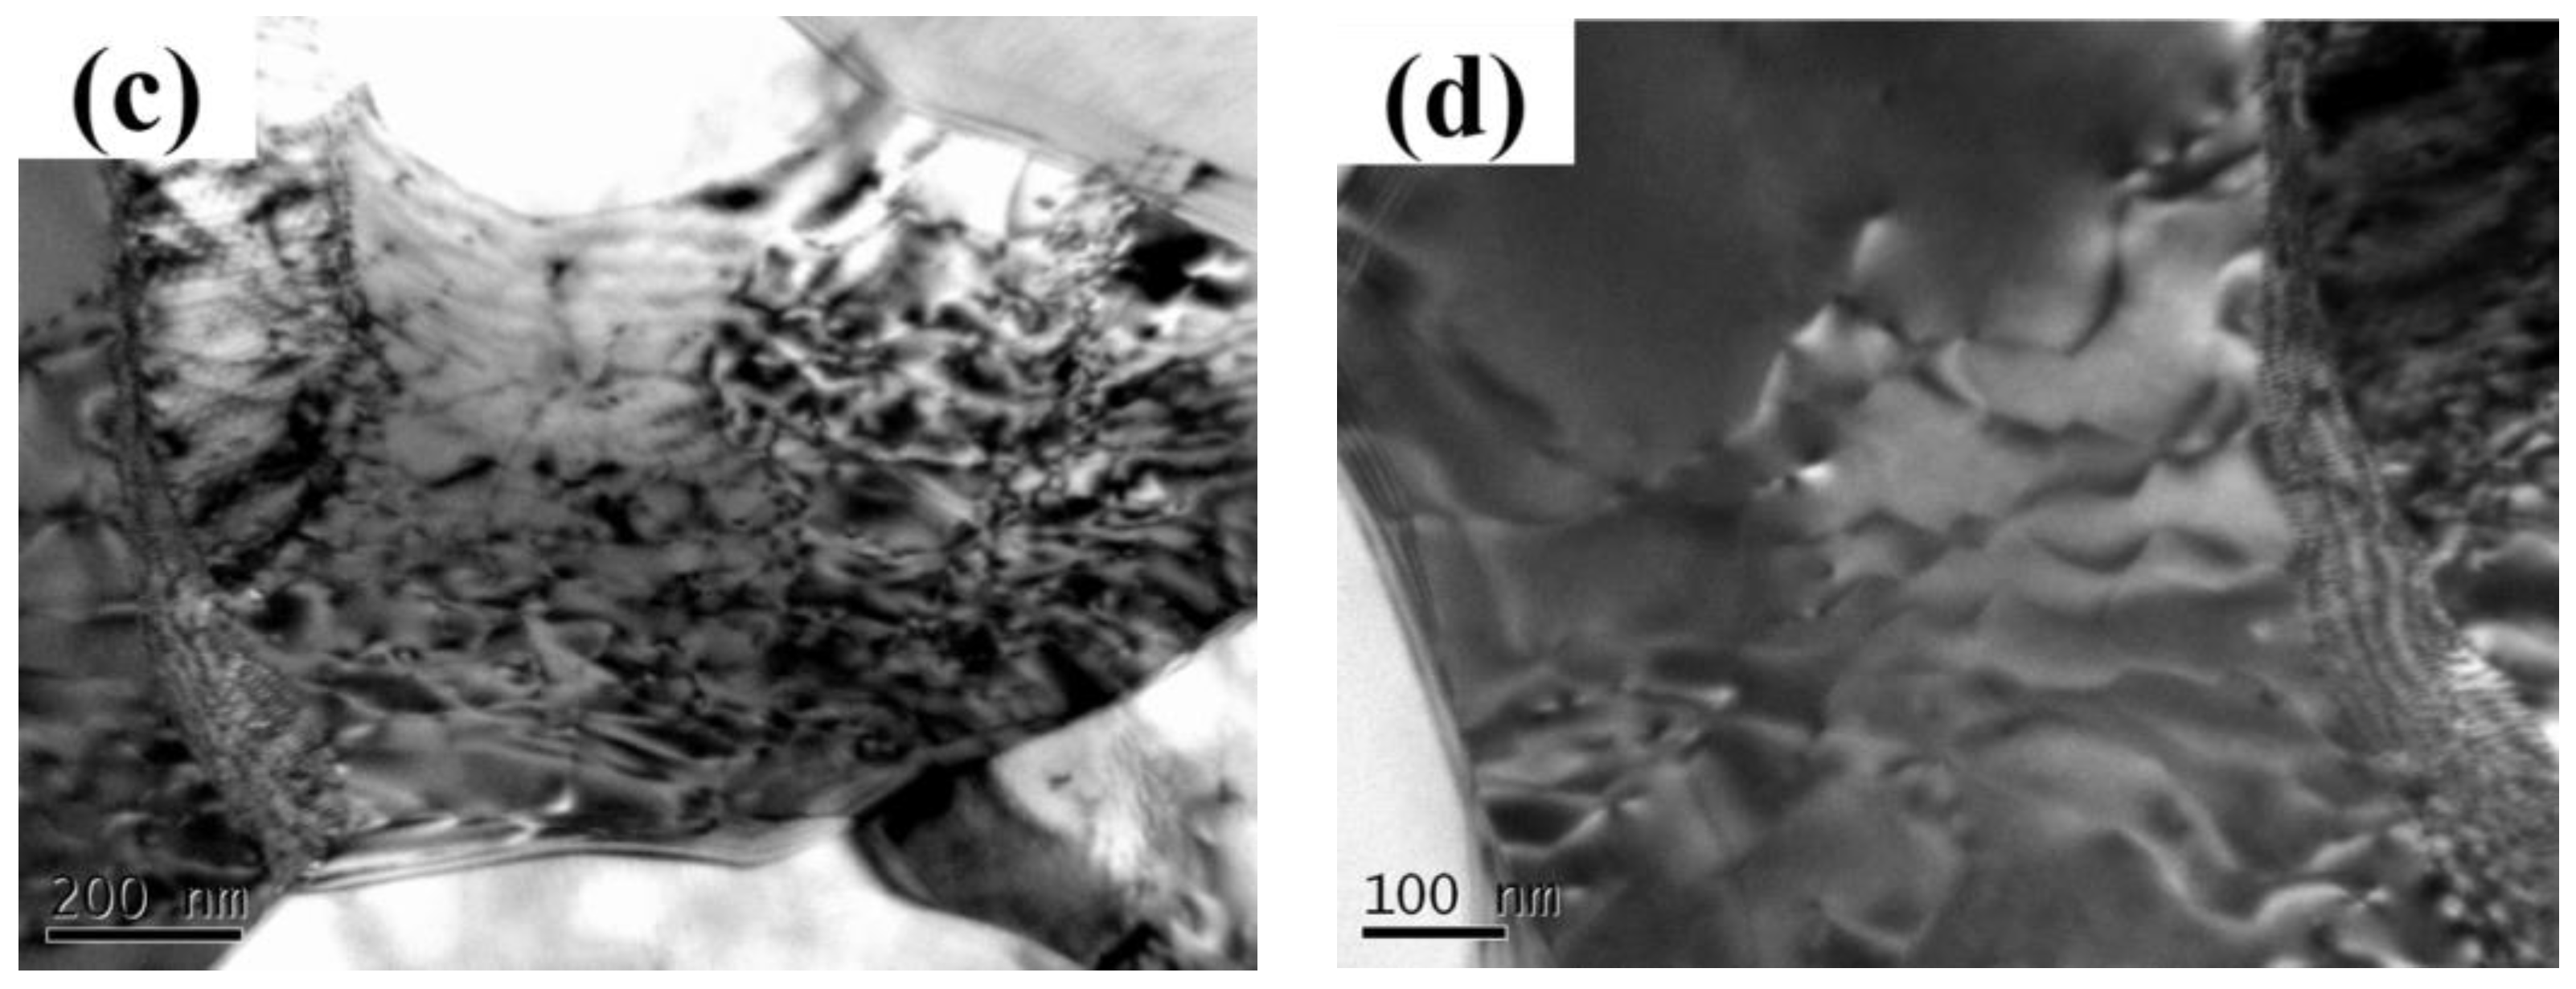
Figure 18 shows the TEM photographs of the aluminum wire near the fracture position in the Level 8 wind simulation experiment. Figure 18a,b shows the presence of a large number of dislocation-plug groups among the grains, and the grains are seriously deformed. The dislocation proliferation occurs inside the grain and begins to migrate to the grain boundary, as shown in Figure 18c. Figure 18d shows that the grain deformations are profoundly serious, and a large number of dislocations have accumulated. The abovementioned characteristics agree with the change pattern of the crystal shape during the plastic deformation.
3.4. SEM Observation and Analysis of Aluminum Wires
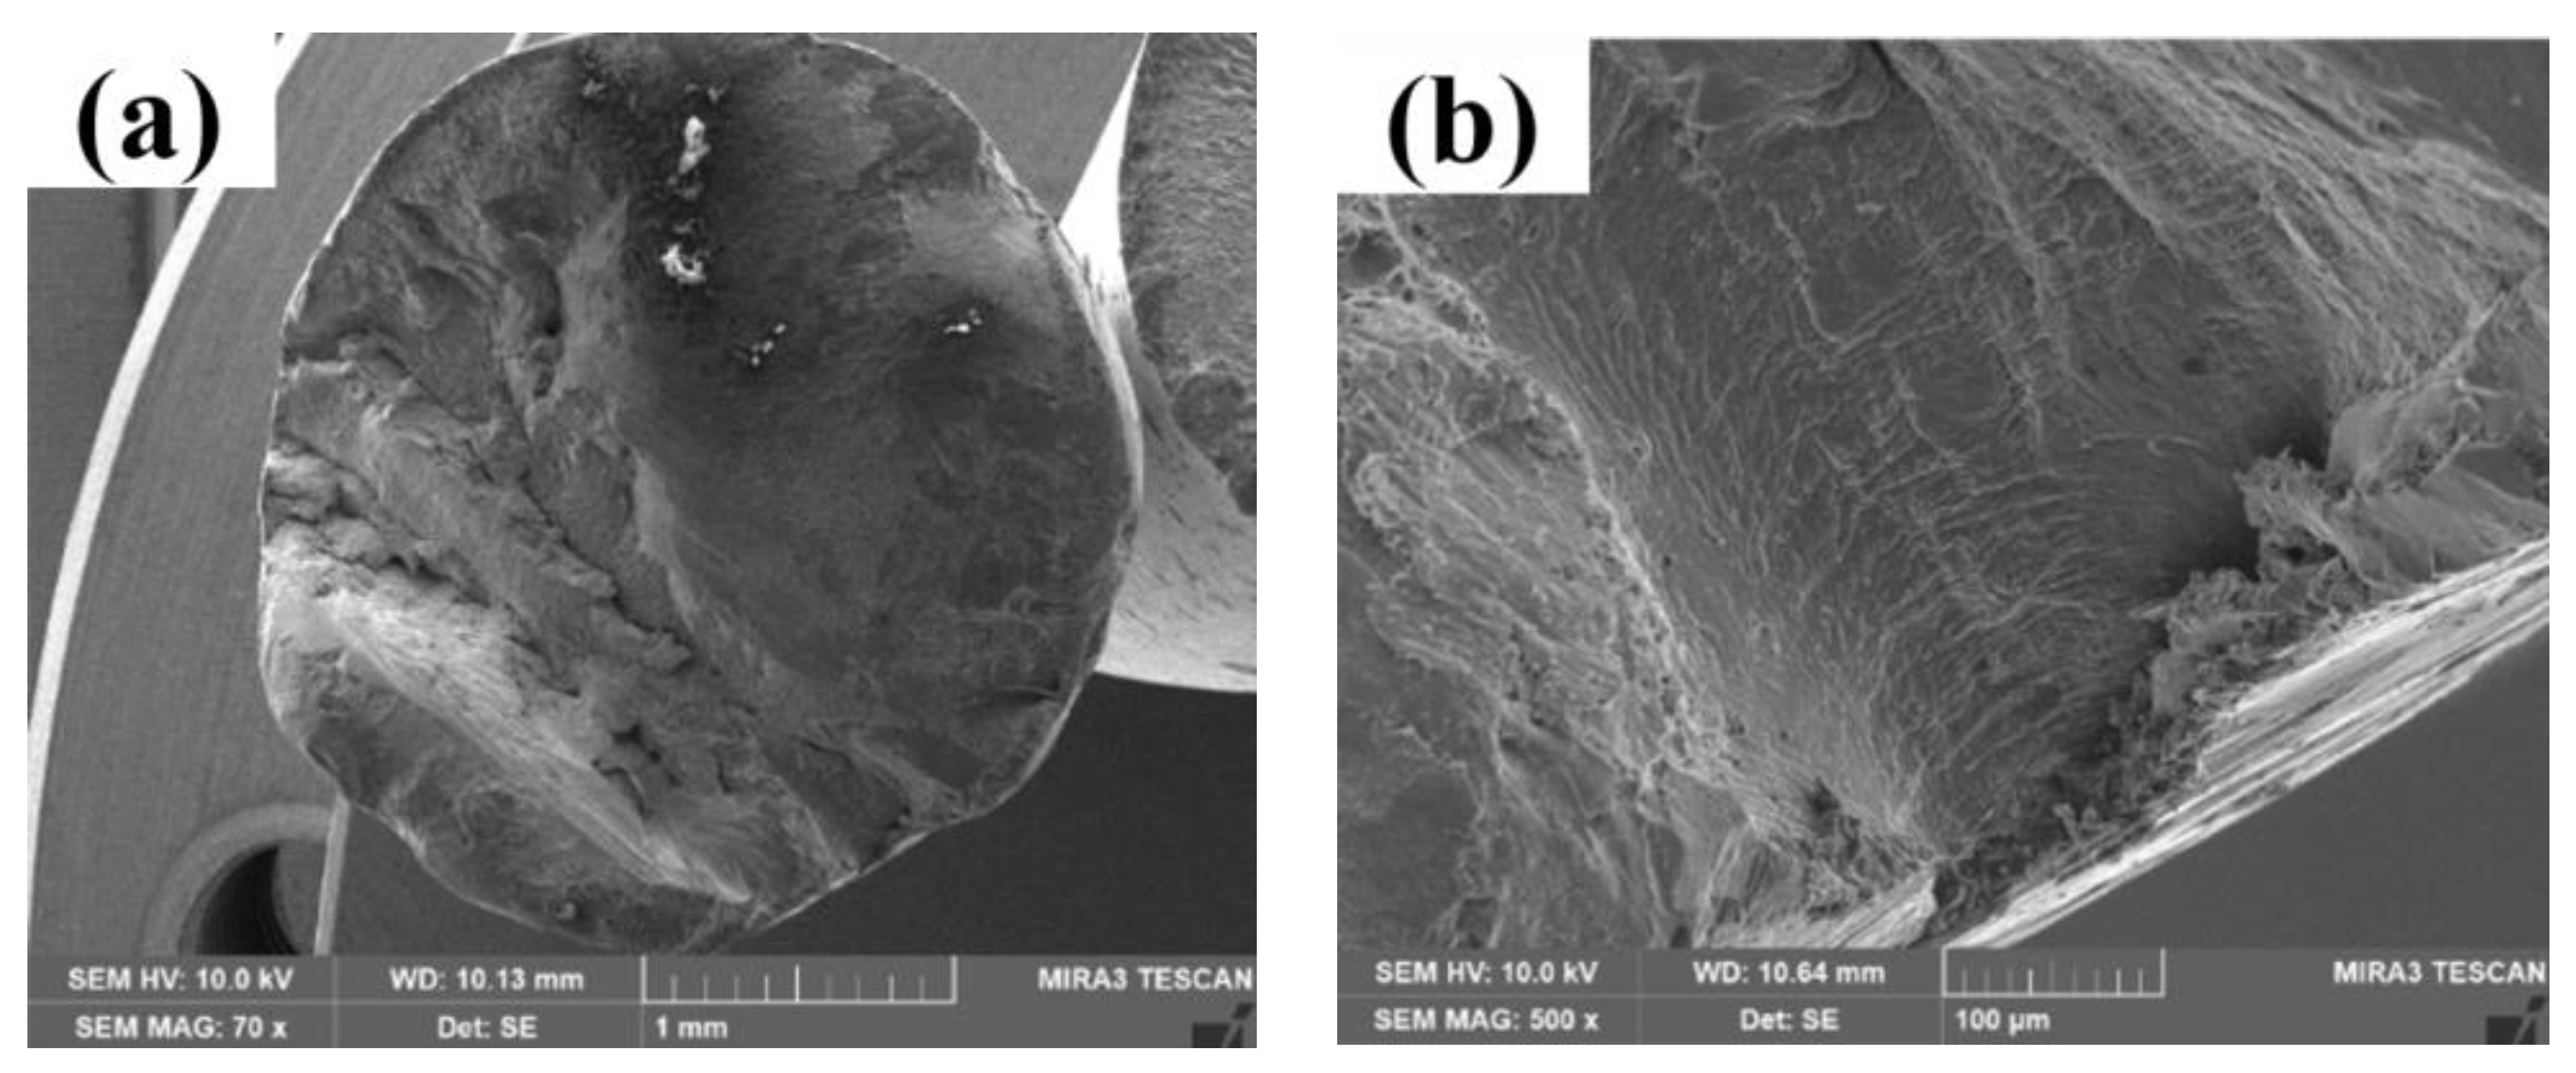
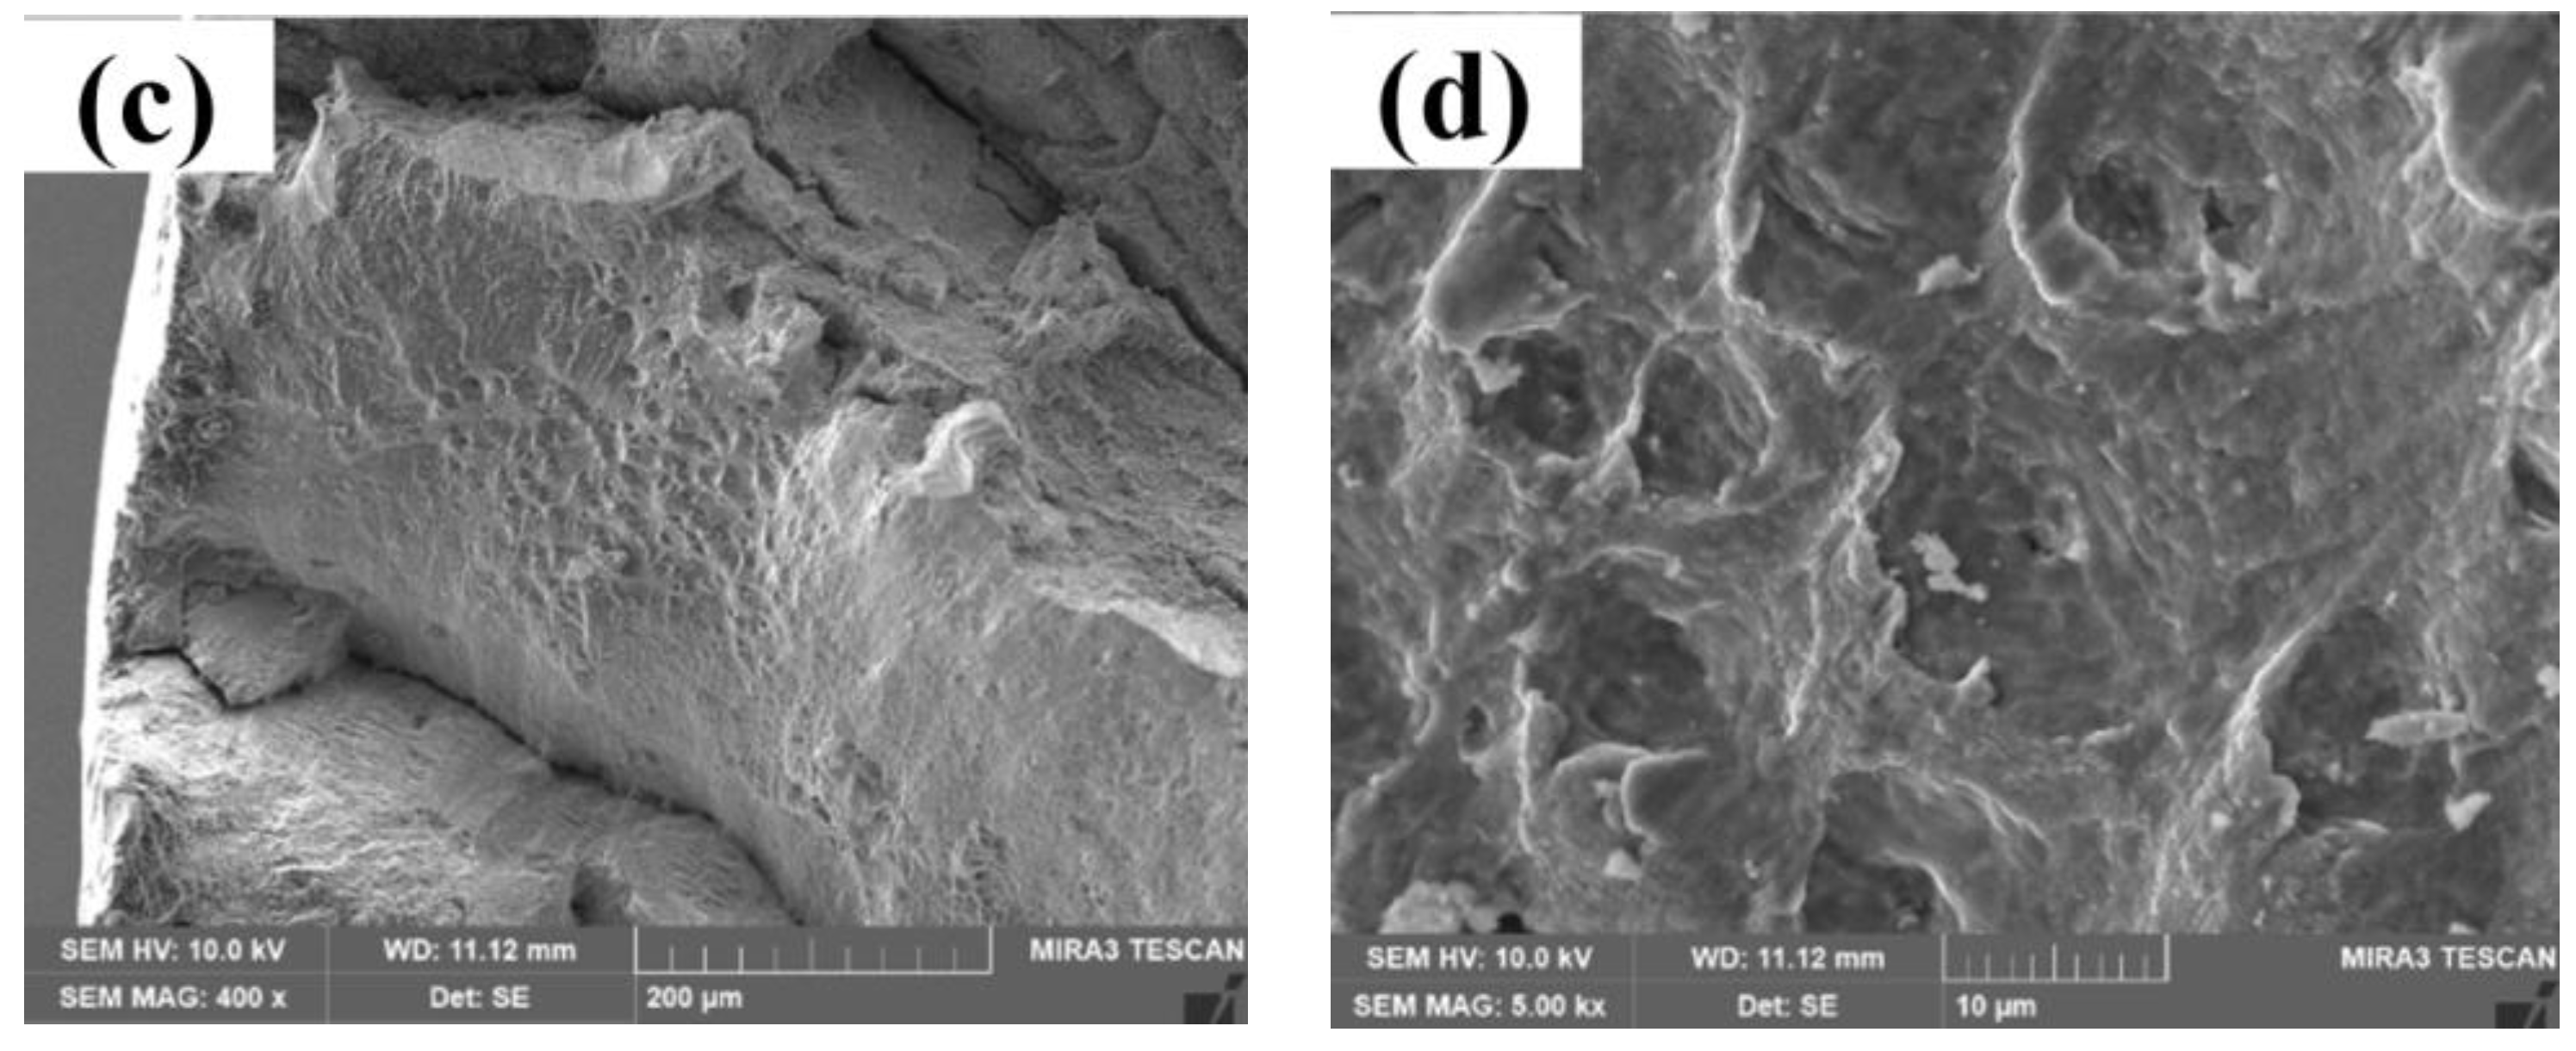
Figure 19 shows the scanning electron microscope (SEM) photographs of the fracture of the broken aluminum wire in the Level 6 wind simulation experiment. Figure 19a shows that cracks sprout at the lower right part and extend to the upper left region. The crack-propagation direction changes with the constantly changing maximum stress of the aluminum wire. The crack is gradually deflected to the upper right and is finally broken at the upper right region. The area in Figure 19b is located at the lower right part of the fracture in Figure 19a, which is the crack-source area of the fracture. The crack starts from the aluminum-wire surface and gradually expands to the core during the swing process in the simulation. Figure 19b shows the fatigue band displaying the characteristics of fatigue fracture, which indicates that this area is essentially the fatigue source area [33,34].
Figure 19c shows the tear characteristics observed in the second half in the crack-growth region, which indicate that the effective-force area decreases, and the local tensile stress increases to exceed its yield limit when the crack extends to the later stage. Dimple characteristics are observed in the same area in Figure 19d, which coincide with the aluminum-wire characteristics as plastic materials.
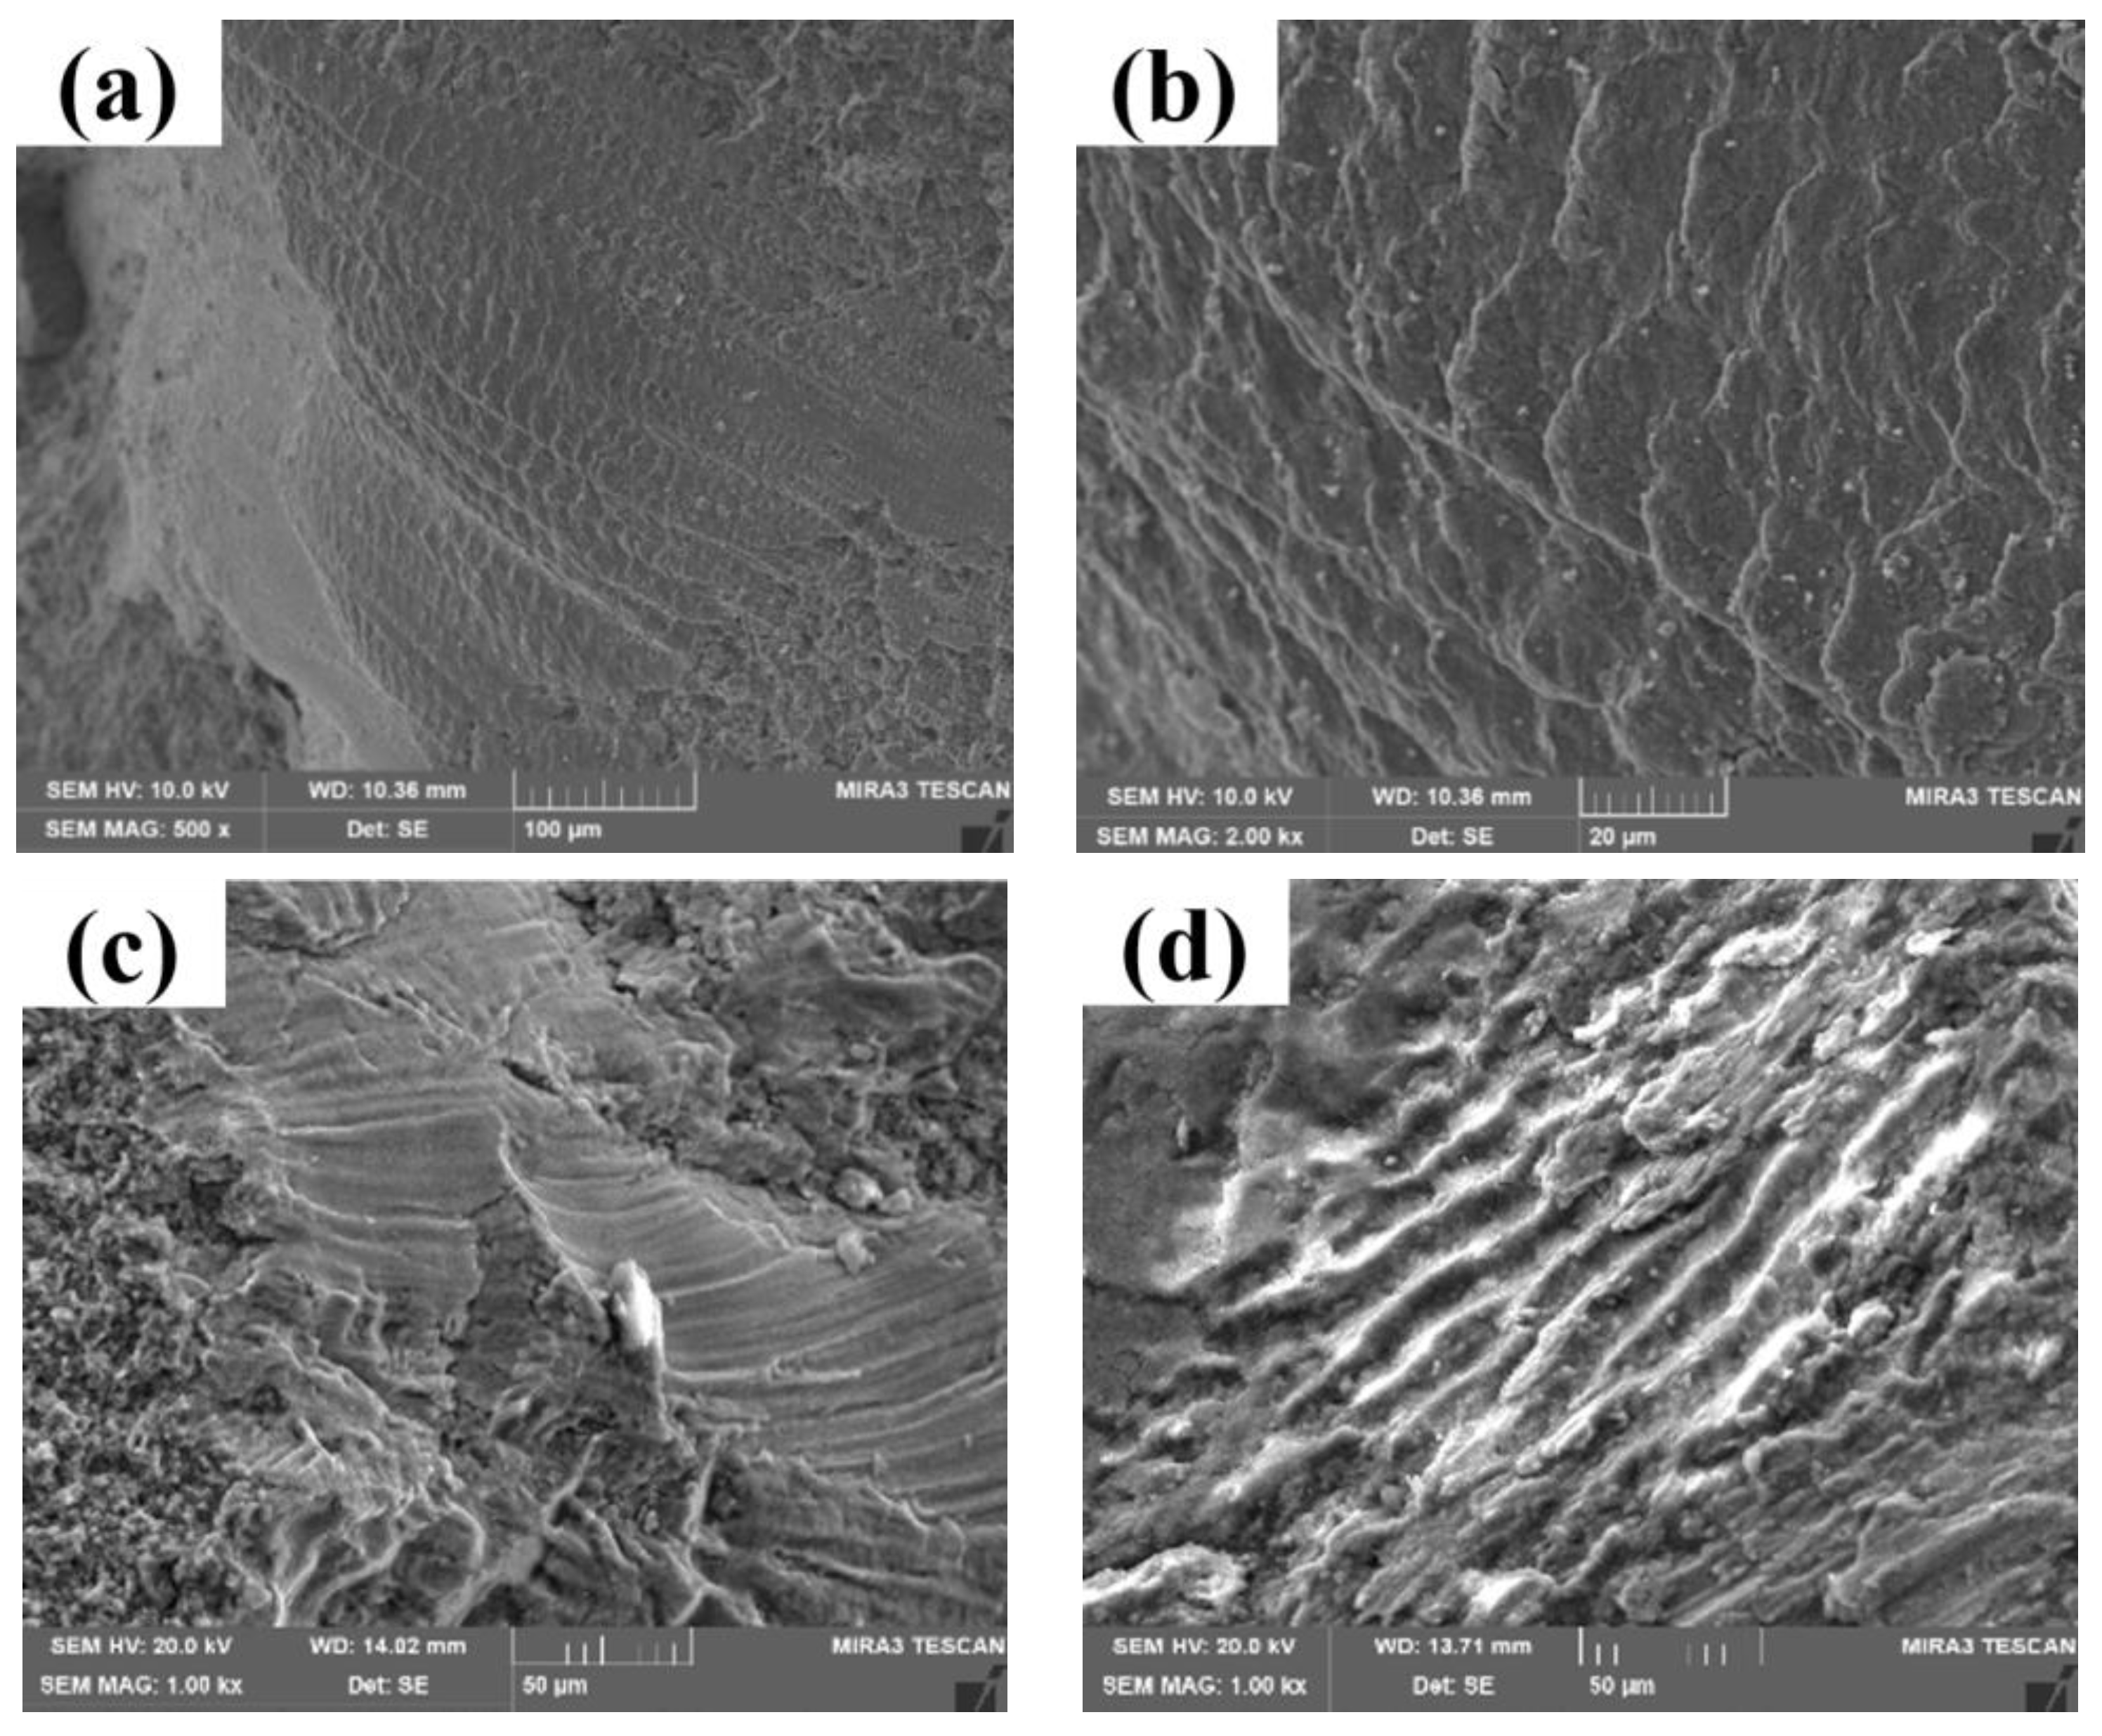
Figure 20 shows the fatigue band with a wavy-line feature observed in most fractures. These fatigue bands are short, deep, wide, and discontinuous, which clearly accord with the characteristics of the low-cycle strain-fatigue fracture bands. In contrast, the high-cycle stress-fatigue bands are usually thin, dense, continuous, long, and shallow [35,36,37].
According to the SEM results for all fractures in the broken aluminum wires, pronounced fatigue bands can be observed in the experimental group in the simulation under Level 6 wind or above. Moreover, the fatigue bands are short, deep, wide, and discontinuous, which conform to the characteristics of strain-fatigue fracture.
4. Conclusions
In this study, the typical jumper-wire-breakage accident of UHV transmission lines in strong-wind areas was analyzed. We preliminarily concluded that the cause of the broken strand of the jumper wires is related to their reciprocating motion under strong winds. We installed a monitoring system for the jumper swing on the fault site of a 750-kV transmission line and developed a simulation machine for the jumper-wire swing. According to the analysis of the broken aluminum wires obtained from the simulation experiment, the failure mechanism of the jumper wires was obtained.
- According to the key data obtained from the monitoring system of the jumper swing, a simulation machine for the jumper wire swing was developed. The simulation machine can simulate the swing condition of the jumper wire under different wind speeds. The fractured aluminum wire under different wind speeds was obtained through simulation experiment.
- According to the analysis of all broken aluminum wires, we found that the aluminum wires under a Level 6 wind and above were in the full-yield state. Their plastic deformation characteristics were evident, and the dislocations were concentrated in the grains. These phenomena fully illustrated the characteristics of strain-fatigue failure. Further fracture analysis showed that the fracture of the aluminum wire under a simulated Level 6 wind and above exhibited the fracture characteristics of a low-cycle strain fatigue.
- The broken jumper wires exhibited pronounced strain-fatigue characteristics under Level 6 wind and above. At the same time, the proportion of the Level 6 wind speed and above in strong-wind areas was much higher than that in other wind areas. Therefore, the failure mechanism of the jumper wires in strong-wind areas was a fatigue failure mechanism mainly based on the strain fatigue.
- When an ultra-high-voltage transmission line is set up in a strong-wind area, we need to pay attention to the role of the hinge structure of the hardware to buffer the wind load, avoid large stress concentration due to jumper-wire swing in strong-wind areas, and reduce the probability of strain-fatigue fracture in the jumper wire.
Author Contributions
Methodology, W.X., P.H., and C.H.; validation, P.H. and W.X.; investigation, C.H.; data curation, P.H.; writing—original draft preparation, P.H.; writing—review and editing, W.X.; project administration, Y.L.; funding acquisition, J.H. All authors have read and agreed to the published version of the manuscript.
Funding
This work was supported by the State Grid of China Science and Technology Project, under Grant No.52130417002U.
Conflicts of Interest
The authors declare no conflict of interest.
References
- Zhou, K.; Chen, Y.; Liu, L.; Xu, W. Application prospect of large cross-section conductor on UHVDC transmission line. Electr. Power 2012, 45, 35–37. [Google Scholar]
- Fu, H.; Chen, L. Analysis on the harm of gale to the transmission line of Xinjiang Power Grid. Xinjiang Electr. Power Technol. 2014, 1, 10–13. [Google Scholar]
- Huo, W.; Yang, Q.; He, Q.; Li, H. Climatic characteristics of Sandstorm in gale area of Xinjiang. Geogr. Arid Area 2011, 34, 753–761. [Google Scholar]
- Zhou, C.; Yin, J.; Liu, Y. Effects of wind and rain on the motion of the high-voltage conductor in a simplified valley terrain. Electr. Power Syst. Res. 2019, 173, 153–163. [Google Scholar] [CrossRef]
- Ma, X.; Gao, L.; Zhang, J.; Zhang, L.-C. Fretting Wear Behaviors of Aluminum Cable Steel Reinforced (ACSR) Conductors in High-Voltage Transmission Line. Metals 2017, 7, 373. [Google Scholar] [CrossRef] [Green Version]
- Fadel, A.A.; Rosa, D.; Murça, L.B.; Fereira, J.L.A.; Araújo, J.A. Effect of high mean tensile stress on the fretting fatigue life of an Ibis steel reinforced aluminium conductor. Int. J. Fatigue 2012, 42, 24–34. [Google Scholar] [CrossRef]
- Qi, Y.; Rui, X.; Ji, K.; Liu, C.; Zhou, C. Study on aeolian vibration suppression schemes for large crossing span of ultra-high-voltage eight-bundle conductors. Adv. Mech. Eng. 2019, 11, 4. [Google Scholar] [CrossRef]
- Matsumiya, H.; Nishihara, T.; Yagi, T. Aerodynamic modeling for large-amplitude galloping of four-bundled conductors. J. Fluids Struct. 2018, 82, 559–576. [Google Scholar] [CrossRef]
- Diana, G.; Belloli, M.; Giappino, S.; Manenti, A.; Mazzola, L.; Muggiasca, S.; Zuin, A. Wind Tunnel Tests on Two Cylinders to Measure Subspan Oscillation Aerodynamic Forces. IEEE Trans. Power Deliv. 2014, 29, 1273–1283. [Google Scholar] [CrossRef]
- Lu, J.; Wang, Q.; Wang, L.; Mei, H.; Yang, L.; Xu, X.; Li, L. Study on wind tunnel test and galloping of iced quad bundle conductor. Cold Reg. Sci. Technol. 2019, 160, 273–287. [Google Scholar] [CrossRef]
- Zhang, D.; He, Z.; Huang, Z.; Jiang, W. Isogeometric Collocation Method for the Galloping of an Iced Conductor. J. Eng. Mech. 2017, 143, 04017009. [Google Scholar] [CrossRef]
- Zhou, L.; Yan, B.; Zhang, L.; Zhou, S. Study on galloping behavior of iced eight bundle conductor transmission lines. J. Sound Vib. 2016, 362, 85–110. [Google Scholar] [CrossRef]
- Corporation, China Power Engineering Consulting. Code for Design of 110 KV~750 KV Overhead Transmission Line; China’s National Scientific and Technological Achievements: Beijing, China, 2012; p. 180. [Google Scholar]
- Dutkiewicz, M.; Machado, R.M. Measurements in Situ and Spectral Analysis of Wind Flow Effects on Overhead Transmission Lines. Soundvibration 2019, 53, 161–175. [Google Scholar] [CrossRef] [Green Version]
- Zhao, L.; Huang, X.; Zhao, Y.; Si, W. Design of a wireless vibration metre for conductor vibration monitoring. Struct. Control Health Monit. 2018, 25, e2143. [Google Scholar] [CrossRef]
- Zhao, L.; Huang, X.; Jia, J.; Zhu, Y.; Cao, W. Detection of Broken Strands of Transmission Line Conductors Using Fiber Bragg Grating Sensors. Sensors 2018, 18, 2397. [Google Scholar] [CrossRef] [Green Version]
- Waters, D.H.; Hoffman, J.; Kumosa, M. Monitoring of Overhead Transmission Conductors Subjected to Static and Impact Loads Using Fiber Bragg Grating Sensors. IEEE Trans. Instrum. Meas. 2019, 68, 595–605. [Google Scholar] [CrossRef]
- Godard, B.; Guerard, S.; Lilien, J.-L. Original Real-Time Observations of Aeolian Vibrations on Power-Line Conductors. IEEE Trans. Power Deliv. 2011, 26, 2111–2117. [Google Scholar] [CrossRef]
- Zhang, X.; Cao, Y.; Han, C.; Bai, Y. On the Surface Damage Features of Transmission Line Conductors Based on Image Processing. J. Graph. 2018, 39, 440–447. [Google Scholar]
- Levesque, F.E.R.; Goudreau, S.; Cardou, A.; Cloutier, L. Strain Measurements on ACSR Conductors During Fatigue Tests Experimental Method and Data. IEEE Trans. Power Deliv. 2010, 25, 2825–2834. [Google Scholar] [CrossRef]
- Goudreau, S.; Levesque, F.D.R.; Cardou, A.; Cloutier, L. Strain Measurements on ACSR Conductors During Fatigue Tests III—Strains Related to Support Geometry. IEEE Trans. Power Deliv. 2010, 25, 3007–3016. [Google Scholar] [CrossRef]
- Azevedo, C.R.F.; Henriques, A.M.D.; Pulino Filho, A.R.; Ferreira, J.L.A.; Araújo, J.A. Fretting fatigue in overhead conductors: Rig design and failure analysis of a Grosbeak aluminium cable steel reinforced conductor. Eng. Fail. Anal. 2009, 16, 136–151. [Google Scholar] [CrossRef]
- Araújo, J.A.; Nowell, D. Mixed high low fretting fatigue of Ti6Al4V: Tests and modelling. Tribol. Int. 2009, 42, 1276–1285. [Google Scholar] [CrossRef]
- Rolim, A.L.; Moreira, J.L.D.R.; Veloso, L.A.C.M.; de Souza, R.M.; Araújo, J.A. Differential displacement and strain analysis of transmission line cables. J. Braz. Soc. Mech. Sci. Eng. 2013, 35, 327–336. [Google Scholar] [CrossRef]
- Wolf, H.; Adum, B.; Bozic, Z. The impact of empirical fules for aeolian vibrations in overhead transmission lines. Trans. FAMENA 2010, 34, 47–58. [Google Scholar]
- Li, Y.; Han, J.; He, C.; Ma, P.; Lin, D.; Xiao, W. Fracture mechanism of lead wire in strong wind environment based on finite element method. China Sci. 2019, 14, 569–574. [Google Scholar]
- Zhao, X.; Gao, W.; Qin, H. Contact Analysis of Stranded Wire between Adjacent Layers. China Mech. Eng. 2011, 22, 1929–1933. [Google Scholar]
- Fellows, L.J.; Nowell, D.; Hills, D.A. Analysis of crack initiation and propagation in fretting fatigue: The effective initial flaw size methodology. Fatigue Fract. Eng. Mater. Struct. 1997, 20, 61–70. [Google Scholar] [CrossRef]
- Sato, K.; Fujii, H.; Kodama, S. Crack propagation behaviour in fretting fatigue. Wear 1986, 107, 245–262. [Google Scholar] [CrossRef]
- Mangardich, D.; Abrari, F.; Fawaz, Z. A fracture mechanics based approach for the fretting fatigue of aircraft engine fan dovetail attachments. Int. J. Fatigue 2019, 129, 105213. [Google Scholar] [CrossRef]
- Chen, Y.; Zhang, X.; Wang, F.; Song, X.; Wang, A.; Song, H. Fatigue Failure Analysis and Life Prediction of Aeroengine Compressor Components. J. Mater. Eng. Perform. 2019, 28, 6418–6427. [Google Scholar] [CrossRef]
- Karabay, S.; Ertürk, A.T.; Zeren, M.; Karakulak, E. Failure analysis of wire-breaks in aluminum conductor production and investigation of early failure reasons for transmission lines. Eng. Fail. Anal. 2018, 83, 47–56. [Google Scholar] [CrossRef]
- Rocha, P.H.C.; Diaz, J.I.M.; Silva, C.R.M.; Araújo, J.A.; Castro, F.C. Fatigue of two contacting wires of the ACSR Ibis 397.5 MCM conductor: Experiments and life prediction. Int. J. Fatigue 2019, 127, 25–35. [Google Scholar] [CrossRef]
- Wang, X.; Chen, G.; Wang, J.; Zhang, J.; Zhang, T.; Xu, G.; Tang, W. Fretting fatigue fractographies of aluminum conductor steel reinforced overhead conductor. Chin. J. Nonferrous Met. 2012, 22, 194–200. [Google Scholar]
- Yang, B.; Mall, S. Mechanics of two-stage crack growth in fretting fatigue. Eng. Fract. Mech. 2008, 75, 1507–1515. [Google Scholar] [CrossRef]
- Szolwinski, M.P.; Farris, T.N. Mechanics of fretting fatigue crack formation. Wear 1996, 198, 93–107. [Google Scholar] [CrossRef]
- Zhou, Z.R.; Vincent, L. Mixed fretting regime. Wear 1995, 181, 531–536. [Google Scholar] [CrossRef]
Figure 1.
Breakage location of ACSR (aluminum conductor steel reinforced).

Figure 2.
Installation diagram of the mid-phase jumper. (a) Three dimensional structure diagram of jumper; (b) Front view of jumper structure.
Figure 2.
Installation diagram of the mid-phase jumper. (a) Three dimensional structure diagram of jumper; (b) Front view of jumper structure.

Figure 3.
Design of mid-phase jumper structure.

Figure 4.
Breakage location of the mid-phase jumper wire.

Figure 5.
Jumper-swing monitoring system.

Figure 6.
Definition of swing angle.

Figure 7.
Wind-speed distribution.

Figure 8.
Swing angle and swing frequency of the jumper under different wind speeds.

Figure 9.
Design drawing of jumper-wire swing simulation machine.

Figure 10.
Simulated schematic diagram of simulation machine.

Figure 11.
Effective tension calculation by the finite element model.

Figure 12.
Crack growth process at the ACSR surface.

Figure 13.
Schematic diagram of the crack-growth process.

Figure 14.
The location of the maximum equivalent stress and the actual breakage.

Figure 15.
Macroscopic persistent slip lines of the aluminum wires. (a) Physical drawing of the macroscopic slip lines; (b) Enlarged drawing of the slip lines; (c) Three-dimensional outline drawing of the slip lines; (d) Outline size of the slip lines.
Figure 15.
Macroscopic persistent slip lines of the aluminum wires. (a) Physical drawing of the macroscopic slip lines; (b) Enlarged drawing of the slip lines; (c) Three-dimensional outline drawing of the slip lines; (d) Outline size of the slip lines.

Figure 16.
TEM (transmission electron microscope) photographs of new aluminum wires. (a) No dislocation; (b) A few short dislocations; (c) Clear grain boundary; (d) Clear grain boundary.
Figure 16.
TEM (transmission electron microscope) photographs of new aluminum wires. (a) No dislocation; (b) A few short dislocations; (c) Clear grain boundary; (d) Clear grain boundary.

Figure 17.
TEM photographs of the simulated Level 6 wind. (a) Dislocations in grains interior; (b) Dislocations at grain boundary; (c) Non equiaxed grains; (d) Deformed grains.
Figure 17.
TEM photographs of the simulated Level 6 wind. (a) Dislocations in grains interior; (b) Dislocations at grain boundary; (c) Non equiaxed grains; (d) Deformed grains.

Figure 18.
TEM photographs of the simulated Level 8 wind. (a) A large number of dislocation-plug groups; (b) Dislocations at the grain boundary; (c) Dislocations migration to the grain boundary; (d) Serious deformation in grains interior.
Figure 18.
TEM photographs of the simulated Level 8 wind. (a) A large number of dislocation-plug groups; (b) Dislocations at the grain boundary; (c) Dislocations migration to the grain boundary; (d) Serious deformation in grains interior.


Figure 19.
SEM (scanning electron microscope) photographs of the simulated Level 6 wind. (a) Macroscopic fracture of the broken aluminum wire; (b) Crack-source area; (c) Tear characteristics; (d) Dimple characteristics.
Figure 19.
SEM (scanning electron microscope) photographs of the simulated Level 6 wind. (a) Macroscopic fracture of the broken aluminum wire; (b) Crack-source area; (c) Tear characteristics; (d) Dimple characteristics.


Figure 20.
Characteristics of fatigue bands with a wavy line. (a) A large number of fatigue bands; (b) Short fatigue bands; (c) Discontinuous fatigue bands; (d) Deep fatigue bands.
Figure 20.
Characteristics of fatigue bands with a wavy line. (a) A large number of fatigue bands; (b) Short fatigue bands; (c) Discontinuous fatigue bands; (d) Deep fatigue bands.


Table 1.
Key experimental parameters.
| Simulated Wind-Speed Level | 5 | 6 | 7 | 8 |
|---|---|---|---|---|
| Simulated wind-speed value (m/s) | 9.4 | 12.3 | 15.5 | 19.0 |
| Swing angle (°) | 2.3 | 2.9 | 3.6 | 4.3 |
| Eccentricity (mm) | 34.0 | 42.0 | 50.0 | 59.0 |
| Swing frequency (cycle/min) | 12.0 | 10.0 | 9.0 | 8.0 |
© 2019 by the authors. Licensee MDPI, Basel, Switzerland. This article is an open access article distributed under the terms and conditions of the Creative Commons Attribution (CC BY) license (http://creativecommons.org/licenses/by/4.0/).
Share and Cite
MDPI and ACS Style
He, P.; Han, J.; Li, Y.; He, C.; Xiao, W. Research on Failure Mechanisms of Broken Strands of Jumper Wires for EHV Transmission Lines in Strong-Wind Areas. Metals 2020, 10, 39. https://doi.org/10.3390/met10010039
AMA Style
He P, Han J, Li Y, He C, Xiao W. Research on Failure Mechanisms of Broken Strands of Jumper Wires for EHV Transmission Lines in Strong-Wind Areas. Metals. 2020; 10(1):39. https://doi.org/10.3390/met10010039
Chicago/Turabian StyleHe, Peng, Jiceng Han, Yongjie Li, Cheng He, and Wenkai Xiao. 2020. "Research on Failure Mechanisms of Broken Strands of Jumper Wires for EHV Transmission Lines in Strong-Wind Areas" Metals 10, no. 1: 39. https://doi.org/10.3390/met10010039
Note that from the first issue of 2016, this journal uses article numbers instead of page numbers. See further details here.