
Direct Membrane Filtration of Municipal Wastewater: Studying the Most Suitable Conditions for Minimizing Fouling Rate in Commercial Porous Membranes at Demonstration Scale

Abstract
:1. Introduction
2. Materials and Methods
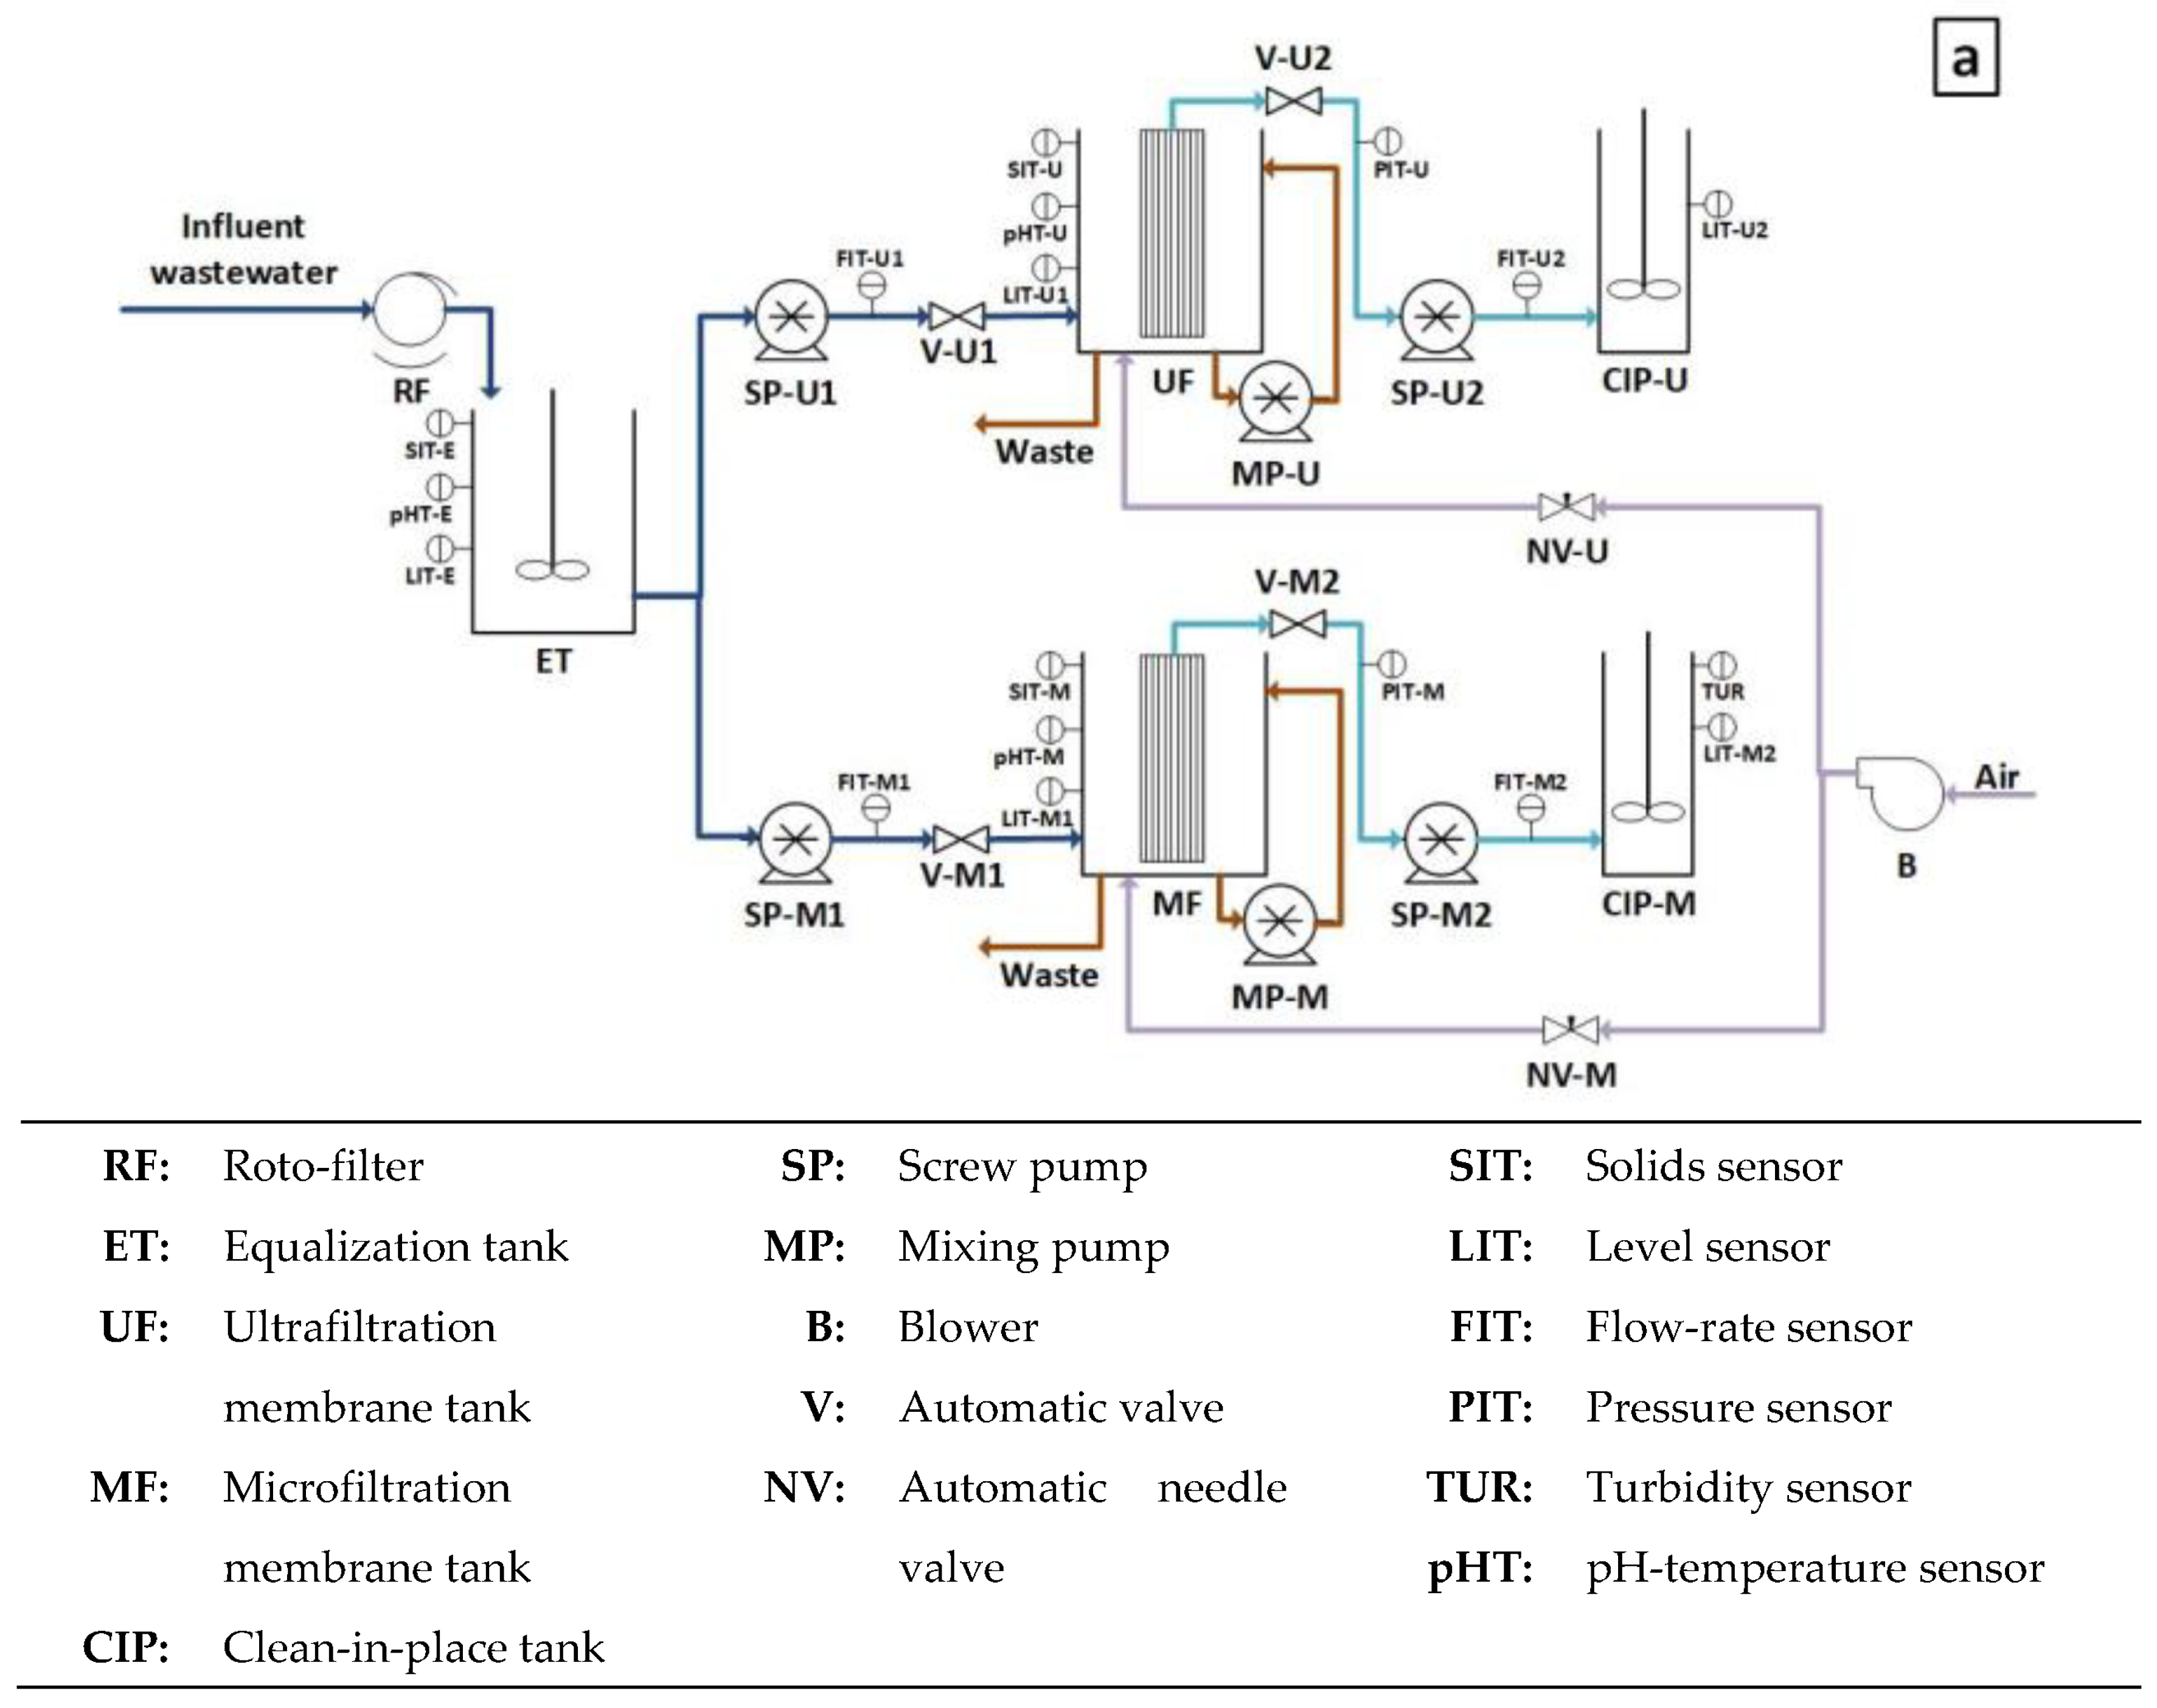
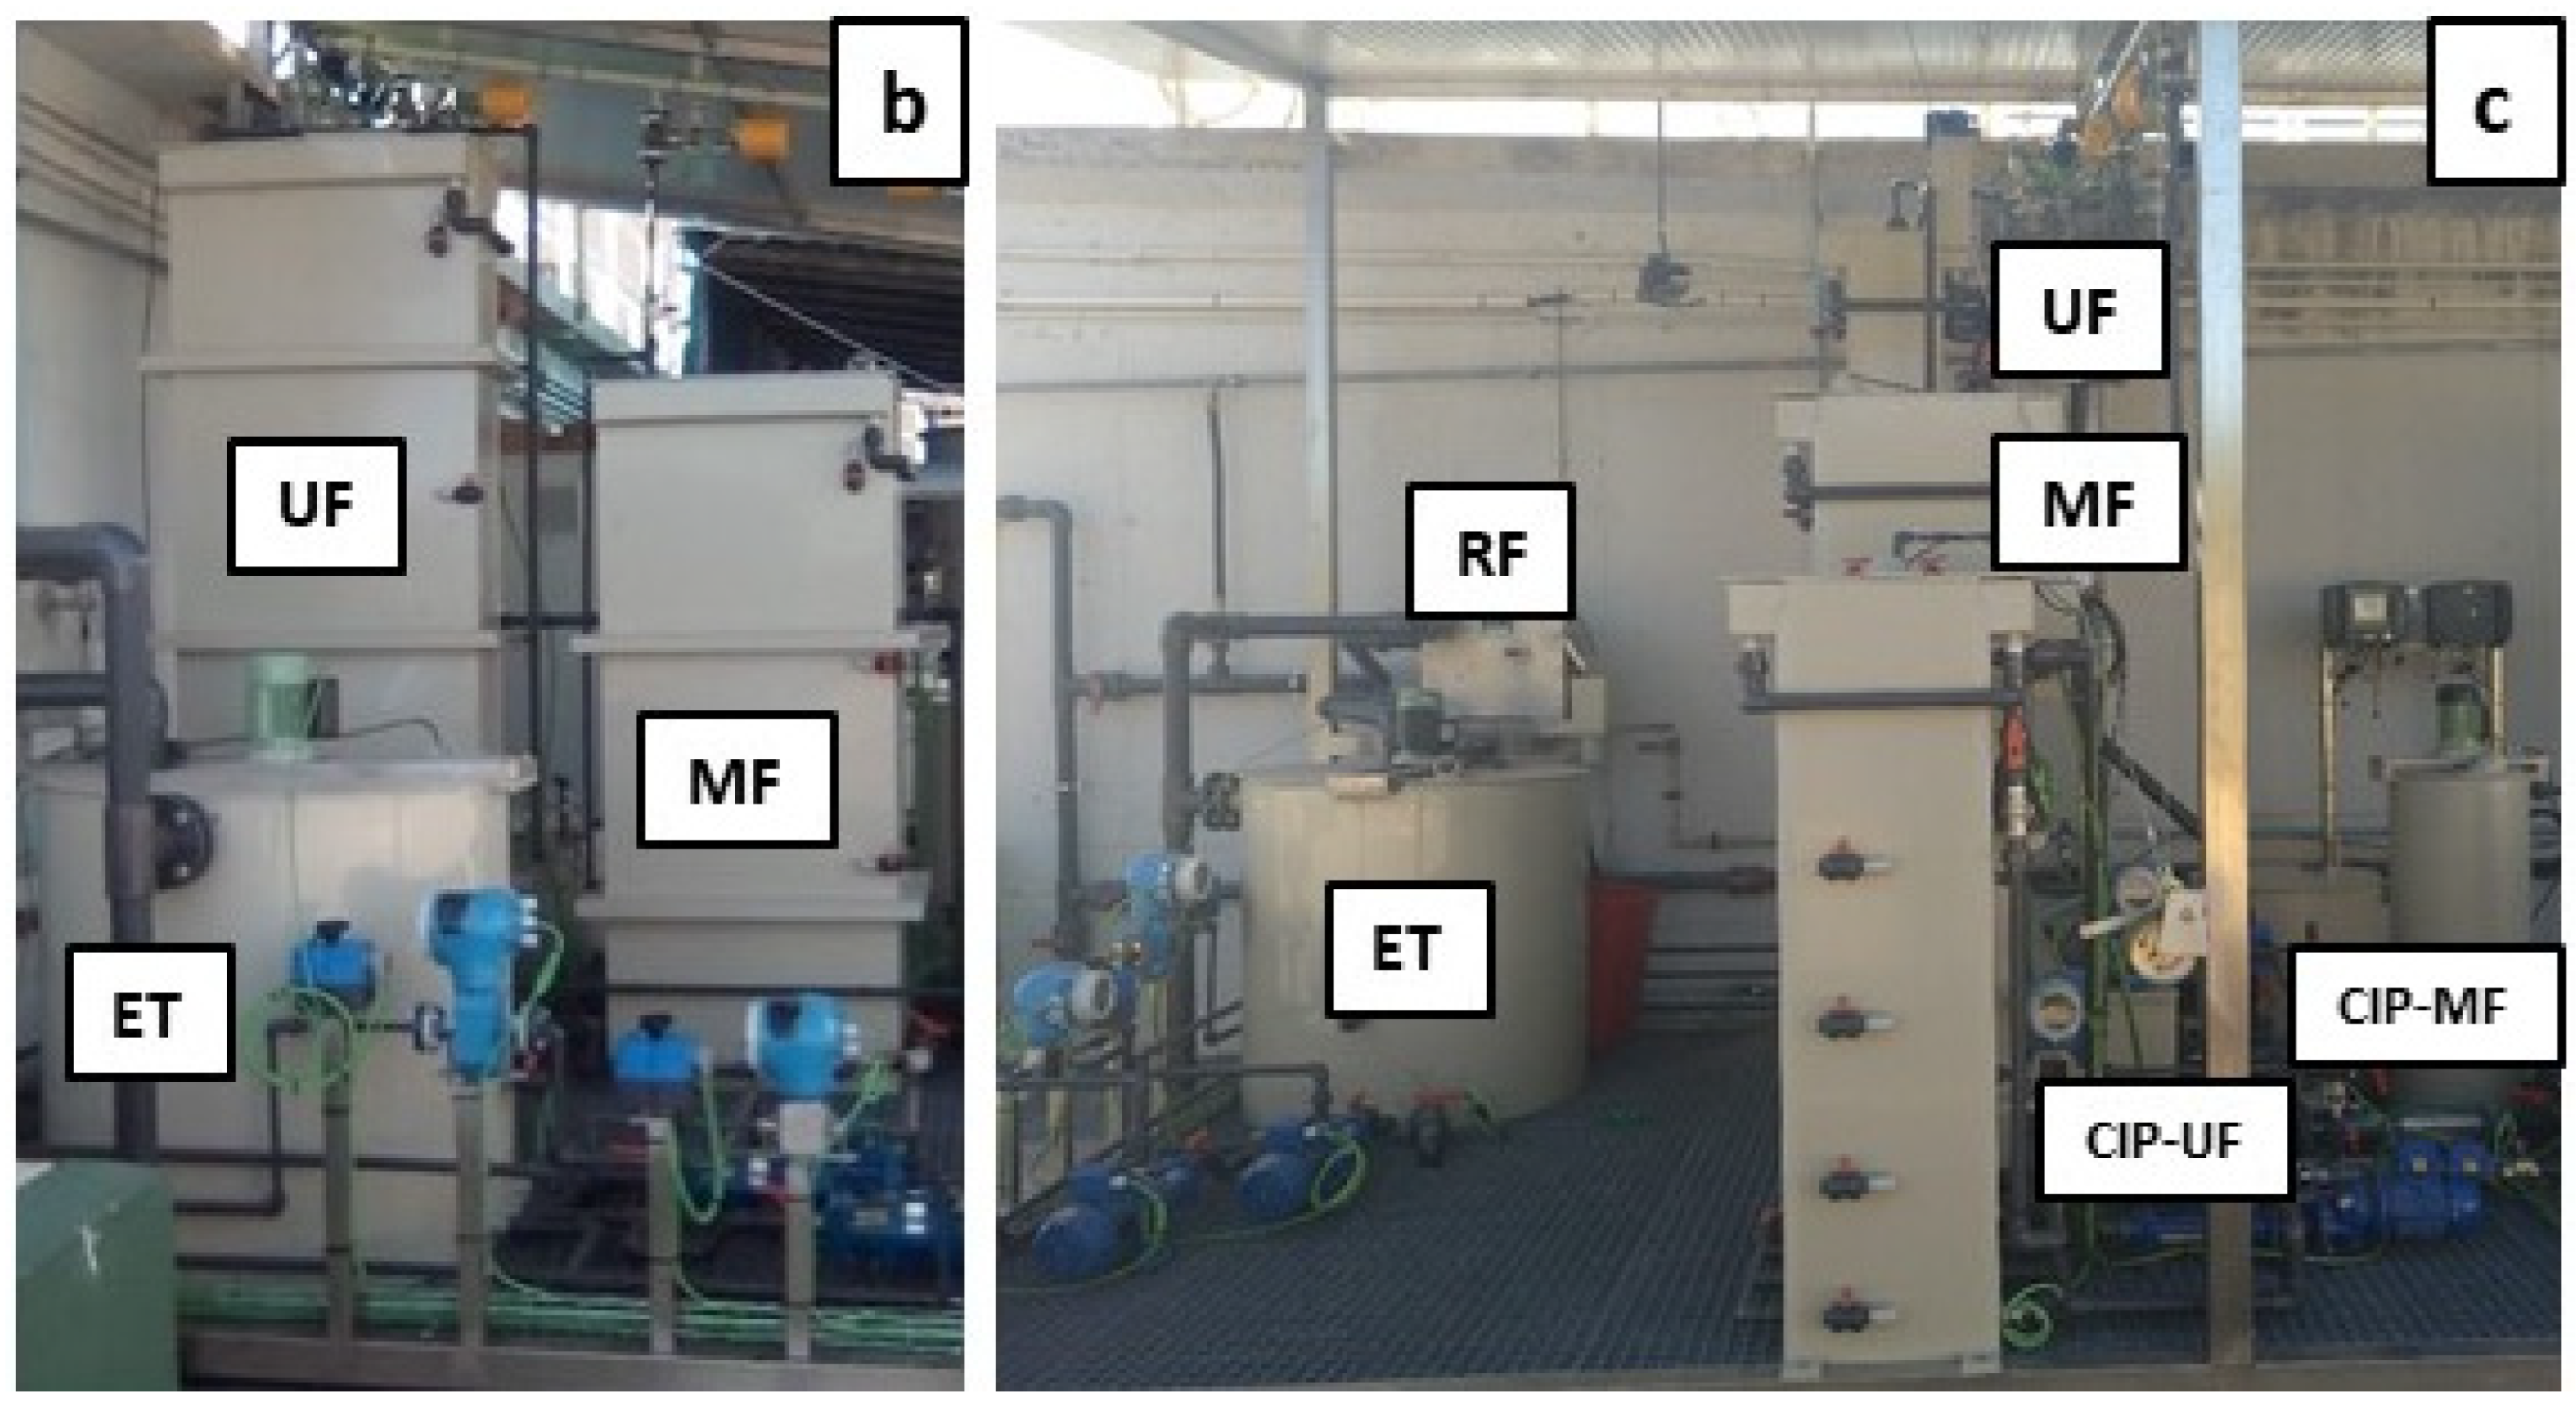
2.1. DMF Plant
2.2. Instrumentation, Automation and Control
2.3. Plant Operation and Experimental Plan
2.4. Analytical Methods and Calculations
3. Results and Discussion
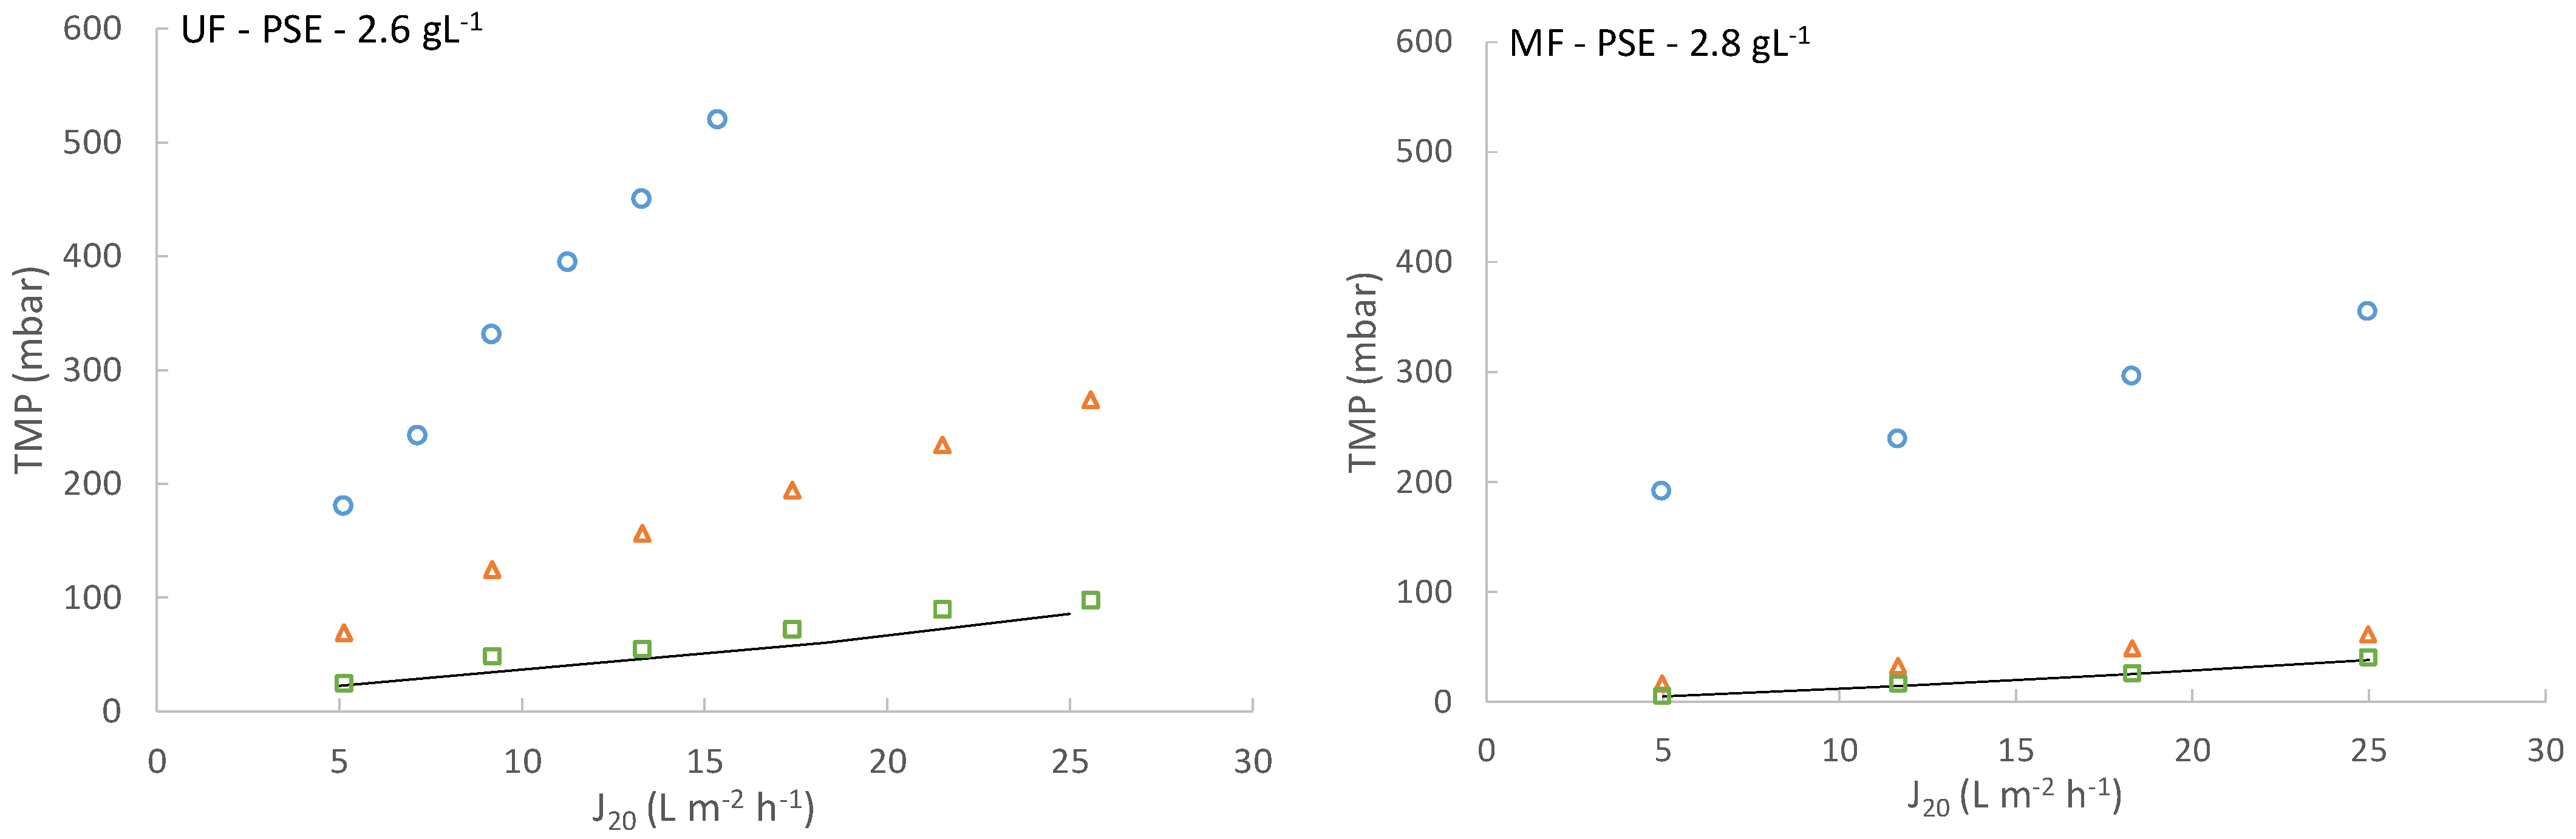
3.1. Effect of Membrane Pore Size
3.2. Effect of the Influent Used
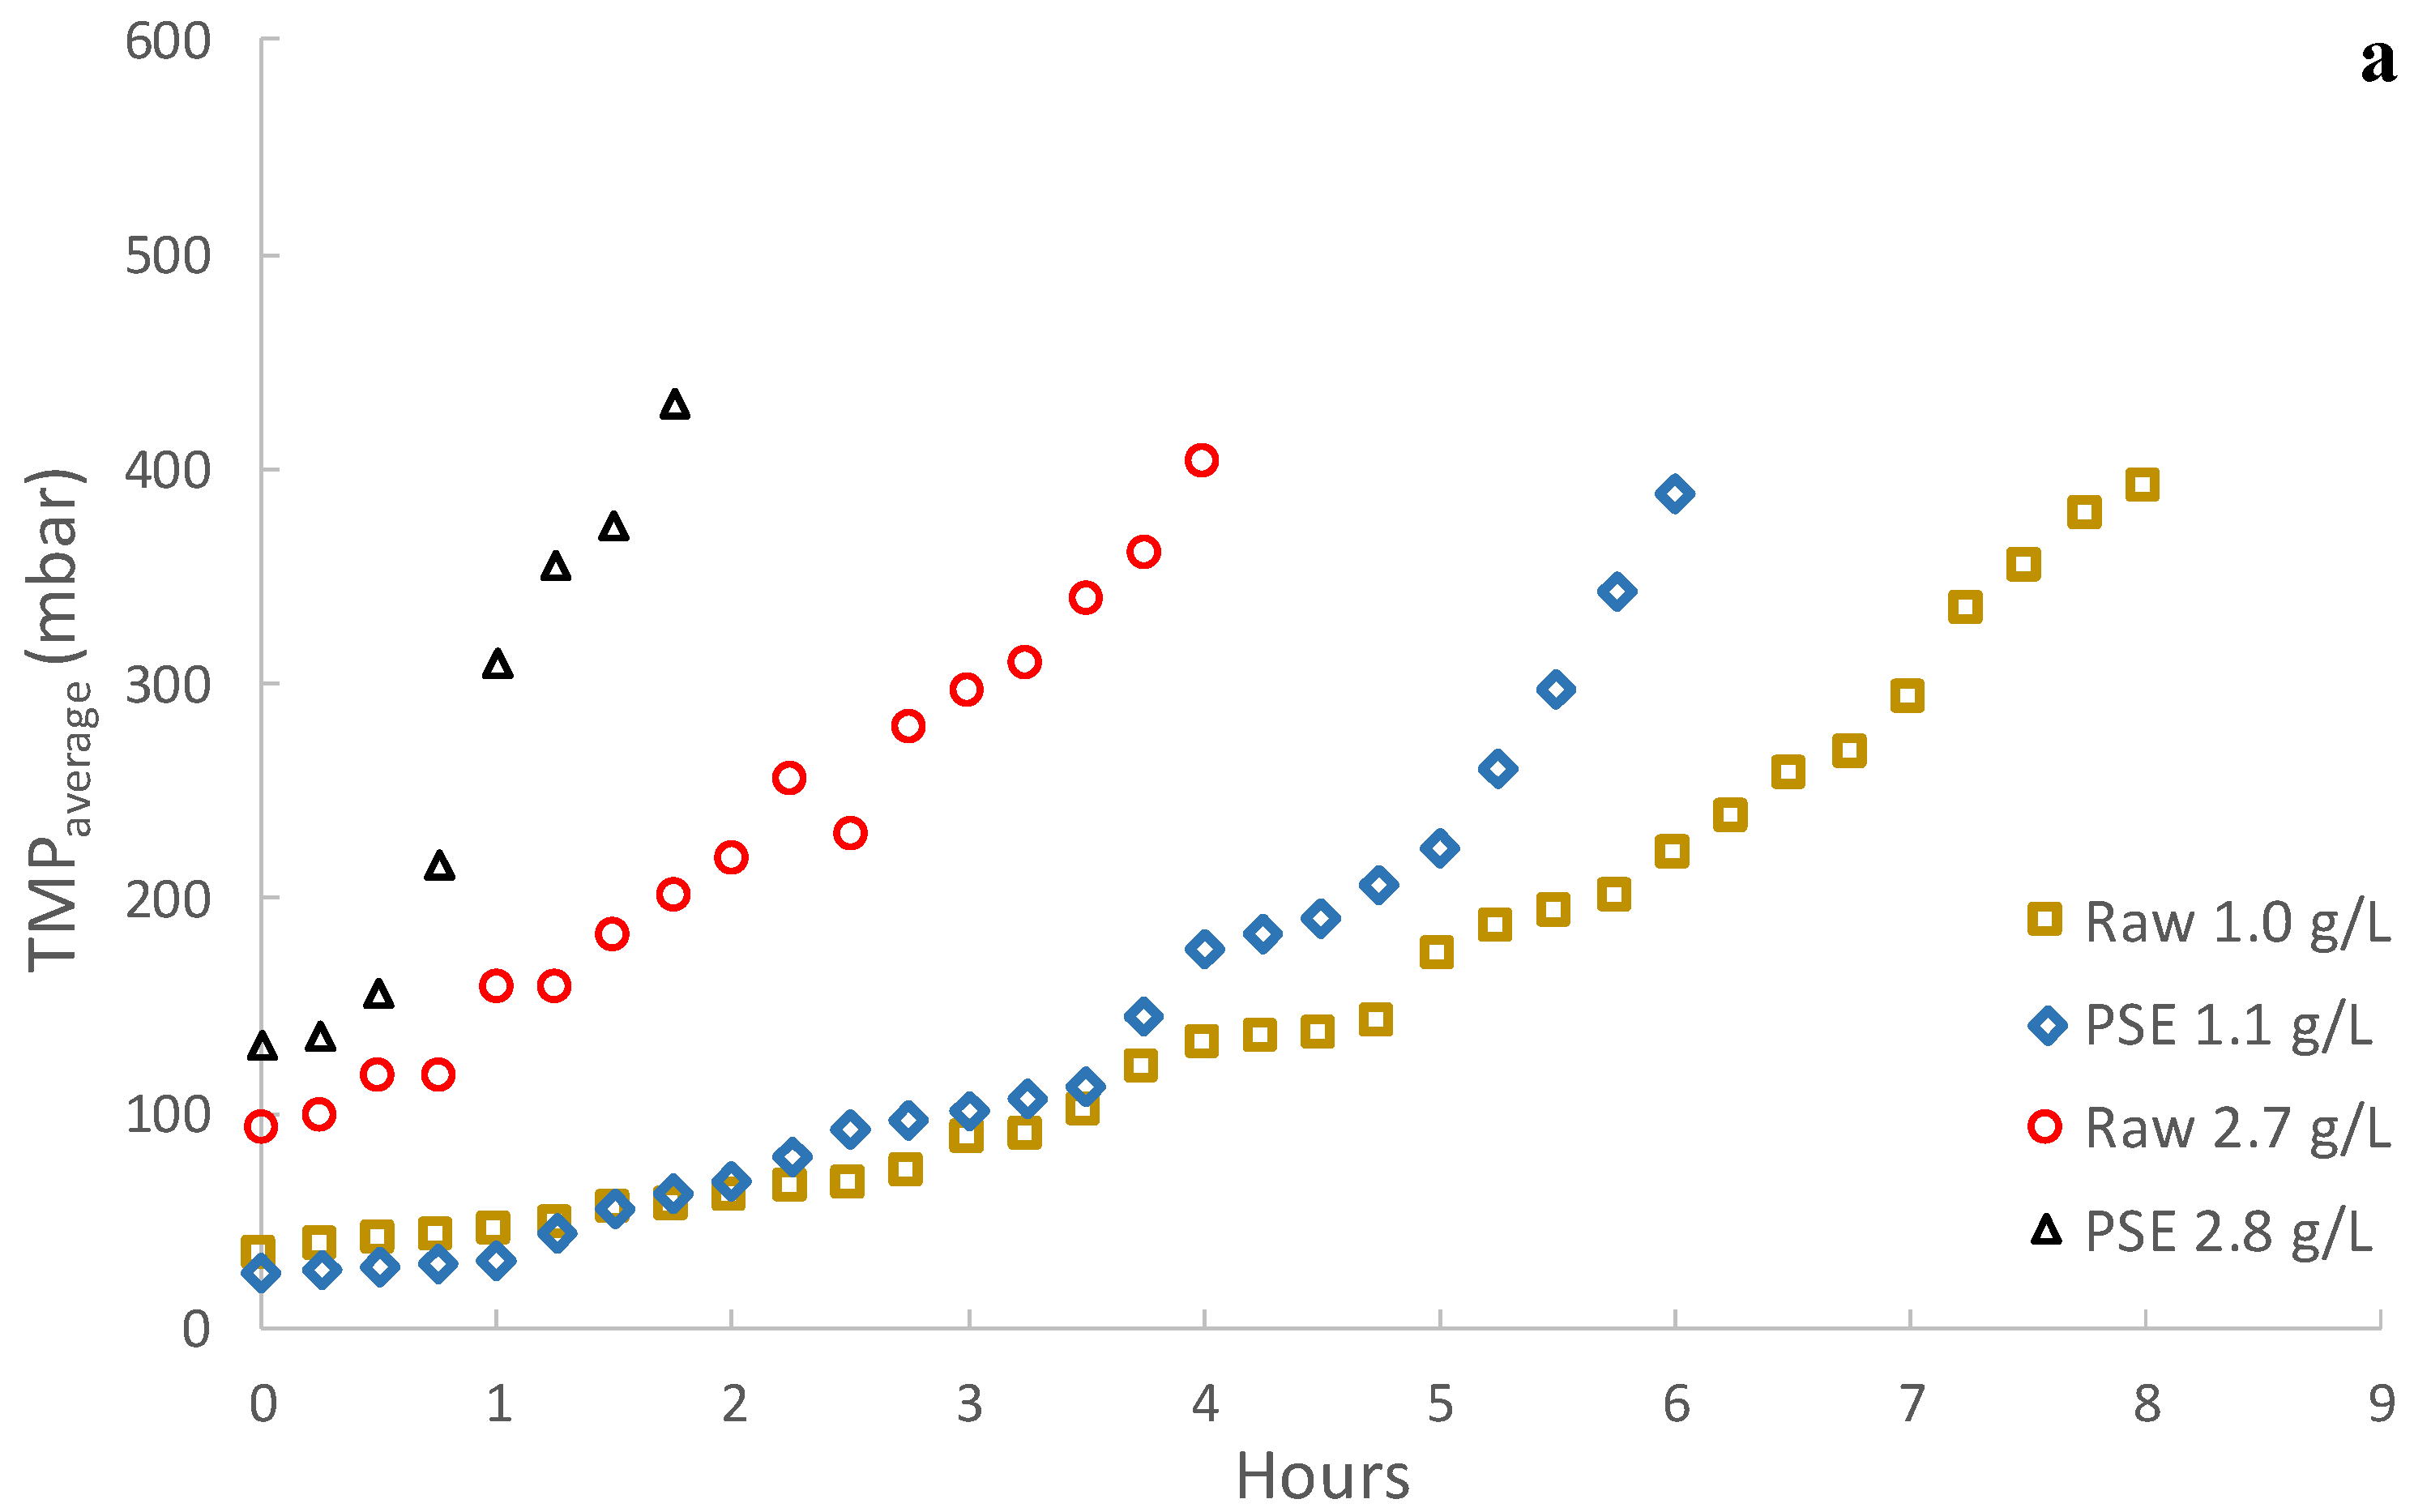
3.3. Effect of Solids Concentration
3.4. Fouling Control Strategies Effectiveness
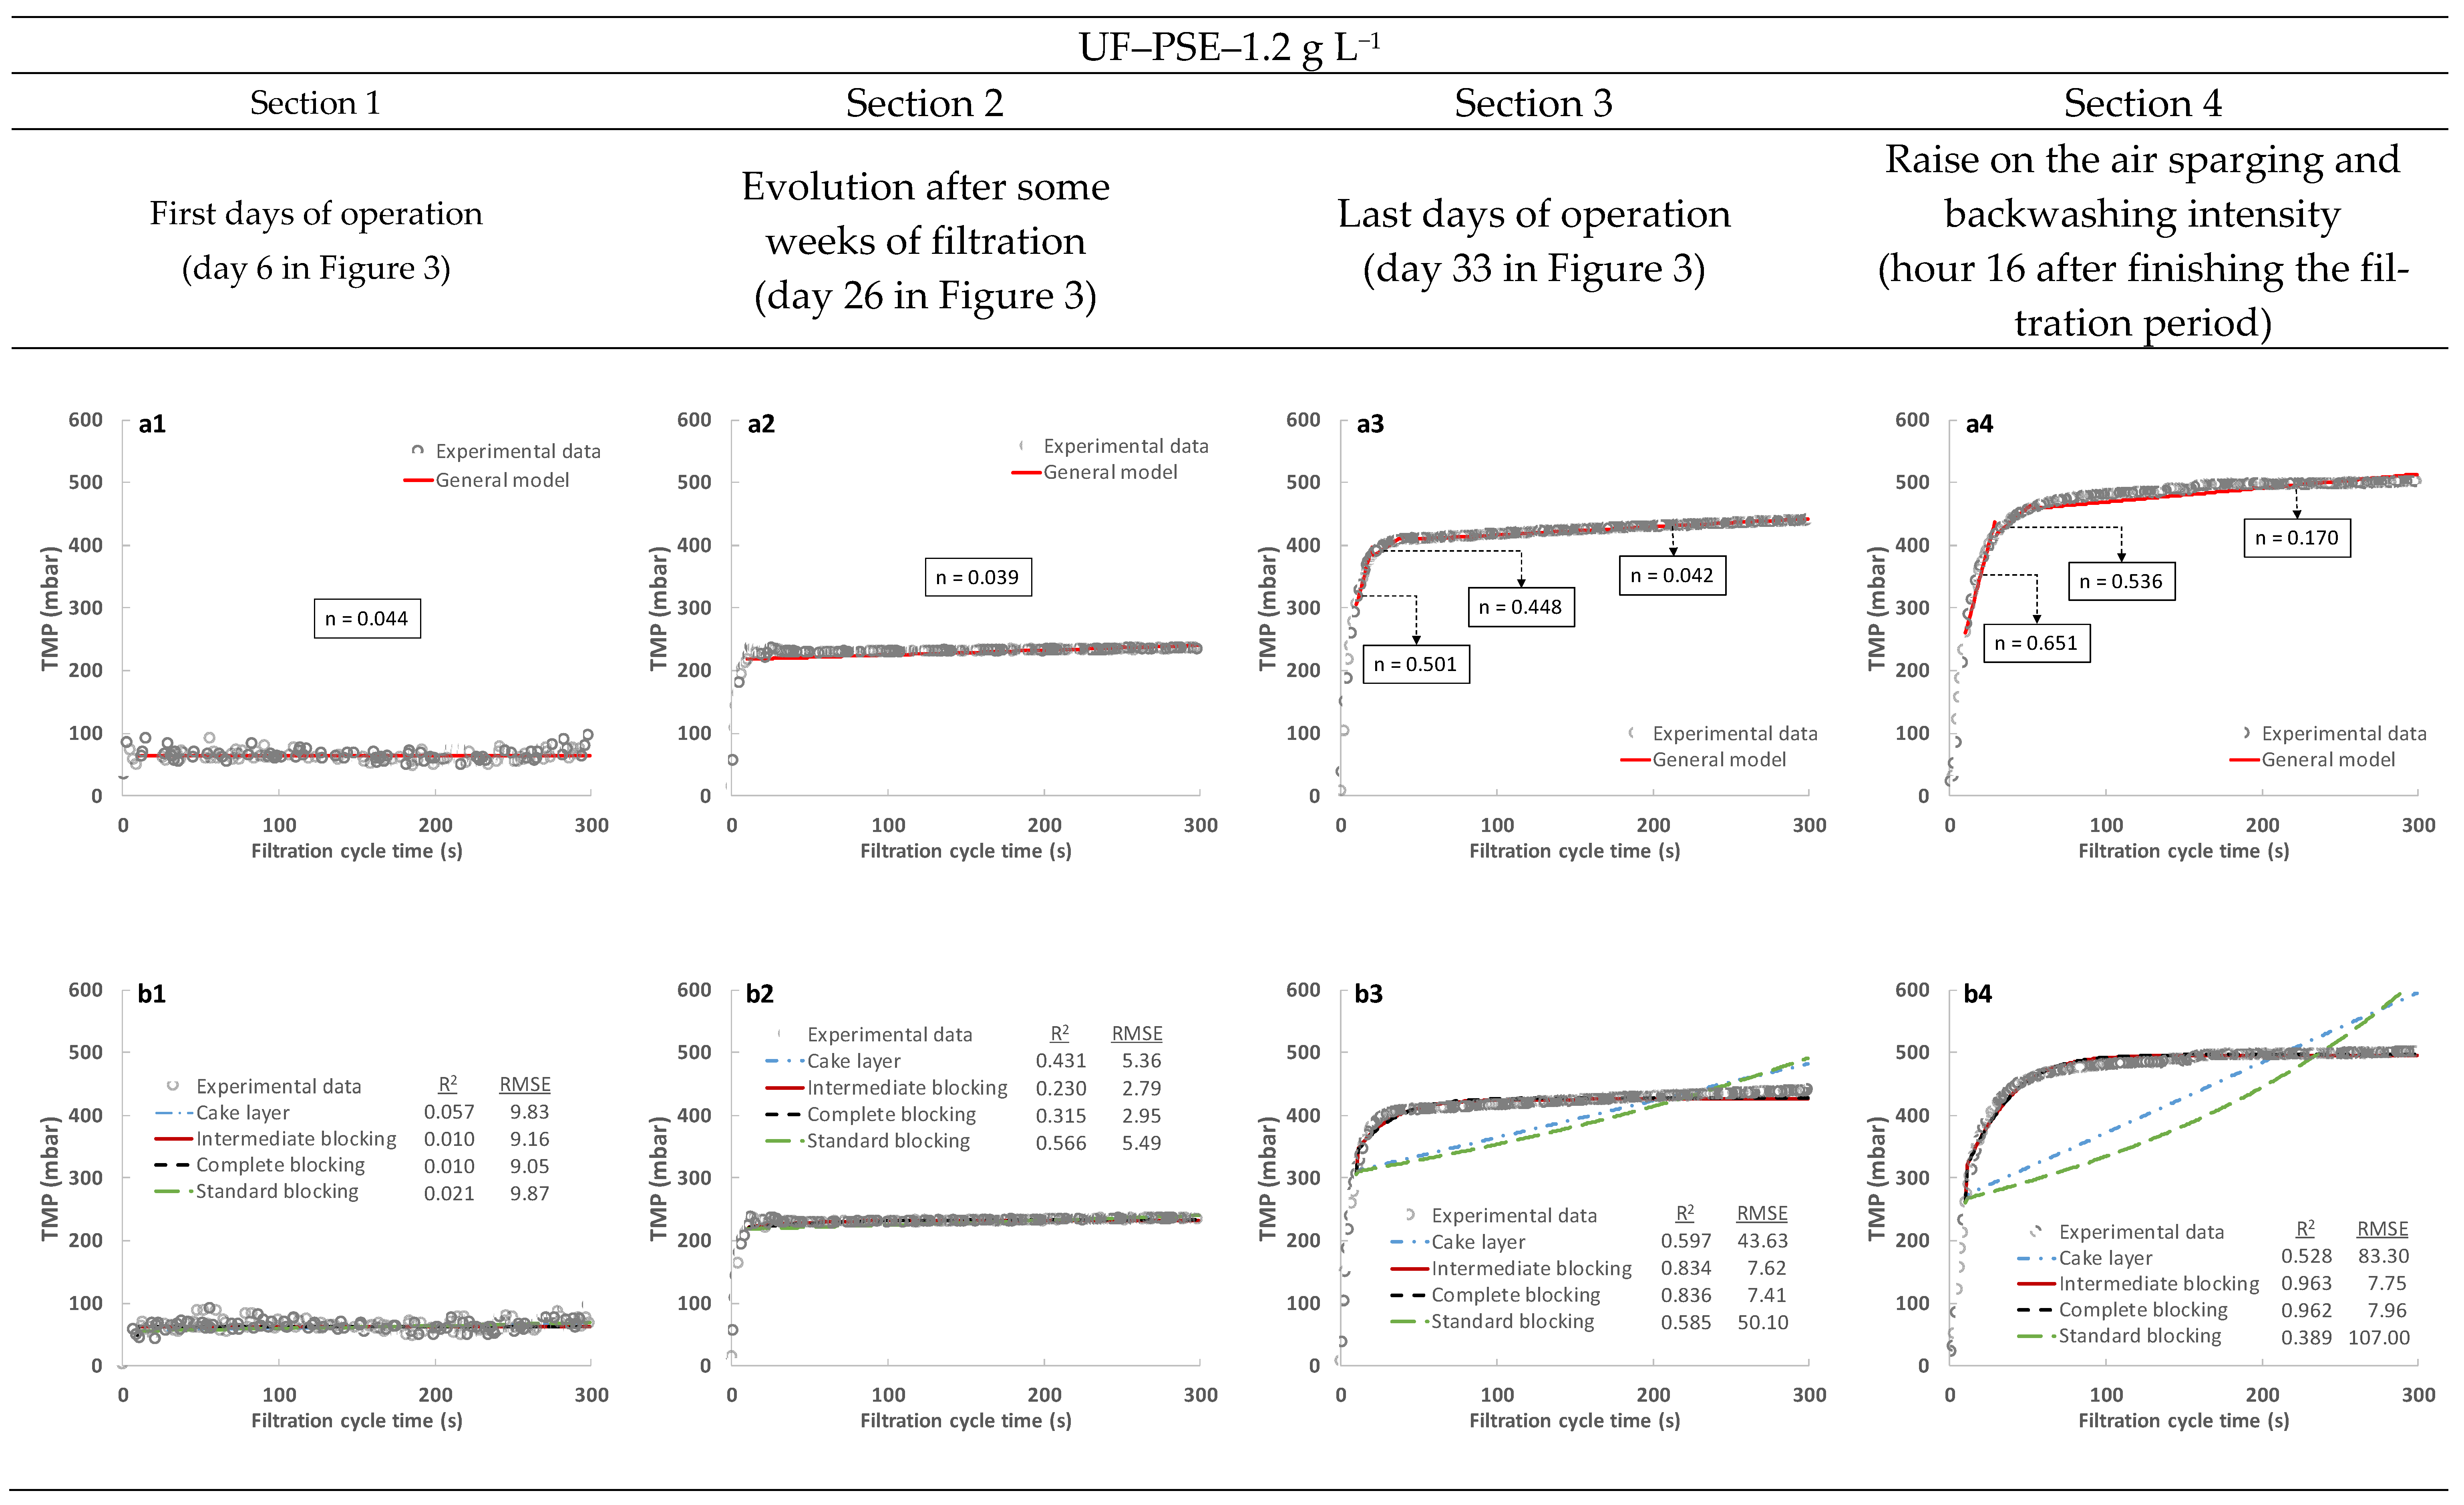
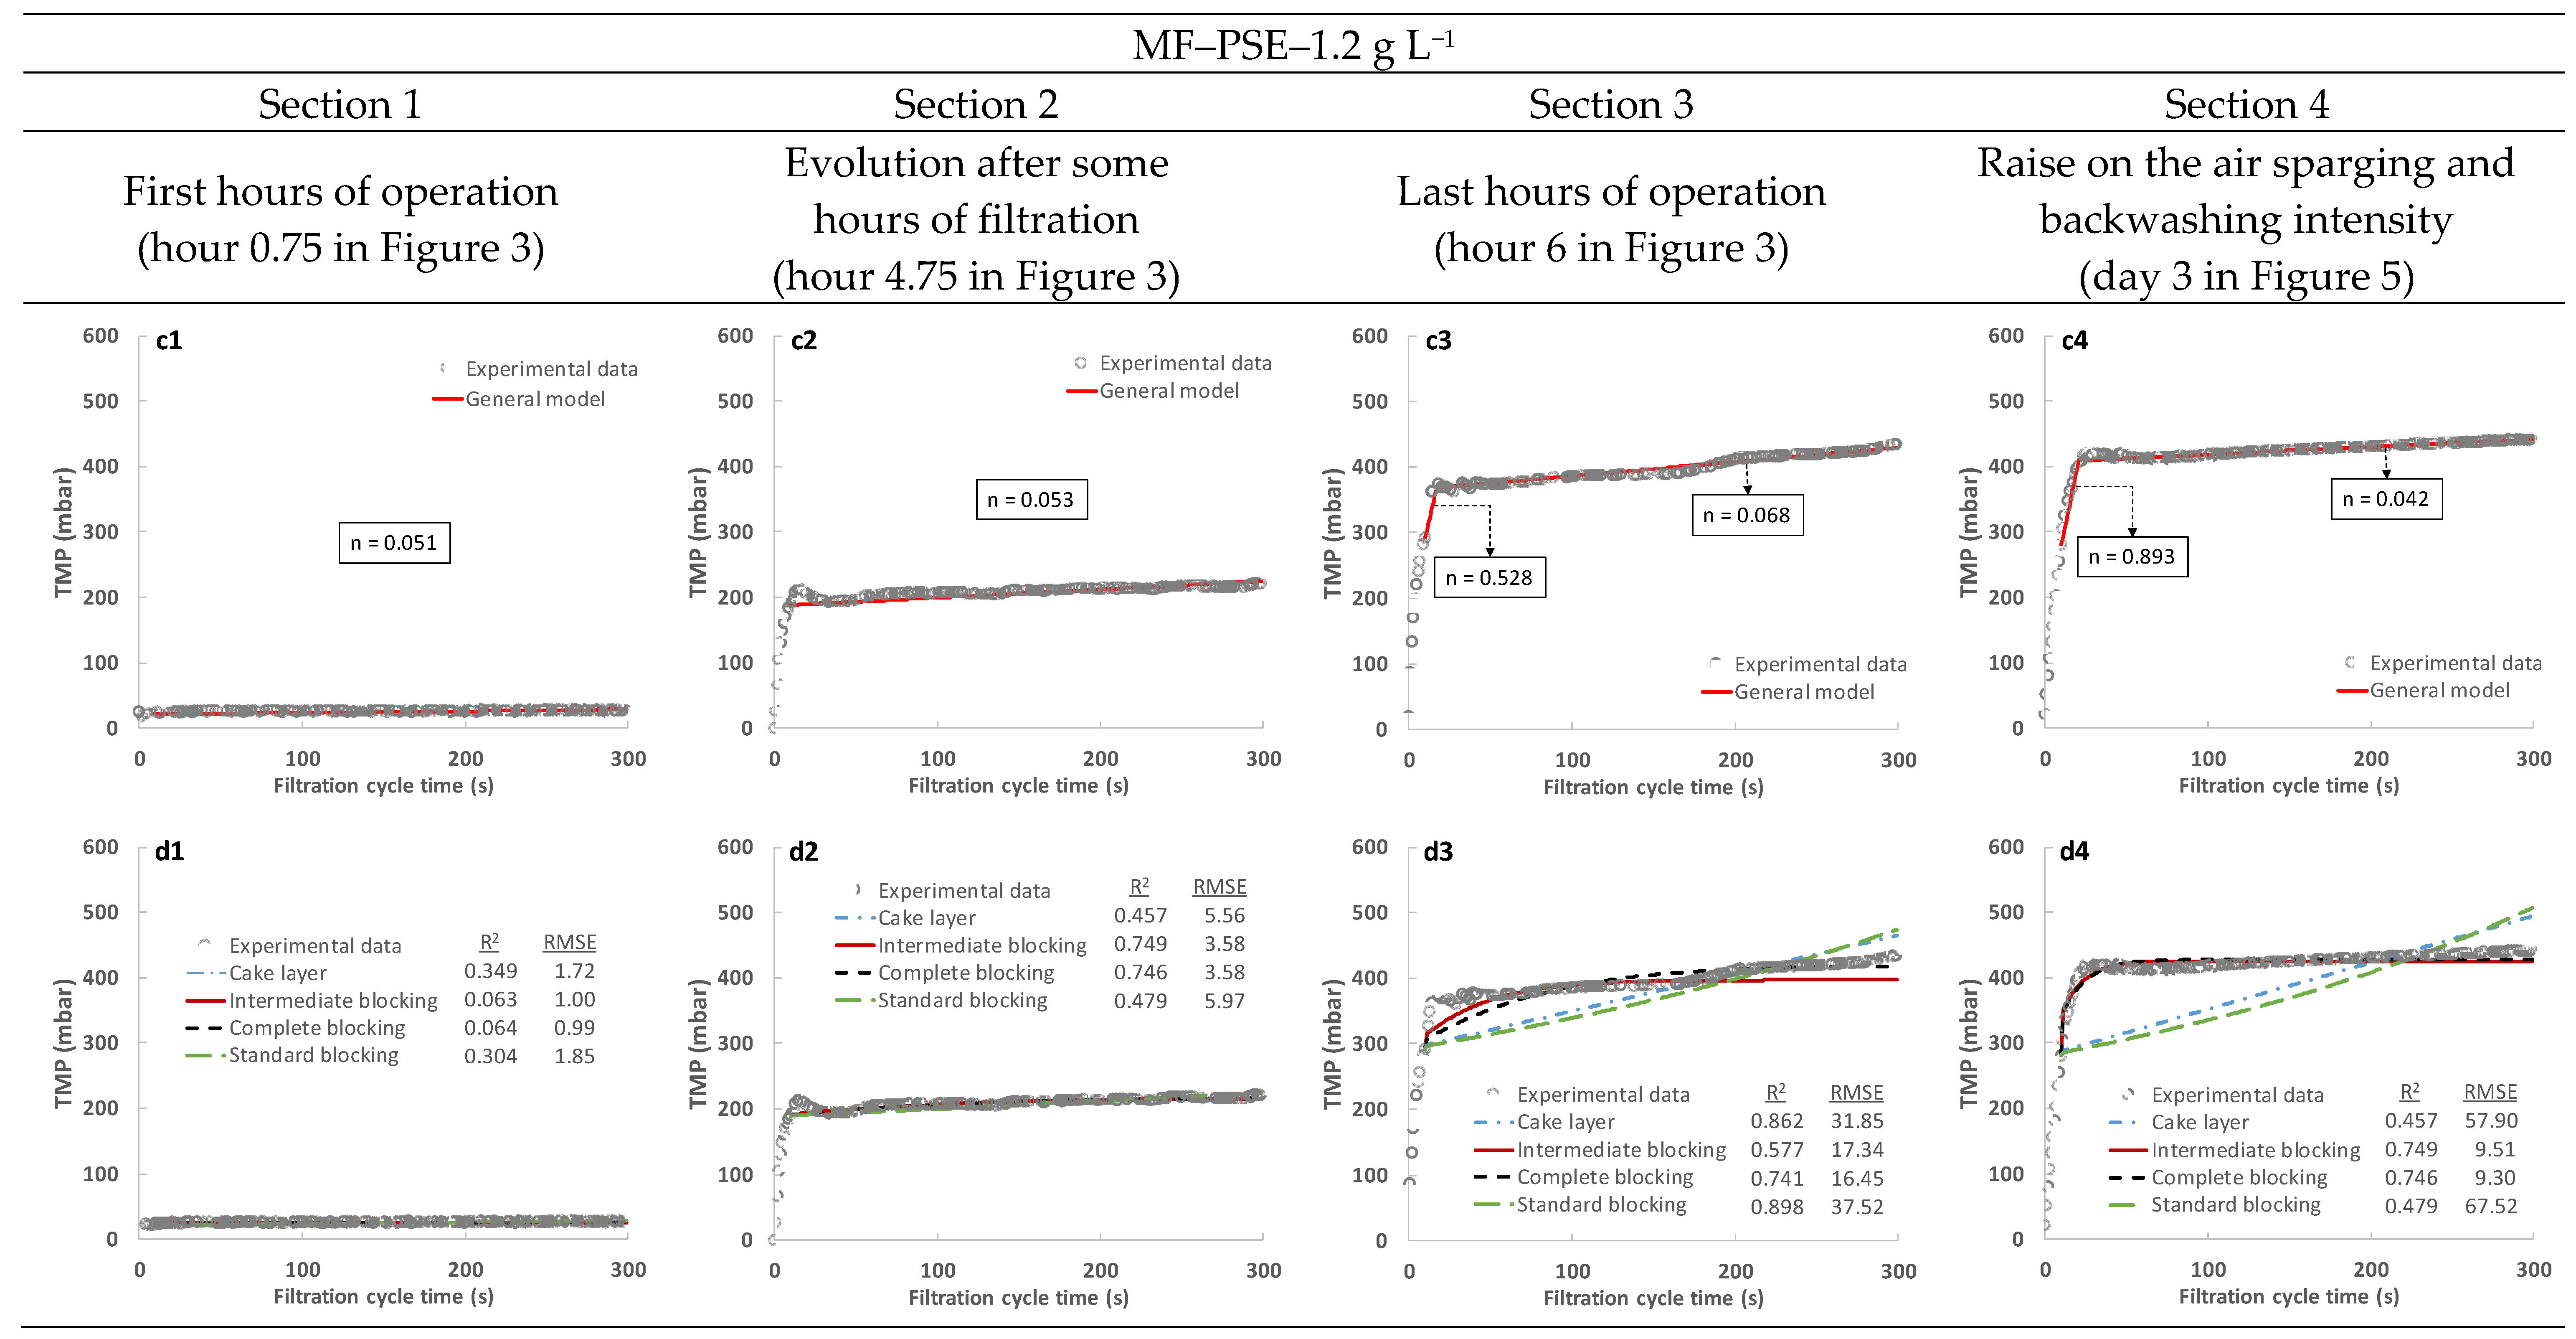
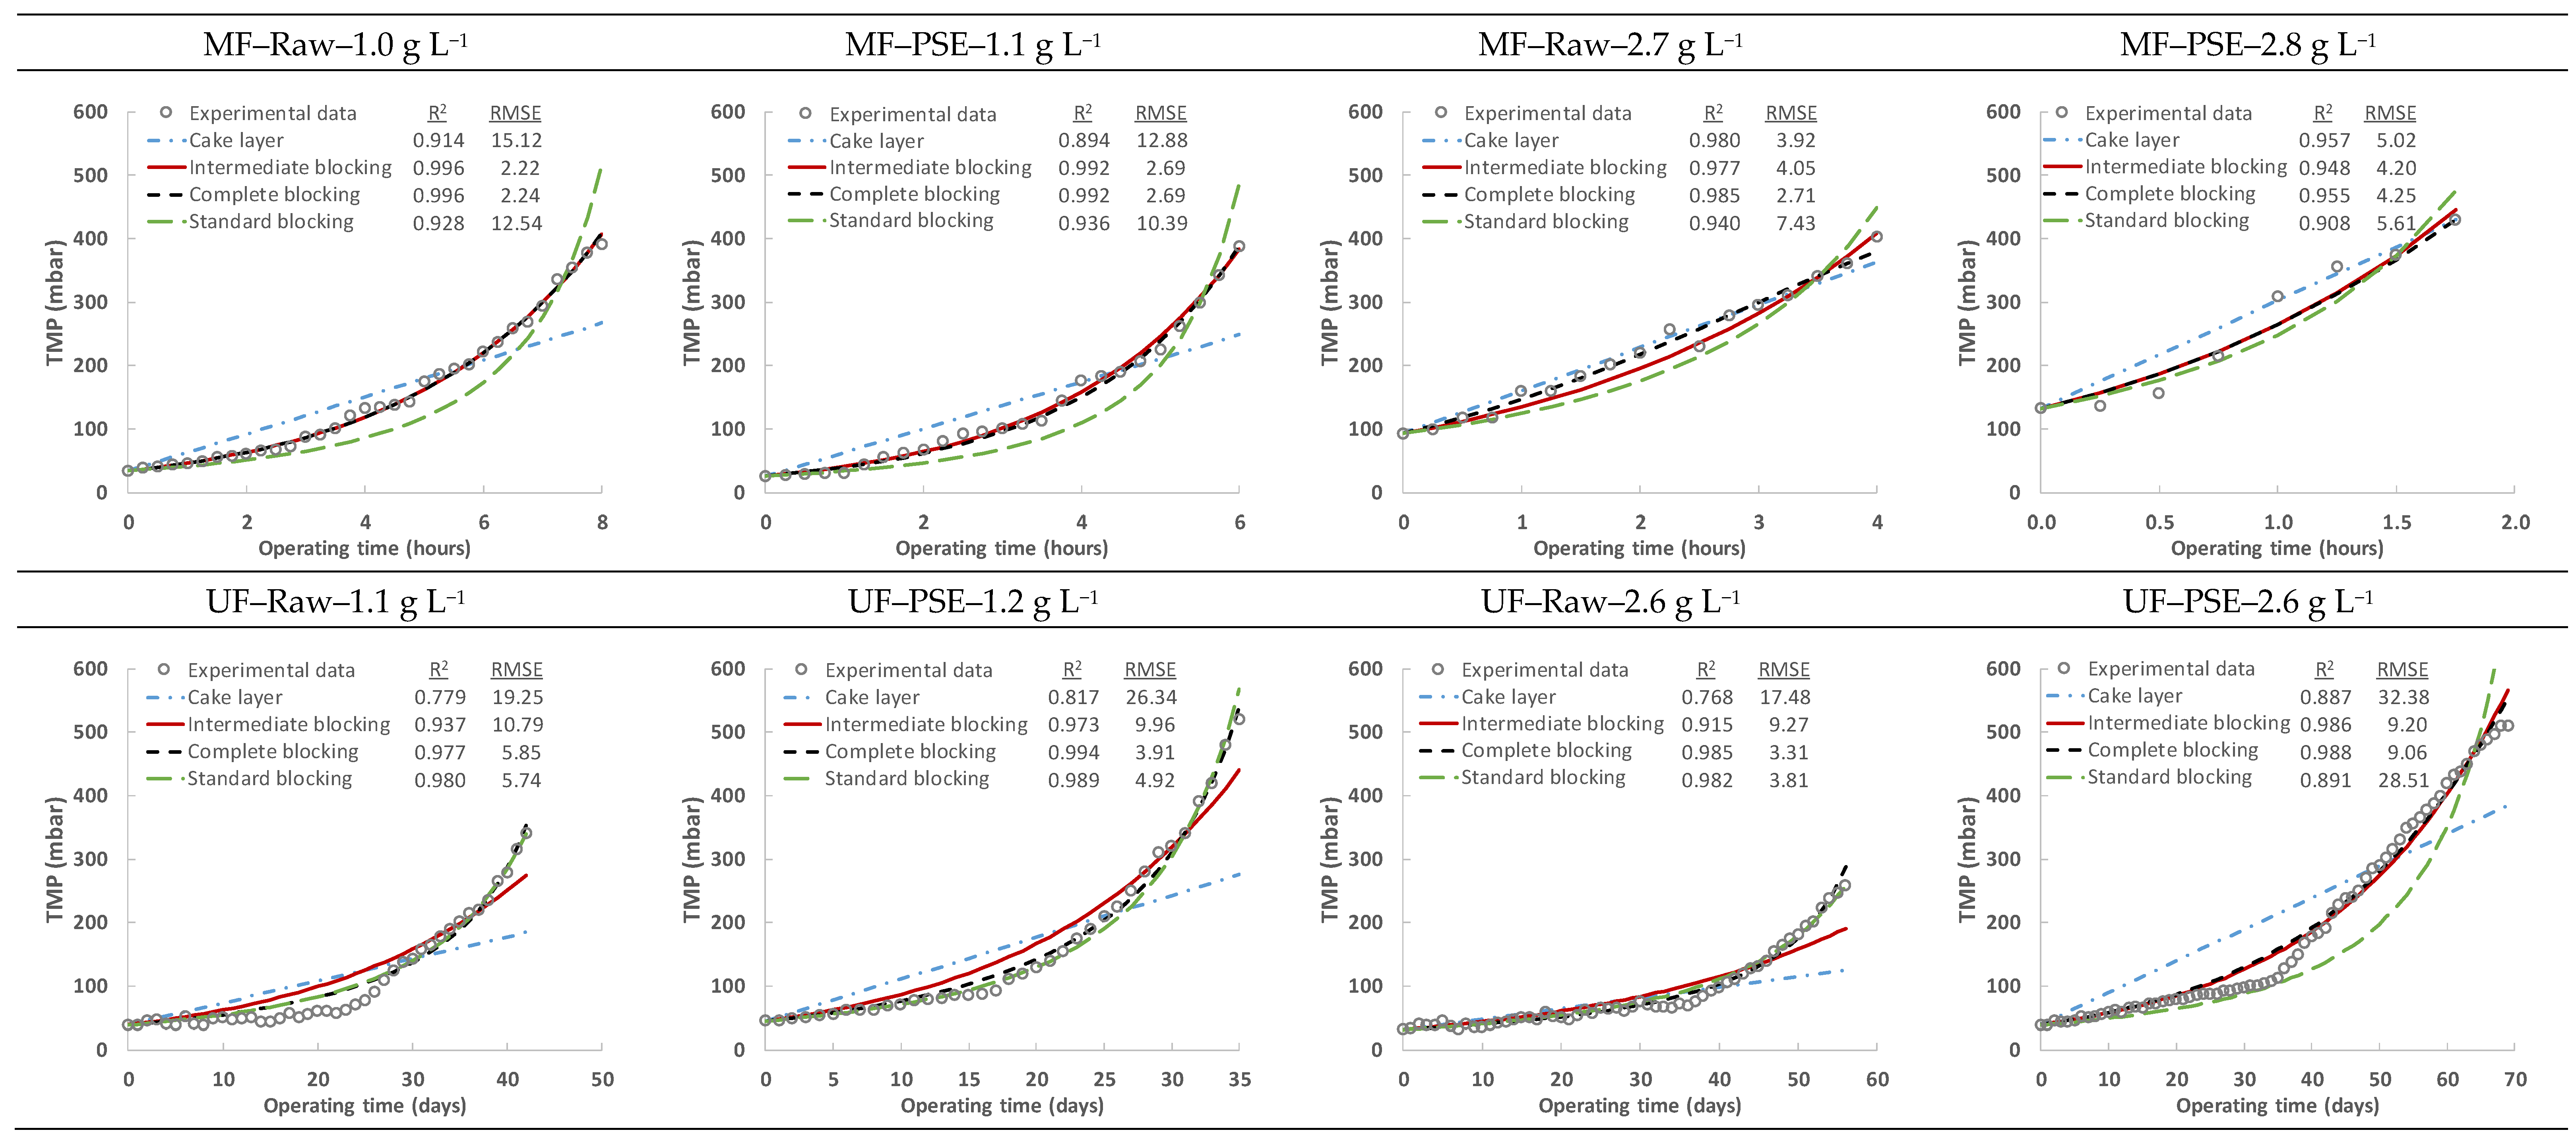
3.5. Fouling Study
4. Conclusions
- Dramatically different performance was obtained depending on the membrane used. Filtration periods of 2–8 h were achieved with the MF membrane, while they were notably increased with the UF module (from 34 to 69 days). This extreme difference was due to the severe fouling when operating the MF membrane, which was dramatically reduced by the UF membrane due to the significantly lower pore size of the latter compared to the former. The benefits observed when operating with a lower membrane pore size were associated with a reduction in pore blocking propensity.
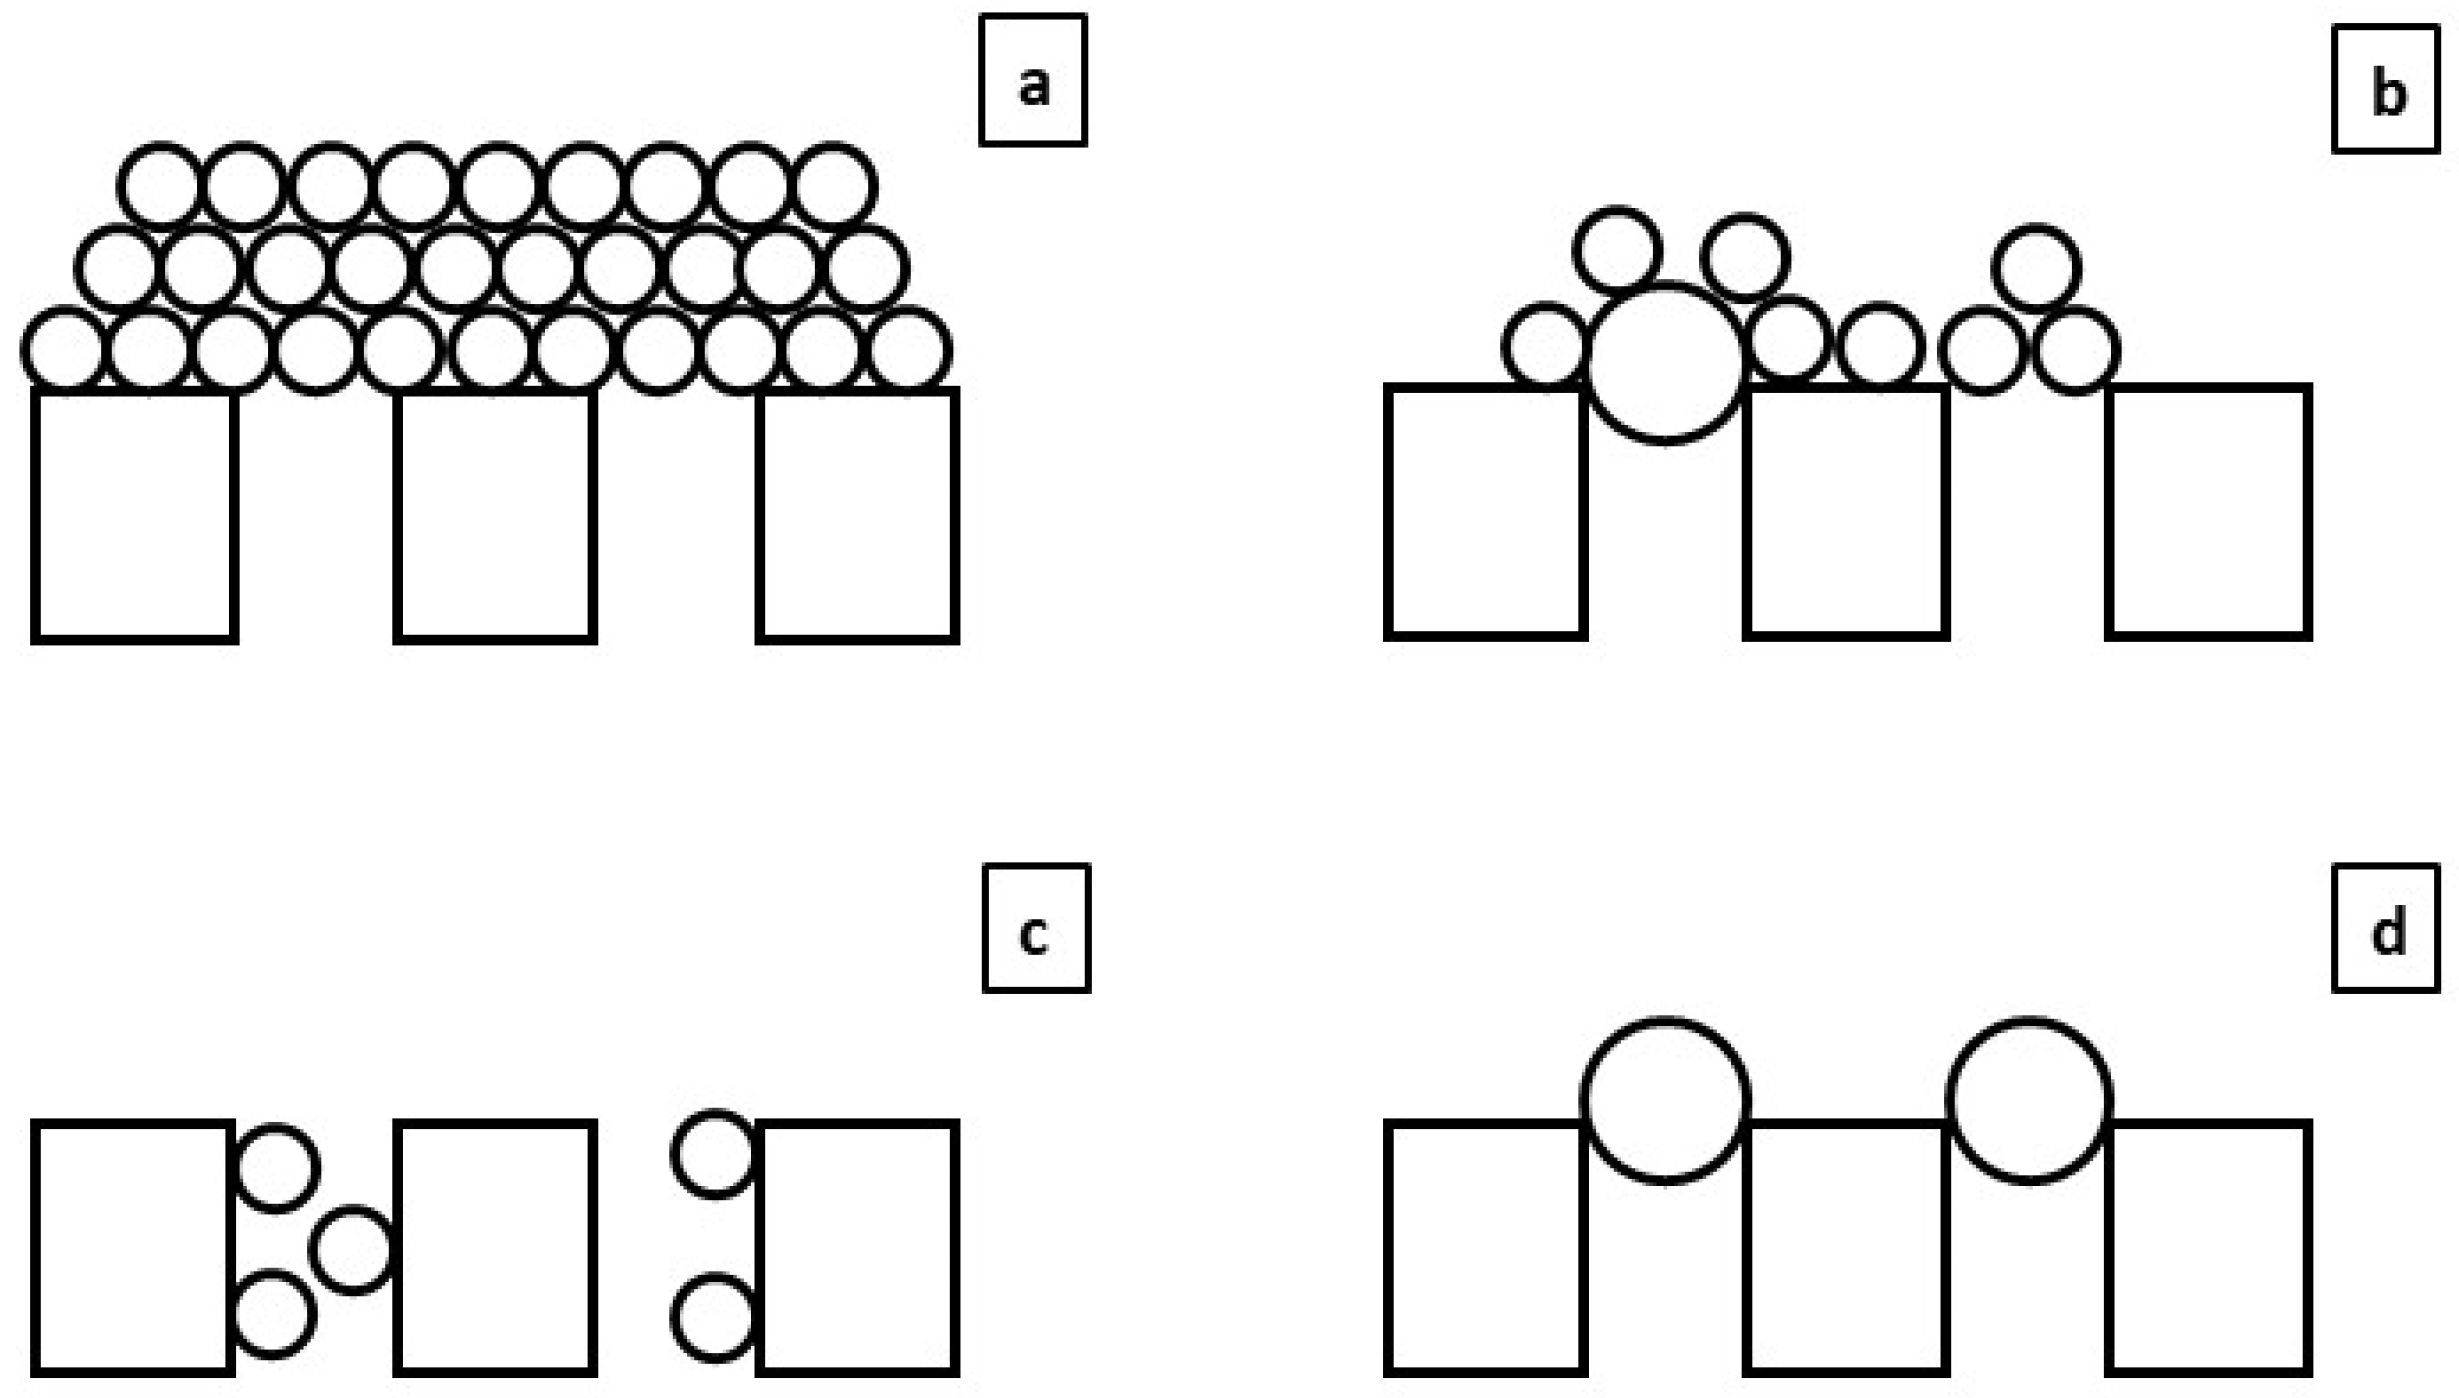
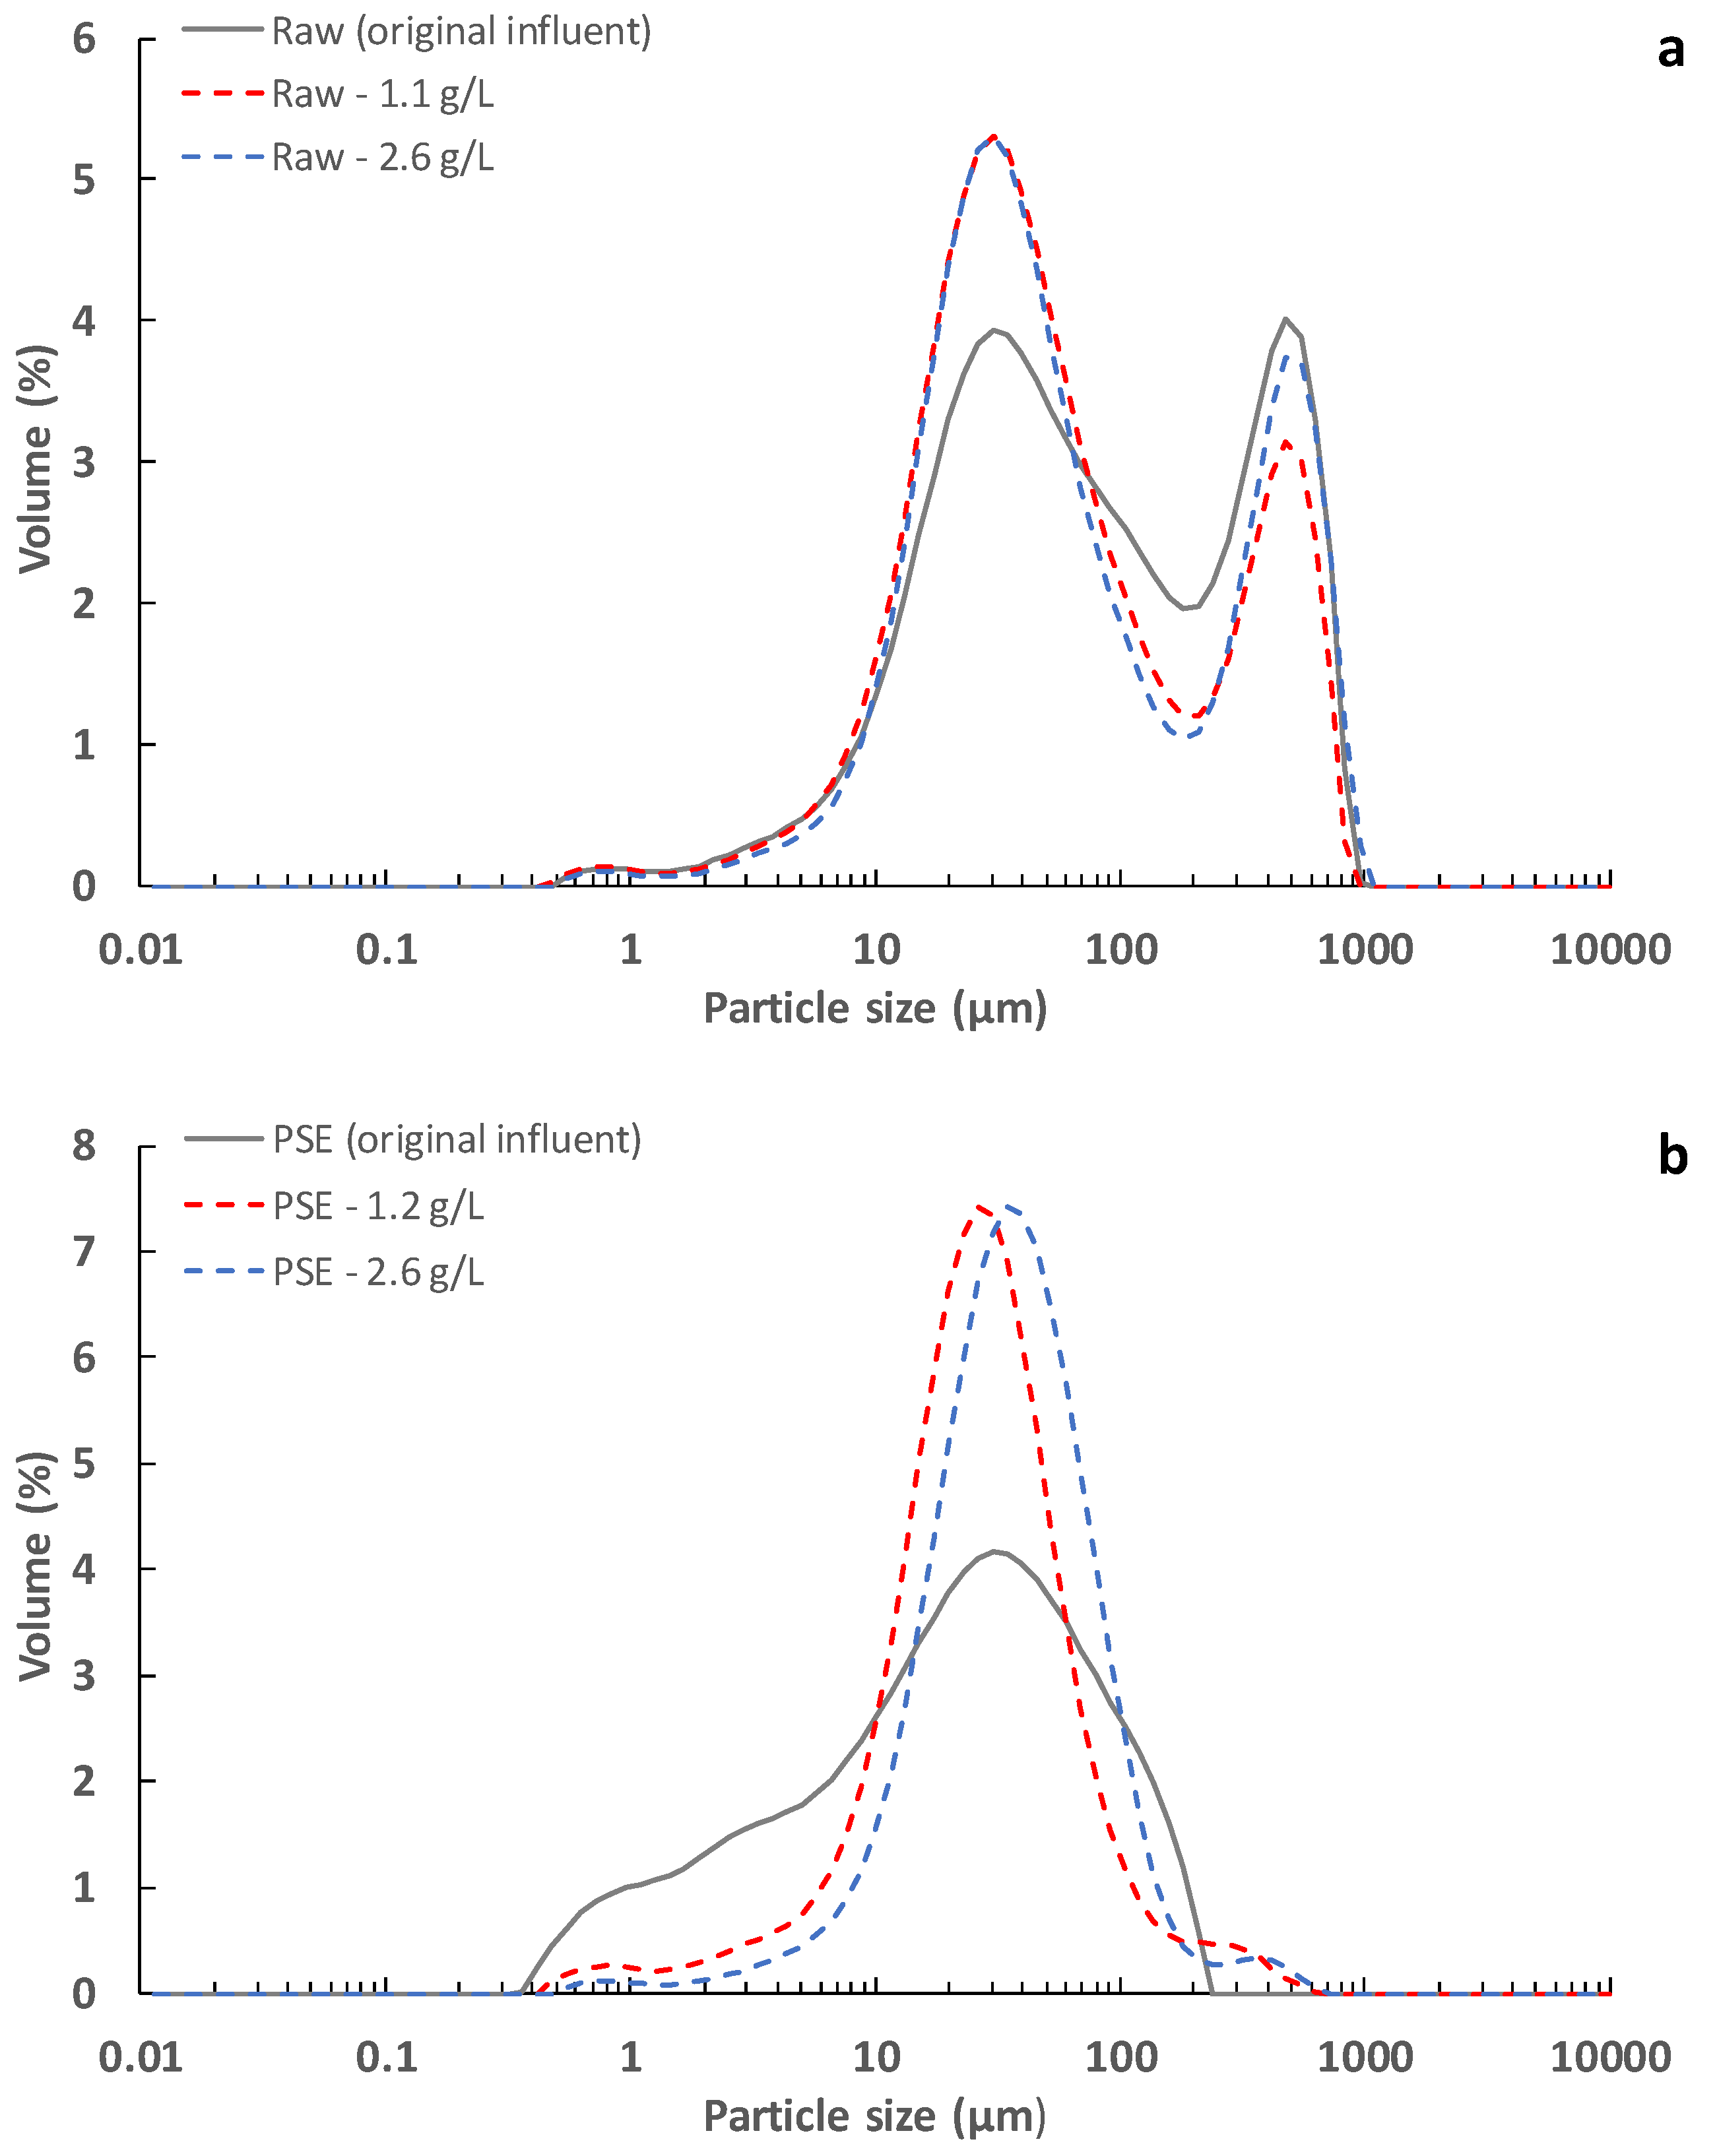
- Both use of raw MWW and increased TSS concentration in the membrane module significantly benefitted the filtration performance with the UF module. This benefit could be associated with the increase in the average particle size, reducing the sludge propensity to block the membrane pores and/or due to formation of a more porous cake layer that acted as a fouling protector.
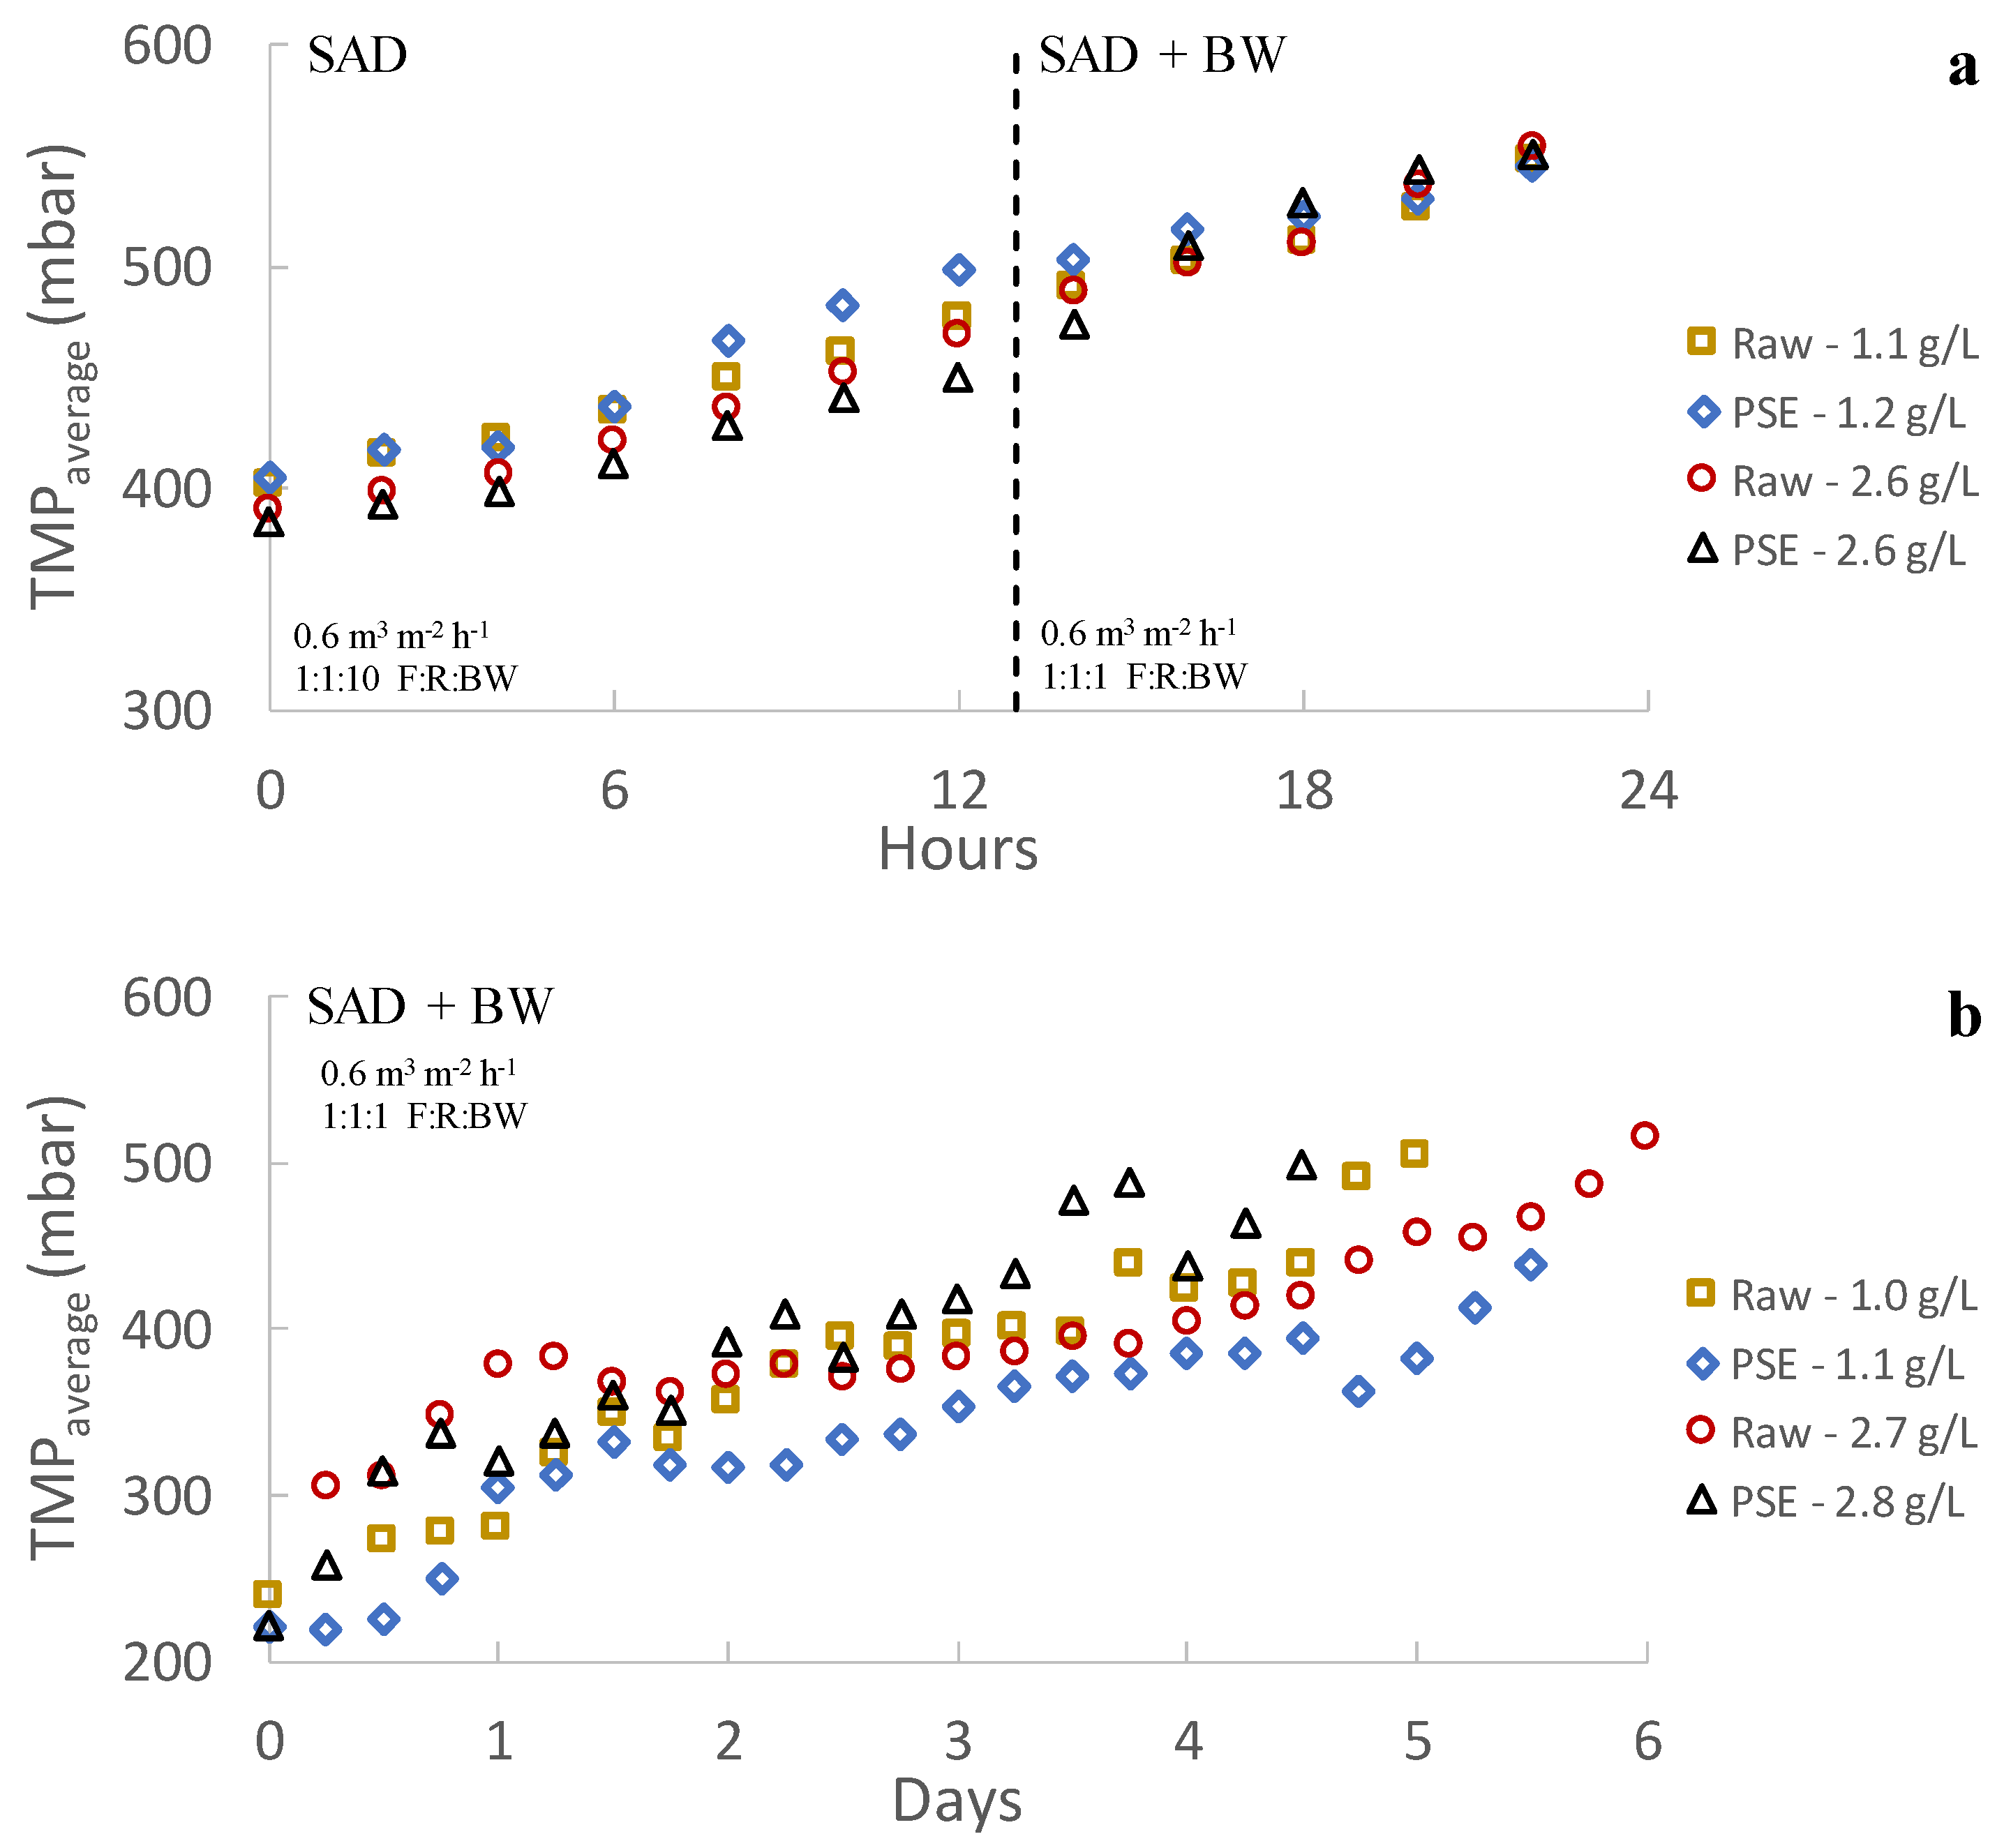
- The physical fouling control strategies used (air sparging and backwashing) proved to be ineffective in controlling fouling of the UF membrane, although they did have a significant impact on MF membrane fouling, extending the operating time from some hours (2–8 h) to some days (5–6 days).
- The fouling evaluation showed that cake layer formation seemed to be the predominant fouling mechanism during each filtration cycle, representing a reversible fouling increase during filtration. However, as continuous filtration advanced, irreversible fouling appeared. This irreversible fouling could be related to intermediate/complete pore blocking in the case of the MF membrane, while it could also be produced by standard pore blocking in the case of the UF membrane. Organic matter represented more than 70% of this irreversible fouling in all the conditions evaluated.
Supplementary Materials
Author Contributions
Funding
Institutional Review Board Statement
Informed Consent Statement
Data Availability Statement
Acknowledgments
Conflicts of Interest
References
- World Economic Forum. Global Risks Report 2019; World Economic Forum: Cologny, Switzerland, 2019; ISBN 9781944835156. [Google Scholar]
- World Economic Forum. Global Risks Report 2022; World Economic Forum: Cologny, Switzerland, 2022; ISBN 9782940631094. [Google Scholar]
- Ferronato, N.; Rada, E.C.; Portillo, M.A.G.; Cioca, L.I.; Ragazzi, M.; Torretta, V. Introduction of the Circular Economy within Developing Regions: A Comparative Analysis of Advantages and Opportunities for Waste Valorization. J. Environ. Manag. 2019, 230, 366–378. [Google Scholar] [CrossRef] [PubMed]
- Donoso-Bravo, A.; Olivares, D.; Lesty, Y.; Bossche, H. Vanden Exploitation of the ADM1 in a XXI Century Wastewater Resource Recovery Facility (WRRF): The Case of Codigestion and Thermal Hydrolysis. Water Res. 2020, 175, 115654. [Google Scholar] [CrossRef] [PubMed]
- González-Camejo, J.; Jiménez-Benítez, A.; Ruano, M.V.; Robles, A.; Barat, R.; Ferrer, J. Optimising an Outdoor Membrane Photobioreactor for Tertiary Sewage Treatment. J. Environ. Manag. 2019, 245, 76–85. [Google Scholar] [CrossRef] [PubMed] [Green Version]
- Robles, Á.; Capson-Tojo, G.; Gales, A.; Viruela, A.; Sialve, B.; Seco, A.; Steyer, J.P.; Ferrer, J. Performance of a Membrane-Coupled High-Rate Algal Pond for Urban Wastewater Treatment at Demonstration Scale. Bioresour. Technol. 2020, 301, 122672. [Google Scholar] [CrossRef]
- Jiménez-Benítez, A.; Ferrer, J.; Rogalla, F.; Vázquez, J.R.; Seco, A.; Robles, Á. Energy and Environmental Impact of an Anaerobic Membrane Bioreactor (AnMBR) Demonstration Plant Treating Urban Wastewater. Curr. Dev. Biotechnol. Bioeng. 2020, 289–310. [Google Scholar] [CrossRef]
- Robles, Á.; Serralta, J.; Martí, N.; Ferrer, J.; Seco, A. Anaerobic Membrane Bioreactors for Resource Recovery from Municipal Wastewater: A Comprehensive Review of Recent Advances. Environ. Sci. Water Res. Technol. 2021, 7, 1944–1965. [Google Scholar] [CrossRef]
- Giwa, A.; Dindi, A.; Kujawa, J. Membrane Bioreactors and Electrochemical Processes for Treatment of Wastewaters Containing Heavy Metal Ions, Organics, Micropollutants and Dyes: Recent Developments. J. Hazard. Mater. 2019, 370, 172–195. [Google Scholar] [CrossRef]
- Yang, Y.L.; Wu, Y.; Lu, Y.X.; Cai, Y.; He, Z.; Yang, X.L.; Song, H.L. A Comprehensive Review of Nutrient-Energy-Water-Solute Recovery by Hybrid Osmotic Membrane Bioreactors. Bioresour. Technol. 2021, 320, 124300. [Google Scholar] [CrossRef]
- Ye, Y.; Ngo, H.H.; Guo, W.; Chang, S.W.; Nguyen, D.D.; Zhang, X.; Zhang, J.; Liang, S. Nutrient Recovery from Wastewater: From Technology to Economy. Bioresour. Technol. Rep. 2020, 11, 100425. [Google Scholar] [CrossRef]
- Rizzo, L. Addressing Main Challenges in the Tertiary Treatment of Urban Wastewater: Are Homogeneous Photodriven AOPs the Answer? Environ. Sci. Water Res. Technol. 2022, 8, 2145–2169. [Google Scholar] [CrossRef]
- Espíndola, J.C.; Caianelo, M.; Scaccia, N.; Rodrigues-Silva, C.; Guimarães, J.R.; Vilar, V.J.P. Trace Organic Contaminants Removal from Municipal Wastewater Using the FluHelik Reactor: From Laboratory-Scale to Pre-Pilot Scale. J. Environ. Chem. Eng. 2021, 9, 105060. [Google Scholar] [CrossRef]
- Espíndola, J.C.; Vilar, V.J.P. Innovative Light-Driven Chemical/Catalytic Reactors towards Contaminants of Emerging Concern Mitigation: A Review. Chem. Eng. J. 2020, 394, 124865. [Google Scholar] [CrossRef]
- Zhao, Y.-X.; Li, P.; Li, R.-H.; Li, X.-Y. Direct Filtration for the Treatment of the Coagulated Domestic Sewage Using Flat-Sheet Ceramic Membranes. Chemosphere 2019, 223, 383–390. [Google Scholar] [CrossRef]
- Hube, S.; Eskafi, M.; Hrafnkelsdóttir, K.F.; Bjarnadóttir, B.; Bjarnadóttir, M.Á.; Axelsdóttir, S.; Wu, B. Direct Membrane Filtration for Wastewater Treatment and Resource Recovery: A Review. Sci. Total Environ. 2020, 710, 136375. [Google Scholar] [CrossRef]
- Kimura, K.; Honoki, D.; Sato, T. Effective Physical Cleaning and Adequate Membrane Flux for Direct Membrane Filtration (DMF) of Municipal Wastewater: Up-Concentration of Organic Matter for Efficient Energy Recovery. Sep. Purif. Technol. 2017, 181, 37–43. [Google Scholar] [CrossRef]
- Jin, Z.; Gong, H.; Temmink, H.; Nie, H.; Wu, J.; Zuo, J.; Wang, K. Efficient Sewage Pre-Concentration with Combined Coagulation Microfiltration for Organic Matter Recovery. Chem. Eng. J. 2016, 292, 130–138. [Google Scholar] [CrossRef]
- Nascimento, T.A.; Fdz-Polanco, F.; Peña, M. Membrane-Based Technologies for the Up-Concentration of Municipal Wastewater: A Review of Pretreatment Intensification. Sep. Purif. Rev. 2018, 49, 1–19. [Google Scholar] [CrossRef]
- Fujioka, T.; Nghiem, L.D. Fouling Control of a Ceramic Microfiltration Membrane for Direct Sewer Mining by Backwashing with Ozonated Water. Sep. Purif. Technol. 2015, 142, 268–273. [Google Scholar] [CrossRef]
- Ravazzini, A.M.; van Nieuwenhuijzen, A.F.; van der Graaf, J.H.M.J. Direct Ultrafiltration of Municipal Wastewater: Comparison between Filtration of Raw Sewage and Primary Clarifier Effluent. Desalination 2005, 178, 51–62. [Google Scholar] [CrossRef]
- Apha, A.W. Standard Methods for Examination of Water and Waste Water, 33rd ed.; Eaton, A.D., Clesceri, L.S., Rice, E.W., Greenberg, A.E., Franson, M.A.H., Eds.; American Public Health Association: Washington, DC, USA, 2012. [Google Scholar]
- Dubois, M.; Gilles, K.A.; Hamilton, J.K.; Rebers, P.A.; Smith, F. Colorimetric Method for Determination of Sugars and Related Substances. Anal. Chem. 1956, 28, 350–356. [Google Scholar] [CrossRef]
- Ho, C.C.; Zydney, A.L. Transmembrane Pressure Profiles during Constant Flux Microfiltration of Bovine Serum Albumin. J. Membr. Sci. 2002, 209, 363–377. [Google Scholar] [CrossRef]
- Kirschner, A.Y.; Cheng, Y.H.; Paul, D.R.; Field, R.W.; Freeman, B.D. Fouling Mechanisms in Constant Flux Crossflow Ultrafiltration. J. Membr. Sci. 2019, 574, 65–75. [Google Scholar] [CrossRef] [Green Version]
- Gong, H.; Jin, Z.; Wang, X.; Wang, K. Membrane Fouling Controlled by Coagulation/Adsorption during Direct Sewage Membrane Filtration (DSMF) for Organic Matter Concentration. J. Environ. Sci. 2015, 32, 1–7. [Google Scholar] [CrossRef]
- Jin, Z.; Gong, H.; Wang, K. Application of Hybrid Coagulation Microfiltration with Air Backflushing to Direct Sewage Concentration for Organic Matter Recovery. J. Hazard. Mater. 2015, 283, 824–831. [Google Scholar] [CrossRef]
- Ravazzini, A.M. Crossflow Ultrafiltration of Raw Municipal Wastewater. Ph.D. Thesis, Delft University of Technology, Delft, The Netherlands, 2008. [Google Scholar]
- Mohammadi, T.; Kohpeyma, A.; Sadrzadeh, M. Mathematical Modeling of Flux Decline in Ultrafiltration. Desalination 2005, 184, 367–375. [Google Scholar] [CrossRef]
- Di Bella, G.; Mannina, G.; Viviani, G. An Integrated Model for Physical-Biological Wastewater Organic Removal in a Submerged Membrane Bioreactor: Model Development and Parameter Estimation. J. Membr. Sci. 2008, 322, 1–12. [Google Scholar] [CrossRef]
- Wu, B.; Kitade, T.; Chong, T.H.; Uemura, T.; Fane, A.G. Role of Initially Formed Cake Layers on Limiting Membrane Fouling in Membrane Bioreactors. Bioresour. Technol. 2012, 118, 589–593. [Google Scholar] [CrossRef]
- Weerasekara, N.A.; Choo, K.H.; Lee, C.H. Hybridization of Physical Cleaning and Quorum Quenching to Minimize Membrane Biofouling and Energy Consumption in a Membrane Bioreactor. Water Res. 2014, 67, 1–10. [Google Scholar] [CrossRef]
- Kramer, F.C.; Shang, R.; Heijman, S.G.J.; Scherrenberg, S.M.; Van Lier, J.B.; Rietveld, L.C. Direct Water Reclamation from Sewage Using Ceramic Tight Ultra- and Nanofiltration. Sep. Purif. Technol. 2015, 147, 329–336. [Google Scholar] [CrossRef]
- Nascimento, T.A.; Mejía, F.R.; Fdz-Polanco, F.; Miranda, M.P. Improvement of Municipal Wastewater Pretreatment by Direct Membrane Filtration. Environ. Technol. 2017, 38, 2562–2572. [Google Scholar] [CrossRef]


 membrane resistance after the operating period;
  membrane resistance after the basic cleaning;
  membrane resistance after the acid cleaning. Raw: influent municipal wastewater after a classic pre-treatment (screening and sieving, desanding and degreasing). PSE: effluent of the full-scale wastewater treatment plant primary settler.
membrane resistance after the operating period; membrane resistance after the basic cleaning; membrane resistance after the acid cleaning. Raw: influent municipal wastewater after a classic pre-treatment (screening and sieving, desanding and degreasing). PSE: effluent of the full-scale wastewater treatment plant primary settler.
membrane resistance after the acid cleaning. Raw: influent municipal wastewater after a classic pre-treatment (screening and sieving, desanding and degreasing). PSE: effluent of the full-scale wastewater treatment plant primary settler.
membrane resistance after the operating period; membrane resistance after the basic cleaning; membrane resistance after the acid cleaning. Raw: influent municipal wastewater after a classic pre-treatment (screening and sieving, desanding and degreasing). PSE: effluent of the full-scale wastewater treatment plant primary settler.


| Treated Sewage | Raw | PSE | |
|---|---|---|---|
| Parameter | Units | Mean ± SD | Mean ± SD |
| TSS | mg TSS L−1 | 321 ± 98 | 132 ± 43 |
| COD | mg COD L−1 | 512 ± 118 | 195 ± 59 |
| SCOD | mg COD L−1 | 63 ± 28 | 57 ± 21 |
| SMP | mg COD L−1 | 58.4 ± 11.3 | 60.9 ± 13.1 |
| TN | mg N L−1 | 56.7 ± 10.8 | 45.5 ± 8.5 |
| TP | mg P L−1 | 6.4 ± 1.6 | 5.9 ± 1.1 |
| Alk | mg CaCO3 L−1 | 342 ± 73 | 335 ± 67 |
| pH | - | 7.4 ± 0.7 | 7.6 ± 0.5 |
| Exp. Nomenclature * | Membrane | Sewage Treated | Waste Concentration (g L−1) |
|---|---|---|---|
| MF-Raw-1.0 | MF | Raw | 0.98 ± 0.39 |
| MF-PSE-1.1 | MF | PSE | 1.09 ± 0.47 |
| MF-Raw-2.7 | MF | Raw | 2.72 ± 0.68 |
| MF-PSE-2.8 | MF | PSE | 2.83 ± 0.70 |
| UF-Raw-1.1 | UF | Raw | 1.11 ± 0.51 |
| UF-PSE-1.2 | UF | PSE | 1.23 ± 0.43 |
| UF-Raw-2.6 | UF | Raw | 2.56 ± 0.42 |
| UF-PSE-2.6 | UF | PSE | 2.63 ± 0.48 |
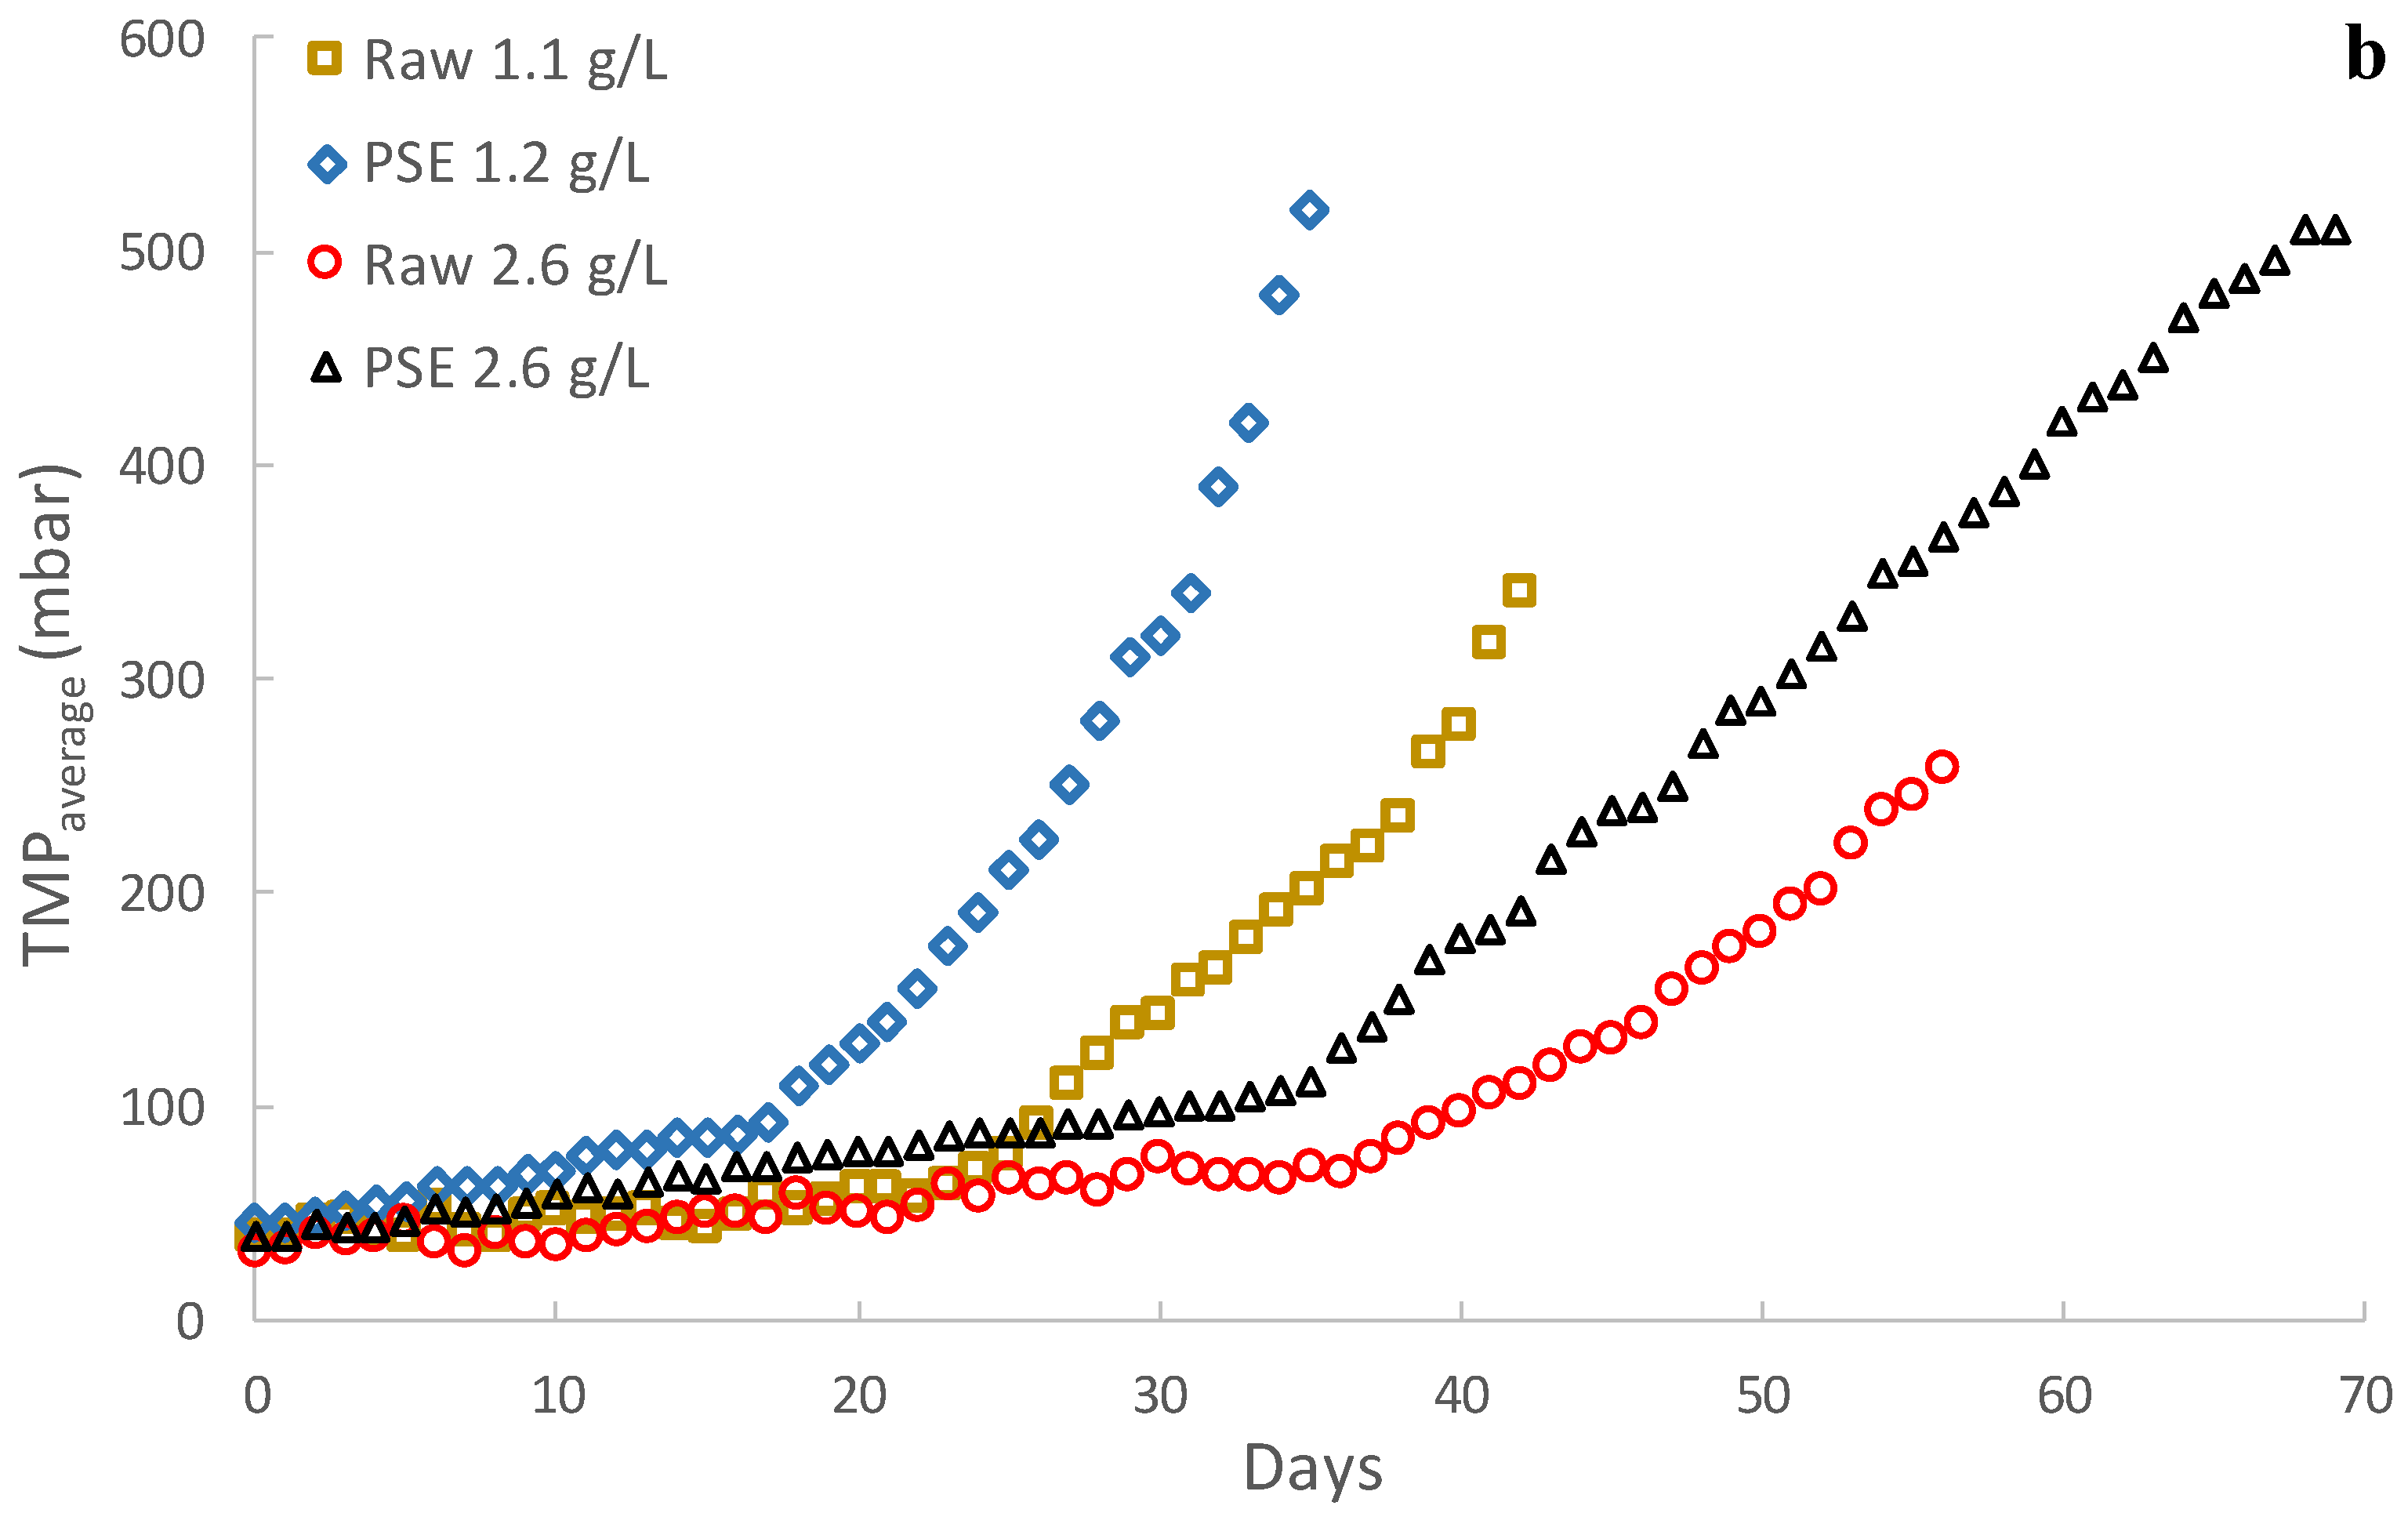
| Sewage Treated | Waste Concentration (g L−1) | Stable Period (Days) | 1st Slope * (mbar/Day) | 2nd Slope * (mbar/Day) |
|---|---|---|---|---|
| Raw | 1.1 | 22 | 1.81 | 13.22 |
| PSE | 1.2 | 16 | 2.87 | 21.58 |
| Raw | 2.6 | 36 | 1.13 | 9.31 |
| PSE | 2.6 | 34 | 1.99 | 12.01 |
| Sewage Treated | Waste Concentration (g L−1) | SMP Concentration (mg COD L−1) | SMP Retention (%) | SMP:TSS Ratio | Viscosity (cSt) | TTF (s) |
|---|---|---|---|---|---|---|
| Raw | 1.11 ± 0.51 | 96.0 ± 14.1 | 10.6 | 86.5 | 0.83 ± 0.04 | 103 ± 57 |
| PSE | 1.23 ± 0.43 | 78.3 ± 17.8 | 11.5 | 65.0 | 0.82 ± 0.03 | 79 ± 46 |
| Raw | 2.56 ± 0.42 | 109.1 ± 20.1 | 16.3 | 42.6 | 0.89 ± 0.08 | 566 ± 178 |
| PSE | 2.63 ± 0.48 | 102.8 ± 22.7 | 13.8 | 39.1 | 0.93 ± 0.08 | 612 ± 237 |
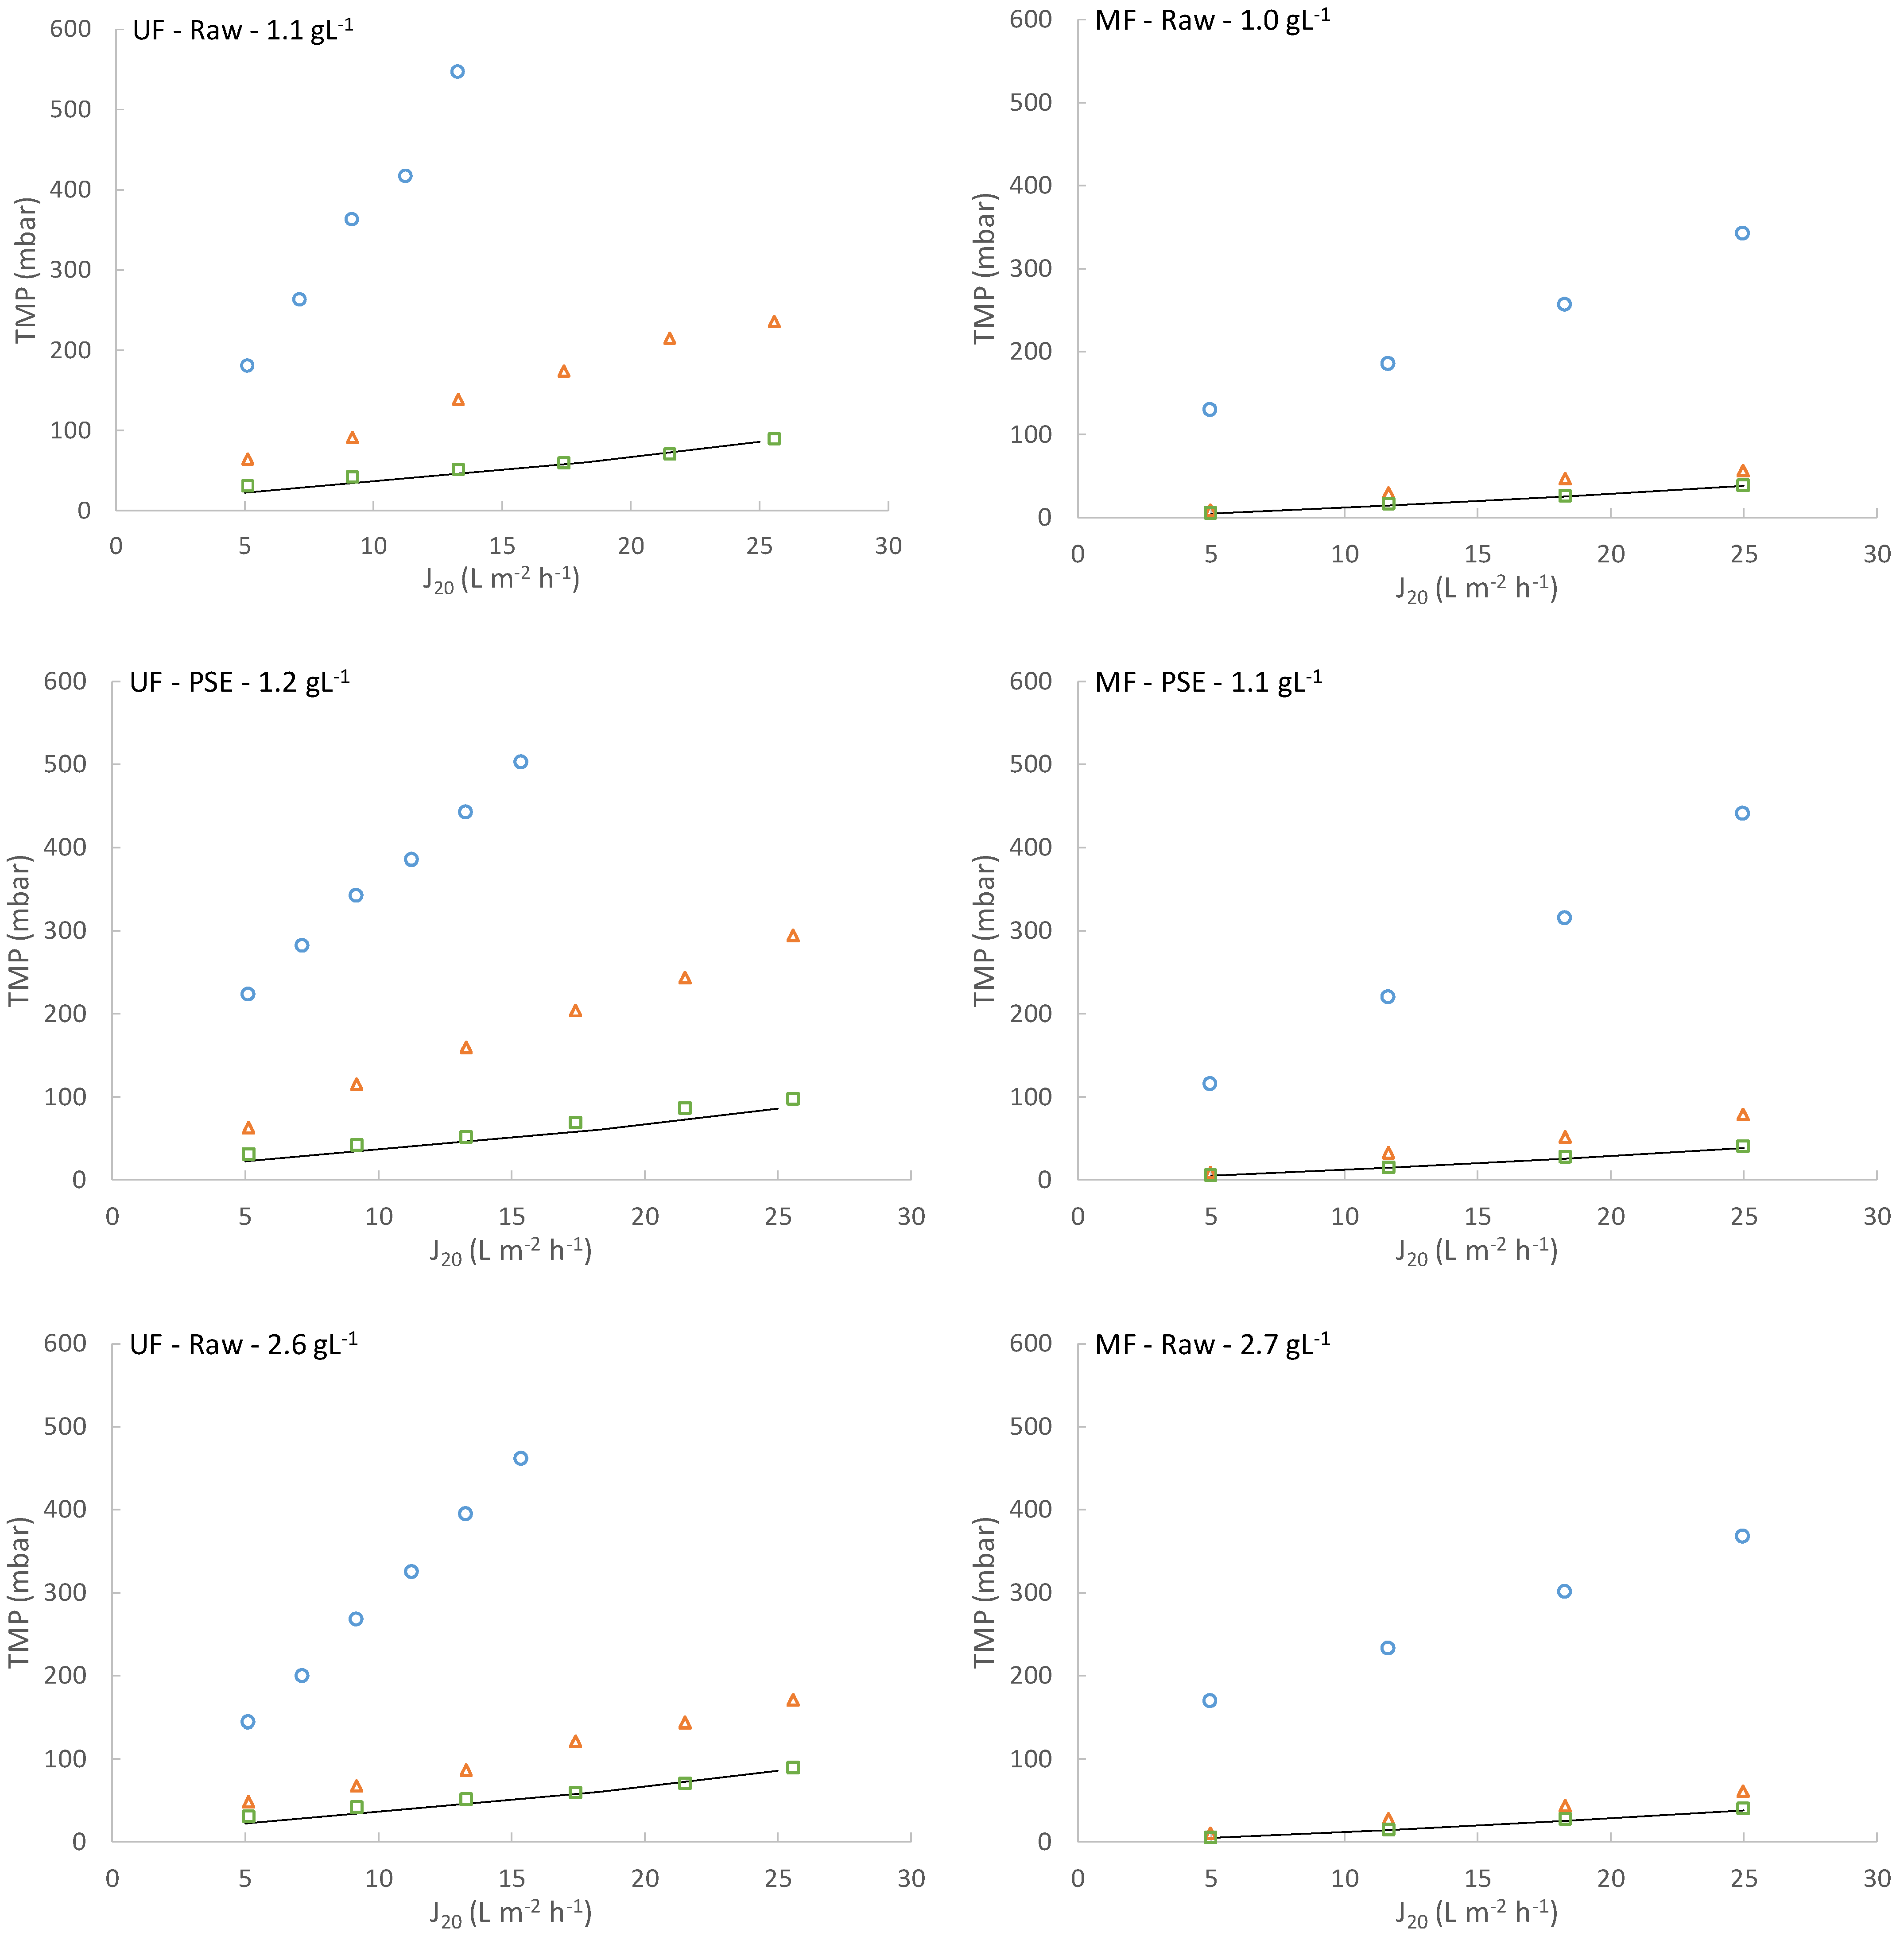
| Exp. Nomenclature | n Value |
|---|---|
| MF-Raw-1.0 | 0.978 |
| MF-PSE-1.1 | 1.194 |
| MF-Raw-2.7 | 0.893 |
| MF-PSE-2.8 | 1.515 |
| UF-Raw-1.1 | 0.717 |
| UF-PSE-1.2 | 1.405 |
| UF-Raw-2.6 | 0.689 |
| UF-PSE-2.6 | 0.761 |
Disclaimer/Publisher’s Note: The statements, opinions and data contained in all publications are solely those of the individual author(s) and contributor(s) and not of MDPI and/or the editor(s). MDPI and/or the editor(s) disclaim responsibility for any injury to people or property resulting from any ideas, methods, instructions or products referred to in the content. |
© 2023 by the authors. Licensee MDPI, Basel, Switzerland. This article is an open access article distributed under the terms and conditions of the Creative Commons Attribution (CC BY) license (https://creativecommons.org/licenses/by/4.0/).
Share and Cite
Sanchis-Perucho, P.; Aguado, D.; Ferrer, J.; Seco, A.; Robles, Á. Direct Membrane Filtration of Municipal Wastewater: Studying the Most Suitable Conditions for Minimizing Fouling Rate in Commercial Porous Membranes at Demonstration Scale. Membranes 2023, 13, 99. https://doi.org/10.3390/membranes13010099
Sanchis-Perucho P, Aguado D, Ferrer J, Seco A, Robles Á. Direct Membrane Filtration of Municipal Wastewater: Studying the Most Suitable Conditions for Minimizing Fouling Rate in Commercial Porous Membranes at Demonstration Scale. Membranes. 2023; 13(1):99. https://doi.org/10.3390/membranes13010099
Chicago/Turabian StyleSanchis-Perucho, Pau, Daniel Aguado, José Ferrer, Aurora Seco, and Ángel Robles. 2023. "Direct Membrane Filtration of Municipal Wastewater: Studying the Most Suitable Conditions for Minimizing Fouling Rate in Commercial Porous Membranes at Demonstration Scale" Membranes 13, no. 1: 99. https://doi.org/10.3390/membranes13010099