
Application and Analysis of Bipolar Membrane Electrodialysis for LiOH Production at High Electrolyte Concentrations: Current Scope and Challenges

 , , ,
, , ,
Abstract
: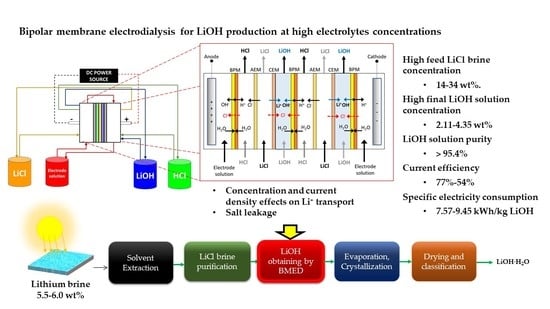
1. Introduction
2. Materials and Methods
2.1. Materials
2.2. Measurement of Water Uptake and Thickness of Membranes
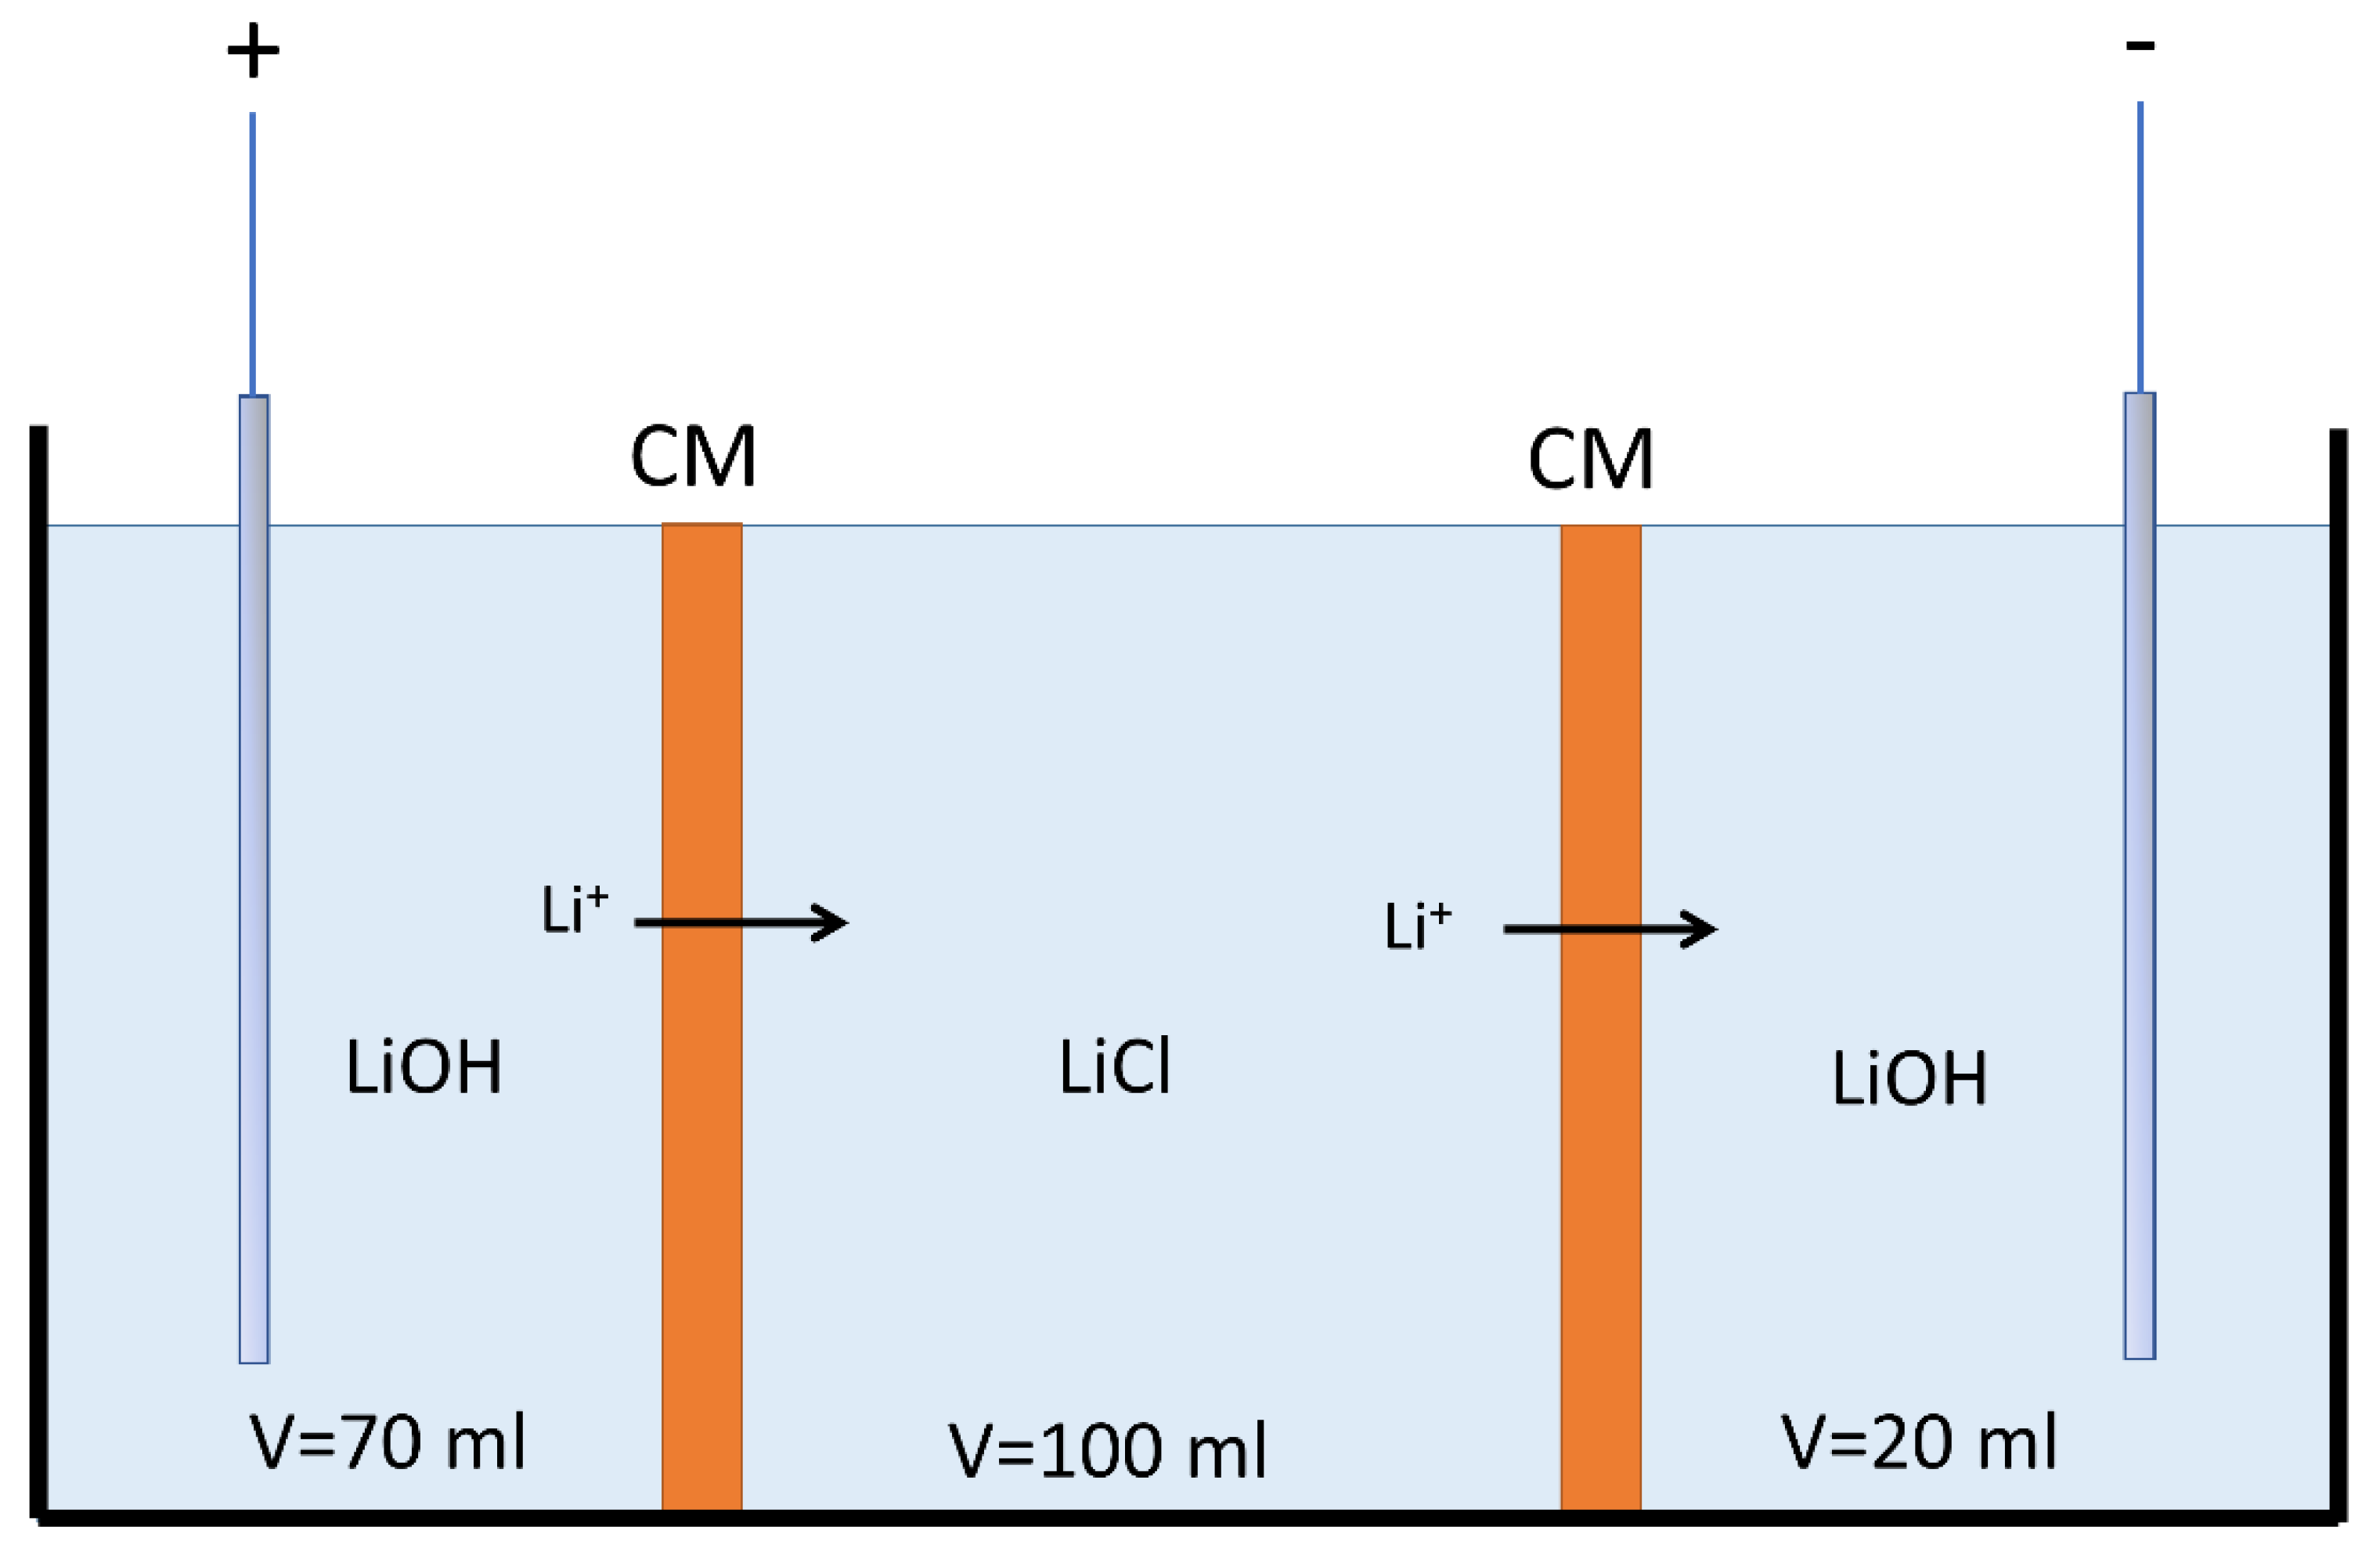
2.3. Determination of Lithium Transport Number
2.4. Linear Sweep Voltammetry (LSV)
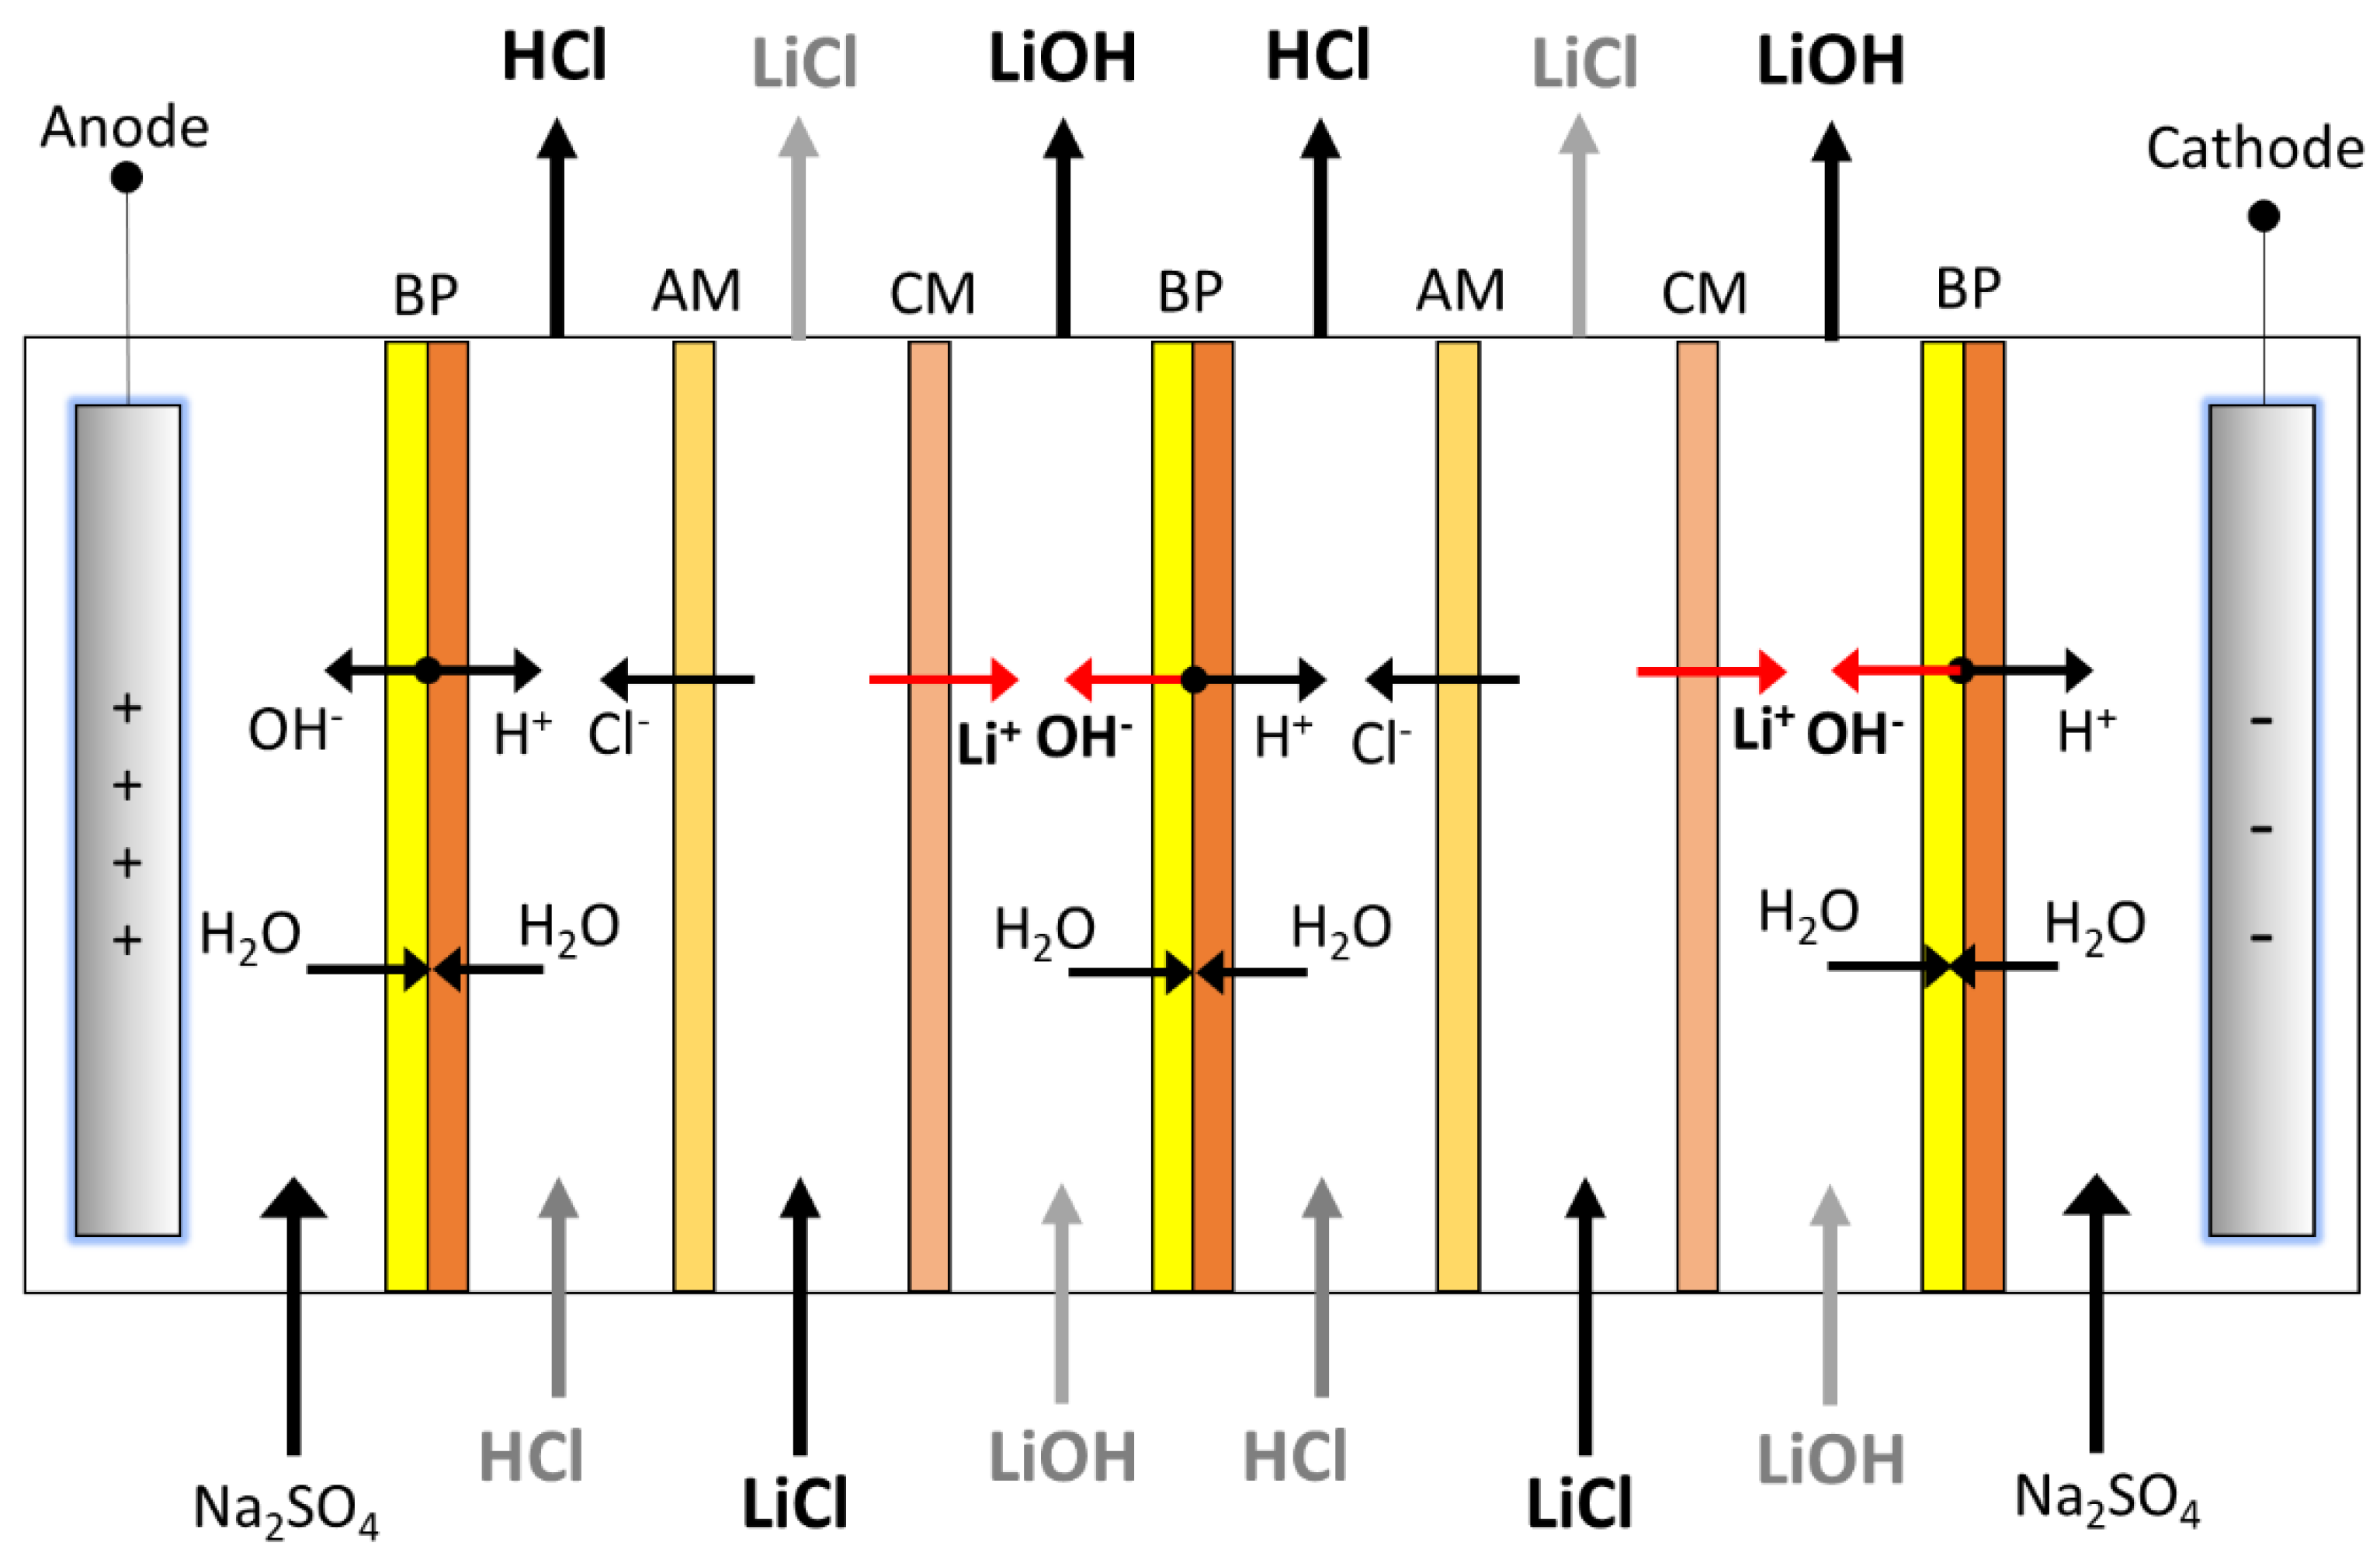
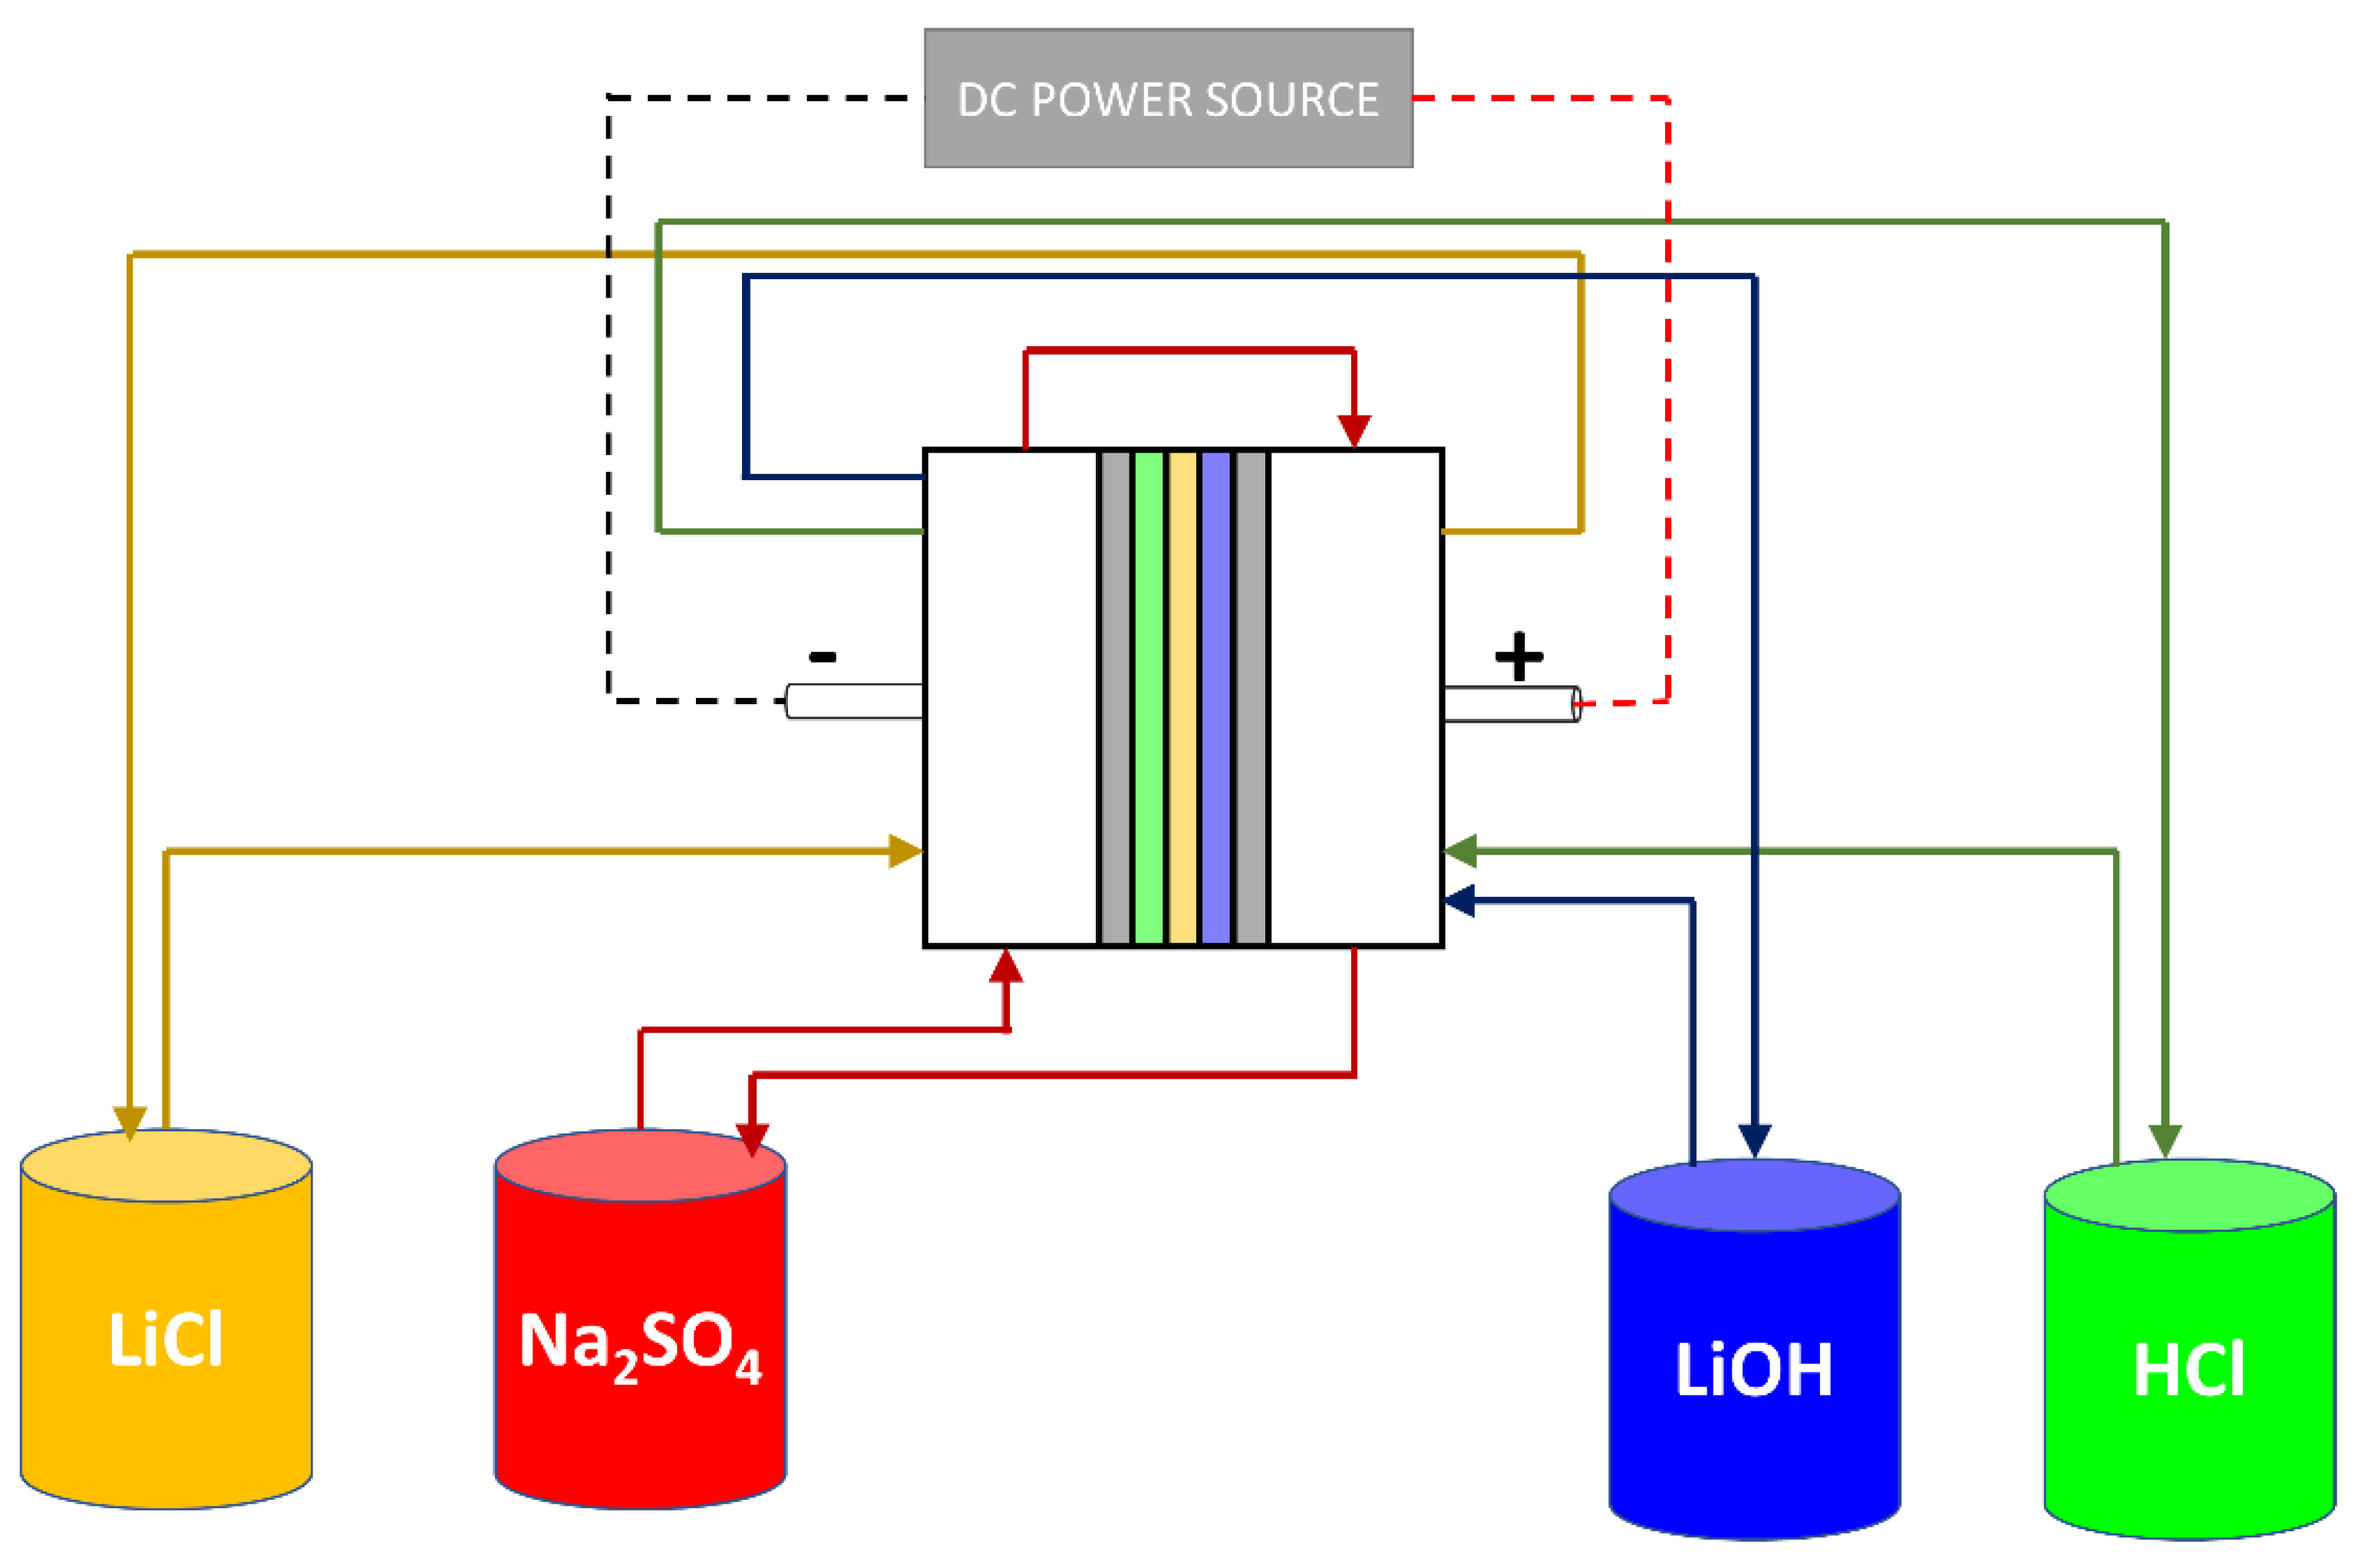
2.5. Bipolar Membrane Electrodialysis System
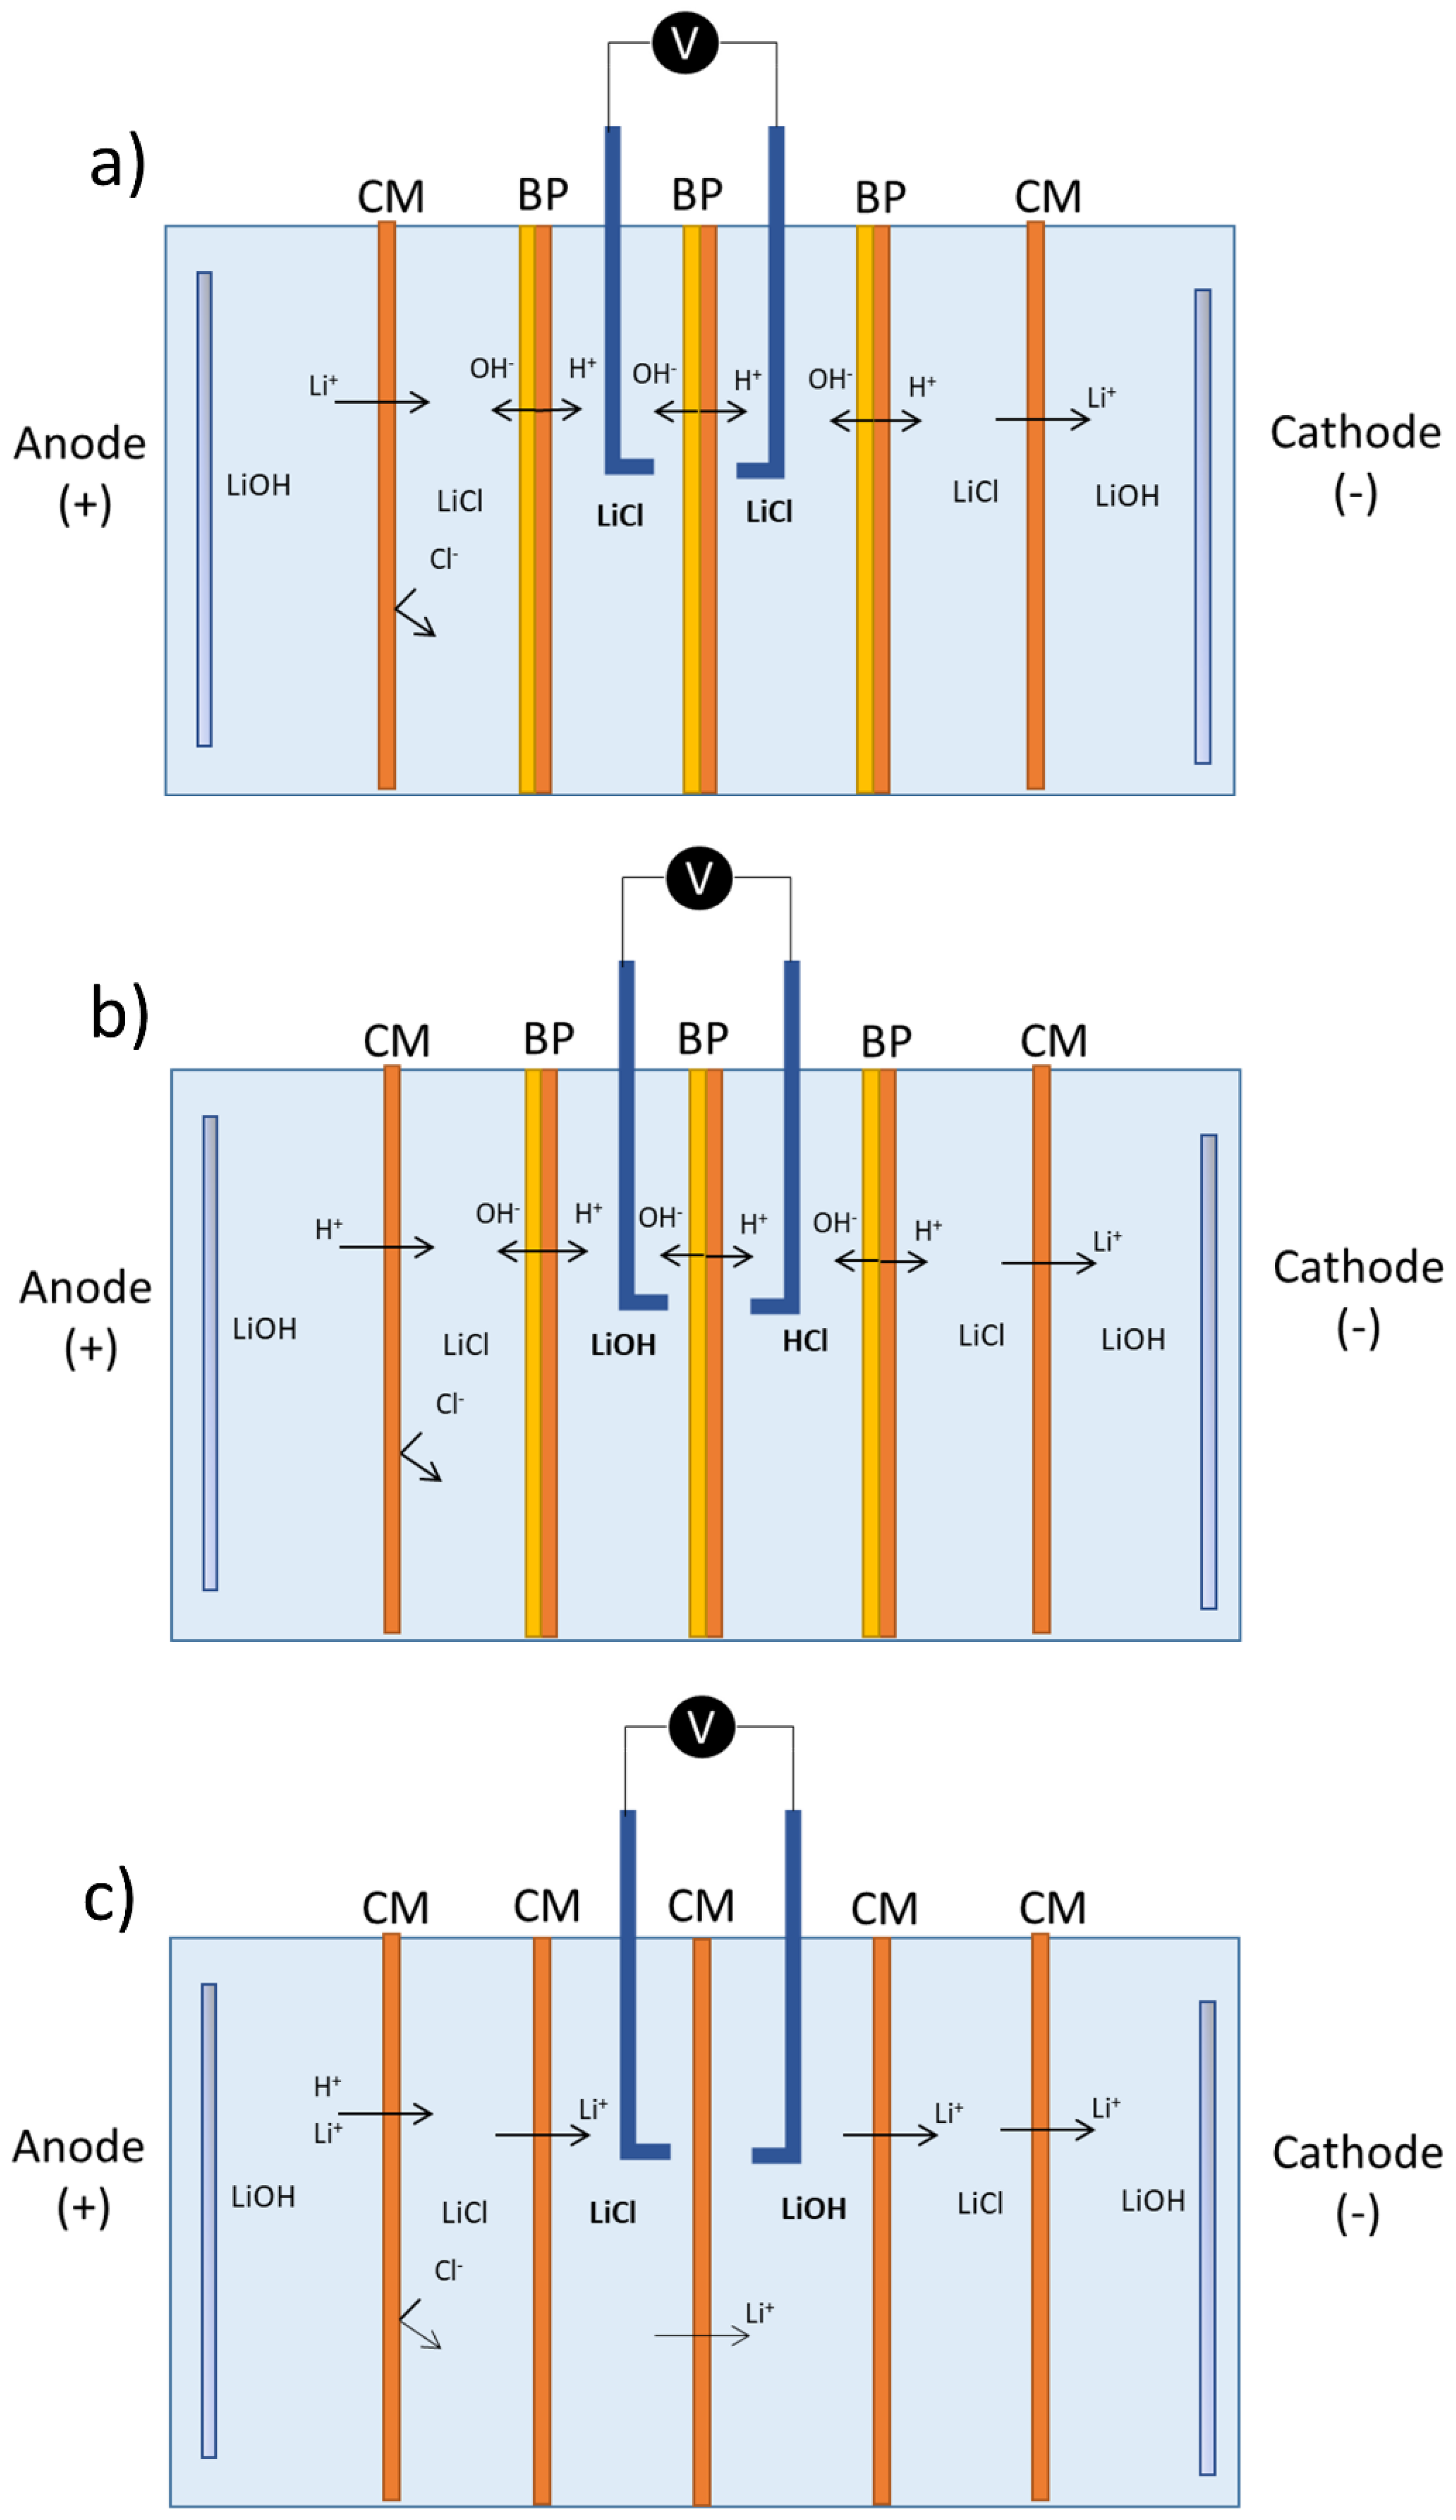
2.5.1. Stack Design and Construction
2.5.2. LiOH Production Experimental Tests Using BMED
2.5.3. SEC and ϕ Calculation
3. Results
3.1. Water Uptake and Membrane Thickness
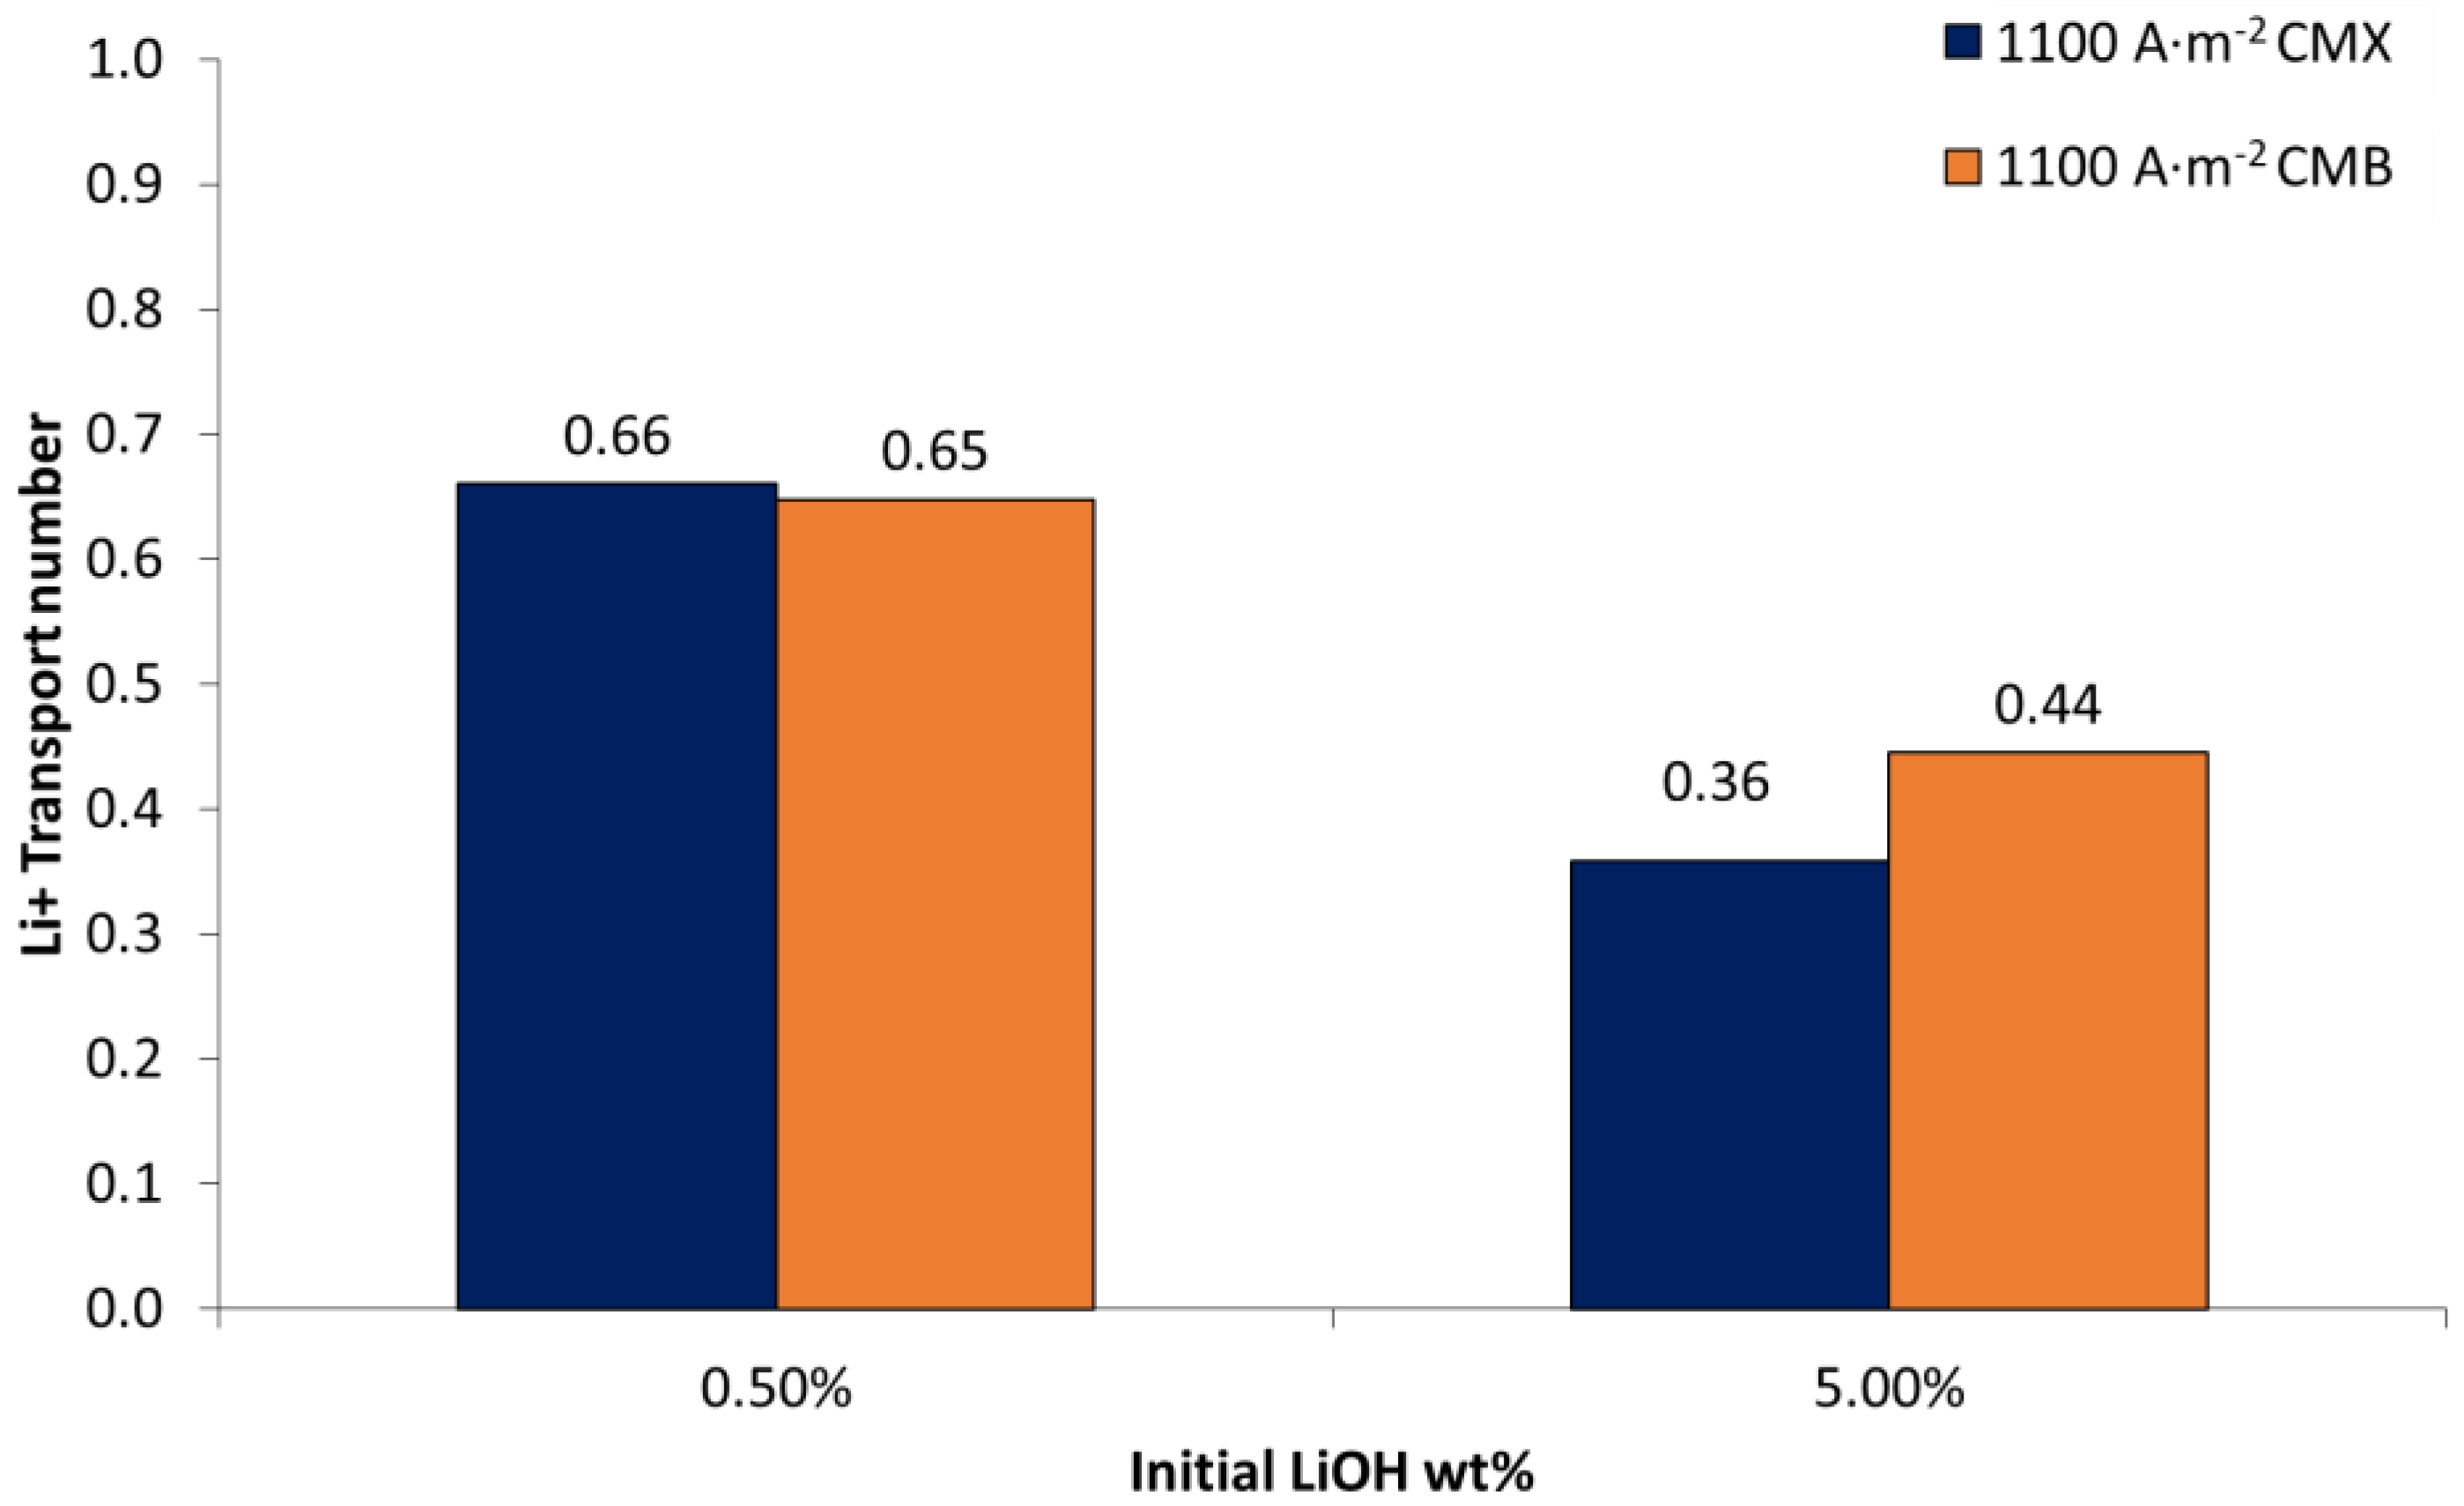
3.2. Lithium Transport Number
3.2.1. Influence of Current Density
3.2.2. Influence of Initial LiOH Concentration
3.2.3. pH Variation
3.2.4. Influence of LiCl Concentration
3.3. Current–Voltage Curves
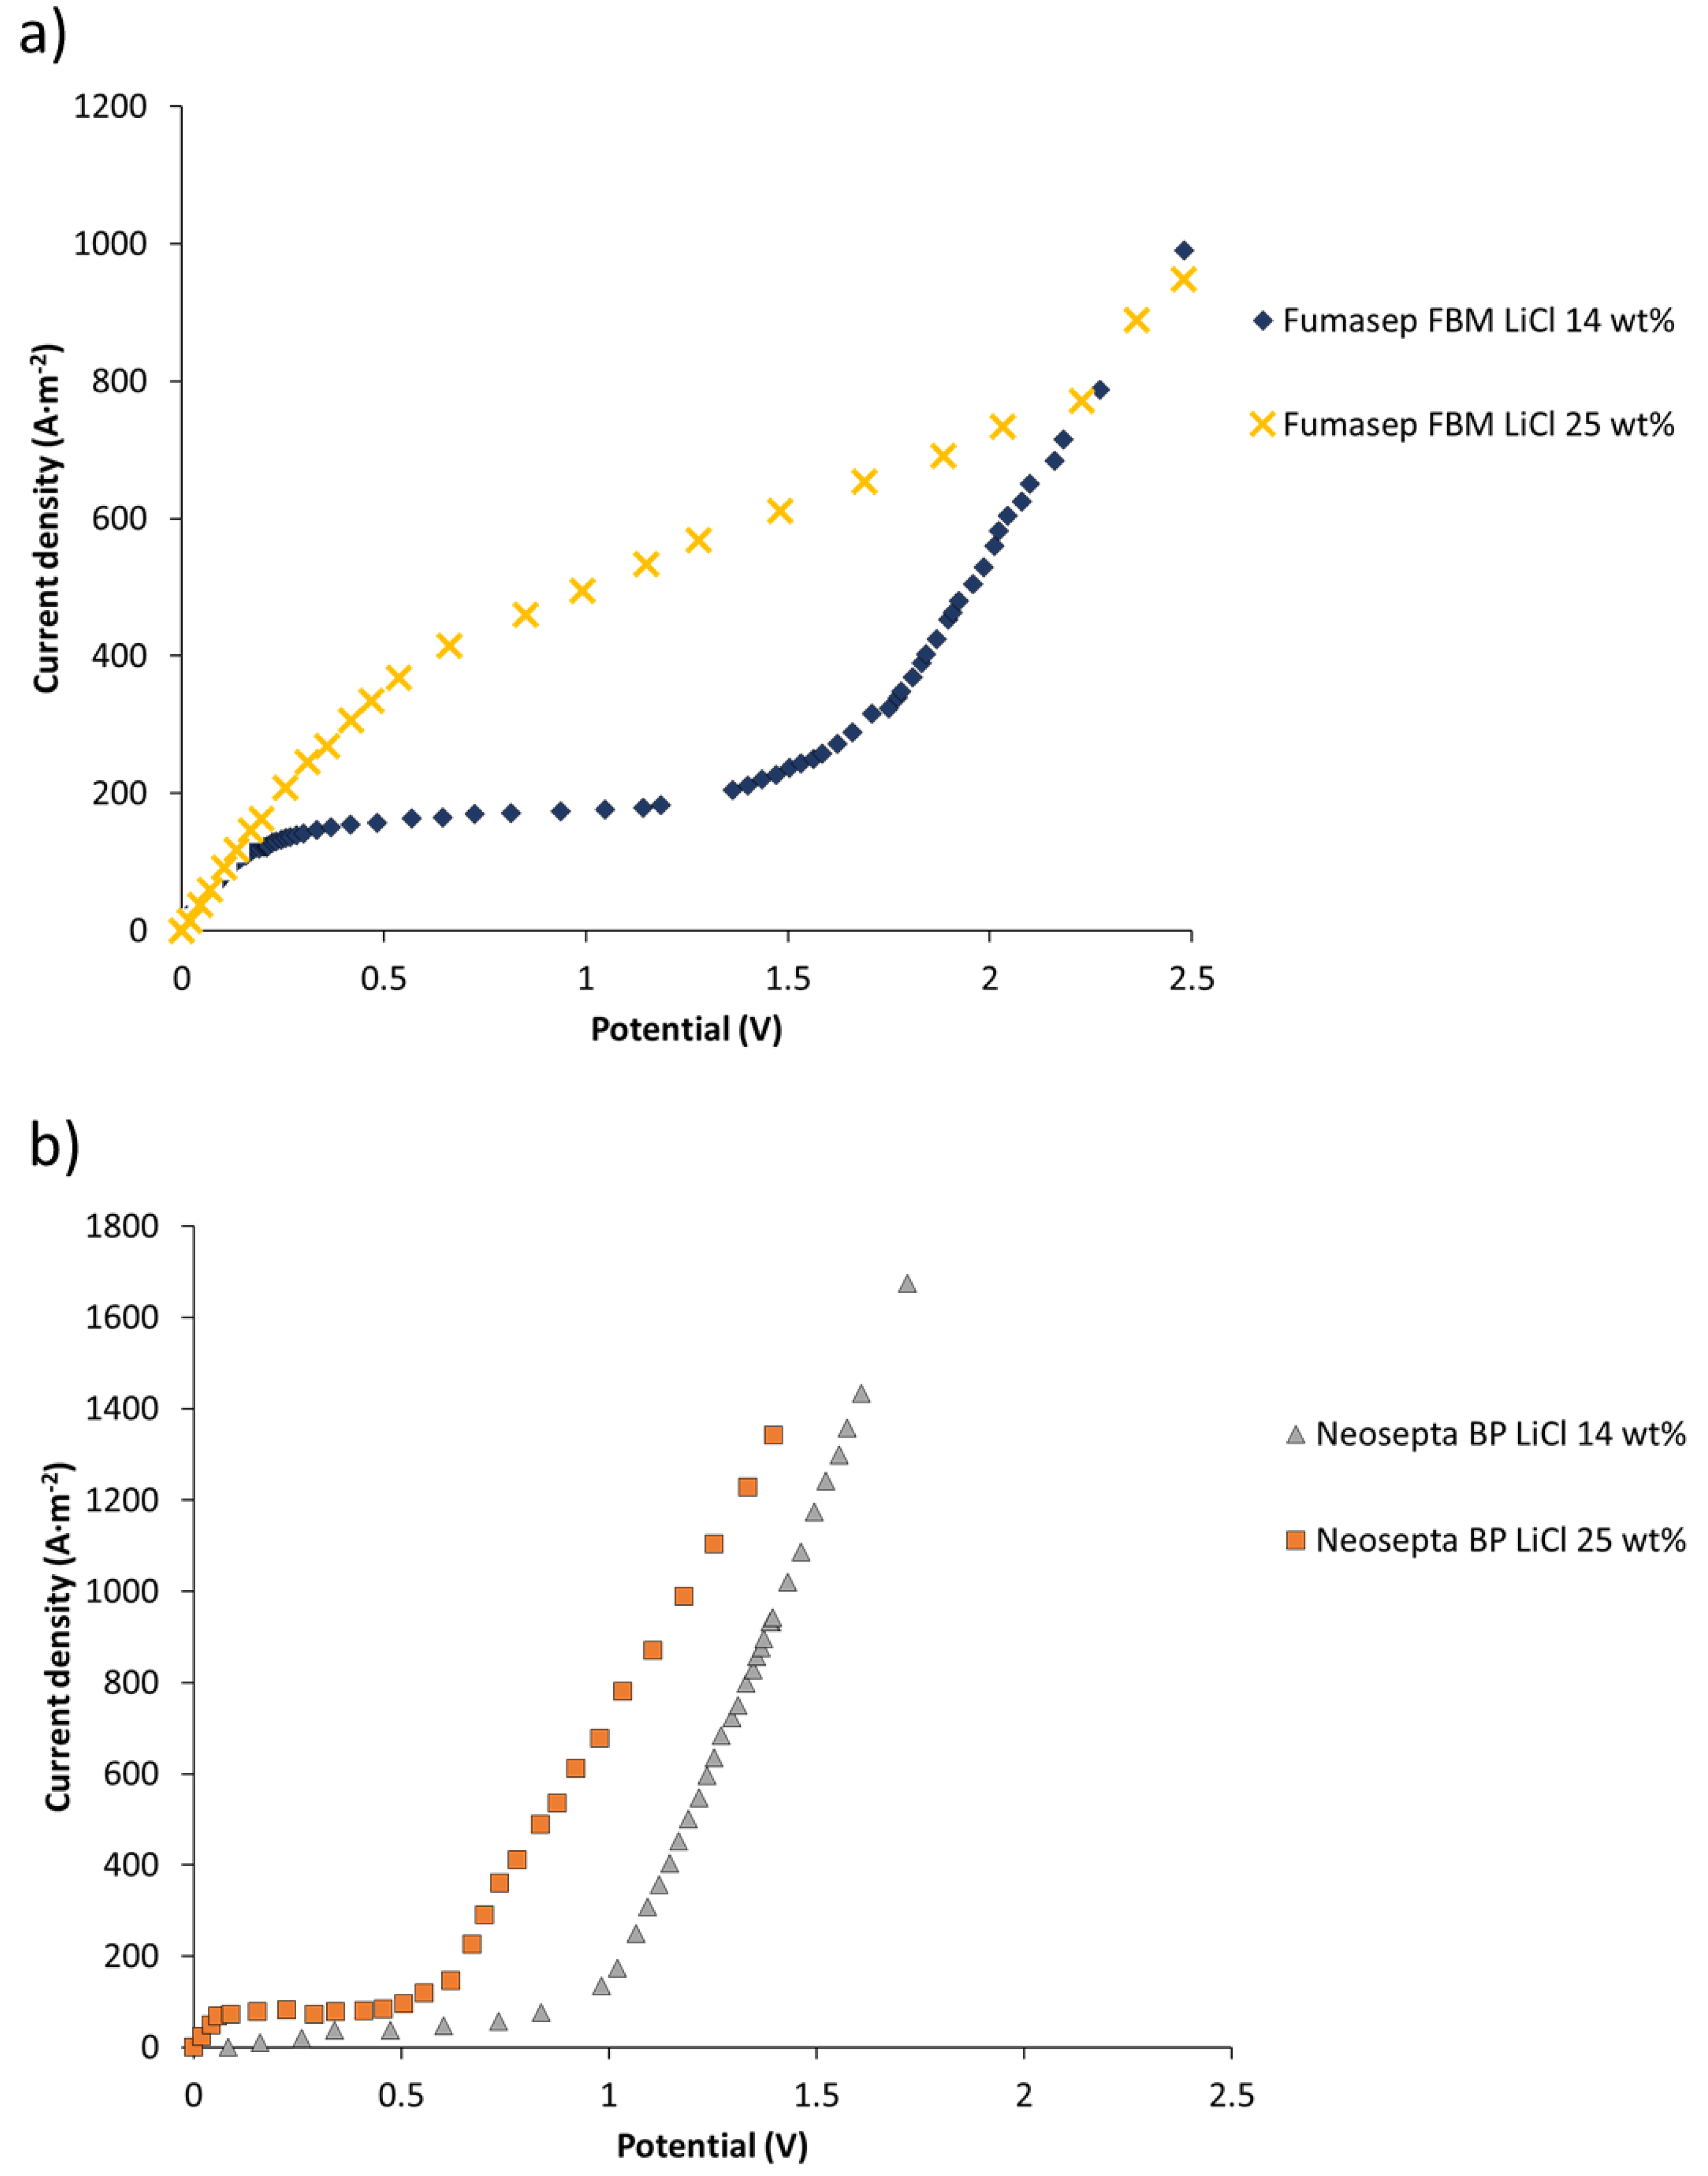
3.3.1. Salt Leakage through Bipolar Membranes
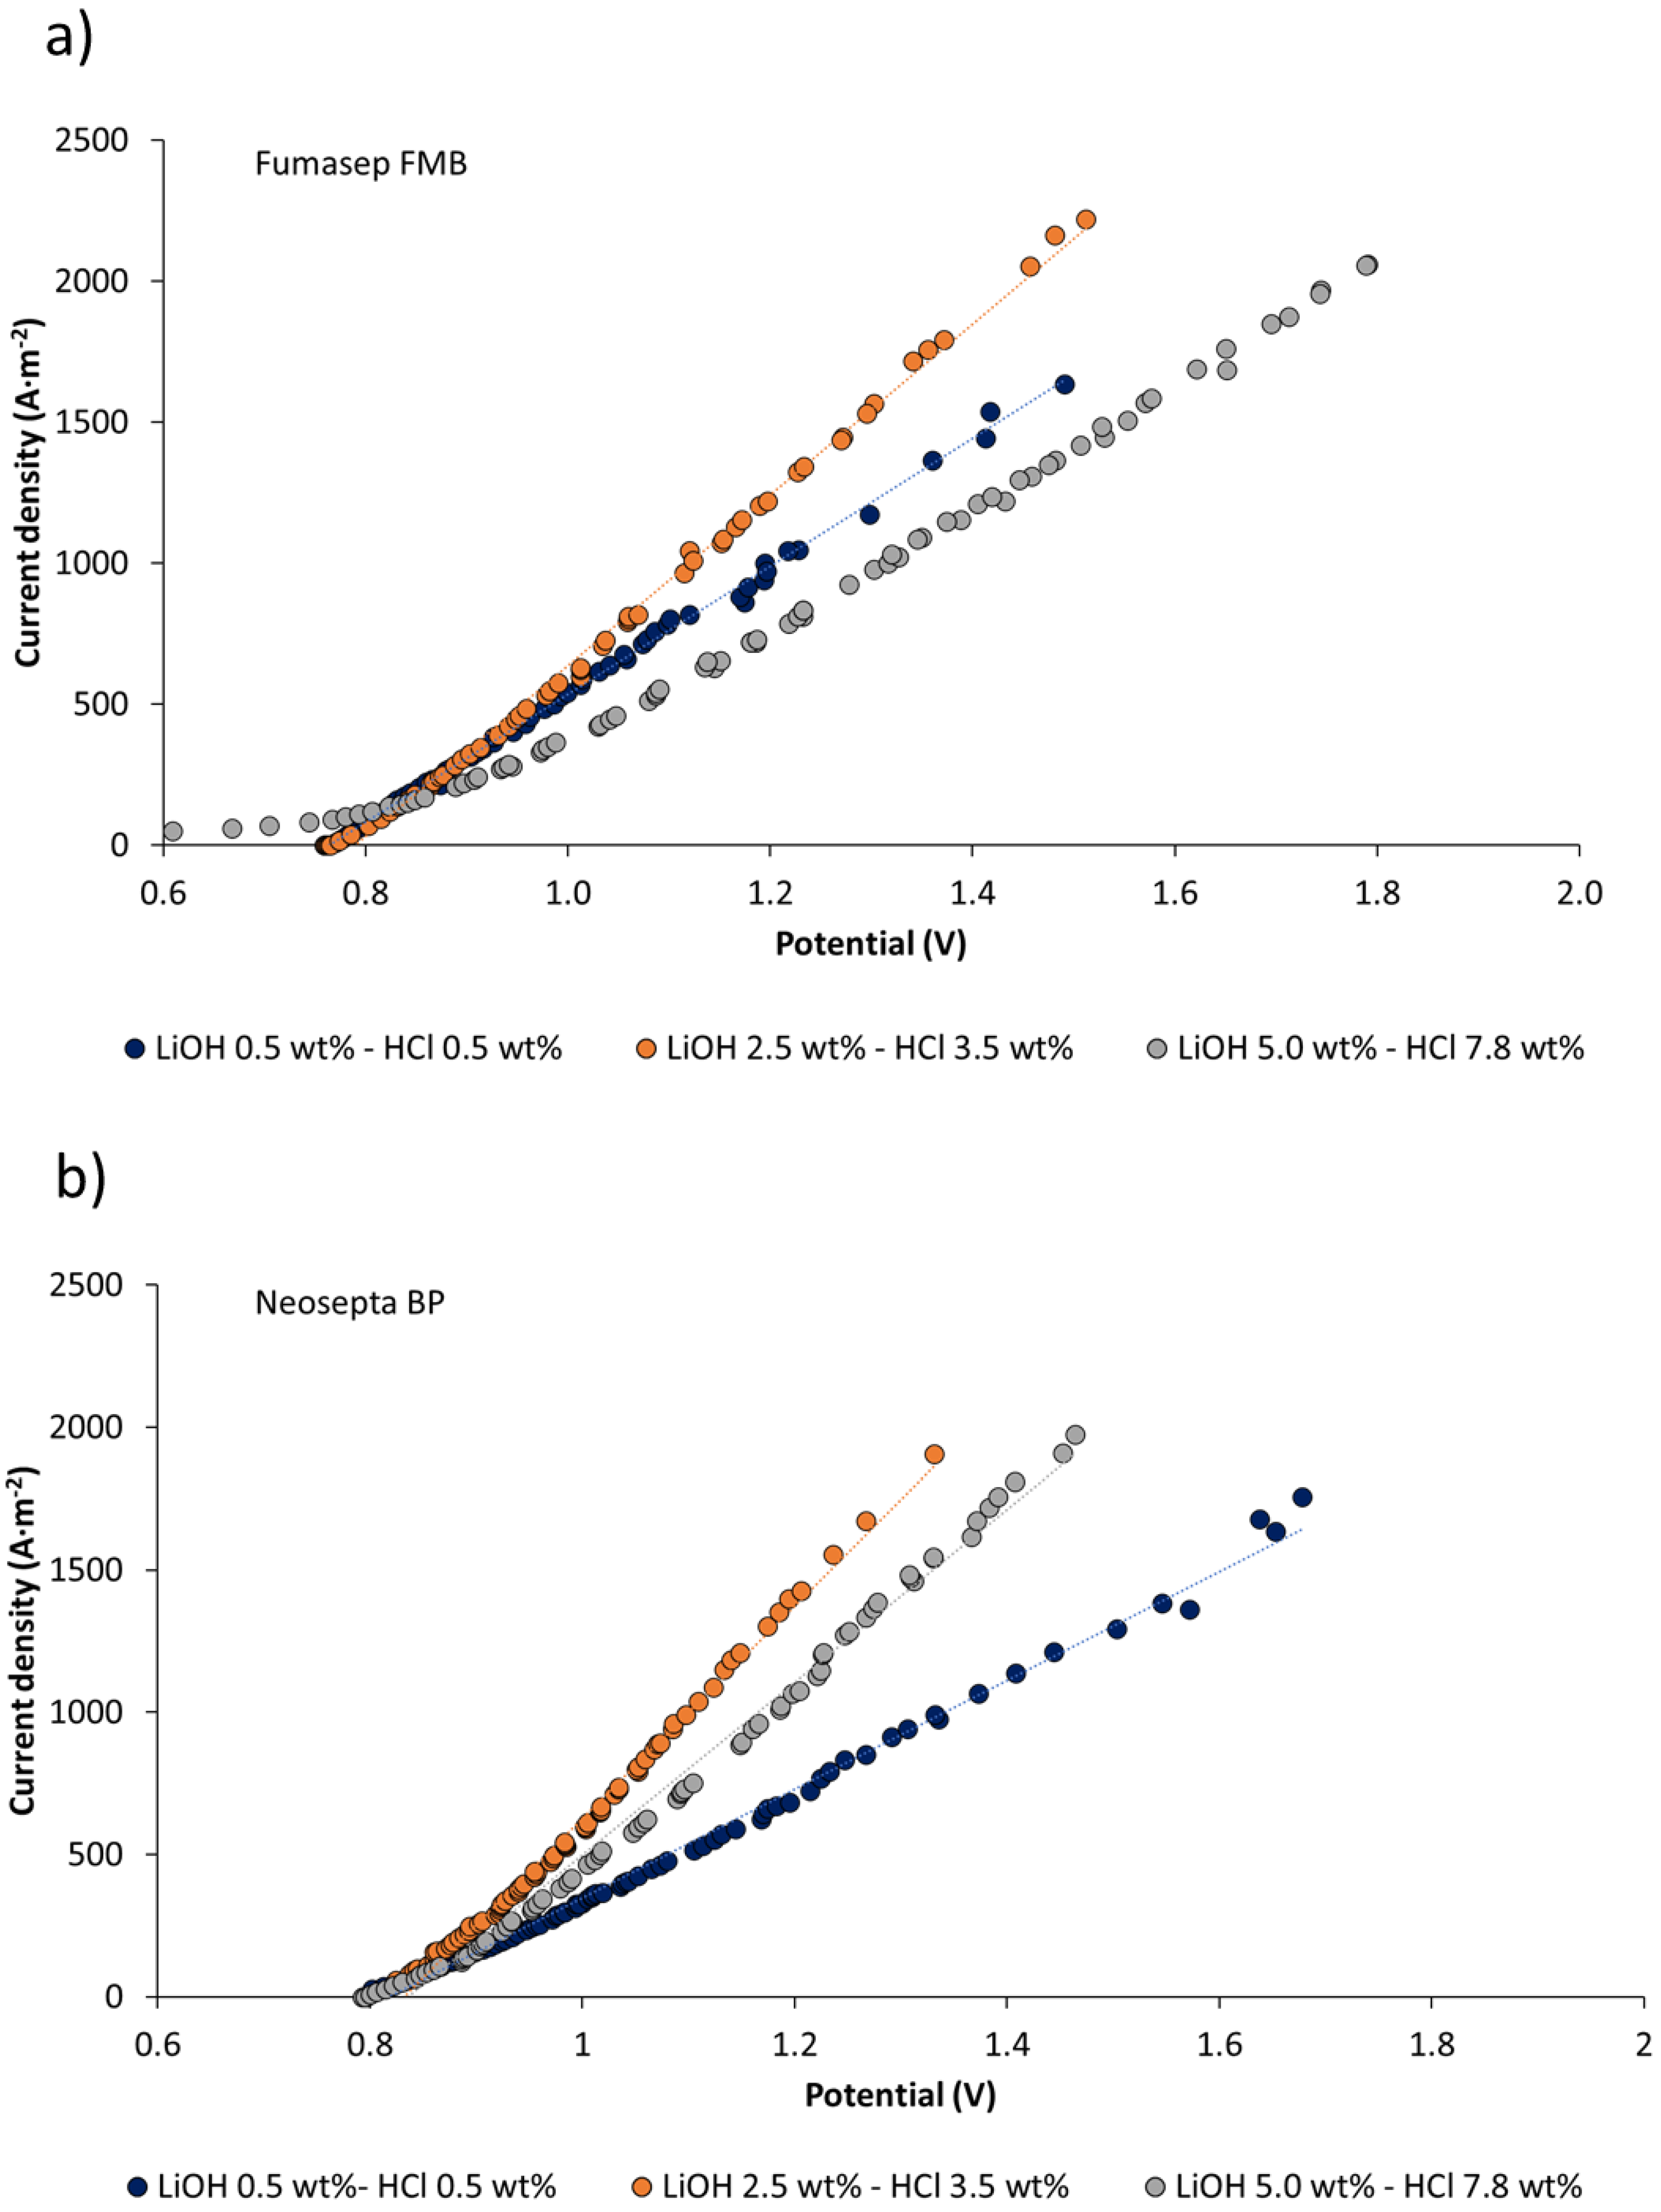
3.3.2. Linear Sweep Voltammetry on Bipolar Membranes under Production Conditions
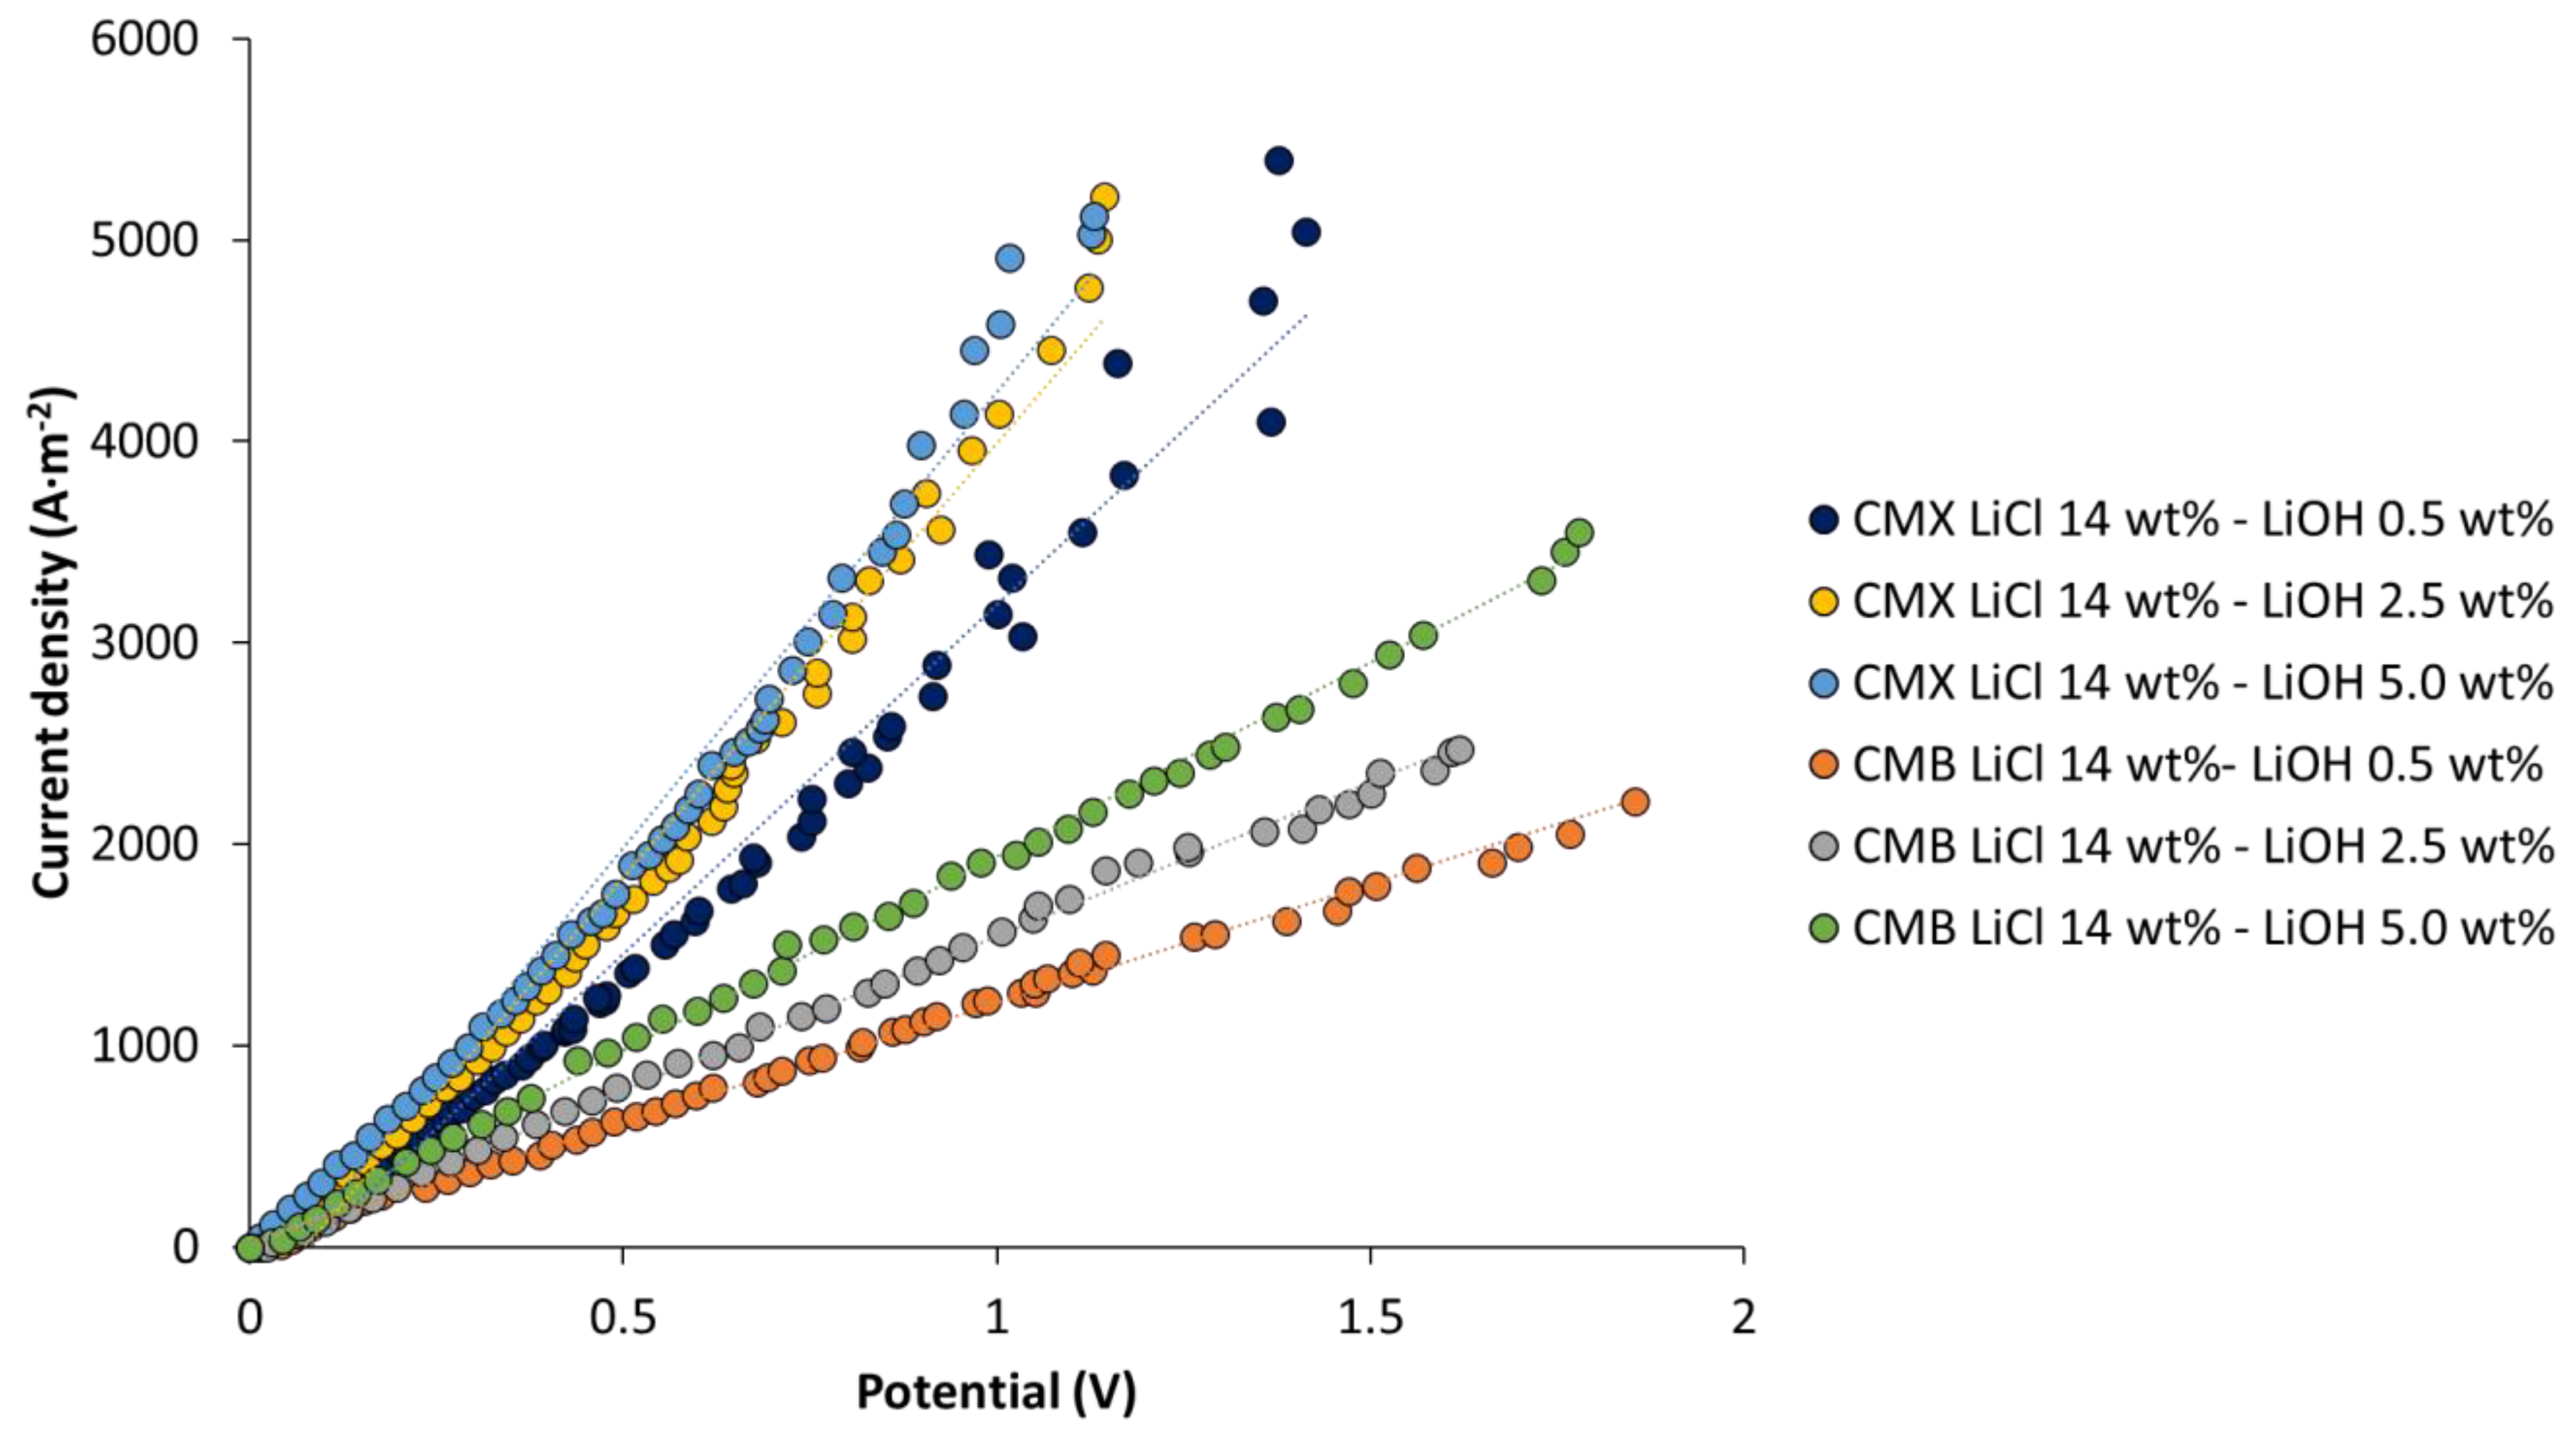
3.3.3. Linear Sweep Voltammetry in Cation-Exchange Membranes
3.4. Long-Running Production Tests of LiOH by BMED
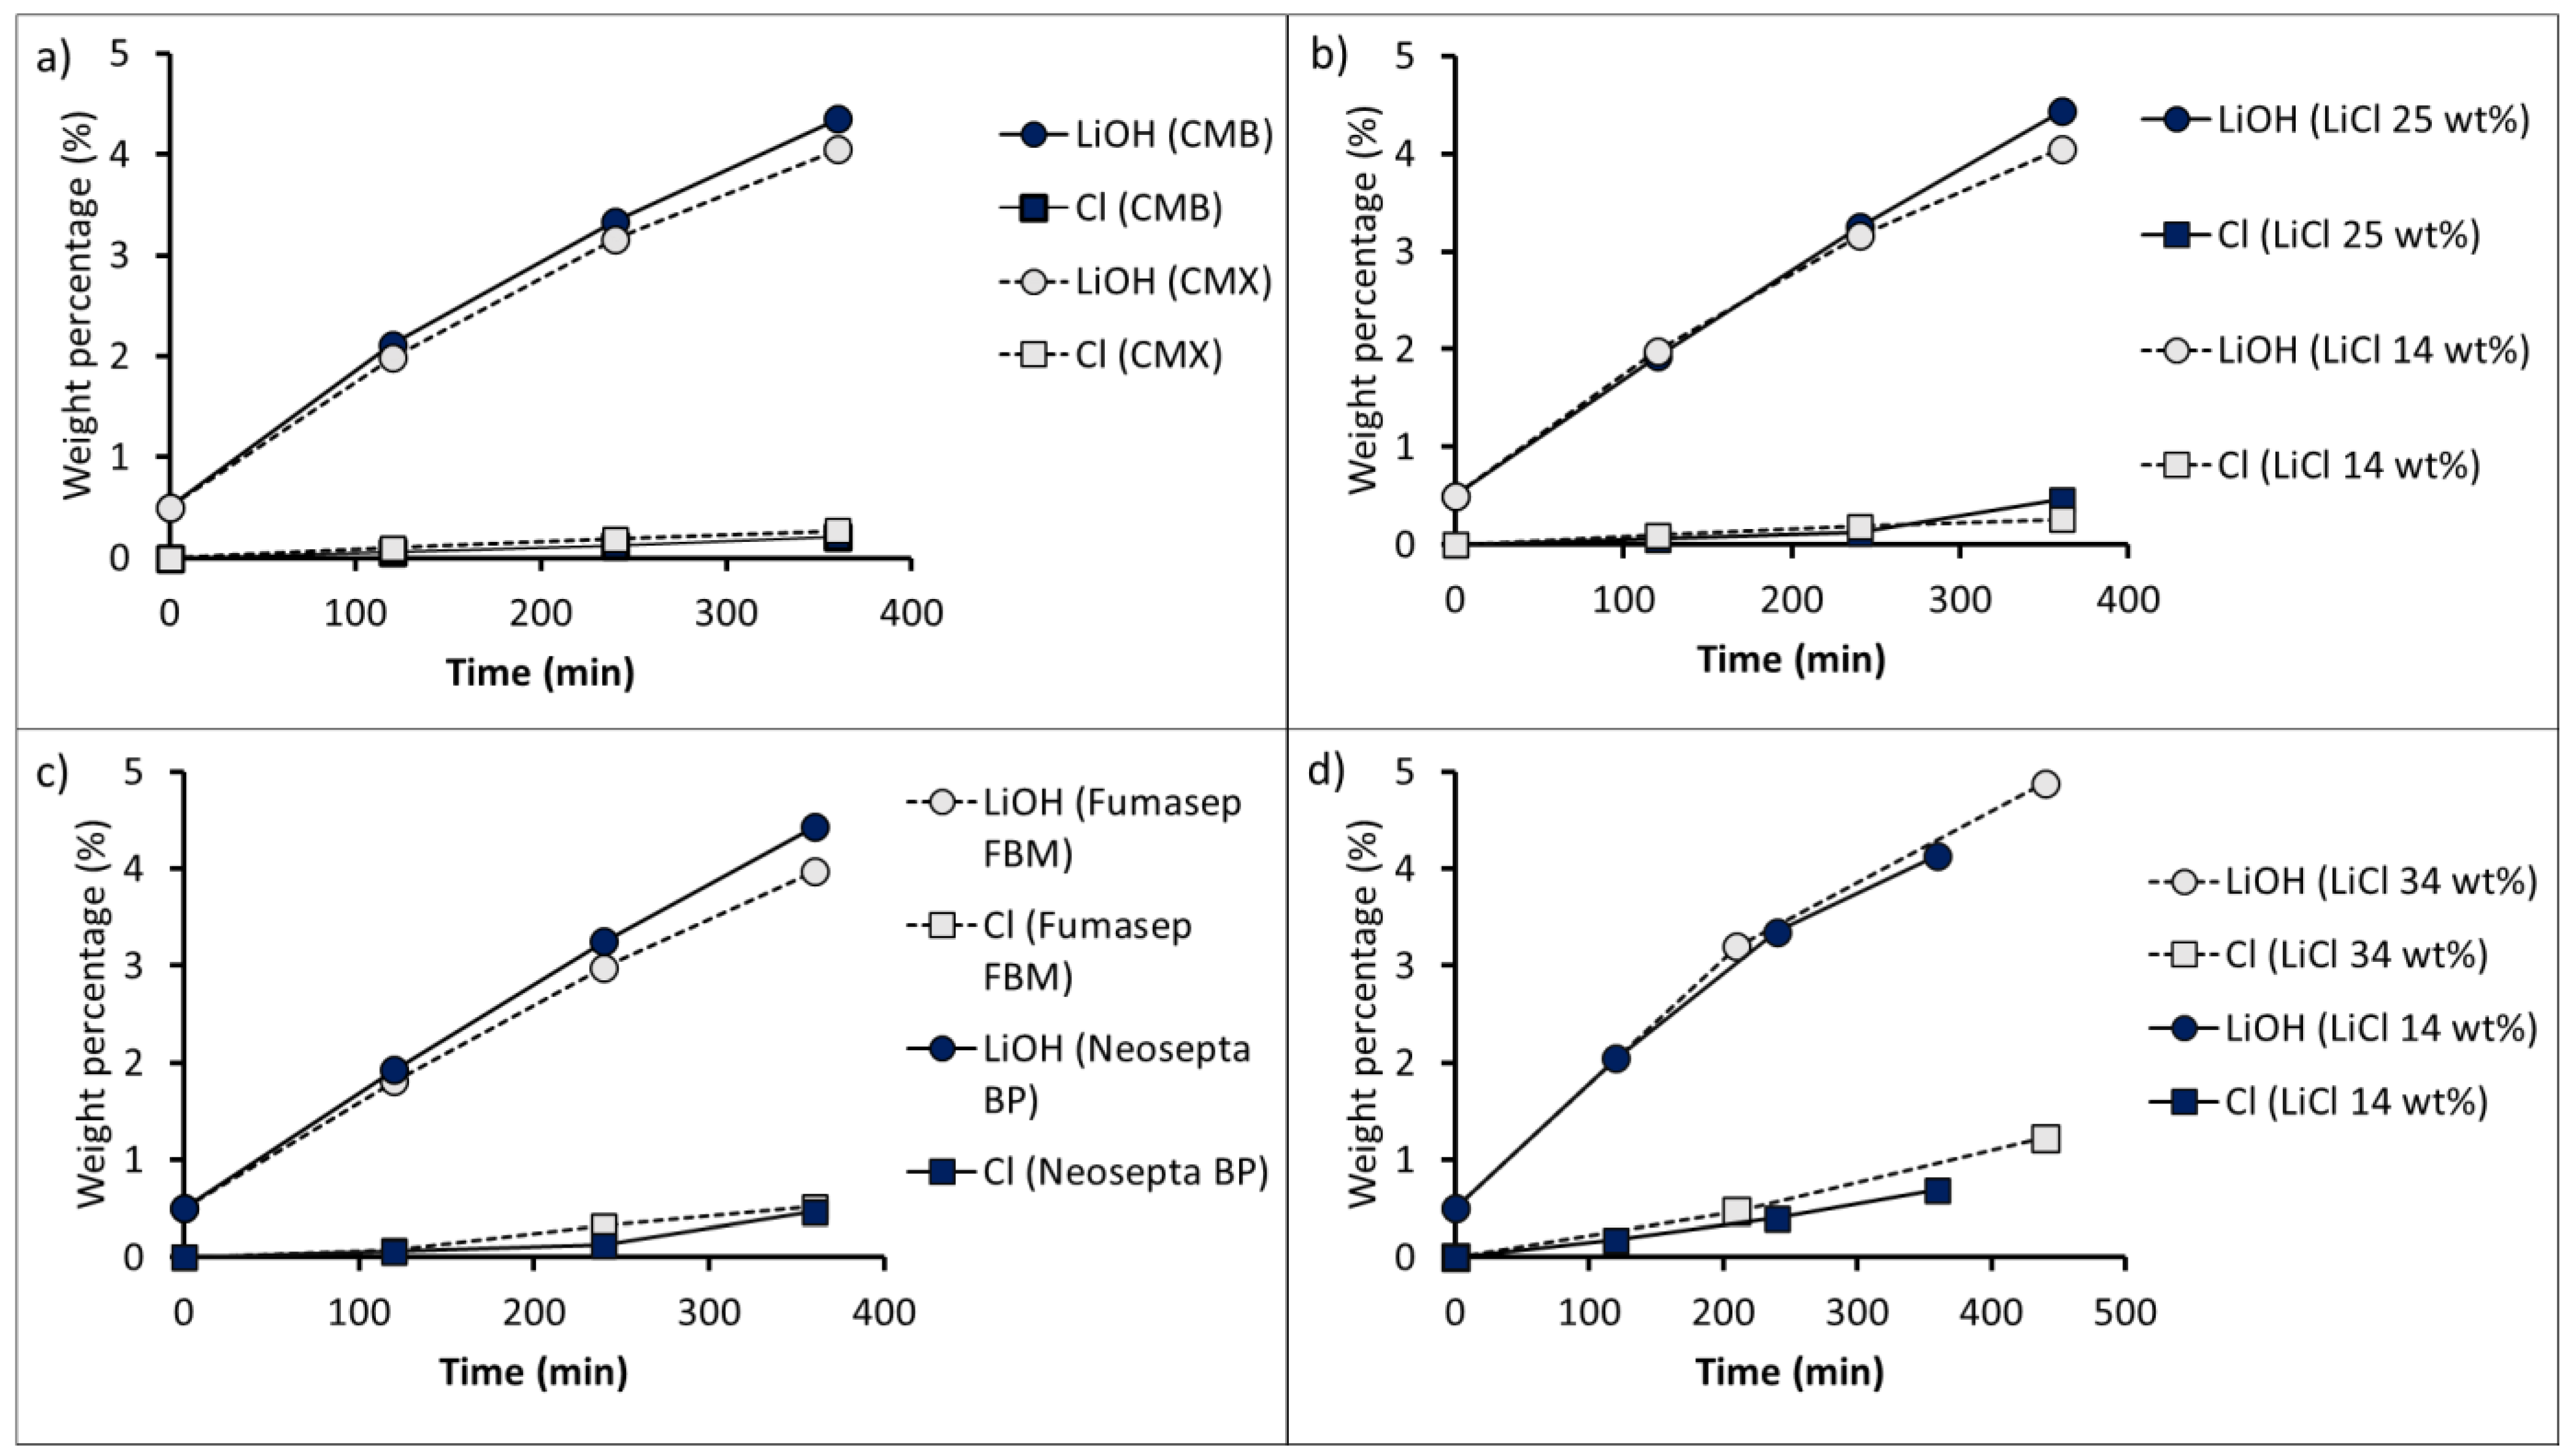
3.4.1. Product Purity
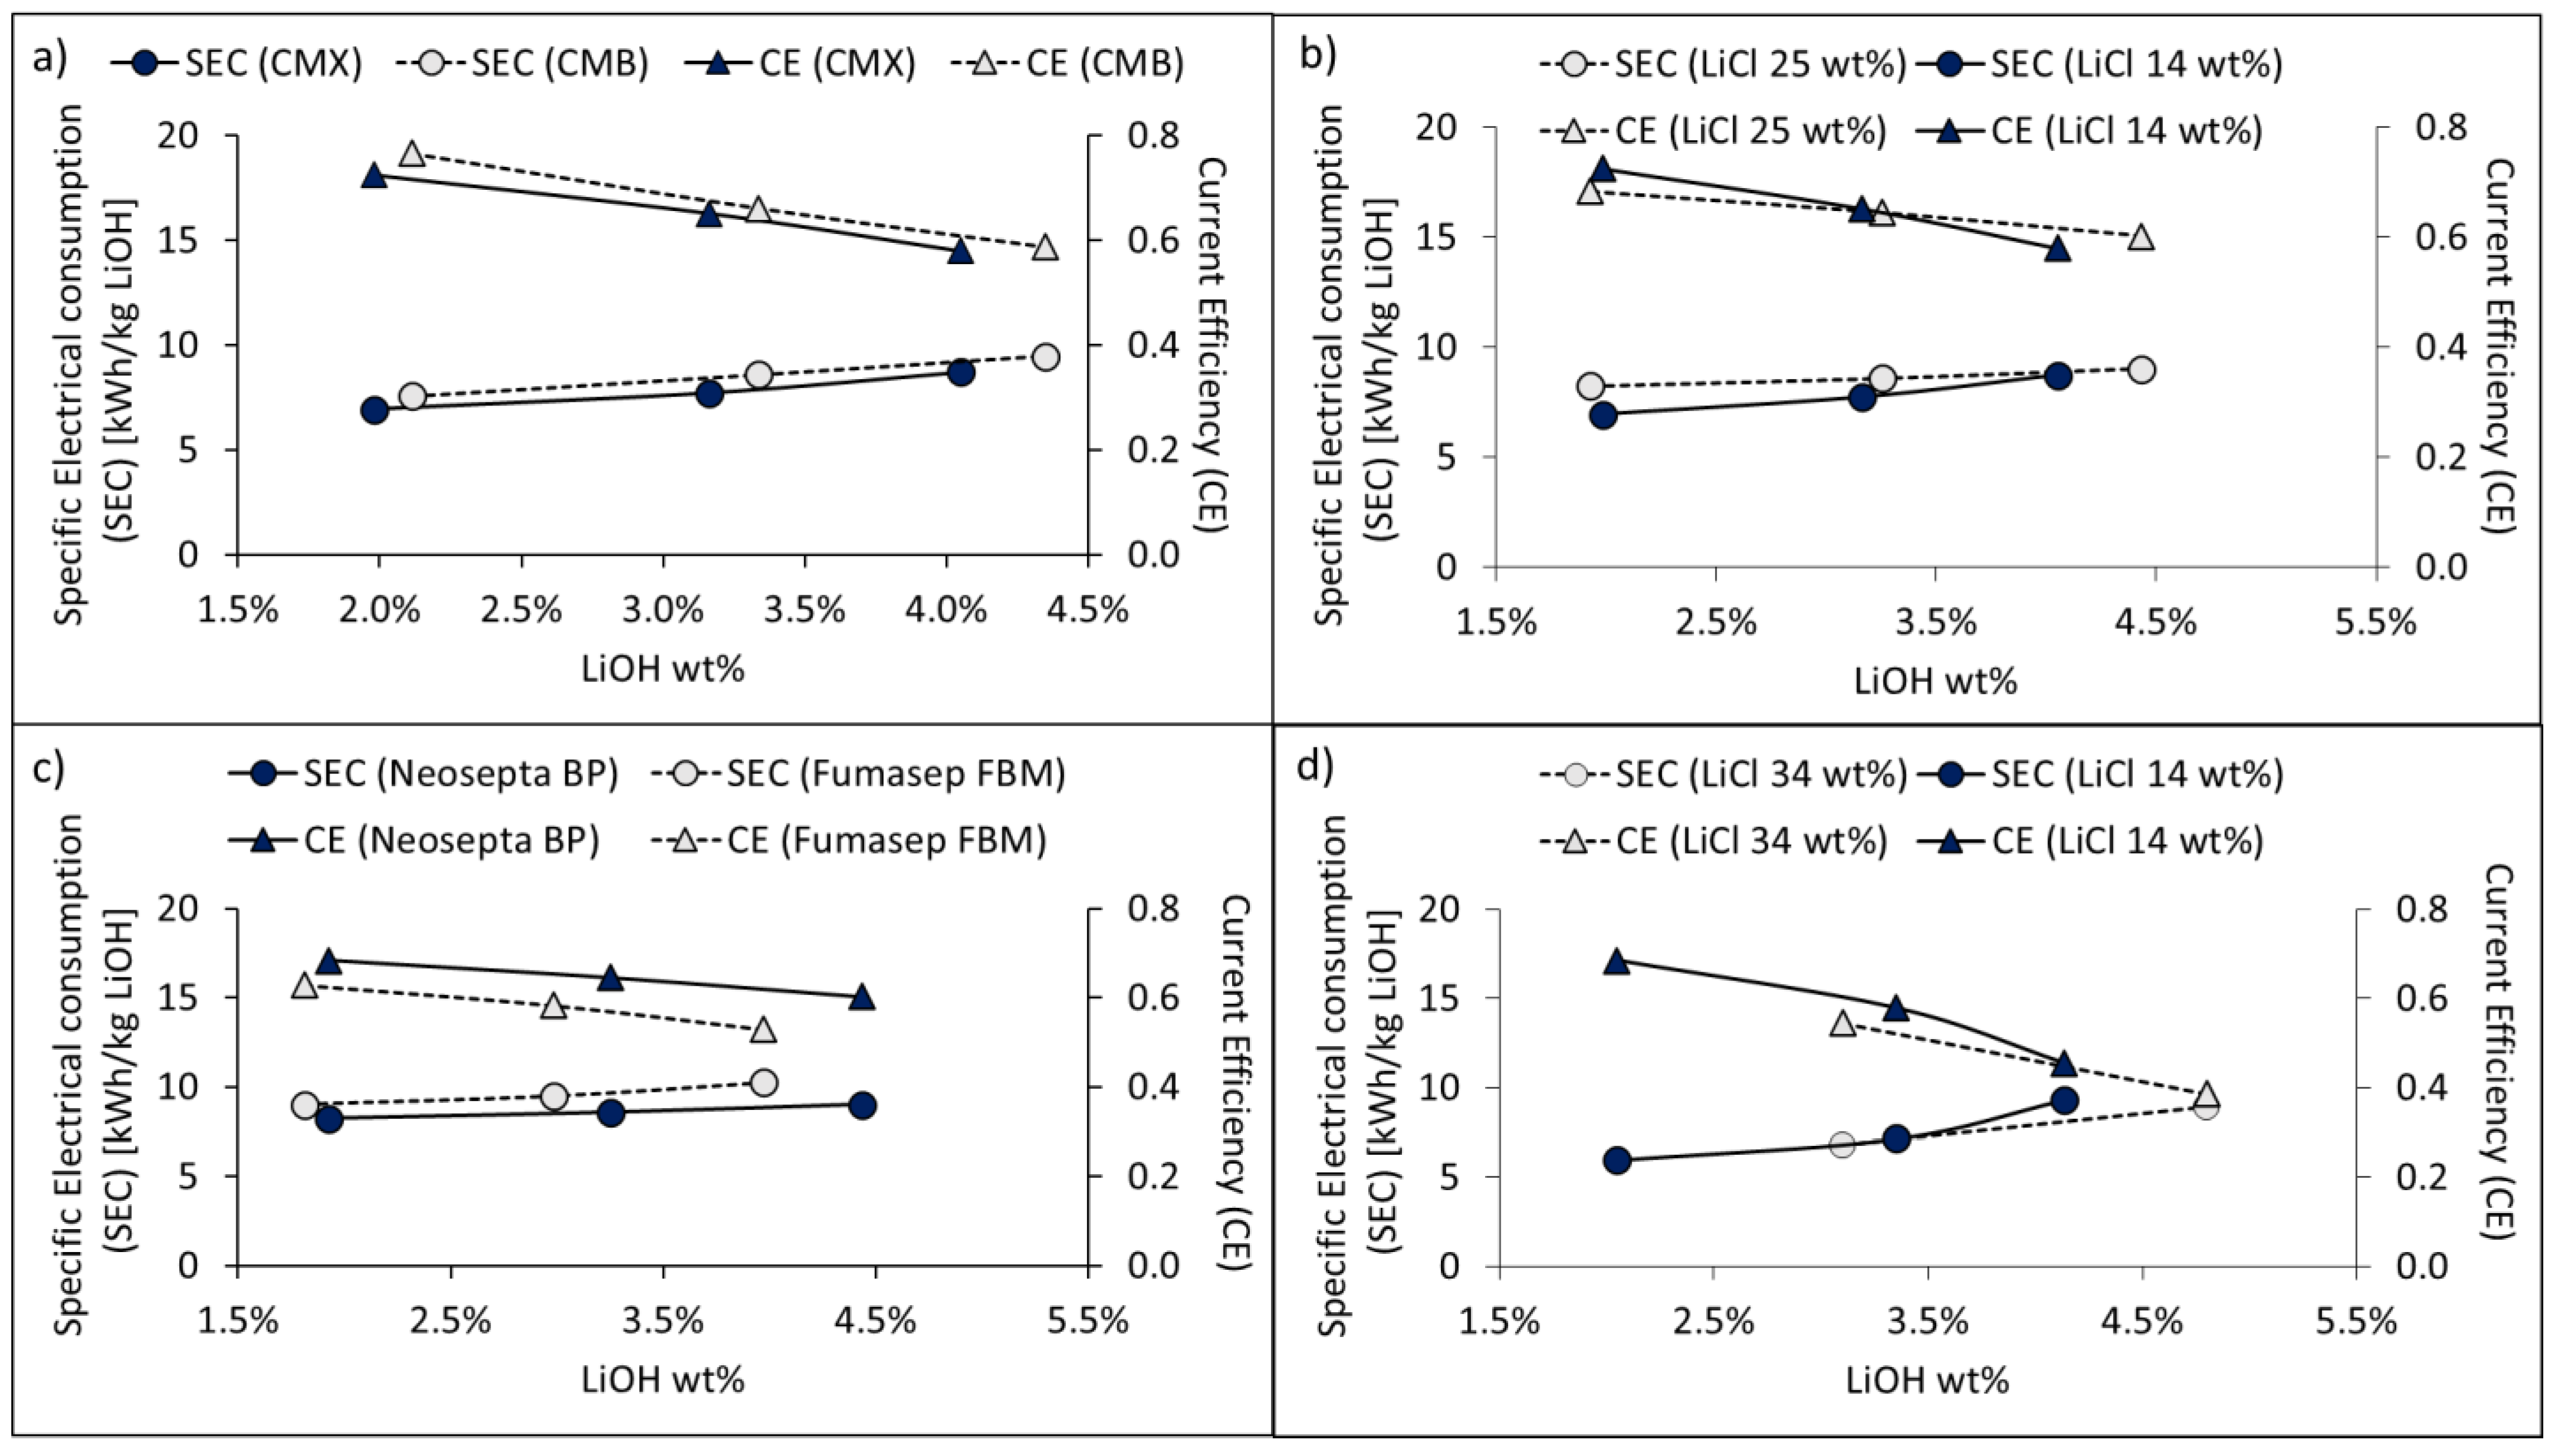
3.4.2. SEC and Current Efficiency
3.4.3. Specific Electricity Consumption (SEC) Comparison
4. Future Challenges
5. Conclusions
Author Contributions
Funding
Institutional Review Board Statement
Informed Consent Statement
Data Availability Statement
Acknowledgments
Conflicts of Interest
References
- Zybert, M.; Ronduda, H.; Szczęsna, A.; Trzeciak, T.; Ostrowski, A.; Żero, E.; Wieczorek, W.; Raróg-Pilecka, W.; Marcinek, M. Different strategies of introduction of lithium ions into nickel-manganese-cobalt carbonate resulting in LiNi0.6Mn0.2Co0.2O2 (NMC622) cathode material for Li-ion batteries. Solid State Ion. 2020, 348, 115273. [Google Scholar] [CrossRef]
- Li, H.; Eksteen, J.; Kuang, G. Recovery of lithium from mineral resources: State-of-the-art and perspectives—A review. Hydrometallurgy 2019, 189, 105129. [Google Scholar] [CrossRef]
- Cochilco.cl. Oferta y Demanda de Litio Hacia el 2030. Available online: https://www.cochilco.cl/Mercado%20de%20Metales/Produccion%20y%20consumo%20de%20litio%20hacia%20el%202030.pdf (accessed on 16 July 2021).
- Li, H.; Cormier, M.; Zhang, N.; Inglis, J.; Li, J.; Dahn, J. Is cobalt needed in Ni-rich positive electrode materials for lithium ion batteries? J. Electrochem. Soc. 2019, 166, A429–A439. [Google Scholar] [CrossRef]
- Kim, J.; Scheers, J.; Hwang, G.; Zhao, X.; Kang, S.; Johansson, P.; Ahn, J.; Jacobsson, P. Role of lithium precursor in the structure and electrochemical performance of LiFePO4. Scr. Mater. 2013, 69, 716–719. [Google Scholar] [CrossRef]
- Liu, A.; Liu, Y.; Hu, Z.; Gao, G.; Xu, Y.; Lei, L. Electrochemical performance of LiFePO4/C synthesized by solid state reaction using different lithium and iron sources. J. Phys. Chem. Solids 2011, 72, 831–835. [Google Scholar] [CrossRef]
- Fitch, B.; Yakovleva, M.; Meiere, S. Lithium hydroxide based performance improvements for nickel rich ncm layered cathode material. ECS Meet. Abstr. 2016. [Google Scholar] [CrossRef]
- Garrett, D. Handbook of Lithium and Natural Calcium Chloride; Elsevier: Amsterdam, The Netherlands, 2007; pp. 1–235. [Google Scholar]
- Grágeda, M.; González, A.; Alavia, W.; Ushak, S. Development and optimización of a modified process for producing the battery grade LiOH: Optimization of energy and water consumption. Energy 2015, 89, 667–677. [Google Scholar] [CrossRef]
- Chagnes, A. Lithium Process Chemistry: Resources, Extraction, Batteries, and Recycling; Elsevier Science: Amsterdam, The Netherlands, 2015. [Google Scholar]
- Pourcelly, G. Electrodialysis with bipolar membranes: Principles, optimization, and applications. Russ. J. Electrochem. 2002, 38, 919–926. [Google Scholar] [CrossRef]
- Koter, S.; Warszawski, A. A new model for characterization of bipolar membrane electrodialysis of brine. Desalination 2006, 198, 111–123. [Google Scholar] [CrossRef]
- Ghyselbrecht, K.; Silva, A.; van der Bruggen, B.; Boussu, K.; Meesschaert, B.; Pinoy, L. Desalination feasibility study of an industrial NaCl stream by bipolar membrane electrodialysis. J. Environ. Manag. 2014, 140, 69–75. [Google Scholar] [CrossRef] [PubMed]
- Reig, M.; Casas, S.; Valderrama, C.; Gibert, O.; Cortina, J. Integration of monopolar and bipolar electrodialysis for valorization of seawater reverse osmosis desalination brines: Production of strong acid and base. Desalination 2016, 398, 87–97. [Google Scholar] [CrossRef] [Green Version]
- Fernandez-Gonzalez, C.; Dominguez-Ramos, A.; Ibañez, R.; Chen, Y.; Irabien, A. Valorization of desalination brines by electrodialysis with bipolar membranes using nanocomposite anion exchange membranes. Desalination 2016, 406, 16–24. [Google Scholar] [CrossRef] [Green Version]
- Chen, B.; Jiang, C.; Wang, Y.; Fu, R.; Liu, Z.; Xu, T. Selectrodialysis with bipolar membrane for the reclamation of concentrated brine from RO plant. Desalination 2018, 442, 8–15. [Google Scholar] [CrossRef]
- Zabolotskii, V.; Sheldeshov, N.; Melnikov, S. Heterogeneous bipolar membranes and their application in electrodialysis. Desalination 2014, 342, 183–203. [Google Scholar] [CrossRef]
- Wei, Y.; Wang, Y.; Zhang, X.; Xu, T. Comparative study on regenerating sodium hydroxide from the spent caustic by bipolar membrane electrodialysis (BMED) and electro-electrodialysis (EED). Sep. Purif. Technol. 2013, 118, 1–5. [Google Scholar] [CrossRef]
- Ye, W.; Huang, J.; Lin, J.; Zhang, X.; Shen, J.; Luis, P.; van der Bruggen, B. Environmental evaluation of bipolar membrane electrodialysis for NaOH production from wastewater: Conditioning NaOH as a CO2 absorbent. Sep. Purif. Technol. 2015, 144, 206–214. [Google Scholar] [CrossRef]
- Sun, M.; Li, M.; Zhang, X.; Wu, C.; Wu, Y. Graphene oxide modified porous P84 co-polyimide membranes for boron recovery by bipolar membrane electrodialysis process. Sep. Purif. Technol. 2020, 232, 115963. [Google Scholar] [CrossRef]
- Hwang, C.W.; Jeong, M.H.; Kim, Y.J.; Son, W.K.; Kang, K.S.; Lee, C.S.; Hwang, T.S. Process design for lithium recovery using bipolar membrane electrodialysis system. Sep. Purif. Technol. 2016, 166, 34–40. [Google Scholar] [CrossRef]
- Sun, X.; Lu, H.; Wang, J. Recovery of citric acid from fermented liquid by bipolar membrane electrodialysis. J. Clean. Prod. 2017, 143, 250–256. [Google Scholar] [CrossRef]
- Parsa, N.; Moheb, A.; Mehrabani-Zeinabad, A.; Masigol, M. Recovery of lithium ions from sodium-contaminated lithium bromide solution by using electrodialysis process. Chem. Eng. Res. Des. 2015, 98, 81–88. [Google Scholar] [CrossRef]
- Iizuka, A.; Yamashita, Y.; Nagasawa, H.; Yamasaki, A.; Yanagisawa, Y. Separation of lithium and cobalt from waste lithium-ion batteries via bipolar membrane electrodialysis coupled with chelation. Sep. Purif. Technol. 2013, 113, 33–41. [Google Scholar] [CrossRef]
- Bunani, S.; Arda, M.; Kabay, N.; Yoshizuka, K.; Nishihama, S. Effect of process conditions on recovery of lithium and boron from water using bipolar membrane electrodialysis (BMED). Desalination 2017, 416, 10–15. [Google Scholar] [CrossRef]
- Bunani, S.; Yoshizuka, K.; Nishihama, S.; Arda, M.; Kabay, N. Application of bipolar membrane electrodialysis (BMED) for simultaneous separation and recovery of boron and lithium from aqueous solutions. Desalination 2017, 424, 37–44. [Google Scholar] [CrossRef]
- Pärnamäe, R.; Mareev, S.; Nikonenko, V.; Melnikov, S.; Sheldeshov, N.; Zabolotskii, V.; Hamelers, H.; Tedesco, M. Bipolar membranes: A review on principles, latest developments, and applications. J. Membr. Sci. 2021, 617, 118538. [Google Scholar] [CrossRef]
- Melnikov, S.; Sheldeshov, N.; Zabolotsky, V.; Loza, S.; Achoh, A. Pilot scale complex electrodialysis technology for processing a solution of lithium chloride containing organic solvents. Sep. Purif. Technol. 2017, 189, 74–81. [Google Scholar] [CrossRef]
- Grageda, M.; Gonzalez, A.; Quispe, A.; Ushak, S. Analysis of a process for producing battery grade lithium hydroxide by membrane electrodialysis. Membranes 2020, 10, 198. [Google Scholar] [CrossRef] [PubMed]
- Ryabtsev, A.; Nemkov, N.; Kotsupalo, N.; Serikova, L. Preparation of high-purity lithium hydroxide monohydrate from technical-grade lithium carbonate by membrane electrolysis. Russ. J. Appl. Chem. 2004, 77, 1108–1116. [Google Scholar] [CrossRef]
- Jiang, C.; Wang, Y.; Wang, Q.; Feng, H.; Xu, T. Production of lithium hydroxide from lake brines through electro–electrodialysis with bipolar membranes (EEDBM). Ind. Eng. Chem. Res. 2014, 53, 6103–6112. [Google Scholar] [CrossRef]
- Yang, Y.; Gao, X.; Fan, A.; Fu, L.; Gao, C. An innovative beneficial reuse of seawater concentrate using bipolar membrane electrodialysis. J. Membr. Sci. 2014, 449, 119–126. [Google Scholar] [CrossRef]
- Herrero-Gonzalez, M.; Diaz-Guridi, P.; Dominguez-Ramos, A.; Ibañez, R.; Irabien, A. Photovoltaic solar electrodialysis with bipolar membranes. Desalination 2018, 433, 155–163. [Google Scholar] [CrossRef]
- Ghyselbrecht, K.; Huygebaert, M.; van der Bruggen, B.; Ballet, R.; Meesschaert, B.; Pinoy, L. Desalination of an industrial saline water with conventional and bipolar membrane electrodialysis. Desalination 2013, 318, 9–18. [Google Scholar] [CrossRef]
- Jiang, C.; Wang, Q.; Zhang, Y.; Li, Y.; Wang, Y.; Xu, T. Separation of methionine from the mixture with sodium carbonate using bipolar membrane electrodialysis. J. Membr. Sci. 2016, 498, 48–56. [Google Scholar] [CrossRef]
- Grágeda, M.; González, A.; Grágeda, M.; Ushak, S. Purification of brines by chemical precipitation and ion-exchange processes for obtaining battery-grade lithium compounds. Int. J. Energy Res. 2018, 42, 2386–2399. [Google Scholar] [CrossRef]
- Hayes, T.; Severin, B. Electrodialysis of highly concentrated brines: Effects of calcium. Sep. Purif. Technol. 2017, 175, 443–453. [Google Scholar] [CrossRef] [Green Version]
- ASTOM Corporation. Available online: http://www.astom-corp.jp/en/catalog/pdf/Astom_Products_Catalogue.pdf (accessed on 18 July 2021).
- Kentish, S.; Kloester, E.; Stevens, G.; Scholes, C.; Dumée, L. Electrodialysis in aqueous-organic mixtures. Sep. Purif. Rev. 2014, 44, 269–282. [Google Scholar] [CrossRef]
- Jaime-Ferrer, J.S.; Couallier, E.; Viers, P.; Durand, G.; Rakib, M. Three-compartment bipolar membrane electrodialysis for splitting of sodium formate into formic acid and sodium hydroxide: Role of diffusion of molecular acid. J. Membr. Sci. 2008, 325, 528–536. [Google Scholar] [CrossRef] [Green Version]
- Sarapulova, V.; Shkorkina, I.; Mareev, S.; Pismenskaya, N.; Kononenko, N.; Larchet, C.; Dammak, L.; Nikonenko, V. Transport characteristics of fujifilm ion-exchange membranes as compared to homogeneous membranes AMX and CMX and to heterogeneous membranes MK-40 and MA-41. Membranes 2019, 9, 84. [Google Scholar] [CrossRef] [PubMed] [Green Version]
- Fuelcellstore.com. Available online: https://www.fuelcellstore.com/spec-sheets/fumasep-fbm-pk-technical-specifications.pdf (accessed on 18 July 2021).
- Products—Fumatech GmbH. Available online: https://www.fumatech.com/EN/Membranes/Water+treatment/Products+fumasep/ (accessed on 21 July 2021).
- Balster, J.; Sumbharaju, R.; Srikantharajah, S.; Pünt, I.; Stamatialis, D.; Jordan, V.; Wessling, M. Asymmetric bipolar membrane: A tool to improve product purity. J. Membr. Sci. 2007, 287, 246–256. [Google Scholar] [CrossRef]
- Israelachvili, J. Interactions involving polar molecules. Intermol. Surf. Forces 2011, 71–90. [Google Scholar] [CrossRef]
- Kamcev, J.; Paul, D.; Freeman, B. Ion activity coefficients in ion exchange polymers: Applicability of manning’s counterion condensation theory. Macromolecules 2015, 48, 8011–8024. [Google Scholar] [CrossRef]
- Izquierdo-Gil, M.; Barragán, V.; Villaluenga, J.; Godino, M. Water uptake and salt transport through Nafion cation-exchange membranes with different thicknesses. Chem. Eng. Sci. 2012, 72, 1–9. [Google Scholar] [CrossRef]
- Strathmann, H. Ion-Exchange Membrane Separation Processes; Elsevier: Amsterdam, The Netherlands, 2004. [Google Scholar]
- Hu, J.; Zhang, H.; Xu, W.; Yuan, Z.; Li, X. Mechanism and transfer behavior of ions in Nafion membranes under alkaline media. J. Membr. Sci. 2018, 566, 8–14. [Google Scholar] [CrossRef]
- Kamcev, J.; Galizia, M.; Benedetti, F.; Jang, E.; Paul, D.; Freeman, B.; Manning, G. Partitioning of mobile ions between ion exchange polymers and aqueous salt solutions: Importance of counter-ion condensation. Phys. Chem. Chem. Phys. 2016, 18, 6021–6031. [Google Scholar] [CrossRef]
- Kamcev, J.; Paul, D.; Manning, G.; Freeman, B. Ion diffusion coefficients in ion exchange membranes: Significance of counterion condensation. Macromolecules 2018, 51, 5519–5529. [Google Scholar] [CrossRef]
- Luo, H.; Agata, W.; Geise, G. Connecting the ion separation factor to the sorption and diffusion selectivity of ion exchange membranes. Ind. Eng. Chem. Res. 2020, 59, 14189–14206. [Google Scholar] [CrossRef]
- Fu, L.; Gao, X.; Yang, Y.; Aiyong, F.; Hao, H.; Gao, C. Preparation of succinic acid using bipolar membrane electrodialysis. Sep. Purif. Technol. 2014, 127, 212–218. [Google Scholar] [CrossRef]
- Gimmi, T.; Alt-Epping, P. Simulating Donnan equilibria based on the Nernst-Planck equation. Geochim. Cosmochim. Acta 2018, 232, 1–13. [Google Scholar] [CrossRef]
- Wang, Y.; Wang, A.; Zhang, X.; Xu, T. Simulation of electrodialysis with bipolar membranes: Estimation of process performance and energy consumption. Ind. Eng. Chem. Res. 2011, 50, 13911–13921. [Google Scholar] [CrossRef]
- Aritomi, T.; van den Boomgaard, T.; Strathmann, H. Current-voltage curve of a bipolar membrane at high current density. Desalination 1996, 104, 13–18. [Google Scholar] [CrossRef] [Green Version]
- Peng, J.; Zawodzinski, T. Describing ion exchange membrane-electrolyte interactions for high electrolyte concentrations used in electrochemical reactors. J. Membr. Sci. 2020, 593, 117340. [Google Scholar] [CrossRef]
- Avci, A.; Rijnaarts, T.; Fontananova, E.; Di Profio, G.; Vankelecom, I.; De Vos, W.; Curcio, E. Sulfonated polyethersulfone based cation exchange membranes for reverse electrodialysis under high salinity gradients. J. Membr. Sci. 2020, 595, 117585. [Google Scholar] [CrossRef]
- Simons, R. Preparation of a high-performance bipolar membrane. J. Membr. Sci. 1993, 78, 13–23. [Google Scholar] [CrossRef]
- Wang, Q.; Wu, B.; Jiang, C.; Wang, Y.; Xu, T. Improving the water dissociation efficiency in a bipolar membrane with amino-functionalized MIL-101. J. Membr. Sci. 2017, 524, 370–376. [Google Scholar] [CrossRef]
- Xu, J.; Amorim, I.; Li, Y.; Li, J.; Yu, Z.; Zhang, B.; Araujo, A.; Zhang, N.; Liu, L. Stable overall water splitting in an asymmetric acid/alkaline electrolyzer comprising a bipolar membrane sandwiched by bifunctional cobalt-nickel phosphide nanowire electrodes. Carbon Energy 2020, 2, 646–655. [Google Scholar] [CrossRef]
- Chabi, S.; Wright, A.; Holdcroft, S.; Freund, M. Transparent bipolar membrane for water splitting applications. ACS Appl. Mater. Interfaces 2017, 9, 26749–26755. [Google Scholar] [CrossRef]
- Wu, X.; Gong, Y.; Xu, S.; Yan, Z.; Zhang, X.; Yang, S. Electrical conductivity of lithium chloride, lithium bromide, and lithium iodide electrolytes in methanol, water, and their binary mixtures. J. Chem. Eng. Data 2019, 64, 4319–4329. [Google Scholar] [CrossRef]
- Zhao, Y.; Wang, H.; Li, Y.; Wang, M.; Xiang, X. An integrated membrane process for preparation of lithium hydroxide from high Mg/Li ratio salt lake brine. Desalination 2020, 493, 114620. [Google Scholar] [CrossRef]
- Chen, X.; Ruan, X.; Kentish, S.; Li, G.; Xu, T.; Chen, G. Production of lithium hydroxide by electrodialysis with bipolar membranes. Sep. Purif. Technol. 2021, 274, 119026. [Google Scholar] [CrossRef]
- Turan, A.; Baloglu, H.; Ünveren, E.; Bulutcu, A. The behaviour of Nafion® 424 membrane in the electrochemical production of lithium hydroxide. J. Chem. Technol. Biotechnol. 2015, 91, 2529–2538. [Google Scholar] [CrossRef]
- Kelly, J.; Wang, M.; Dai, Q.; Winjobi, O. Energy, greenhouse gas, and water life cycle analysis of lithium carbonate and lithium hydroxide monohydrate from brine and ore resources and their use in lithium ion battery cathodes and lithium ion batteries. Resour. Conserv. Recycl. 2021, 174, 105762. [Google Scholar] [CrossRef]
- Yuan, B.; Wang, J.; Cai, W.; Yang, Y.; Yi, M.; Xiang, L. Effects of temperature on conversion of Li2CO3 to LiOH in Ca(OH)2 suspension. Particuology 2017, 34, 97–102. [Google Scholar] [CrossRef]
- Wilhelm, F. Optimisation strategies for the preparation of bipolar membranes with reduced salt ion leakage in acid-base electrodialysis. J. Membr. Sci. 2001, 182, 13–28. [Google Scholar] [CrossRef]
- Ji, Z.; Chen, Q.; Yuan, J.; Liu, J.; Zhao, Y.; Feng, W. Preliminary study on recovering lithium from high Mg2+/Li+ ratio brines by electrodialysis. Sep. Purif. Technol. 2017, 172, 168–177. [Google Scholar] [CrossRef]
- Nie, X.; Sun, S.; Sun, Z.; Song, X.; Yu, J. Ion-fractionation of lithium ions from magnesium ions by electrodialysis using monovalent selective ion-exchange membranes. Desalination 2017, 403, 128–135. [Google Scholar] [CrossRef]
- Zabolotsky, V.; Utin, S.; Bespalov, A.; Strelkov, V. Modification of asymmetric bipolar membranes by functionalized hyperbranched polymers and their investigation during pH correction of diluted electrolytes solutions by electrodialysis. J. Membr. Sci. 2015, 494, 188–195. [Google Scholar] [CrossRef]
- Peng, F.; Peng, S.; Huang, C.; Xu, T. Modifying bipolar membranes with palygorskite and FeCl3. J. Membr. Sci. 2008, 322, 122–127. [Google Scholar] [CrossRef]
- Gonzalez, A.; Grágeda, M.; Ushak, S. Assessment of pilot-scale water purification module with electrodialysis technology and solar energy. Appl. Energy 2017, 206, 1643–1652. [Google Scholar] [CrossRef]
- Hanel, M.; Escobar, R. Influence of solar energy resource assessment uncertainty in the levelized electricity cost of concentrated solar power plants in Chile. Renew. Energy 2013, 49, 96–100. [Google Scholar] [CrossRef]


| Characteristics | AMX | CMX | CMB |
|---|---|---|---|
| Type | Anion | Cation | Cation |
| Electrical resistance (Ω∙cm2) | 2.0–3.5 (0.5 M NaCl) | 2.5–3.5 (0.5 M NaCl) | 4.5 |
| Thickness of wet membrane (mm) | 0.14–0.18 | 0.17–0.19 | 0.21 |
| Burst pressure | 4.5–5.5 (kg/cm2) | 5–6 (kg/cm2) | ≥0.40 MPa |
| Exchange capacity (meq∙g−1) | 1.4–1.7 | 1.5–1.8 | 2.4–2.7 |
| Water content (%) | 25–30 | 25–30 | 37–42 |
| Thermal stability (°C) | 40 | 40 | 60 |
| Characteristics | Fumasep FBM [42,43] | Neosepta BP [27,38] |
|---|---|---|
| Type | Bipolar | Bipolar |
| Thickness (mm) | 0.18–0.20 (wet) 0.13–0.16 (dry) | 0.22 (wet) |
| Burst pressure | - | >0.40 MPa |
| Thermal stability (°C) | 40 | - |
| Water dissociation voltage at 100 mA∙cm−2 | <1.2 1 | 1.2 2 |
| Water dissociation efficiency at 100 mA∙cm−2 | >98% | >98% |
| Configuration | 1 | 2 | 3 | 4 | 5 | 6 |
|---|---|---|---|---|---|---|
| LiCl (wt%) | 14 | 14 | 14 | 14 | 25 | 25 |
| LiOH (wt%) | 0.5 | 2.5 | 5.0 | 8.0 | 0.5 | 5.0 |
| Configuration (a): Bipolar Membrane’s Salt Leakage | ||||||
| Test | 1 | 2 | 3 | 4 | ||
| Bipolar membrane | Fumasep FBM | Neosepta BP | Fumasep FBM | Neosepta BP | ||
| LiCl solution (wt%) | 14 | 14 | 25 | 25 | ||
| Configuration (b): Bipolar Membrane’s Apparent Electrical Resistance | ||||||
| Test | 1 | 2 | 3 | 4 | 5 | 6 |
| Bipolar membrane | Fumasep FBM | Fumasep FBM | Fumasep FBM | Neosepta BP | Neosepta BP | Neosepta BP |
| LiOH solution (wt%) | 0.5 | 2.5 | 5.0 | 0.5 | 2.5 | 5.0 |
| HCl solution (wt%) | 0.5 | 3.5 | 7.8 | 0.5 | 3.5 | 7.8 |
| Configuration (c): Cation-Exchange Membrane’s Apparent Electrical Resistance | ||||||
| Test | 1 | 2 | 3 | 4 | 5 | 6 |
| Membrane | CMX | CMX | CMX | CMB | CMB | CMB |
| LiCl solution (wt%) | 14 | 14 | 14 | 14 | 14 | 14 |
| LiOH solution (wt%) | 0.5 | 2.5 | 5.0 | 0.5 | 2.5 | 5.0 |
| Test | 1 | 2 | 3 | 4 | 5 | 6 |
|---|---|---|---|---|---|---|
| Cation membrane | CMX | CMB | CMX | CMX | CMX | CMX |
| Bipolar membrane | Neosepta BP | Neosepta BP | Neosepta BP | Fumasep FBM | Fumasep FBM | Fumasep FBM |
| Current density (A∙m−2) | 1000 | 1000 | 1000 | 1000 | 500 | 500 |
| LiCl initial concentration (wt%) | 14 | 14 | 25 | 25 | 14 | 34 |
| Time (min) | 360 | 360 | 360 | 360 | 360 | 440 |
| Number of three-compartment cells | 2 | 2 | 2 | 2 | 4 | 4 |
| Water Uptake (%) | |||||||||
|---|---|---|---|---|---|---|---|---|---|
| Solution | HCl 0.5 wt% | HCl 2.5 wt% | HCl 5.0 wt% | LiOH 0.5 wt% | LiOH 2.5 wt% | LiOH 5.0 wt% | LiCl 14 wt% | LiCl 25 wt% | LiCl 34 wt% |
| CMX | - | - | - | 31.2 ± 0.6 | 30.5 ± 0.4 | 29.5 ± 0.2 | 27.1 ± 0.0 | 20.3 ± 0.6 | 13.8 ± 0.2 |
| CMB | - | - | - | 35.9 ± 0.7 | 38.0 ± 0.8 | 37.1 ± 0.8 | 30.6 ± 0.5 | 26.5 ± 0.8 | 18.9 ± 0.7 |
| Fumasep FBM | 37.5 ± 0.3 | 48.2 ± 0.2 | 40.6 ± 0.3 | 52.1 ± 0.6 | 55.2 ± 0.0 | 53.1 ± 0.0 | - | - | - |
| Neosepta BP | 31.1 ± 0.7 | 30.9 ± 0.3 | 30.4 ± 0.1 | 33.8 ± 0.4 | 35.9 ± 0.2 | 30.4 ± 0.6 | - | - | - |
| Thickness of Wet Membrane (μm) | |||||||||
|---|---|---|---|---|---|---|---|---|---|
| Solution | HCl 0.5 wt% | HCl 2.5 wt% | HCl 5.0 wt% | LiOH 0.5 wt% | LiOH 2.5 wt% | LiOH 5.0 wt% | LiCl 14 wt% | LiCl 25 wt% | LiCl 34 wt% |
| CMX | - | - | - | 172 ± 1 | 170 ± 1 | 168 ± 1 | 167 ± 1 | 165 ± 1 | 164 ± 1 |
| CMB | - | - | - | 198 ± 2 | 198 ± 2 | 198 ± 1 | 196 ± 0 | 196 ± 1 | 195 ± 1 |
| Fumasep FBM | 176 ± 2 | 171 ± 1 | 171 ± 1 | 189 ± 1 | 191 ± 2 | 192 ± 1 | - | - | - |
| Neosepta BP | 229 ± 2 | 229 ± 1 | 230 ± 1 | 263 ± 1 | 266 ± 1 | 265 ± 2 | - | - | - |
| Test | Test 1 | Test 2 | Test 3 | Test 4 | Test 5 | Test 6 | ||||||||||||
|---|---|---|---|---|---|---|---|---|---|---|---|---|---|---|---|---|---|---|
| Cation membrane | CMX | CMB | CMX | CMX | CMX | CMX | ||||||||||||
| Bipolar membrane | Neosepta BP | Neosepta BP | Neosepta BP | Fumasep FBM | Fumasep FBM | Fumasep FBM | ||||||||||||
| Current density (A∙m−2) | 1000 | 1000 | 1000 | 1000 | 500 | 500 | ||||||||||||
| LiCl initial concentration (wt%) | 14 | 14 | 25 | 25 | 14 | 34 | ||||||||||||
| Number of unit cells | 2 | 2 | 2 | 2 | 4 | 4 | ||||||||||||
| LiOH concentration (wt%) | 1.98 | 3.16 | 4.05 | 2.11 | 3.34 | 4.35 | 1.93 | 3.25 | 4.43 | 1.81 | 2.98 | 3.97 | 2.05 | 3.35 | 4.13 | 3.10 | 4.80 | 5.20 |
| Cl− concentration in LiOH solution (wt%) | 0.10 | 0.19 | 0.26 | 0.05 | 0.13 | 0.21 | 0.06 | 0.13 | 0.46 | 0.07 | 0.32 | 0.52 | 0.18 | 0.40 | 0.69 | 0.48 | 1.23 | 1.24 |
| Final purity (wt%) | 94.6 | 93.5 | 93.4 | 97.9 | 96.0 | 95.4 | 96.0 | 95.3 | 88.6 | 92.9 | 86.5 | 83.8 | 90.7 | 87.8 | 83.6 | 76.8 | 66.0 | 54.7 |
| SEC (kWh∙kg−1) | 6.94 | 7.72 | 8.71 | 7.57 | 8.58 | 9.45 | 8.23 | 8.58 | 9.01 | 8.98 | 9.46 | 10.23 | 5.97 | 7.14 | 9.29 | 6.81 | 8.92 | 11.94 |
| CE | 0.72 | 0.65 | 0.58 | 0.77 | 0.66 | 0.59 | 0.68 | 0.64 | 0.60 | 0.63 | 0.58 | 0.53 | 0.69 | 0.58 | 0.46 | 0.54 | 0.39 | 0.31 |
Publisher’s Note: MDPI stays neutral with regard to jurisdictional claims in published maps and institutional affiliations. |
© 2021 by the authors. Licensee MDPI, Basel, Switzerland. This article is an open access article distributed under the terms and conditions of the Creative Commons Attribution (CC BY) license (https://creativecommons.org/licenses/by/4.0/).
Share and Cite
González, A.; Grágeda, M.; Quispe, A.; Ushak, S.; Sistat, P.; Cretin, M. Application and Analysis of Bipolar Membrane Electrodialysis for LiOH Production at High Electrolyte Concentrations: Current Scope and Challenges. Membranes 2021, 11, 575. https://doi.org/10.3390/membranes11080575
González A, Grágeda M, Quispe A, Ushak S, Sistat P, Cretin M. Application and Analysis of Bipolar Membrane Electrodialysis for LiOH Production at High Electrolyte Concentrations: Current Scope and Challenges. Membranes. 2021; 11(8):575. https://doi.org/10.3390/membranes11080575
Chicago/Turabian StyleGonzález, Alonso, Mario Grágeda, Adrián Quispe, Svetlana Ushak, Philippe Sistat, and Marc Cretin. 2021. "Application and Analysis of Bipolar Membrane Electrodialysis for LiOH Production at High Electrolyte Concentrations: Current Scope and Challenges" Membranes 11, no. 8: 575. https://doi.org/10.3390/membranes11080575