3.1. Characterization of the Composite Membranes
The development of new methodologies for the synthesis of functional materials aimed at obtaining samples with an improved structure and characteristics is one of the promising areas of materials science. As shown in our previous studies, the concentration of carboxyl groups directly affects the degree of sensitization; thus the oxidative pretreatment results in an increase in the catalytic activity of the composite membrane compared with a sample synthesized in “etched-only” PET TeM [
35,
44]. In this study, higher efficiency properties obtained with pretreated templates were utilized in As(III) sorption.
Both types of PET templates used (“etched-only” and “oxidized”) were studied by XPS technique. High-resolution C1s and O1s spectra of oxidized and etched-only PET templates are shown in
Figure S1 of the Supplementary Material. The C1s spectrum is characterized by three peaks: C-C/C-H groups located at the binding energy of ~284.6 eV, C-OH/C-O-C groups at ~286.2 eV, and –COOH groups at ~288.6 eV. It is clear from the C1s spectra that the oxygenated C content is higher in the oxidized sample compared with the etched-only membrane. High-resolution O1s spectra have two peaks located at ~531.5 eV (O=C) and ~533.8 eV (O-C) [
37]. After oxidation, there is a relative increase in the amount of O=C species compared with oxygen atoms attached to C atom with a single covalent bond (O-C). As a result of the analysis of the surface with XPS, it is clear that after the oxidative treatment of the PET template in the H
2O
2/UV system, the oxygen content increases compared with the “etched-only” PET template.
The terminal carboxyl group concentration ([–COOH]) was determined by the toluidine blue dye assay and was calculated as 6.4 ± 0.5 and 10.8 ± 0.2 nM/cm
2 for the pristine and oxidized PET templates, respectively. The significant increase in the –COOH amount was also confirmed by the FTIR data presented in
Figure S2 of the Supplementary Material. The main difference was observed at around 1715 cm
−1 corresponding to the stretching vibrations of the C=O groups. After oxidation, the intensity of C=O peak increases due to the increasing concentration of polar carboxyl groups.
The electroless deposition of copper has been studied extensively, and a wide variety of plating solutions and various additives have previously been used in order to obtain thin copper layers or nanostructures [
45,
46,
47,
48]. As a result of the method we apply, the wall thickness and inner diameter obtained by SEM, specific surface area determined by BET analysis, and gravimetrically calculated amount of copper loaded to the sorbent are presented in
Table 1. When comparing the amount of copper loaded, it is noted that more copper deposition occurs when the oxidized PET template is used due to the increase in the functional carboxyl groups. Furthermore, the results in this table clearly show that the specific surface area of the composite prepared using the oxidized PET is significantly higher than that obtained using the etched-only template. These results are in line with the atomic force microscopy (AFM) results that will be presented later. Both increased copper loading and surface area are associated with high As(III) adsorption capacity, which is obtained in the presence of oxidized PET and will be discussed in the following sections.
As can be seen from the SEM images shown in
Figure 1, all the samples studied are porous and homogeneously covered with copper. From the SEM images of the released MTs (
Figure 1c–d), it is clear that the electroless plating of copper allows for synthesizing hollow tubular MTs with an outer diameter equal to the pore diameter of the pristine polymer template.
The chemical composition of the composite membranes was studied further by energy dispersive X-ray analysis (EDX). EDX spectra and element percentages for Cu/PET and Cu/Ox_PET samples are presented in
Figure S3 of the Supplementary Material. Strong signals from the C and O elements can be attributed to the PET template. The absence of any impurity is clear in the spectra. Additionally, in accordance with other analysis results, the amounts of the Cu and O elements in the oxidized composite structure were higher.
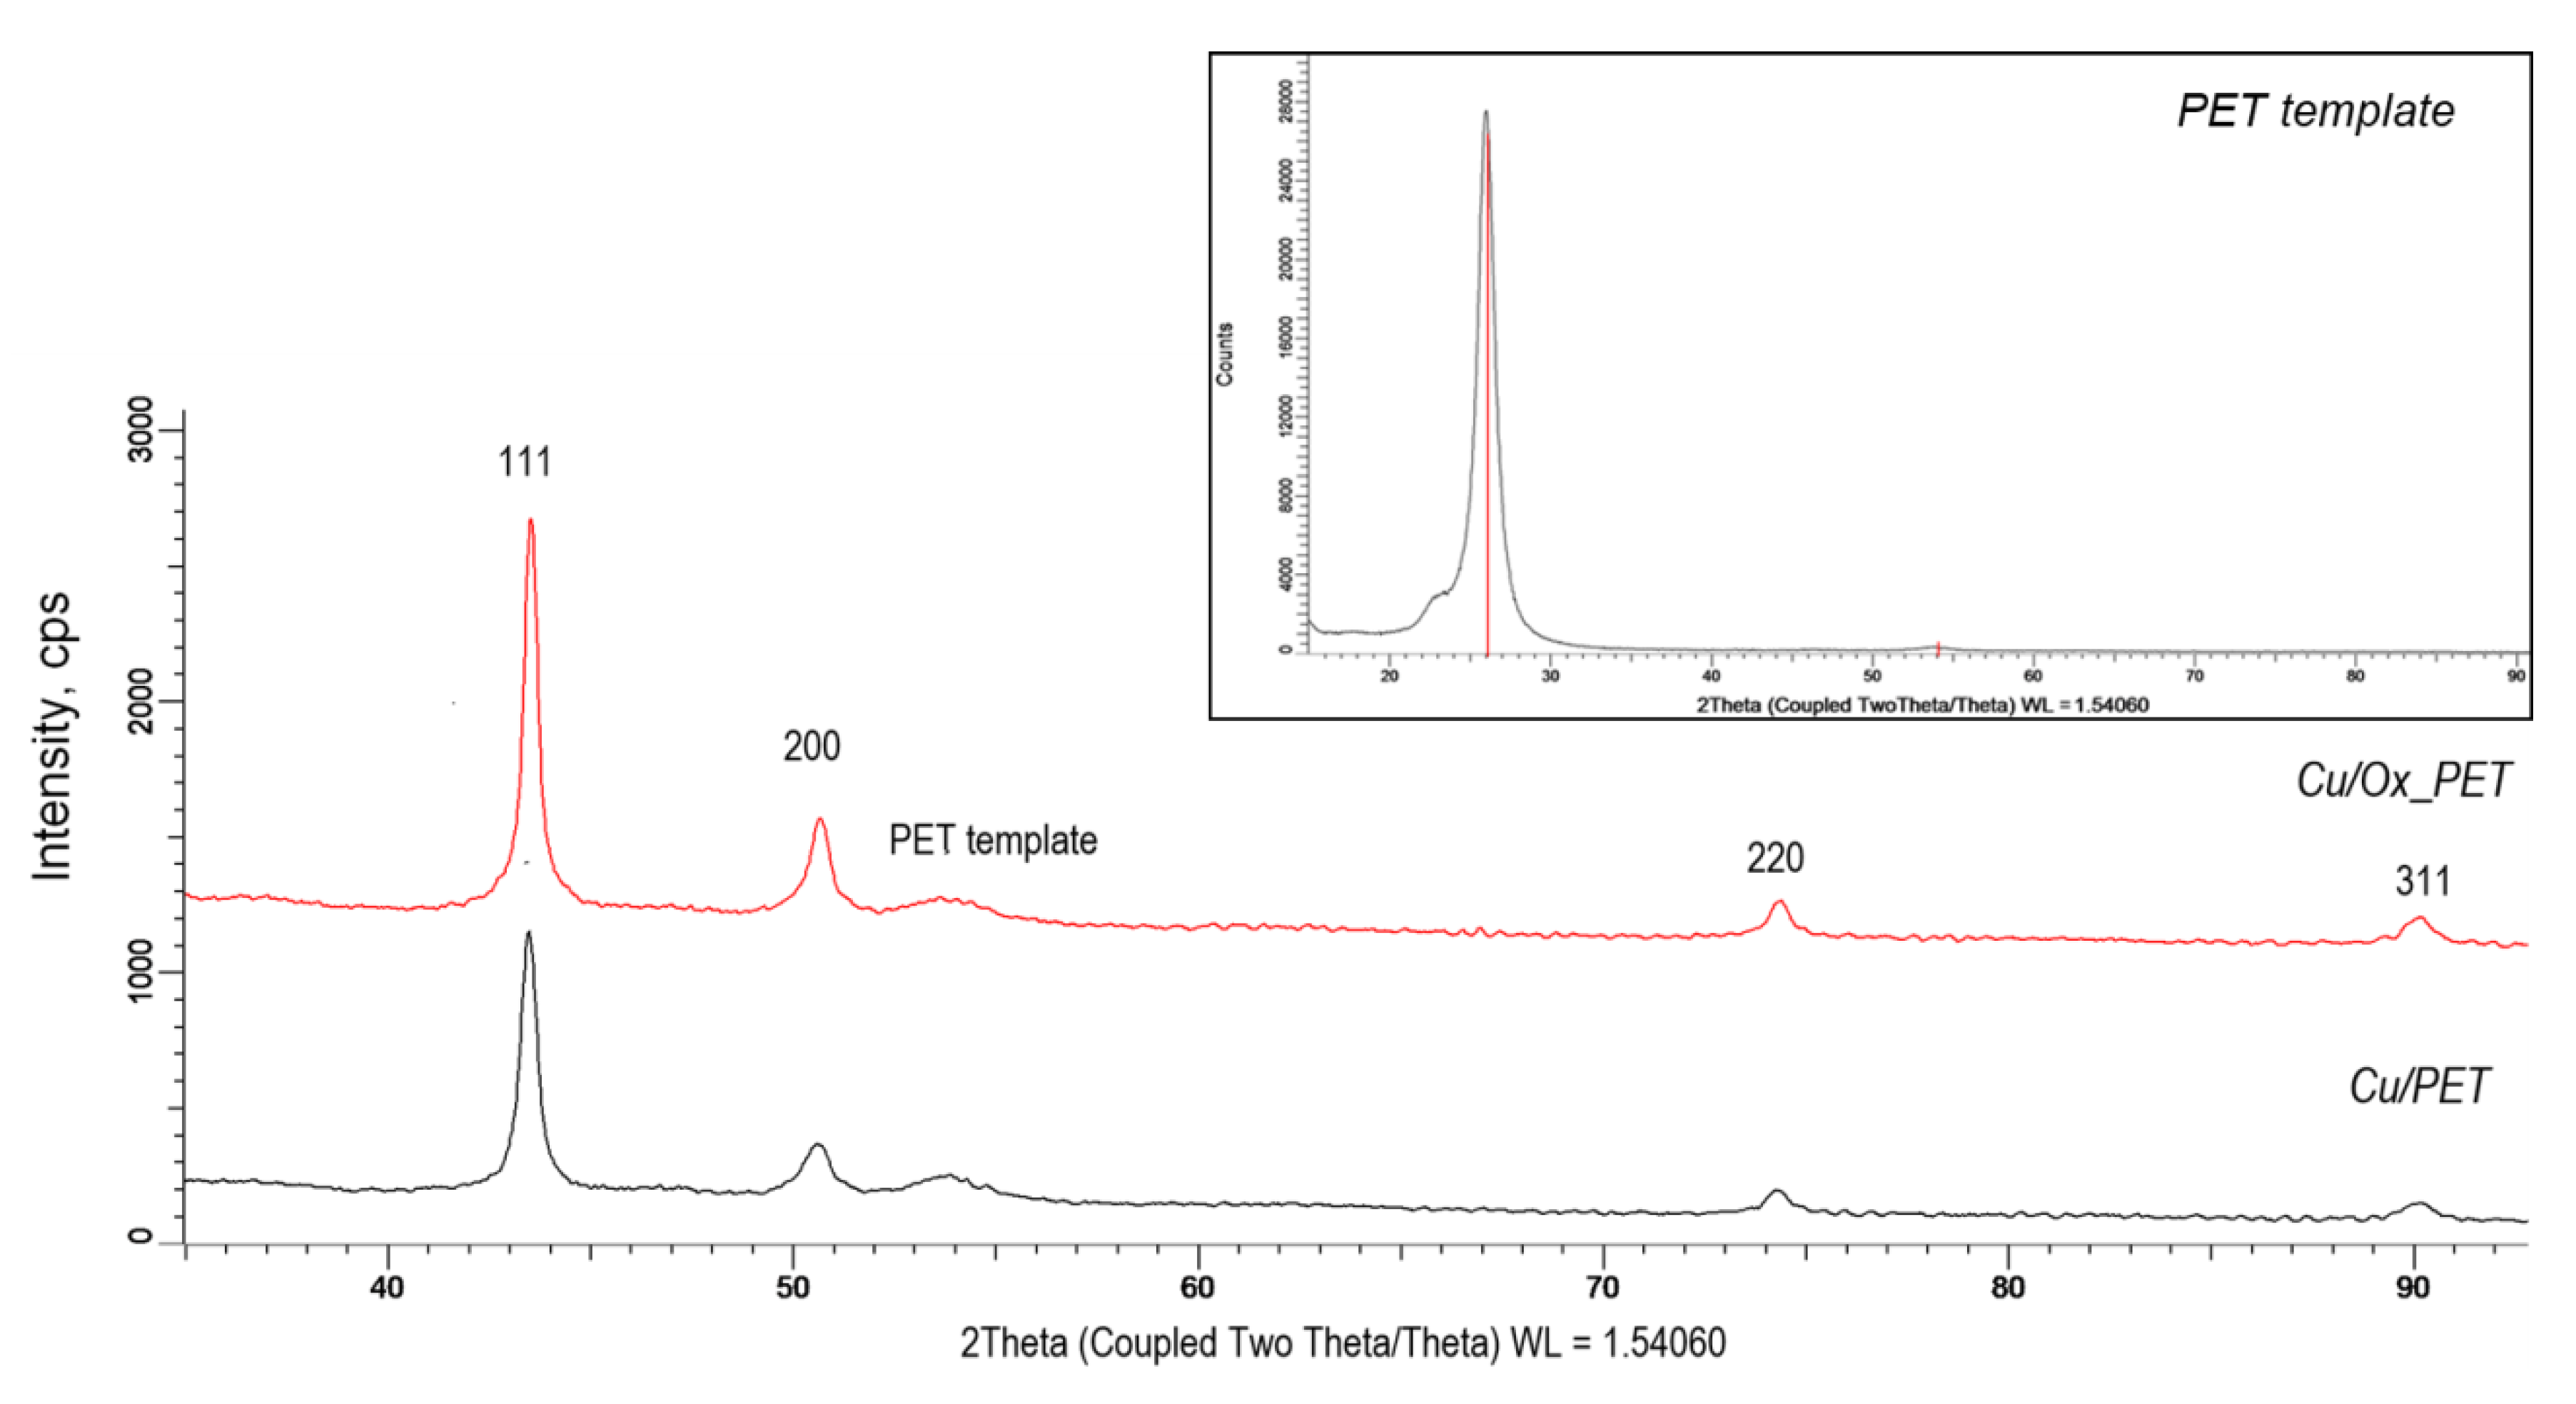
To evaluate the crystal structure and phase contents, XRD analysis of composite TeMs was carried out. As can be seen from the XRD patterns of composites (
Figure 2), four peaks (111, 200, 220, and 311) can be assigned for Cu MT arrays, which possess a polycrystalline structure with a face-centered cubic (fcc) phase without the presence of oxide compounds in the structure. An additional broad peak in the region from 53° to 56° relates to the amorphous structure of the PET template, as can be seen from the XRD pattern of the pristine PET presented in the inset of
Figure 2. The location and intensity of the peaks in the XRD diffractograms, their corresponding interplane distances, the full width at half maximum (FWHM) values, and the unit cell parameters and average crystallite sizes calculated for the studied composites are summarized in
Table 2.
According to X-ray diffraction data, the unit cell is characterized by a cubic syngony (Fm3m) with a cell parameter of a = 3.604, slightly different from the reference value (a = 3.6150, PDF #040836). A small deviation of the reference value of the unit cell parameter and the sample value can be explained by microstresses arising in the structure during synthesis process. When the lines on the diffractogram were approximated by the necessary number of symmetric pseudo-Voigt functions, the width of the registered lines at half of their height (FWHM) was measured, which allowed us to estimate the degree of perfection of the crystal structure and the degree of crystallinity (DC). For the Cu/PET and Cu/Ox_PET samples, the DC values were calculated as a 43.8% and 52.5%, respectively.
3.2. Sorption Kinetics of As(III) on Composite TeMs
Adsorption is a time-dependent process and is affected by physical/chemical interactions between the adsorbent and the adsorbate. Studying adsorption kinetics is very important to understand the adsorption mechanism of new adsorbents. To investigate the adsorption kinetics of As(III) on composite TeMs, we used three kinetic models, namely, Elovich, pseudo-first-order, and pseudo-second-order models [
49,
50,
51,
52].
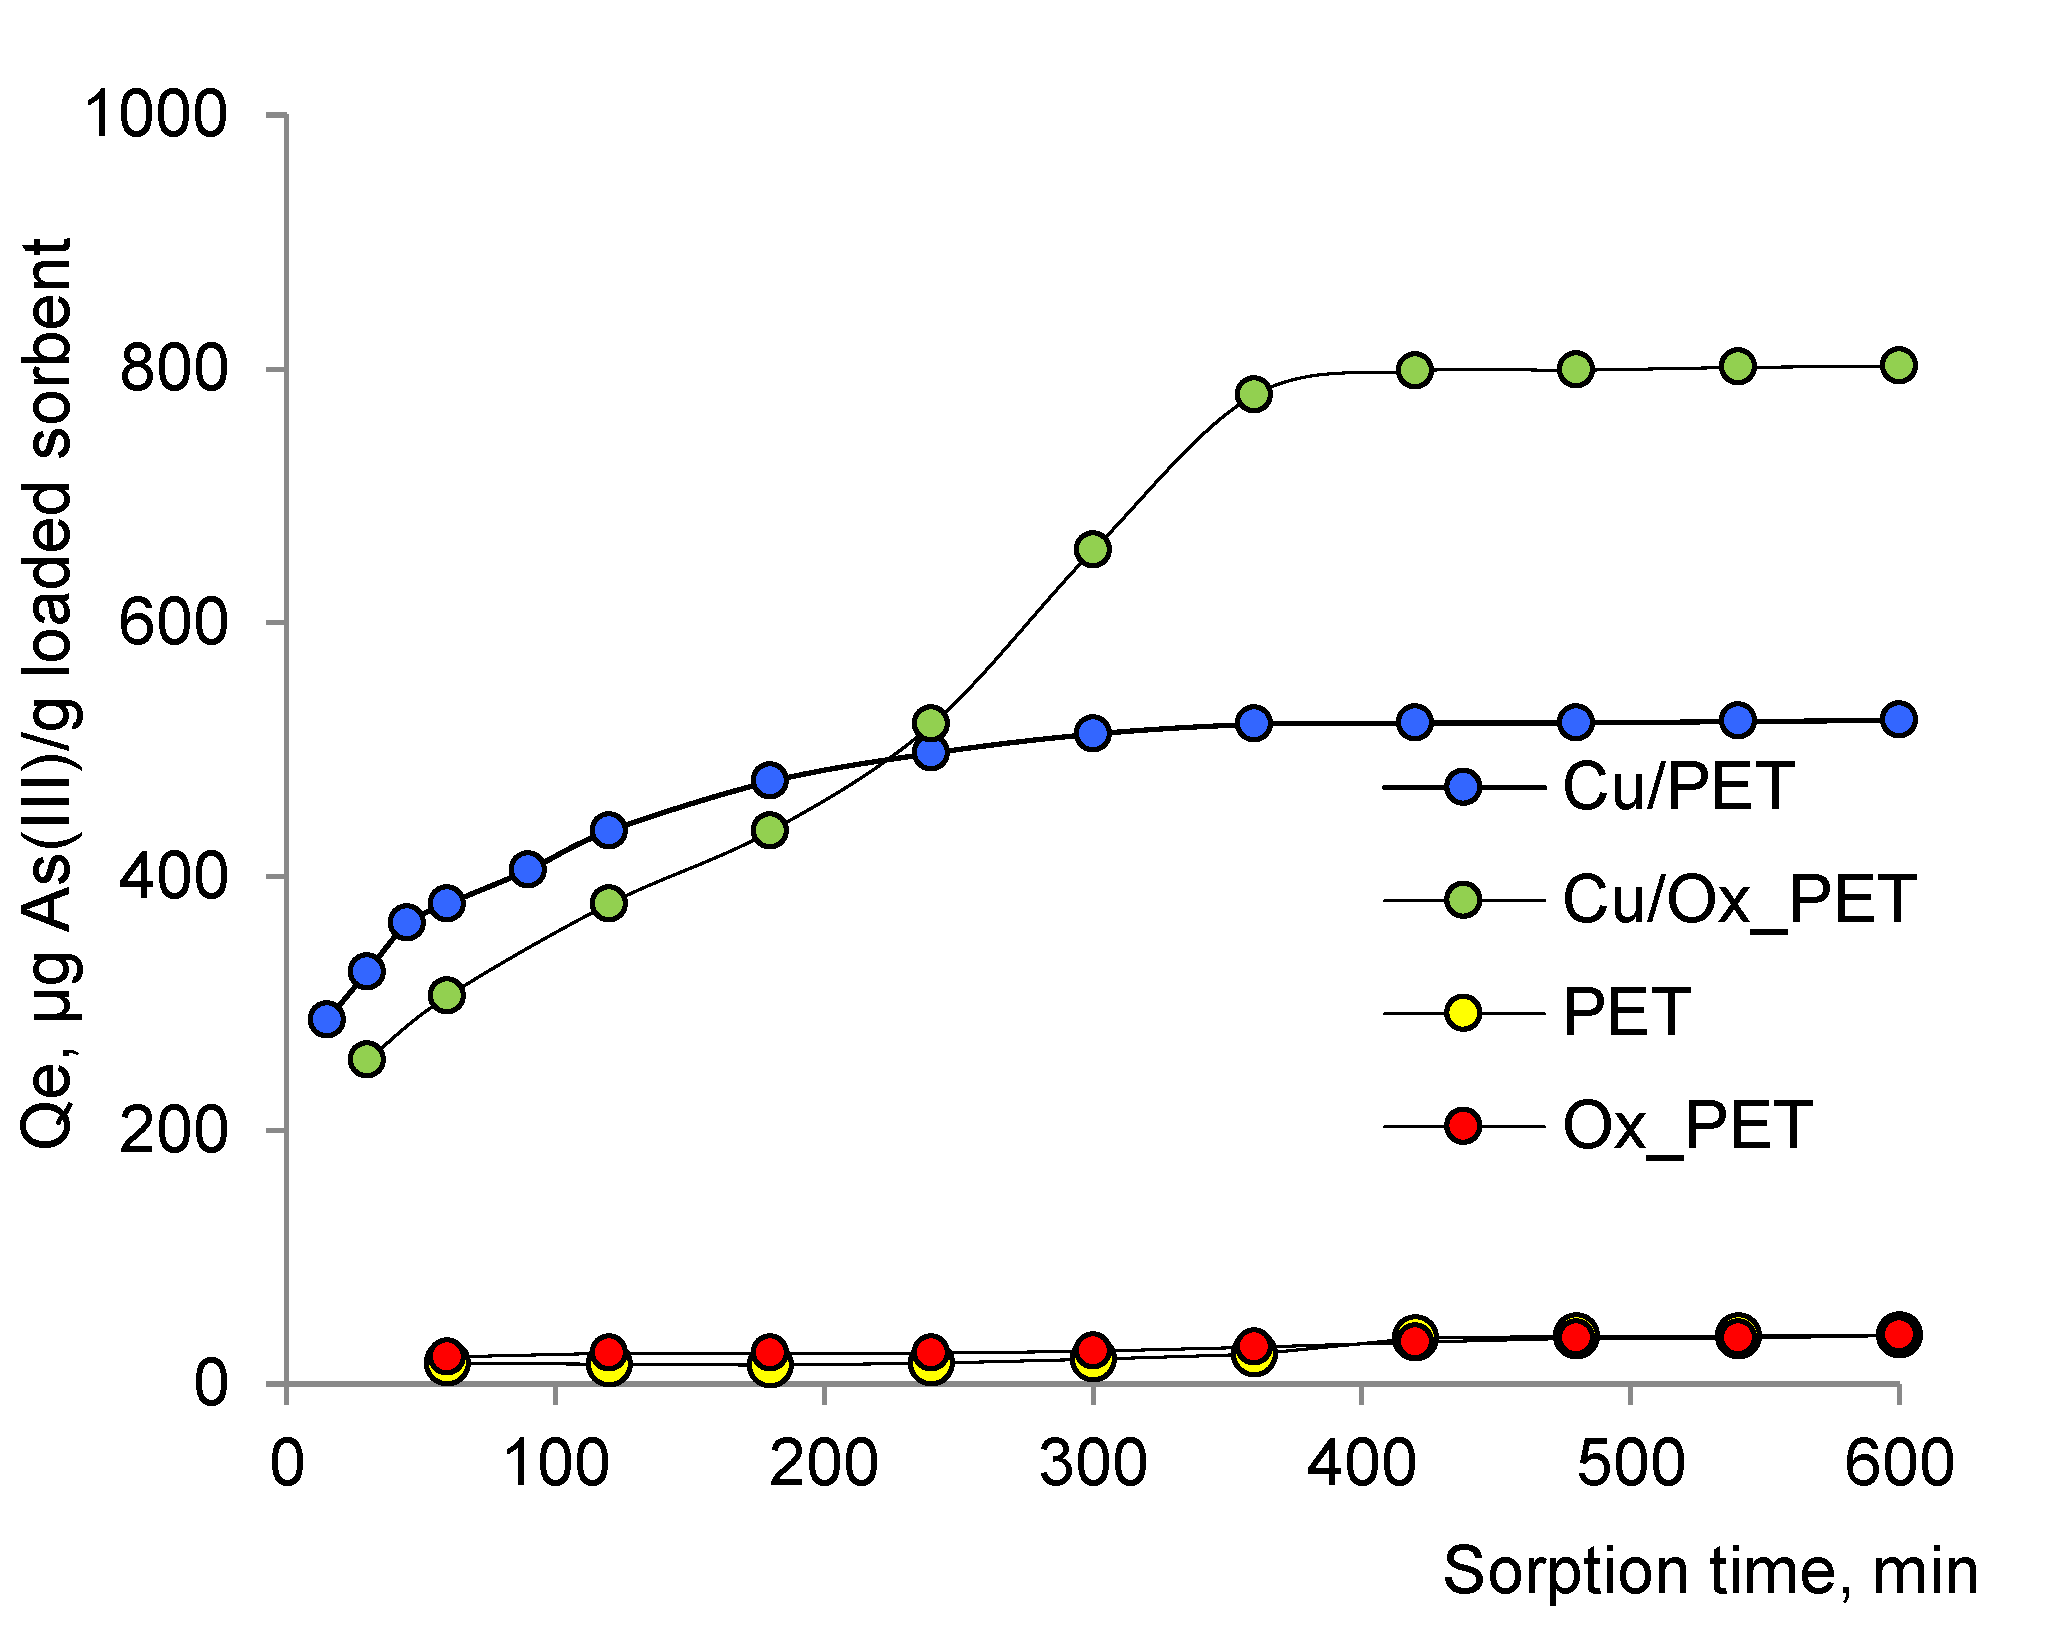
Figure 3 shows the amount of arsenic(III) adsorbed by composite TeMs with deposited metallic copper microtubes depending on the adsorption time. In order to exclude the effect of the PET template on the sorption activity of the prepared composites, etched-only (pristine) and oxidized PET species were also examined in As(III) sorption along with both types of composites. As can be seen in
Figure 3, the PET template has a very low arsenic sorption capacity both when oxidized and only-etched, and the equilibrium sorption capacities (
Qe) are 33.2 and 36.3 μg As(III)/g for the etched-only and oxidized PET templates, respectively.
It is clear from
Figure 3 that when oxidized PET is used as the template, a much higher equilibrium sorption capacity (
Qe) is achieved compared with what is obtained in the case of etched-only PET. While
Qe was found as 802 μg As(III)/g for Cu/Ox_PET, it was 521 μg As(III)/g when un-oxidized PET was applied as a template. Since the PET template alone does not have much effect on adsorption, this significant increase is attributed to the increase in the amount of copper loaded to the membrane and the specific surface area (
Table 1). Although the time required to reach the equilibrium sorption is slightly longer in oxidized PET (360 min) compared with the pristine counterpart (300 min), this is far from a problem given the high amount of equilibrium adsorption obtained.
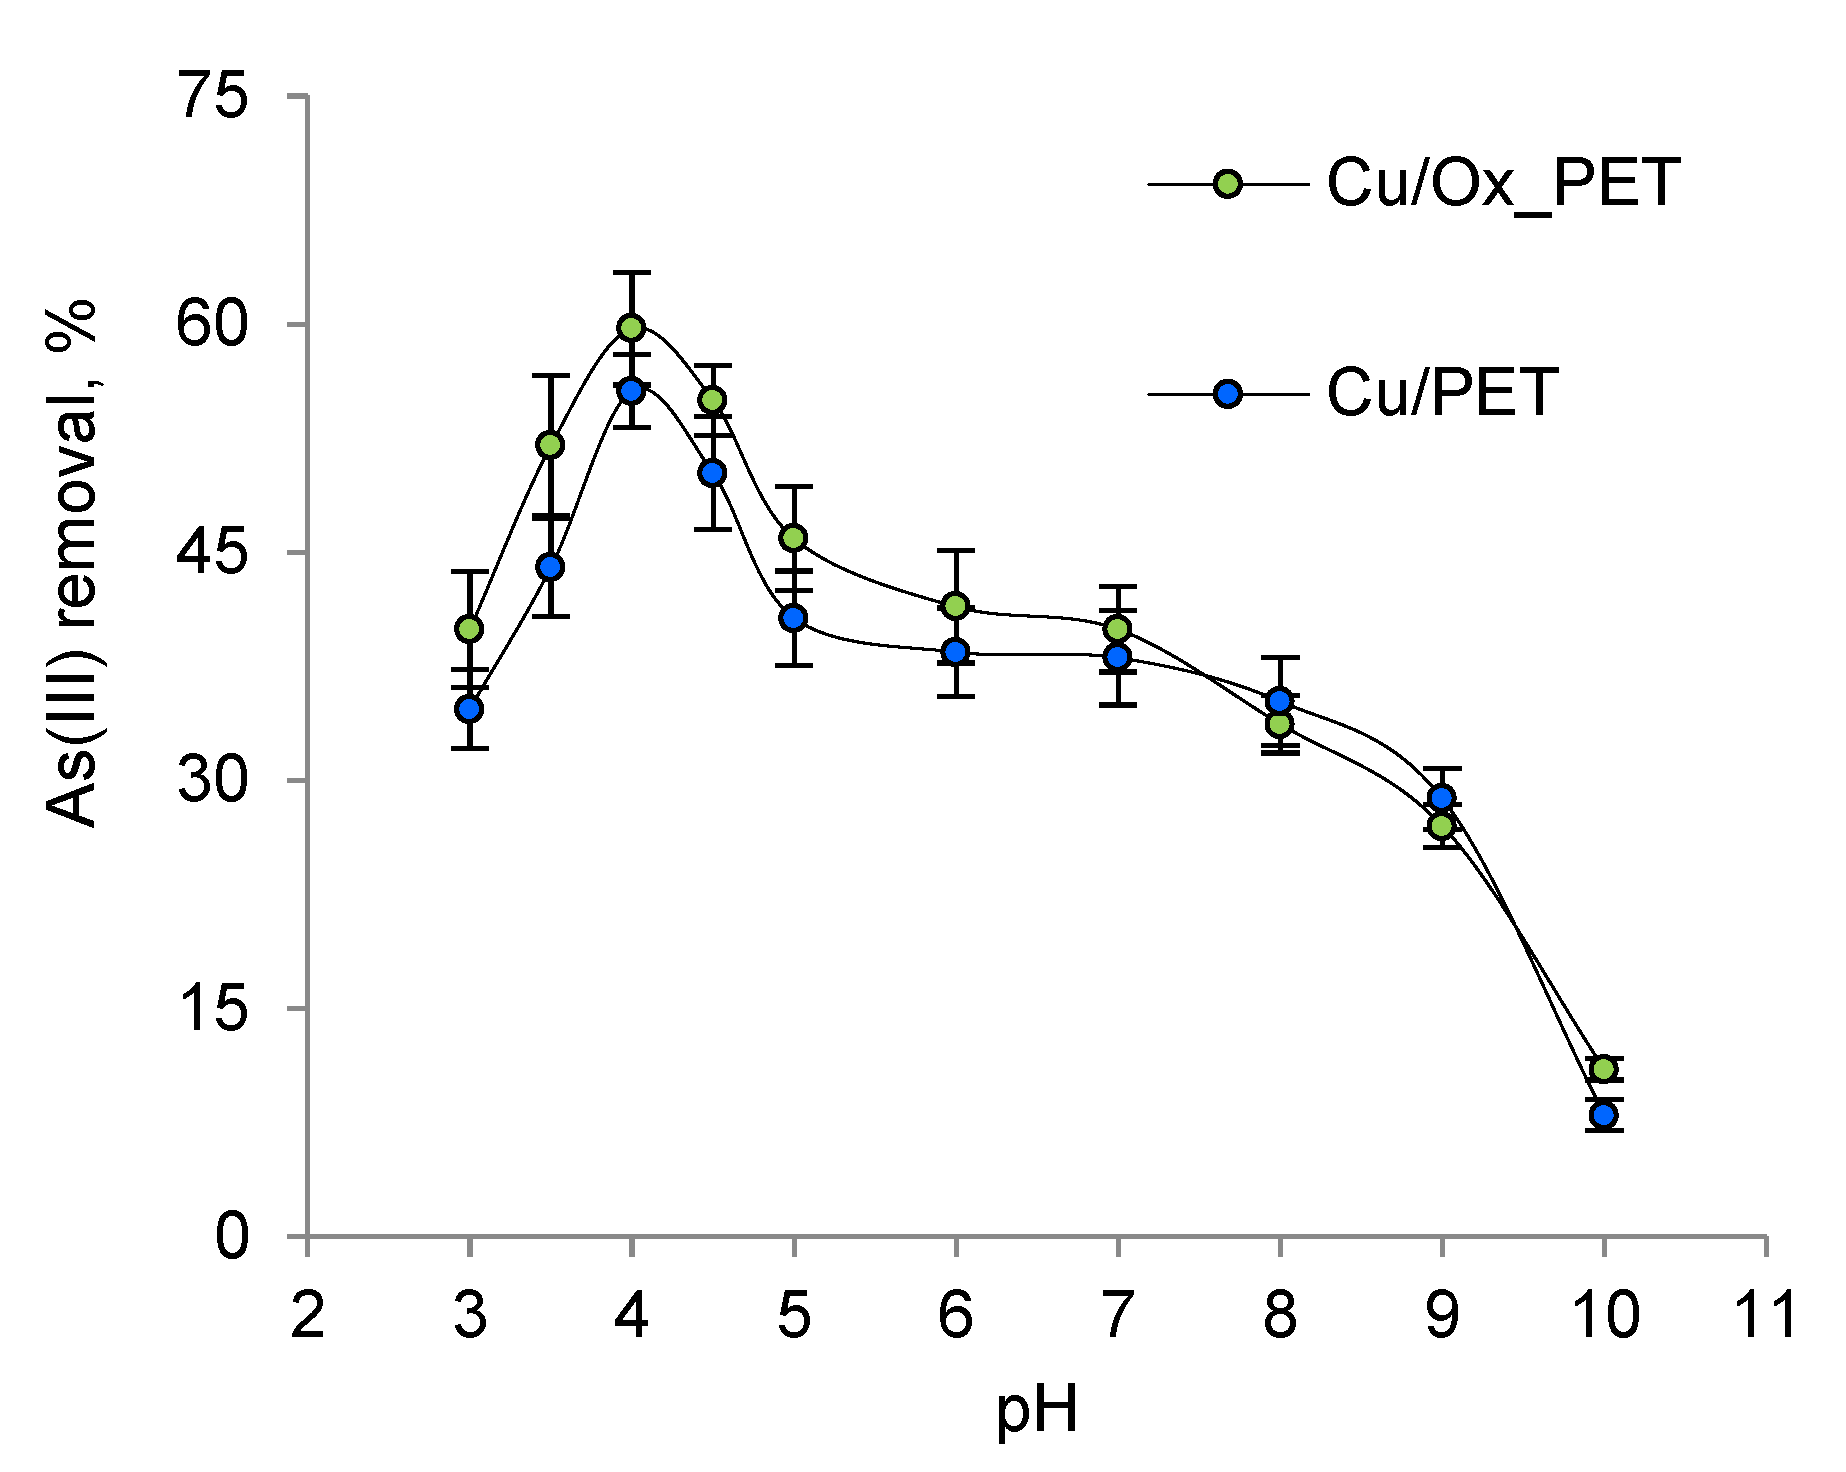
The relative distribution of As(III) species and the ionization of functional groups on the adsorbent surface depend on the pH of the solution [
53,
54]. When the effect of pH on As(III) sorption was examined, it was found that the maximum sorption capacity was obtained at pH 4 (
Figure 4).
At pH > 9, the membranes lost their integrity due to the destruction of the PET template and were unable to function. As the pH increased from 3 to 4, the adsorption efficiency increased from 40% to 60%. As(III) removal decreased dramatically at pH > 4.0. The results show that the interactions between the composite absorbent and As(III) are highest at pH 4, which is related to both the surface charge of the absorbent and the charge and structure of As(III) species at this pH [
55].
The pseudo-first-order model proposed by Lagergren [
56] as the earliest adsorption kinetic model is used to describe the adsorption behavior of solid adsorbents in liquid media. The differential form of the pseudo-first-order model is given by Equation (2) [
56]:
Equation (2) can be expressed as follows after integration to obtain a linear form:
where
is the adsorption capacity at time
, mg/g, and
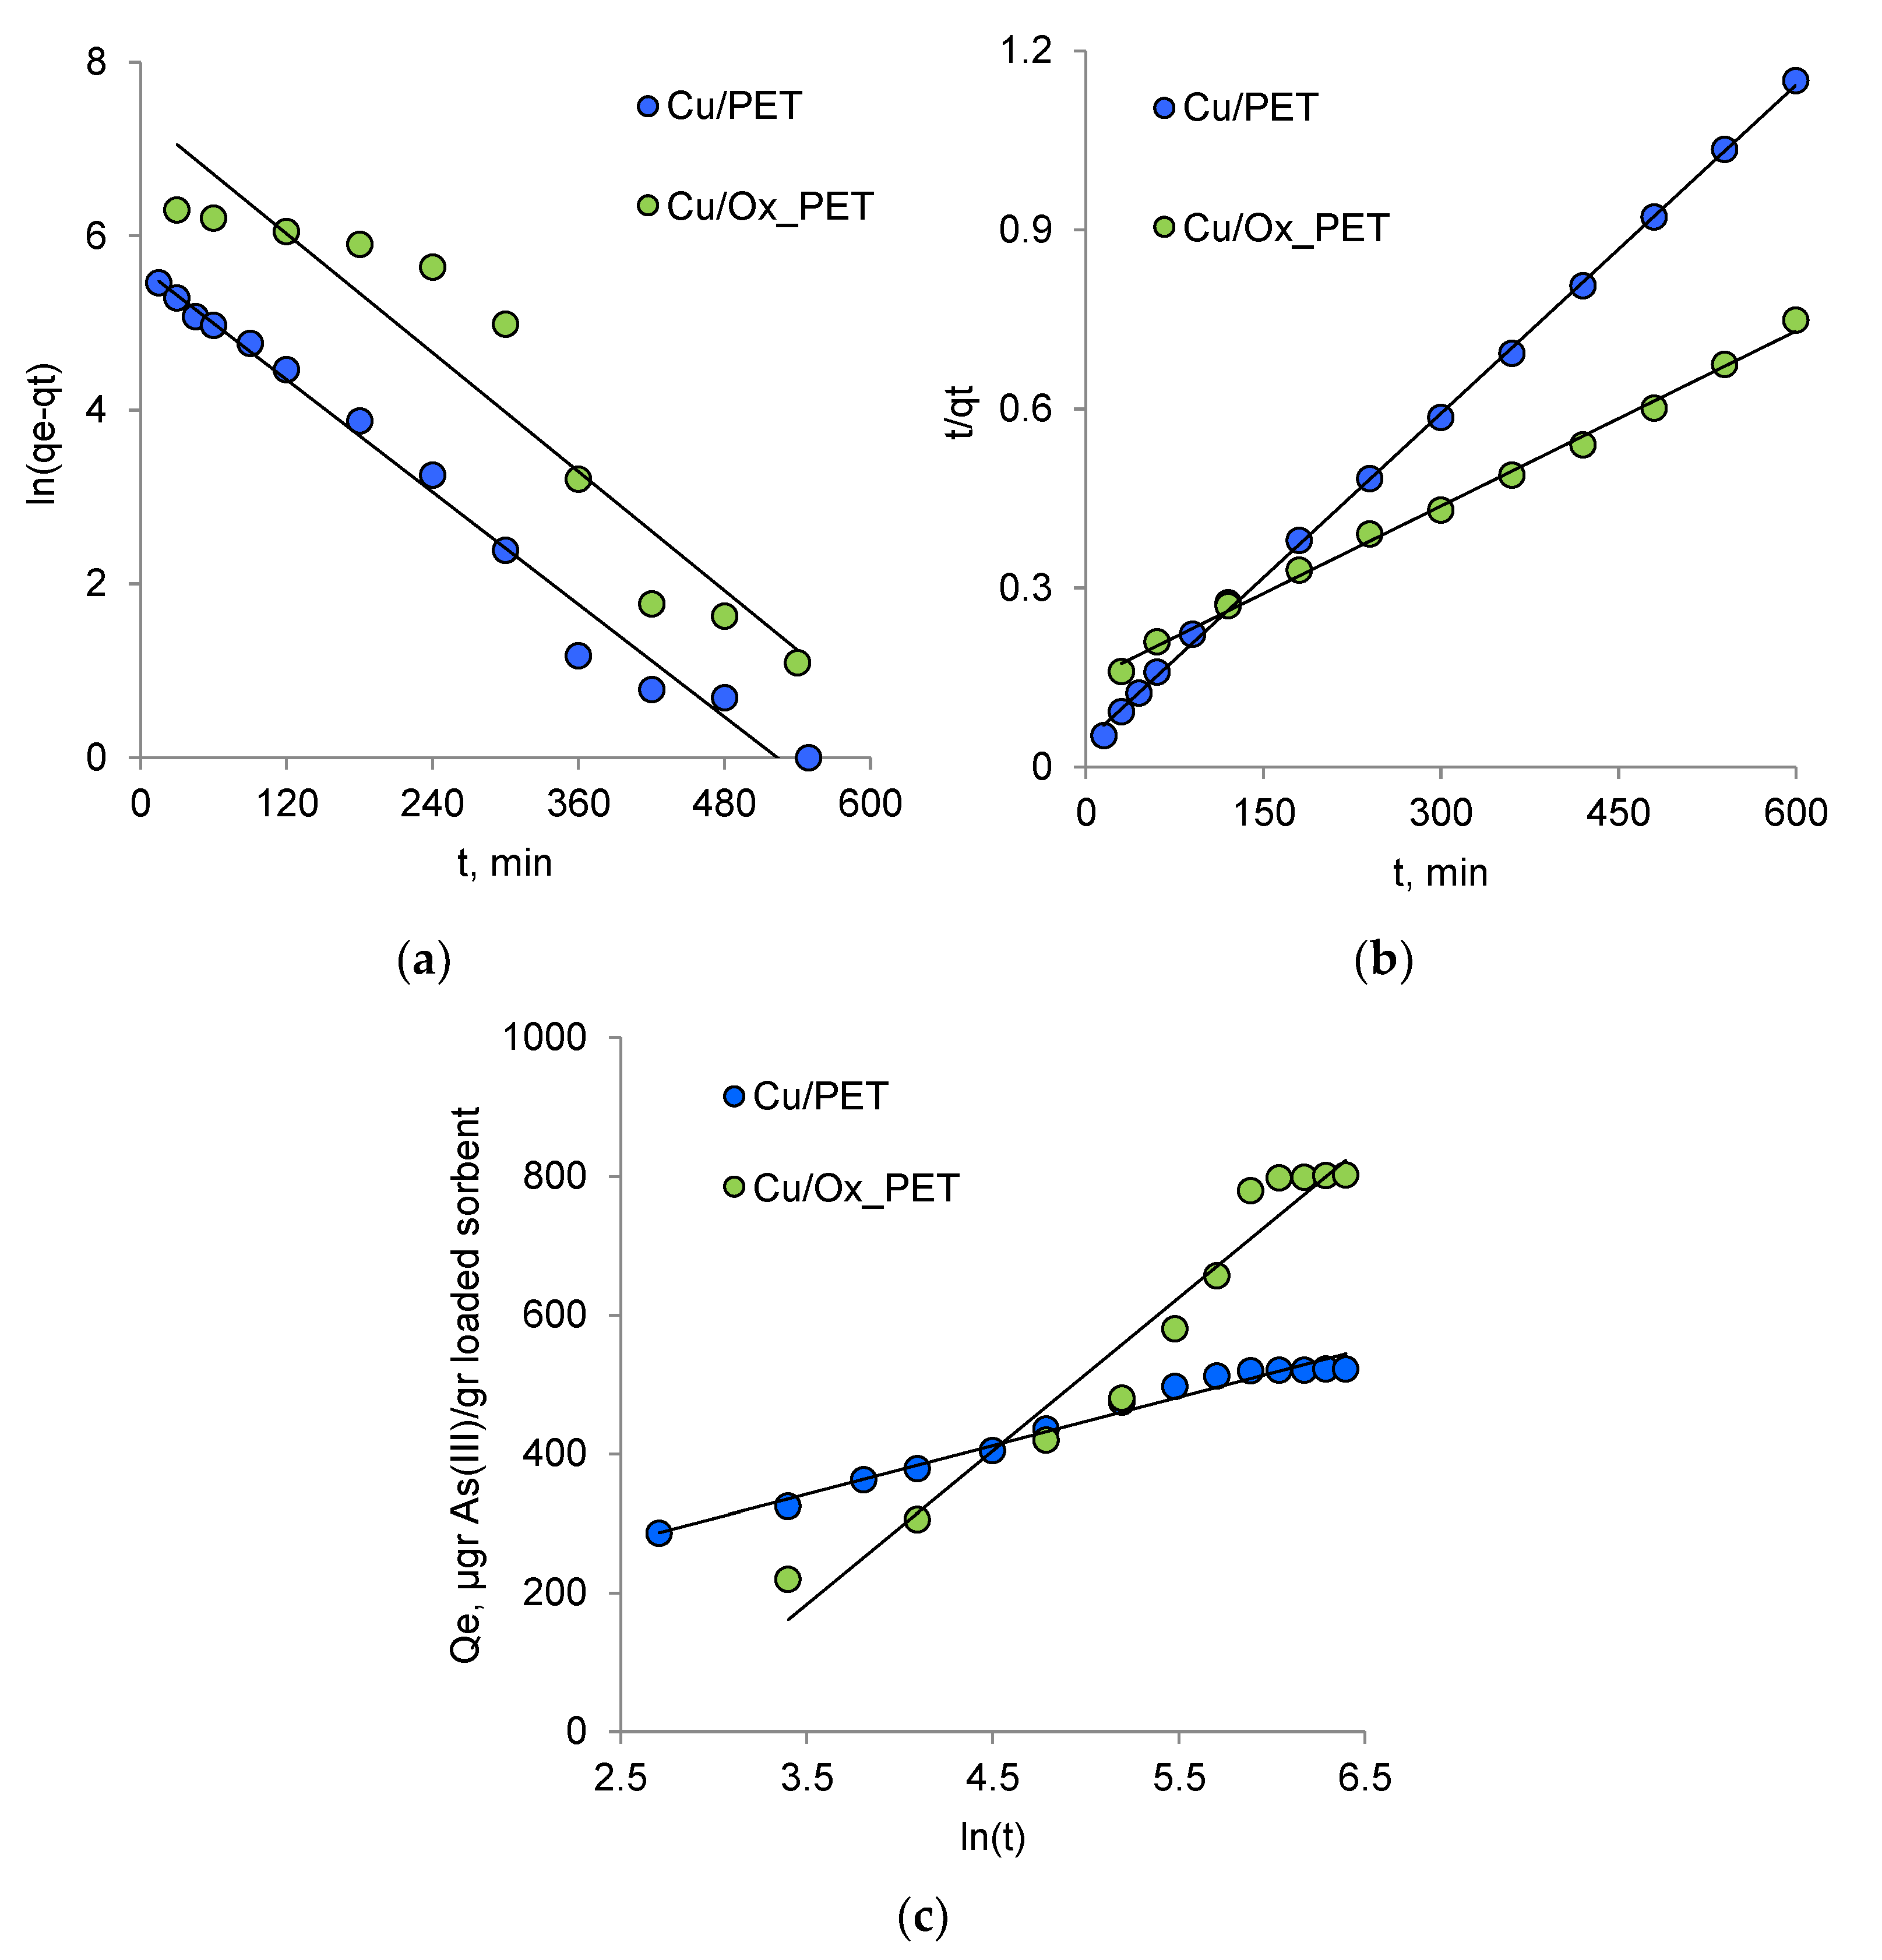
is the first-order reaction rate constant. As shown in
Figure 5a and listed in
Table 3, the values of
and
and the coefficient of determination, R
2, are determined by the linear graph dependency. For the pseudo-first-order kinetic model, the lower value of R
2 indicates that the adsorption kinetics do not match the pseudo-first-order reaction kinetic model.
When the concentration of adsorbate ions reaching the adsorbent functional groups is extremely low compared with the active centers, the first-order kinetic model can be applied to the initial stage of the adsorption process [
57]. In this case, the number of active centers involved in the adsorption changes slightly over time, and the adsorption process can be reduced mathematically by including the concentration of the functional groups of the adsorbent in the reaction rate constant. In the latter stage of the adsorption process, the adsorption rate is affected by the concentration of the two components, so the order of the adsorption becomes two.
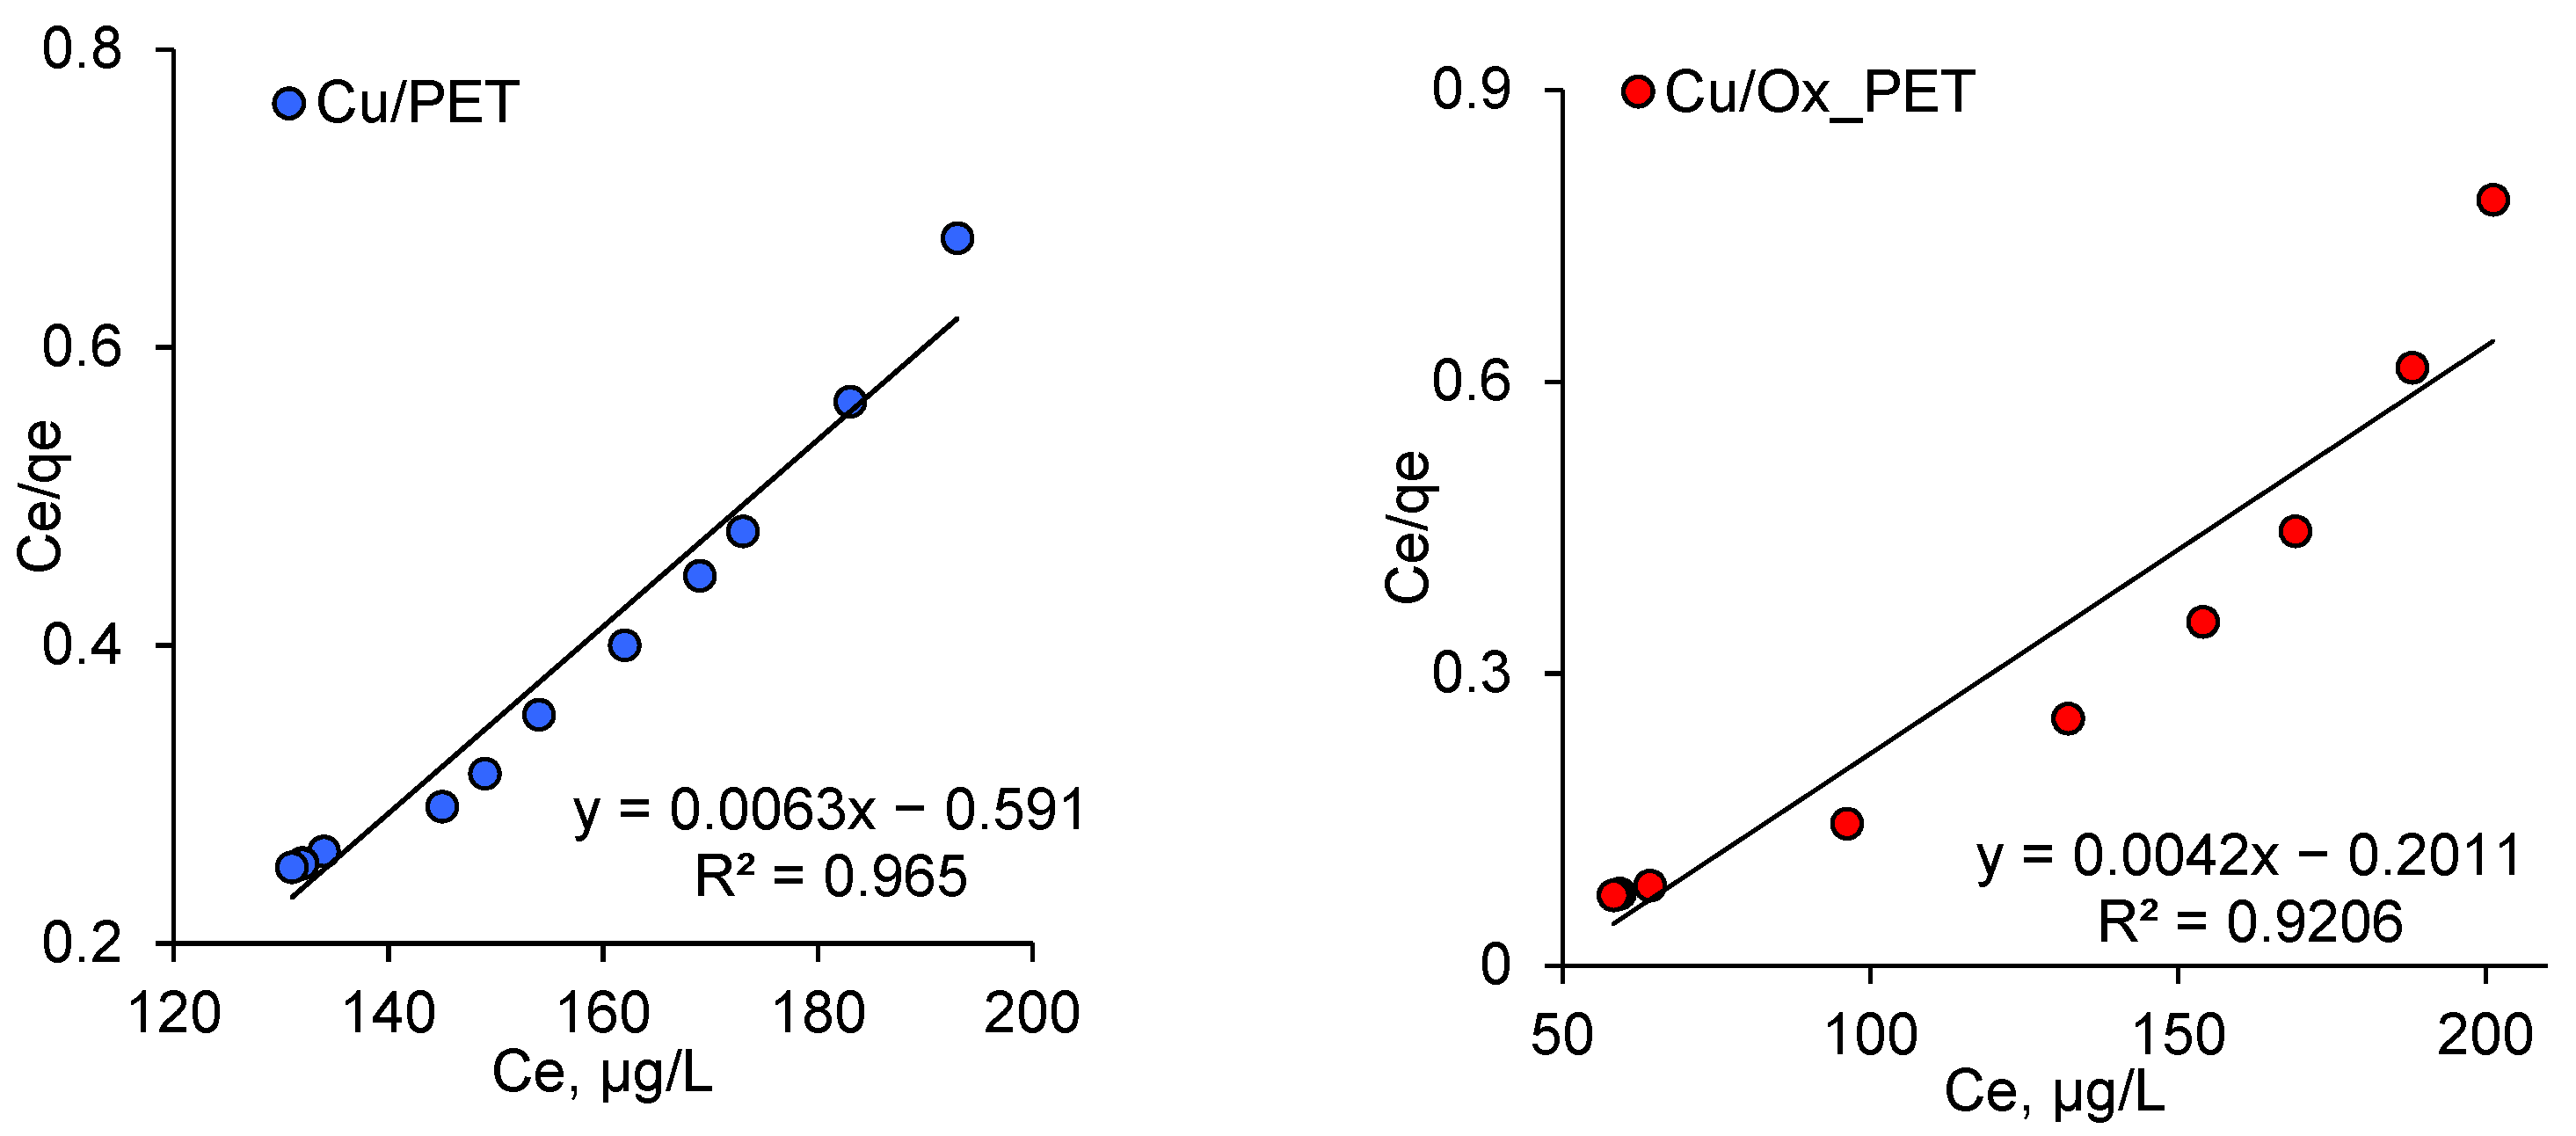
If the process is defined by the pseudo-second-order model (Equation (4)), the interaction between the adsorbate and the functional group of the adsorbent is strictly stoichiometric; that is, a metal ion occupies an adsorption site [
58].
In general, this model is similar to the pseudo-first-order kinetic model, but it can be used to describe the entire adsorption process [
59].
By integrating
t from 0 to
t and
from 0 to
we obtain
In linear form, the equation becomes
where
is the pseudo-second-order rate constant of the adsorption,
, and
is the equilibrium sorption amount, mg/g. These two values and the corresponding linear regression correlation coefficient R
2 are calculated from the linear graph shown in
Figure 5b, and the results are presented in
Table 3. The calculated
values of Cu/PET and Cu/Ox_PET are 0.545 and 1.0 mg/g, respectively, which are very consistent with the experimental data under the pseudo-second-order kinetics.
The pseudo-second-order equation also covers the intermolecular interactions of the adsorbate. The Elovich model described in Equation (7) takes into account the contribution of the adsorption process and the desorption phenomena to material extraction kinetics, which will have a significant impact when the adsorption is close to the equilibrium state [
59].
where
is the amount of adsorbate at time
, μg/g;
is the initial rate of the adsorption process, mg/g × min; and
is the desorption constant (g·mmol
−1). The kinetic parameters of this model are calculated from the linear dependence of
on ln(t) (
Figure 5c), and the results are given in
Table 3. Compared with
, the higher-value
indicates that arsenic absorption, rather than its desorption, is dominant [
59]. As can be seen in
Table 3, the
value for Cu/Ox_PET is much higher than in the case where the non-oxidized PET template is used. The results presented in
Figure 3 confirm that the PET template contributes to the adsorption process. The lower
value obtained in the case of the oxidized template states that the desorption of As(III) occurs at a lower amount, indicating favorable interaction between the adsorbate and the adsorbent through the oxidized species. When these two parameters,
and
, are evaluated together, the high equilibrium sorption obtained from the use of oxidized PET becomes quite expected.
The value of the correlation coefficient R
2 shows that the pseudo-second-order model best describes the adsorption of arsenic(III) by both composite adsorbents. The linear dependence in
Figure 5b over the entire time interval is obvious. The applicability of the pseudo-second-order kinetic model to both composite sorbents leads to the conclusion that chemisorption is the rate-determining step of the process, and the effect of the diffusion stage is insignificant [
49,
51].
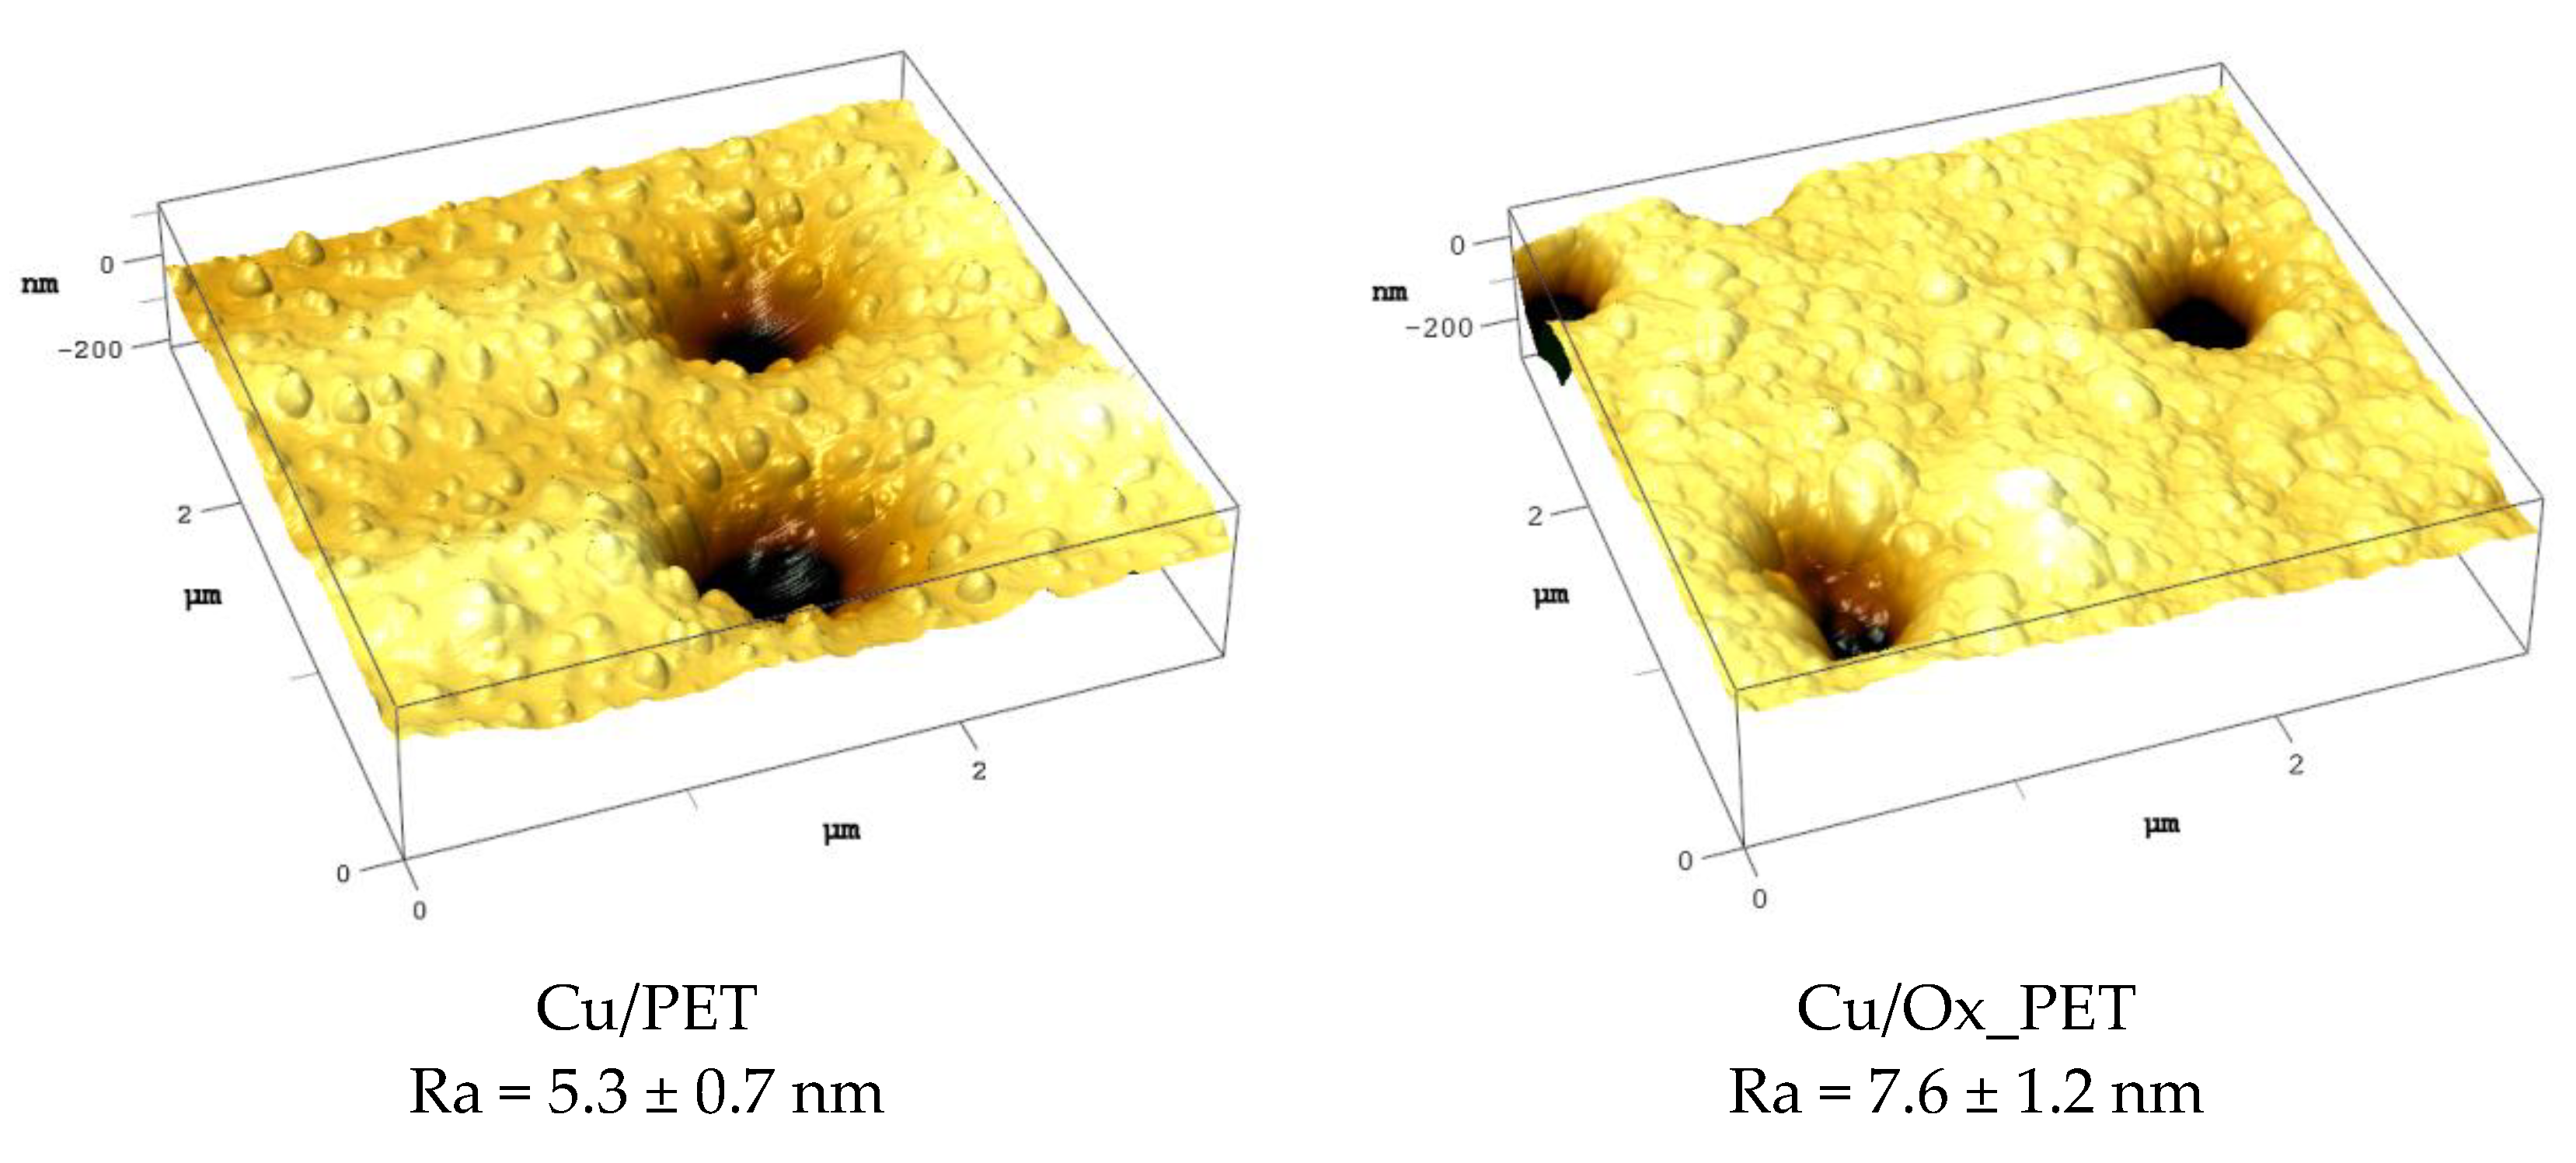
As can be seen in
Table 1, the specific surface area and the amount of copper loaded are higher in the case of Cu/Ox_PET. The oxidation process is expected to increase surface porosity, and this morphological difference also positively contributes to the adsorption process. To confirm this expectation, we performed atomic force microscopy (
Figure 6) and found that the roughness (Ra) of the composite obtained when using the oxidized PET template was 30% higher compared with the use of its untreated counterpart. In addition to all these, the Cu/Ox_PET composite has a smaller crystallite size (15.0 ± 2.8 nm) compared with Cu/PET (18.0 ± 2.7 nm), as was shown earlier [
35]. Therefore, we think that smaller copper crystallites also contribute to increased adsorption performance with their increased surface areas.


 ,
, 


