
Pathological Neurovascular Unit Mapping onto Multimodal Imaging in Diabetic Macular Edema
by
Tomoaki Murakami
*,
Kenji Ishihara
,
Noriko Terada
,
Keiichi Nishikawa
,
Kentaro Kawai
and
Akitaka Tsujikawa
Department of Ophthalmology and Visual Sciences, Kyoto University Graduate School of Medicine, Kyoto 606-8507, Japan
*
Author to whom correspondence should be addressed.
Medicina 2023, 59(5), 896; https://doi.org/10.3390/medicina59050896
Submission received: 11 March 2023
/
Revised: 1 May 2023
/
Accepted: 6 May 2023
/
Published: 7 May 2023
(This article belongs to the Special Issue Macular Edema: Pathogenesis, Diagnosis and Therapies)
Abstract
:Diabetic retinopathy is a form of diabetic microangiopathy, and vascular hyperpermeability in the macula leads to retinal thickening and concomitant reduction of visual acuity in diabetic macular edema (DME). In this review, we discuss multimodal fundus imaging, comparing the pathogenesis and interventions. Clinicians diagnose DME using two major criteria, clinically significant macular edema by fundus examination and center-involving diabetic macular edema using optical coherence tomography (OCT), to determine the appropriate treatment. In addition to fundus photography, fluorescein angiography (FA) is a classical modality to evaluate morphological and functional changes in retinal capillaries, e.g., microaneurysms, capillary nonperfusion, and fluorescein leakage. Recently, optical coherence tomography angiography (OCTA) has allowed us to evaluate the three-dimensional structure of the retinal vasculature and newly demonstrated that lamellar capillary nonperfusion in the deep layer is associated with retinal edema. The clinical application of OCT has accelerated our understanding of various neuronal damages in DME. Retinal thickness measured by OCT enables us to quantitatively assess therapeutic effects. Sectional OCT images depict the deformation of neural tissues, e.g., cystoid macular edema, serous retinal detachment, and sponge-like retinal swelling. The disorganization of retinal inner layers (DRIL) and foveal photoreceptor damage, biomarkers of neurodegeneration, are associated with visual impairment. Fundus autofluorescence derives from the retinal pigment epithelium (RPE) and its qualitative and quantitative changes suggest that the RPE damage contributes to the neuronal changes in DME. These clinical findings on multimodal imaging help to elucidate the pathology in the neurovascular units and lead to the next generation of clinical and translational research in DME.
Keywords:
center-involving diabetic macular edema; clinically significant macular edema; diabetic macular edema; diabetic retinopathy; disorganization of retinal inner layers; fluorescein angiography; fluorescein leakage; fundus autofluorescence; hard exudates; hyperreflective foci; optical coherence tomography; optical coherence tomography angiography; photoreceptor damage; vascular hyperpermeability1. Introduction
Diabetic retinopathy (DR) is one of the leading causes of vision loss worldwide. In particular, diabetic macular edema (DME) and proliferative diabetic retinopathy (PDR) are vision-threatening DR [1]. Although the standard clinical practice for DME has been established, the pathogenesis of DME remains to be fully characterized and further advances in diagnosis and treatment should be pursued [2,3,4].
DME is characterized by vascular hyperpermeability and retinal edema in the macula, resulting in reduction of visual acuity (VA) [4]. Classical fundus examination has allowed us to evaluate and diagnose DME [2]. The distinct findings are retinal hemorrhages, hard exudates, and microaneurysms. The thickening of translucent retinas is the most relevant, although its subjective evaluation is difficult even for the experienced clinicians.
Histological publications have elucidated the morphological changes and their components in DME [5,6,7,8,9,10]. Cystoid macular edema (CME) often develops in the inner nuclear layer (INL) and outer plexiform layer (OPL) in eyes with macular edema [10]. Electron microscopy suggested that these spaces correspond to the accumulation of the extracellular fluid or intracytoplasmic swelling due to the liquefaction necrosis of neuroglial cells [11]. Tight junctions are abundantly developed between vascular endothelial cells in healthy retinas, whereas they are disrupted in diabetic retinas [12,13,14]. Trypsin-digested specimens revealed that pericyte loss and vascular deformation, i.e., microaneurysms, may contribute to vascular hyperpermeability [5,15]. Hard exudates may correspond to the accumulation of lipid-laden macrophages or the deposition of lipoproteins in the histological samples [16,17]. These publications allow clinicians to speculate about the pathogenesis of DME.
Advances in vascular biology have elucidated that vascular endothelial growth factor (VEGF) plays the most important role in angiogenesis and vascular hyperpermeability in PDR and DME, respectively [18,19,20]. This prompted us to apply anti-VEGF treatment for DME [21,22,23]. Among several therapeutic strategies, it is the first-line therapy and regulates vascular hyperpermeability most efficiently [24]. Currently, clinicians are trying to determine the predictors of visual outcomes, treatment frequency, and remission of macular edema after anti-VEGF treatment to pursue customized medicine [25,26,27,28,29,30].
In this article, we searched PubMed as an electronic database, and selected the first publication in the relevant field. We discuss about how the recent application of multimodal imaging improves our understanding of the pathogenesis of DME and resolves the clinical issues, e.g., visual prognosis (Figure 1).
2. Clinical Diagnosis of DME
At present, many clinicians objectively and quantitatively diagnose center-involving diabetic macular edema (CIDME) using optical coherence tomography (OCT) [3]. It is reasonable to designate the retinal thickening in the macula as the diagnostic criterion for DME. CIDME is used as the eligibility criterion in most clinical trials of anti-VEGF treatment [31]. Another classical diagnosis of DME is clinically significant macular edema (CSME) [2]. The criteria are retinal thickening or hard exudates within 500 μm from the fovea or 1500 μm or more of retinal thickening within 1 disc diameter of the fovea on fundus examination or the stereoscopic fundus photography. The Early Treatment Diabetic Retinopathy Study (ETDRS) had defined CSME as the criterion for macular photocoagulation in DME.
In addition to these two major diagnostic criteria, the international classification of diabetic macular edema disease severity depends on the proximity of the retinal edema and hard exudates to the fovea [32]. Eyes with retinal thickening or hard exudates in the posterior pole were diagnosed as DME. Eyes with these lesions distant from the center are defined as mild DME. When these lesions are approaching or involving the center, we diagnose moderate or severe DME, respectively. Finally, fluorescein angiography (FA) shows focal and/or diffuse fluorescein leakage as a biomarker of vascular hyperpermeability [33].
The pathogenesis of DME is complicated, and evidence is continuing to accumulate using newly developed imaging modalities, so we have not reached a consensus on the ultimate criteria for DME diagnosis.
3. Fundus Photography
3.1. Conventional Photography
Fundus examination was originally the basis of the diagnosis and treatment of DME (Figure 2A). Fundus photography is useful for longitudinal evaluation. Their main findings are retinal hemorrhages, hard exudates, and retinal thickening in the macula, all of which represent the breakdown of the blood-retinal barrier (BRB) [4]. In particular, VA is reduced when the foveal center is involved with retinal edema and hard exudates. The ETDRS defined CSME depending on the fundus findings and demonstrated that VA reduction is retarded by macular photocoagulation [2].
Hard exudates are generally considered to be the accumulation of the extravasated lipoproteins or the lipid-laden macrophages [16,34]. They are sometimes arrayed at the edge of retinal edema, which is referred to as circinate hard exudates. This suggests the vascular lesions with hyperpermeability at the center of the “circinate”. When they migrate into the subfoveal spaces, they often lead to the photoreceptor damage at the fovea and subsequent VA reduction [35,36].
3.2. Advanced Technologies
There are three main advances in fundus photography: ultrawide field imaging, super high resolution, and separate wavelengths. The clinical application of ultrawide-field fundus photographs has significantly improved the quality of the assessment of peripheral retinas (Figure 2B) [37]. However, we carefully evaluate the macular lesions, because the lateral resolution is slightly reduced in these indirect images. Adaptive optics technology, which was originally applied to astrology to remove the wavefront aberrations, has increased the lateral resolution of fundus cameras and scanning laser ophthalmoscopes (SLOs) [38,39]. As a result, we can appreciate the fine structure of vascular lesions, hard exudates, and photoreceptor mosaics (Figure 2C). Since the SLO obtains the fundus imaging, mediated via specific wavelengths of emission and excitation, the light reflection in the SLO images delineates the unusual fundus images. The clinical feasibility of such modalities should be elucidated.
4. Dye-Based Angiography
4.1. Fluorescein Angiography
FA is the best imaging modality to assess the vascular morphologies and dysfunction in the retinas. Higher contrast allows us to appreciate capillaries and details of the morphological changes in retinal vessels. In particular, FA is the only modality to evaluate the BRB status. Fluorescein dye is extravasated into the retinal parenchyma in cases of BRB disruption, which is referred to as fluorescein leakage. It is classified into two patterns: focal and diffuse fluorescein leakage (Figure 3) [33]. When the source of the leaked dye can be identified clearly, the extravascular hyperfluorescence is considered focal fluorescein leakage. In most cases, microaneurysms are the source of dye leakage. In contrast, when the source is not distinctive, hyperfluorescence is referred to as diffuse fluorescein leakage. Focal and diffuse leakages often coexist, and they are not definitively divided. Another sign of the BRB breakdown is fluorescein pooling. Fluorescein dye is stored in cystoid spaces in the INL or OPL and appears to be round or oval.
FA has higher sensitivity to detect microaneurysms than fundus examination. Microaneurysms appear to be hyperfluorescent dots and are sometimes accompanied by fluorescein leakage [5,15]. FA is useful to discriminate microaneurysms from dot-like retinal hemorrhages, which correspond to blocked fluorescence. Circinate hard exudates in fundus examination and microaneurysms with leakage often coexist. When we consider macular photocoagulation for CSME, FA images are useful to determine whether vascular lesions are coagulated.
The disadvantages of FA also need to be considered. The retinal vasculature is composed of three or four capillary plexus layers. However, the signals on two-dimensional images are derived mainly from the superficial layer, and we cannot assess the status of deep vascular plexuses on FA images [40]. Another consideration is patient allergy, for which first aid for anaphylaxis needs to be prepared.
4.2. Indocyanine Green Angiography
Indocyanine green angiography (ICGA) is another imaging modality of chorioretinal vessels. This dye has an affinity for lipoproteins, and some microaneurysms are delineated as hyperfluorescent dots on ICGA images. It was reported that such microaneurysms are the source of vascular leakage and might be appropriate targets for focal macular photocoagulation [41].
5. Optical Coherence Tomography
Clinical application of spectral-domain optical coherence tomography (SD-OCT) has deepened our understanding of DME in neuroglial tissue [42,43]. One of the main characteristics of DME is retinal thickening. SD-OCT allows us to evaluate retinal edema qualitatively and quantitatively [44]. In particular, the mean retinal thickness in the central subfield, referred to as central subfield thickness (CST), is used to diagnose CIDME [3,31]. Some lesions develop, and some important structure in the retinas is lost on SD-OCT images in eyes with DME.
5.1. Principles
OCT is a noninvasive imaging modality. Time-domain (TD)-OCT, the original technique, depends on the coherence between the reflected lights from the retinas and the reference mirror [45]. As a result, we can differentiate the retinal layers according to OCT reflectivity. In SD-OCT with approximate 840 nm light source, the nonuniform Fourier transform of OCT signal spectra increased the scan speed and generated the high-resolution images (axial resolution = 3–5 μm) [42]. The latest generation is swept source (SS)-OCT [46]. The longer wavelength of the light source (approximate 1040–1060 nm) penetrates deep structures, e.g., the choroid and sclera, in most of commercially available SS-OCT machines, and the axial resolution is considered to be 6–8 μm. As a result, SS-OCT enables us to evaluate the chorioretinal structure. Visible light is sometimes used as the light source for the research. Of these, SD-OCT is the main technique used today. We need to pay attention to the several artifacts including motion artifacts, blinking artifacts, and segmentation error. Hyperreflective lesions often lead to the shadow beneath themselves.
5.2. Diagnosis of CIDME
Retinal sectional images are obtained using OCT, and the side-by-side arrangement of these images constructs three-dimensional images, which allows us to measure the retinal thickness in each sector of the ETDRS grid. In particular, the mean retinal thickness within the central 1-mm circle is defined as the CST. When the CST is greater than the thresholds, eyes with DR are diagnosed with CIDME (Figure 4, Table 1) [3]. We must be careful with this quantitative diagnosis. The thresholds are different in the different devices, because of the different methods used for automatic segmentation [31]. In some cases, the segmentation is incorrect, and as a result, the measurement is also incorrect. We may consider the manual measurement using the caliper in the equipped software.
This quantified parameter is often applied as a surrogate marker in clinical trials for DME. We can confirm improvement of the edematous changes and remission of CIDME using the CST [29,49]. Although the CST is the gold standard for the structural assessment of DME, its association with VA reduction is modest. We sometimes observe the cases with paradoxical VA changes, e.g., VA reduction in eyes with decreased CST and VA improvement in eyes with increased CST [50]. This suggests that factors other than retinal edema influence visual function [4,51,52].
5.3. Various Pathomorphologies on Sectional Images
OCT delineates various lesions in neuroglial tissues in DME. The first publication of the pathomorphologies in DME documented three patterns on TD-OCT images: CME, serous retinal detachment (SRD), and sponge-like retinal swelling (Figure 5A,B) [53]. They considered that retinal thickening is composed of one or a mixture of these structural lesions. High-resolution SD-OCT images have shown that CME develops mainly in the INL and OPL and that sponge-like swelling results from epiretinal membrane or taut posterior hyaloidal membrane [54,55].
Comparative studies between FA and OCT images have promoted our understanding of the multifaceted pathogenesis in DME. Honeycomb and petaloid patterns of fluorescein pooling correspond to cystoid spaces in the INL and OPL, respectively [54]. The foveal avascular zone (FAZ) is enlarged, and microaneurysms around it develop in CME eyes [56]. This suggests that retinal ischemia and microaneurysms contribute to the development of CME. In contrast, we rarely find the fluorescein pooling in SRD eyes. Perifoveal hyperfluorescence is often observed in SRD eyes, so we hypothesize that the distant effects from vascular hyperpermeability in the perifovea result in the development of SRD [57]. This correlation may prompt us to perform the customized methods of macular photocoagulation.
5.4. Photoreceptor Damage
High-resolution images in the outer retinal layers allow us to appreciate the pathological changes in the photoreceptor-retinal pigment epithelium (RPE) complex. SD-OCT delineates the ellipsoid zone (EZ) and the external limiting membrane (ELM) above the RPE [58], which are biomarkers of the photoreceptor status. In some cases with DME, one or both of these lines are disrupted or absent at the fovea (Figure 5A–C) [59,60,61,62,63]. Since VA depends on the foveal photoreceptors in human eyes, their damage leads to VA reduction. The pathological mechanisms underlying photoreceptor damage remain to be elucidated. A recent publication has shown that anti-fumarase antibody is increased in some patients with DME and promotes the photoreceptor inner and outer segments in mice [64]. This suggests the autoimmune mechanisms in the photoreceptor damage in DME.
5.5. Hyperreflective Foci
Hyperreflective foci have been reported as a sign of extravasation in DME [43]. Morphologically, dot-like deposits with high OCT reflectivity are delineated individually or aggregated (Figure 5F). Hard exudates in fundus examination correspond to the accumulation of hyperreflective foci. Surgically resected hard exudates contain phagocytes, and histological publications have showed lipid-laden macrophages in diabetic retinas [16]. Future clinicopathological study should elucidate the relationship between this OCT finding and histological lipid-laden macrophages [17,34].
Hyperreflective foci are delineated throughout the retina and often accumulate in the OPL. They are present in cystoid spaces or vascular walls. In some cases with DME, hyperreflective foci migrate into the subfoveal spaces and promote photoreceptor damage there [67,68]. Further studies should show how hyperreflective foci exacerbate neuroinflammation in DME [69].
5.6. Lamellar Disorganization
In healthy retinas, the signals from foveal photoreceptors are transmitted through inner retinal layers, including bipolar cells and ganglion cells. They are represented by the definite lamellar structures in inner retinas. In some eyes with DME, some or all inner layers are absent or disorganized, which is referred to as disorganization of the retinal inner layers (DRIL) (Figure 5G) [70]. The magnitude of DRIL is associated with VA reduction cross-sectionally and longitudinally.
Diabetic macular ischemia also induces VA reduction and is associated with DME, mediated via VEGF and insufficient drainage of extracellular fluids [71,72,73]. The contrast between the highly reflective nerve fiber layer (NFL) and the less reflective ganglion cell layer/inner plexiform layer (GCL/IPL) enables us to assess the integrity of the inner retinal layers. The boundaries between the layers are often absent or obscure in areas with capillary nonperfusion [74]. Such lesions might result in VA reduction collaboratively with DME.
5.7. Vitreoretinal Interface
DME is sometimes accompanied by epiretinal membrane or vitreomacular traction. Assessing these lesions is difficult even for the experienced clinicians. In contrast, OCT delineates them very clearly, which allows us to infer the magnitude of traction and subsequent visual dysfunction. Therefore, it is easy to determine whether vitrectomy should be performed in DME with vitreoretinal pathology [75,76].
5.8. Choroid
Many clinicians believe that the choroid influences on the pathogenesis of DME, because the choroid nourishes the outer retinas through the RPE and drains waste from the retinas [77]. Some publications reported greater choroidal thickness in eyes with DME, and others reported opposite results [78,79,80,81,82]. Ocular inflammation or vascular hyperpermeability might increase choroidal thickness, whereas the loss of choroidal vessels might decrease it. Choroidal thickness depends on axial length, age, and systemic factors, and future studies should elucidate the cause-and-effect relationship between DME and choroidal thickness [83,84,85].
En face images of SS-OCT or enhanced depth imaging (EDI)-OCT depict the choroidal vessels with an intermediate or large diameter in the Sattler’s and Haller’s layers, respectively. The subjective evaluation of these layers indeed showed reduced vascular density or tortuosity of choroidal vessels in DR [86,87,88]. These lesions correspond to the histological findings at least in part [89,90]. Despite the definite choroidal pathology in diabetic eyes, it remains to be elucidated whether such lesions promote ocular inflammation or reduce the drainage of extracellular fluids from the retinas [91]. In addition, studies should focus on the relationship between immune cell infiltration and hyperreflective foci in the choroid [92].
6. Optical Coherence Tomography Angiography
Optical coherence tomography angiography (OCTA) delineates three-dimensional retinal vasculature, depending on the differences in the optical reflectivity between sequential multiple B-scan images [93,94,95]. OCTA is the first device that can depict the deep capillary plexuses (Figure 6A,B) [96]. OCTA cannot be used to evaluate BRB breakdown. OCTA is in the process of clinical investigation and can demonstrate the pathogenesis of DME, although there is no consensus regarding the diagnostic criteria. We need to be careful of several artifacts in OCTA imaging [97,98]. In particular, motion artifacts often influence the image processing in diabetic patients with poor fixation. The main findings are microaneurysms, lamellar nonperfusion, and suspended scattering particles in motion (SSPiM) in cystoid spaces.
6.1. Microaneurysms
OCTA visualizes multiple morphologies of microaneurysms, e.g., fusiform and saccular, which may be very similar to the histological findings [5,99]. In contrast, microaneurysms present a dot-like appearance in fundus photography and FA images. Microaneurysms are delineated in the deep OCTA slab images, which is consistent with histological publications showing that many microaneurysms develop in the INL [100,101]. Several publications have focused on the association between vascular hyperpermeability and the characteristics of microaneurysms on OCTA images [102].
6.2. Lamellar Nonperfusion
Automatic quantification of vascular parameters can be applied on en face OCTA images because they have higher contrast and higher signal/noise ratios. The development of layer-by-layer vascular parameters are in progress, e.g., the size and morphological parameters of the FAZ, perfusion metrics (vascular density, vascular length density, and fractal dimension), and nonperfusion metrics (intercapillary area and total avascular area). In particular, retinal thickening or cystoid spaces are often accompanied by capillary nonperfusion in the deep layer [71,73]. It was reported that deep nonperfusion areas are related to photoreceptor damage [103]. An enlarged FAZ and reduced vascular density are predictors of poor visual outcomes after anti-VEGF treatment for DME [104,105]. Future studies should elucidate the relationship between diabetic macular ischemia and DME.
The OCTA slab images in the choriocapillaris layer present the mosaic-like appearance of flow signals in healthy eyes [77]. Loss of such OCTA signal is referred to as flow void in chorioretinal diseases. The flow void gradually increases according to the severity of DR [88]. Future studies should elucidate the pathological interactions between outer retinas and the RPE-choriocapillaris complex.
7. Fundus Autofluorescence
The RPE is the main component of the outer BRB and maintains metabolism in photoreceptor cells [106]. Fundus autofluorescence (FAF) enables us to evaluate the status of the RPE [107]. Two main modalities, short-wavelength (SW) FAF and near-infrared (NIR) FAF, have been clinically introduced. The SW-FAF and NIR-FAF signals are derived from the lipofuscin and melanin, respectively. Since the signal is faint, the media opacity reduces the signal/noise ratio.
The fluorescent signals on SW-FAF images gradually decrease to the fovea in healthy eyes because the signals from the RPE are blocked by the macular pigments in the retinal parenchyma. The signals are reduced in diabetic retinal pigment epitheliopathy. There are associations between FAF signals and visual functions in DME [108,109]. Oval-shaped hyperfluorescence corresponds to the foveal cystoid spaces in CME eyes (Figure 6C) [110].
The NIR-FAF signals increase to the fovea in healthy eyes, according to the density of melanin. A mosaic pattern on NIR-FAF images is often observed in eyes with DME and is associated with foveal photoreceptor damage and subsequent VA reduction [111,112]. Quantitative analysis revealed that NIR-FAF signal levels are negatively related to the logarithm of the minimum angle of resolution (logMAR) and CST (Figure 6D). It remains to be elucidated whether the RPE damage contributes to the exacerbation of DME or vice versa.
8. Emerging Questions
The advances in the modern modalities deepen our understanding the clinical findings on the classical modalities (Table 1). We have discussed the hot topics in fundus imaging rather than its systematic review. Resultantly, there might be bias, although its advances are raising interesting questions regarding the next generation of diagnosis and treatment for DME.
8.1. What Is DME?
We have discussed the clinical feasibility of each imaging modality above. Although there is no doubt that vascular hyperpermeability promotes DME, other mechanisms also contribute to its pathogenesis [4,51,52]. Retinal ischemia increases VEGF expression and subsequent breakdown of the BRB [113]. Capillary nonperfusion in the deep vascular plexus may reduce the ability to drain the extracellular fluids and concomitantly promote their storage [71,73]. Neurodegeneration may be represented by the DRIL and photoreceptor damage on OCT images and RPE changes on FAF images [59,60,70,109,111]. Hyperreflective foci and increases in cytokine levels may represent neuroinflammation in concert with vascular hyperpermeability [43,114]. These results suggest the necessity of an integrative understanding of DME pathology.
8.2. Will the Deep Learning Reduce Our Burden?
Artificial intelligence has been implemented in society and industry. In particular, deep learning is being applied to the medical issues, such as diagnosis, assistance during surgery, and drug discovery. The main concept of the deep learning is the convolutional neural network, which transforms from the complex information of several medical images to an all-or-nothing diagnostic decision. Gulshan and associates demonstrated, for the first time, the performance of the deep learning using fundus photography in the diagnosis of DR [115]. The study was followed by the publications that applied deep learning to OCT images for the automatic diagnosis of DME [116]. These technologies may take the place of the beginning ophthalmologists, or they may learn from the data from artificial intelligence in the medical diagnosis of vision-threatening DR.
Deep learning has an advantage in substituting the subjective evaluation, e.g., DR and CSME diagnosis using fundus photography [2,32]. In contrast, CIDME is objectively and quantitatively diagnosed using OCT, so the introduction of artificial intelligence is controversial [3]. We may apply deep learning to the assessment of subjective findings on sectional OCT images.
Despite its feasibility, we have to grasp the limitations of deep learning. It needs a training dataset, the quality of which influences the accuracy in the outcomes. The processes are in the black box, and these issues may reduce the reproducibility.
8.3. Can Fundus Imaging Offer Customized Medicine?
These imaging modalities deepen our understanding of the pathogenesis of DME. In particular, quantitative parameters, e.g., CST for reversible disease activity and DRIL and nonperfusion metrics for irreversible disease progression, are feasible in the longitudinal study. There are two major strategies to pursue optimized interventions. One strategy is that clinicians may plan therapeutic approaches against the pathogenesis specific to each patient. The other strategy is tailor-made medicine using prognostic factors.
The CST is the surrogate marker in the treatment of DME, although VA improvement and ME resolution are not necessarily consistent [50]. The multiple mechanisms discussed above might explain the paradoxical VA changes. Most circinate hard exudates are accompanied by leaking microaneurysms in their own center and can be treated by focal macular photocoagulation in eyes with CSME but not CIDME. Typical focal fluorescein leakage mostly derives from microaneurysms, which can be coagulated by LASER [33]. In contrast, diffuse fluorescein leakage should be treated by medical interventions including anti-VEGF treatment and ocular steroids [22,117]. Among the potential OCT findings, epiretinal membrane and vitreomacular traction are good biomarkers for vitrectomy even in the era of anti-VEGF therapy [75,118]. We may confirm photoreceptor restoration under anti-VEGF treatment, which is related to VA improvement [65]. This suggests that foveal photoreceptor status is a candidate surrogate marker for anti-VEGF treatment [66].
Some findings on fundus imaging modalities are reported as prognostic factors after intervention in DME. Classically, hard exudates at the fovea are a predictor of subretinal fibrosis and concomitant poor vision after macular photocoagulation for CSME [35,36]. Atrophic creep involving the fovea after photocoagulation also explains the significant reduction in VA. In the era of expensive anti-VEGF treatment, we must take both visual prognosis and socioeconomic burden into consideration. The presence of subretinal fluid is a predictor of visual gain after ranibizumab for DME [25]. The CST is positively associated with the treatment frequency of anti-VEGF drugs [26,27]. We can compare the prognostic factors between individual interventions for the optimized application of treatments.
9. Conclusions and Future Prospects
Multimodal fundus imaging sheds light on the clinical aspects of DME. Many novel findings are defined subjectively. Further investigation should translate these findings into quantitative parameters to introduce objective diagnosis and assessment. Adaptive optics technologies are now being applied to fundus photography and OCT. Their high resolution delineates cellular changes in the retinas. Based on these fundus findings, translational studies from beds to bench will elucidate the molecular mechanisms in DME. The visible parameters on imaging and the invisible parameters in molecular mechanisms reciprocally elucidate the pathogenesis. Hopefully, these challenges will lead to the development of novel treatments. Furthermore, statistical analyses of prognostic factors are also contributing to the promotion of customized medicine. These integrative advances should improve preventive and therapeutic interventions for DME.
Author Contributions
T.M. wrote the draft of the manuscript; K.I., N.T., K.N., K.K. and A.T. revised/edited the manuscript. All authors have read and agreed to the published version of the manuscript.
Funding
This research received no external funding.
Institutional Review Board Statement
Not applicable.
Informed Consent Statement
Not applicable.
Data Availability Statement
Not applicable.
Conflicts of Interest
The authors declare no conflict of interest.
References
- Yau, J.W.; Rogers, S.L.; Kawasaki, R.; Lamoureux, E.L.; Kowalski, J.W.; Bek, T.; Chen, S.J.; Dekker, J.M.; Fletcher, A.; Grauslund, J.; et al. Global prevalence and major risk factors of diabetic retinopathy. Diabetes Care 2012, 35, 556–564. [Google Scholar] [CrossRef] [PubMed]
- Early Treatment Diabetic Retinopathy Study Research Group. Photocoagulation for diabetic macular edema. Early Treatment Diabetic Retinopathy Study report number 1. Arch. Ophthalmol. 1985, 103, 1796–1806. [Google Scholar] [CrossRef]
- Danis, R.P.; Glassman, A.R.; Aiello, L.P.; Antoszyk, A.N.; Beck, R.W.; Browning, D.J.; Ciardella, A.P.; Kinyoun, J.L.; Murtha, T.J.; Topping, T.M.; et al. Diurnal variation in retinal thickening measurement by optical coherence tomography in center-involved diabetic macular edema. Arch. Ophthalmol. 2006, 124, 1701–1707. [Google Scholar] [PubMed]
- Antonetti, D.A.; Klein, R.; Gardner, T.W. Diabetic retinopathy. N. Engl. J. Med. 2012, 366, 1227–1239. [Google Scholar] [CrossRef] [PubMed]
- De Venecia, G.; Davis, M.; Engerman, R. Clinicopathologic correlations in diabetic retinopathy. I. Histology and fluorescein angiography of microaneurysms. Arch. Ophthalmol. 1976, 94, 1766–1773. [Google Scholar] [CrossRef]
- Ashton, N. Studies of the Retinal Capillaries in Relation to Diabetic and Other Retinopathies. Br. J. Ophthalmol. 1963, 47, 521–538. [Google Scholar] [CrossRef]
- Kuwabara, T.; Cogan, D.G. Retinal vascular patterns. VI. Mural cells of the retinal capillaries. Arch. Ophthalmol. 1963, 69, 492–502. [Google Scholar] [CrossRef]
- Fine, B.S.; Brucker, A.J. Macular edema and cystoid macular edema. Am. J. Ophthalmol. 1981, 92, 466–481. [Google Scholar] [CrossRef]
- Wolter, J.R. The histopathology of cystoid macular edema. Albrecht Von Graefes Arch. Für Klin. Und Exp. Ophthalmol. 1981, 216, 85–101. [Google Scholar] [CrossRef]
- Tso, M.O. Pathology of cystoid macular edema. Ophthalmology 1982, 89, 902–915. [Google Scholar] [CrossRef]
- Yanoff, M.; Fine, B.S.; Brucker, A.J.; Eagle, R.C., Jr. Pathology of human cystoid macular edema. Surv. Ophthalmol. 1984, 28 (Suppl. S2), 505–511. [Google Scholar] [CrossRef] [PubMed]
- Antonetti, D.A.; Barber, A.J.; Khin, S.; Lieth, E.; Tarbell, J.M.; Gardner, T.W. Vascular permeability in experimental diabetes is associated with reduced endothelial occludin content: Vascular endothelial growth factor decreases occludin in retinal endothelial cells. Penn State Retina Research Group. Diabetes 1998, 47, 1953–1959. [Google Scholar] [CrossRef] [PubMed]
- Barber, A.J.; Antonetti, D.A.; Gardner, T.W. Altered expression of retinal occludin and glial fibrillary acidic protein in experimental diabetes. The Penn State Retina Research Group. Investig. Ophthalmol. Vis. Sci. 2000, 41, 3561–3568. [Google Scholar]
- Murakami, T.; Frey, T.; Lin, C.; Antonetti, D.A. Protein kinase cbeta phosphorylates occludin regulating tight junction trafficking in vascular endothelial growth factor-induced permeability in vivo. Diabetes 2012, 61, 1573–1583. [Google Scholar] [CrossRef]
- Bresnick, G.H.; Davis, M.D.; Myers, F.L.; de Venecia, G. Clinicopathologic correlations in diabetic retinopathy. II. Clinical and histologic appearances of retinal capillary microaneurysms. Arch. Ophthalmol. 1977, 95, 1215–1220. [Google Scholar] [CrossRef] [PubMed]
- Takagi, H.; Otani, A.; Kiryu, J.; Ogura, Y. New surgical approach for removing massive foveal hard exudates in diabetic macular edema. Ophthalmology 1999, 106, 249–256; discussion 256–257. [Google Scholar] [CrossRef]
- Toussaint, D.; Cogan, D.G.; Kuwabara, T. Extravascular lesions of diabetic retinopathy. Arch. Ophthalmol. 1962, 67, 42–47. [Google Scholar] [CrossRef]
- Aiello, L.P.; Avery, R.L.; Arrigg, P.G.; Keyt, B.A.; Jampel, H.D.; Shah, S.T.; Pasquale, L.R.; Thieme, H.; Iwamoto, M.A.; Park, J.E.; et al. Vascular endothelial growth factor in ocular fluid of patients with diabetic retinopathy and other retinal disorders. N. Engl. J. Med. 1994, 331, 1480–1487. [Google Scholar] [CrossRef]
- Funatsu, H.; Yamashita, H.; Noma, H.; Mimura, T.; Yamashita, T.; Hori, S. Increased levels of vascular endothelial growth factor and interleukin-6 in the aqueous humor of diabetics with macular edema. Am. J. Ophthalmol. 2002, 133, 70–77. [Google Scholar] [CrossRef]
- Murakami, T.; Felinski, E.A.; Antonetti, D.A. Occludin phosphorylation and ubiquitination regulate tight junction trafficking and vascular endothelial growth factor-induced permeability. J. Biol. Chem. 2009, 284, 21036–21046. [Google Scholar] [CrossRef]
- Cunningham, E.T., Jr.; Adamis, A.P.; Altaweel, M.; Aiello, L.P.; Bressler, N.M.; D’Amico, D.J.; Goldbaum, M.; Guyer, D.R.; Katz, B.; Patel, M.; et al. A phase II randomized double-masked trial of pegaptanib, an anti-vascular endothelial growth factor aptamer, for diabetic macular edema. Ophthalmology 2005, 112, 1747–1757. [Google Scholar] [PubMed]
- Elman, M.J.; Aiello, L.P.; Beck, R.W.; Bressler, N.M.; Bressler, S.B.; Edwards, A.R.; Ferris, F.L., 3rd; Friedman, S.M.; Glassman, A.R.; Miller, K.M.; et al. Randomized trial evaluating ranibizumab plus prompt or deferred laser or triamcinolone plus prompt laser for diabetic macular edema. Ophthalmology 2010, 117, 1064–1077.e35. [Google Scholar] [CrossRef] [PubMed]
- Korobelnik, J.F.; Do, D.V.; Schmidt-Erfurth, U.; Boyer, D.S.; Holz, F.G.; Heier, J.S.; Midena, E.; Kaiser, P.K.; Terasaki, H.; Marcus, D.M.; et al. Intravitreal aflibercept for diabetic macular edema. Ophthalmology 2014, 121, 2247–2254. [Google Scholar] [CrossRef] [PubMed]
- Virgili, G.; Parravano, M.; Evans, J.R.; Gordon, I.; Lucenteforte, E. Anti-vascular endothelial growth factor for diabetic macular oedema: A network meta-analysis. Cochrane Database Syst. Rev. 2018, 10, CD007419. [Google Scholar] [CrossRef]
- Sophie, R.; Lu, N.; Campochiaro, P.A. Predictors of Functional and Anatomic Outcomes in Patients with Diabetic Macular Edema Treated with Ranibizumab. Ophthalmology 2015, 122, 1395–1401. [Google Scholar] [CrossRef]
- Wykoff, C.C.; Elman, M.J.; Regillo, C.D.; Ding, B.; Lu, N.; Stoilov, I. Predictors of Diabetic Macular Edema Treatment Frequency with Ranibizumab During the Open-Label Extension of the RIDE and RISE Trials. Ophthalmology 2016, 123, 1716–1721. [Google Scholar] [CrossRef]
- Mori, Y.; Murakami, T.; Suzuma, K.; Ishihara, K.; Yoshitake, S.; Fujimoto, M.; Dodo, Y.; Yoshitake, T.; Miwa, Y.; Tsujikawa, A. Relation between macular morphology and treatment frequency during twelve months with ranibizumab for diabetic macular edema. PLoS ONE 2017, 12, e0175809. [Google Scholar] [CrossRef]
- Yoshitake, T.; Murakami, T.; Yoshitake, S.; Suzuma, K.; Dodo, Y.; Fujimoto, M.; Tsujikawa, A. Anti-Fumarase Antibody as a Predictor of Functional Efficacy of Anti-VEGF Therapy for Diabetic Macular Edema. Investig. Ophthalmol. Vis. Sci. 2019, 60, 787–794. [Google Scholar] [CrossRef]
- Terada, N.; Murakami, T.; Uji, A.; Dodo, Y.; Mori, Y.; Tsujikawa, A. Hyperreflective Walls in Foveal Cystoid Spaces as a Biomarker of Diabetic Macular Edema Refractory to Anti-VEGF Treatment. Sci. Rep. 2020, 10, 7299. [Google Scholar] [CrossRef]
- Yoshitake, T.; Murakami, T.; Suzuma, K.; Dodo, Y.; Fujimoto, M.; Tsujikawa, A. Hyperreflective Foci in the Outer Retinal Layers as a Predictor of the Functional Efficacy of Ranibizumab for Diabetic Macular Edema. Sci. Rep. 2020, 10, 873. [Google Scholar] [CrossRef]
- Wells, J.A.; Glassman, A.R.; Ayala, A.R.; Jampol, L.M.; Aiello, L.P.; Antoszyk, A.N.; Arnold-Bush, B.; Baker, C.W.; Bressler, N.M.; Browning, D.J.; et al. Aflibercept, bevacizumab, or ranibizumab for diabetic macular edema. N. Engl. J. Med. 2015, 372, 1193–1203. [Google Scholar] [CrossRef] [PubMed]
- Wilkinson, C.P.; Ferris, F.L., 3rd; Klein, R.E.; Lee, P.P.; Agardh, C.D.; Davis, M.; Dills, D.; Kampik, A.; Pararajasegaram, R.; Verdaguer, J.T. Proposed international clinical diabetic retinopathy and diabetic macular edema disease severity scales. Ophthalmology 2003, 110, 1677–1682. [Google Scholar] [CrossRef] [PubMed]
- Browning, D.J.; Altaweel, M.M.; Bressler, N.M.; Bressler, S.B.; Scott, I.U. Diabetic macular edema: What is focal and what is diffuse? Am. J. Ophthalmol. 2008, 146, 649–655, 655.e6. [Google Scholar] [CrossRef] [PubMed]
- Cusick, M.; Chew, E.Y.; Chan, C.C.; Kruth, H.S.; Murphy, R.P.; Ferris, F.L., 3rd. Histopathology and regression of retinal hard exudates in diabetic retinopathy after reduction of elevated serum lipid levels. Ophthalmology 2003, 110, 2126–2133. [Google Scholar] [CrossRef]
- Chew, E.Y.; Klein, M.L.; Ferris, F.L., 3rd; Remaley, N.A.; Murphy, R.P.; Chantry, K.; Hoogwerf, B.J.; Miller, D. Association of elevated serum lipid levels with retinal hard exudate in diabetic retinopathy. Early Treatment Diabetic Retinopathy Study (ETDRS) Report 22. Arch. Ophthalmol. 1996, 114, 1079–1084. [Google Scholar] [CrossRef]
- Fong, D.S.; Segal, P.P.; Myers, F.; Ferris, F.L.; Hubbard, L.D.; Davis, M.D. Subretinal fibrosis in diabetic macular edema. ETDRS report 23. Early Treatment Diabetic Retinopathy Study Research Group. Arch. Ophthalmol. 1997, 115, 873–877. [Google Scholar] [CrossRef]
- Silva, P.S.; Dela Cruz, A.J.; Ledesma, M.G.; van Hemert, J.; Radwan, A.; Cavallerano, J.D.; Aiello, L.M.; Sun, J.K.; Aiello, L.P. Diabetic Retinopathy Severity and Peripheral Lesions Are Associated with Nonperfusion on Ultrawide Field Angiography. Ophthalmology 2015, 122, 2465–2472. [Google Scholar] [CrossRef]
- Arichika, S.; Uji, A.; Hangai, M.; Ooto, S.; Yoshimura, N. Noninvasive and direct monitoring of erythrocyte aggregates in human retinal microvasculature using adaptive optics scanning laser ophthalmoscopy. Investig. Ophthalmol. Vis. Sci. 2013, 54, 4394–4402. [Google Scholar] [CrossRef]
- Nesper, P.L.; Scarinci, F.; Fawzi, A.A. Adaptive Optics Reveals Photoreceptor Abnormalities in Diabetic Macular Ischemia. PLoS ONE 2017, 12, e0169926. [Google Scholar] [CrossRef]
- Spaide, R.F.; Klancnik, J.M., Jr.; Cooney, M.J. Retinal vascular layers imaged by fluorescein angiography and optical coherence tomography angiography. JAMA Ophthalmol. 2015, 133, 45–50. [Google Scholar] [CrossRef]
- Nozaki, M.; Kato, A.; Yasukawa, T.; Suzuki, K.; Yoshida, M.; Ogura, Y. Indocyanine green angiography-guided focal navigated laser photocoagulation for diabetic macular edema. Jpn. J. Ophthalmol. 2019, 63, 243–254. [Google Scholar] [CrossRef] [PubMed]
- Nassif, N.; Cense, B.; Park, B.; Pierce, M.; Yun, S.; Bouma, B.; Tearney, G.; Chen, T.; de Boer, J. In vivo high-resolution video-rate spectral-domain optical coherence tomography of the human retina and optic nerve. Opt. Express 2004, 12, 367–376. [Google Scholar] [CrossRef] [PubMed]
- Bolz, M.; Schmidt-Erfurth, U.; Deak, G.; Mylonas, G.; Kriechbaum, K.; Scholda, C. Optical coherence tomographic hyperreflective foci: A morphologic sign of lipid extravasation in diabetic macular edema. Ophthalmology 2009, 116, 914–920. [Google Scholar] [CrossRef] [PubMed]
- Murakami, T.; Yoshimura, N. Structural changes in individual retinal layers in diabetic macular edema. J. Diabetes Res. 2013, 2013, 920713. [Google Scholar] [CrossRef] [PubMed]
- Huang, D.; Swanson, E.A.; Lin, C.P.; Schuman, J.S.; Stinson, W.G.; Chang, W.; Hee, M.R.; Flotte, T.; Gregory, K.; Puliafito, C.A.; et al. Optical coherence tomography. Science 1991, 254, 1178–1181. [Google Scholar] [CrossRef]
- Lim, H.; de Boer, J.F.; Park, B.H.; Lee, E.C.; Yelin, R.; Yun, S.H. Optical frequency domain imaging with a rapidly swept laser in the 815-870 nm range. Opt. Express 2006, 14, 5937–5944. [Google Scholar] [CrossRef] [PubMed]
- Zawadzki, R.J.; Jones, S.M.; Olivier, S.S.; Zhao, M.; Bower, B.A.; Izatt, J.A.; Choi, S.; Laut, S.; Werner, J.S. Adaptive-optics optical coherence tomography for high-resolution and high-speed 3D retinal in vivo imaging. Opt. Express 2005, 13, 8532–8546. [Google Scholar] [CrossRef]
- Liu, Z.; Kurokawa, K.; Zhang, F.; Lee, J.J.; Miller, D.T. Imaging and quantifying ganglion cells and other transparent neurons in the living human retina. Proc. Natl. Acad. Sci. USA 2017, 114, 12803–12808. [Google Scholar] [CrossRef]
- Yoshitake, T.; Murakami, T.; Suzuma, K.; Fujimoto, M.; Dodo, Y.; Tsujikawa, A. Predictor of Early Remission of Diabetic Macular Edema under As-Needed Intravitreal Ranibizumab. Sci. Rep. 2019, 9, 7599. [Google Scholar] [CrossRef]
- Browning, D.J.; Glassman, A.R.; Aiello, L.P.; Beck, R.W.; Brown, D.M.; Fong, D.S.; Bressler, N.M.; Danis, R.P.; Kinyoun, J.L.; Nguyen, Q.D.; et al. Relationship between optical coherence tomography-measured central retinal thickness and visual acuity in diabetic macular edema. Ophthalmology 2007, 114, 525–536. [Google Scholar]
- Gardner, T.W.; Antonetti, D.A.; Barber, A.J.; LaNoue, K.F.; Levison, S.W. Diabetic retinopathy: More than meets the eye. Surv. Ophthalmol. 2002, 47 (Suppl. S2), S253–S262. [Google Scholar] [CrossRef]
- Bressler, N.M.; Odia, I.; Maguire, M.; Glassman, A.R.; Jampol, L.M.; MacCumber, M.W.; Shah, C.; Rosberger, D.; Sun, J.K.; Network, D.R. Association Between Change in Visual Acuity and Change in Central Subfield Thickness During Treatment of Diabetic Macular Edema in Participants Randomized to Aflibercept, Bevacizumab, or Ranibizumab: A Post Hoc Analysis of the Protocol T Randomized Clinical Trial. JAMA Ophthalmol. 2019, 137, 977–985. [Google Scholar]
- Otani, T.; Kishi, S.; Maruyama, Y. Patterns of diabetic macular edema with optical coherence tomography. Am. J. Ophthalmol. 1999, 127, 688–693. [Google Scholar] [CrossRef] [PubMed]
- Otani, T.; Kishi, S. Correlation between optical coherence tomography and fluorescein angiography findings in diabetic macular edema. Ophthalmology 2007, 114, 104–107. [Google Scholar] [CrossRef]
- Bolz, M.; Ritter, M.; Schneider, M.; Simader, C.; Scholda, C.; Schmidt-Erfurth, U. A systematic correlation of angiography and high-resolution optical coherence tomography in diabetic macular edema. Ophthalmology 2009, 116, 66–72. [Google Scholar] [CrossRef] [PubMed]
- Murakami, T.; Nishijima, K.; Sakamoto, A.; Ota, M.; Horii, T.; Yoshimura, N. Foveal cystoid spaces are associated with enlarged foveal avascular zone and microaneurysms in diabetic macular edema. Ophthalmology 2011, 118, 359–367. [Google Scholar] [CrossRef] [PubMed]
- Murakami, T.; Uji, A.; Ogino, K.; Unoki, N.; Horii, T.; Yoshitake, S.; Nishijima, K.; Yoshimura, N. Association between Perifoveal Hyperfluorescence and Serous Retinal Detachment in Diabetic Macular Edema. Ophthalmology 2013, 120, 2596–2603. [Google Scholar] [CrossRef]
- Staurenghi, G.; Sadda, S.; Chakravarthy, U.; Spaide, R.F. Proposed lexicon for anatomic landmarks in normal posterior segment spectral-domain optical coherence tomography: The IN*OCT consensus. Ophthalmology 2014, 121, 1572–1578. [Google Scholar] [CrossRef]
- Sakamoto, A.; Nishijima, K.; Kita, M.; Oh, H.; Tsujikawa, A.; Yoshimura, N. Association between foveal photoreceptor status and visual acuity after resolution of diabetic macular edema by pars plana vitrectomy. Graefe’s Arch. Clin. Exp. Ophthalmol. 2009, 247, 1325–1330. [Google Scholar] [CrossRef]
- Murakami, T.; Nishijima, K.; Akagi, T.; Uji, A.; Horii, T.; Ueda-Arakawa, N.; Muraoka, Y.; Yoshimura, N. Optical coherence tomographic reflectivity of photoreceptors beneath cystoid spaces in diabetic macular edema. Investig. Ophthalmol. Vis. Sci. 2012, 53, 1506–1511. [Google Scholar] [CrossRef]
- Otani, T.; Yamaguchi, Y.; Kishi, S. Correlation between visual acuity and foveal microstructural changes in diabetic macular edema. Retina 2010, 30, 774–780. [Google Scholar] [CrossRef] [PubMed]
- Alasil, T.; Keane, P.A.; Updike, J.F.; Dustin, L.; Ouyang, Y.; Walsh, A.C.; Sadda, S.R. Relationship between optical coherence tomography retinal parameters and visual acuity in diabetic macular edema. Ophthalmology 2010, 117, 2379–2386. [Google Scholar] [CrossRef] [PubMed]
- Forooghian, F.; Stetson, P.F.; Meyer, S.A.; Chew, E.Y.; Wong, W.T.; Cukras, C.; Meyerle, C.B.; Ferris, F.L., 3rd. Relationship between photoreceptor outer segment length and visual acuity in diabetic macular edema. Retina 2010, 30, 63–70. [Google Scholar] [CrossRef] [PubMed]
- Yoshitake, S.; Murakami, T.; Suzuma, K.; Yoshitake, T.; Uji, A.; Morooka, S.; Dodo, Y.; Fujimoto, M.; Shan, Y.; Fort, P.E.; et al. Anti-fumarase antibody promotes the dropout of photoreceptor inner and outer segments in diabetic macular oedema. Diabetologia 2019, 62, 504–516. [Google Scholar] [CrossRef]
- Mori, Y.; Suzuma, K.; Uji, A.; Ishihara, K.; Yoshitake, S.; Fujimoto, M.; Dodo, Y.; Yoshitake, T.; Miwa, Y.; Murakami, T. Restoration of foveal photoreceptors after intravitreal ranibizumab injections for diabetic macular edema. Sci. Rep. 2016, 6, 39161. [Google Scholar] [CrossRef]
- Ehlers, J.P.; Uchida, A.; Hu, M.; Figueiredo, N.; Kaiser, P.K.; Heier, J.S.; Brown, D.M.; Boyer, D.S.; Do, D.V.; Gibson, A.; et al. Higher-Order Assessment of OCT in Diabetic Macular Edema from the VISTA Study: Ellipsoid Zone Dynamics and the Retinal Fluid Index. Ophthalmol. Retin. 2019, 3, 1056–1066. [Google Scholar] [CrossRef]
- Uji, A.; Murakami, T.; Nishijima, K.; Akagi, T.; Horii, T.; Arakawa, N.; Muraoka, Y.; Ellabban, A.A.; Yoshimura, N. Association between hyperreflective foci in the outer retina, status of photoreceptor layer, and visual acuity in diabetic macular edema. Am. J. Ophthalmol. 2012, 153, 710–717.e1. [Google Scholar] [CrossRef]
- Ota, M.; Nishijima, K.; Sakamoto, A.; Murakami, T.; Takayama, K.; Horii, T.; Yoshimura, N. Optical coherence tomographic evaluation of foveal hard exudates in patients with diabetic maculopathy accompanying macular detachment. Ophthalmology 2010, 117, 1996–2002. [Google Scholar] [CrossRef]
- Framme, C.; Schweizer, P.; Imesch, M.; Wolf, S.; Wolf-Schnurrbusch, U. Behavior of SD-OCT-detected hyperreflective foci in the retina of anti-VEGF-treated patients with diabetic macular edema. Investig. Ophthalmol. Vis. Sci. 2012, 53, 5814–5818. [Google Scholar] [CrossRef]
- Sun, J.K.; Lin, M.M.; Lammer, J.; Prager, S.; Sarangi, R.; Silva, P.S.; Aiello, L.P. Disorganization of the retinal inner layers as a predictor of visual acuity in eyes with center-involved diabetic macular edema. JAMA Ophthalmol. 2014, 132, 1309–1316. [Google Scholar] [CrossRef]
- Spaide, R.F. Volume-Rendered Angiographic and Structural Optical Coherence Tomography. Retina 2015, 35, 2181–2187. [Google Scholar] [CrossRef] [PubMed]
- Cheung, C.M.G.; Fawzi, A.; Teo, K.Y.; Fukuyama, H.; Sen, S.; Tsai, W.S.; Sivaprasad, S. Diabetic macular ischaemia—A new therapeutic target? Prog. Retin. Eye Res. 2022, 89, 101033. [Google Scholar] [CrossRef] [PubMed]
- Dodo, Y.; Murakami, T.; Suzuma, K.; Yoshitake, S.; Yoshitake, T.; Ishihara, K.; Fujimoto, M.; Miwa, Y.; Tsujikawa, A. Diabetic Neuroglial Changes in the Superficial and Deep Nonperfused Areas on Optical Coherence Tomography Angiography. Investig. Ophthalmol. Vis. Sci. 2017, 58, 5870–5879. [Google Scholar] [CrossRef] [PubMed]
- Dodo, Y.; Murakami, T.; Uji, A.; Yoshitake, S.; Yoshimura, N. Disorganized retinal lamellar structures in nonperfused areas of diabetic retinopathy. Investig. Ophthalmol. Vis. Sci. 2015, 56, 2012–2020. [Google Scholar] [CrossRef]
- Haller, J.A.; Qin, H.; Apte, R.S.; Beck, R.R.; Bressler, N.M.; Browning, D.J.; Danis, R.P.; Glassman, A.R.; Googe, J.M.; Kollman, C.; et al. Vitrectomy outcomes in eyes with diabetic macular edema and vitreomacular traction. Ophthalmology 2010, 117, 1087–1093.e3. [Google Scholar]
- Lewis, H.; Abrams, G.W.; Blumenkranz, M.S.; Campo, R.V. Vitrectomy for diabetic macular traction and edema associated with posterior hyaloidal traction. Ophthalmology 1992, 99, 753–759. [Google Scholar] [CrossRef]
- Borrelli, E.; Sarraf, D.; Freund, K.B.; Sadda, S.R. OCT angiography and evaluation of the choroid and choroidal vascular disorders. Prog. Retin. Eye Res. 2018, 67, 30–55. [Google Scholar] [CrossRef]
- Adhi, M.; Brewer, E.; Waheed, N.K.; Duker, J.S. Analysis of morphological features and vascular layers of choroid in diabetic retinopathy using spectral-domain optical coherence tomography. JAMA Ophthalmol. 2013, 131, 1267–1274. [Google Scholar] [CrossRef]
- Hua, R.; Liu, L.; Wang, X.; Chen, L. Imaging evidence of diabetic choroidopathy in vivo: Angiographic pathoanatomy and choroidal-enhanced depth imaging. PLoS ONE 2013, 8, e83494. [Google Scholar] [CrossRef]
- Xu, J.; Xu, L.; Du, K.F.; Shao, L.; Chen, C.X.; Zhou, J.Q.; Wang, Y.X.; You, Q.S.; Jonas, J.B.; Wei, W.B. Subfoveal choroidal thickness in diabetes and diabetic retinopathy. Ophthalmology 2013, 120, 2023–2028. [Google Scholar] [CrossRef]
- Esmaeelpour, M.; Kajic, V.; Zabihian, B.; Othara, R.; Ansari-Shahrezaei, S.; Kellner, L.; Krebs, I.; Nemetz, S.; Kraus, M.F.; Hornegger, J.; et al. Choroidal Haller’s and Sattler’s layer thickness measurement using 3-dimensional 1060-nm optical coherence tomography. PLoS ONE 2014, 9, e99690. [Google Scholar] [CrossRef]
- Gerendas, B.S.; Waldstein, S.M.; Simader, C.; Deak, G.; Hajnajeeb, B.; Zhang, L.; Bogunovic, H.; Abramoff, M.D.; Kundi, M.; Sonka, M.; et al. Three-dimensional automated choroidal volume assessment on standard spectral-domain optical coherence tomography and correlation with the level of diabetic macular edema. Am. J. Ophthalmol. 2014, 158, 1039–1048. [Google Scholar] [CrossRef]
- Wei, W.B.; Xu, L.; Jonas, J.B.; Shao, L.; Du, K.F.; Wang, S.; Chen, C.X.; Xu, J.; Wang, Y.X.; Zhou, J.Q.; et al. Subfoveal choroidal thickness: The Beijing Eye Study. Ophthalmology 2013, 120, 175–180. [Google Scholar] [CrossRef]
- Gupta, P.; Jing, T.; Marziliano, P.; Cheung, C.Y.; Baskaran, M.; Lamoureux, E.L.; Wong, T.Y.; Cheung, C.M.; Cheng, C.Y. Distribution and determinants of choroidal thickness and volume using automated segmentation software in a population-based study. Am. J. Ophthalmol. 2015, 159, 293–301.e3. [Google Scholar] [CrossRef] [PubMed]
- Song, Y.; Tham, Y.C.; Chong, C.; Ong, R.; Fenner, B.J.; Cheong, K.X.; Takahashi, K.; Jordan-Yu, J.M.; Teo, K.Y.C.; Tan, A.C.S.; et al. Patterns and Determinants of Choroidal Thickness in a Multiethnic Asian Population: The Singapore Epidemiology of Eye Diseases Study. Ophthalmol. Retin. 2021, 5, 458–467. [Google Scholar] [CrossRef]
- Murakami, T.; Uji, A.; Suzuma, K.; Dodo, Y.; Yoshitake, S.; Ghashut, R.; Yoza, R.; Fujimoto, M.; Yoshimura, N. In Vivo Choroidal Vascular Lesions in Diabetes on Swept-Source Optical Coherence Tomography. PLoS ONE 2016, 11, e0160317. [Google Scholar] [CrossRef] [PubMed]
- Ferrara, D.; Waheed, N.K.; Duker, J.S. Investigating the choriocapillaris and choroidal vasculature with new optical coherence tomography technologies. Prog. Retin. Eye Res. 2016, 52, 130–155. [Google Scholar] [CrossRef] [PubMed]
- Dodo, Y.; Suzuma, K.; Ishihara, K.; Yoshitake, S.; Fujimoto, M.; Yoshitake, T.; Miwa, Y.; Murakami, T. Clinical relevance of reduced decorrelation signals in the diabetic inner choroid on optical coherence tomography angiography. Sci. Rep. 2017, 7, 5227. [Google Scholar] [CrossRef] [PubMed]
- Hidayat, A.A.; Fine, B.S. Diabetic choroidopathy. Light and electron microscopic observations of seven cases. Ophthalmology 1985, 92, 512–522. [Google Scholar] [CrossRef] [PubMed]
- Cao, J.; McLeod, S.; Merges, C.A.; Lutty, G.A. Choriocapillaris degeneration and related pathologic changes in human diabetic eyes. Arch. Ophthalmol. 1998, 116, 589–597. [Google Scholar] [CrossRef] [PubMed]
- Lutty, G.A. Diabetic choroidopathy. Vis. Res. 2017, 139, 161–167. [Google Scholar] [CrossRef] [PubMed]
- McMenamin, P.G.; Saban, D.R.; Dando, S.J. Immune cells in the retina and choroid: Two different tissue environments that require different defenses and surveillance. Prog. Retin. Eye Res. 2019, 70, 85–98. [Google Scholar] [CrossRef] [PubMed]
- Jia, Y.; Tan, O.; Tokayer, J.; Potsaid, B.; Wang, Y.; Liu, J.J.; Kraus, M.F.; Subhash, H.; Fujimoto, J.G.; Hornegger, J.; et al. Split-spectrum amplitude-decorrelation angiography with optical coherence tomography. Opt. Express 2012, 20, 4710–4725. [Google Scholar] [CrossRef]
- Schwartz, D.M.; Fingler, J.; Kim, D.Y.; Zawadzki, R.J.; Morse, L.S.; Park, S.S.; Fraser, S.E.; Werner, J.S. Phase-variance optical coherence tomography: A technique for noninvasive angiography. Ophthalmology 2014, 121, 180–187. [Google Scholar] [CrossRef]
- Choi, W.; Mohler, K.J.; Potsaid, B.; Lu, C.D.; Liu, J.J.; Jayaraman, V.; Cable, A.E.; Duker, J.S.; Huber, R.; Fujimoto, J.G. Choriocapillaris and choroidal microvasculature imaging with ultrahigh speed OCT angiography. PLoS ONE 2013, 8, e81499. [Google Scholar] [CrossRef] [PubMed]
- Spaide, R.F.; Fujimoto, J.G.; Waheed, N.K.; Sadda, S.R.; Staurenghi, G. Optical coherence tomography angiography. Prog. Retin. Eye Res. 2018, 64, 1–55. [Google Scholar] [CrossRef] [PubMed]
- Spaide, R.F.; Fujimoto, J.G.; Waheed, N.K. Image Artifacts in Optical Coherence Tomography Angiography. Retina 2015, 35, 2163–2180. [Google Scholar] [CrossRef]
- Ghasemi Falavarjani, K.; Al-Sheikh, M.; Akil, H.; Sadda, S.R. Image artefacts in swept-source optical coherence tomography angiography. Br. J. Ophthalmol. 2017, 101, 564–568. [Google Scholar] [CrossRef]
- Stitt, A.W.; Gardiner, T.A.; Archer, D.B. Histological and ultrastructural investigation of retinal microaneurysm development in diabetic patients. Br. J. Ophthalmol. 1995, 79, 362–367. [Google Scholar] [CrossRef]
- Miwa, Y.; Murakami, T.; Suzuma, K.; Uji, A.; Yoshitake, S.; Fujimoto, M.; Yoshitake, T.; Tamura, Y.; Yoshimura, N. Relationship between Functional and Structural Changes in Diabetic Vessels in Optical Coherence Tomography Angiography. Sci. Rep. 2016, 6, 29064. [Google Scholar] [CrossRef]
- Horii, T.; Murakami, T.; Nishijima, K.; Sakamoto, A.; Ota, M.; Yoshimura, N. Optical coherence tomographic characteristics of microaneurysms in diabetic retinopathy. Am. J. Ophthalmol. 2010, 150, 840–848. [Google Scholar] [CrossRef]
- Hasegawa, N.; Nozaki, M.; Takase, N.; Yoshida, M.; Ogura, Y. New Insights into Microaneurysms in the Deep Capillary Plexus Detected by Optical Coherence Tomography Angiography in Diabetic Macular Edema. Investig. Ophthalmol. Vis. Sci. 2016, 57, OCT348-55. [Google Scholar] [CrossRef]
- Scarinci, F.; Nesper, P.L.; Fawzi, A.A. Deep Retinal Capillary Nonperfusion Is Associated with Photoreceptor Disruption in Diabetic Macular Ischemia. Am. J. Ophthalmol. 2016, 168, 129–138. [Google Scholar] [CrossRef]
- Lee, J.; Moon, B.G.; Cho, A.R.; Yoon, Y.H. Optical Coherence Tomography Angiography of DME and Its Association with Anti-VEGF Treatment Response. Ophthalmology 2016, 123, 2368–2375. [Google Scholar] [CrossRef]
- Ghasemi Falavarjani, K.; Iafe, N.A.; Hubschman, J.P.; Tsui, I.; Sadda, S.R.; Sarraf, D. Optical Coherence Tomography Angiography Analysis of the Foveal Avascular Zone and Macular Vessel Density After Anti-VEGF Therapy in Eyes with Diabetic Macular Edema and Retinal Vein Occlusion. Investig. Ophthalmol. Vis. Sci. 2017, 58, 30–34. [Google Scholar] [CrossRef]
- Strauss, O. The retinal pigment epithelium in visual function. Physiol. Rev. 2005, 85, 845–881. [Google Scholar] [CrossRef]
- Delori, F.C.; Dorey, C.K.; Staurenghi, G.; Arend, O.; Goger, D.G.; Weiter, J.J. In vivo fluorescence of the ocular fundus exhibits retinal pigment epithelium lipofuscin characteristics. Investig. Ophthalmol. Vis. Sci. 1995, 36, 718–729. [Google Scholar]
- Vujosevic, S.; Casciano, M.; Pilotto, E.; Boccassini, B.; Varano, M.; Midena, E. Diabetic macular edema: Fundus autofluorescence and functional correlations. Investig. Ophthalmol. Vis. Sci. 2011, 52, 442–448. [Google Scholar] [CrossRef]
- Chung, H.; Park, B.; Shin, H.J.; Kim, H.C. Correlation of fundus autofluorescence with spectral-domain optical coherence tomography and vision in diabetic macular edema. Ophthalmology 2012, 119, 1056–1065. [Google Scholar] [CrossRef]
- Bessho, K.; Gomi, F.; Harino, S.; Sawa, M.; Sayanagi, K.; Tsujikawa, M.; Tano, Y. Macular autofluorescence in eyes with cystoid macula edema, detected with 488 nm-excitation but not with 580 nm-excitation. Graefe’s Arch. Clin. Exp. Ophthalmol. 2009, 247, 729–734. [Google Scholar] [CrossRef]
- Yoshitake, S.; Murakami, T.; Horii, T.; Uji, A.; Ogino, K.; Unoki, N.; Nishijima, K.; Yoshimura, N. Qualitative and quantitative characteristics of near-infrared autofluorescence in diabetic macular edema. Ophthalmology 2014, 121, 1036–1044. [Google Scholar] [CrossRef] [PubMed]
- Yoshitake, S.; Murakami, T.; Uji, A.; Fujimoto, M.; Dodo, Y.; Suzuma, K.; Tsujikawa, A. Granular lesions of short-wavelength and near-infrared autofluorescence in diabetic macular oedema. Eye 2019, 33, 564–571. [Google Scholar] [CrossRef]
- Aiello, L.P.; Bursell, S.E.; Clermont, A.; Duh, E.; Ishii, H.; Takagi, C.; Mori, F.; Ciulla, T.A.; Ways, K.; Jirousek, M.; et al. Vascular endothelial growth factor-induced retinal permeability is mediated by protein kinase C in vivo and suppressed by an orally effective beta-isoform-selective inhibitor. Diabetes 1997, 46, 1473–1480. [Google Scholar] [CrossRef] [PubMed]
- Noma, H.; Mimura, T.; Yasuda, K.; Shimura, M. Role of inflammation in diabetic macular edema. Ophthalmologica 2014, 232, 127–135. [Google Scholar] [CrossRef] [PubMed]
- Gulshan, V.; Peng, L.; Coram, M.; Stumpe, M.C.; Wu, D.; Narayanaswamy, A.; Venugopalan, S.; Widner, K.; Madams, T.; Cuadros, J.; et al. Development and Validation of a Deep Learning Algorithm for Detection of Diabetic Retinopathy in Retinal Fundus Photographs. JAMA 2016, 316, 2402–2410. [Google Scholar] [CrossRef]
- Tang, F.; Wang, X.; Ran, A.R.; Chan, C.K.M.; Ho, M.; Yip, W.; Young, A.L.; Lok, J.; Szeto, S.; Chan, J.; et al. A Multitask Deep-Learning System to Classify Diabetic Macular Edema for Different Optical Coherence Tomography Devices: A Multicenter Analysis. Diabetes Care 2021, 44, 2078–2088. [Google Scholar] [CrossRef]
- Jonas, J.B.; Sofker, A. Intraocular injection of crystalline cortisone as adjunctive treatment of diabetic macular edema. Am. J. Ophthalmol. 2001, 132, 425–427. [Google Scholar] [CrossRef]
- Flaxel, C.J.; Edwards, A.R.; Aiello, L.P.; Arrigg, P.G.; Beck, R.W.; Bressler, N.M.; Bressler, S.B.; Ferris, F.L., 3rd; Gupta, S.K.; Haller, J.A.; et al. Factors associated with visual acuity outcomes after vitrectomy for diabetic macular edema: Diabetic retinopathy clinical research network. Retina 2010, 30, 1488–1495. [Google Scholar] [CrossRef]
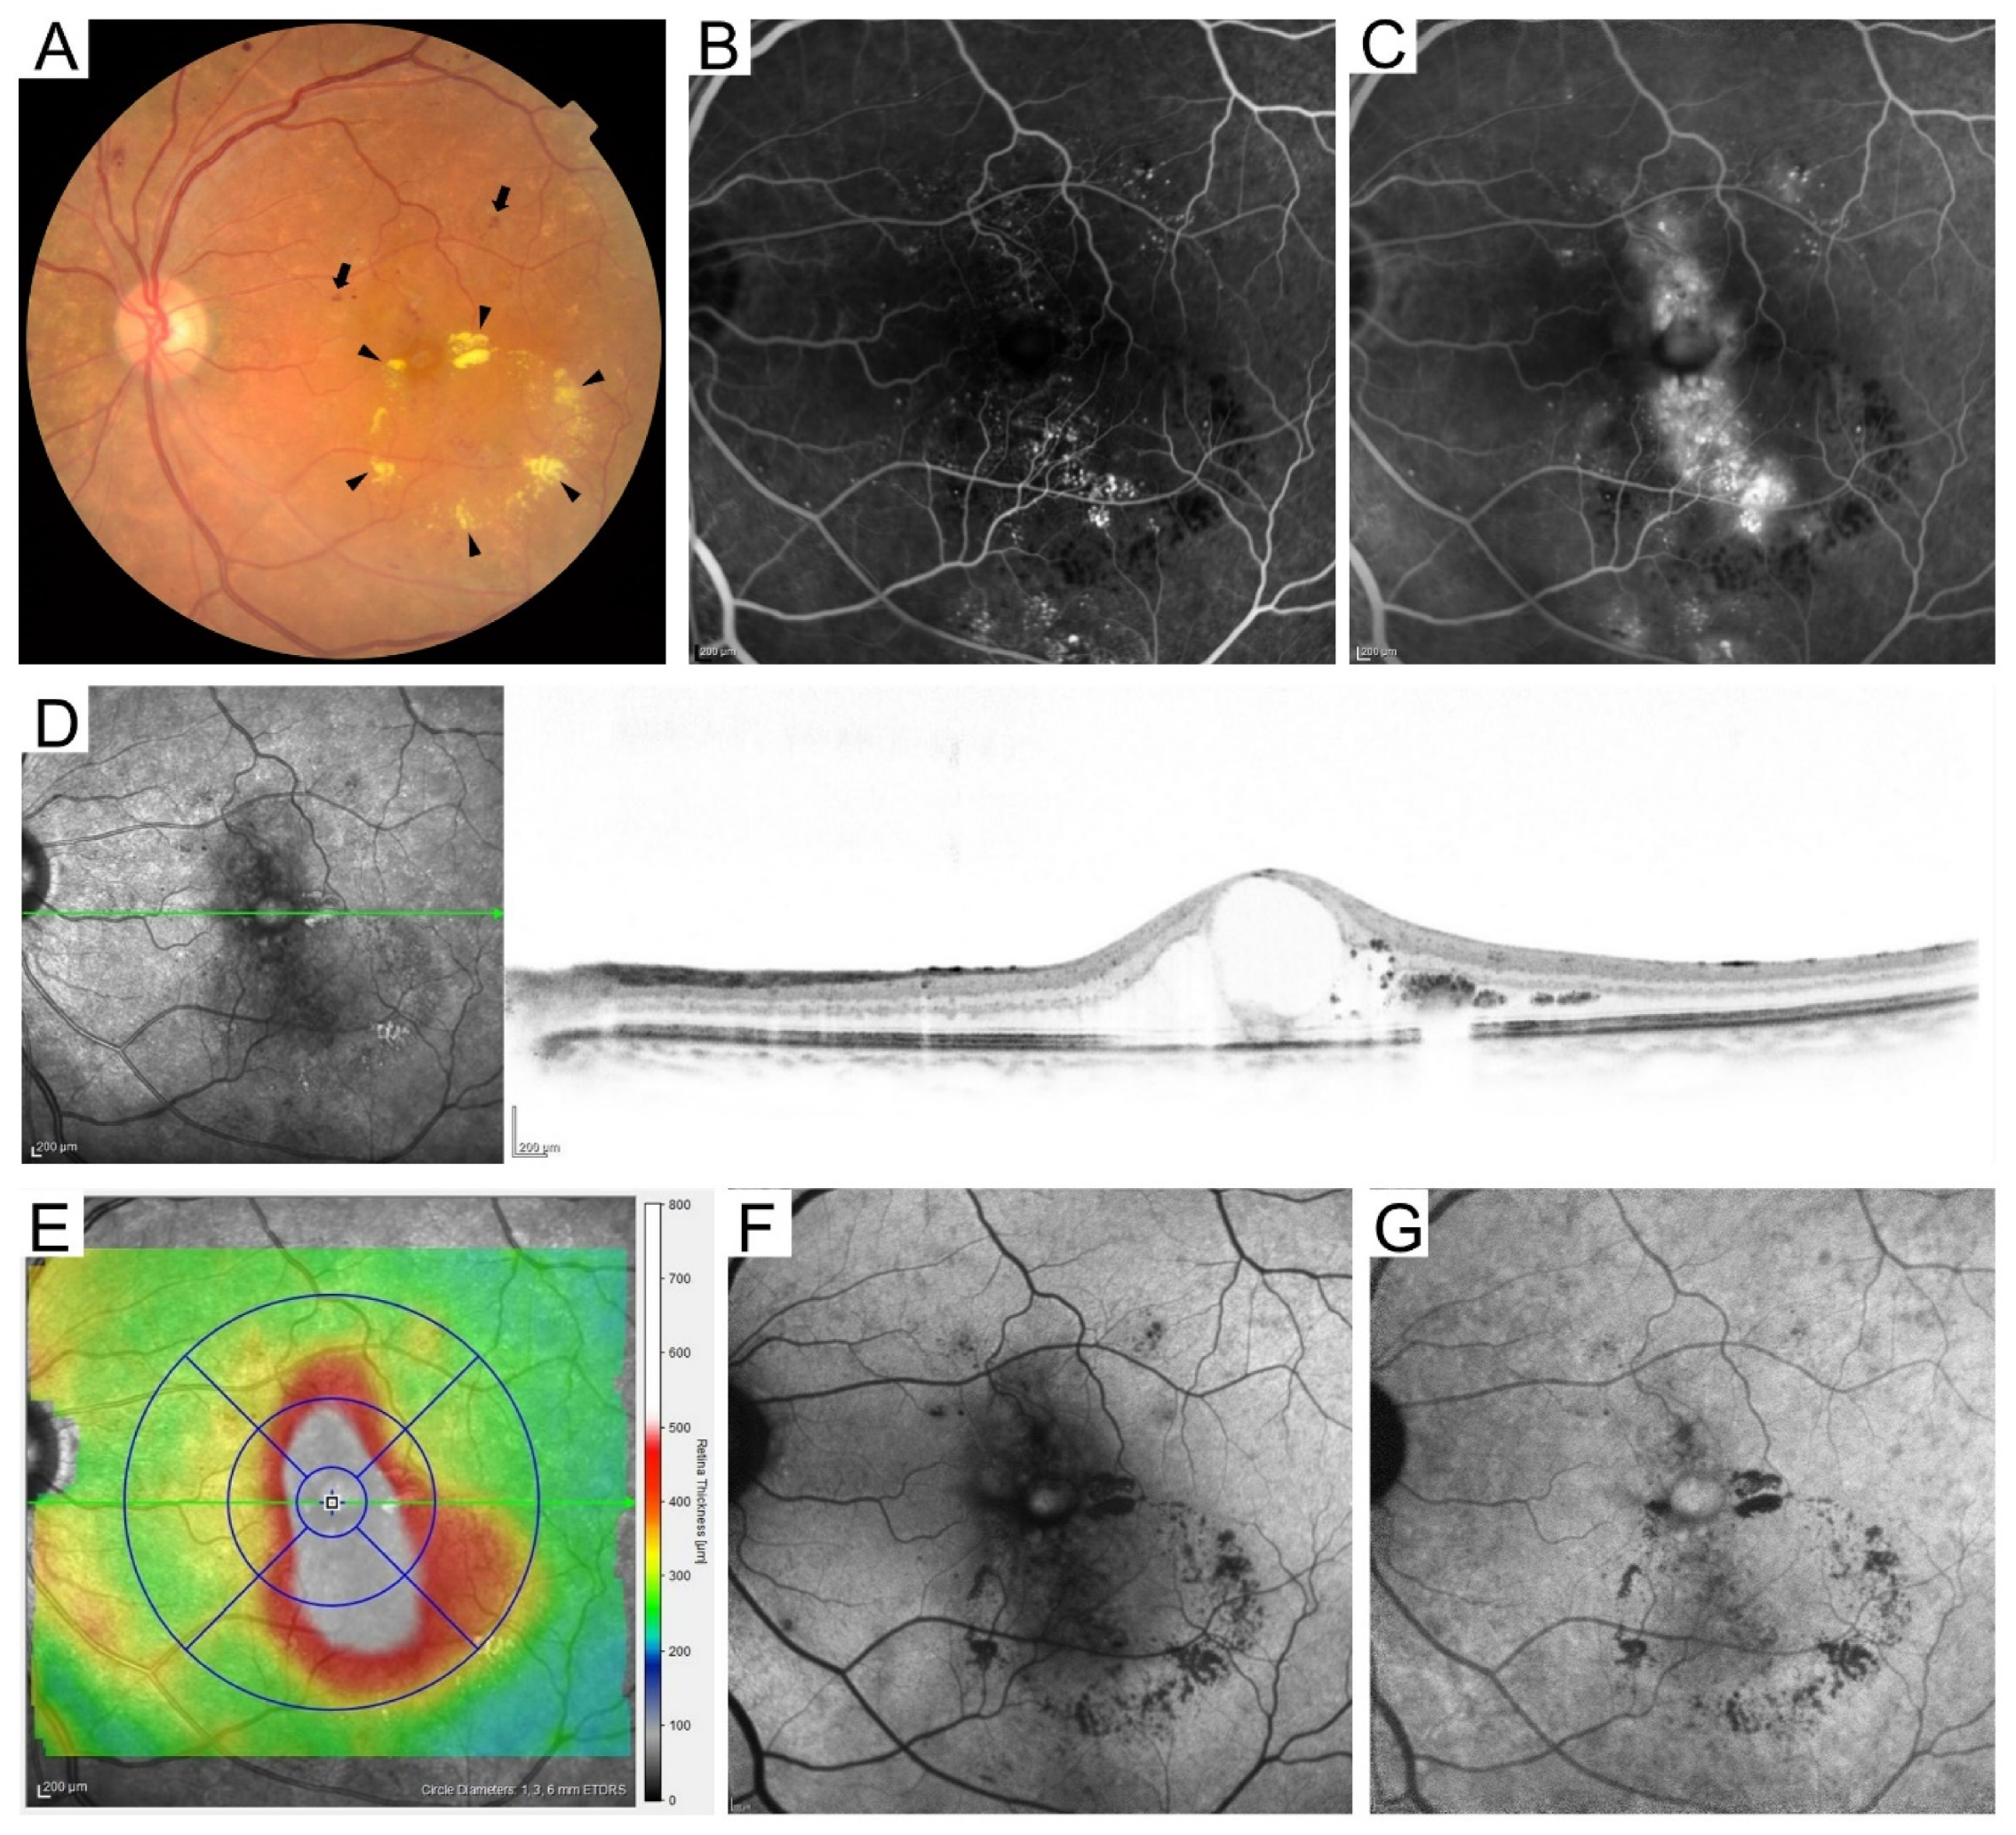
Figure 1.
Multimodal imaging in a representative case with diabetic macular edema. (A) Retinal hemorrhages (arrows) and hard exudates (arrowheads) in fundus photography. The early (B) and late (C) phases of FA images show fluorescein leakage and pooling. (D) Cystoid macular edema is delineated on the sectional optical coherence tomography (OCT) image obtained using Spectralis OCT along the green arrow on the scanning laser ophthalmoscope image. (E) Two-dimensional OCT thickness map (total retinal thickness) with an ETDRS grid overlay (1, 3, 6 mm-circles). The central subfield thickness is 651 μm. Different OCT machines use different segmentation methods for the outer boundaries of retinas, so the mean retinal thicknesses depend on the OCT machines. (F) Short wavelength fundus autofluorescence. (G) Near-infrared FAF.

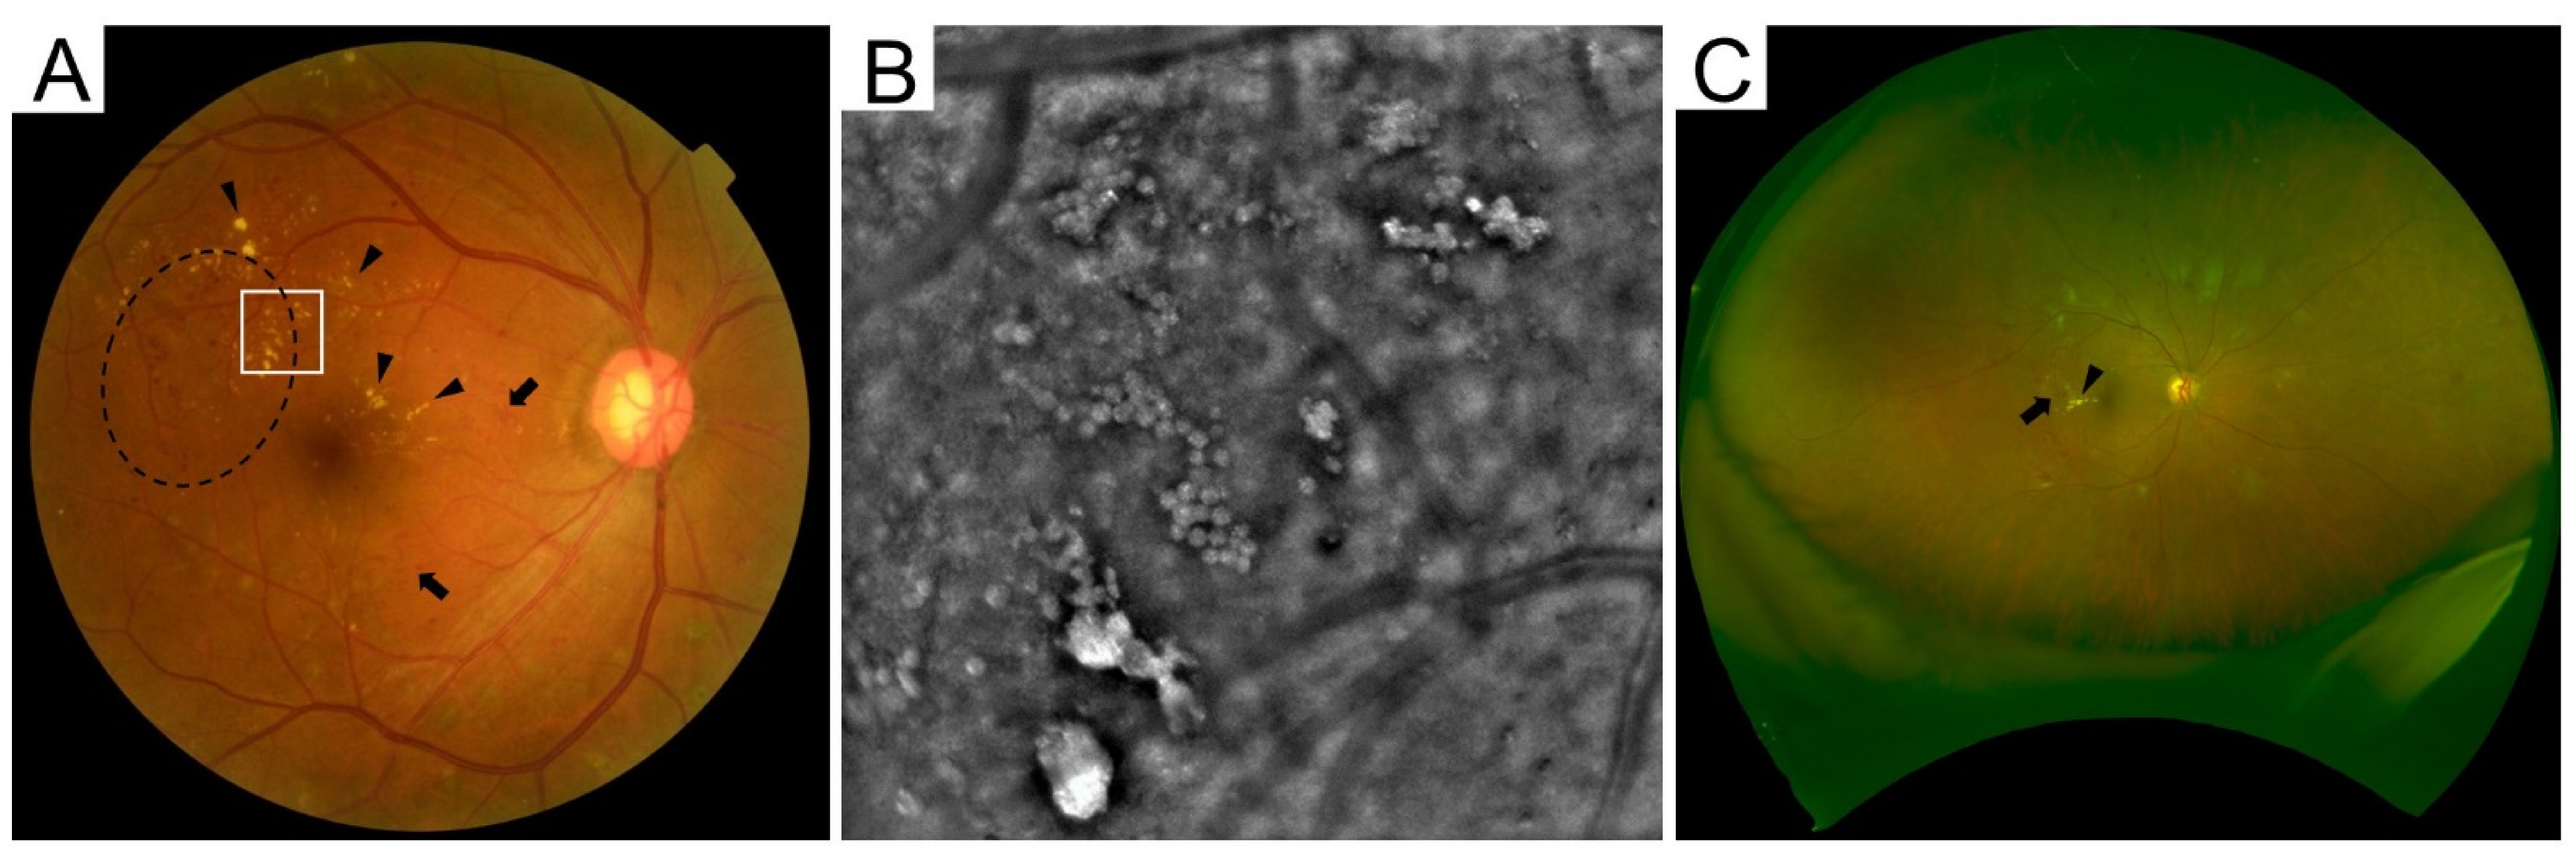
Figure 2.
Various instruments for fundus photography. (A) Clinically significant macular edema on conventional photography. Arrows and arrowheads indicate retinal hemorrhages and hard exudates, respectively. Dashed line is retinal thickening. (B) The high-resolution image by adaptive optics camera within the square in panel A reveals that hard exudates are composed of multiple round lesions. (C) Ultrawide-field scanning laser ophthalmoscope images can show approximately 80% of the area of the entire retina.

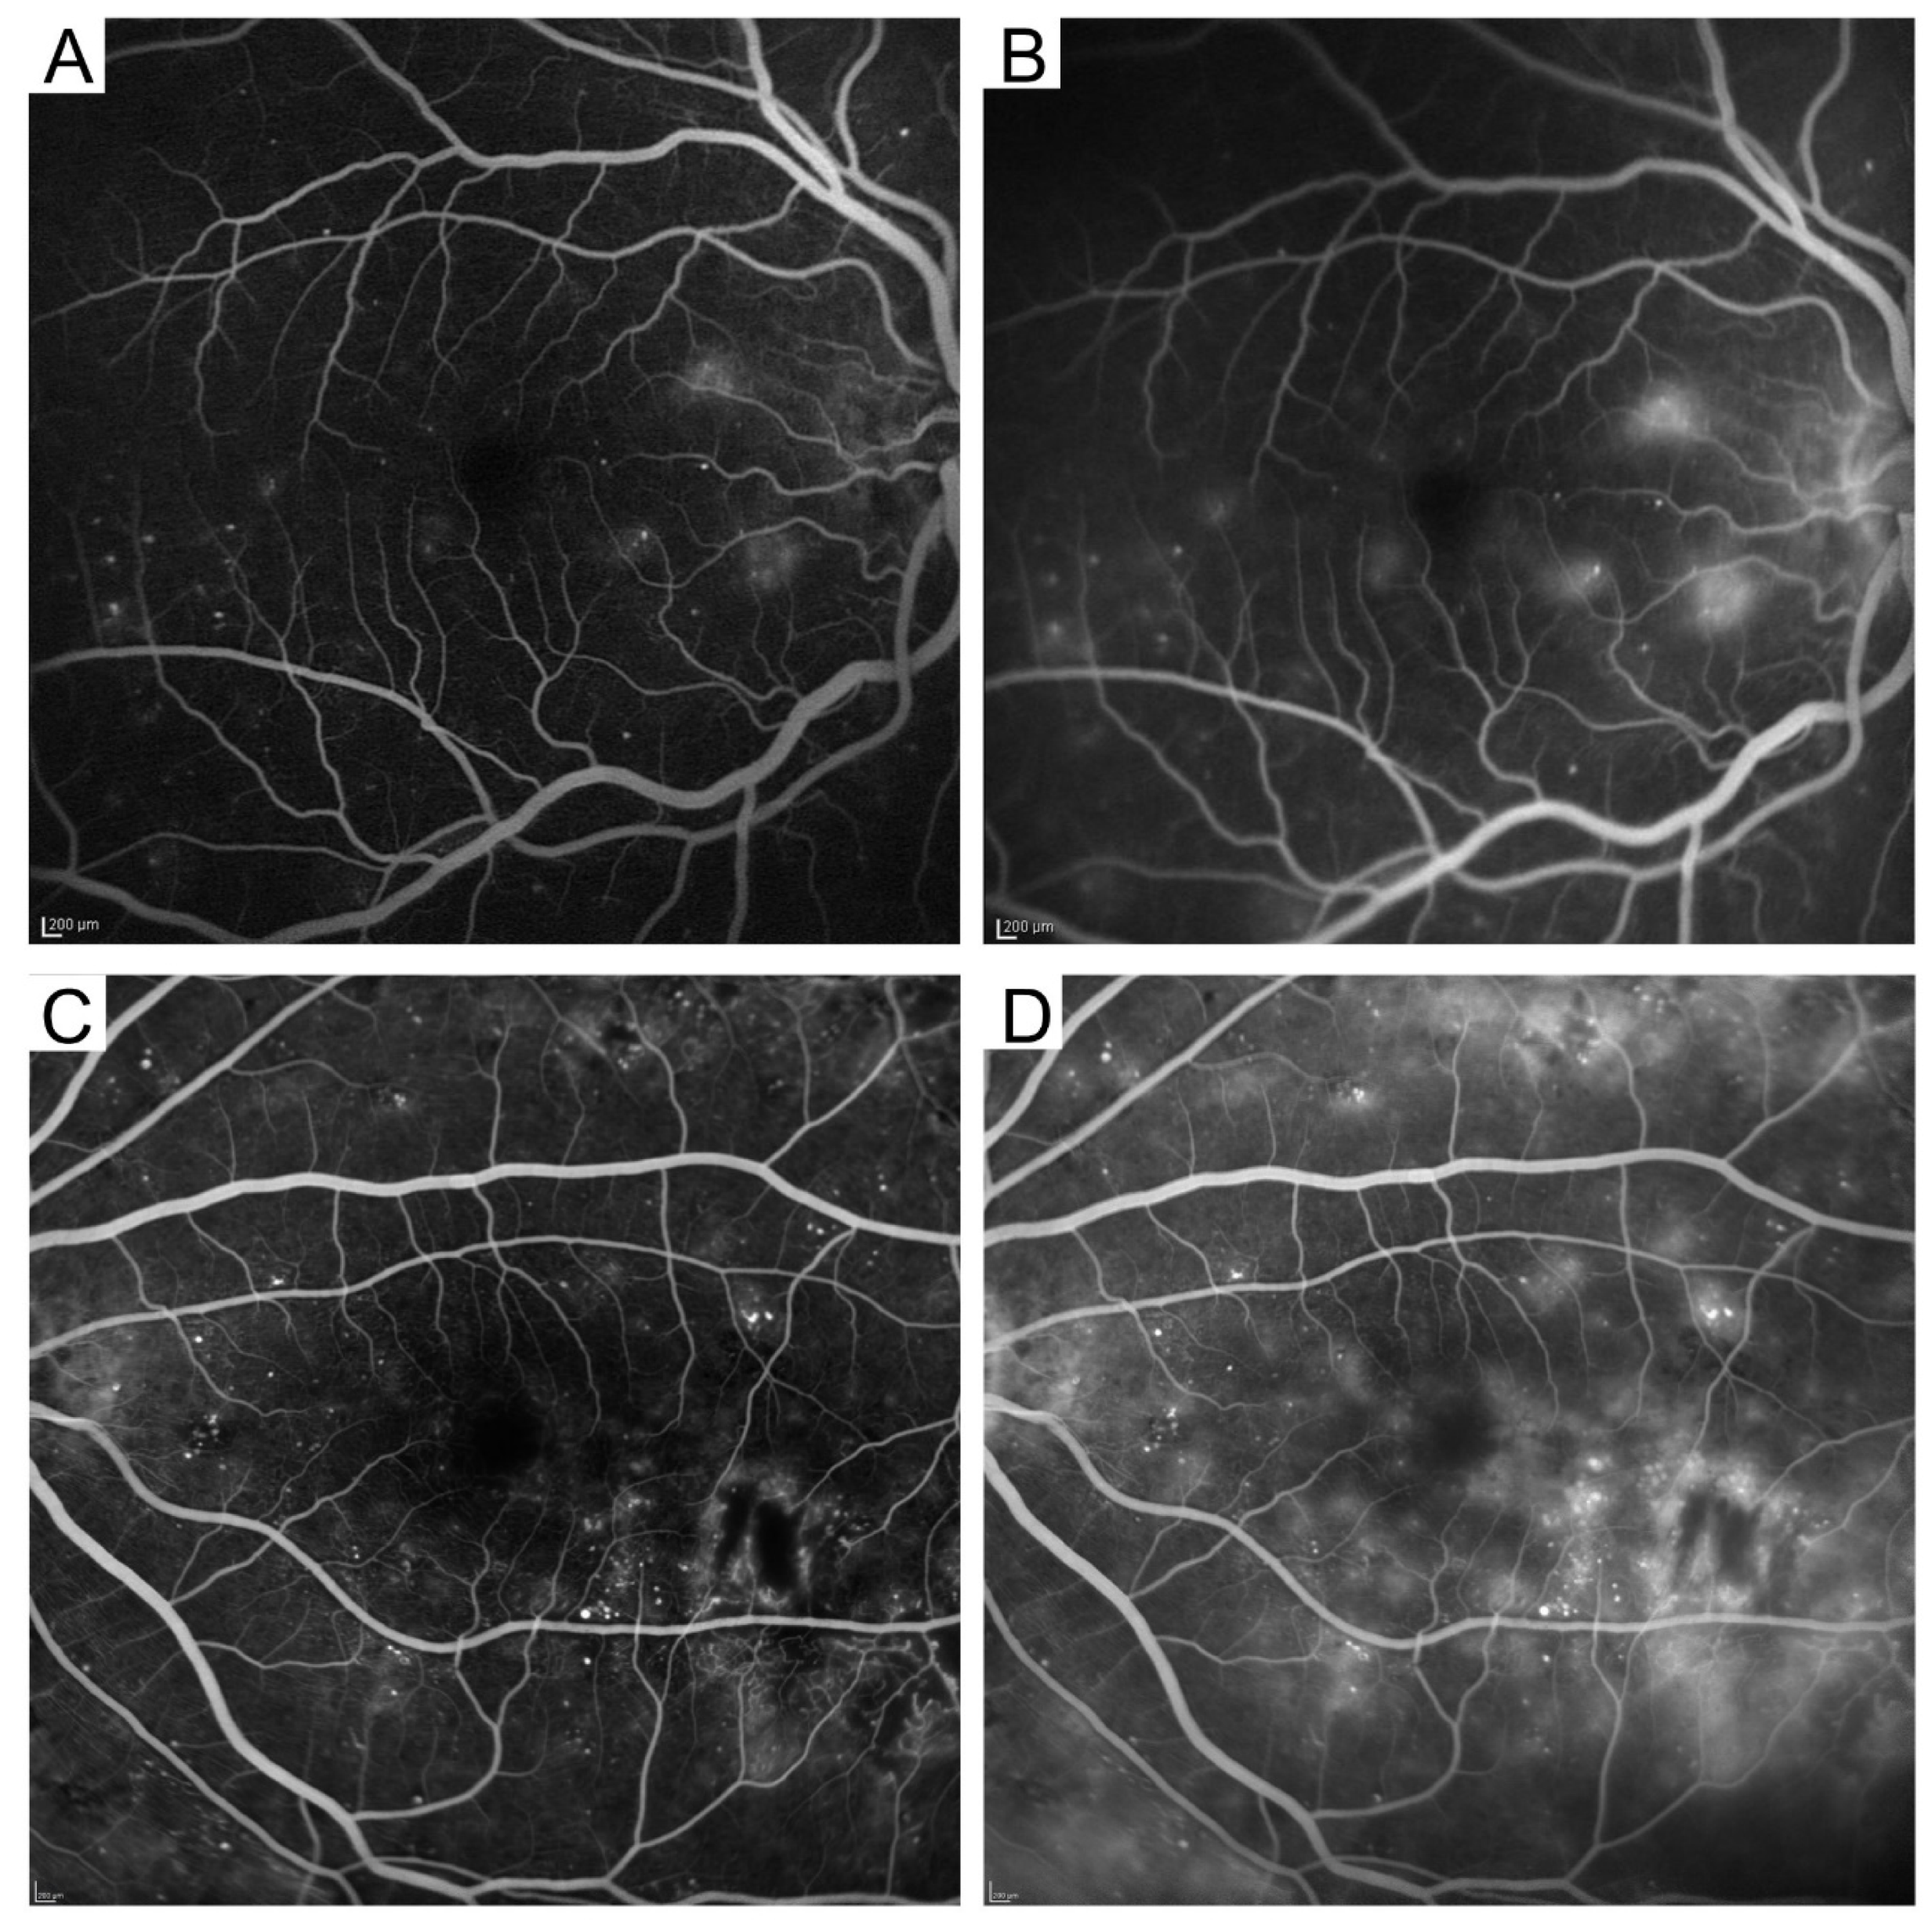
Figure 3.
Two major patterns of fluorescein leakage on fluorescein angiography images. Focal (A,B) and diffuse (C,D) fluorescein leakage. The early (A,C) and late (B,D) phases.
Figure 3.
Two major patterns of fluorescein leakage on fluorescein angiography images. Focal (A,B) and diffuse (C,D) fluorescein leakage. The early (A,C) and late (B,D) phases.

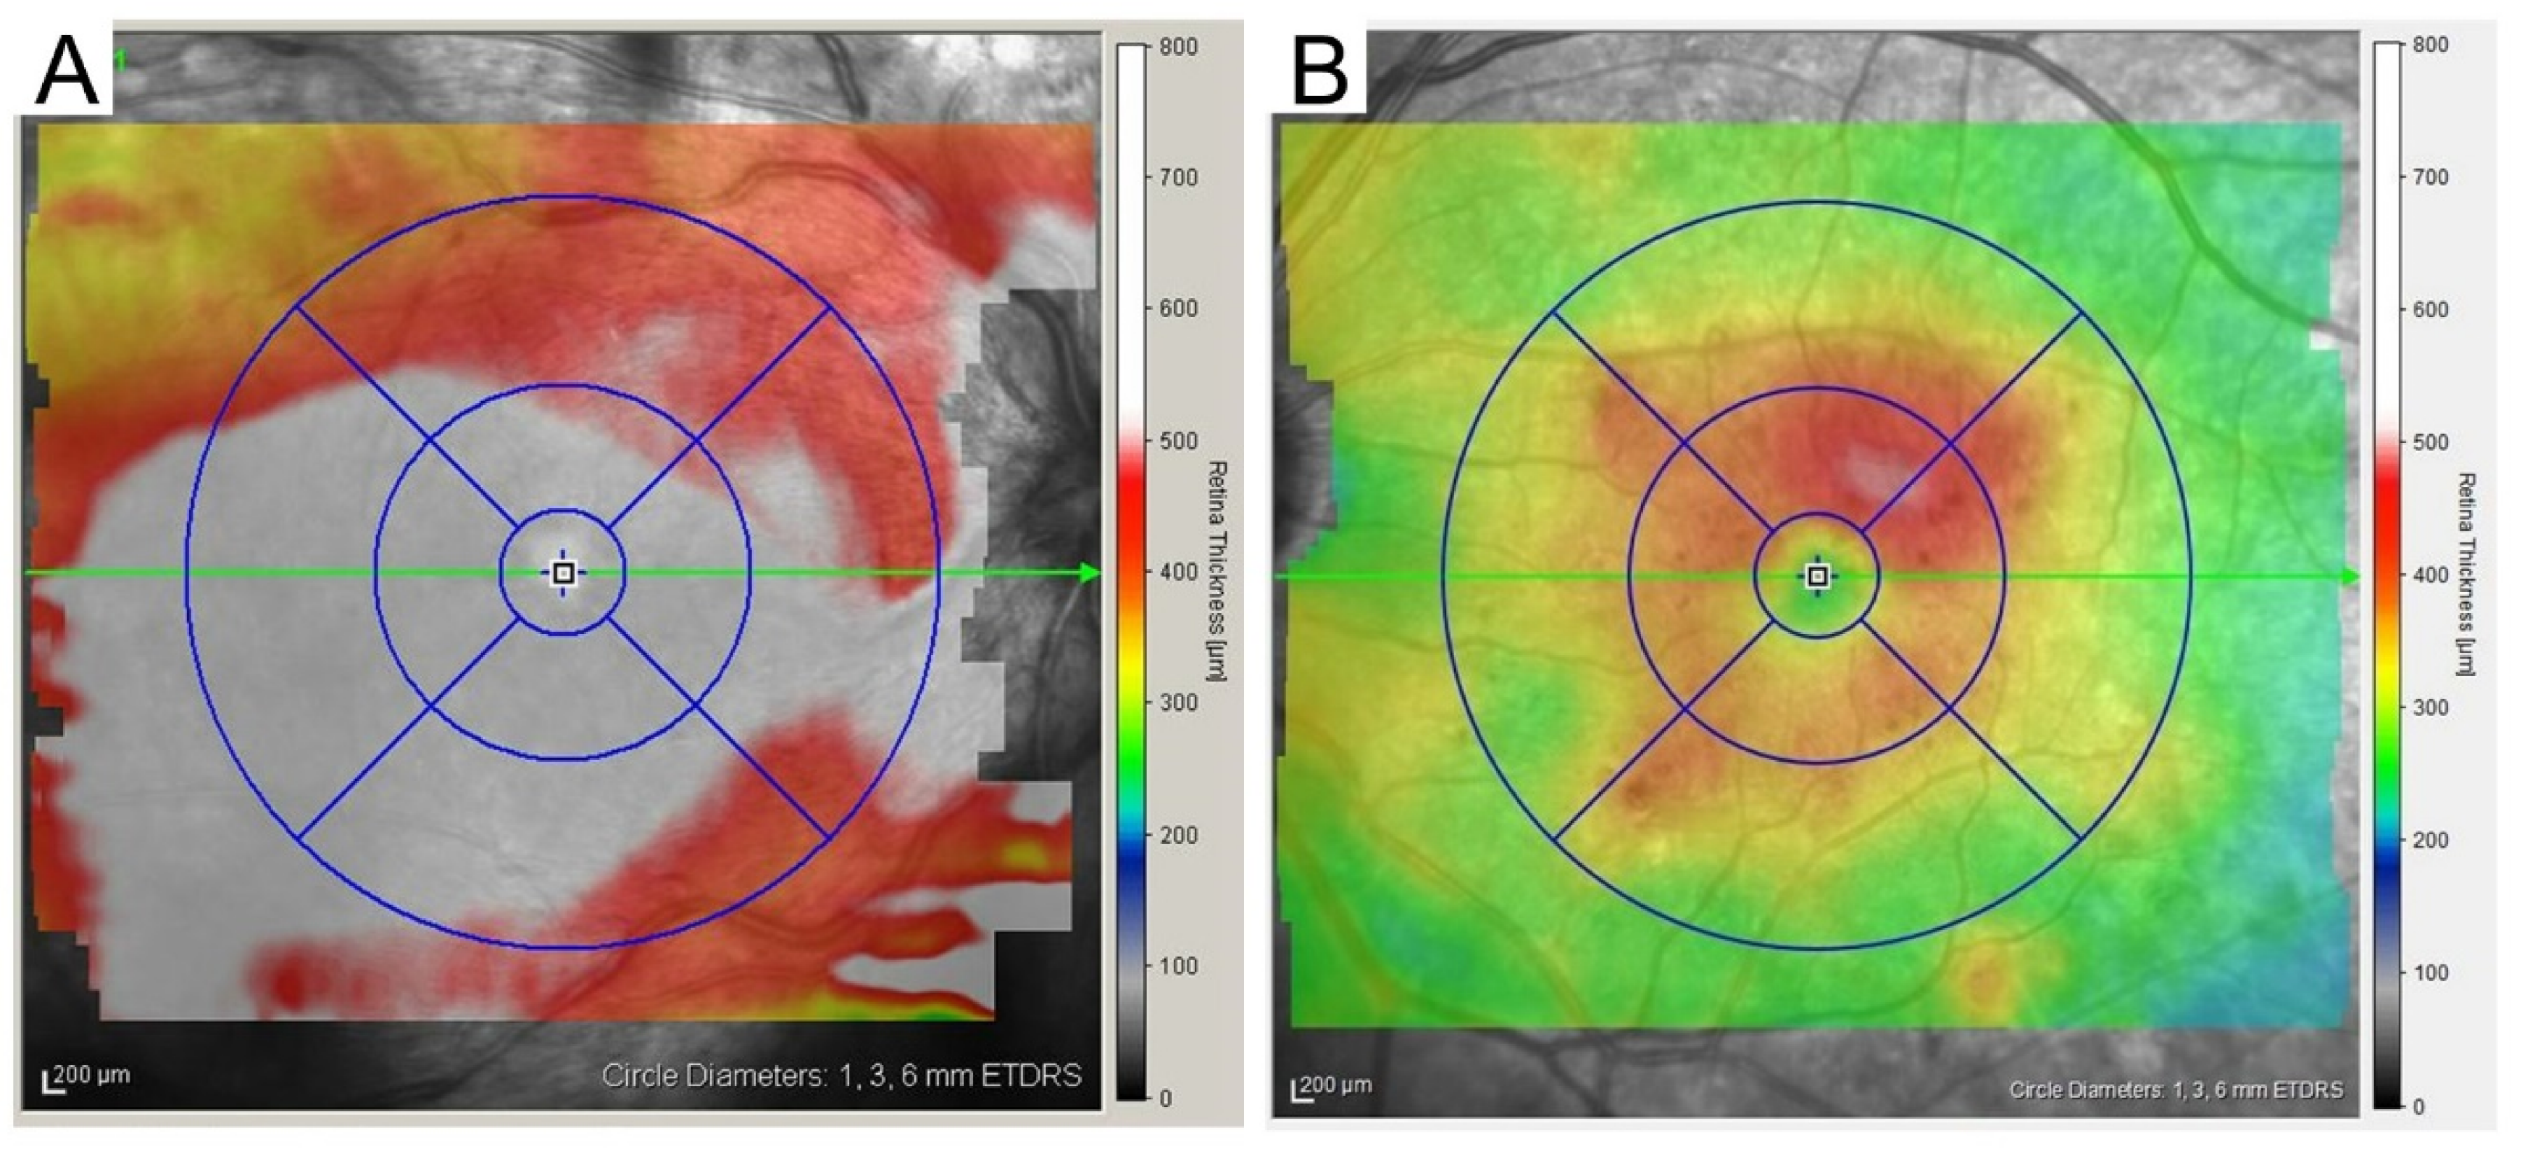
Figure 4.
Two-dimensional optical coherence tomography (OCT) map. A two-dimensional map with an ETDRS grid overlay (1, 3, 6 mm-circles), which is obtained using Spectralis OCT, allows us to discriminate center-involving diabetic macular edema (CIDME) (A) from non-CIDME (B).
Figure 4.
Two-dimensional optical coherence tomography (OCT) map. A two-dimensional map with an ETDRS grid overlay (1, 3, 6 mm-circles), which is obtained using Spectralis OCT, allows us to discriminate center-involving diabetic macular edema (CIDME) (A) from non-CIDME (B).

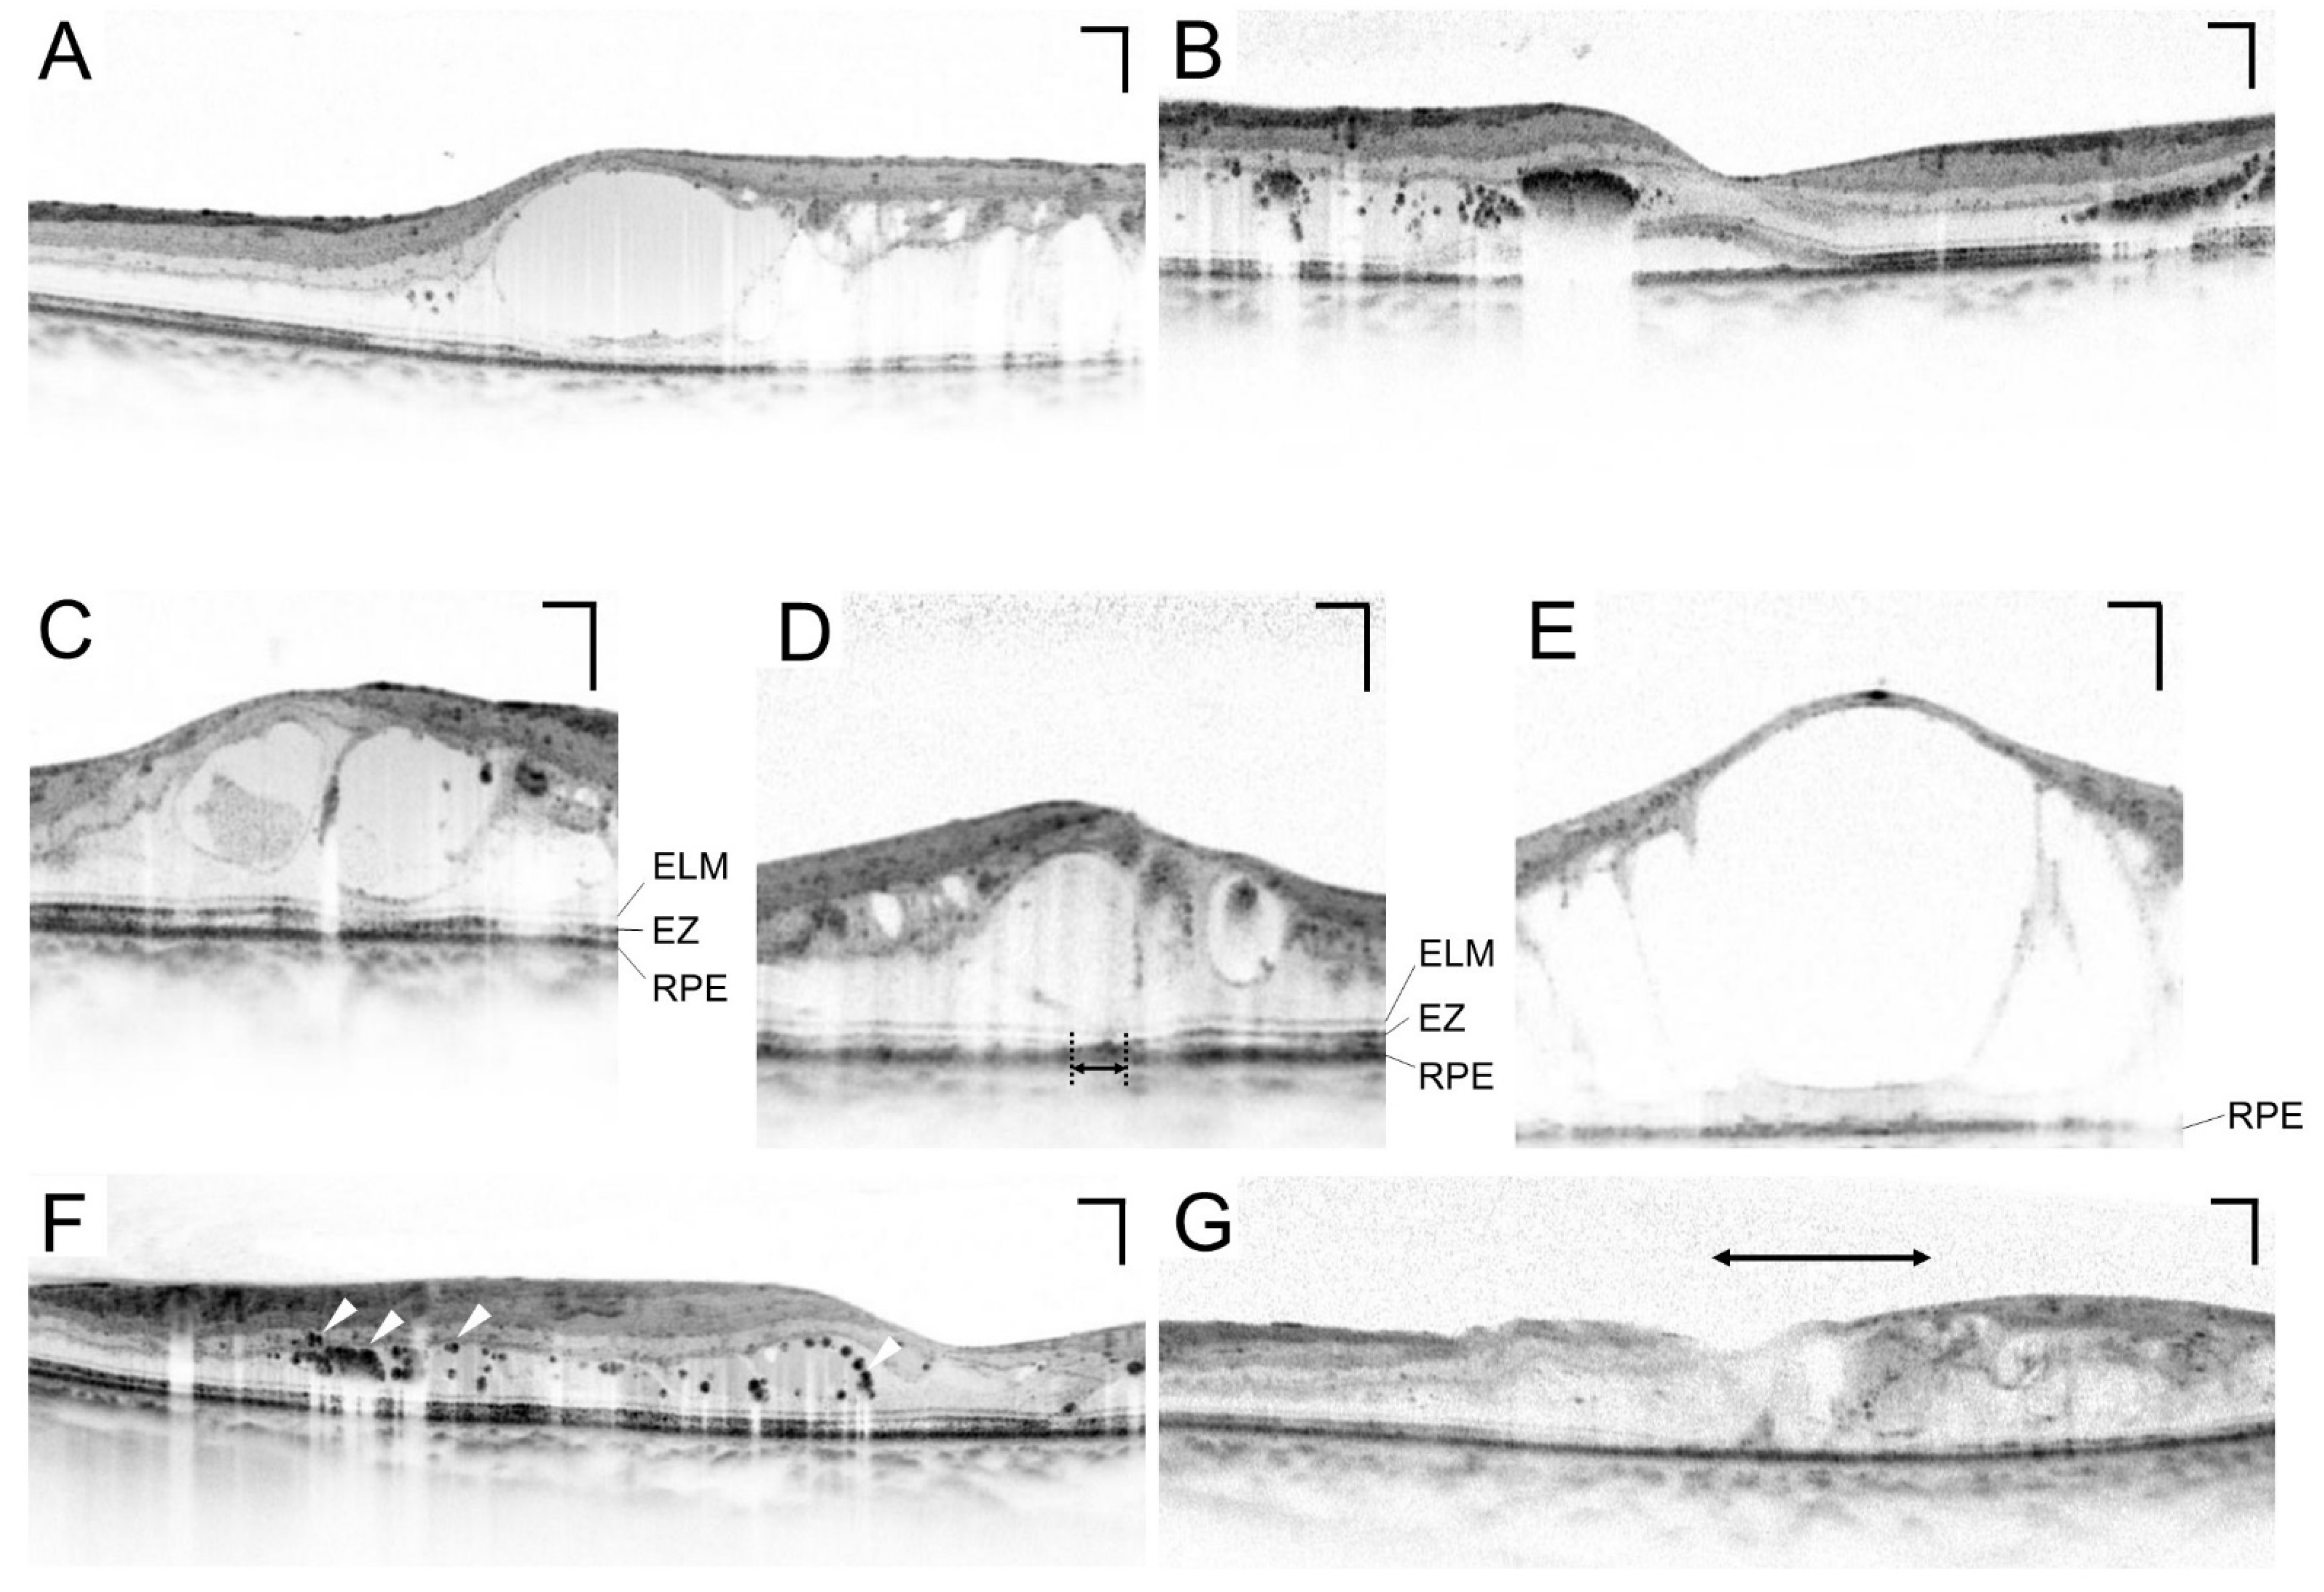
Figure 5.
Various findings on sectional optical coherence tomography (OCT) images. The images obtained using Spectralis OCT show pathomorphologies, e.g., cystoid macular edema (A) and serous retinal detachment (B). Intact (C), disrupted (D) (double-headed arrow), and absent (E) ellipsoid zone (EZ) lines. ELM = external limiting membrane; RPE = retinal pigment epithelium. (F) Hyperreflective foci (white arrowheads). (G) DRIL as a biomarker of neural damage (double-headed arrow). Scale bar = 200 μm.

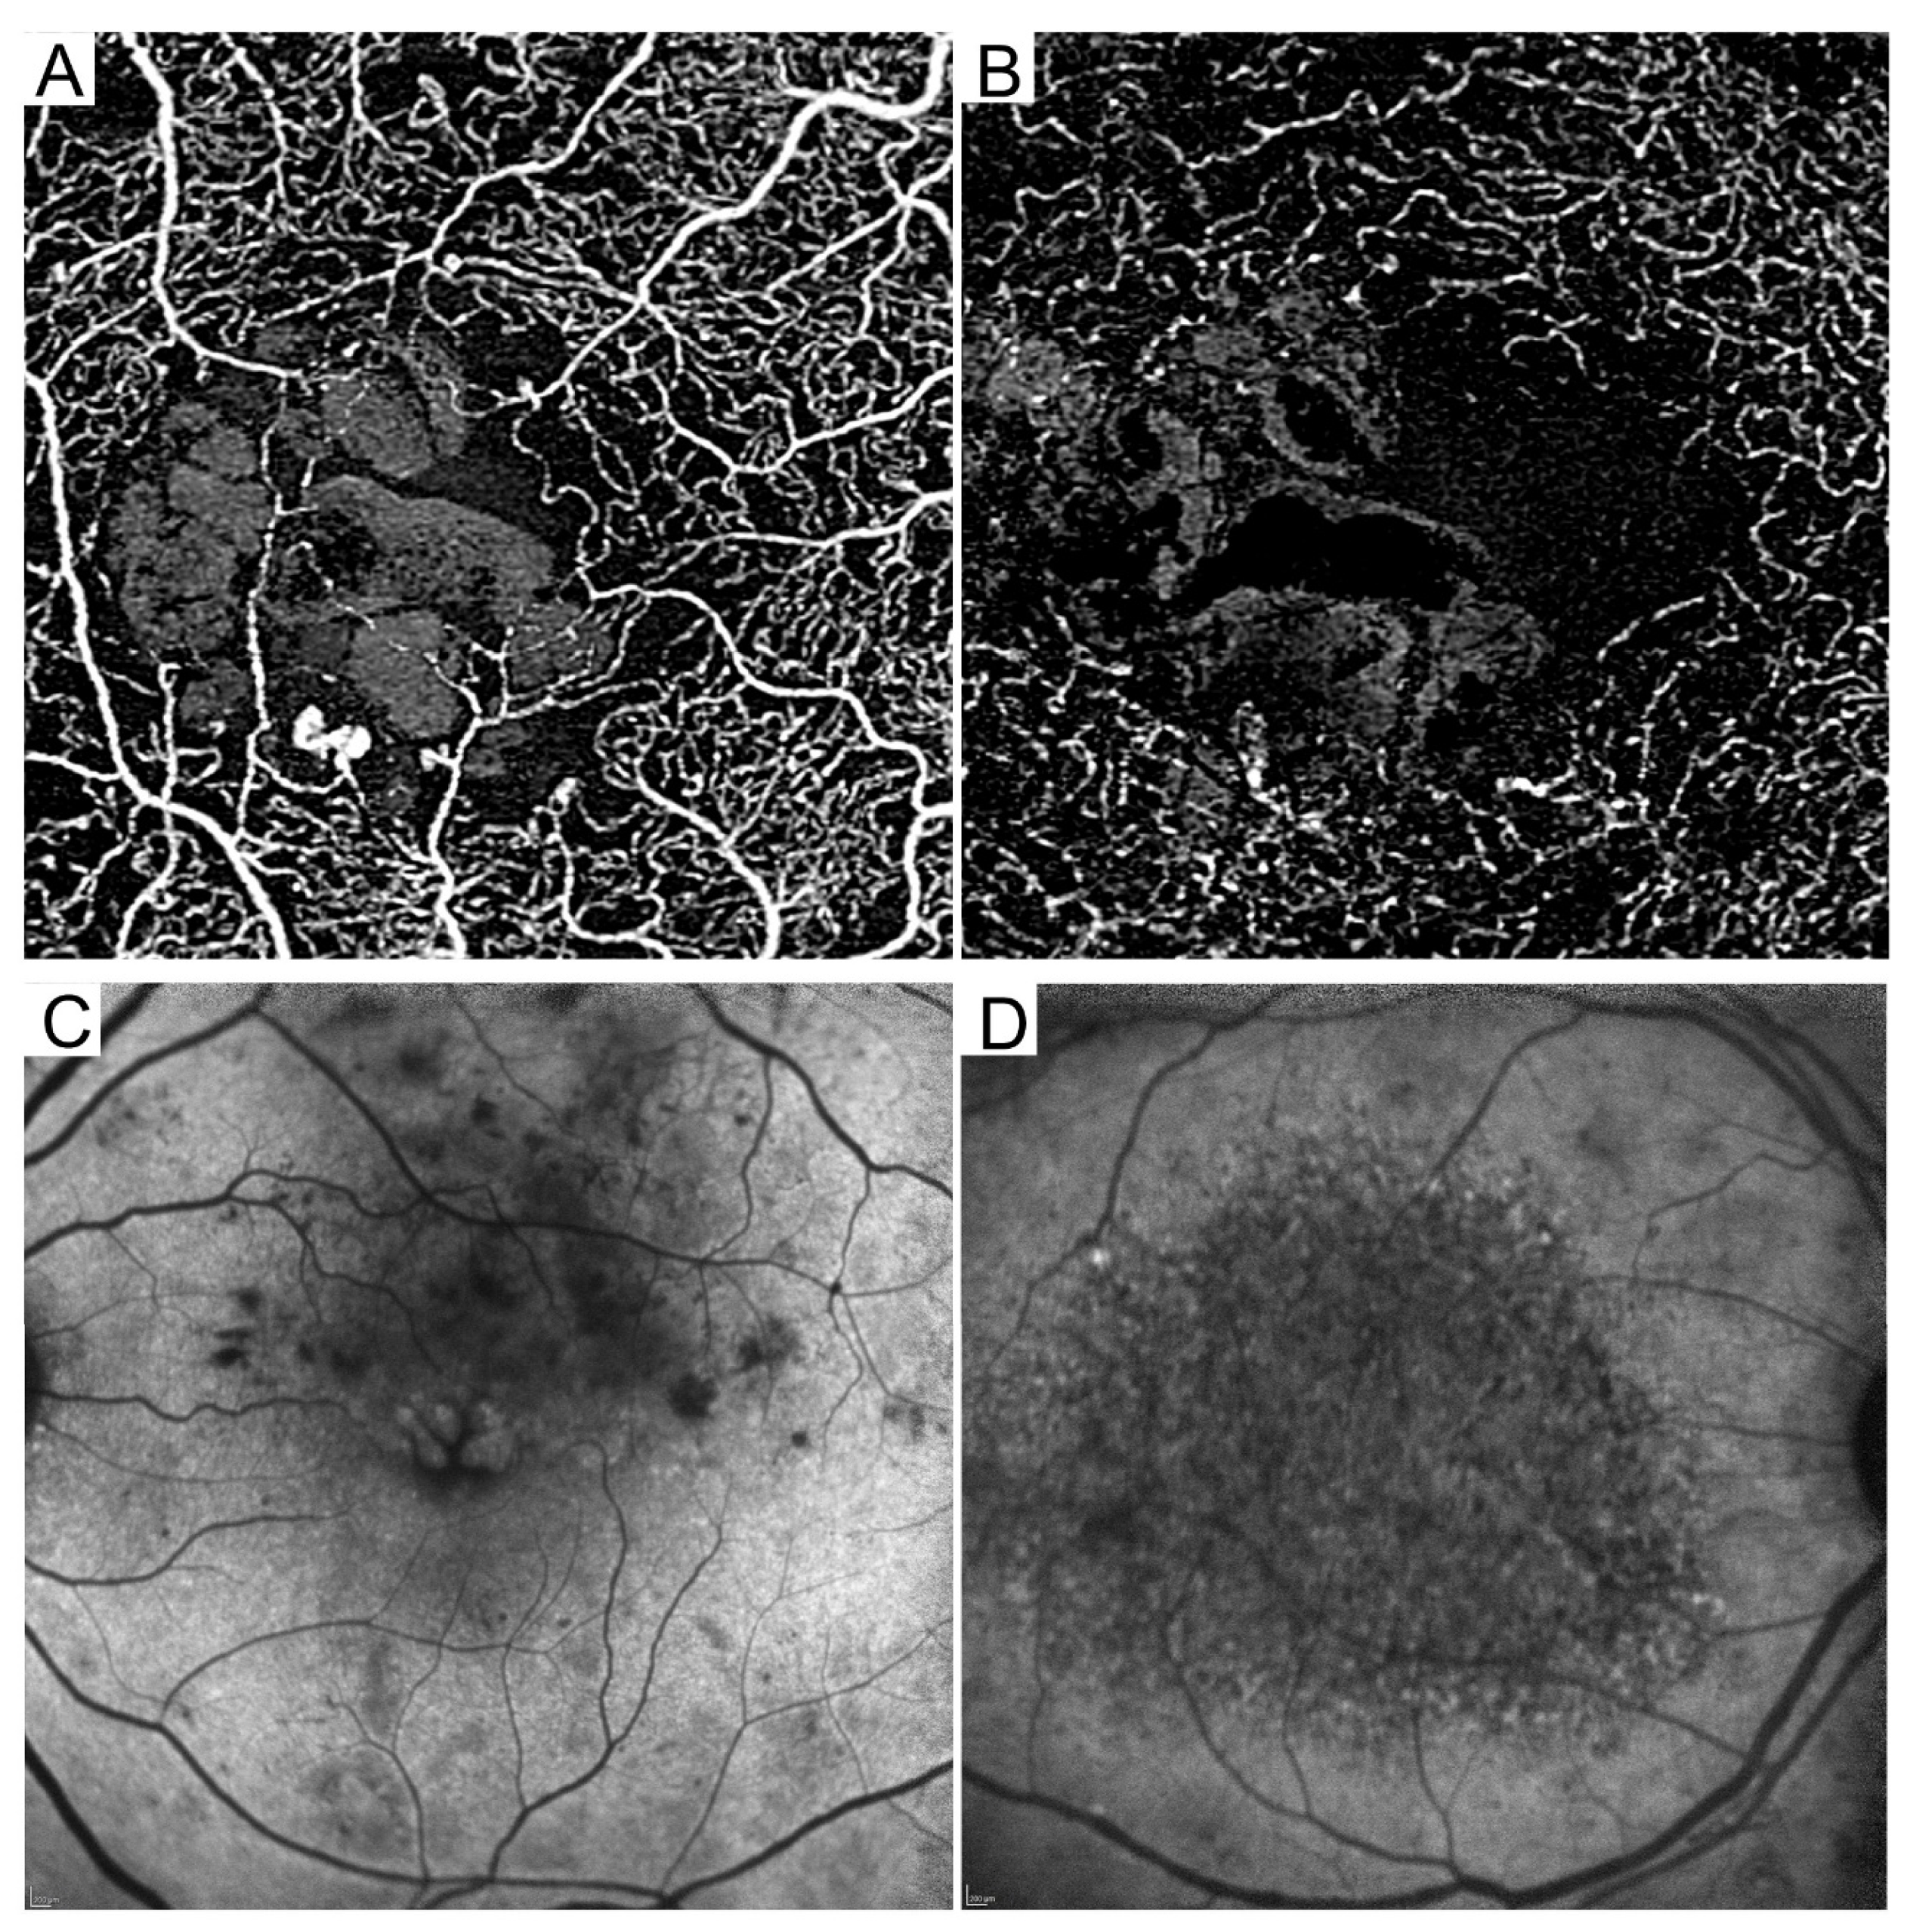
Figure 6.
Latest modalities, optical coherence tomography angiography (OCTA) and fundus autofluorescence (FAF). Reduced vascular density in the superficial (A) and deep (B) en-face OCTA images. Scale bar = 200 μm. (C) Oval-shaped hyperfluorescence in short wavelength FAF. (D) Reduced levels of fluorescent signals in near-infrared FAF.


Table 1.
The correspondence between findings on classical and modern modalities. CFP = color fundus photograph; FA = fluorescein angiography; IA = indocyanine green angiography; OCT = optical coherence tomography; OCTA = optical coherence tomography angiography; SW-FAF = short wavelength fundus autofluorescence; NIR-FAF = near-infrared fundus autofluorescence.
| Classical Modalities | Modern Modalities |
|---|---|
| Diagnosis of diabetic macular edema (DME) | |
|
|
| Microaneurysms | |
|
|
|
|
| Fluorescein leakage on FA | - |
| Fluorescein pooling on FA | Cystoid macular edema on OCT |
| Capillary nonperfusion on FA | No boundaries between inner layers on OCTLamellar capillary nonperfusion on OCTA |
| Choroid | |
|
|
| |
| - | Serous retinal detachment on OCT |
| - | Disrupted or absent ellipsoid zone line on OCT |
| Hard exudates on CFP | Hyperreflective foci on OCT |
| - | Disorganization of the retinal inner layers |
| - | Epiretinal membrane or vitreomacular traction on OCT |
| Retinal pigment epitheliopathy on CFP |
|
|
Disclaimer/Publisher’s Note: The statements, opinions and data contained in all publications are solely those of the individual author(s) and contributor(s) and not of MDPI and/or the editor(s). MDPI and/or the editor(s) disclaim responsibility for any injury to people or property resulting from any ideas, methods, instructions or products referred to in the content. |
© 2023 by the authors. Licensee MDPI, Basel, Switzerland. This article is an open access article distributed under the terms and conditions of the Creative Commons Attribution (CC BY) license (https://creativecommons.org/licenses/by/4.0/).
Share and Cite
MDPI and ACS Style
Murakami, T.; Ishihara, K.; Terada, N.; Nishikawa, K.; Kawai, K.; Tsujikawa, A. Pathological Neurovascular Unit Mapping onto Multimodal Imaging in Diabetic Macular Edema. Medicina 2023, 59, 896. https://doi.org/10.3390/medicina59050896
AMA Style
Murakami T, Ishihara K, Terada N, Nishikawa K, Kawai K, Tsujikawa A. Pathological Neurovascular Unit Mapping onto Multimodal Imaging in Diabetic Macular Edema. Medicina. 2023; 59(5):896. https://doi.org/10.3390/medicina59050896
Chicago/Turabian StyleMurakami, Tomoaki, Kenji Ishihara, Noriko Terada, Keiichi Nishikawa, Kentaro Kawai, and Akitaka Tsujikawa. 2023. "Pathological Neurovascular Unit Mapping onto Multimodal Imaging in Diabetic Macular Edema" Medicina 59, no. 5: 896. https://doi.org/10.3390/medicina59050896