Article

New Ceramides and Cerebrosides from the Deep-Sea Far Eastern Starfish Ceramaster patagonicus

by
Timofey V. Malyarenko
1,2,*,
Viktor M. Zakharenko
1,2,
Alla A. Kicha
1,
Alexandra S. Kuzmich
1,
Olesya S. Malyarenko
1,
Anatoly I. Kalinovsky
1,
Roman S. Popov
1,
Vasily I. Svetashev
3 and
Natalia V. Ivanchina
1,*
1
G.B. Elyakov Pacific Institute of Bioorganic Chemistry, Far Eastern Branch, Russian Academy of Sciences, Pr. 100-let Vladivostoku 159, 690022 Vladivostok, Russia
2
Department of Bioorganic Chemistry and Biotechnology, School of Natural Sciences, Far Eastern Federal University, Russky Island, Ajax Bay 10, 690922 Vladivostok, Russia
3
A.V. Zhirmunsky National Scientific Center of Marine Biology, Far Eastern Branch, Russian Academy of Sciences, ul. Palchevskogo 17, 690041 Vladivostok, Russia
*
Authors to whom correspondence should be addressed.
Mar. Drugs 2022, 20(10), 641; https://doi.org/10.3390/md20100641
Submission received: 9 September 2022 / Revised: 12 October 2022 / Accepted: 12 October 2022 / Published: 14 October 2022

Abstract

:
Three new ceramides (13) and three new cerebrosides (4, 8, and 9), along with three previously known cerebrosides (ophidiocerebrosides C (5), D (6), and CE-3-2 (7)), were isolated from a deep-sea starfish species, the orange cookie starfish Ceramaster patagonicus. The structures of 14, 8, and 9 were determined by the NMR and ESIMS techniques and also through chemical transformations. Ceramides 13 contain iso-C21 or C23 Δ9-phytosphingosine as a long-chain base and have C16 or C17 (2R)-2-hydroxy-fatty acids of the normal type. Cerebroside 4 contains C22 Δ9-sphingosine anteiso-type as a long-chain base and (2R)-2-hydroxyheptadecanoic acid of the normal type, while compounds 8 and 9 contain saturated C-17 phytosphingosine anteiso-type as a long-chain base and differ from each other in the length of the polymethylene chain of (2R)-2-hydroxy-fatty acids of the normal type: C23 in 8 and C24 in 9. All the new cerebrosides (4, 8, and 9) have β-D-glucopyranose as a monosaccharide residue. The composition of neutral sphingolipids from C. patagonicus was described for the first time. The investigated compounds 13, 57, and 9 exhibit slight to moderate cytotoxic activity against human cancer cells (HT-29, SK-MEL-28, and MDA-MB-231) and normal embryonic kidney cells HEK293. Compounds 2, 5, and 6 at a concentration of 20 µM inhibit colony formation of MDA-MB-231 cells by 68%, 54%, and 68%, respectively. The colony-inhibiting activity of compounds 2, 5, and 6 is comparable to the effect of doxorubicin, which reduces the number of colonies by 70% at the same concentration.

1. Introduction

Starfish (also called sea stars) are found throughout the world’s oceans at a wide range of depths: from intertidal to deep-sea habitats. Their ecological characteristics and life-history features make them a rich source of various low-molecular-weight compounds. The best-studied starfish-derived substances are polar steroidal compounds that were found in almost all of the species analyzed [1,2,3,4,5,6,7,8,9]. In addition, anthraquinoid pigments, triterpene glycosides, carotenoids, and sphingolipids were found in starfish [5,9,10,11,12,13,14,15].
Sphingolipids are a group of heterogeneous lipids including those present in the plasma membranes that, along with phospholipids and sterols, play a fundamental role in important phenomena such as cell–cell recognition and antigenic specificity [16,17]. Sphingolipids can be divided into several structural groups: ceramides, cerebrosides, gangliosides, and sphingophospholipids.
Ceramides are hydrophobic molecules consisting of a long-chain base (LCB) and an amide-linked fatty acid (FA) residue. Ceramides are biosynthesized during the reaction of S-acyl-coenzyme A (usually C16-CoA) with serine, which is catalyzed by serine palmitoyl transcriptase or related enzymes, followed by the reduction of the carbonyl group by ketosphinganine reductase and the N-acylation by ceramide synthase. Surprisingly, the LCB hydroxylation, which leads to the production of so-called phytosphinganine derivatives, also occurs in plants and many echinoderms. When hydroxylases act on FA in these invertebrates, an additional hydroxyl group is introduced also into the α–position of FA [17]. Additionally, both bases and FA moieties in this type of natural product may contain normal chains, as well as those with iso- and/or anteiso-branching. Unfortunately, the biological activity of starfish-derived ceramides has not been sufficiently studied. It was previously reported that asteriaceramide A from Asterias amurensis showed it could actively stimulate the root growth of Brassica campestris [18].
Cerebrosides are glycosylceramides containing, as a rule, glucose and galactose or other rare monosaccharide residues in their carbohydrate moieties. These compounds are synthesized by special enzymes, glycosyl-transferases, that attach monosaccharide residues to C-1 of ceramide [17]. On the basis of the chemical structure of cerebrosides, these can be divided into three groups: monoglycosides, biglycosides (mainly lactosides), and oligoglycosides. In addition to glucose and galactose residues, this class of glycosylated lipids can contain an aminosugar residue (globosides) in their carbohydrate moieties or be sulfated. The interest in sphingolipids and their derivatives is mainly associated with their wide range of biological activities. Some studies have shown that sphingolipids can inhibit the growth of microalgae, fungi, and bacteria [19]. It was previously reported that starfish cerebrosides showed neuritogenic activity against the rat pheochromocytoma PC12 cells in the presence of nerve growth factor (NGF), an anti-inflammatory effect, in vitro cytotoxic activity against Caco-2 colon cancer cells, improvement of the barrier function of the skin, and other properties [14].
Thus, the study of starfish sphingolipids is an interesting and relevant scientific issue. It is also worth noting that previously, sphingolipids were studied from starfish that live at shallow depths. To date, there have been no reports on sphingolipids derived from starfish dwelling at depths greater than 150 m.
Recently, we found that conjugates of polyhydroxysteroids with long-chain FAs from the same starfish species exhibited potent anticancer activity in vitro [20]. In the present report, continuing the search for anticancer compounds from marine organisms, we provide the results of our studies on the structures of ceramides and cerebrosides derived from the starfish Ceramaster patagonicus, and also their effects on the viability of human normal and cancer cells and the colony formation of cancer cells.

2. Results and Discussion

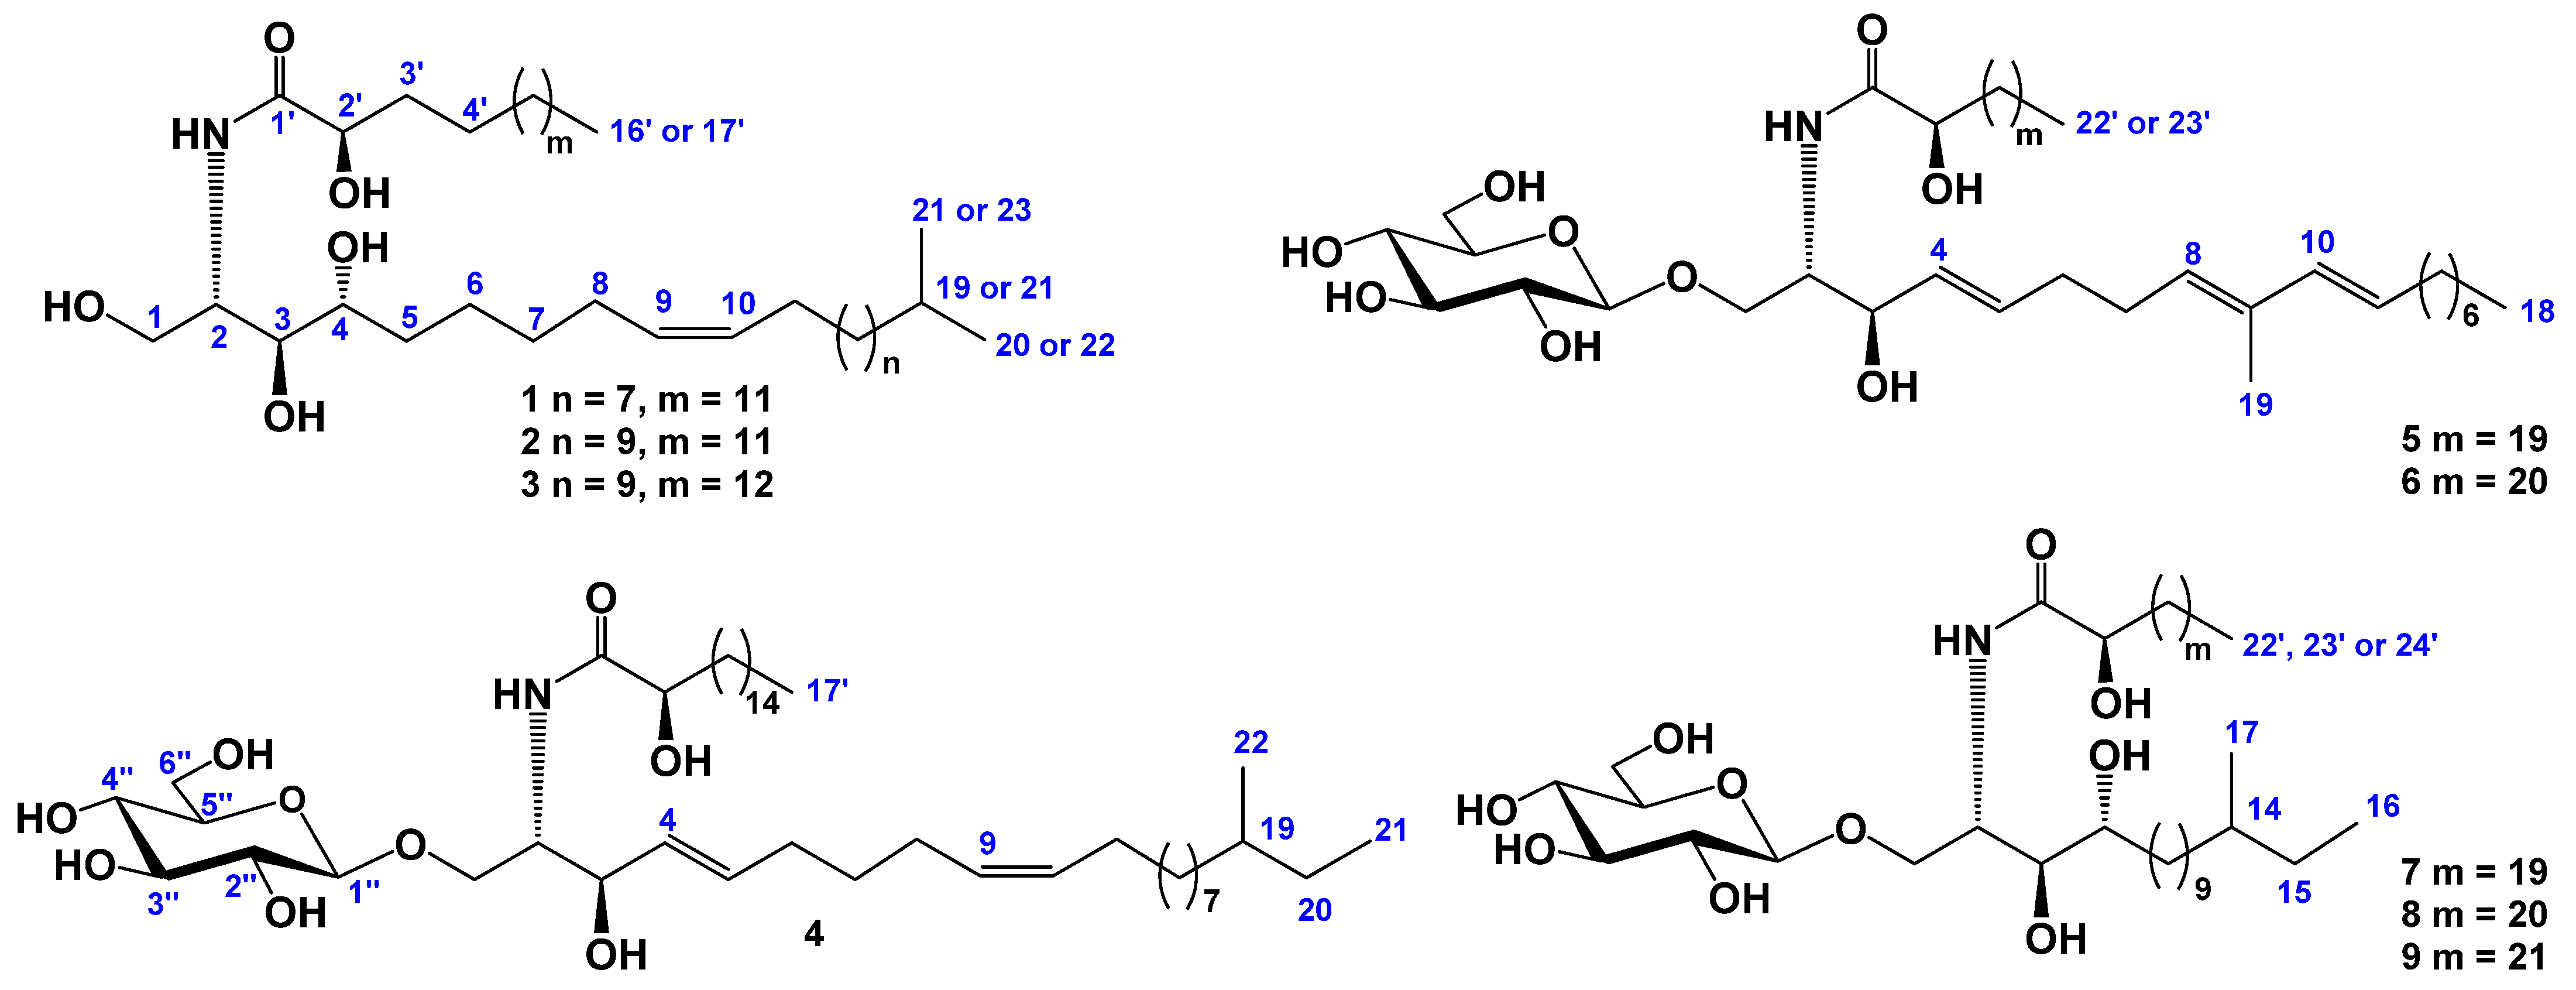
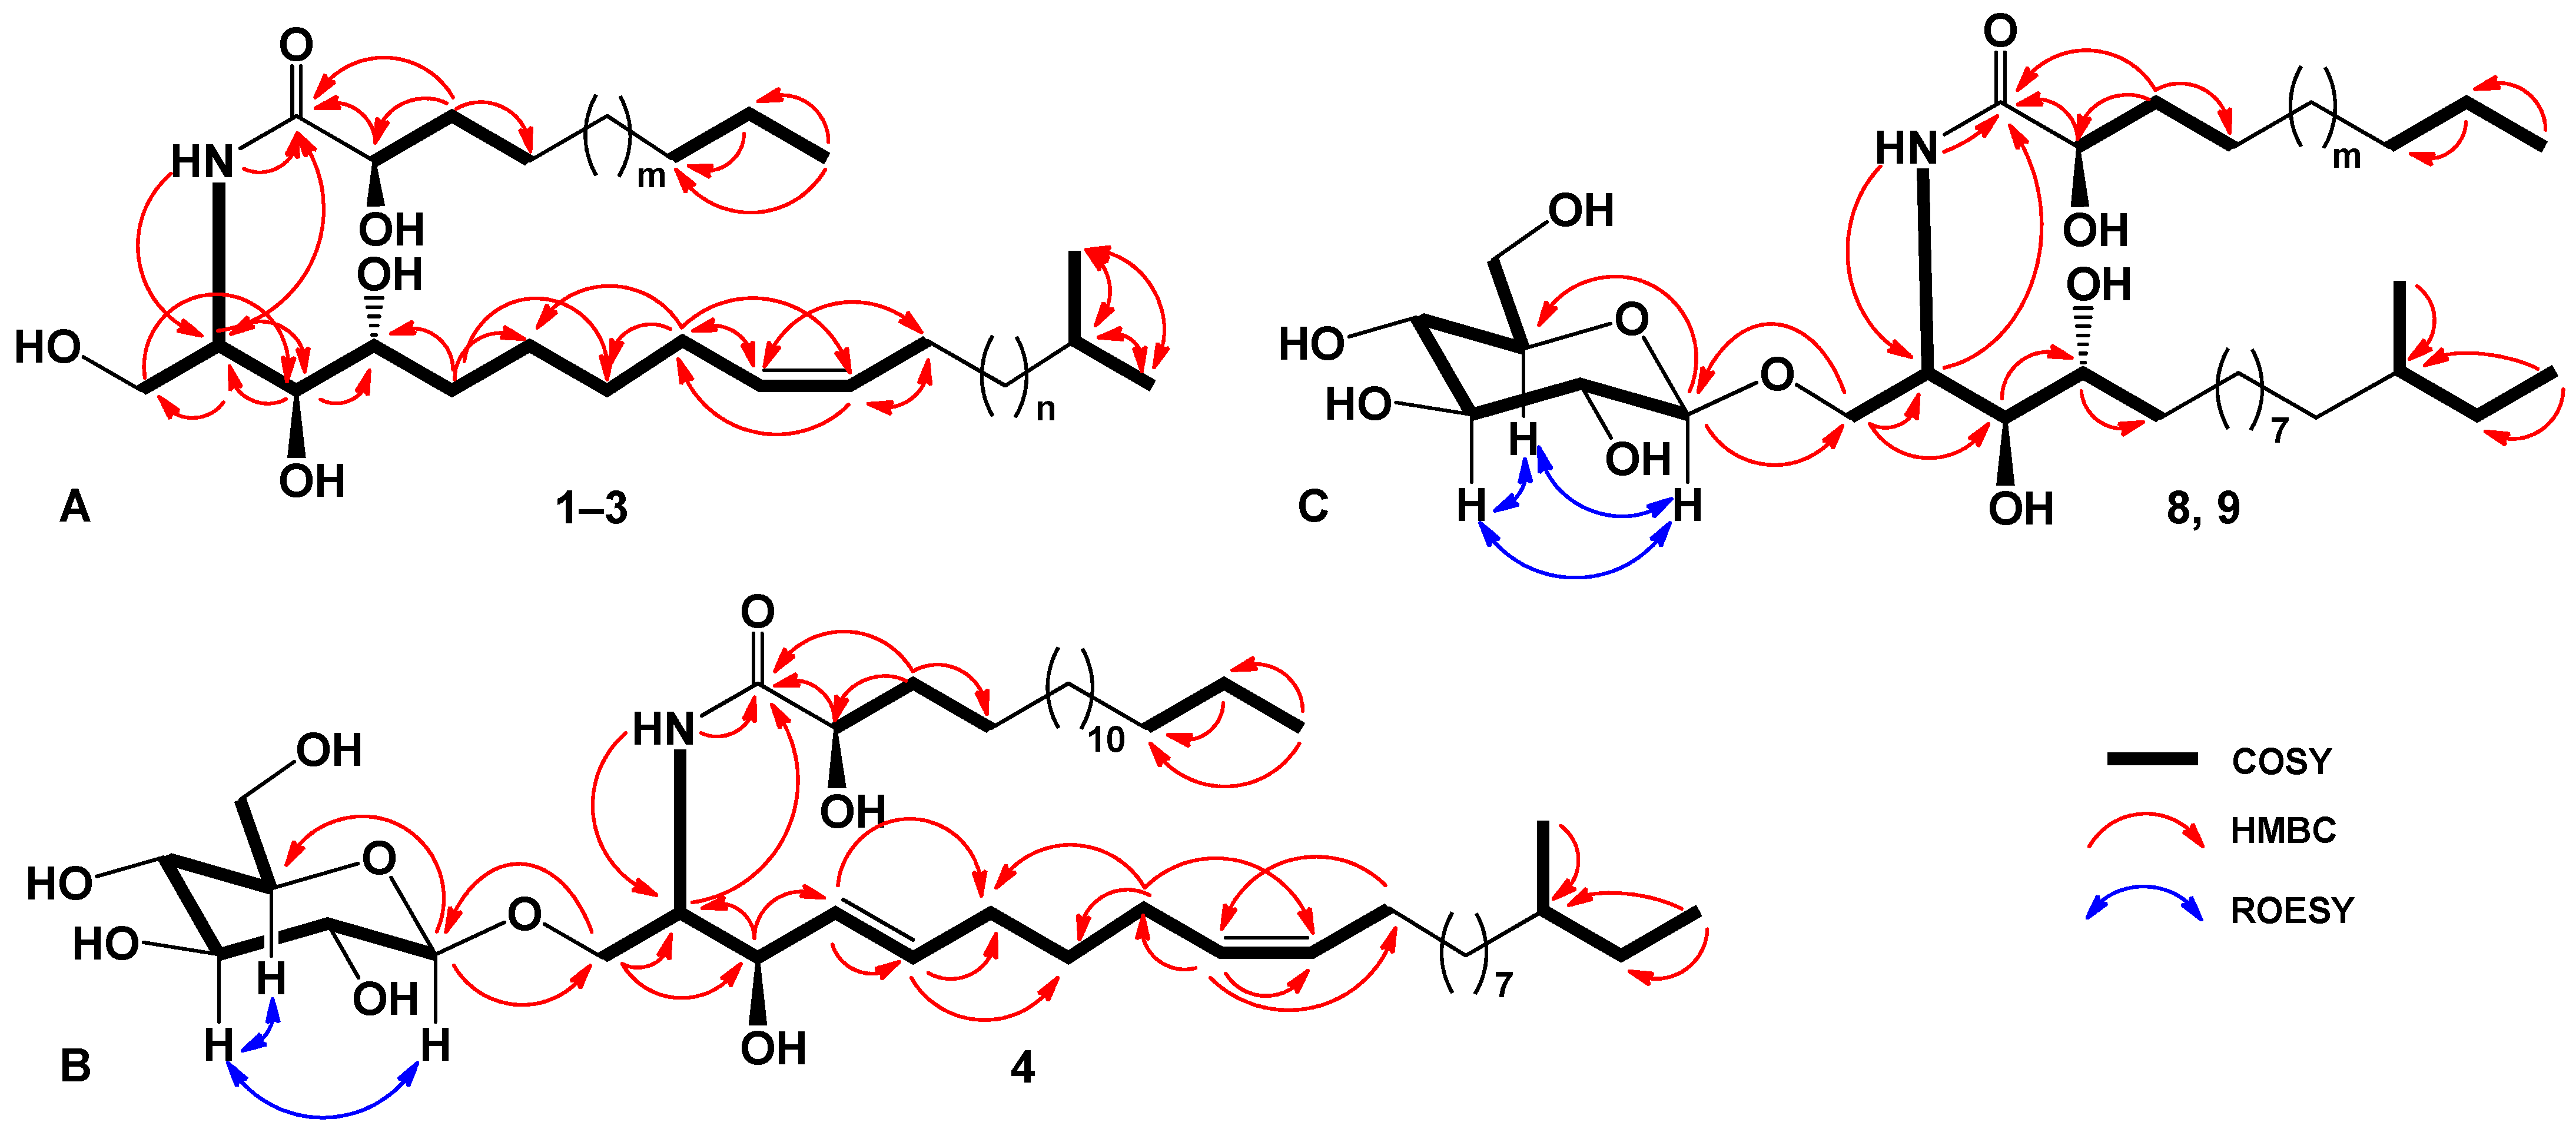
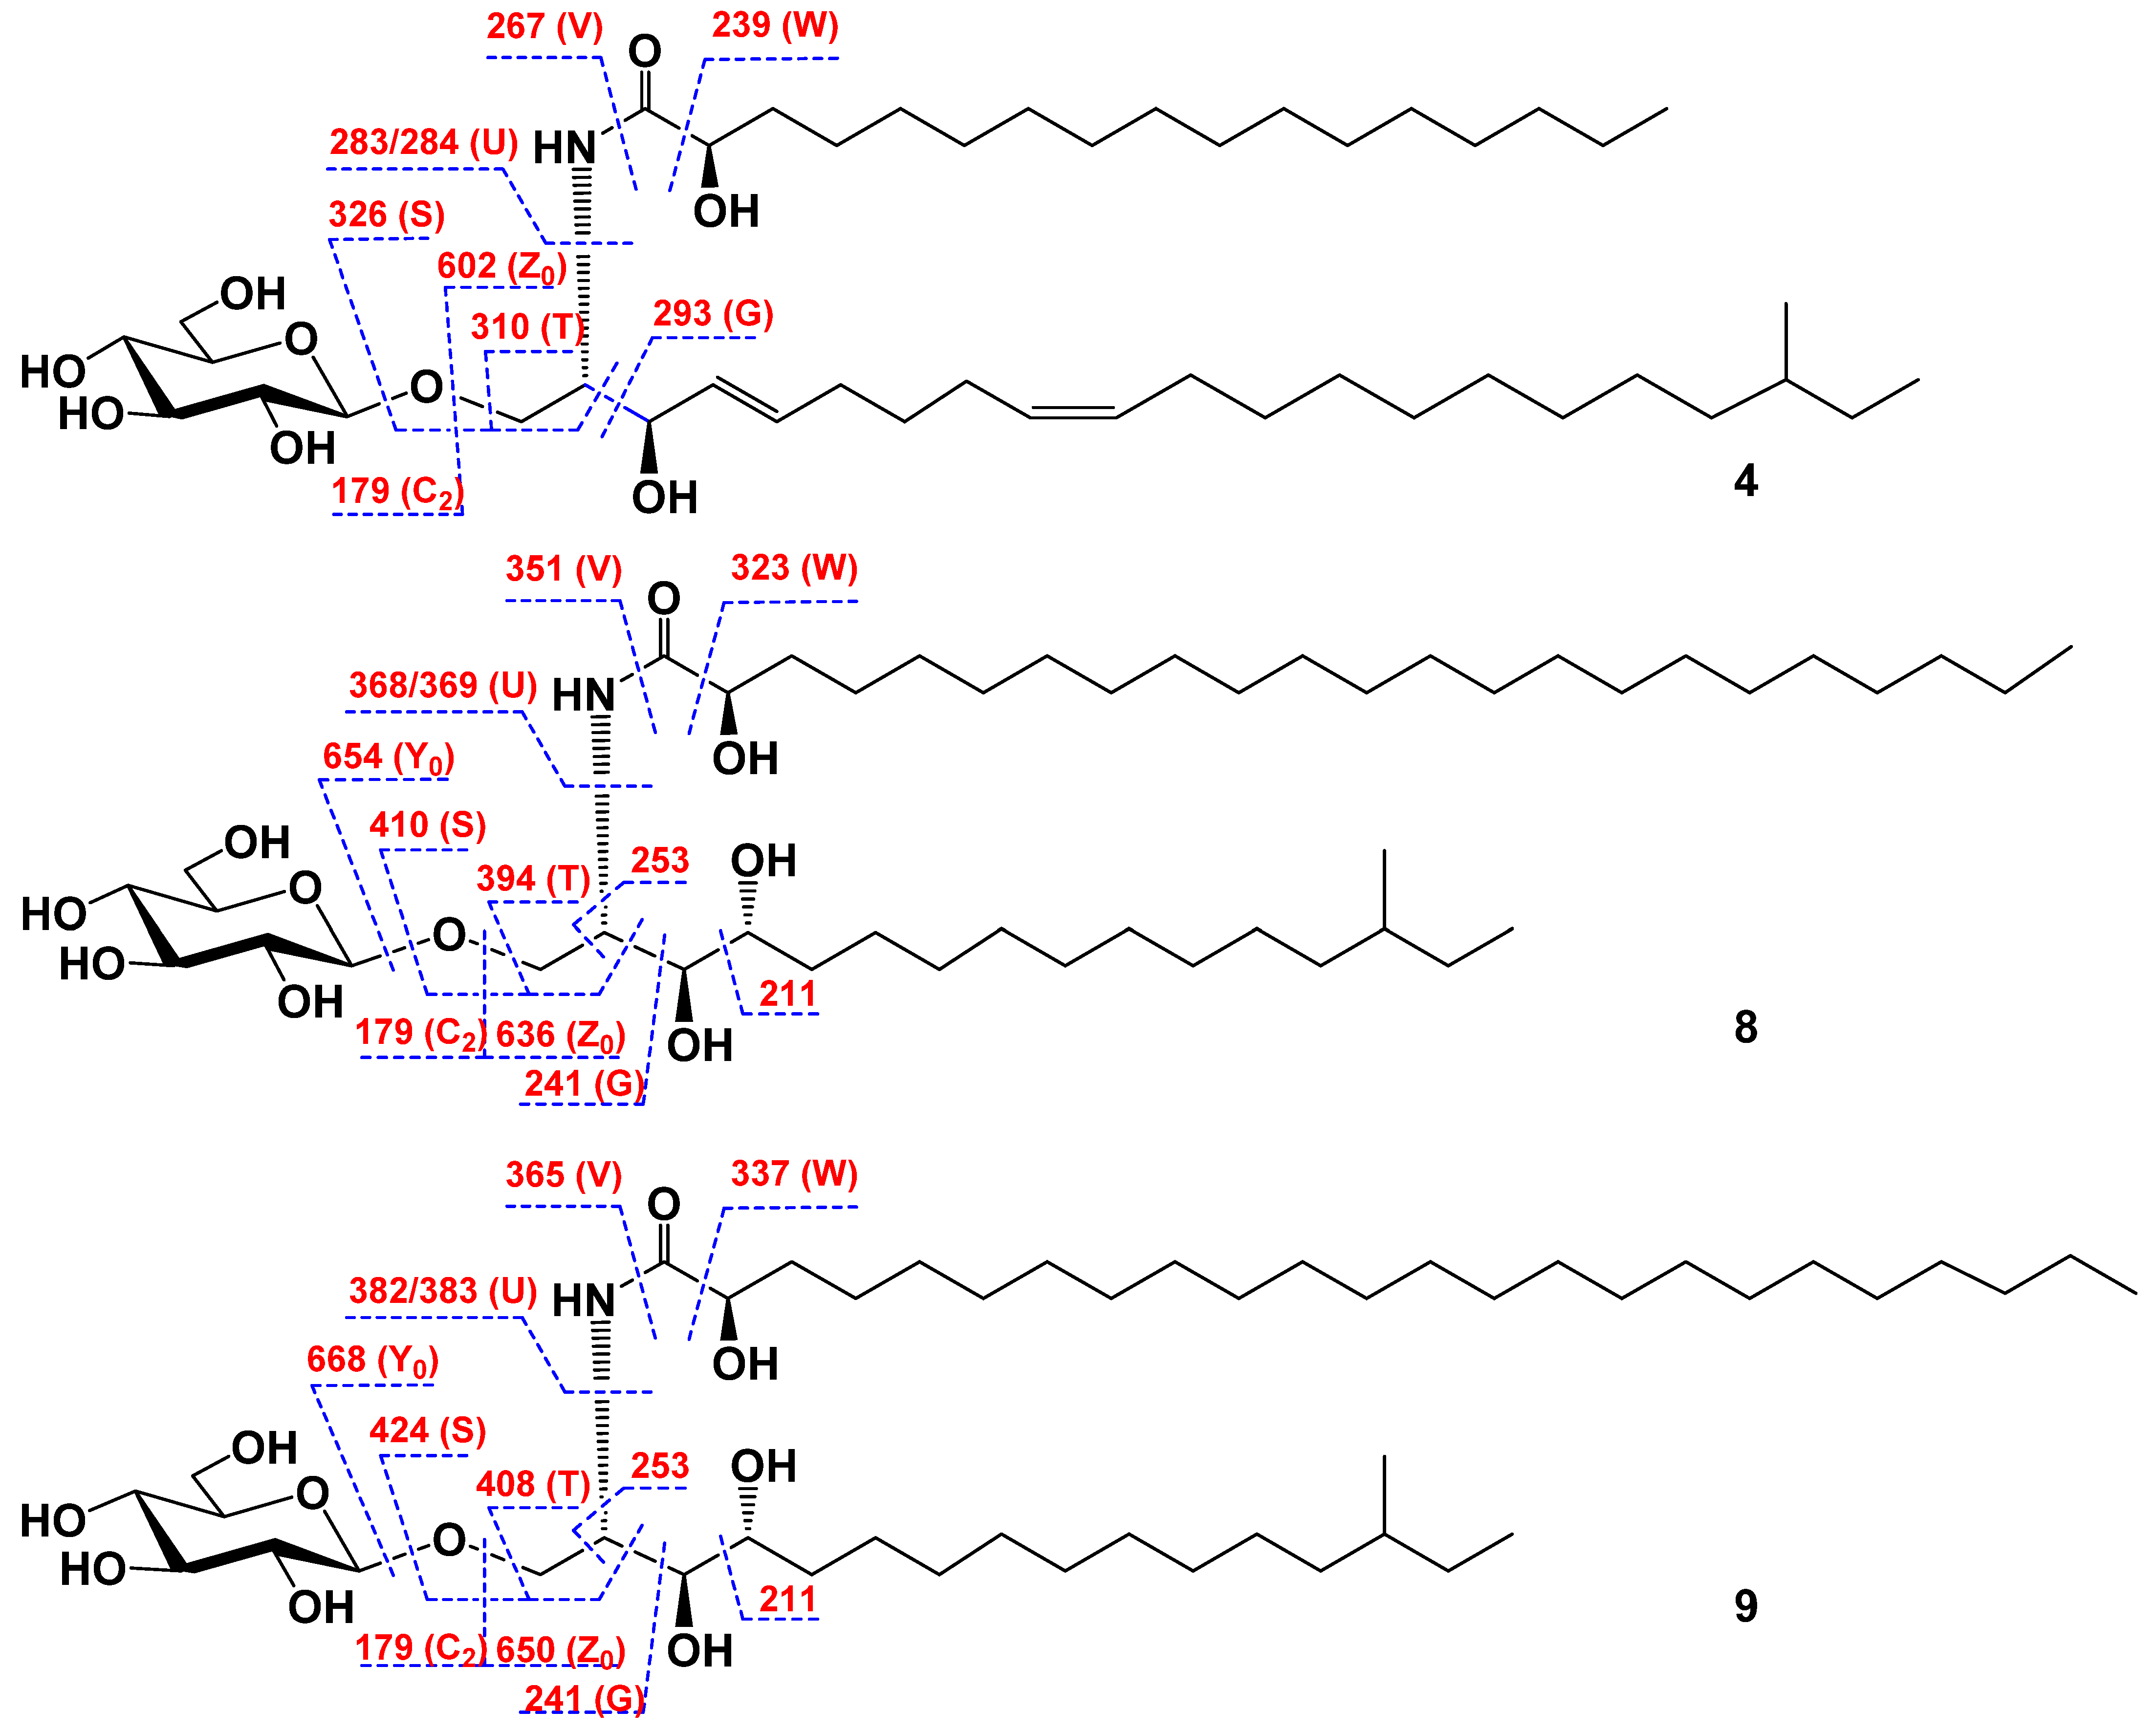
2.1. The Isolation and Determination of the Structures of Compounds 19 from C. patagonicus

The concentrated methanol–chloroform–ethanolic extract of C. patagonicus was separated between H2O and AcOEt/BuOH, with the organic layer dried and washed with cold acetone. The acetone-soluble fraction was separated by chromatography on a silica gel column, followed by HPLC on semi-preparative Diasfer-110-C18, Discovery C18, and Discovery HS C18-10 columns. As a result, we obtained three new ceramides (13) and three new cerebrosides (4, 8, and 9) along with three known cerebrosides: ophidiacerebrosides C (5) and D (6) that had been previously isolated from the purple starfish Ophidiaster ophidianus [21] and CE-3-2 (7) from the sea cucumber Cucumaria echinata [22] (Figure 1).
The IR spectrum of compound 1 showed the presence of hydroxyl (3402 cm−1) and amide (1656, 1523 cm−1) groups. The molecular formula of compound 1 was determined as C37H73NO5 from the [M + Na]+ sodium adduct ion peak at m/z 634.5376 in the (+)HRESIMS and the [M – H] deprotonated molecular ion peak at m/z 610.5412 in the (–)HRESIMS (Figures S1 and S2). The 1H- and 13C-NMR spectroscopic data of 1 showed the resonances of protons and carbons of three terminal methyls CH3-20, CH3-21, and CH3-16′ [δH 2 × 0.88 d (6.5), 0.89 t (7.2); δC 2 × 22.5, 14.0], four oxygenated groups CH2-1 [δHa 4.51 dt (10.9, 4.2), δHb 4.43 m; δC 61.8], CH-3 (δH 4.34 m; δC 76.7), CH-4 (δH 4.28 m; δC 72.8), and CH-2′ (δH 4.62 m; δC 72.3), one amide group NH-CO [δH 8.55 d (9.0); δC 175.0], the 9(10)-double bond (δH 5.50 m, 5.48 m; δC 130.1, 129.9), and one characteristic methine CH-2 [δH 5.10 sext (4.5); δC 52.8] attached at the nitrogen atom (Table 1, Figures S3 and S4). Thus, the 1H- and 13C-NMR spectra of 1 exhibited the characteristic signals of an unsaturated phytosphingosine-type ceramide with a 2-hydroxy fatty acid (Figure 1). Moreover, ceramide 1 has normal and iso-types of side chains; in the terminal methyl groups, the carbon atom signals were observed at δC 14.0 (normal form) and 2 × 22.5 (iso-form) in the 13C-NMR spectrum (Table 1, Figure S4). The 1H-1H COSY and HSQC correlations of 1 revealed the corresponding sequences of protons at C-1 to C-11; C-20 to C-21 through C-19; C-2 to NH; C-2′ to C-4′, and C-16′ to C-14′ (Table 1, Figure 2A, Figures S5 and S6). The key HMBC cross-peaks, such as Hb-1/C-3; H-2/C-1, C-3, C-1′; H-3/C-2, C-4; Hb-5/C-4, C-6, C-7; H-8/C-6, C-7, C-9, C-10; H-9 and H-10/C-8, C-11; H-11/C-9, C-10; H-19/C-20, C-21; H3-20/C-19, C-21; H3-21/C-19, C-20; NH/C-2, C-1′; H-2′/C-1′; Ha-3′/C-1′, C-4′; Hb-3′/C-2′; H2-15′/C-14′; and H3-16′/C-14′, C-15′ confirmed the overall structure of ceramide 1 (Figure 2A and Figure S7).
The polymethylene chain length of LCB and FA and the absolute configuration of the ceramide 1 were determined as follows. When 1 was methanolyzed with methanolic hydrochloric acid, fatty acid methyl ester (FAME) was obtained together with LCB. A gas chromatography–mass spectrometry (GC–MS) analysis of FAME showed the existence of one component that was characterized as saturated methyl 2-hydroxyhexadecanoate of normal type (FAME-1). The normal type of FAME-1 was also confirmed by 1H-NMR spectra, which consisted only of one triplet terminal methyl group at δH 0.89. The optical rotation of FAME-1 ([α]D25 –3.5˚ (c = 1.0, CHCl3)) is consistent with the data [α]D25 –3.21˚ reported in the literature [23]; therefore, the absolute stereochemistry at C-2′ is suggested to be R. Based on this suggestion, as well as on NMR and mass spectrometric data, we assumed LCB of ceramide 1 to have 21 carbon atoms and iso-type of unsaturated polymethylene chain. The geometry of the double bond in LCB can be determined on the basis of the 13C-NMR chemical shift of the methylene carbon adjacent to the olefinic carbon (δC ≈ 27 for (Z) isomers and δC ≈ 32 for (E) isomers [24]). The 13C-NMR spectrum of compound 1 indicated the presence of two characteristic allyl carbons, C-8 (δC 27.5) and C-11 (δC 27.3). Thus, the olefinic group in 1 was determined to have a cis (Z) geometry. The location of the double bond in the LCB moiety at position C-9 was determined through 1H-1H COSY, HMBC, and 2D TOCSY NMR experiments (Figure 2A, Figure S5, S7, and S8). The absolute configuration of LCB of ceramide 1 was assumed to be D-ribo-(2S,3S,4R) on the basis of similarities in optical rotation ([α]D25 +28.0˚ (c = 1.0, CHCl3)) with synthetic D-ribo-(2S,3S,4R)-phytosphingosine ([α]D25 +26.8˚ (c = 1.1, CHCl3)) [25].
Based on all above-mentioned data, we determined the structure of 1 to be (2S,3S,4R,9Z)-2-[(2R)-2-hydroxyhexadecanoylamino]-19-methyl-9-icosen-1,3,4-triol. As far as we know, a ceramide with such a chemical structure was isolated for the first time.
The IR spectrum of compound 2 showed the presence of hydroxyl (3404 cm−1) and amide (1657, 1522 cm−1) groups. The molecular formula of compound 2 was determined as C39H77NO5 from the [M + Na]+ sodium adduct ion peak at m/z 662.5324 in the (+)HRESIMS and the [M – H] deprotonated molecular ion peak at m/z 638.5364 in the (–)HRESIMS (Figures S9 and S10). A comparison of the 1H-, 13C-NMR spectra and an extensive 2D NMR analysis of compounds 1, 2, and 3 revealed that the unsaturated phytosphingosine-type ceramide with a 2-hydroxy fatty acid of 2 and 3 is identical to that of compound 1, while the polymethylene chain lengths of LCB and/or FA of 13 differ from each other (Figure 1, Figures S11–S15, Table 1). A comparison of the molecular weights (MWs) of 1 and 2 showed that they differed by 28 amu.
The FA unit in 2 was identified by GC analysis and the mass spectra of the FAME-2 derivative were measured by GC–MS similarly to compound 1. The GC–MS analysis showed that FAME-2 was identical to FAME-1. Moreover, the normal type of FAME-2 was also confirmed by the 1H-NMR spectrum, which consisted of only one triplet terminal methyl group at δH 0.89. Thus, the FA of ceramide 2 was determined to be (2R)-2-hydroxyhexadecanoic acid. Based on this finding, as well as on the NMR and mass spectrometry data, we suggested that LCB of ceramide 2 has 23 carbon atoms and an iso-type of unsaturated polymethylene chain. Accordingly, the structure of 2 was determined to be (2S,3S,4R,9Z)-2-[(2R)-2-hydroxyhexadecanoylamino]-21-methyl-9-docosen-1,3,4-triol.
Compound 3 was characterized from a mixture with compound 2 at a ratio of 2:1 on the basis of the evaluation of the ion peak intensities in ESI mass-spectra. The IR spectrum of compound 3 showed the presence of hydroxyl (3407 cm−1) and amide (1655, 1522 cm−1) groups. The positive HRESI mass spectrum of this mixture showed two [M + Na]+ ion peaks at m/z 662.5324 corresponding to compound 2 and at m/z 676.5463 corresponding to compound 3. Therefore, the molecular formula of compound 3 was determined as C40H79NO5 from the [M + Na]+ sodium adduct ion peak at m/z 676.5463 in the (+)HRESIMS and the [M – H] deprotonated molecular ion peak at m/z 652.5520 in the (–)HRESIMS (Figures S16 and S17). The NMR spectra of compounds 3 and 2 were almost identical (Figures S18–S22), but the MWs of 3 and 2 differed by 14 amu. A GC–MS analysis and mass spectra of fatty acid methyl esters obtained from the mixture of 3 and 2 showed the presence of FAME-2 containing saturated methyl 2-hydroxyhexadecanoate of the normal type and FAME-3 containing methyl 2-hydroxyheptadecanoate of the normal type. Thus, compounds 2 and 3 differed from each other by FA residues, C16 in 2 and C17 in 3, and had an identical C23 unsaturated phytosphingosine-type LCB. Thus, the structure of 3 was determined to be (2S,3S,4R,9Z)-2-[(2R)-2-hydroxyheptadecanoylamino]-21-methyl-9-docosen-1,3,4-triol.
The IR spectrum of compound 4 showed the presence of hydroxyl (3383 cm−1) and amide (1649, 1538 cm−1) groups. The molecular formula of compound 4 was determined as C45H85NO9 from the [M + Na]+ sodium adduct ion peak at m/z 806.6110 in the (+)HRESIMS and the [M – H] deprotonated molecular ion peak at m/z 782.6154 in the (–)HRESIMS (Figures S23 and S24). The 1H- and 13C-NMR spectroscopic data of the ceramide moiety of 4 showed the resonances of protons and carbons of three terminal methyls CH3-21, CH3-22, and CH3-17′ [δH 0.87 t (7.3), 0.87 d (6.2), 0.89 t (7.0); δC 11.3, 19.1, 14.0], three oxygenated groups CH2-1 [δHa 4.70 dd (10.6, 5.6), δHb 4.26 dd (10.6, 4.1); δC 69.9], CH-3 (δH 4.77 m; δC 72.1), and CH-2′ (δH 4.58 m; δC 72.3), one amide group NH-CO [δH 8.32 d (9.0); δC 175.4], the 4(5)-double bond [δH 5.99 dd (15.8, 6.2), 5.93 dt (15.8, 6.2); δC 131.7, 132.2], the 9(10)-double bond (δH 5.50 m, 5.49 m; δC 130.3, 129.6), and one characteristic methine CH-2 attached to nitrogen atom [δH 4.81 m; δC 54.4] (Table 2, Figures S25 and S26). Thus, the presence of characteristic signals of an unsaturated sphingosine-type ceramide including the 2-hydroxy FA residue in the 1H- and 13C-NMR spectra of the ceramide part of 4 was shown (Figure 1). Moreover, the ceramide moiety of 4 had normal and anteiso-types of side chains because the carbon atom signals of the terminal methyl groups were observed at δC 14.0 (normal form) and 11.3 and 19.1 (anteiso-form) in the 13C-NMR spectrum (Table 2). The 1H-1H COSY and HSQC correlations in the NMR spectra of 4 indicated the corresponding sequences of protons at C-1 to C-11; C-21 to C-22 through C-19 and C-20; C-2 to NH; C-2′ to C-4′, and C-16′ to C-14′ (Table 2, Figure 2B, Figures S27 and S28). The key HMBC cross-peaks such as Hb-1/C-2, C-3; H-2/C-1′; H-3/C-2, C-4; H-4/C-5, C-6; H-5/C-6, C-7; H-8/C-6, C-7, C-10; H-9/C-8, C-10, C-11; H-11/C-9; H3-21/C-19, C-20; H3-22/C-19; NH/C-2, C-1′; H-2′/C-1′; Ha-3′/C-1′, C-2′, C-4′; H2-16′/C-15′; and H3-17′/C-15′, C-16′ confirmed the overall structure of the ceramide part of 4 (Figure 2B and Figure S29).
A GC–MS analysis of FAME-4 showed the existence of one component belonging to saturated methyl 2-hydroxyheptadecanoate of the normal type. Based on this finding, as well as on the NMR and mass spectrometry data, we assumed that the LCB of the ceramide part of 4 has 22 carbon atoms and an anteiso-type of unsaturated polymethylene chain. The E-configuration of the 4(5)-double bond in LCB was determined on the basis of the coupling constant between H-4 and H-5 (15.8 Hz) in the 1H-NMR spectrum of 4 (Table 2). The geometry of the 9(10)-double bond in LCB was characterized as Z on the basis of the 13C-NMR chemical shifts of methylene carbons at δC 27.2 (C-8) and δC 27.0 (C-11) [19]. The location of the double bond in the LCB moiety was determined through 1H-1H COSY and HMBC NMR experiments (Table 2, Figure 2B, Figures S27 and S29).
The absolute configuration of C-2 and C-3 in LCB of the ceramide part of 4 is suggested to be (2S,3R) according to the similarities of the 1H-NMR data with the previously known asteriacerebroside G with a (2S,3R)-configuration of asymmetric centers [18].
In addition to the above-mentioned signals, the 1H-NMR spectrum of 4 exhibited one resonance in the de-shielded region due to the anomeric proton of the monosaccharide unit at δH 4.92 that correlated in the HSQC experiment with a carbon signal at δC 105.4 (Table 2). The 1H-1H COSY, HSQC, HMBC, and ROESY experiments led to the assignment of all the proton and carbon signals to the carbohydrate residue of 4 (Table 2, Figure 2B, Figures S25–S29). The coupling constant (7.8 Hz) of the anomeric proton was indicative of a β-configuration of the glycosidic bond. The NMR spectroscopic data of the monosaccharide moiety strictly coincided with those of a β-glucopyranosyl residue of the known asteriacerebroside G from A. amurensis [18]. The attachment of the monosaccharide to the ceramide part of 4 was deduced from the long-range correlations in the HMBC spectrum. There were cross-peaks between H-1″ of Glcp and C-1 of aglycon, as well as between H-1 of the ceramide part and C-1″ of Glcp (Figure 2B). Acid hydrolysis of cerebroside 4 with 2M TFA was carried out to confirm the identification of its monosaccharide unit as glucose. An alcoholysis of sugar by ©-(−)-2-octanol followed by acetylation, a GC analysis, and a comparison with the corresponding derivatives of standard monosaccharides allowed us to identify the D-configuration for the β-glucopyranosyl residue of 4.
The presence of a monosaccharide unit and the structure of the ceramide part of cerebroside 4 were confirmed by ESIMS/MS data. In fact, the (−)ESIMS/MS spectrum of the molecular anion peak –M − H] at m/z 782 showed fragmentary peaks obtained through the loss of a sugar unit at m/z 602 [–M − H)−180] (Z0-ion) and 179 [hexo–e − H] (C2-ion), and also a few characteristic fragmentary peaks due to the cleavage of the ceramide part of 4: m/z 326 [–M − H)−456], the loss of a monosaccharide residue, and the cleavage of the bond between C-2 and C-3 (S-ion); m/z 310 [–M − H)−472], the loss of monosaccharide residue, and the cleavage of the bond between C-2 and C-3 (T-ion); m/z 293 [–M − H)−489], the cleavage of the bond between C-2 and C-3 (G-ion); m/z 283/284 [–M − H)−499/500], the cleavage of the bond between C-2 and NH (U-ion); m/z 267 [–M − H)−515], the cleavage of the amide bond (V-ion), and m/z 239 [–M − H)−543], and the cleavage of the bond between C-1′ and C-2′ (W-ion) (Figure 3).
On the basis of all the above-mentioned data, we determined the structure of cerebroside 4 to be (2S,3R,4E,9Z)-1-O-(β-D-glucopyranosyl)-2-[(2R)-2-hydroxyheptadecanoylamino]-19-methyl-4,9-henicosadien-3-ol.
After carrying out an extensive 2D NMR and MS analysis of cerebrosides 4, 8, and 9, we suggested that the monosaccharide moiety of 4 is identical to those of glycosides 8 and 9.
The IR spectrum of compound 8 showed the presence of hydroxyl (3401 cm−1) and amide (1634, 1541 cm−1) groups. The molecular formula of compound 8 was determined as C46H91NO10 from the [M + Na]+ sodium adduct ion peak at m/z 840.6336 in the (+)HRESIMS and the [M – H] deprotonated molecular ion peak at m/z 816.6574 in the (–)HRESIMS (Figures S30 and S31). The 1H- and 13C-NMR spectroscopic data of the ceramide part of 8 showed the resonances of protons and carbons of three terminal methyls CH3-16, CH3-17, and CH3-22′ [δH 0.86 t (7.5), 0.86 d (6.4), 0.88 t (7.0); δC 11.3, 19.2, 14.0], four oxygenated groups CH2-1 [δHa 4.71 dd (10.6, 6.5), δHb 4.53 dd (10.6, 4.4); δC 70.3], CH-3 [δH 4.32 dd (12.3, 5.5); δC 75.7], CH-4 (δH 4.21 m; δC 72.4), and CH-2′ (δH 4.58 m; δC 72.3), one amide group NH-CO [δH 8.54 d (9.2); δC 175.4], and one characteristic methine CH-2 [δH 5.26 m; δC 51.5] attached at the nitrogen atom (Table 2, Figures S32 and S33). Thus, the 1H- and 13C-NMR spectra of 8 exhibited the characteristic signals of a saturated phytosphingosine-type ceramide residue containing a 2-hydroxy FA (Figure 1). Moreover, the ceramide part of 8 had the normal and anteiso-types of side chains because the carbon atom signals of the terminal methyl groups were observed at δC 14.0 (normal form) and 11.3 and 19.2 (anteiso-form) in the 13C-NMR spectrum (Table 2). The 1H-1H COSY and HSQC correlations in the NMR spectra of 8 indicated the corresponding sequences of protons at C-1 to C-5; C-16 to C-17 through C-15 and C-14; C-2 to NH; C-2′ to C-4′, and C-22′ to C-20′ (Table 2, Figure 2C, Figures S34 and S35). The key HMBC cross-peaks such as Hb-1/C-2, C-3; H-2/C-1′; H-3/C-4; H-4/C-5; H3-16/C-14, C-15; H3-17/C-14; NH/C-2, C-1′; H-2′/C-1′; Ha-3′/C-1′, C-2′, C-4′; H2-21′/C-20′; H3-22′/C-21′ confirmed the common structure of the ceramide part of 8 (Figure 2C and Figure S36).
A GC–MS analysis of FAME-5 showed the existence of one component that belonged to a saturated methyl 2-hydroxytricosanoate of the normal type. Based on this finding, as well as on the NMR and mass spectrometric data, we assumed that the LCB of the ceramide part of 8 has 17 carbon atoms and the anteiso-type of saturated polymethylene chain. The absolute configuration of LCB of the ceramide moiety of 8 is suggested to be D-ribo-(2S,3S,4R) on the basis of the similarity of its 1H-NMR spectroscopic data with those of the LCB of ceramide 1. The attachment of the monosaccharide to the ceramide part of 8 was deduced from long-range correlations in the HMBC spectrum. There were cross-peaks between H-1″ of Glcp and C-1 of aglycon, as well as between H-1 of the ceramide part and C-1″ of Glcp (Figure 2C and Figure S36).
The presence of a monosaccharide unit and the structure of the ceramide part of cerebroside 8 were confirmed by ESIMS/MS data. In fact, the (−)ESIMS/MS spectrum of the molecular anion peak –M − H] at m/z 816 showed fragmentary peaks obtained through the loss of a sugar unit at m/z 654 [–M − H)−162] (Y0-ion), m/z 636 [–M − H)−180] (Z0-ion) and 179 [hexo–e − H] (C2-ion), and also few characteristic fragmentary peaks due to the cleavage of the ceramide part of 8: m/z 410 [–M − H)−406], the loss of a monosaccharide residue and the cleavage of the bond between C-2 and C-3 (S-ion); m/z 394 [–M − H)−422], the loss of a monosaccharide residue and the cleavage of the bond between C-2 and C-3 (T-ion); m/z 368/369 [–M – H)−448/449], the cleavage of the bond between C-2 and NH (U-ion); m/z 351 [–M – H)−465], the cleavage of the amide bond (V-ion); m/z 323 [–M – H)−493], the cleavage of the bond between C-1′ and C-2′ (W-ion); m/z 253 [–M – H)−563], the cleavage of the bonds between C-1 and C-2 and simultaneously between C-2 and NH; m/z 241 [–M – H)−575], the cleavage of the bond between C-2 and C-3 (G-ion); and 211 [–M – H)−605], the cleavage of the bond between C-3 and C-4 (Figure 3).
Hence, we determined the structure of cerebroside 8 to be (2S,3S,4R)-1-O-(β-D-glucopyranosyl)-2-[(2R)-2-hydroxytricosanoylamino]-14-methylhexadecan-3,4-diol.
The IR spectrum of compound 9 showed the presence of hydroxyl (3401 cm−1) and amide (1626, 1540 cm−1) groups. The molecular formula of compound 9 was determined as C47H93NO10 from the [M + Na]+ sodium adduct ion peak at m/z 854.6687 in the (+)HRESIMS and the [M – H] deprotonated molecular ion peak at m/z 830.6730 in the (–)HRESIMS (Figures S37 and S38). Based on a thorough 2D NMR analysis of cerebrosides 9 and 8, we suggested that the ceramide part of 9 is almost identical to those of compound 8 (Figure S39–S43). However, a comparison of the molecular weights of 8 and 9 showed that they differ in MW by 14 amu. A GC–MS analysis of FAME-6 showed the presence of one component that was characterized as saturated methyl 2-hydroxytetracosanoate normal type.
The presence of a monosaccharide unit and the structure of the ceramide part of cerebroside 9 were confirmed by ESIMS/MS data. In fact, the (−)ESIMS/MS spectrum of the molecular anion peak –M – H] at m/z 830 showed fragmentary peaks obtained through the loss of a sugar unit at m/z 668 [–M – H)−162] (Y0-ion), m/z 650 [–M – H)−180] (Z0-ion), and 179 [hexo–e – H] (C2-ion) and also few characteristic fragmentary peaks due to the cleavage of the ceramide part of 9: m/z 424 [–M – H)−406], the loss of a monosaccharide residue and the cleavage of the bond between C-2 and C-3 (S-ion); m/z 408 [–M – H)−422], the loss of a monosaccharide residue and the cleavage of the bond between C-2 and C-3 (T-ion); m/z 382/383 [–M – H)−448/449], the cleavage of the bond between C-2 and NH (U-ion); m/z 365 [–M – H)−465], the cleavage of the amide bond (V-ion); m/z 337 [–M – H)−493], the cleavage of the bond between C-1′ and C-2′ (W-ion); m/z 253 [–M – H)−577], the cleavage of the bonds between C-1 and C-2 and simultaneously between C-2 and NH; m/z 241 [–M – H)−589], the cleavage of the bond between C-2 and C-3 (G-ion); and 211 [–M – H)−619], and the cleavage of the bond between C-3 and C-4 (Figure 3).
Thus, we determined the structure of cerebroside 9 to be (2S,3S,4R)-1-O-(β-D-glucopyranosyl)-2-[(2R)-2-hydroxytetracosanoylamino]-14-methyl-hexadecan-3,4-diol.

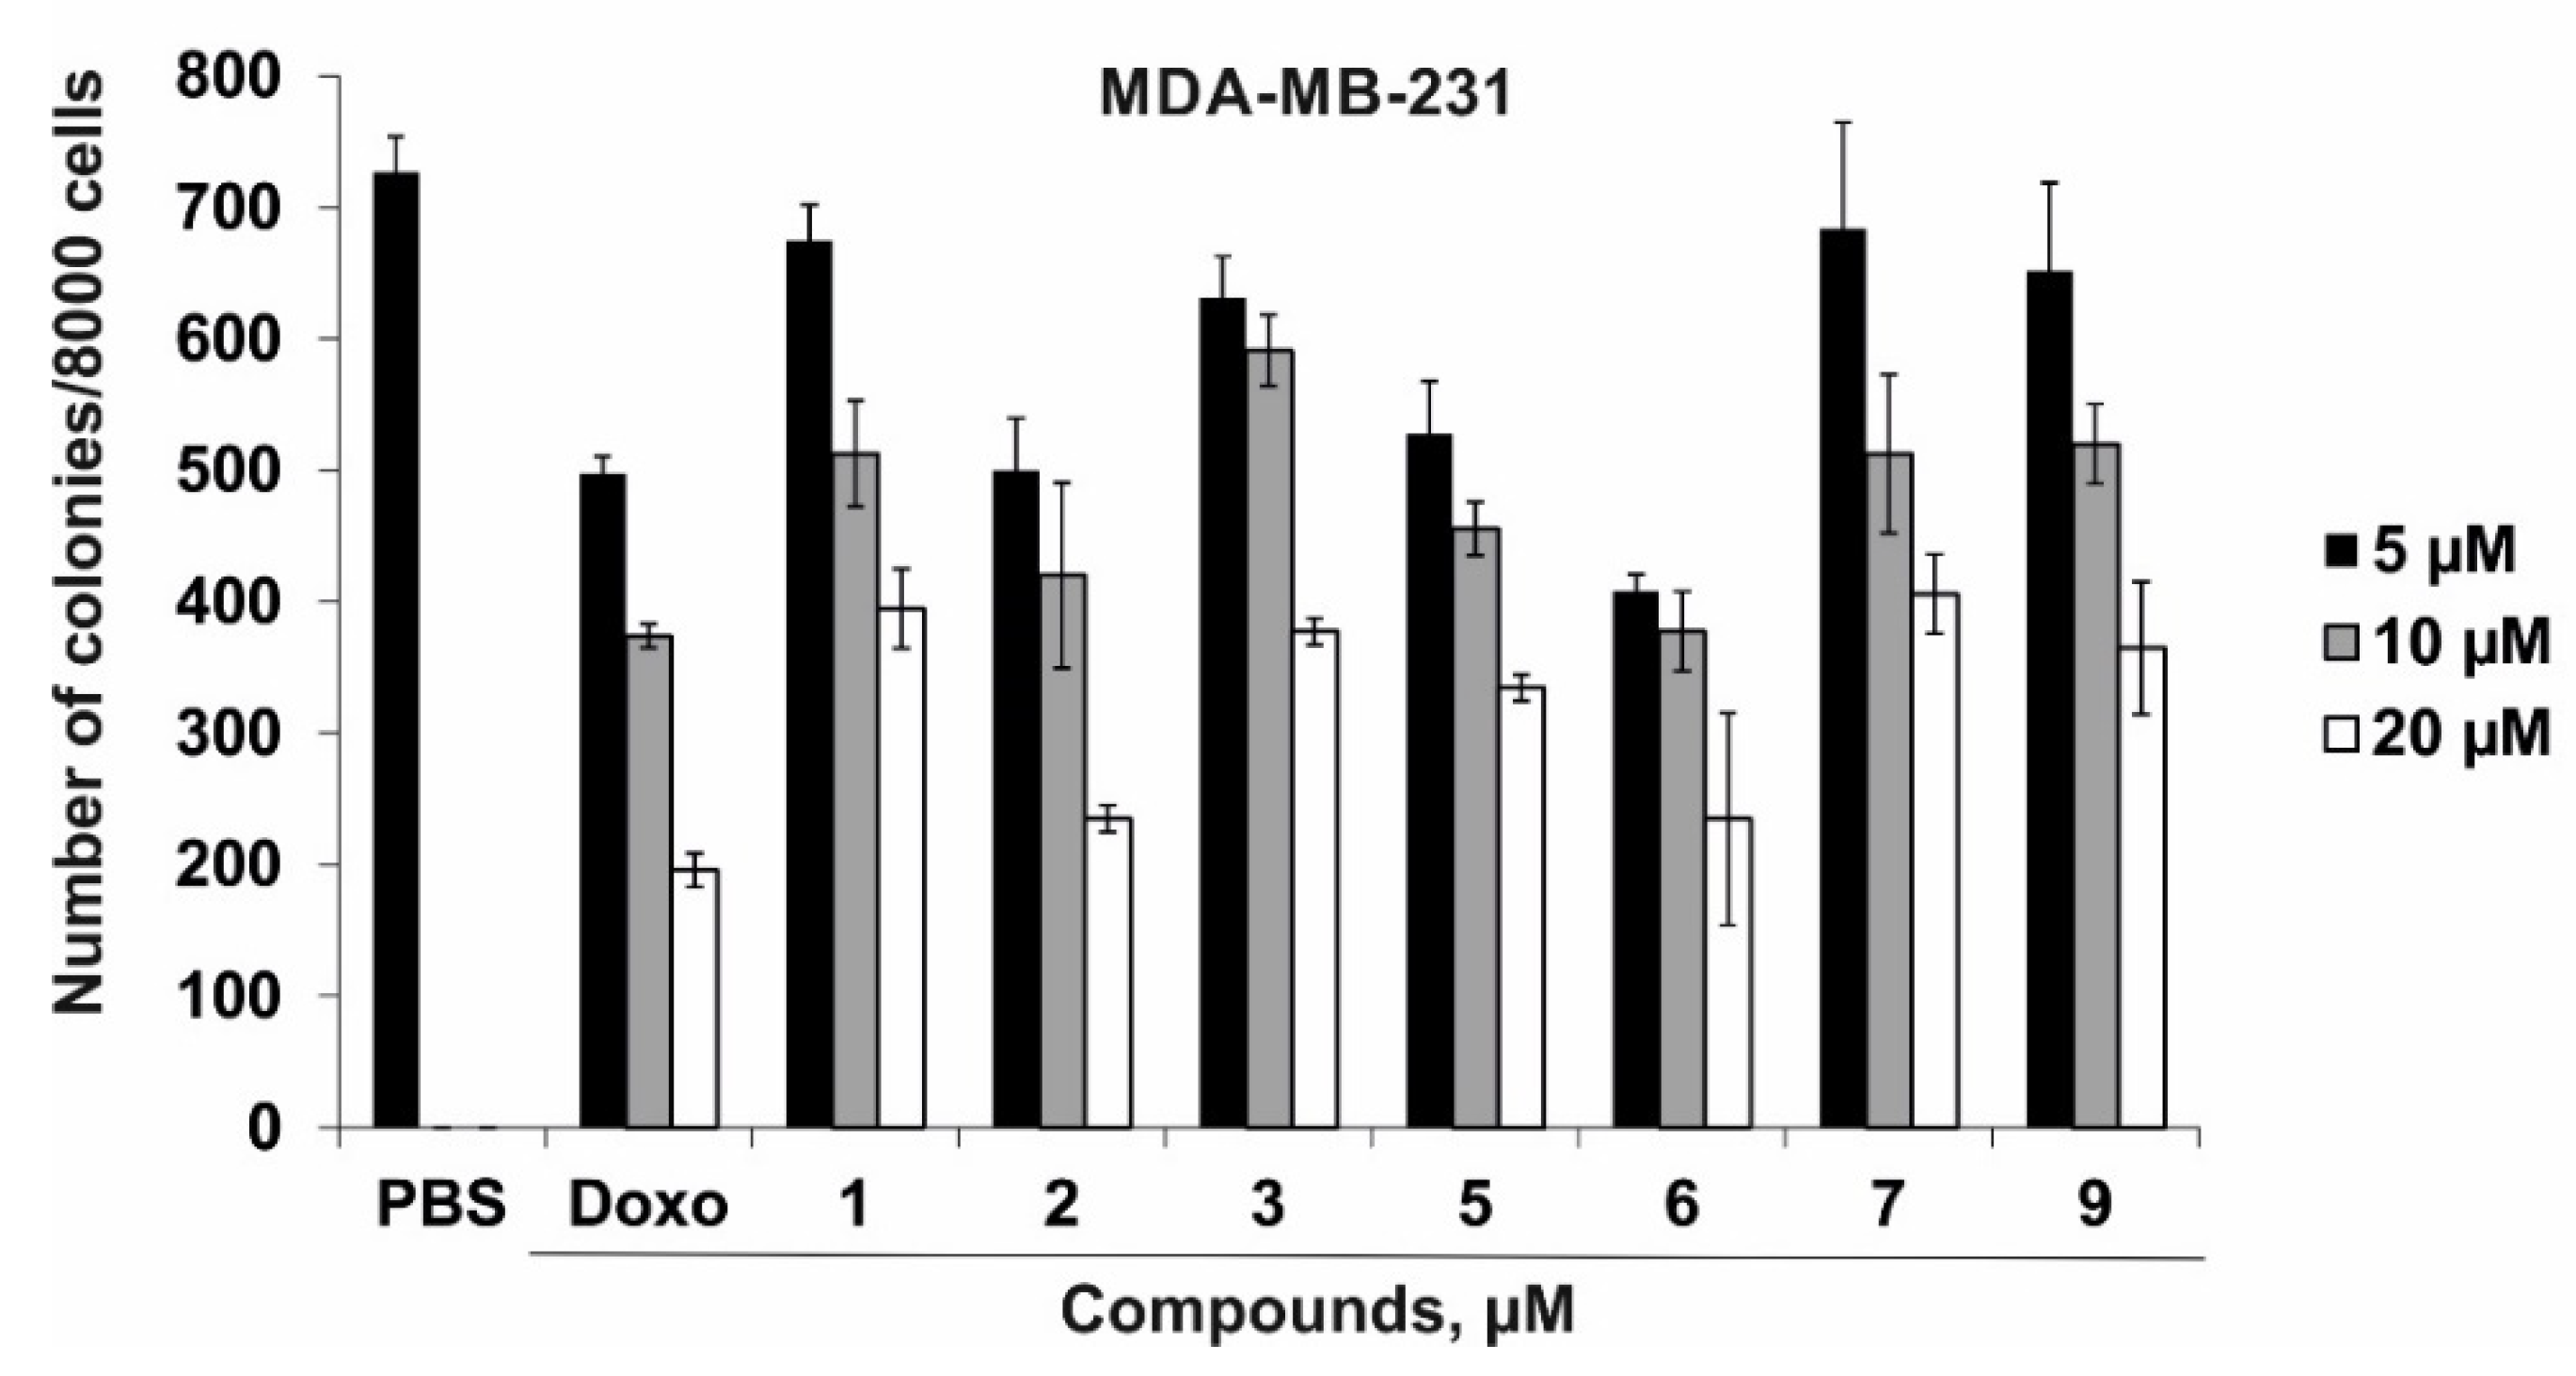
2.2. The Cytotoxic Activity of Compounds 13, 57, and 9 against Normal and Cancer Cells and their Effect on Colony Formation and Growth of Human Cancer Cells

In the present study, the cytotoxic activity of compounds 13, 57, and 9 against human normal embryonic kidney cells HEK293 and a panel of human cancer cells HT-29, SK-MEL-28, and MDA-MB-231 was measured by the MTS assay after 24 h of exposure. Different concentrations of doxorubicin (10, 50, and 100 µM), used as a positive control, and compounds 13, 57, and 9 (1, 10, and 50 µM) were studied. As a result, it was found that compounds 13, 57, and 9 had moderate cytotoxic activity against HEK293, HT-29, and SK-MEL-28 (Table 3). These compounds slightly inhibited the viability of HEK293, HT-29, and SK-MEL-28 cells at concentrations of up to 50 µM (with a percentage of inhibition lower than 15%). Compounds 1, 7, and 9 also possessed slight cytotoxic activity against MDA-MB-231 cells at concentrations of up to 50 µM. The half maximal inhibitory concentration (IC50) of compounds 2, 3, 5, and 6 that caused inhibition of 50% cell viability was recorded only for breast carcinoma cells MDA-MB-231 and was comparable among the compounds under study (Table 3). The IC50 of doxorubicin (Doxo) was 35.7 µM, 21.8 µM, 40.0 µM, and 22.3 µM for HEK293, HT-29, SK-MEL-28, and MDA-MB-231 cell lines, respectively (Table 3).
Since compounds 13, 57, and 9 inhibited the viability of breast cancer cells MDA-MB-231, we then tested their ability to inhibit colony formation of MDA-MB-231 cells using the soft agar assay. The colony formation assay, also referred to as soft agar assay, allows for screening the therapeutic efficacy of compounds for anchorage-independent cell growth, which is one of the hallmark characteristics of cellular transformation and uncontrolled growth of cancer cells [26].
As a result, we found that compounds 1, 3, 7, and 9 at a concentration of 20 µM had a comparable effect on MDA-MB-231 colony formation and decreased the number of colonies by 46%, 48%, 44%, and 50%, respectively. Compounds 2, 5, and 6 (20 µM) inhibited colony formation of MDA-MB-231 cells by 68%, 54%, and 68%, respectively. The colony-inhibiting activity of compounds 2, 5, and 6 (20 µM) was comparable with the effect of doxorubicin that reduced the number of colonies by 70% at a concentration of 20 µM (Figure 4).

3. Materials and Methods

3.1. General Procedures

Optical rotations were determined on a PerkinElmer 343 polarimeter (Waltham, MA, USA). UV spectra were recorded on a Shimadzu UV-1601 PC spectrophotometer (Shimadzu, Kyoto, Japan). IR spectra were recorded using a Bruker Equinox 55 spectrophotometer in CDCl3 (Bruker, Göttingen, Germany). The 1H- and 13C-NMR spectra were obtained on Bruker Avance III 700 spectrometer (Bruker BioSpin, Bremen, Germany) at 700.13 and 176.04 MHz, respectively; chemical shifts were referenced to the corresponding residual solvent signals (δH 7.21/δC 123.5 for C5D5N). The HRESIMS spectra were recorded on a Bruker Impact II Q-TOF mass spectrometer (Bruker, Bremen, Germany); the samples were dissolved in MeOH (c 0.001 mg/mL). HPLC separations were carried out on an Agilent 1100 Series chromatograph (Agilent Technologies, Santa Clara, CA, USA) equipped with a differential refractometer and with the following columns used: Diasfer-110-C18 (10 μm, 250 × 15 mm, Biochemmack, Moscow, Russia), Discovery HS C18-10 (10 μm, 250 × 21.2 mm, Supelco, North Harrison, PA, USA), and Discovery C18 (5 μm, 250 × 4 mm, Supelco, North Harrison, PA, USA). GC and GC–MS analyses were performed on a GC 2010 chromatograph equipped with a flame ionization detector and a gas chromatograph–mass spectrometer GCMS-QP5050, both Shimadzu (Kioto, Japan), and with fused silica capillary columns Supelcowax 10 and MDN-5S (both columns 30 m, 0.25 mm ID, 0.25 lm film, Supelco, USA). Low-pressure liquid column chromatography was carried out using Polychrom-1 (powdered Teflon, 0.25–0.50 mm; Biolar, Olaine, Latvia), Si gel KSK (50–160 μm, Sorbpolimer, Krasnodar, Russia), and Florisil (60–100 μm, Sigma Aldrich, St. Louis, MO, USA). Sorbfil Si gel plates (4.5 × 6.0 cm, 5–17 μm, Sorbpolimer, Krasnodar, Russia) were used for thin-layer chromatography.

3.2. Animal Material

Specimens of Ceramaster patagonicus Sladen, 1889 (order Valvatida, family Goniasteridae) were collected at a depth of 150–300 m in the Sea of Okhotsk, off Iturup Island, during the 42nd research cruise aboard the R/V Akademik Oparin in August 2012. The species was identified by B.B. Grebnev (G.B. Elyakov Pacific Institute of Bioorganic Chemistry FEB RAS, Vladivostok, Russia). A voucher specimen [no. 042-67] is deposited at the marine specimen collection of the G.B. Elyakov Pacific Institute of Bioorganic Chemistry FEB RAS, Vladivostok, Russia.

3.3. Extraction and Isolation

The fresh C. patagonicus specimens (3 kg wet weight) were cut into small pieces and extracted with CHCl3:MeOH (2:1) followed by further extraction with CHCl3:MeOH (1:1) and EtOH. The combined extracts were concentrated in vacuo to a residue of 159.5 g. This residue was separated between H2O (1.5 L) and AcOEt:BuOH (2:1) (4.5 L), and the organic layer was concentrated in vacuo to obtain a less polar fraction (51.5 g), which was washed with cold acetone (1 L). The acetone-soluble fraction (28.5 g) was chromatographed on a Si gel column (19 × 4.5 cm) using CHCl3, CHCl3:MeOH (97:3), and CHCl3:MeOH (9:1) to yield four fractions: 1 (932 mg), 2 (486 mg), 3 (735 mg), and 4 (1.04 g). Fractions 1–4 were further chromatographed on a Si gel column (10 × 4 cm) using n-hexane:AcOEt:MeOH (stepwise gradient, 6:3:0.1→6:3:0.7, v/v/v) to yield six subfractions: 21 (123 mg), 31 (475 mg), 32 (231 mg), 41 (55 mg), 42 (212 mg), and 43 (570 mg), which were then analyzed by TLC in the eluent system CHCl3:MeOH:H2O (8:1:0.1, v/v/v). Subfractions 21–43 mainly contained ceramides, cerebrosides, admixtures of pigments, and other concomitant lipids. A HPLC separation of subfraction 31 (475 mg) on a Diasfer-110-C18 column (2.5 mL/min) with MeOH as an eluent yielded pure 2 (12.0 mg, Rt 68.2 min) and seventeen subfractions 31-3–31-15 and 31-17–31-20. A HPLC separation of subfractions 31-14 and 31-18 on a Discovery C18 column (2.5 mL/min) with MeOH as an eluent yielded pure 1 (2.0 mg, Rt 15.1 min) and unseparated mixture of 3 and 2 (1.5 mg, Rt 17.8 min). HPLC separation of subfraction 42 (212 mg) on a Discovery HS C18-10 column (4.0 mL/min) with MeOH as an eluent yielded pure 5 (3.0 mg, Rt 133.2 min), 6 (4.5 mg, Rt 153.2 min), and thirteen subfractions 42-4–42-15 and 42-17. A HPLC separation of subfractions 42-12, 42-13, 42-15, and 42-17 on a Discovery C18 column (2.5 mL/min) with MeOH as an eluent yielded pure 4 (1.0 mg, Rt 15.9 min), 7 (2.5 mg, Rt 18.9 min), 8 (0.5 mg, Rt 21.7 min), and 9 (1.5 mg, Rt 26.9 min).

3.4. Compounds Characterization Data

(2S,3S,4R,9Z)-2-[(2R)-2-hydroxyhexadecanoylamino]-19-methyl-9-icosen-1,3,4-triol (1): Amorphous powder; [α]D25: +15.4 (c 0.1, MeOH); IR (CDCl3) νmax 3402, 2934, 2920, 2855, 1722, 1656, 1625, 1523, 1493, 1462, 1365, 1274, 1186, 1130, 1080 cm−1; (+)HRESIMS m/z 634.5376 [M + Na]+ (calcd for [C37H73NO5Na]+, 634.5381); (–)HRESIMS m/z 610.5412 [M – H] (calcd for [C37H72NO5], 610.5416); 1H- and 13C-NMR data, see Table 1.
(2S,3S,4R,9Z)-2-[(2R)-2-hydroxyhexadecanoylamino]-21-methyl-9-docosen-1,3,4-triol (2): Amorphous powder; [α]D25: +10.8 (c 0.1, MeOH); IR (CDCl3) νmax 3404, 2937, 2922, 2853, 1724, 1657, 1625, 1522, 1495, 1460, 1365, 1275, 1187, 1131, 1080 cm−1; (+)HRESIMS m/z 662.5324 [M + Na]+ (calcd for [C39H77NO5Na]+, 662.5694); (–)HRESIMS m/z 638.5364 [M – H] (calcd for [C39H76NO5], 638.5729); 1H- and 13C-NMR data, see Table 1.
(2S,3S,4R,9Z)-2-[(2R)-2-hydroxyheptadecanoylamino]-21-methyl-9-docosen-1,3,4-triol (3) as mixed with 2 (ratio 2:1): Amorphous powder; [α]D25: +10.0 (c 0.1, MeOH); IR (CDCl3) νmax 3407, 2932, 2927, 2855, 1728, 1655, 1624, 1522, 1495, 1464, 1366, 1278, 1183, 1130, 1081 cm−1; (+)HRESIMS m/z 676.5463 [M + Na]+ (calcd for [C40H79NO5Na]+, 676.5850); (–)HRESIMS m/z 652.5520 [M – H] (calcd for [C40H78NO5], 652.5885); 1H- and 13C-NMR data, see Table 1.
(2S,3R,4E,9Z)-1-O-(β-D-glucopyranosyl)-2-[(2R)-2-hydroxyheptadecanoylamino]-19-methyl-4,9-henicosadien-3-ol (4): Amorphous powder; [α]D25: –9.7 (c 0.05, MeOH); IR (CDCl3) νmax 3383, 2927, 2854, 1718, 1649, 1602, 1538, 1461, 1366, 1261, 1098, 1078, 1034 cm−1; (+)HRESIMS m/z 806.6110 [M + Na]+ (calcd for C45H85NO9Na, 806.6117); (–)HRESIMS m/z 782.6154 [M – H] (calcd for C45H84NO9, 782.6152); (–)ESIMS/MS of the ion at m/z 782: m/z 602 [–M − H)−180], 326 [–M − H)−456], 310 [–M − H)−472], 293 [–M − H)−489], 283/284 [–M − H)−499/500], 267 [–M − H)−515], 239 [–M − H)−543], 179 [hexo–e − H]; 1H- and 13C-NMR data, see Table 2.
(2S,3S,4R)-1-O-(β-D-glucopyranosyl)-2-[(2R)-2-hydroxytricosanoylamino]-14-methylhexadecan-3,4-diol (8): Amorphous powder; [α]D25: –14.0 (c 0.1, MeOH); IR (CDCl3) νmax 3401, 2925, 2854, 1732, 1634, 1602, 1541, 1457, 1363, 1261, 1078, 1018 cm−1; (+)HRESIMS m/z 840.6336 [M + Na]+ (calcd for C46H91NO10Na, 840.6335); (–)HRESIMS m/z 816.6574 [M – H] (calcd for C46H90NO10, 816.6570); (–)ESIMS/MS of the ion at m/z 816: m/z 654 [–M − H)−162], 636 [–M − H)−180], 410 [–M − H)−406], 394 [–M − H)−422], 368/369 [–M − H)−448/449], 351 [–M − H)−465], 323 [–M − H)−493], 253 [–M − H)−563], 241 [–M − H)−575], 211 [–M − H)−605], 179 [hexo–e − H]; 1H- and 13C-NMR data, see Table 2.
(2S,3S,4R)-1-O-(β-D-glucopyranosyl)-2-[(2R)-2-hydroxytetracosanoylamino]-14-methylhexadecan-3,4-diol (9): Amorphous powder; [α]D25: –17.5 (c 0.1, MeOH); IR (CDCl3) νmax 3401, 2925, 2854, 1731, 1626, 1602, 1540, 1455, 1297, 1103, 1078, 1029 cm−1; (+)HRESIMS m/z 854.6687 [M + Na]+ (calcd for C47H93NO10Na, 854.6692); (–)HRESIMS m/z 830.6730 [M – H] (calcd for C47H92NO10, 830.6727); (–)ESIMS/MS of the ion at m/z 830: m/z 668 [–M − H)−162], 650 [–M − H)−180], 424 [–M − H)−406], 408 [–M − H)−422], 382/383 [–M − H)−448/449], 365 [–M − H)−465], 337 [–M − H)−493], 253 [–M − H)−577], 241 [–M − H)−589], 211 [–M − H)−619], 179 [hexo–e − H]; 1H- and 13C-NMR data, see Table 2.

3.5. Methanolysis of Compounds 19 and Analysis of FAMEs

Compounds 19 (1 mg) were heated with 1 N HCl in 80% aqus. MeOH (1.0 mL) at 80°C for 4 h. The reaction mixtures were then extracted with n-hexane and the extracts were concentrated in vacuo to yield FAME-1–FAME-9. The FAMEs were analyzed on Supelcowax 10 columns at 200 °C. Helium was used as the carrier gas at a linear velocity of 30 cm/s. Mass spectra were recorded at 70 eV. The obtained mass spectra were compared with the NIST library and a FA mass spectra archive accessible online.

3.6. Acid Hydrolysis and Determination of Absolute Configurations of Monosaccharides

The acid hydrolysis of 4 (0.5 mg) was carried out in a solution of 2 M trifluoroacetic acid (TFA) (1 mL) in a sealed vial on an H2O bath at 100 ˚C for 2 h. The H2O layer was washed with CHCl3 (3 × 1.0 mL) and concentrated in vacuo. One drop of concentrated TFA and 0.5 mL of R-(–)-2-octanol (Sigma Aldrich) were added to the sugar fraction, and the sealed vial was heated in a glycerol bath at 130 ˚C for 6 h. The solution was evaporated in vacuo and exposed to a mixture of pyridine/acetic anhydride (1:1, 0.5 mL) for 24 h at room temperature. The acetylated 2-octylglycosides were analyzed by GC using the corresponding authentic samples prepared by the same procedure. The following peaks were detected in the hydrolysate of 4: D-glucose (tR 24.24, 24.84, 25.08, and 25.38 min). The retention times of the authentic samples were as follows: D-glucose (tR 24.23, 24.83, 25.06, and 25.37 min), L-glucose (tR 24.39, 24.63, 24.83, and 25.06 min).

3.7. Bioactivity Assay

3.7.1. Reagents

The McCoy’s 5A Modified Medium (McCoy’s 5A), the Dulbecco’s Modified Eagle’s Medium (DMEM), Basal Medium Eagle (BME), phosphate-buffered saline (PBS), L-glutamine, penicillin–streptomycin solution (10 000 U/mL, 10 µg/mL) and trypsin were all purchased from Sigma-Aldrich (St. Louis, MO, USA). The MTS reagent was purchased from Promega (Madison, WI, USA). Fetal bovine serum (FBS), agar and gentamicin were purchased from ThermoFisher Scientific (Waltham, Massachusetts, USA).

3.7.2. Cell Lines

The human embryonic kidney cells HEK293 (ATCC® CRL-1573™), the colorectal adenocarcinoma cell line HT-29 (ATCC® HTB-38), the melanoma SK-MEL-28 (ATCC® HTB-72™), and breast adenocarcinoma MDA-MB-231 (ATCC® HTB-26™) cell lines were obtained from the American Type Culture Collection (Manassas, VA, USA).

3.7.3. Cells Culture Conditions

HT 29 cells were cultured in McCoy’s 5A medium; HEK293, SK-MEL-28, and MDA-MB-231 cell lines were maintained in the DMEM medium. The culture media were supplemented with 10% FBS and a 1% penicillin/streptomycin solution. The cell cultures were maintained at 37 ˚C in a humidified atmosphere containing 5% CO2.

3.7.4. Preparation of Compounds

Compounds 13, 57, and 9 were dissolved in a sterile dimethyl sulfoxide solution (DMSO) to prepare stock concentrations of 20 mM. Cells were exposed to serially diluted 13, 57, and 9 (1–100 µM) (with the culture medium used as a diluent) (the final concentration of DMSO was less than 0.5%).
Doxorubicin (Doxo) (Teva Pharmaceutical Industries, Ltd. (Israel)) was dissolved in sterile PBS to prepare stock concentrations of 10 mM. Cells were exposed to serially diluted Doxo (10–100 µM) (with the culture medium used as a diluent).
The vehicle control is the cells exposed to the equivalent volume of DMSO (the final concentration was less than 0.5%) for all of the experiments conducted.

3.7.5. Cell Viability Assay

The effect of compounds 13, 57, and 9 on the viability of tested cell lines was evaluated by the MTS assay. HEK293 (1.0 × 10⁴/200 µL), HT-29 (1.0 × 10⁴/200 µL), SK-MEL-28 (0.8 × 10⁴/200 µL), and MDA-MB-231 (1.0 × 10⁴/200 µL) cells were seeded on a 96-well plate and incubated for 24 h at 37°C in a CO2 incubator. The cells were exposed to either DMSO (vehicle control) or Doxo at concentrations of 1, 10, 50 µM (positive control) or 13, 57, and 9 at concentrations of 1, 10, and 50 µM for 24 h. The cells were subsequently incubated with 15 µL MTS reagent for 3 h, and the absorbance of each well was measured at 490/630 nm on a Power Wave XS microplate reader (BioTek, Winooski, VT, USA). The concentration at which a compound exerted half of its maximal inhibitory effect on cell viability (IC50) was calculated using the AAT-Bioquest® online calculator [27].

3.7.6. Colony Formation Assay

MDA-MB-231 cells (2.4 × 10⁴/mL) were exposed to either DMSO (vehicle control) or Doxo (positive control) at concentrations of 5, 10, and 20 µM, and to 13, 57, and 9 at concentrations of 5, 10, 20 µM. Then, the cells were applied on dishes with 0.3% BME agar containing 10% FBS, 2 mM L-glutamine, and 25 µg/mL gentamicin. The cultures were maintained at 37°C in a 5% CO2 incubator for 14 days. The number and size of the colonies were estimated under a Motic microscope AE 20 and using the ImageJ software bundled with 64-bit Java 1.8.0_112 (NIH, Bethesda, Maryland, USA).

3.7.7. Statistical Analysis

All assays were performed in triplicate. Results are presented as mean ± standard deviation (SD).

4. Conclusions

Three new ceramides (13) and three new cerebrosides (4, 8, and 9) along with three previously known cerebrosides—ophidiacerebrosides C (5), D (6), and CE-3-2 (7)—were isolated from a deep-sea starfish species, the orange cookie star Ceramaster patagonicus. Ceramides 13 contain iso-C21 or C23 Δ9-phytosphingosine as LCB and have C16 or C17 (2R)-2-hydroxy-fatty acids of the normal type. As far as we know, ceramides with the iso-type of LCB were isolated from this starfish for the first time. It is also worth noting that starfish-derived ceramides are the least studied class of sphingolipids. This may be due to the challenge of isolating certain components from complex mixtures of ceramides and other lipids. However, new data on the structures of starfish ceramides allow a better understanding of the biosynthetic features of these animals. Furthermore, these ceramides can also be used as chemotaxonomic markers.
Cerebroside 4 contains C22 Δ9-sphingosine of anteiso-type and (2R)-2-hydroxyheptadecanoic acid of the normal type. The C22 Δ9-sphingosine of anteiso-type was found in starfish cerebrosides for the first time. New compounds 8 and 9 contain saturated C-17 phytosphingosine of anteiso-type as LCB and differ from each other in the length of the polymethylene chain of (2R)-2-hydroxy-fatty acids: C23 at 8 and C24 at 9. All the isolated cerebrosides have β-D-glucopyranose as a monosaccharide residue. It is also worth noting that all the isolated ceramides and cerebrosides have only (2R)-2-hydroxy-fatty acids of the normal type. As far as we know, the composition of neutral sphingolipids of the starfish C. patagonicus was described for the first time.
Compounds 13, 57, and 9 under study exhibit slight or moderate cytotoxic activity against HEK293, HT-29, SK-MEL-28, and MDA-MB-231 cells. On the other hand, compounds 1, 3, 7, and 9 at a non-toxic concentration of 20 µM significantly decreased the number of colonies of MDA-MB-231 cells. The colony-inhibiting activity of compounds 2, 5, and 6 is comparable to the anticancer effect of doxorubicin. Ophidiacerebrosides C (5) and D (6) with (4E,8E,10E)-9-methylsphinga-4,8,10-trienine as LCB showed the highest cytotoxic and colony formation inhibitory effects among the cerebrosides analyzed. These data agree well with the results of published studies where these cerebrosides showed strong cytotoxic activity at a concentration of 2 μM against murine leukemic cells L1210 and moderate cytotoxic activity against a number of human cancer cell lines at concentrations of 15–34 μM [21,28]. The inhibition of cancer cell colony formation by starfish sphingolipids was shown for the first time.

Supplementary Materials

The following supporting information can be downloaded at: https://www.mdpi.com/article/10.3390/md20100641/s1, copies of the HRESIMS (Figures S1, S2, S9, S10, S16, S17, S23, S24, S30, S31, S37, and S38), 1H-NMR (Figures S3, S11, S18, S25, S32, and S39), 13C-NMR (Figures S4, S12, S19, S26, S33, and S40), 1H-1H-COSY (Figures S5, S13, S20, S27, S34, and S41), HSQC (Figures S6, S14, S21, S28, S35, and S42), and HMBC (Figures S7, S15, S22, S29, S36, and S43) spectra of compounds 1, 2, 3, 4, 8, and 9, respectively. This material is available free online.

Author Contributions

T.V.M.: Conceptualization, methodology (chemical), writing—original draft. V.M.Z.: Methodology (chemical). A.A.K.: writing—review and editing. A.S.K.: Methodology (biological). O.S.M.: Conceptualization, methodology (biological), writing—review and editing. A.I.K.: Methodology (NMR). R.S.P.: Methodology (mass spectrometry). V.I.S.: Methodology (chemical). N.V.I.: Writing—review and editing, supervision. All authors have read and agreed to the published version of the manuscript.

Funding

This study was supported by the Grant from the Ministry of Science and Higher Education of the Russian Federation No. 13.1902.21.0012 (contract No. 075-15-2020-796).

Institutional Review Board Statement

Not applicable.

Data Availability Statement

The data presented in this study are available on request from the corresponding authors.

Acknowledgments

The study was carried out using the equipment of the Collective Facilities Center “The Far Eastern Center for Structural Molecular Research (NMR/MS) of PIBOC FEB RAS”. We are grateful to B.B. Grebnev (G.B. Elyakov Pacific Institute of Bioorganic Chemistry FEB RAS, Vladivostok, Russia) for the identification of the starfish species.

Conflicts of Interest

The authors declare no conflict of interest.

References

  1. Minale, L.; Riccio, R.; Zollo, F. Steroidal oligoglycosides and polyhydroxysteroids from Echinoderms. Fortschr. Chem. Org. Nat. 1993, 62, 75–308. [Google Scholar] [CrossRef]
  2. Stonik, V.A. Marine polar steroids. Russ. Chem. Rev. 2001, 70, 673–715. [Google Scholar] [CrossRef]
  3. Iorizzi, M.; De Marino, S.; Zollo, F. Steroidal oligoglycosides from the Asteroidea. Curr. Org. Chem. 2001, 5, 951–973. [Google Scholar] [CrossRef]
  4. Stonik, V.A.; Ivanchina, N.V.; Kicha, A.A. New polar steroids from starfish. Nat. Prod. Commun. 2008, 3, 1587–1610. [Google Scholar] [CrossRef] [Green Version]
  5. Dong, G.; Xu, T.H.; Yang, B.; Lin, X.P.; Zhou, X.F.; Yang, X.W.; Liu, Y.H. Chemical constituents and bioactivities of starfish. Chem. Biodivers. 2011, 8, 740–791. [Google Scholar] [CrossRef]
  6. Ivanchina, N.V.; Kicha, A.A.; Stonik, V.A. Steroid glycosides from marine organisms. Steroids 2011, 76, 425–454. [Google Scholar] [CrossRef] [PubMed]
  7. Ivanchina, N.V.; Kicha, A.A.; Malyarenko, T.V.; Stonik, V.A. Advances in Natural Products Discovery; Gomes, A.R., Rocha-Santos, T., Duarte, A., Eds.; Nova Science Publishers: Hauppauge, NY, USA, 2017; Volume 6, pp. 191–224. [Google Scholar]
  8. Stonik, V.A.; Kicha, A.A.; Malyarenko, T.V.; Ivanchina, N.V. Asterosaponins: Structures, taxonomic distribution, biogenesis and biological activities. Mar. Drugs 2020, 18, 584. [Google Scholar] [CrossRef]
  9. Xia, J.M.; Miao, Z.; Xie, C.L.; Zhang, J.W.; Yang, X.W. Chemical constituents and bioactivities of starfish: An update. Chem. Biodivers. 2020, 17, e1900638. [Google Scholar] [CrossRef] [PubMed] [Green Version]
  10. Muralidhar, P.; Radhika, P.; Krishna, N.; Rao, D.V.; Rao, C.B. Sphingolipids from marine organisms: A review. Nat. Prod. Sci. 2003, 9, 117–142. [Google Scholar]
  11. Higuchi, R.; Inagaki, M.; Yamada, K.; Miyamoto, T. Biologically active gangliosides from echinoderms. J. Nat. Med. 2007, 61, 367–370. [Google Scholar] [CrossRef]
  12. Yamada, K. Chemo-pharmaceutical studies on the glycosphingolipid constituents from Echinoderm, sea cucumbers, as the medicinal materials. Yakugaku Zasshi 2002, 122, 1133–1143. [Google Scholar] [CrossRef] [PubMed]
  13. Inagaki, M. Structure and biological activity of glycosphingolipids from starfish and feather star. Yakugaku Zasshi 2008, 128, 1187–1194. [Google Scholar] [CrossRef] [PubMed] [Green Version]
  14. Malyarenko, T.V.; Kicha, A.A.; Stonik, V.A.; Ivanchina, N.V. Sphingolipids of Asteroidea and Holothuroidea: Structures and biological activities. Mar. Drugs 2021, 19, 330. [Google Scholar] [CrossRef]
  15. Degroote, S.; Wolthoorn, J.; van Meer, G. The cell biology of glycosphingolipids. Semin. Cell Dev. Biol. 2004, 15, 375–387. [Google Scholar] [CrossRef]
  16. Hakomori, S.; Igarashi, Y. Functional role of glycosphingolipids in cell recognition and signaling. J. Biochem. 1995, 118, 1091–1103. [Google Scholar] [CrossRef]
  17. Sperling, P.; Heinz, E. Plant sphingolipids: Structural diversity, biosynthesis, first genes and functions. Biochem. Biophys. Acta 2003, 1632, 1–15. [Google Scholar] [CrossRef]
  18. Ishii, T.; Okino, T.; Mino, Y. A ceramide and cerebroside from the starfish Asterias amurensis Lütken and their plant-growth promotion activities. J. Nat. Prod. 2006, 69, 1080–1082. [Google Scholar] [CrossRef]
  19. Fischer, C.L.; Drake, D.R.; Dawson, D.V.; Blanchette, D.R.; Brogden, K.A.; Wertz, P.W. Antibacterial activity of sphingoid bases and fatty acids against gram-positive and gram-negative bacteria. Antimicrob. Agents Chemother. 2012, 56, 1157–1161. [Google Scholar] [CrossRef] [Green Version]
  20. Malyarenko, T.V.; Kicha, A.A.; Malyarenko, O.S.; Zakharenko, V.M.; Kotlyarov, I.P.; Kalinovsky, A.I.; Popov, R.S.; Svetashev, V.I.; Ivanchina, N.V. New conjugates of polyhydroxysteroids with long-chain fatty acids from the deep-water Far Eastern starfish Ceramaster patagonicus and their anticancer activity. Mar. Drugs 2020, 18, 260. [Google Scholar] [CrossRef]
  21. Jin, W.; Rinehart, K.L.; Jares-Erijman, E.A. Ophidiacerebrosides: Cytotoxic glycosphingolipids containing a novel sphingosine from a sea star. J. Org. Chem. 1994, 59, 144–147. [Google Scholar] [CrossRef]
  22. Yamada, K.; Hara, E.; Miyamoto, T.; Higuchi, R.; Isobe, R.; Honda, S. Constituents of Holothuroidea, 6-Isolation and structure of biologically active glycosphingolipids from the sea cucumber Cucumaria echinata. Eur. J. Org. Chem. 1998, 371–378. [Google Scholar] [CrossRef]
  23. Higuchi, R.; Natori, T.; Komori, T. Biologically active glycosides from Asteroidea, XX. Glycosphingolipids from the starfish Asterina pectinifera, 1. Isolation and characterization of acanthacerebroside B and structure elucidation of related, nearly homogeneous cerebrosides. Liebigs Ann. Chem. 1990, 1, 51–55. [Google Scholar] [CrossRef]
  24. De Haan, J.W.; van de Ven, L.J.M. Configurations and Conformations in Acyclic, Unsaturated Hydrocarbons. A 13C NMR Study. Magn. Reson Chem. 1973, 5, 147–153. [Google Scholar] [CrossRef]
  25. Sugiyama, S.; Honda, M.; Komori, T. Biologically active glycosides from Asteroidea, XXIV 1). Stereochemistry of the four diastereomers of phytosphingosine. Liebigs Ann. Chem. 1990, 11, 1069–1078. [Google Scholar] [CrossRef]
  26. Horibata, S.; Vo, T.V.; Subramanian, V.; Thompson, P.R.; Coonrod, S.A. Utilization of the soft agar colony formation assay to identify inhibitors of tumorigenicity in breast cancer cells. J. Vis. Exp. 2015, 99, e52727. [Google Scholar] [CrossRef] [Green Version]
  27. AAT Bioquest. Available online: https://www.aatbio.com/tools/ic50-calculator (accessed on 10 November 2020).
  28. Kawatake, S.; Nakamura, K.; Inagaki, M.; Higuchi, R. Isolation and structure determination of six glucocerebrosides from the starfish Luidia maculata. Chem. Pharm. Bull. 2002, 50, 1091–1096. [Google Scholar] [CrossRef]
Figure 1. The structures of compounds 19 isolated from C. patagonicus.
Marinedrugs 20 00641 g001
Figure 2. 1H-1H COSY and key HMBC correlations for compounds 13 (A) and 1H-1H COSY, key HMBC, and ROESY correlations for compounds 4 (B), 8, and 9 (C).
Marinedrugs 20 00641 g002
Figure 3. The key fragmentary peaks in (–)ESIMS/MS spectra of compounds 4, 8, and 9.
Marinedrugs 20 00641 g003
Figure 4. The effect of compounds 13, 57, and 9 on colony formation of human breast cancer cells MDA-MB-231 (2.4 × 10⁴) that were exposed to PBS (control), Doxo (5, 10, and 20 µM), or the compounds under study (5, 10, and 20 µM) and placed on dishes with 0.3% Basal Medium Eagle (BME) agar containing 10% fetal bovine serum FBS, 2 mM L-glutamine, and 25 µg/mL gentamicin. After 14 days of incubation, the number of colonies was counted under a microscope using the ImageJ software program.
Marinedrugs 20 00641 g004
Table 1. 1H- (700.13 MHz) and 13C- (176.04 MHz) NMR chemical shifts of ceramides 13 in C5D5N, at 30 °C, δ in ppm, J values in Hz.
PositionδHδCPositionδHδC
1a
1b
4.51 dt (10.9, 4.2)
4.43 m
61.8112.10 q (6.7)27.3
1-OH6.60 m 19 or 211.51 m27.9
25.10 sext (4.5)52.820 or 220.88 d (6.5)22.5
34.34 m76.721 or 230.88 d (6.5)22.5
3-OH6.59 d (6.8) NH8.55 d (9.0)
44.28 m72.81′ 175.0
4-OH6.14 d (6.5) 2′4.62 m72.3
5a
5b
2.28 m
1.95 m
33.92′-OH7.53 d (5.1)
6a
6b
1.74 m
1.39 m
26.13′a
3′b
2.24 m
2.05 m
35.5
7a
7b
1.58 m
1.53 m
30.24′a
4′b
1.80 m
1.73 m
25.6
82.17 q (7.0)27.514′ or 15′1.25 m31.9
95.50 m130.115′ or 16′1.27 m22.7
105.48 m129.916′ or 17′0.89 t (7.2)14.0
Table 2. 1H- (700.13 MHz) and 13C- (176.04 MHz) NMR chemical shifts of cerebrosides 4 and 8, 9 in C5D5N, at 30 °C, δ in ppm, J values in Hz.
Position48, 9
δHδCδHδC
1a
1b
4.70 dd (10.6, 5.6)
4.26 dd (10.6, 4.1)
69.94.71 dd (10.6, 6.5)
4.53 dd (10.6, 4.4)
70.3
24.81 m54.45.26 m51.5
34.77 m72.14.32 dd (12.3, 5.5)75.7
3-OH6.75 d (4.7) 6.69 d (6.0)
45.99 dd (15.8, 6.2)131.74.21 m72.4
5a
5b
5.93 dt (15.8, 6.2)132.22.24 m
1.91 m
33.9
62.12 m32.1
71.50 m29.4
82.11 m27.2
95.50 m130.3
105.49 m129.6
112.12 m27.0
19 or 141.30 m34.41.30 m34.5
20a or 15a
20b or 15b
1.30 m
1.12 m
36.71.30 m
1.10 m
36.8
21 or 160.87 t (7.3)11.30.86 t (7.5)11.3
22 or 170.87 d (6.2)19.10.86 d (6.4)19.2
NH8.32 d (9.0) 8.54 d (9.2)
1′ 175.4 175.4
2′4.58 m72.34.58 m72.3
2′-OH7.53 d (5.0) 7.55 m
3′a
3′b
2.21 m
2.02 m
35.42.20m
2.01 m
35.4
4′a
4′b
1.82 m
1.73 m
25.71.77 m
1.70 m
25.0
Terminal CH30.89 t (7.0)14.00.88 t (7.0)14.0
1″4.92 d (7.8)105.44.95 d (7.9)105.5
2″4.03 m74.94.00 m74.9
2″-OH7.11 brs
3″4.20 m78.24.17 m78.2
4″4.20 m71.44.17 m71.4
5″3.91 m78.33.89 m78.3
6″a
6″b
4.51 brd (12.5)
4.35 m
62.54.48 brd (12.0)
4.33 m
62.5
6″-OH6.26 brs 6.27 brs
Table 3. Cytotoxic activities of compounds 13, 57, and 9 against normal and cancer cells.
CompoundsHalf Maximal Inhibitory Concentration (IC50), µM
HEK293HT-29SK-MEL-28MDA-MB-231
Doxorubicin35.7 ± 1.221.8 ± 3.240.0 ± 5.022.3 ± 0.2
1>50.0
>50.0
>50.0
>50.0
>50.0
>50.0
>50.0
>50.0
>50.0
>50.0
>50.0
>50.0
>50.0
>50.0
>50.0
>50.0
>50.0
>50.0
>50.0
>50.0
>50.0
>50.0
248.7 ± 2.4
349.4 ± 1.6
548.7 ± 1.8
640.5 ± 0.5
7>50.0
9>50.0
IC50 is the concentration of compounds that caused a 50% reduction in cell viability of tested normal and cancer cells. Values are mean ± standard deviation.
Publisher’s Note: MDPI stays neutral with regard to jurisdictional claims in published maps and institutional affiliations.

