Fuzzy Multicriteria Modelling of Decision Making in the Renewal of Healthcare Technologies


1
Department of Business Management, Technical School of Industrial Engineering, University of Castilla-la Mancha, 13005 Ciudad Real, Spain
2
CEG-IST, Instituto Superior Técnico, Universidade de Lisboa, 1649004 Lisbon, Portugal
*
Author to whom correspondence should be addressed.
Mathematics 2020, 8(6), 944; https://doi.org/10.3390/math8060944
Submission received: 18 May 2020
/
Revised: 4 June 2020
/
Accepted: 5 June 2020
/
Published: 8 June 2020
(This article belongs to the Special Issue Applications of Mathematical Methods and Fuzzy Techniques in Decision Making)
Abstract
:In the current literature, there are a clear lack of systems to assist in making decisions about the renewal of technology for healthcare equipment, which means that the limited capacity to invest in new equipment cannot usually be appropriately applied as determined by the care requirements of a community. This may have important repercussions for patients, such as the inability to offer treatment or diagnosis, having to delay treatment or diagnosis, increase the risk of patients and care staff of using obsolete equipment, and preventing early, accurate, and reliable diagnosis, all of which have effects on the quality of care to a community. This study therefore describes the first multicriteria model in a fuzzy environment to assist in decision making related to the renewal of healthcare equipment. The fuzzy analytic hierarchy process (FAHP), which allows for ambiguities, uncertainties, and doubts inherent in real-world decision processes to be taken into account, was used to do this. The model produces a plan with actions to be taken depending on the obtained results. The model includes a novel methodology that consists of modifying the top–down technique to allow for the levels of priority for renewing healthcare equipment to be determined from judgements given by three experts. The model was validated by applying it to a set of medical devices, and we show the results for a surgical C-arm, an X-ray CT room, a neonatal ventilator, a defibrillator, and a video-colonoscope. A program was also created using the NI Labview software to process the model so that it could be applied with a user interface that acts quickly, simply, and intuitively.
1. Introduction
Healthcare technology in Spain is the oldest it has been for decades [1]. A number of societies and associations (The Spanish Society of Electromedicine and Clinical Engineering (SEEIC), the Spanish Society of Radiotherapeutic Oncology (SEOR), the Technology and Health Foundation, the Spanish Association against Cancer (AECC), the Official Medical Organization (OMC), and the Spanish Federation of Healthcare Technology Companies (FENIN)) and the scientific community have warned about the serious consequences of this problem. Three out of every ten patients do not receive radiotherapy treatment because of a lack of equipment, drastically reducing their life chances [2]. The efficient renewal of equipment would serve to improve early diagnosis and avoid or minimize risks to healthcare staff and patients (a modern computed tomography (CT) scanner produces 75–80% less radiation than an old machine, and it includes dose modulation, reiterative reconstruction, and artificial intelligence algorithm technologies, which considerably reduce the required X-ray dose [3]); it also allows healthcare staff to continuously monitor the safety and comfort of patients, reduce the number of diagnostic tests, increase the reliability of results [4], reduce the time needed for the post-processing of data and images used by healthcare staff who can give greater attention to patients, and it favors the traceability and exploitation of data and access to the most up-to-date treatments and monitoring [1]. In addition to the previous advantages, the renewal of equipment can reduce hazardous waste, which seriously affects the environment, and it provides significant energy savings, which can be up to 40% in some models of CT scanners, which would decrease costs and improve environmental management [5]. It should also not be forgotten that reducing investment in the maintenance of healthcare technology, which has also been seen to exist in recent years, increases the risks of use and speeds up the decline of the available technology [6].
Though the problem is most obvious in the electromedical sector, which includes devices such as echograph respirators, magnetic resonance imaging (MRI), CT, and defibrillators, it is present in all medical equipment. The situation is especially concerning in equipment that is used for heat therapy, life support, X-rays, and monitoring equipment, 72.73–55.00% of which, at the end of 2018, were found to be installed at least ten years ago [1], putting Spain in second-last place within the European Union in terms of the obsolescence of CT and MRI [7].
This problem is, however, not limited to Spain. The European Coordination Committee of the Radiological, Electromedical, and Healthcare IT Industry (COCIR) has indicated that extant European healthcare technologies would be unable to handle the aging of the population, the increase in chronic illnesses, and expectations of patient safety and comfort [8]. Using statistical data from different European countries in 2003, 2009, and 2013, COCIR set out golden rules to support decision making in technology renewal that consider a balance between technological innovation and obtaining the greatest benefit from investment. The golden rules are as follows:
- At least 60% of the installed medical devices should be no older than five years.
- No more than 30% of devices should be from 6 to 10 years old.
- No more than 10% of devices should be older than 10 years.
The analysis by COCIR of European countries showed that the fulfilment of these golden rules in the last ten years has not significantly improved these issues; rather, in CT and MRI, it has worsened them even more. The number of countries that do not satisfy the golden rules for CT has increased threefold, and it has doubled for MRI. However, although small improvements have been seen in equipment density in Eastern and Western Europe, the situation in Eastern Europe is still much worse than in Western Europe [3].
Due to the exponential introduction of novel technology and the increasingly early obsolescence of hardware and software, medical equipment replacement cycles are becoming shorter, going from 10 years or more about 20 years ago to three years currently [9]. The criterion of obsolescence in time has been joined by instrumental obsolescence [10]. The healthcare industry provides updates to installed equipment that allows its useful life to be extended; however, as technology ages, incompatibilities may appear (a lack of interconnectivity or an inability to adapt to new standards, the redesign of components to adapt to changes in software and hardware, etc.) that make the continuous updating of equipment difficult.
The oldest equipment has a higher risk of failure or breakdown due to wear. This may endanger the health and safety of patients and healthcare workers, as well as causing delays to care services because of the unavailability of the device.
Hospital technical services (maintenance services) therefore have a crucial role in reaching and extending the working life of medical devices and carrying out necessary upgrading to add new functions. However, despite their important role in healthcare organizations, these services are not usually consulted about decisions on renewing technology.
The maintenance service is also responsible for managing spares (which have a peripheral obsolescence since they may stop being produced or supplied by the supplier) and internal obsolescence (which is linked to the replacement by the manufacturer of first generation devices with others of the second or third generation, thus leading to spares not being available for devices over ten years old [11]).
There has also been failure to comply with the recommendations of the Spanish Medicines and Health Products Agency (AEMPS) on device maintenance, as set out in Circular 3/2012 [12]. Thus, the specifications for preventive maintenance are not met for 20–60% of devices [1], and with corrective maintenance, manufacturer recommendations are not followed, there are deficiencies in calibration, and there is not systematic compliance with safety criteria for patients and users according to the specifications set by the AEMPS.
On the other hand, healthcare technologies are one of the most important items in health system expenditure [13,14], and so at times of limited economic resources, decisions on renewing technology becomes more complex. This requires the development of more rational models and practices of technological renewal in hospitals [15]. FENIN [11] has mentioned the need for a management model that guarantees an investment plan in healthcare technologies that is in accordance with the criteria of repayment and cost–benefit analysis. Cost–benefit analysis is a tool traditionally used for the economic assessment of healthcare technology decisions [16]. However, this method tends to emphasize the quantifiable effects, even when intangible or qualitative effects can be equally or more important, as can happen in the healthcare environment.
The results of cost–benefit, cost–efficiency, and cost–utility analyses do not allow for direct decisions about whether or not to introduce technologies in a given environment [17]. The results are also not habitually included in the process of decision making in a clinical setting, nor in health policies. In order for this process of putting results of economic assessments of healthcare alternatives into practice to be possible, all the actors involved should be assigned responsibilities. The authors of [18,19] stated that the research community should provide managers and users with a better understanding of the circumstances in which technology adds value, the planner should establish incentives for the better use of the technology, and all parts should contribute to maintaining transparency in the production and translation of knowledge. Therefore, the optimum strategy for decision making in technological renewal in healthcare centers should consider the opinions of different stakeholders.
Decisions regarding healthcare technologies are complex, since they include a lot of risk and uncertainty, changing technology, obsolescence of products, clinical efficiency, inertia to change in organizations, operating costs, refund policy, etc. [20]. Additionally, the distribution of public resources for health has ethical, moral, and political implications [21]. It thus requires explicit and efficient processes to ensure the transparency and consistency of results [22], which is more defensible than the current situation [23,24]. These processes should do the following:
- Include tools that allow for the simultaneous consideration of multiple factors such as clinical benefits, the level of technological innovation, the quality of clinical evidence, the quality and accuracy of information, cost–efficiency analysis [25], price and impact on budget, value judgements, and facts or evidence that give reasons to back up a judgement [26]. Without these explicit processes to structure complex decisions, the decision group will make intuitive judgements or use subjective methodologies, losing important information for the decision [27].
- Ensure that they can be reviewed by public opinion, making it easier for the decisions to be approved. Transparency in the renewal of medical equipment, including the availability of data, would increase societal confidence in the investment decisions taken [28].
Therefore, the technological renewal of medical devices is a strategic decision requiring many factors to be considered, e.g., care, social, economic, technical, environmental, and political factors; as well as cost, it is necessary to consider the safety of patients and staff, the impact on care activity and the environment, and the maintainability of the device, etc. Thus, for example, the World Health Organization, in its 2015 report [29] described aspects of the assessment of healthcare technology that should be taken into account, including safety, clinical effectiveness, economic considerations, viability, and acceptability to healthcare providers and patients. However, these factors do not all have the same impact on the quality of care. There may also be different stakeholders and scenarios involved [30].
These characteristics make it very appropriate to apply multicriteria decision techniques to these decisions, as it allows for acceptable compromise solutions for when the criteria conflict. They can also handle large amounts of data, relations, and goals, which are typical features of real-life problems [31]. These techniques lead to significant improvements in the decision process and can guarantee acceptance by public opinion, the stakeholders involved, or the managers of an organization of the proposed solution [32]. These techniques also provide the necessary flexibility and robustness to deal with decision problems when multiple variable or units of measure are used [33]. One or more decision centers or decision groups can be used to give judgements that allow for a valuation of the importance that each criterion involved in the renewal of healthcare technology has for the organization. They are also able to simultaneously analyze multiple quantitative and qualitative criteria and guarantee that there is no redundancy in the assessment of items. They include the possibility of including uncertainty, scenarios, and tools to evaluate inconsistencies in the judgements given by decision makers. They are susceptible to integration with other multicriteria techniques, as well as with linear programming, the Taguchi loss function, neural networks, genetic algorithms, principal component analysis, Monte Carlo simulation, etc., and they allow for multiple constraints, decision rules (characteristics of expert systems), etc. These techniques generally produce a complete classification of alternatives.
All these advantages have contributed to a considerable increase in the literature applying Multi-Criteria Decision Analysis (MCDA) techniques in the last two decades [34], and they are promising approaches for decision making in healthcare organizations [27]. There are, however, no precedents in the literature for applying fuzzy multicriteria techniques to the technological renewal of medical devices, and so the uncertainties, ambiguities, and inaccuracies inherent in the decision process have not so far been considered. These deficiencies in systems to help make decisions for technological renewal in healthcare equipment mean that the limited capacity to invest in new equipment is not, in general, applied properly or satisfactorily in accordance with the care requirements of healthcare organizations. This can lead to important repercussions for patients, care staff, and the environment. This study therefore describes a fuzzy multicriteria model to assist in decisions about the renewal of healthcare equipment.
The fuzzy analytic hierarchy process (FAHP) was used for this purpose. Given that there are few tools in the field of multicriteria decision making that work with fuzzy calculus, a new software was created in NI Labview that could process the methodology to be applied through a user interface that allows data to be gathered quickly, easily, and intuitively. It also offers an action plan with the measures to be taken depending on the obtained results. To this end, an innovative methodology was produced that consisted of a modification of the traditional top–down technique that allows for the boundaries between the levels of priority of healthcare device renewal to be identified. Once the data are obtained, there is a sensitivity analysis—also based on a program created in NI Labview—with the aim of proving the robustness of the model. The program also includes a model designed for this study using the AHP in order to contrast the solutions provided by both methodologies.
The main contributions of this research are:
- To develop a fuzzy multicriteria model using the FAHP to facilitate decision making in the renewal of healthcare equipment to give objective, transparent, consistent, and checkable results.
- To incorporate into the model the preferences, judgements, and knowledge of the three decision centers with knowledge and experience in the renewal of healthcare technologies.
- To provide actions to be taken by healthcare organizations based on the establishment of boundaries between levels that depend on the judgements given by the decision centers.
- To provide software that allows the model to be applied to all healthcare equipment easily, quickly, and intuitively.
This paper is structured as follows. Section 2 contains a review of the literature on the technological renewal of healthcare equipment. Section 3 describes the fuzzy multicriteria model for decision making in the renewal of healthcare technology, first showing the criteria, descriptors, weightings of criteria, and calculation of the boundaries between levels of renewal. Next are the case studies the model is applied to, as well as the sensitivity analysis. Section 6 sets out the conclusions and the references. Finally, the supplementary data documents show the description and programming of the software program created with NI Labview.
2. Literature Review
The literature that has applied multicriteria techniques to the healthcare sector has focused on diagnosis and treatment [35], and the AHP is the most commonly used method [36,37,38], followed by the fuzzy AHP [39].
The literature review carried out by Liberatore and Nydick [37] analyzed 50 contributions with applications aimed at assessing healthcare and medical decision-making problems using the AHP; however, none included an application aimed at assessing medical equipment, although there have been some contributions that have looked at the choice between various technologies or models for one medical device, such as that by Hummel et al. [40], who evaluated a new pulsatile blood pump, together with two existing pump technologies. Sloane et al. [41] used 46 criteria to assess neonatal ventilators using the AHP. Cho and Kim [42] applied the AHP to the choice of medical devices in Korea, using marketability, applicability of the technology, and the public benefit as criteria. Tak [43] uses the AHP to evaluate the quality of X-ray images obtained by conventional and computerized devices in Hong Kong. Joshi et al. [44] used the AHP to choose the most suitable imaging and communication technology for radiology. Husereau et al. [45] described an application procedure for MCDA to the prioritizing of healthcare technologies where the most important criteria are: the seriousness of the illness, clinical impact, alternatives, budgetary impact, economic impact, and available evidence. Though used in 29 projects for choosing technologies, the consistency indices have been seen to be 0.2, which would mean including a degree of randomness higher than that traditionally permitted in decision making. This is a serious problem which has been recognized in the literature through MCDA applied to the healthcare environment; for example, 22 of the 69 studies analyzed by Schmidt et al. [46] did not calculate the consistency of the judgements given, and in five of them, a consistency ratio greater than 0.1 was allowed; many of the other analyzed articles did not include a threshold for the consistency ratio, and only a very small proportion of studies had a procedure to resolve the excessive inconsistency of the judgements. There were also no sensitivity analyses [47] or robustness studies.
Diaby et al. [48] reviewed 521 papers, of which 27% analyzed clinical applications, 27% reported on methods, and 46% studied healthcare resource allocation. In a more recent literature review, which included all multicriteria techniques, Mardani et al. [39] analyzed 130 research studies related to decision-making processes in healthcare and medical issues, but again, no contribution was aimed at analyzing medical technology, although there were assessments of new medical technologies [14,49,50,51,52,53].
Furthermore, in the literature review on MCDA in the healthcare environment, no validations of the models developed with other multicriteria techniques were found, which is now a trend in the literature on MCDA, which gives an additional trustworthiness to sensitivity and robustness analyses.
Among the few contributions that have used MCDA techniques in the renewal of medical equipment were those of Faisal and Sharawi [54], who used the criteria support availability, performance, maintenance cost, age, equipment function, operation impact, and clinical acceptability in a model built with the AHP to obtain as a result a replacement priority index of devices. Sherif [55] used a multi-attribute value analysis to build a model that automatically provided a budget planning tool for medical equipment replacement. Stolze [9] defined a series of issues that should be borne in mind in medical equipment replacement such as the compatibility of previous hardware and software, equipment supplies, equipment connectivity, equipment and user training, equipment service, and life cycle cost of ownership, while Jasuta and Parrott [56] suggested that as well as the age of the equipment, aspects such as the frequency of work orders and the availability and supportability of parts, utilization, operational, and maintenance cost should be considered. From the environmental perspective not focused on healthcare equipment, Sloan [57] considered the following aspects to be relevant: environmental costs and compliance mechanisms (which provide incentives or penalties according to whether or not given levels of environmental performance are achieved); additionally, they though that the scope of the decision should also be considered beyond the initial period. Other contributions to the choice of maintenance policies for medical equipment can also be used to choose the criteria relevant to renewal of medical equipment; in this case, the intention was generally to associate a criticality index to each device: for example, Fennigkoh and Smith [58] considered the task performed by the equipment, the physical risks associated with the clinical application, and the need for maintenance, while Masmoudi et al. [59] included the criteria degree of complexity of the maintenance, function, risk, degree of the mission importance, and age. Taghipour et al. [60] considered that function, mission criticality, age, risk, recalls, hazard alerts, and maintenance requirements are the appropriate criteria to be included in a model built with the AHP for the prioritization of criticality of medical devices; the obtained normalized scores can be used together with other pre-set thresholds to establish the most suitable maintenance policy, e.g., for devices in the high criticality class (and therefore with scores between 40% and 100% of the total score), proactive, predictive, or time-based maintenance is recommended. The research of Houria et al. [61] followed a similar line, using the fuzzy AHP together with the fuzzy Technique for Order Preference by Similarity to Ideal Situation (TOPSIS) in a model built with the criteria of the degree of complexity of the maintenance, function, risk, the degree of importance of the mission, age, recalls, user errors, and the class of equipment, so time-based maintenance was the strategy assigned to high critical medical devices, followed by condition-based maintenance and corrective maintenance strategies for devices in descending order of criticality. A similar study was described by Houria et al. [62], who used the AHP, the TOPSIS, and mixed integer problems but tried to limit the total maintenance costs within a budget. Jamshidi et al. [63] first developed a fuzzy failure modes and effects analysis (FFMEA) methodology in which they established a risk priority number from the product of the criteria detectability, occurrence, and failure consequences, which, in turn, included the subcriteria of the probability of non-detection, the method of failure detection, the mean time between failures, repeatability, visibility, patient safety, the potential risk for the device operator and maintenance personnel, the mean time to repair, and economic loss. At a second stage, they included additional criteria in the analysis that contributed to risk in the prioritization of medical equipment for maintenance such as age, usage-related hazards, utilization, the number of available identical devices, recalls, hazard alerts, function, and maintenance requirements; the AHP was used to calculate the weightings of these additional criteria. Finally, a maintenance planning diagram was used to assign priority levels to each device and thereby maintenance strategies according to these priorities. Tawfik et al. [64] assessed risk in medical devices by also considering the operational conditions of equipment via a fuzzy model to assign appropriate maintenance strategies with limited resources. Mahfoud et al. [65] developed a method that combined the AHP and Preference Ranking Organization METHod for Enrichment of Evaluations (PROMETHE) and that used the criteria of function, recalls, hazard alerts, use, redundancy, age, technological obsolescence, maintenance requirements, and risk; then, they assigned a maintenance strategy according to the position a medical device occupied in a diagram.
In the United States, the valuation criteria used in the renewal of technology come, for example, from the American Hospital Association, which has published a guide, updated periodically, to the good use of hospital stock resources. In 2012, the Veterans Association published an exhaustive guide to the average lifetime of electromedical devices. This guide says that the life cycle should not be a criterion used to replace a device, as it instead should be used with other factors, such as a failure index, maintenance problems, and safety deficits. In Canada, there is a guide that analyzes the criteria of radiology equipment renewal [66], among which the level of use over the life cycle, for three levels of use should be noted as high (24 h), medium (16 h), and low (8 h). Additionally, the need to separate the hardware and the software in the analysis is clear, and it gives recommendations for equipment planning. In 2015, the United Kingdom published a guide to the management of medical technology. It analyzes the concept of global life cycle from planning to installation to deinstallation. It underlines the need to have a single documented record with all the information about the device, whether it be technical, safety, or economic.
Therefore, the concept of life cycle should be taken into account in these decisions, but it should be considered that its definition is modified in public safety systems because benefits are defined a priori, and, therefore, there are no economic incentives that justify the application of the return on investment (ROI) parameter.
The Mini-Health Technology Assessment (Mini-HTA) is a checklist-based decision support tool that includes a number of issues related to the prerequisites and consequences of using a new healthcare technology, where the issues are grouped into four large areas: technology, patient, organization, and economy [67]. The success of the Mini-HTA is its ability to more effectively integrate end-user evaluations within hospital action policies [68]. Furthermore, being a tool developed at a local or regional level, it is better adapted to the established objectives.
In Spain, the checklists have been gathered into different guides for the acquisition of medical technologies, such as the Guide for Acquisition of New Technologies (GANT) in Andalusia [69], or the guide for the preparation of health technology assessment reports from the Ministry of Health and Consumption, both which have been followed by guides in different autonomous communities. Among them, we can highlight the guide for technological renewal and updating in radiology published by the Spanish Society of Medical Radiology in 2017. It contains a series of suggestions and recommendations to apply in the process of technological acquisition and renewal based on the criteria and indicators of the most developed countries in this area. However, these guides lack the contribution of objective mathematical models.
Fuzzy logic is a multi-valued logic that allows one to mathematically represent uncertainty, inaccuracies, and vagueness, as well to provide formal tools for their treatment. Therefore, applying multicriteria methods, together with fuzzy logic, would take the uncertainty, inaccuracies, and ambiguity inherent in decision-making processes into account. Current trends in MCDA literature advocate the greater use of fuzzy multicriteria techniques due to the advantages they bring to the solution; however, in the field of new technologies, only in a study by Ivlev et al. [70] were the AHP and the Delphi method integrated in a fuzzy field to identify the preferences of experts in the selection of MRI equipment in a regional hospital in the Czech Republic, and Zhou et al. [52] used the FAHP and the fuzzy Multicriteria Optimization and Compromise Solution (VIKOR) to select a mobile robot in hospital pharmacy. The other fuzzy MCDA contributions have mainly been oriented to waste treatment [71,72,73,74] or to evaluate the service quality or performance of healthcare organizations [75,76,77,78,79,80,81,82,83], but in no case have they been oriented to analyzing the renewal of healthcare technologies.
3. Fuzzy Multi-Criteria Model for the Renewal of Health Technologies
The model for the renovation of healthcare equipment described in this article tries to objectively analyze the different factors that must be taken into account in decision-making to renew healthcare technologies; for this, a fuzzy multicriteria decision technique was used, since technological healthcare renewal is normally supported by unreliable information on costs, ambiguous analyses, inaccurate data on years of operation, inaccurate conditions of equipment, inaccurate levels of use, and incorrect forecasts of expected services or uncontrasted benefits to be obtained by new technologies [54].
The model analyzes families of products that are susceptible to obsolescence, for which the philosophy of the golden rules was incorporated and adapted to the Spanish legislative framework.
For the construction of the model, a literature review on previous studies was carried out, including research on technological renewal, maintenance, management, and risks of healthcare equipment [54,60,61,62,63,64]. Therefore, the proposed model includes economic, technical, and healthcare criteria, just as some authors have advised [84].
In the real word, decision makers prefer to use expressions rather than deterministic values because it is difficult to provide exact data when evaluating alternatives with respect to a criterion or comparing criteria [85]. According to Zadeh, “Almost all the logic of human reasoning is not the classic logic of two values, or even of several values, but a logic of fuzzy truths, of fuzzy conjunctions, of fuzzy deduction rules” [86].
A triangular fuzzy number (TFN) is made up of a triplet with , where l and u are the lower and upper value, respectively, and m is the modal value. A TFN is characterized by a continuous membership function ], as noted by [87].
Some algebraic calculations of two TFNs and are [88]:
- Addition
- Multiplication
- Division
- Reciprocal
- Scalar multiplication ; .
The FAHP is a widely applied method in the literature on complex real-world problems (see, for example, [88,89,90,91,92,93]). However, it should be remembered that, as described by Saaty and Tran [94], fuzzification does not necessarily improve the numerical value of a result in those cases where the true value is known, represents the judgements of the decision makers involved, and shows whether they are well or badly informed. The crisp numbers used in pairwise comparison judgements are already fuzzy, since the values used after fuzzification are already uncertain. To do this, this study applied both the AHP and the FAHP in the software developed with NI Labview, which can be seen in some of the software panels shown in the supplementary data. Though this paper only describes the model using the FAHP, where convenient, the results obtained with the AHP can be contrasted with those of the FAHP in the search for the greater validity of the outcome.
Some FAHP methodologies have been proposed in the literature to calculate the relative weights of the criteria, the Chang extent analysis methodology being the most applied; however, this methodology is the one that provides least accurate results [95]. In this research, the geometric mean method suggested by Buckley [96] was used because it was easier to apply and understand than other methodologies [97], it guaranteed the existence of a single solution, and it has not received much criticism [93] compared other methodologies.
The steps to follow to apply Buckley’s geometric mean methodology are:
- Step 1. Define the problem: The problem, conditions, and boundary situation must be clearly defined, and all possible solutions or alternatives to be evaluated must be identified; different scenarios or stakeholders should also be identified.
- Step 2. Select the decision maker: A decision maker or a group of experts in the analyzed problem must provide the judgements that complete the pairwise matrices, and they should also validate the results obtained by the model.
- Step 3. Hierarchy architecture construction: The problem is divided into different levels that constitute a hierarchy tree. The objective is located at the top level of the hierarchy, and the criteria and subcriteria are located at the following levels to place the alternatives at the bottom level of the hierarchy.
- Step 4. Select the fuzzy scale: The scale proposed by Saaty [98] is composed of integers between 1 and 9 or their inverses, and it allows a judgement to be associated with one of the previous numbers; however, this scale does not take the doubt, vagueness, hesitancy, or ambiguous situations [99] that characterize decisional problems in real world into account. Furthermore, decision makers sometimes feel more confident when providing interval judgements rather than crisp judgements [100]. Though different fuzzy scales from the literature can be used, in this research, the scale proposed by Kabir [101] was used; it is very similar to that proposed by Saaty, but it is in the fuzzy environment (see Table 1).
- Step 5. Establish the fuzzy pairwise matrices among the hierarchy: The experts must provide fuzzy judgements when comparing criteria, subcriteria, or alternatives—as well as between the levels of scale of each criteria and subcriteria, for which they can use the fuzzy scale defined previously in Table 1 or another fuzzy scale. The verbal scale can be translated into fuzzy numbers according to the equivalences in Table 1 to construct the fuzzy pairwise comparison matrix , at the same level of hierarchy.where and .Given a fuzzy number from the previous fuzzy pairwise comparison matrix obtained by comparing criterion i (i = 1, 2, …, n) to alternatives j (j = 1, 2, …, m) in order to aggregate the judgements given by a group of decision makers, each denoted by k (k = 1, 2, …, K), the geometric mean of is used, given the aggregated judgements of Equation (3):
- Step 6. Compute fuzzy weights: The geometric mean method developed by Buckley [96] is applied to obtain the fuzzy weights of criteria and subcriteria through the following equations:where is the fuzzy comparison value of criterion i to criterion j, is the geometric mean of fuzzy comparison value of criterion i with respect to each criterion, and is the fuzzy weight of the criterion i.
- Step 7. Defuzzification process: needs to be defuzzified, for which there are different methods available. In this research, the center of area (COA) or centroid method was applied. The selection of this method was due to the fact that it is simple and practical, and there is no need to bring in the preferences of any evaluators [102]. For this, it must be applied to the fuzzy weight of the criterion and Equation (6) [103]:
- Step 8. Normalize the weights: The crisp weight must be normalized, for which Equation (7) is applied:
- Step 9. Quantify the consistency of the judgements: If is a fuzzy judgement matrix composed of the triangular fuzzy numbers , a crisp matrix can be constituted. According to Csutora and Buckley [104], if is consistent, then is consistent. To quantify the inconsistency of the judgements made in each pairwise matrix, Saaty [98] proposed computing the consistency ratio (CR) according to Equation (8):where is a consistency index computed from Equation (9), is the largest eigenvalue, and is the dimension of the matrix. The random consistency index (RCI) is generated by simulation, and its value is independent of the size of the matrix, as can be seen in Table 2 [90].
The judgements are considered if the CR is less than 0.05 for a 3 × 3 matrix, 0.08 for a 4 × 4 matrix, or 0.1 for matrices with dimension superior to 4 [105]. If the CR exceeds the previous values, the judgements of the pairwise comparison matrix are not valid and the process must be repeated [106]. However, it should also be remembered that improving the consistency of the judgement matrix does not necessarily improve the validity of the outcome, as manipulating the judgements to improve consistency can move the correct solution away from that given by the method [94].
Figure 1 shows the flowchart with the steps followed in the study.
3.1. Structuring
The first level of the hierarchy structure is made up of four scenarios, each associated with the defined categories of medical devices [107] that encompass different medical equipment. This approach allows each type of medical equipment to be treated separately in order to later form part of a joint solution. In addition to favoring the simplicity of the model, the distinction between equipment based on different technologies is considered necessary for the correct subjective evaluation by a decision maker. Therefore, the hierarchical model applied to four different product categories, whose objective is to obtain the renewal priorities of the equipment in each category, is presented. The four equipment categories are as follows:
- Category 2: Products for anesthesia and respiration, e.g., respirators, resuscitators, medicinal gas administration systems, and monitors for respiratory physiological parameters.
- Category 4: Electromedical/mechanical products, e.g., ultrasound physiotherapy equipment, infusion pumps, defibrillators, and incubators for newborns.
- Category 12: Products that use radiation for diagnosis and therapy, e.g., gamma cameras, positron emission tomography (PET), equipment that uses radiation for diagnostic purposes (CAT and MRI), and equipment that uses radiation for therapeutic purposes.
- Category 8: Ophthalmic and optical products, e.g., refractometers, keratometers, and lasers for ophthalmology.
Below are the criteria and subcriteria considered in the replacement model that are common to all categories. Though the criteria and subcriteria are the same, there are nuances in certain descriptors depending on the category. The criteria and subcriteria were chosen by taking the following characteristics into account:
- They must be independent and have a sufficiently representative relationship with the model’s goal.
- They must be well defined and precise enough not to create ambiguities.
- They must be located at different levels in a coherent and consistent way regarding the repercussion and importance that they represent to the objective.
- The subcriteria must be grouped in a coherent way regarding the impact and importance they represent with respect to the criterion.
For each criterion, a descriptor is defined. A descriptor is an ordered set of impact levels that allows each alternative to be objectively evaluated.
The criteria used in this investigation were the following:
- Age of the device (AGE): This is one of the most important factors to consider when renovating healthcare equipment. Furthermore, it is a dynamic criterion that extols the need for periodic reviews of the model. Regarding the literature, there is a broad consensus when it comes to including this criterion [54,60,108]. It should be noted that, depending on the equipment to be dealt with, its useful life may be more or less short, although it is generally ten years. This criterion is made up of the following subcriteria:
- Years since start-up (AGE1): This refers to the years the device has been active. The start date of use (start-up) should not be confused with the date of installation, because a device may be installed without use made of it. The descriptors of this subcriterion are adapted to the years set by the golden rules and are as follows:
- -
- Very old equipment: The age of the equipment is over 10 years.
- -
- Old equipment: The age of the equipment is between 7 and 10 years.
- -
- Average age equipment: The age of the device is between five and seven years.
- -
- New equipment: The age of the equipment is between two and five years.
- -
- Very new equipment: The age of the equipment is less than two years.
- Age of technology (AGE2): This refers to the current age of the technology used in the equipment. It should be understood as new advances and improvements within the technology of the device and not as a change in its purpose. The time interval that defines this age starts from the moment the equipment was released. The descriptors of this subcriterion are as follows:
- -
- Old technology: The technology has been on the market for more than 10 years.
- -
- Quite old technology: The age of the technology is between 5 and 10 years.
- -
- Quite new technology: The age of the technology is between three and five years.
- -
- New technology: The age of the technology is less than three years.
- Frequency of changes in technology, standards and regulations (AGE3): This allows for knowledge of how dynamic the market is for a given device, given that, as previously mentioned, changes in standards and regulations can also make a device obsolete. The descriptors of this subcriterion are as follows:
- -
- Very high: High inclusion of new equipment in the market. Very frequent changes in regulations and/or standards.
- -
- High: High inclusion of new equipment in the market. Frequent changes in regulations and/or standards.
- -
- Medium: Moderate inclusion of new equipment in the market. Frequent changes in regulations and/or standards.
- -
- Low: Moderate inclusion of new equipment in the market. Infrequent changes in regulations and/or standards.
- -
- Very low: Little inclusion of new equipment in the market. Very infrequent changes in regulations and/or standards.
- Function of the equipment (FUN): This criterion evaluates the service that the device provides, as well as the importance that the different types of equipment have for the decision center according to their risk. The following subcriteria are considered:
- Service (FUN1): The role played by each device within the hospital is evaluated, attending to the different possible healthcare purposes. The descriptors of this subcriterion are as follows:
- -
- Life support: Equipment whose operation (continuous or discontinuous) is necessary to maintain the life of the patient.
- -
- Therapeutic: Equipment that allows for the treatment of ailments and rehabilitation.
- -
- Diagnosis: The diagnostic equipment that allows for the identification a disease or pathology in order to know the patient’s condition.
- -
- Analysis or assessment: Equipment intended for the analysis of patient parameters.
- Risk category (FUN2): As described in Royal Decree 1951/2002, products can be classified at different levels depending on the risk they represent for the patient. The decision maker must express the importance for him/her of the different risk classes. The descriptors of this subcriterion are as follows:
- -
- Class III: High risk.
- -
- Class IIb: Moderate–high risk.
- -
- Class IIa: Low–moderate risk.
- -
- Class I: Low risk.
The risk class is described based on the risk to which the patient is exposed and, a priori, can be interpreted as a subcriterion more related to safety than to function; however, as described in Annex IX of Royal Decree 1951/2009, the four classes of risk are justified depending on how the device interacts with the patient. In this way, this subcriterion answers the question of in what way? Therefore, the decision maker assesses what the service is and how it is performed, thus defining the role of the device in the hospital and adapting this criterion to Spanish regulations. Since the service of the device and its place in a certain risk class are already given in advance, the decision maker makes comparisons between the different services and classes in order to locate and assign a score to the alternative.
- Availability of support (SUP): An important characteristic to take into account in renovation is the support that the equipment has, such as guarantees, maintenance contracts, documentation, and training of staff [54], since all contributions to increase in useful life equipment must be valued. The subcriteria are as follows:
- Supplier support (SUP1). The time remaining for the device to receive support from its supplier or manufacturer is considered, based on guarantees, maintenance contracts, and employee training. The descriptors of this subcriterion are as follows:
- -
- Very low: The remaining supplier or manufacturer support time is less than one year.
- -
- Low: The remaining support time of the supplier or manufacturer is between one and three years.
- -
- Medium: The remaining support time of the supplier or manufacturer is between three and five years.
- -
- High: The remaining support time of the supplier or manufacturer is more than five years.
- Alternative support service (SUP2). Once the manufacturer’s support has ended, the life of the equipment can be extended by the services of the health center itself or by the person in charge. Therefore, this subcriterion refers to the ease with which said services can find spare parts for this purpose. The descriptors for this subcriterion are as follows:
- -
- Null: None of the parts are available.
- -
- Low: Some of the parts are available but are difficult to find.
- -
- High: Some of the parts are available and easy to find.
- -
- Full: All spare parts are available.
- Impact of operation (IMP): This criterion includes in the model the repercussion that a device has on the activity of the health center. It is considered that the most used equipment will have a greater operational impact, that is, problems in it would negatively influence the normal development of healthcare activity [60]. This is a criterion highly dependent on the health context in which it is found and assessed, since the same devices located in unequal health centers can have very different operational impacts. The following subcriteria are considered:
- Use of device (IMP1): It is difficult to obtain precise information on this subcriterion, since within the fluctuations in the use of equipment, its aim is to estimate an average of its daily use. To facilitate its assessment, the working day of a worker at the center (eight hours) is considered as a reference. The descriptors for this subcriterion are as follows:
- -
- Very high: The equipment is used more than eight hours a day.
- -
- High: The equipment is used between six and eight hours a day.
- -
- Medium: The equipment is used between four and six hours a day.
- -
- Low: The equipment is used between two and four hours a day.
- -
- Very low: The equipment is used less than two hours a day.
The decision maker, in case of precisely knowing the use of equipment during his day, must extrapolate said data to the rest of the days or shifts existing in his/her center if he/she has knowledge of its use in them. This descriptor can also be expressed in terms of the number of patients seen per unit of time, but given the complexity of this assessment, it was decided to measure in units of time. - Backup devices (IMP2): It should be considered that the equipment under study may have failures or problems that prevent its use for a period of time; the severity of the resulting impact is given by the number of patients who do not receive the care intended by said device. Therefore, having equipment with similar characteristics that can provide support to patients during the device’s withdrawal times helps to reduce the impact [54,60]. The descriptors for this subcriterion are as follows:
- -
- Non-existence: There is no backup device that can provide support to patients during periods of device downtime.
- -
- Low stocks: There are one or two backup devices that can provide support to patients during periods of device downtime.
- -
- High stocks: There are three or four backup devices that can provide support to patients during periods of device downtime.
- -
- Full support: There are more than four backup devices that can provide support to patients during periods of device downtime.
- -
- It is necessary to include this subcriterion because, although there are devices with similar characteristics to the non-working device, if these devices have a high level of use, they may not be able to cope with the original patient demand and, therefore, not serve as backup devices.
The first subcriterion evaluates how important the device under study is in the day-to-day running of the hospital (depending on the hours it is used), based on the philosophy that it is necessary to prioritize the renewal of the most used device. Therefore, this subcriterion answers the question: what workload does the device support? The second subcriterion refers to the hospital’s ability to cope with the load of the device in the event that it is not operational, having equipment of similar characteristics that can cope with the workload that the first cannot handle. It is a difficult criterion to assess because it is highly dependent on the context in which it is studied. It is not a matter of listing the devices that are similar; rather, it is a matter of how many devices can take on the additional burden. In this way, this subcriterion answers the question: how many devices can carry their load? With both subcriteria, the decision maker first establishes how many hours the device is used (its workload) and then studies whether there are other devices that can cope with that load in the event that the first one is not available, in this way defining the impact of operation that the device has in the hospital. Though it is true that both subcriteria can be expressed as one (expanding the descriptors), this would cause two problems. The first would be the need for many levels of the descriptor to be able to cover all the scenarios that can occur considering them separately (20 levels in total). This would create too much complexity for the model and would pose a major difficulty in applying the FAHP. The second problem is related to the first problem, since in order to solve the problem of the number of scale levels, much flexibility must be sacrificed for the subcriterion. The importance of indicating the number of backup devices (not only indicating that backup equipment is available) should also be highlighted, since such equipment may also fail and be unavailable.
- Staff preferences (PRE): This criterion represents the degree of the satisfaction of healthcare personnel with respect to the device used. This is the most subjective criterion of all those included in the model, but it was be considered that the decisions of the users of the technology at the time of renovation within health centers cannot be excluded. In this way, the needs of healthcare personnel are incorporated into the model, assessing the effectiveness and efficiency with which they rate the device and its need for change. It is the only criterion that does not have subcriteria, and its descriptors are as follows:
- -
- Very low level of satisfaction: The device does not respond to the needs of the staff. It has a very high difficulty in the use and maintenance of the device by healthcare personnel, as well as much higher training requirements compared to current technologies.
- -
- Low level of satisfaction: The device does not respond to the needs of the staff. It has a high difficulty in the use and maintenance of the equipment by healthcare personnel, as well as higher training requirements compared to current technologies.
- -
- Average level of satisfaction: The device partially responds to the needs of the staff. It has a medium difficulty in the use and maintenance of the equipment by healthcare personnel, as well as higher training requirements compared to current technologies.
- -
- High level of satisfaction: The device fully responds to the needs of the staff. It has a low difficulty in the use as well as maintenance of the equipment by the healthcare personnel, as well as similar training requirements compared to current technologies.
- -
- Very high level of satisfaction: The device fully responds to the needs of the staff. It has a very low difficulty in the use and maintenance of the equipment by healthcare personnel, as well as similar training requirements compared to current technologies.
- Equipment failures or breakdowns (FAI): A very important aspect is the failures that occur in the device during its period of use, since they represent a clear indication of its current state and its need for change. The number of failures should not be the only aspects taken into account; the danger they entail, the periods that the device is not available, and the ease with which users can detect them should also be considered. For all this, equipment failures can be interpreted according to the following subcriteria:
- Frequency of failures (FAI1): The number of failures occurred in a time interval compared to today. Faults can be mechanical, electrical, and other types of failures. It is also important to observe failure trends, since in a short period of time, a large proportion of failures can occur with respect to the total of the history. The descriptors for this subcriterion are as follows:
- -
- Very high frequency: The device registers several failures in its last year of use.
- -
- High frequency: The device registers several failures in the interval of one-to-two years.
- -
- Medium frequency: The device registers several failures in the interval of two-to-five years.
- -
- Low frequency: The device registers a failure in the interval of two-to-five years.
- -
- Very low frequency: The device registers a failure or none in more than five years.
However, due to the limitations in the information available to assess the device, it was decided to calculate the annual average of failures for each of the product families analyzed in this investigation, and later, within each family, to compare the individual average of the alternative with that of the device family. This was the reason that each of the product categories has different descriptors. Finally, the descriptors for this subcriterion are the following:- -
- Very high frequency: The device annual failure rate is greater than or equal to twice the annual failure rate for its category.
- -
- High frequency: The device annual average of failures is between twice the annual average of failures in its category and the annual average.
- -
- Medium frequency: The annual failure rate of the devices corresponds to the annual failure rate of its category.
- -
- Low frequency: The annual average of device failures is between the annual average of failures of its category and an annual average of one failure.
- -
- Very low frequency: The annual average of device failures is less than one.
The precision of the annual average of failures by category improves depending on the number of devices used for its calculation. - Detectability of failures (FAI2): This is related to the degree of difficulty associated with having knowledge of a failure at the time it occurs. This subcriterion must not only be reflected in equipment maintenance decisions, it must also be incorporated into renovation decisions, as poor detectability has been interpreted as a factor that enhances the impact of equipment failure. It can be affected by the history of failures and by the age of the device, and it can be compared in relation to new devices available on the market. The descriptors for this subcriterion are as follows:
- -
- Very low: Faults are not detectable with regular inspection of the device or with the naked eye.
- -
- Low: Faults are detectable with regular inspection but not with the naked eye.
- -
- High: Faults are detectable with the naked eye.
- -
- Very high: The fault is announced by the device itself.
- Post-failure dead time (FAI3): This is defined as the dead time that an average device is out of service once a failure has occurred. It is important to consider this subcriterion based on the time that patients have to wait until the device is available and they can be treated, as well as the number of patients who do not receive service due to device failure [60]. The descriptors of this subcriterion are as follows:
- -
- Extremely high: High waiting time and a high number of neglected patients.
- -
- Very high: Average waiting time and a high number of neglected patients.
- -
- High: Low waiting time and high number of neglected patients.
- -
- Medium high: High waiting time and an average number of neglected patients.
- -
- Medium: Average waiting time and an average number of neglected patients.
- -
- Medium low: Low waiting time and average number of neglected patients.
- -
- Low: High waiting time and a low number of neglected patients.
- -
- Very low: Average waiting time and a low number of neglected patients.
- -
- Extremely low: Low waiting time and a low number of neglected patients.
It is necessary to define a very precise descriptor since the two factors to take into account (waiting time and neglected patients), although dependent, can be highly variable. Additionally, given that the primary objective is always the patient, these factors become more important than the actual device down time. - Impact of failure on patients (FAI4): This is focused on the consequences to the patient if the failure occurs during the use of the device. The descriptor scale levels are:
- -
- Very high: Equipment failure can lead to death of the patient.
- -
- High: Equipment failure can involve serious injury to the patient.
- -
- Medium: Equipment failure may involve improper therapy, a misdiagnosis, or minor injury to the patient.
- -
- Low: Equipment failure may lead to a delay in treatment.
- -
- Very low: Equipment failure has no consequence on the patient.
When assessing this subcriterion, it is important to think about the worst-case scenario, assuming that it may have different impacts on the patient. Most of the data collected for this subcriterion came from the bibliography [60].
- Costs associated with the device (COS): This criterion analyzes the costs associated with the current state of the device, so that in order not to blur the assessment of renewal priorities, the acquisition costs (purchase and installation) of the device are not taken into account. Acquisition costs are considered as a purchasing factor that does not influence the need for it. Therefore, the costs derived from equipment maintenance and repair are considered in this criterion, giving rise to the following subcriteria:
- Maintenance costs (COS1): These include the maintenance costs of the device, as well as its repairs (labor and spare parts). It is understood that when the sum of these costs is compared during the last three years with respect to the acquisition cost and it exceeds 25%, the device must be replaced. The descriptor scale levels for this subcriterion are as follows:
- -
- Unacceptable: Maintenance costs in the last three years exceed 25% of the acquisition cost.
- -
- High: Maintenance costs in the last three years are between 15% and 25% of the acquisition cost.
- -
- Acceptable: Maintenance costs in the last three years are between 10% and 15% of the acquisition cost.
- -
- Low: Maintenance costs in the last three years are less than 10% of the acquisition cost.
- Expected benefits (COS2): This refers to the impact that device replacement can have on operating costs of the activity carried out by the device. These costs are classified as direct costs, although indirect costs are also considered in this criterion. Below is a short description of each cost:
- -
- Direct costs: These refer to hospital costs related to patient care. These costs include the resources that are used and cannot be reused. It is worth distinguishing between direct healthcare costs—such as the costs of diagnosis, intervention, and tests—and direct non-healthcare costs—such as transporting the patient to the center and social services.
- -
- Indirect costs: These are associated with the loss of productivity suffered by the patient and others, such as a lack of attendance at work.The descriptor scale levels for this subcriterion are as follows:
- -
- High: Direct and indirect costs would greatly decrease with the use of new technology.
- -
- Medium: Direct and indirect costs would decrease little with the use of new technology.
- -
- Low: Direct and indirect costs would decrease very little with the use of new technology.
- -
- Non-existent: Direct and indirect costs would not decrease with the use of new technology.
Figure 2 shows the hierarchy of the model.
3.2. Weighting
In order to carry out the weighting process, the judgements provided by three expert decision makers in maintenance and healthcare technologies were used, and each had extensive knowledge and experience in the hospital environment. One of the experts has been in charge for the renewal of health technologies in the Castilla-La Mancha region (Spain).
To carry out pairwise comparisons, the fuzzy verbal scale shown in Table 1 was used. The results of the three decision makers were combined with geometric means. All the data were processed by the computer program created in NI Labview. As an example, the calculations carried out to obtain the criteria weights are shown, and Table 3 shows the pairwise matrix of judgements obtained using geometric means of the judgements provided by the three decision makers.
Using Equation (4), the geometric mean of fuzzy comparison value of criterion i with respect to each criterion, , was found:
The fuzzy weight of the criterion i , was calculated using Equation (5), giving:
The centroid method, set out in Equation (6), was used to apply defuzzification, giving a crisp weight for each criterion:
After normalization, the resulting crisp weights were found to be: , , , . .
To check the consistency of the judgements given by the decision makers when building the pairwise comparison matrix, the CR was calculated from the values of the judgement matrix in Table 3:
A similar procedure was applied in Table 4, Table 5, Table 6, Table 7, Table 8 and Table 9, in which the pairwise comparison matrices obtained by geometric means of the judgements issued by the three decision makers are shown to obtain the subcriteria weights. The weights obtained after applying the Bucley and CR methodology are shown in the righthand columns. It can be seen that all fuzzy pairwise comparison matrices had consistency ratios below 0.1. These consistency ratios were obtained with the first judgements given by the decision makers, and there was no need to reassess the judgements, thus avoiding the problem mentioned by Saaty and Tran [94] of the result diverging from reality when adjusting the judgements in search of consistency.
Next, it was necessary to reapply the fuzzy AHP using the geometric means method of Bucley between the scale levels of each descriptor. The decision makers also issued the judgements regarding the pairwise comparison between the scale levels using the same verbal scale shown in Table 1. As an example, the calculations for the subcriterion Years since start-up are shown. A similar procedure was applied for the rest of the subcriteria and for the Staff preferences criterion. Table 10 shows the matrix obtained by geometric means of the judgements provided by the decision makers for the subcriterion Years since start-up. The results obtained for the rest of the criteria/subcriteria are shown in Table 11, Table 12, Table 13, Table 14, Table 15 and Table 16.
Using Equation (4), the geometric mean of fuzzy comparison values of each scale level of the descriptor j with respect to the other levels, , was calculated:
The fuzzy weight of the scale level j, , was calculated using Equation (5), giving:
The centroid method was used to perform defuzzification, giving the crisp weight for the scale level:
After normalization, the resulting weights were: ; ; ; and .
These scale level weights were adjusted to utilities so that the least preferred scale level had a utility of 1.0 and the most preferred alternative had a utility of 0.0 (this allocation of utilities is generally made the opposite way, but in this model, the higher the final evaluation of a device, the more necessary the need for renewal).
3.3. Levels of Priority of Renewal
To establish the boundaries between the priority levels for renewal, the top–down technique was used for each criterion and global model. These boundaries were determined by the particular valuations of the three decision makers and are unique to this model, making another top–down study necessary if more decision makers were included.
Firstly, four levels of renovation priority were defined; an action is proposed to be taken depending on the priority assigned. The four renewal priority levels are as follows:
- Urgent: The equipment must be replaced in the current financial year.
- High: The equipment must be replaced in the following financial year.
- Medium: Equipment must be reviewed in the following financial year.
- Low: Equipment must be reviewed in the next two financial years.
These levels were defined based on the state of the Spanish technology stock, which is why they are levels that offer a very short-term solution. If the context is different, the different solutions could be more relaxed.
The top–down technique consists of making variations from the higher levels of each descriptor (which lead to the weight of the criterion being 1) to the lower levels by means of minimum jumps (lowering the level that subtracts least value from the previous value) until the minimum weight is reached. In this way, a list of minimum jumps is obtained, which shows which levels have the most influence on the weight and where the boundaries between levels can be found. Once the list of minimum jumps has been made, the three maximum differences between the weight of each level assignment with the previous level assignment can be found, since it is understood that when one of these maximum differences is found, it can be attributed to a change in the renewal priority level. Once a maximum difference is found, the lower value of the difference (the weight of the lower level assignment) is taken as the boundary. When the boundaries for all criteria are known, they are added, taking into account the weight assigned to each criterion. Below are the minimum jump lists for each criterion, from which the differences that define the level changes are made. The three maximum differences are shaded.
The renewal levels by criterion bearing in mind the boundaries identified (N1i, N2i, and N3i) are defined as follows:
- (1–N1i]: Urgent.
- (N1i–N2i]: High.
- (N2i–N3i]: Medium.
- (N3i–0]: Low.
The results obtained for the criterion Function are shown in Table 17.
The intervals of the four levels are defined as:
- (1–0.71]: Urgent.
- (0.71–0.30]: High.
- (0.30–0.15]: Medium.
- (0.15–0]: Low.
The results for the criterion Age of device are shown in Table 18.
The intervals for the four levels are defined as follows:
- (1–0.74]: Urgent.
- (0.74–0.38]: High.
- (0.38–0.22]: Medium.
- (0.22–0]: Low.
The results for the criterion Availability of support are shown in Table 19.
The intervals of the four levels are defined as follows:
- (1–0.90]: Urgent.
- (0.89–0.45]: High.
- (0.45–0.21]: Medium.
- (0.21–0]: Low.
The results for the criterion Impact of operations are shown in Table 20.
The intervals of the four levels are defined as follows:
- (1–0.81]: Urgent.
- (0.81–0.68]: High.
- (0.68–0.29]: Medium.
- (0.13–0]: Low.
The results for the criterion Staff preferences are shown in Table 21.
The intervals of the four levels are defined as follows:
- (1–0.62]: Urgent.
- (0.62–0.30]: High.
- (0.30–0.15]: Medium.
- (0.15–0]: Low.
The results for the criterion Failures of faults are shown in Table 22.
The intervals of the four levels are defined as follows:
- (1–0.38]: Urgent.
- (0.38–0.22]: High.
- (0.22–0.11]: Medium.
- (0.11–0]: Low.
The results for the criterion Associated costs are shown in Table 23.
The intervals of the four levels are defined as follows:
- (1–0.83]: Urgent.
- (0.83–0.40]: High.
- (0.40–0.20]: Medium.
- (0.20–0]: Low.
Once each criterion has been handled, it is necessary to achieve a joint solution for the model. Global boundaries that define the levels of renewal (LG1, LG2, and LG3) were calculated. For the calculation of these boundaries, the weights obtained for each criterion in Section 3.2 were taken into account. For this, a weighted aggregation of each of the boundaries of each criterion was performed, following Equation (10):
where k is the number of criteria, is the weight of each criterion, and represents the boundaries found for each criterion; their computation gives:
In this way, one can fully define the renewal intervals and know which solution should be adopted depending on the total weight of the alternative.
- (1–0.714]: Urgent: The device must be replaced in the current financial year.
- (0.714–0.419]: High. The device must be replaced in the following financial year.
- (0.419–0.208]: Medium. Review of the device in the following financial year.
- (0.208–0]: Low. Review of the device in the next two financial years.
4. Case Studies
A hospital, whose identity is not given due to confidentiality, provided the data on medical equipment that were assessed by the model.
In an initial review of the data, problems such as a lack of traceability of equipment maintenance or great age were detected. The data associated with the criterion staff preferences were not available, so we chose to assign a probability distribution of the most probable values. It should be noted that in the full study, more devices were analyzed than those shown in each category in this paper; this is especially relevant in the subcriterion Failure rate, in which the descriptor assesses the annual average of equipment failures with respect to the annual average of failures in its category.
The following briefly describes some of the medical equipment to which the model was applied to calculate its renewal priority using the program designed in NI Labview and the results obtained with the calculation engine.
4.1. Surgical C-arm X-ray Machine
The X-ray surgical C-arm device was found to be in Category 12 of healthcare equipment since it uses radiation during its operation and to fall under Class IIb in the risk category. The device allows for the monitoring of the patient during a surgical intervention, and, normally, it consists of two parts: a monitor or monitors where images of the patient’s body can be observed and the mobile arch-shaped pedestal that captures and intensifies these images. The specific model available is not disclosed for confidentiality, but an image can be seen in Figure 3.
The results obtained for the X-ray surgical C-arm device are shown in Table 24. It is the second newest device of those shown in this paper, but the score of this device placed it in the high renovation priority. The end of supplier guarantees placed it at an urgent level for the Availability of support criterion; however, for this type of device, spare parts are easier to find. The Impact of operation criterion scored high because there were no backup devices. In the seven years since its start-up, it has had three breakdowns that have accounted for 13.56% of maintenance costs compared to the acquisition cost in the last three years, placing it at an acceptable scale level. It should be noted that, although a failure of this device during use by a surgeon in an operation could, in the worst case, cause the death of a patient, a lower level of impact was given because there was no history of this event.
4.2. X-ray CT room
The X-ray CT room was found to belong to Category 12 of healthcare equipment since it uses radiation during its operation and to fall under Class IIb of the risk category. Computed axial tomography is a non-invasive technique used to obtain images of a patient’s body (such as images of different tissues) from different angles. An image can be seen of this type of equipment in Figure 4.
The results obtained for the equipment analyzed at the hospital are shown in Table 25. In this case, the least repercussion for the patient derived from equipment failure placed the level for this criterion in the lowest position of those calculated for this category; however, the 52 breakdowns it has suffered in its 11 years of operation have led to maintenance costs rising to 24.61% of acquisition costs in the last three years, which was the highest of all the equipment analyzed in this category, thus placing it at a high level. The unavailability of backup equipment, as well as the age of the equipment, placed it at the high renovation priority level.
4.3. Defibrillator
Defibrillators were found to belong to Category 4 of electromedical/mechanical healthcare equipment and to fall under Class IIb of the risk category. This device applies an abrupt and brief current to the patient suffering cardiac arrest and, in addition, allows for the monitoring of cardiac constants. Data were available for a model similar to that shown in Figure 5.
The results for the defibrillator are shown in Table 26. This device had an urgent renovation priority given that, in addition to being 13 years old, there are no backup devices that can replace it in the event of a failure, and said failure, in the worst case, could cost a patient’s life. Despite the 14 breakdowns it has experienced, maintenance costs in the last three years represented only 3.02% of the acquisition cost, placing it at a low level in said subcriterion.
4.4. Neonatal Ventilator
A neonatal ventilator was found to belong to Category 2 of anesthesia and breathing equipment and to fall under Class III of the risk category. It provides respiratory support to sick or premature infants. Several models are available, but the one analyzed is similar to that of Figure 6.
The results obtained for a specific neonatal ventilator unit are shown in Table 27. Despite being in a less critical situation than other neonatal ventilators in the hospital, since it is a more modern model and thus has more potential spare parts available, the role it performs is essential. So, although it has backup devices, its age of 11 years placed the device at the urgent level. In addition, it has had six failures, meaning 15.07% maintenance costs with respect to acquisition costs over last three years, so a high level was assigned in this criterion.
4.5. Video Colonoscope
The video colonoscope was found to belong to Category 4 of healthcare equipment for electromedical/mechanical products and to fall under Class IIa of the risk category. These are devices that provide images, through fiber optics, for the diagnosis of problems in the lower digestive tract, which mainly corresponds to the large and distal intestines of the ileum such as mucous lesions of the large intestine (mucosal lesions, bleeding lesions, and neoformations), as well as well as some alterations of its normal structure (stenosis, diverticula, fistulas, duplications). An image of the device is shown in Figure 7.
The results obtained for a specific video colonoscope unit are shown in Table 28. It was the newest device of all those analyzed in this study at only four years old. Though the support time has ended, it is a device that has so far not had any breakdown, so its maintenance costs have been low; in any case, it has more backup equipment, which, together with the role it performs, led to the decision of a low renewal priority.
5. Sensitivity Analysis
A sensitivity analysis was of paramount importance for verifying the robustness of the model, because if small changes in the criteria weights produced large changes in the prioritization of the equipment, it could be deduced that the models were highly variable, and, therefore, their robustness was open to question.
For the sensitivity analysis, a computer program was created whose execution was carried out independently of the other programs developed for the study.
Small increases and decreases (±10%) were made to the weights obtained for each criterion in order to observe changes in the global renewal priority of each analyzed medical device and to thereby see whether this entailed a change in their priority level of renewal.
For this study, the boundaries that delimit the different levels of renovation were left fixed. It was necessary to highlight this aspect because with the methodology used to calculate them, a variation in the weight of one of the criteria would modify the value of the boundary.
To demonstrate the sensitivity analysis, the value obtained for each of the modifications is shown, as is the percentage deviation from the real priority value of each alternative. Table 29, Table 30, Table 31, Table 32 and Table 33 show the results of the sensitivity analysis of the equipment analyzed in this paper.
It can be seen that in all cases the deviations resulting from the modification of the weightings of the criteria were quite low, generally with a greater deviation when the modifications were made to the Age of device and Impact of operation criteria, since these were the criteria that had most influence on the final result.
In no case was the deviation greater than 3% over the valuation obtained in the model, and it can also be guaranteed that there was no change in the level of renewal. The same behavior was observed in the rest of the devices analyzed in the study from different categories.
Therefore, it can be said that the model was robust and the results it obtained were consistent. To this must be added that the boundaries used in the project were designed to vary depending on the weights of the criteria, which increased its robustness.
6. Conclusions
There is a complete absence in the literature of models in the fuzzy environment that assess the need for renewal of each medical device in an objective way, and that includes the uncertainty, ambiguities, or doubts typical of decision-making processes in the real world. These models are also highly valued since they allow for public spending to be conveniently justified to the public.
In this research, a model using the FAHP was designed to support the decision to renew the technology of healthcare equipment in hospitals. Three decision makers with knowledge of the hospital environment and technological renewal, as well as multicriteria techniques (one of whom is a recognized expert in the field), were in charge of issuing the judgements to obtain the weightings of the criteria and subcriteria of the models, as well as the assessments of the scale levels of the descriptors.
The model was validated by applying it to different devices belonging to different categories of equipment, five of which have their results shown in this paper: a surgical C-arm, an X-ray CT room, a neonatal ventilator, a defibrillator, and a video colonoscope. The results obtained from applying the model showed how the current state of the equipment is rather poor, given that all but one were found to be at the urgent and high prioritization levels. Since the computer program created in NI Labview for the study applied not only the model designed via the FAHP but also one built with the AHP, it should be noted that similar renewal decisions were obtained using the two methodologies for all the analyzed devices. However, a slight increase of, on average, 2.17% was seen in end utility when applying the FAHP rather than the AHP in all analyzed devices. That is, the model built with the FAHP slightly increased priority in renewal of healthcare technology compared to the model using the AHP and was therefore slightly more conservative. The obtained results can help raise awareness among hospital managers of the need to base technology renewal decisions on criteria and the need to rely on objective models focused on quality of care, rather than other types of consideration.
As for the function of the device, decision makers indicated a clear preference to giving high priorities to life support systems, as well as for Class III; combining this with the great weight stemming from those devices whose failure could lead to the death of the patient and the expected benefits of equipment replacement, it is clear that the decisions made in the model gave preference to the patient.
The results were largely due to two criteria that were considered the most important by decision makers: the Age of the device and the Impact of operation. Both criteria gave quite high priorities in all the devices, especially given that the newest device was over five years old (with the exception of the video colonoscope), and, in general, there was no backup of any kind in many of the devices analyzed.
It should be noted that none of the equipment is currently covered by the guarantee provided by the supplier, and several are virtually discontinued, making the task of searching for spare parts for them difficult. The data available for the assessment of medical equipment by the model were very scarce, and in some cases, such as in the preferences of the staff, it was necessary to use discrete probability distributions with the most probable values. Thus, if better data are available, the model would provide less uncertainty in its results.
The consistency ratio of each of the valuations was always below the 10% threshold, so all the judgements issued by the decision makers were valid for their introduction in the models. The inconsistency analysis that was carried out, unlike most of the contributions to the literature that have not had it, provided a greater solidity to the model.
The research also provided a sensitivity analysis of the models, demonstrating that the model was robust, something that most of the literature’s contributions have also lacked.
It can thus be deduced that a valid model was found for the calculation of the renewal of medical equipment, one that incorporates aspects of maintenance, economic, healthcare, risk, and patient safety, as well as software. This model allows all the data to be entered in a fast and simple way that facilitates the assessment of the renewal status of the entire set of medical equipment in a short time, as well as constant reassessments after the periods established by the model in the low or medium renewal level cases. It should be noted that the results obtained for the equipment analyzed are very representative of the current situation of Spanish healthcare.
The impact of the research on theory is the modelling of the decision to renew health technologies when considering a series of current criteria and sub-criteria that take the rate of renewal of health technologies and the preferences of the users of these devices (doctors, nurses, radiologists, etc.) into account. This was considered fundamental in this research, and, generally, it has not been included in the decision-making process for health technology renewal. It must be considered that technology users are the ones who can provide the most critical assessment of the effectiveness and efficiency of the devices they use. Furthermore, the proposed model presents an innovative system for calculating the limits between priority levels for technological renewal by using a modified top–down methodology, which makes a big difference in how these levels are decided. From the point of view of practice, the proposed approach—both a model developed through the FAHP and the built software—can provide undoubted benefits to healthcare organizations by employing objective methodologies and tools that can be presented to taxpayers or the public and that guarantee the objectivity of public spending in the case of public sector healthcare organizations, as well as against investors in the case of private health institutions. In addition, the built-in software automatically performs a sensitivity analysis that ensures that the results obtained for each medical device are robust. This software could be of great help at the hospital management level in decisions related to the annual budget for the renewal of technologies, as well as for the establishment of a homogeneous and objective procedure by the health departments of the autonomous communities or the Spanish Health Ministry.
Therefore, as an advantage of this research, the availability of the multicriteria model implemented in the software that provides renewal decisions for medical equipment simply and quickly—including expert judgments—is appreciated. As disadvantages of the proposed approach, the model provides a decision with, at best, a two-year time horizon and, at worst, in the current financial year. Therefore, it forces reassessment every year or every two years by means of the created software for all the devices that do not have to be replaced in the current year. Though the designed software is very intuitive and easy to use, it requires a series of data with each reassessment that could be quite time consuming for the personnel in charge of this task. However, the connection of the software created with a computerized maintenance management system (CMMS) or with an enterprise resource planning (ERP), which has a maintenance module, could carry out the automatic acquisition of the necessary information and facilitate the entire process. Therefore, if the proposed software was implemented in the aforementioned information systems, a great benefit would be obtained for the entire healthcare organization, as would a faster and more comfortable way of obtaining results.
As future developments of this research, we intend to carry out a cost–benefit analysis decision making to replace medical equipment. Once the technological renovation priorities are available, a feasibility study can be carried out, one that prioritizes which equipment should be replaced, the order of replacement, and the execution periods, all taking into account different factors such as the health center budget for each financial year, the cost of equipment acquisition, and the specific benefits resulting from the equipment change. It is also expected to be able to incorporate more decision centers to the giving of judgements of the pairwise comparison matrices and to see if there is any significant modification in the established renewal boundaries. In addition, it is expected to be able to model the renewal of medical technologies using other techniques in the fuzzy environment, such as the fuzzy TOPSIS.
Supplementary Materials
The following are available online at https://www.mdpi.com/2227-7390/8/6/944/s1.
Author Contributions
Conceptualization, M.C.C.; methodology, S.D. and M.C.C.; software, S.D.; formal analysis, S.D. and M.C.C.; investigation, S.D. and M.C.C.; data curation, S.D.; visualization, S.D.; writing—original draft preparation, M.C.C.; writing—review and editing, M.C.C. All authors have read and agreed to the published version of the manuscript.
Funding
This research was funded by the University of Castilla-La Mancha and the European Union through the European Regional Development Fund to the Predictive Analysis Laboratory (PREDILAB) group (2020-GRIN-28770).
Conflicts of Interest
The authors declare no conflict of interest.
References
- FENIN (Federación Española de Empresas de Tecnología Sanitaria). Perfil Tecnológico Hospitalario y Propuestas Para la Renovación de Tecnologías Sanitarias; FENIN: Madrid, Spain, 2019. [Google Scholar]
- Lara, P. GMV talento e innovación para la Salud. Gmv news 2016, 61, 8–11. [Google Scholar]
- COCIR. Medical Imaging Equipment Age Profile & Density; COCIR: Brussels, Belgium, 2019. [Google Scholar]
- IM Médico Hospitalario. La SEEIC Defiende La Necesidad De Renovar Los Equipos De Los Centros Sanitarios. 2016. Available online: http://www.immedicohospitalario.es/noticia/7751/la-seeic-defiende-la-necesidad-de-renovar-los-equipos-de-los-centros-sanitarios (accessed on 8 June 2020).
- FENIN (Federación Española de Empresas de Tecnología Sanitaria). Perfil Tecnológico Hospitalario en España. Sector de Tecnología y Sistemas de Información Clínica. Available online: https://www.fenin.es/documents/document/375 (accessed on 8 June 2020).
- SESCAM. Plan de renovación de high tecnología sanitaria en Castilla-La Mancha. Available online: https://sanidad.castillalamancha.es/files/plan_renovacion_alta_tecnologia.pdf (accessed on 8 June 2020).
- Gaceta Dental Fenin Advierte que España Mantiene un High Nivel de Obsolescencia en Equipamiento Hospitalario. Available online: https://gacetadental.com/2019/12/fenin-advierte-espana-mantiene-high-nivel-obsolescencia-equipamiento-hospitalario-93545/ (accessed on 5 May 2020).
- COCIR. Medical Imaging Equipment Age Profile&Density; COCIR Executive Summary; COCIR: Brussels, Belgium, 2014. [Google Scholar]
- Stolze, C. Replacing Medical Equipment. 24 × 7 Magazine. Available online: https://www.24x7mag.com/standards/regulations/replacing-medical-equipment/ (accessed on 21 April 2020).
- Biete, A.; Esco, R.; Errazquin, L.; Pardo, J.; Algara, M.I. Gestión Clínica y los Análisis de Costes en la Oncología Radioterápica; Libro Blanco de la SEOR XXI: Madrid, Spain, 2012; pp. 95–106. [Google Scholar]
- FENIN (Federación Española de Empresas de Tecnología Sanitaria). Perfil Tecnológico Hospitalario en España. Sector de Oftalmología. Nivel de Obsolescencia del Equipamiento de Oftalmología, Estudio base; FENIN: Madrid, Spain, 2014. [Google Scholar]
- AEMPS (Agencia Española de Medicamentos y Productos Sanitarios). Circular Nº 3/2012. Recomendaciones aplicables en la Asistencia Técnica de Productos Sanitarios en los Centros Sanitarios. Available online: https://www.aemps.gob.es/informa/circulares/industria/2012/docs/circular_3_2012.pdf (accessed on 8 June 2020).
- World Health Organization. World Health Report; Health Systems Financing, the Path to Universal Coverage: Geneva, Switzerland, 2010. Available online: https://www.who.int/whr/2010/en/ (accessed on 5 May 2020).
- Ivlev, I.; Kneppo, P.; Bartak, M. Multicriteria decision analysis: A multifaceted approach to medical equipment management. Technol. Econ. Dev. Econ. 2014, 20, 576–589. [Google Scholar] [CrossRef]
- Lettieri, E. Uncertainty inclusion in budgeting technology adoption at a hospital level: Evidence from a multiple case study. Health Policy 2009, 93, 128–136. [Google Scholar] [CrossRef] [PubMed]
- Poveda, J.L.; Hernández, M.; Díez, A.M.; García, C. Análisis coste-beneficio del proceso de semiautomatización en la preparación de dosis unitarias por el Servicio de Farmacia. Farm. Hosp. 2004, 28, 76–83. [Google Scholar]
- Pinto, J.L.; Sacristán, J.A.; Antoñanzas, F. Reflexiones sobre reglas de decisión, coste-efectividad e impacto presupuestario. Gac. Sanit. 2008, 22, 585–595. [Google Scholar] [CrossRef] [Green Version]
- Martín, J. La evaluación económica en el campo de la salud. Cirugía Española 2012, 90, 545–547. [Google Scholar]
- García, A. La introducción de tecnologías en los sistemas sanitarios: Del dicho al hecho. Gac. Sanit. 2004, 18, 398–405. [Google Scholar] [CrossRef]
- Lapsley, I. The accounting—Clinical interface—implementing budgets for hospital doctors. Abacus 2001, 37, 79–109. [Google Scholar] [CrossRef]
- Dye, C.; Boerma, T.; Evans, D.; Harries, A.; Lienhardt, C.; McManus, J.; Pang, T.; Terry, R.; Zachariah, R. Research for Universal Health Coverage; WHO: Luxemburg, 2013. [Google Scholar]
- Goetghebeur, M.M.; Wagner, M.; Khoury, H.; Rindress, D.; Grégoire, J.P. Deal Combining multicriteria decision analysis, ethics and health technology assessment: Applying the EVIDEM decision making framework to growth hormone for Turner syndrome patients. Cost Eff. Resour. Alloc. 2010, 8, 4. [Google Scholar] [CrossRef] [Green Version]
- Teng, F.; Mitton, C.; Mackenzie, J. Priority setting in the provincial health services authority: Survey of key decision makers. BMC Health Serv. Res. 2007, 7, 84. [Google Scholar] [CrossRef] [Green Version]
- Dionne, F.; Mitton, C.; Smith, N.; Donaldson, C. Decision maker views on priority setting in the Vancouver Island Health Authority. Cost Eff. Resour. Alloc. 2008, 6, 10–13. [Google Scholar] [CrossRef] [PubMed] [Green Version]
- Bloom, B.S. Use of formal benefit/cost evaluations in health system decision making. Am. J. Manag. Care 2004, 10, 329–335. [Google Scholar]
- Lomas, J.; Culyer, T.; McCutcheon, C.; McAuley, L.; Law, S. Conceptualizing and Combining Evidence for Health System Guidance; Canadian Health Service Research Foundation: Ottawa, ON, Canada, 2005. [Google Scholar]
- Baltussen, R.; Niessen, L. Priority setting of health interventions: The need for multi-criteria decision analysis. Cost Eff. Resour. Alloc. 2006, 4, 14. [Google Scholar] [CrossRef] [PubMed] [Green Version]
- Dhalla, I.; Laupacis, A. Moving from opacity to transparency in pharmaceutical policy. Can. Med Assoc. J. 2008, 178, 428–431. [Google Scholar] [CrossRef] [Green Version]
- Hill, S.; Velazquez, A.; Tay-Teo, K.; Metherell, A. Global Survey on Health Technology Assessment by National Authorities; World Health Organization: Geneva, Switzerland, 2015. [Google Scholar]
- Huang, I.B.; Keisler, J.; Linkov, I. Multi-criteria decision analysis in environmental sciences: Ten years of applications and trends. Sci. Total Environ. 2011, 409, 3578–3594. [Google Scholar] [CrossRef]
- Munda, G. Measuring sustainability: A multi-criterion framework. Environ. Dev. Sustain. 2005, 2, 117–134. [Google Scholar] [CrossRef]
- Morales, M.; García, S.; Llopis, A. Analysis de los sistemas de gestión medioambiental en la red hospitalaria del sistema nacional de salud: Estado actual. In Proceedings of the Spanish Congress of Environment, Madrid, Spain, 26–30 November 2012. [Google Scholar]
- Egilmez, G.; Gumus, S.; Kucukvar, M. Environmental sustainability benchmarking of the U.S. and Canada metropoles: An expert judgement-based multi-criteria decision making approach. Cities 2015, 42, 31–41. [Google Scholar] [CrossRef]
- Carnero, M.C. Fuzzy Multicriteria Model for Selection of Vibration Technology. Shock Vib. 2016, 2016, 6723605. [Google Scholar] [CrossRef] [Green Version]
- Adunlin, G.; Diaby, V.; Xiao, H. Application of multicriteria decision analysis in health care: A systematic review and bibliometric analysis. Health Expect. 2015, 18, 1894–1905. [Google Scholar] [CrossRef] [Green Version]
- Michalowski, W.; Rubin, S.; Slowinski, R.; Wilk, S. Triage of the child with abdominal pain: A clinical algorithm for emergency patient management. Paediatr. Child Health 2001, 6, 23–28. [Google Scholar] [CrossRef]
- Liberatore, M.J.; Nydick, R.L. The analytic hierarchy process in medical and health care decision making: A literature review. Eur. J. Oper. Res. 2008, 189, 194–207. [Google Scholar] [CrossRef]
- Cheever, M.A.; Allison, J.P.; Ferris, A.S.; Finn, O.J.; Hastings, B.M.; Hecht, T.T.; Mellman, I.; Prindiville, S.A.; Viner, J.L.; Weiner, L.M.; et al. The prioritization of cancer antigens: A national cancer institute pilot project for the acceleration of translational research. Clin. Cancer Res. 2009, 15, 5323–5337. [Google Scholar] [CrossRef] [PubMed] [Green Version]
- Mardani, A.; Hooker, R.E.; Ozkul, S.; Yifan, S.; Nilashi, M.; Sabzi, H.Z.; Fei, G.C. Application of decision making and fuzzy sets theory to evaluate the healthcare and medical problems: A review of three decades of research with recent developments. Expert Syst. Appl. 2019, 137, 202–231. [Google Scholar] [CrossRef]
- Hummel, J.M.; van Rossum, W.; Verkerke, G.J.; Rakhorst, G. Medical technology assessment: The use of the analytic hierarchy process as a tool for multidisciplinary evaluation of medical devices. Int. J. Artif. Organs 2000, 23, 782–787. [Google Scholar] [CrossRef] [PubMed]
- Sloane, E.B.; Liberatore, M.J.; Nydick, R.L.; Luo, W.; Chung, Q.B. Using the analytic hierarchy process as a clinical engineering tool to facilitate an iterative, multidisciplinary, microeconomic health technology assessment. Comput. Oper. Res. 2003, 30, 1447–1465. [Google Scholar] [CrossRef]
- Cho, K.T.; Kim, S.M. Selecting medical devices and materials for development in Korea: The analytic hierarchy process approach. Int. J. Health Plan. Manag. 2003, 18, 161–174. [Google Scholar] [CrossRef]
- Tak, F.W. Prelude to the benchmarking of general radiography. Hong Kong Radiogr. J. 2002, 6, 3–9. [Google Scholar]
- Joshi, V.; Narra, V.R.; Joshi, K.; Lee, K.; Melson, D. PACS Administrators’ and Radiologists’ Perspective on the Importance of Features for PACS Selection. J. Digit. Imaging 2014, 27, 486–495. [Google Scholar] [CrossRef] [Green Version]
- Husereau, D.; Boucher, M.; Noorani, H. Priority setting for health technology assessment at CADTH. Int. J. Technol. Assess. Health Care 2010, 26, 341–347. [Google Scholar] [CrossRef]
- Schmidt, K.; Aumann, I.; Hollander, I.; Damm, K.; Graf von der Schulenburg, J.M. Applying the Analytic Hierarchy Process in healthcare research: A systematic literature review and evaluation of reporting. BMC Med. Inform. Decis. Mak. 2015, 15, 112. [Google Scholar] [CrossRef] [Green Version]
- Chen, H.; Kocaoglu, D.F. A sensitivity analysis algorithm for hierarchical decision models. Eur. J. Oper. Res. 2008, 185, 266–288. [Google Scholar] [CrossRef]
- Diaby, V.; Campbell, K.; Goeree, R. Multi-criteria decision analysis (MCDA) in health care: A bibliometric analysis. Oper. Res. Health Care 2013, 2, 20–24. [Google Scholar] [CrossRef]
- Rossetti, M.D.; Selandari, F. Multi-objective analysis ofhospital delivery systems. Comput. Ind. Eng. 2001, 41, 309–333. [Google Scholar] [CrossRef]
- Thokala, P.; Duenas, A. Multiple criteria decision analysis for health technology assessment. Value Health 2012, 15, 1172–1181. [Google Scholar] [CrossRef] [PubMed] [Green Version]
- Angelis, A.; Montibeller, G.; Hochhauser, D.; Kanavos, P. Multiple criteria decision analysis in the context of health technology assessment: A simulation exercise on metastatic colorectal cancer with multiple stakeholders in the English setting. BMC Med Inform. Decis. Mak. 2017, 17, 149. [Google Scholar] [CrossRef] [Green Version]
- Zhou, F.L.; Wang, X.; Goh, M. Fuzzy extended VIKOR-based mobile robot selection model for hospital pharmacy. Int. J. Adv. Robot. Syst. 2018, 15, 1–11. [Google Scholar] [CrossRef] [Green Version]
- Improta, G.; Russo, M.A.; Triassi, M.; Converso, G.; Murino, T.; Santillo, L.C. Use of the AHP methodology in system dynamics: Modelling and simulation for health technology assessments to determine the correct prosthesis choice for hernia diseases. Math. Biosci. 2018, 299, 19–27. [Google Scholar] [CrossRef]
- Faisal, M.; Sharawi, A. Prioritize Medical Equipment Replacement Using Analytical Hierarchy Process. J. Electr. Electron. Eng. 2015, 10, 55–63. [Google Scholar]
- Sherif, M. Modeling for Decision Making: The Case of Medical Equipment Replacement. J. Clin. Eng. 2020, 45, 77–100. [Google Scholar] [CrossRef]
- Jasuta, L.; Parrott, B. Why Age is Not Enough: A Better Approach to Equipment Replacement. Strata Decision Technology. Available online: https://www.stratadecision.com/article/why-age-is-not-enough-a-better-approach-to-equipment-replacement/ (accessed on 4 May 2020).
- Sloan, T.W. Green renewal: Incorporating environmental factors in equipment replacement decisions under technological change. J. Clean. Prod. 2011, 19, 173–186. [Google Scholar] [CrossRef]
- Fennigkoh, L.; Smith, B. Clinical equipment management. Jcaho Ptsm Ser. 1989, 2, 5–14. [Google Scholar]
- Masmoudi, M.; Houria, Z.B.; Hanbali, A.A.; Masmoudi, F. Decision Support Procedure for Medical Equipment Maintenance Management. J. Clin. Eng. 2016, 41, 19–29. [Google Scholar] [CrossRef]
- Taghipour, S.; Banjevic, D.; Jardine, A.K.S. Prioritization of medical equipment for maintenance decisions. J. Oper. Res. Soc. 2011, 62, 1666–1687. [Google Scholar] [CrossRef]
- Houria, B.; Besbes, M.; Elaoud, B.; Masmoudi, M.; Masmoudi, F. Maintenance strategy selection for medical equipments using multiple fuzzy multicriteria decision making approach. In Proceedings of the CIE 45 Proceedings, Metz, France, 28–30 October 2015. [Google Scholar]
- Houria, B.; Masmoudi, Z.; Al Hanbali, M.; Masmoudi, A.F. Quantitative techniques for medical equipment maintenance management. Eur. J Ind. Eng. 2016, 10, 703–723. [Google Scholar] [CrossRef]
- Jamshidi, A.; Rahimi, S.A.; Ait-kadi, D.; Ruiz, A. A comprehensive fuzzy risk-based maintenance framework for prioritization of medical devices. Appl. Soft Comput. 2015, 32, 322–334. [Google Scholar] [CrossRef]
- Tawfik, B.; Ouda, B.K.; El Samad, M.E. A fuzzy logic model for medical equipment risk classification. J. Clin. Eng. 2013, 38, 185–190. [Google Scholar] [CrossRef]
- Mahfoud, H.; El Barkany, A.; El Biyaali, A. A Hybrid Decision-Making Model for Maintenance Prioritization in Health Care Systems. Am. J. Appl. Sci. 2016, 13, 439–450. [Google Scholar] [CrossRef]
- Canadian Association of Radiologists Lifecycle Guidance for Medical Imaging Equipment in Canada. 2013. Available online: https://car.ca/wp-content/uploads/car-lifecycleguidance-mainreport.pdf (accessed on 7 May 2020).
- Danish Centre for Evaluation and Health Technology Assessment. Introduction to Mini-HTA—A Management and Decision Support Tool for the Hospital Service; The National Board of Health: Copenhagen, Denmark, 2005.
- Ehlers, L.; Vestergaard, M.; Kidholm, K.; Bonnevie, B.; Pedersen, P.H.; Jørgensen, T.; Jensen, M.F.; Kristensen, F.B.; Mette, K. Doing mini-health technology assessments in hospitals: A new concept of decision support in health care? Int. J. Technol. Assess. Health Care 2006, 22, 295–301. [Google Scholar] [CrossRef] [Green Version]
- Briones, E.; Loscertales, M.; Pérez, M.J. Proyecto GANT: Metodología de Desarrollo y Estudio Preliminar; Agencia de Evaluación de Tecnologías Sanitarias de Andalucía: Sevilla, Spain, 1999. [Google Scholar]
- Ivlev, I.; Vacek, J.; Kneppo, P. Multi-criteria decision analysis for supporting the selection of medical devices under uncertainty. Eur. J. Oper. Res. 2015, 247, 216–228. [Google Scholar] [CrossRef]
- Bereketli, I.; Genevois, M.E.; Albayrak, Y.E.; Ozyol, M. WEEE treatment strategies’ evaluation using fuzzy LINMAP method. Expert Syst. Appl. 2011, 38, 71–79. [Google Scholar] [CrossRef]
- Dursun, M.; Karsak, E.E.; Karadayi, M.A. Assessment of health-care waste treatment alternatives using fuzzy multi-criteria decision making approaches. Resour. Conserv. Recycl. 2011, 57, 98–107. [Google Scholar] [CrossRef]
- Liu, H.C.; Wu, J.; Li, P. Assessment of health-care waste disposal methods using a VIKOR-based fuzzy multi-criteria decision making method. Waste Manag. 2013, 33, 2744–2751. [Google Scholar] [CrossRef] [PubMed]
- Xiao, F. A novel multi-criteria decision making method for assessing health care waste treatment technologies based on D numbers. Eng. Appl. Artif. Intell. 2018, 71, 216–225. [Google Scholar] [CrossRef]
- Tsai, H.Y.; Chang, C.W.; Lin, H.L. Fuzzy hierarchy sensitive with Delphi method to evaluate hospital organization performance. Expert Syst. Appl. 2010, 37, 5533–5541. [Google Scholar] [CrossRef]
- Büyüközkan, G.; Çifçi, G.; Güleryüz, S. Strategic analysis of healthcare service quality using fuzzy AHP methodology. Expert Syst. Appl. 2011, 38, 9407–9424. [Google Scholar] [CrossRef]
- Büyüközkan, G.; Çifçi, G. A combined fuzzy AHP and fuzzy TOPSIS based strategic analysis of electronic service quality in healthcare industry. Expert Syst. Appl. 2012, 39, 2341–2354. [Google Scholar] [CrossRef]
- Afkham, L.; Abdi, F.; Komijan, A. Evaluation of service quality by using fuzzy MCDM: A case study in Iranian health-care centers. Manag. Sci. Lett. 2012, 2, 291–300. [Google Scholar] [CrossRef]
- Kou, G.; Wu, W. Multi-criteria decision analysis for emergency medical service assessment. Ann. Oper. Res. 2014, 223, 239–254. [Google Scholar] [CrossRef]
- Chang, T.H. Fuzzy VIKOR method: A case study of the hospital service evaluation in Taiwan. Inf. Sci. 2014, 271, 196–212. [Google Scholar] [CrossRef]
- Shafii, M.; Rafiei, S.; Abooee, F.; Bahrami, M.A.; Nouhi, M.; Lotfi, F.; Khanjankhani, K. Assessment of service quality in teaching hospitals of Yazd University of Medical Sciences: Using multi-criteria decision making techniques. Osong Public Health Res. Perspect. 2016, 7, 239–247. [Google Scholar] [CrossRef] [Green Version]
- Otay, I.; Oztaysi, B.; Onar, S.C.; Kahraman, C. Multi-expert performance evaluation of healthcare institutions using an integrated intuitionistic fuzzy AHP&DEA methodology. Knowl. Based Syst. 2017, 133, 90–106. [Google Scholar]
- La Fata, C.M.; Lupo, T.; Piazza, T. Service quality benchmarking via a novel approach based on fuzzy ELECTRE III and IPA: An empirical case involving the Italian public healthcare context. Health Care Manag. Sci. 2019, 22, 106–120. [Google Scholar] [CrossRef] [PubMed]
- Efendigil, T. Integrated Ranking Procedure for Replacement Decisions of Critical Medical Equipments. Int. J. Anal. Hierarchy Process 2011, 3, 1–5. [Google Scholar]
- SeongKon, L.; Gento, M.; SangKon, L.; JongWook, K. Prioritizing the weights of hydrogen energy technologies in the sector of the hydrogen economy by using a fuzzy AHP approach. Int. J. Hydrog. Energy 2011, 36, 1897–1902. [Google Scholar]
- Zadeh, L.A. Fuzzy sets. Inf. Control 1965, 8, 338–353. [Google Scholar] [CrossRef] [Green Version]
- Chang, D.Y. Application of the extent analysis method on fuzzy AHP. Eur. J. Op. Res. 1996, 95, 649–655. [Google Scholar] [CrossRef]
- Wang, W.M.; Peng, H.H. A Fuzzy Multi-Criteria Evaluation Framework for Urban Sustainable Development. Mathematics 2020, 8, 330. [Google Scholar] [CrossRef] [Green Version]
- Ly, P.T.M.; Lai, W.H.; Hsu, C.W.; Shih, F.Y. Fuzzy AHP analysis of Internet of Things (IoT) in enterprises. Technol. Forecast. Soc. Chang. 2018, 136, 1–13. [Google Scholar] [CrossRef]
- Khan, A.A.; Shameem, M.; Kumar, R.R.; Hussain, S.; Yan, X. Fuzzy AHP based prioritization and taxonomy of software process improvement success factors in global software development. Appl. Soft Comput. 2019, 83, 105648. [Google Scholar] [CrossRef]
- Kim, C.; Kim, Y.; Yi, H. Fuzzy Analytic Hierarchy Process-Based Mobile Robot Path Planning. Electronics 2020, 9, 290. [Google Scholar] [CrossRef] [Green Version]
- Li, M.; Wang, H.; Wang, D.; Shao, Z.; He, S. Risk assessment of gas explosion in coal mines based on fuzzy AHP and bayesian network. Process Saf. Environ. Prot. 2020, 135, 207–218. [Google Scholar] [CrossRef]
- Boral, S.; Howard, I.; Chaturvedi, S.K.; McKee, K.; Naikan, V.N.A. An integrated approach for fuzzy failure modes and effects analysis using fuzzy AHP and fuzzy MAIRCA. Eng. Fail. Anal. 2020, 108, 104195. [Google Scholar] [CrossRef]
- Saaty, T.L.; Tran, L.T. On the invalidity of fuzzifying numerical judgments in the Analytic Hierarchy Process. Math. Comput. Model. 2007, 46, 7–8. [Google Scholar] [CrossRef]
- Ahmed, F.; Kilic, K. Fuzzy Analytic Hierarchy Process: A performance analysis of various algorithms. Fuzzy Sets Syst. 2019, 3621, 110–128. [Google Scholar] [CrossRef]
- Buckley, J.J. Fuzzy hierarchical analysis. Fuzzy Sets Syst 1985, 17, 233–247. [Google Scholar] [CrossRef]
- Jenatabadi, H.S.; Babashamsi, P.; Yusoff, N.I. The Combination of a Fuzzy Analytical Hierarchy Process and the Taguchi Method to Evaluate the Malaysian Users’ Willingness to Pay for Public Transportation. Symmetry 2016, 8, 90. [Google Scholar] [CrossRef] [Green Version]
- Saaty, T.L. The Analytic Hierarchy Process; McGraw Hill: New York, NY, USA, 1980. [Google Scholar]
- Cheng, C.H. Evaluating naval tactical missile systems by fuzzy AHP based on the grade value of membership function. Eur. J. Oper. Res. 1996, 96, 343–350. [Google Scholar] [CrossRef]
- Isaai, M.T.; Kanani, A.; Tootoonchi, M.; Afzali, H.R. Intelligent timetable evaluation using fuzzy AHP. Expert Syst. Appl. 2011, 38, 3718–3723. [Google Scholar] [CrossRef]
- Kabir, G. Comparative analysis of AHP and fuzzy AHP models for multicriteria inventory classification. Int. J. Fuzzy Log. Syst. 2011, 1, 1–16. [Google Scholar]
- Chen, V.Y.C.; Lien, H.P.; Liu, C.H.; Liou, J.J.H.; Tzeng, G.H.; Yang, L.S. Fuzzy MCDM approach for selecting the best environment-watershed plan. Appl. Soft Comput. 2011, 11, 265–275. [Google Scholar] [CrossRef]
- Chang, T.H.; Wang, T.C. Using the fuzzy multi-criteria decision making approach for measuring the possibility of successful knowledge management. Inf. Sci. 2009, 179, 355–370. [Google Scholar] [CrossRef]
- Csutora, R.; Buckley, J.J. Fuzzy hierarchical analysis: The Lambda-Max method. Fuzzy Sets Syst. 2001, 120, 181–195. [Google Scholar] [CrossRef]
- Saaty, T.L. Decision Making with Dependence and Feedback: The Analytic Network Process; RWS Publications: Pittsburgh, PA, USA, 2001. [Google Scholar]
- Agrawal, A.; Alenezi, M.; Kumar, R.; Khan, R.A. A Unified Fuzzy-Based Symmetrical Multi-Criteria Decision-Making Method for Evaluating Sustainable-Security of Web Applications. Symmetry 2020, 12, 448. [Google Scholar] [CrossRef] [Green Version]
- AEMPS. Agencia Española de Medicamentos y Productos Sanitarios. Categorías, genéricos y tipos de producto. Ministerio de Sanidad, Servicios Sociales e Igualdad. Available online: https://sede.aemps.gob.es/PSCH/PS/docs/manual_categorias_genericos_tiposProducto.pdf (accessed on 8 June 2020).
- Mummolo, G.; Ranieri, L.; Bevilacqua, V.; Menolascina, F.; Galli, P.; Padoano Siena, G. A fuzzy approach for medical equipment replacement planning. In Proceedings of the Third International Conference on Maintenance and Facility Management, Rome, Italy, 27—28 September 2007; pp. 229–235. [Google Scholar]
Figure 1.
Flowchart of the study.

Figure 2.
Total structure by category N.

Figure 3.
X-ray surgical C-arm.

Figure 4.
X-ray computed tomography (CT) room.

Figure 5.
Defibrillator.

Figure 6.
Neonatal ventilator.

Figure 7.
Video colonoscope.


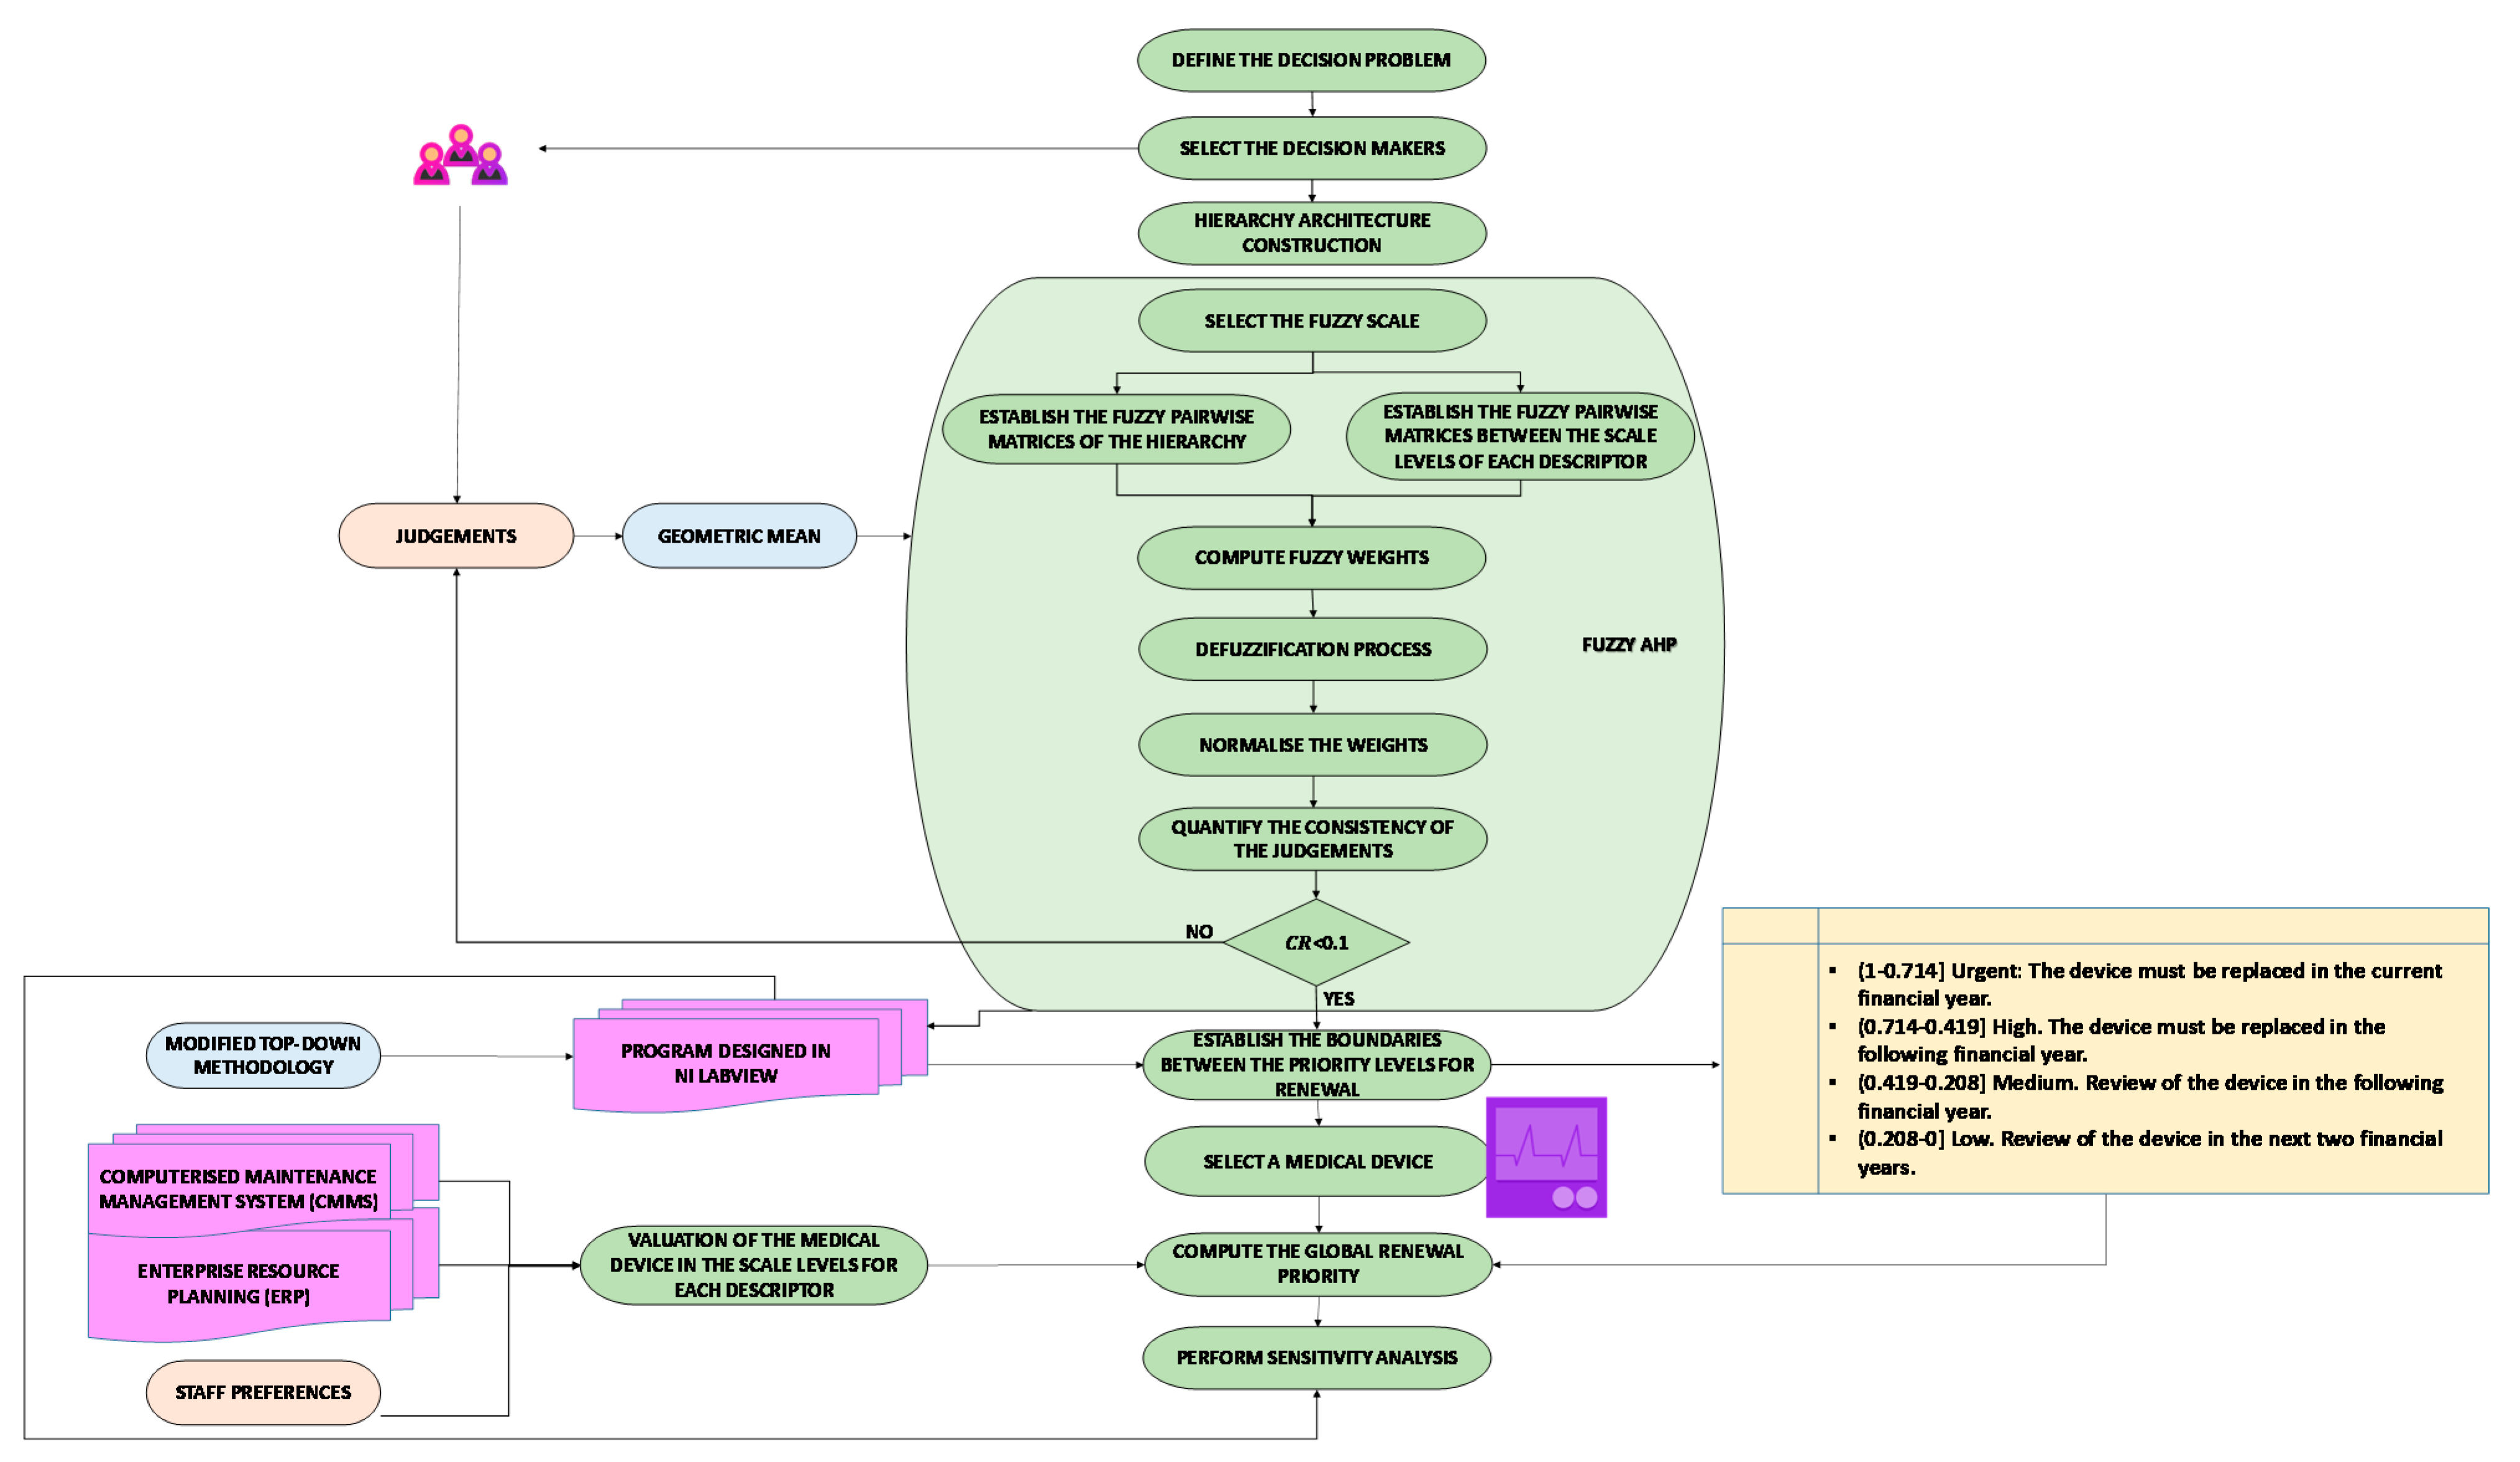
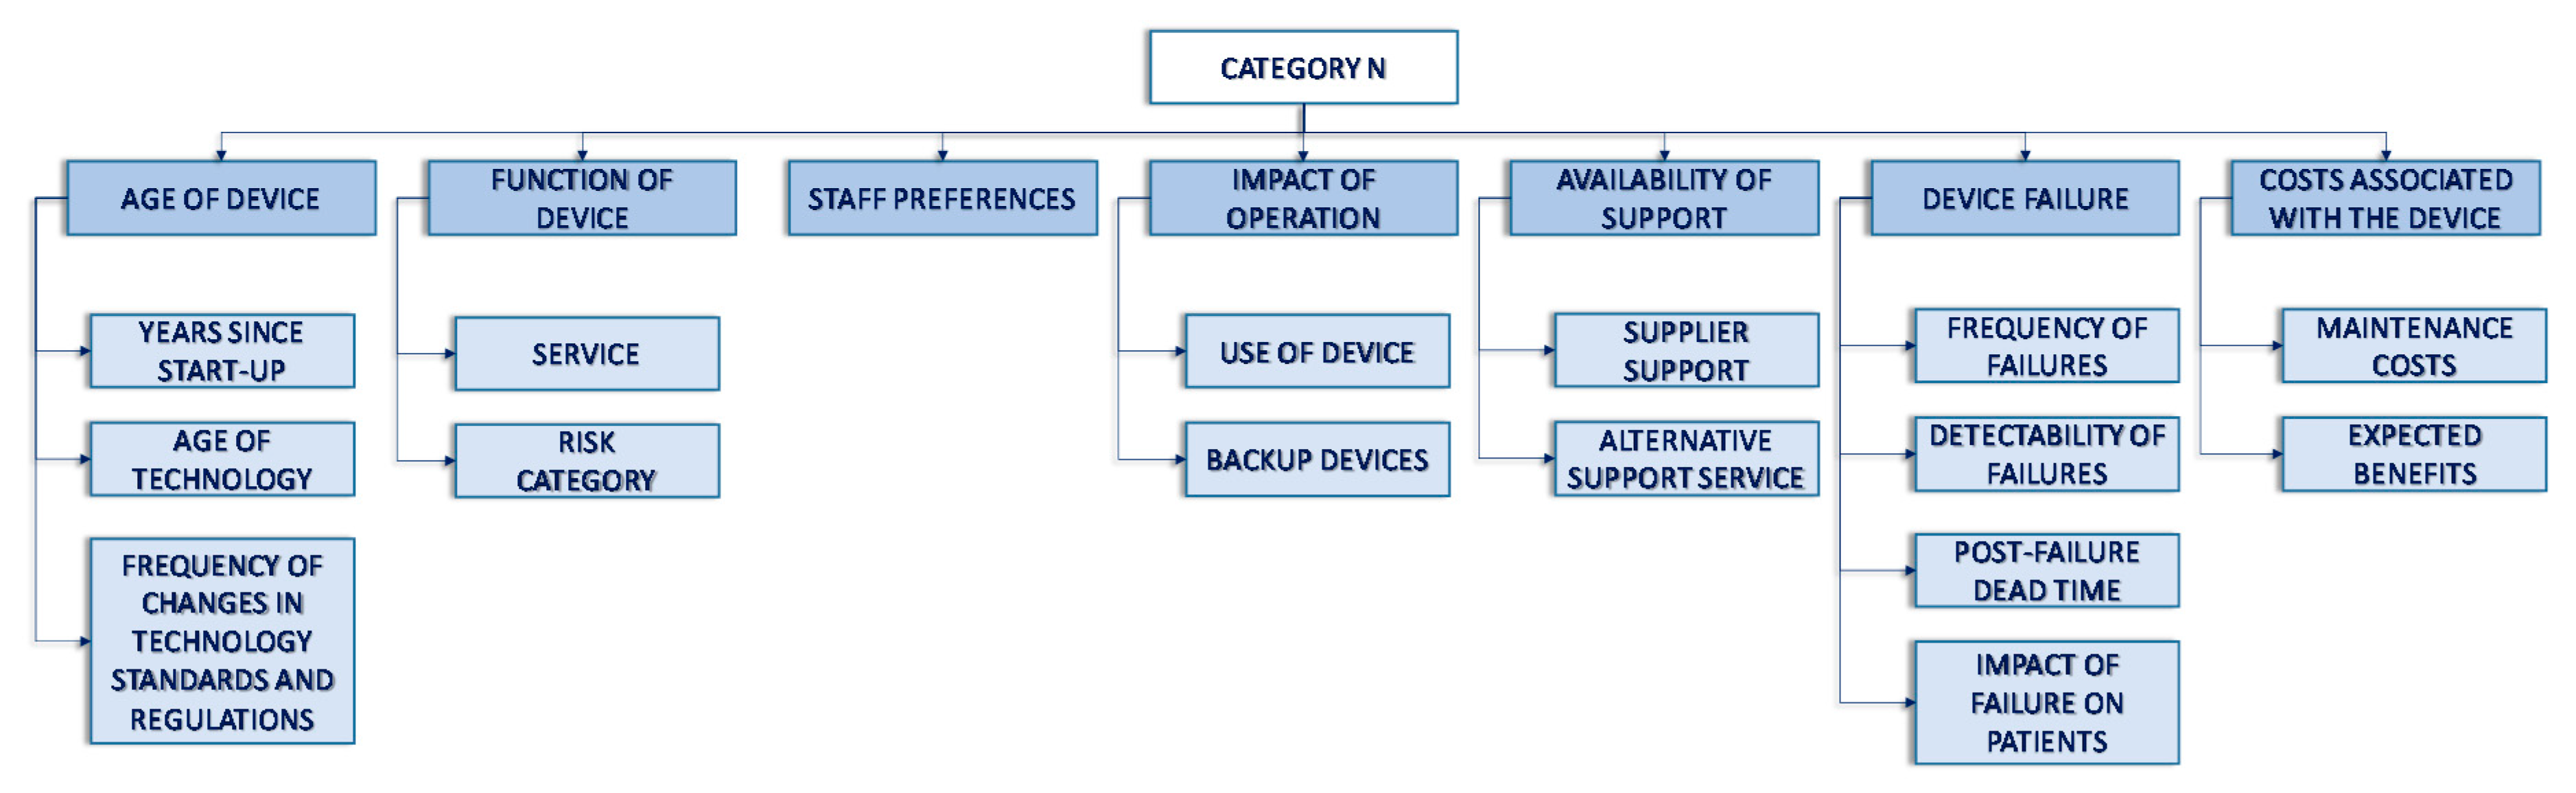
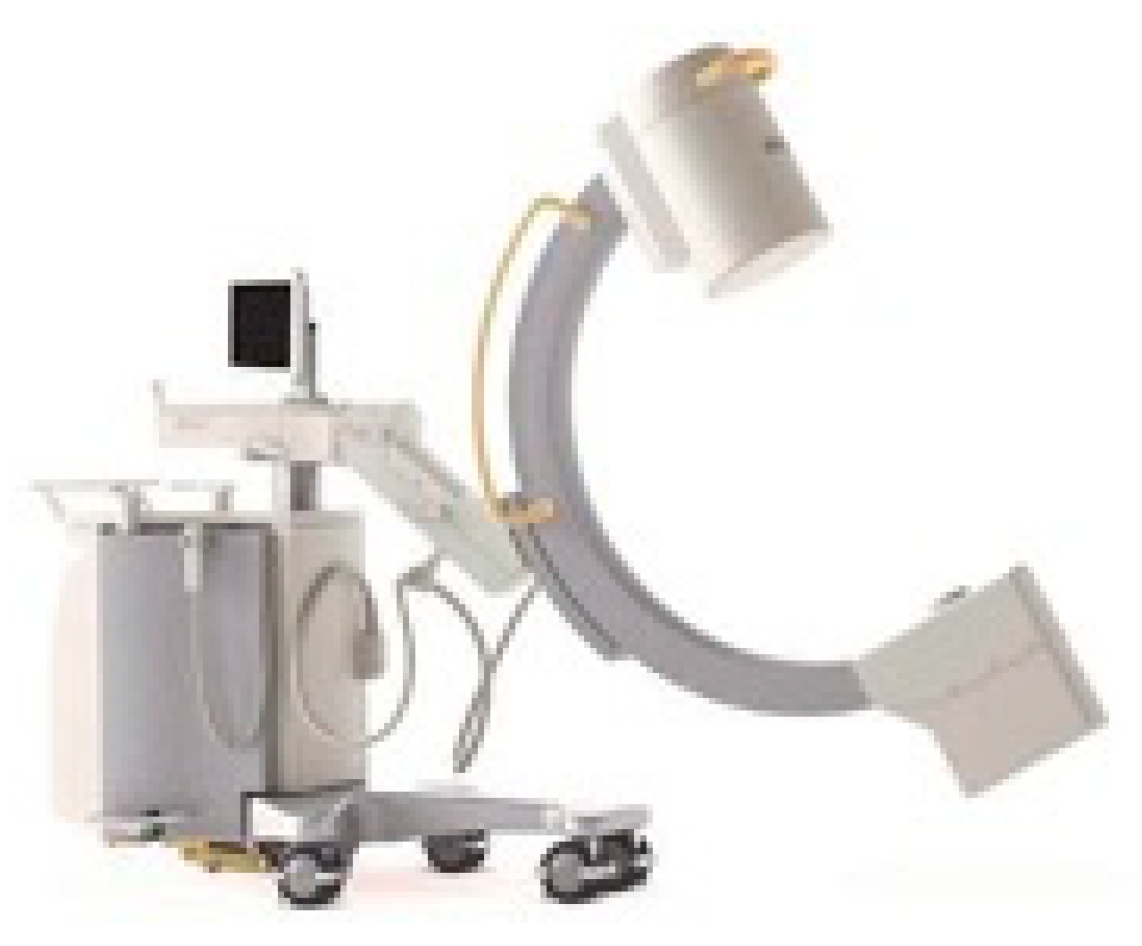
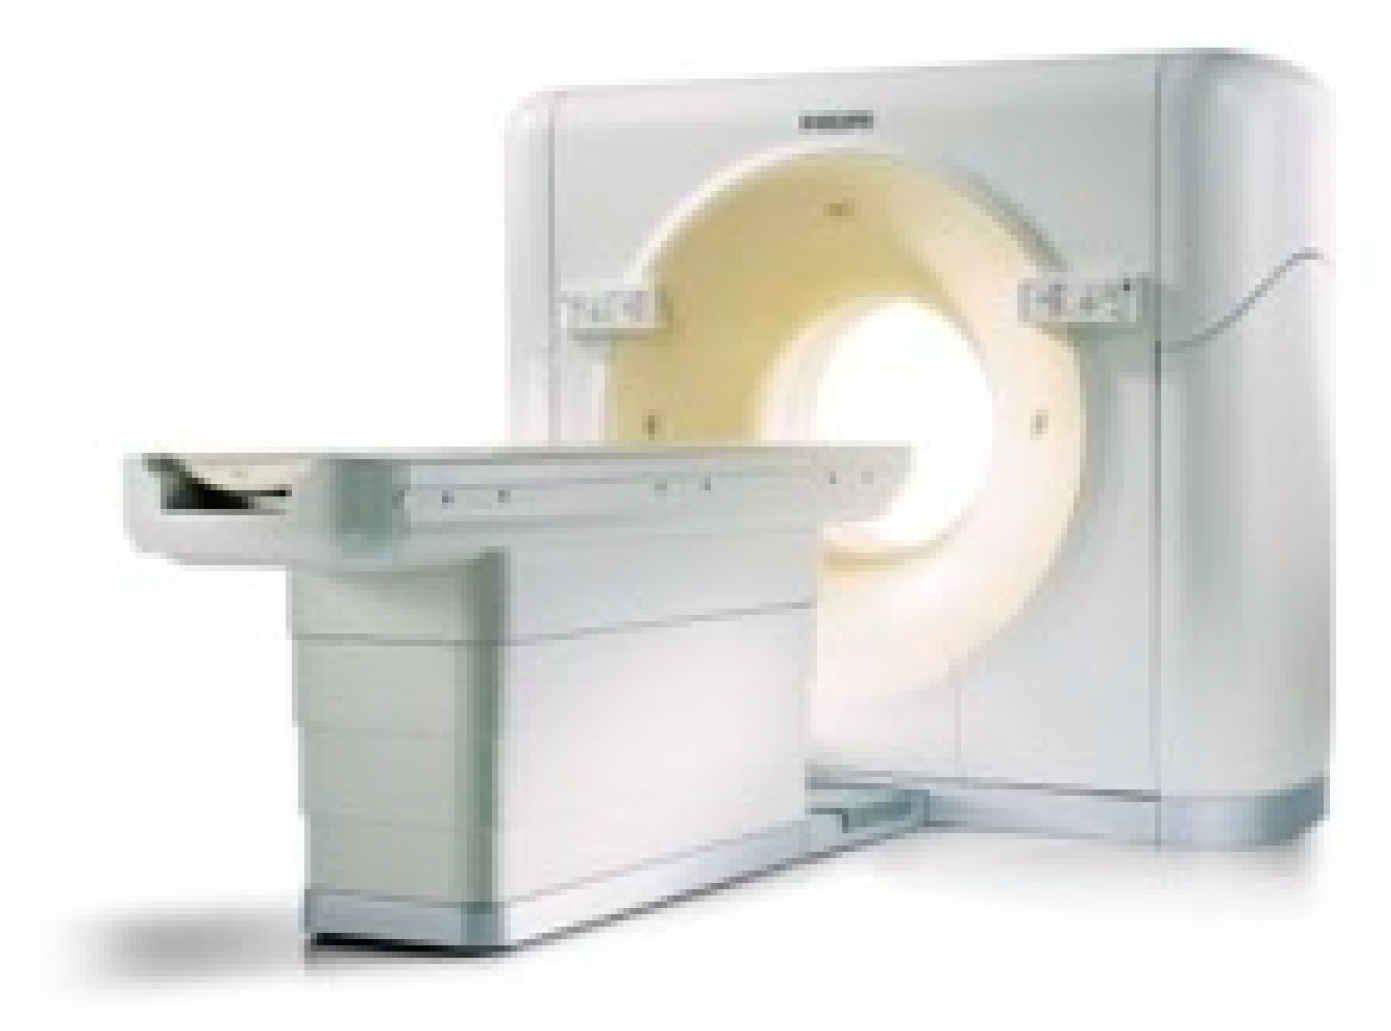
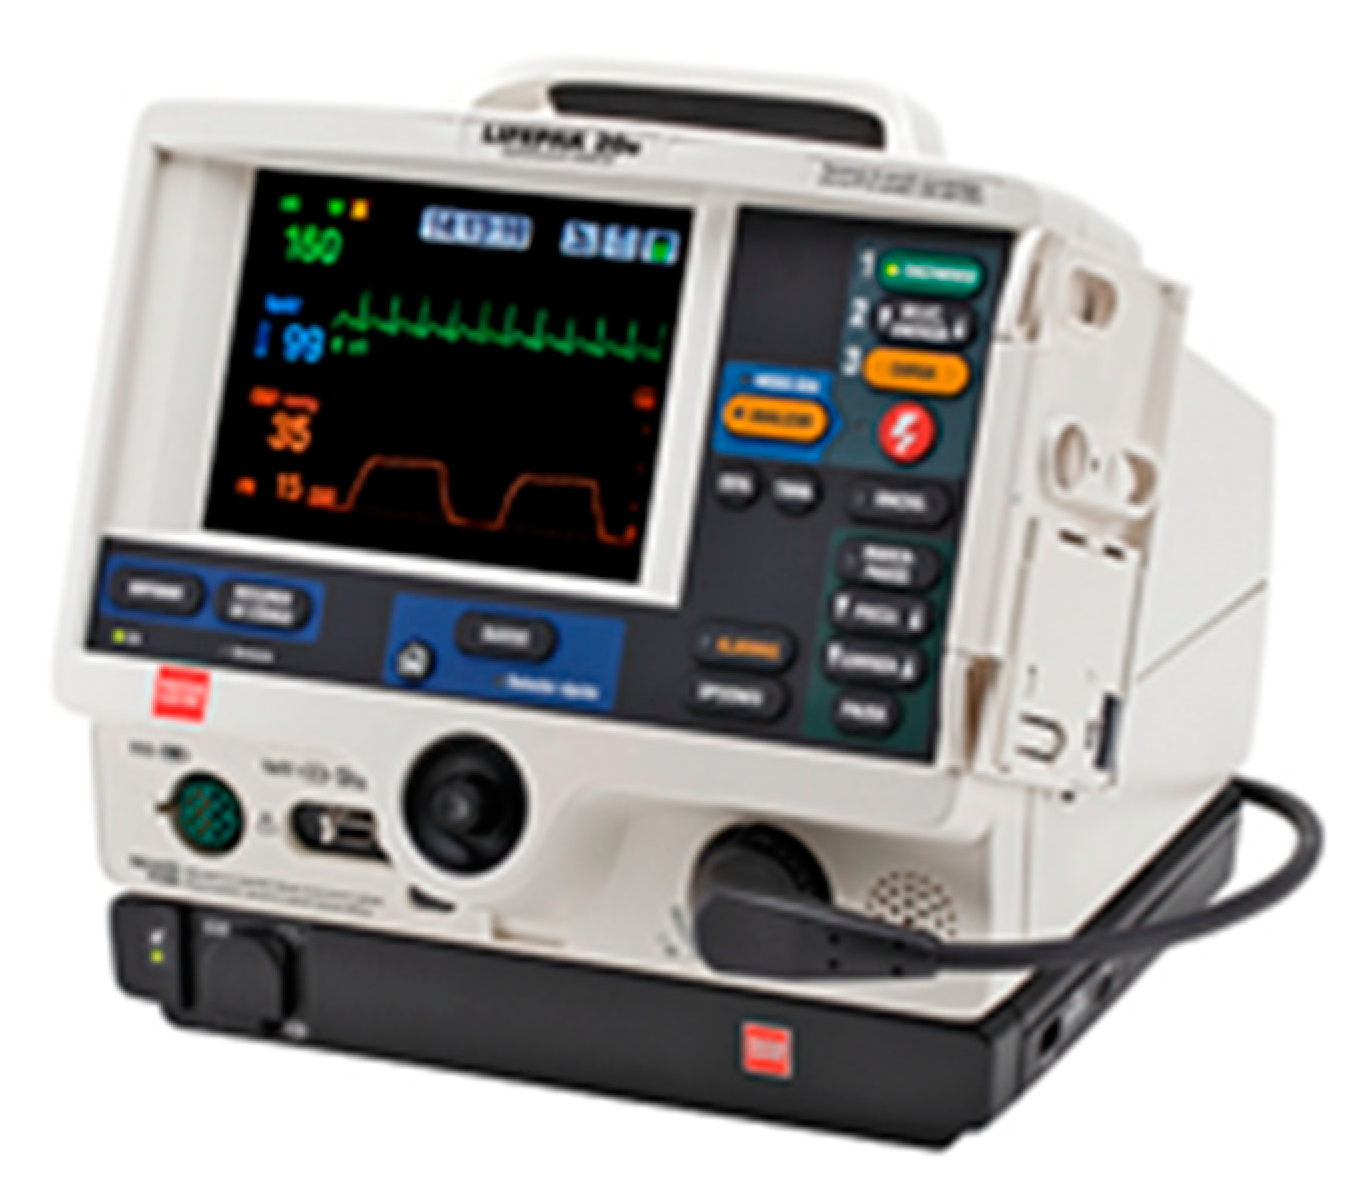
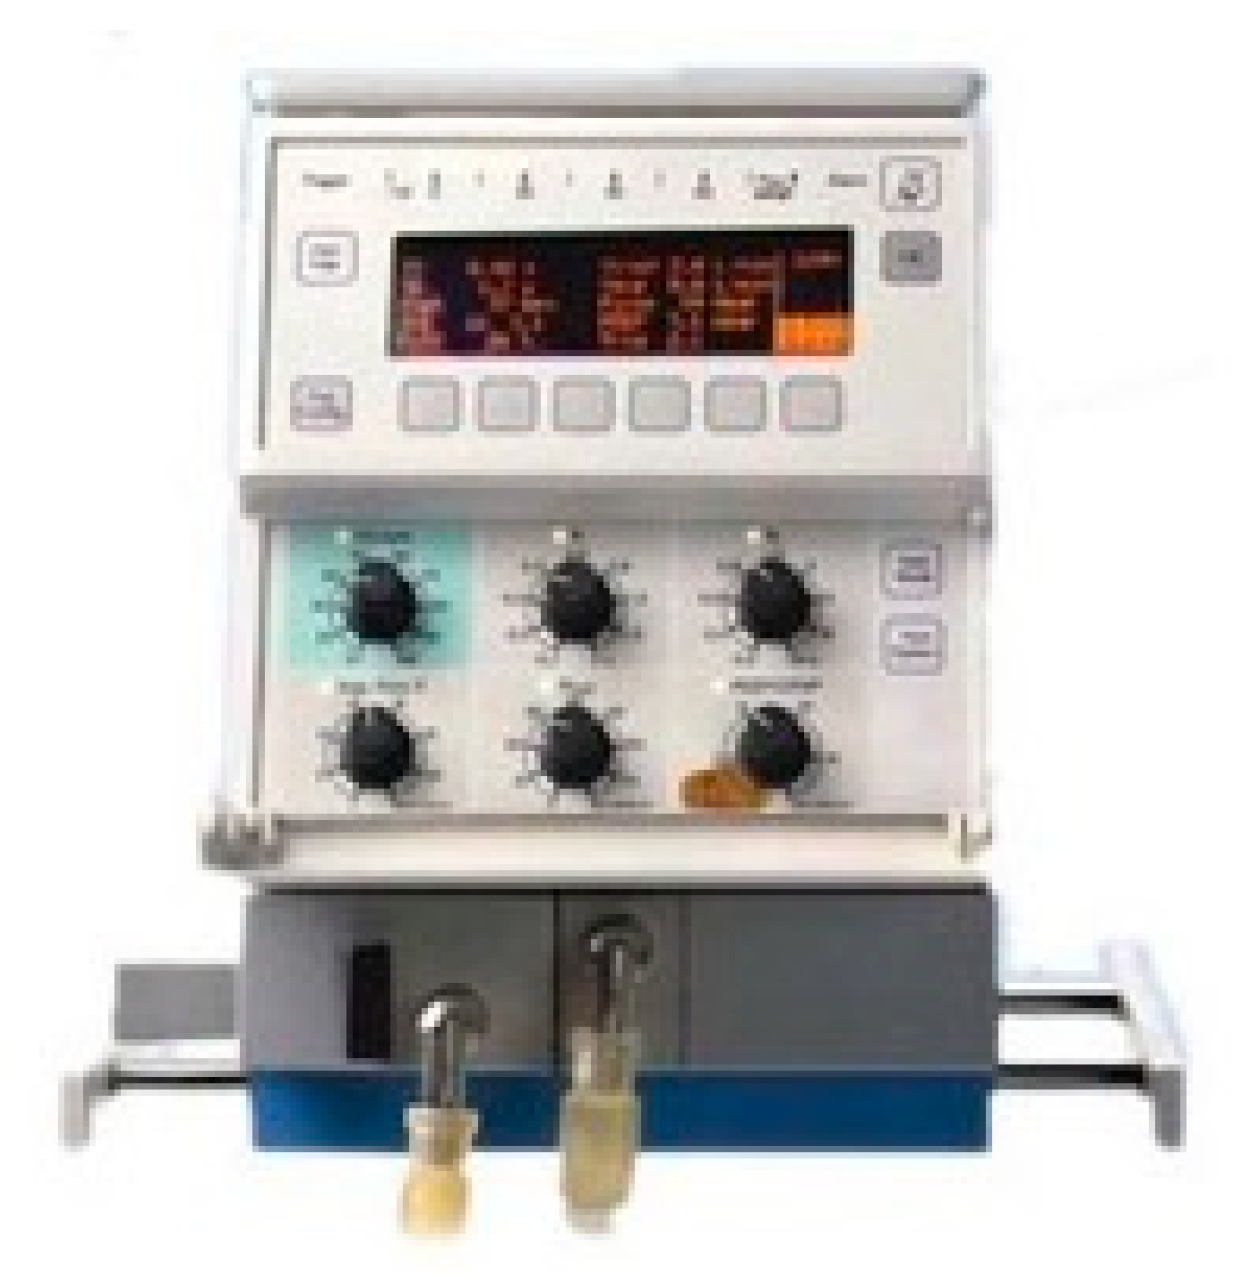
Table 1.
Verbal scale and associated fuzzy numbers.
| Verbal scale | Fuzzy Numbers | Reciprocal Fuzzy Numbers |
|---|---|---|
| Equally preferable | (1/3, 1, 1) | |
| Between equally and moderately preferable | (1/4, 1/2, 1) | |
| Moderately preferable | (1/5, 1/3, 1) | |
| Between moderately and strongly preferable | (1/6, 1/4, 1/2) | |
| Strongly preferable | (1/7, 1/5, 1/3) | |
| Between strongly and very strongly preferable | (1/8, 1/6, 1/4) | |
| Very strongly preferable | (1/9, 1/7, 1/5) | |
| Between very strongly and extremely preferable | (1/9, 1/8, 1/6) | |
| Extremely preferable | (1/9, 1/9, 1/7) |
Table 2.
Random consistency index (RCI).
| Matrix Dimension | 1 | 2 | 3 | 4 | 5 | 6 | 7 | 8 | 9 | 10 |
|---|---|---|---|---|---|---|---|---|---|---|
| RCI | 0 | 0 | 0.58 | 0.9 | 1.12 | 1.24 | 1.32 | 1.41 | 1.45 | 1.49 |
Table 3.
Matrix of combined judgements using geometric means for the criteria. FUN: function of the equipment; AGE: age of device; SUP: availability of support; IMP: impact of operation; PRE: staff preferences; FAI: equipment failures or breakdowns; COS: costs associated with device.
Table 3.
Matrix of combined judgements using geometric means for the criteria. FUN: function of the equipment; AGE: age of device; SUP: availability of support; IMP: impact of operation; PRE: staff preferences; FAI: equipment failures or breakdowns; COS: costs associated with device.
| FUN | AGE | SUP | IMP | PRE | FAI | COS | |||||||||||||||
|---|---|---|---|---|---|---|---|---|---|---|---|---|---|---|---|---|---|---|---|---|---|
| FUN | 1.000 | 1.000 | 1.000 | 0.288 | 0.464 | 0.874 | 1.442 | 3.107 | 5.192 | 0.322 | 0.437 | 1.145 | 1.260 | 2.884 | 4.932 | 0.500 | 1.000 | 1.817 | 1.587 | 2.884 | 5.040 |
| AGE | 1.145 | 2.154 | 3.476 | 1.000 | 1.000 | 1.000 | 2.289 | 4.481 | 6.542 | 0.630 | 1.442 | 2.714 | 2.466 | 4.121 | 6.316 | 1.000 | 2.621 | 4.642 | 2.289 | 4.309 | 6.316 |
| SUP | 0.193 | 0.322 | 0.693 | 0.153 | 0.223 | 0.437 | 1.000 | 1.000 | 1.000 | 0.150 | 0.215 | 0.382 | 0.368 | 0.693 | 1.587 | 0.191 | 0.315 | 0.630 | 0.397 | 0.794 | 1.587 |
| IMP | 0.874 | 2.289 | 3.107 | 0.368 | 0.693 | 1.587 | 2.621 | 4.642 | 6.649 | 1.000 | 1.000 | 1.000 | 1.817 | 3.915 | 5.944 | 1.260 | 3.302 | 5.313 | 1.587 | 3.780 | 5.848 |
| PRE | 0.203 | 0.347 | 0.794 | 0.158 | 0.243 | 0.405 | 0.630 | 1.442 | 2.714 | 0.168 | 0.255 | 0.550 | 1.000 | 1.000 | 1.000 | 0.342 | 0.693 | 1.710 | 0.500 | 1.000 | 1.817 |
| FAI | 0.550 | 1.000 | 2.000 | 0.215 | 0.382 | 1.000 | 1.587 | 3.175 | 5.241 | 0.188 | 0.303 | 0.794 | 0.585 | 1.442 | 2.924 | 1.000 | 1.000 | 1.000 | 1.000 | 2.289 | 4.309 |
| COS | 0.198 | 0.347 | 0.630 | 0.158 | 0.232 | 0.437 | 0.630 | 1.260 | 2.520 | 0.171 | 0.265 | 0.630 | 0.550 | 1.000 | 2.000 | 0.232 | 0.437 | 1.000 | 1.000 | 1.000 | 1.000 |
Table 4.
Matrix of combined judgements using geometric means for the subcriteria of the criterion Age of the device. CR: consistency ratio.
Table 4.
Matrix of combined judgements using geometric means for the subcriteria of the criterion Age of the device. CR: consistency ratio.
| AGE1 | AGE2 | AGE3 | Weights | CR | |||||||
|---|---|---|---|---|---|---|---|---|---|---|---|
| AGE1 | 1.000 | 1.000 | 1.000 | 1.000 | 2.289 | 4.309 | 2.466 | 4.121 | 6.316 | 0.585 | 0 |
| AGE2 | 0.232 | 0.437 | 1.000 | 1.000 | 1.000 | 1.000 | 1.260 | 2.000 | 4.160 | 0.276 | |
| AGE3 | 0.158 | 0.243 | 0.405 | 0.240 | 0.500 | 0.794 | 1.000 | 1.000 | 1.000 | 0.139 | |
Table 5.
Combined judgement matrix using geometric means for the subcriteria of the criterion Availability of support.
Table 5.
Combined judgement matrix using geometric means for the subcriteria of the criterion Availability of support.
| SUP1 | SUP2 | Weights | CR | |||||
|---|---|---|---|---|---|---|---|---|
| SUP1 | 1.000 | 1.000 | 1.000 | 2.466 | 4.718 | 6.804 | 0.810 | 0 |
| SUP2 | 0.147 | 0.212 | 0.405 | 1.000 | 1.000 | 1.000 | 0.190 | |
Table 6.
Combined judgement matrix using geometric means for the subcriteria of the criterion Impact of operation.
Table 6.
Combined judgement matrix using geometric means for the subcriteria of the criterion Impact of operation.
| IMP1 | IMP2 | Weights | CR | |||||
|---|---|---|---|---|---|---|---|---|
| IMP1 | 1.000 | 1.000 | 1.000 | 0.693 | 1.077 | 1.671 | 0.518 | 0 |
| IMP2 | 0.598 | 0.928 | 1.442 | 1.000 | 1.000 | 1.000 | 0.482 | |
Table 7.
Combined judgement matrix using geometric means for the subcriteria of the criterion Function.
Table 7.
Combined judgement matrix using geometric means for the subcriteria of the criterion Function.
| FUN1 | FUN2 | Weights | CR | |||||
|---|---|---|---|---|---|---|---|---|
| FUN1 | 1.000 | 1.000 | 1.000 | 0.500 | 0.794 | 1.554 | 0.428 | 0 |
| FUN2 | 0.644 | 1.260 | 2.000 | 1.000 | 1.000 | 1.000 | 0.572 | |
Table 8.
Combined judgement matrix using geometric means for the subcriteria of the criterion Failures.
Table 8.
Combined judgement matrix using geometric means for the subcriteria of the criterion Failures.
| FAI1 | FAI2 | FAI3 | FAI4 | Weights | CR | |||||||||
|---|---|---|---|---|---|---|---|---|---|---|---|---|---|---|
| FAI1 | 1.000 | 1.000 | 1.000 | 0.721 | 1.357 | 2.061 | 1.310 | 2.321 | 3.659 | 0.131 | 0.179 | 0.281 | 0.150 | 0 |
| FAI2 | 0.485 | 0.737 | 1.387 | 1.000 | 1.000 | 1.000 | 0.630 | 1.000 | 2.289 | 0.127 | 0.158 | 0.243 | 0.107 | |
| FAI3 | 0.273 | 0.431 | 0.763 | 0.437 | 1.000 | 1.587 | 1.000 | 1.000 | 1.000 | 0.116 | 0.127 | 0.172 | 0.087 | |
| FAI4 | 3.557 | 5.593 | 7.612 | 4.121 | 6.316 | 7.862 | 5.809 | 7.862 | 8.653 | 1.000 | 1.000 | 1.000 | 0.656 | |
Table 9.
Combined judgement matrix using geometric means for the subcriteria of the criterion Costs.
Table 9.
Combined judgement matrix using geometric means for the subcriteria of the criterion Costs.
| COS1 | COS2 | Weights | CR | |||||
|---|---|---|---|---|---|---|---|---|
| COS1 | 1.000 | 1.000 | 1.000 | 0.306 | 0.511 | 1.101 | 0.359 | 0 |
| COS2 | 0.909 | 1.957 | 3.271 | 1.000 | 1.000 | 1.000 | 0.641 | |
Table 10.
Pairwise comparison matrix resulting from the geometric mean between the decisions of the decision makers between the scale levels of the criterion Years since start-up.
Table 10.
Pairwise comparison matrix resulting from the geometric mean between the decisions of the decision makers between the scale levels of the criterion Years since start-up.
| Very Old Devices | Old Devices | Medium Age Devices | New Devices | Very New Devices | |||||||||||
|---|---|---|---|---|---|---|---|---|---|---|---|---|---|---|---|
| Very old devices | 1.000 | 1.000 | 1.000 | 1.000 | 3.000 | 5.000 | 2.449 | 4.472 | 6.481 | 4.472 | 6.481 | 8.485 | 5.916 | 7.937 | 9.000 |
| Old devices | 0.200 | 0.333 | 1.000 | 1.000 | 1.000 | 1.000 | 1.000 | 2.449 | 4.472 | 2.449 | 4.472 | 6.481 | 3.873 | 5.916 | 7.937 |
| Medium age devices | 0.154 | 0.224 | 0.408 | 0.224 | 0.408 | 1.000 | 1.000 | 1.000 | 1.000 | 1.000 | 2.449 | 4.472 | 1.732 | 3.873 | 5.916 |
| New devices | 0.118 | 0.154 | 0.224 | 0.154 | 0.224 | 0.408 | 0.224 | 0.408 | 1.000 | 1.000 | 1.000 | 1.000 | 1.000 | 2.449 | 4.472 |
| Very new devices | 0.111 | 0.126 | 0.169 | 0.126 | 0.169 | 0.258 | 0.169 | 0.258 | 0.577 | 0.224 | 0.408 | 1.000 | 1.000 | 1.000 | 1.000 |
Table 11.
Weightings of the scale levels of the other descriptors of the criterion Age of device.
| Scale Levels | Age of Technology | Scale Levels | Frequency of Change in Technology, Standards and Regulations |
|---|---|---|---|
| Old technology | 0.523 | Very high | 0.457 |
| Fairly old technology | 0.284 | High | 0.275 |
| Fairly new technology | 0.128 | Medium | 0.145 |
| New technology | 0.065 | Low | 0.078 |
| - | - | Very low | 0.045 |
Table 12.
Weightings of the scale levels of the descriptors of the criterion Availability of support.
Table 12.
Weightings of the scale levels of the descriptors of the criterion Availability of support.
| Scale Levels | Supplier Support | Scale Levels | Alternative Support Service |
|---|---|---|---|
| Very low | 0.529 | Null | 0.533 |
| Low | 0.281 | Low | 0.276 |
| Medium | 0.130 | High | 0.127 |
| High | 0.060 | Full | 0.064 |
Table 13.
Weightings of the scale levels of the descriptors of Impact of operation.
| Scale Levels | Use of Device | Scale Levels | Backup Devices |
|---|---|---|---|
| Very high | 0.461 | No stock | 0.548 |
| High | 0.276 | Low stock | 0.262 |
| Medium | 0.147 | High stock | 0.129 |
| Low | 0.075 | Full support | 0.060 |
| Very low | 0.040 | - | - |
Table 14.
Weightings of the scale levels of the descriptor of Staff preferences.
| Scale Levels | Staff Preferences |
|---|---|
| Very low level of satisfaction | 0.463 |
| Low level of satisfaction | 0.288 |
| Medium level of satisfaction | 0.139 |
| High level of satisfaction | 0.070 |
| Very high level of satisfaction | 0.040 |
Table 15.
Weightings of the scale levels of the descriptors of Failures.
| Scale Levels | Frequency of Failures | Scale Levels | Detectability of Failures | Scale Levels | Post-Failure Dead Time | Scale Levels | Impact of Failure on Patients |
|---|---|---|---|---|---|---|---|
| Very high frequency | 0.458 | Very low | 0.565 | Extremely high | 0.285 | Very high | 0.509 |
| High frequency | 0.277 | Low | 0.253 | Very high | 0.216 | High | 0.259 |
| Medium frequency | 0.142 | High | 0.121 | High | 0.162 | Medium | 0.139 |
| Low frequency | 0.078 | Very high | 0.061 | Medium high | 0.116 | Low | 0.059 |
| Very low frequency | 0.045 | - | - | Medium | 0.081 | Very low | 0.034 |
| - | - | - | - | Medium low | 0.056 | - | - |
| - | - | - | - | Low | 0.038 | - | - |
| - | - | - | - | Very low | 0.027 | - | - |
| - | - | - | - | Extremely low | 0.019 | - | - |
Table 16.
Weightings of the scale levels of the descriptors of Cost.
| Scale Levels | Maintenance Costs | Scale Levels | Expected Benefits |
|---|---|---|---|
| Unacceptable | 0.531 | High | 0.515 |
| High | 0.289 | Medium | 0.292 |
| Acceptable | 0.121 | Low | 0.129 |
| Low | 0.059 | Non-existent | 0.064 |
Table 17.
Top–down technique for the criterion Function.
| Combination | Service | Risk Category | Weight | Difference |
|---|---|---|---|---|
| 1 | Life support | Class III | 1 | - |
| 2 | Therapy | Class III | 0.713307 | 0.286693 |
| 3 | Diagnosis | Class III | 0.655358 | 0.057949 |
| 4 | Analysis | Class III | 0.623109 | 0.032249 |
| 5 | Analysis | Class IIb | 0.30334 | 0.319769 |
| 6 | Analysis | Class IIa | 0.152447 | 0.150893 |
| 7 | Analysis | Class I | 0.103216 | 0.049231 |
Table 18.
Top–down technique for the criterion Age of device.
| Combination | Years from Start-Up | Age of Technology | Frequency of Change in Technology, Standards of Rules | Weight | Different |
|---|---|---|---|---|---|
| 1 | Very old | Old | Very high | 1 | - |
| 2 | Very old | Old | High | 0.947852 | 0.052148 |
| 3 | Very old | Old | Medium | 0.910492 | 0.03736 |
| 4 | Very old | Old | Low | 0.891334 | 0.019158 |
| 5 | Very old | Old | Very low | 0.881686 | 0.009648 |
| 6 | Very old | Fairly old | Very low | 0.744558 | 0.137128 |
| 7 | Very old | Fairly new | Very low | 0.655519 | 0.089039 |
| 8 | Very old | New | Very low | 0.619375 | 0.036144 |
| 9 | Old | New | Very low | 0.375249 | 0.244126 |
| 10 | Medium age | New | Very low | 0.223709 | 0.15154 |
| 11 | New | New | Very low | 0.14162 | 0.082089 |
| 12 | Very new | New | Very low | 0.103697 | 0.037923 |
Table 19.
Top–down technique for the criterion Availability of support.
| Combination | Supplier Support | Availability of Alternative Support | Weight | Difference |
|---|---|---|---|---|
| 1 | Very low | Null | 1 | - |
| 2 | Very low | Low | 0.904062 | 0.095938 |
| 3 | Very low | High | 0.84829 | 0.055772 |
| 4 | Very low | Full | 0.824953 | 0.023337 |
| 5 | Low | Full | 0.449285 | 0.375668 |
| 6 | Medio | Full | 0.210578 | 0.238707 |
| 7 | High | Full | 0.115463 | 0.905115 |
Table 20.
Top–down technique for the criterion Impact of operation.
| Combination | Use | Backup Devices | Weight | Difference |
|---|---|---|---|---|
| 1 | Very high | No stock | 1 | - |
| 2 | High | No stock | 0.808992 | 0.191008 |
| 3 | Medium | No stock | 0.675864 | 0.133128 |
| 4 | Low | No stock | 0.602284 | 0.07358 |
| 5 | Very low | No stock | 0.566059 | 0.036225 |
| 6 | Very low | Low stock | 0.292658 | 0.273401 |
| 7 | Very low | High stock | 0.165464 | 0.127194 |
| 8 | Very low | Full backup | 0.0992519 | 0.0662121 |
Table 21.
Top–down technique for the criterion Staff preferences.
| Combination | Degree of Satisfaction | Weight | Difference |
|---|---|---|---|
| 1 | Very low | 1 | - |
| 2 | Low | 0.622107 | 0.377893 |
| 3 | Medio | 0.3004 | 0.321707 |
| 4 | High | 0.152139 | 0.148261 |
| 5 | Very high | 0.087417 | 0.064722 |
Table 22.
Top–down technique for the criterion.
| Combination | Failure Rate | Detectability | Post-Failure Dead Time | Impact on Patient | Weight | Difference |
|---|---|---|---|---|---|---|
| 1 | Very high | Very low | Extremely high | Very high | 1 | - |
| 2 | Very high | Very low | Very high | Very high | 0.987703 | 0.012297 |
| 3 | Very high | Very low | High | Very high | 0.978204 | 0.009499 |
| 4 | Very high | Very low | The results for the criterion high | Very high | 0.969943 | 0.008261 |
| 5 | Very high | Very low | Medio | Very high | 0.963729 | 0.006214 |
| 6 | Very high | Very low | Medium low | Very high | 0.959299 | 0.00443 |
| 7 | Very high | Very low | Low | Very high | 0.956238 | 0.003061 |
| 8 | Very high | Very low | Very low | Very high | 0.954184 | 0.002054 |
| 9 | Very high | Very low | Extremely low | Very high | 0.952796 | 0.001388 |
| 10 | High | Very low | Extremely low | Very high | 0.896862 | 0.055934 |
| 11 | Medium | Very low | Extremely low | Very high | 0.855527 | 0.041335 |
| 12 | Low | Very low | Extremely low | Very high | 0.835593 | 0.019934 |
| 13 | Very low | Very low | Extremely low | Very high | 0.82558 | 0.010013 |
| 14 | Very low | Low | Extremely low | Very high | 0.757388 | 0.068192 |
| 15 | Very low | High | Extremely low | Very high | 0.728303 | 0.029085 |
| 16 | Very low | Very high | Extremely low | Very high | 0.715281 | 0.013022 |
| 17 | Very low | Very high | Extremely low | High | 0.379452 | 0.335829 |
| 18 | Very low | Very high | Extremely low | Medium | 0.217504 | 0.161948 |
| 19 | Very low | Very high | Extremely low | Low | 0.110733 | 0.106771 |
| 20 | Very low | Very high | Extremely low | Very low | 0.0766287 | 0.0341043 |
Table 23.
Top–down technique for the criterion Costs associated with the device.
| Combination | Maintenance Costs | Expected Benefits | Weight | Difference |
|---|---|---|---|---|
| 1 | Unacceptable | High | 1 | - |
| 2 | High | High | 0.833022 | 0.166978 |
| 3 | Acceptable | High | 0.717155 | 0.115867 |
| 4 | Low | High | 0.674582 | 0.042573 |
| 5 | Low | Medium | 0.399393 | 0.275189 |
| 6 | Low | Low | 0.198891 | 0.200502 |
| 7 | Low | Non existent | 0.119722 | 0.079169 |
Table 24.
Results for the X-ray surgical C-arm device.
| Criterion | Valuation | Renewal Priority by Criterion |
|---|---|---|
| Function | 0.335588 | High |
| Age of device | 0.513247 | High |
| Availability of support | 0.837475 | Urgent |
| Impact of operation | 0.904496 | Urgent |
| Staff preferences | 0.432413 | High |
| Equipment failures or breakdowns | 0.429614 | Urgent |
| Costs associated with the devices | 0.341716 | Medium |
| Valuation: Global renewal priority: | 0.574723. High. The device should be replaced in the next financial year. | |
Table 25.
Results for X-ray CT room.
| Criterion | Valuation | Renewal Priority by Criterion |
|---|---|---|
| Function | 0.335588 | High |
| Age of device | 0.894502 | Urgent |
| Availability of support | 0.848682 | Urgent |
| Impact of operation | 0.904496 | Urgent |
| Staff preferences | 0.432413 | High |
| Equipment failures or breakdowns | 0.288108 | Urgent |
| Costs associated with the devices | 0.624561 | High |
| Valuation: Global renewal priority: | 0.680697 High. The device should be replaced in the next financial year. | |
Table 26.
Results for the defibrillator.
| Criterion | Valuation | Renewal Priority by Criterion |
|---|---|---|
| Function | 0.68023 | High |
| Age of device | 0.929172 | Urgent |
| Availability of support | 0.875466 | High |
| Impact of operation | 0.904496 | Urgent |
| Staff preferences | 0.432413 | High |
| Equipment failures or breakdowns | 0.768599 | Urgent |
| Costs associated with the devices | 0.299142 | Medium |
| Valuation: Global renewal priority: | 0.783709 Urgent. The device should be replaced in the current financial year. | |
Table 27.
Results for neonatal ventilator.
| Criterion | Valuation | Renewal Priority by Criterion |
|---|---|---|
| Function | 1 | Urgent |
| Age of device | 0.986963 | Urgent |
| Availability of support | 0.917498 | Urgent |
| Impact of operation | 0.516778 | Medium |
| Staff preferences | 0.432413 | High |
| Equipment failures or breakdowns | 0.775429 | Urgent |
| Costs associated with the devices | 0.457583 | High |
| Valuation: Global renewal priority: | 0.762975 Urgent. The device should be replaced in the current financial year. | |
Table 28.
Results for video colonoscope.
| Criterion | Valuation | Renewal Priority by Criterion |
|---|---|---|
| Function | 0.102 | Low |
| Age of device | 0.145 | Low |
| Availability of support | 0.829 | High |
| Impact of operation | 0.073 | Low |
| Staff preferences | 0.357 | High |
| Equipment failures or breakdowns | 0.023 | Low |
| Costs associated with the devices | 0.043 | Low |
| Valuation: Global renewal priority: | 0.151 Review device in next two financial years. | |
Table 29.
Sensitivity analysis for neonatal ventilator.
| Original Use | 0.680697 | ||
|---|---|---|---|
| Function | |||
| Variation +10% | Variation −10% | ||
| Use | Deviation (%) | Use | Deviation (%) |
| 0.767837 | 0.64% | 0.758424 | −0.60% |
| Age of device | |||
| Variation +10% | Variation −10% | ||
| Use | Deviation (%) | Use | Deviation (%) |
| 0.771494 | 1.12% | 0.754766 | −1.08% |
| Availability support | |||
| Variation +10% | Variation −10% | ||
| Use | Deviation (%) | Use | Deviation (%) |
| 0.764338 | 0.18% | 0.761923 | −0.14% |
| Impact of operation | |||
| Variation +10% | Variation −10% | ||
| Use | Deviation (%) | Use | Deviation (%) |
| 0.757013 | −0.78% | 0.769248 | 0.82% |
| Staff preferences | |||
| Variation +10% | Variation −10% | ||
| Use | Deviation (%) | Use | Deviation (%) |
| 0.760593 | −0.31% | 0.765668 | 0.35% |
| Equipment failures or breakdowns | |||
| Variation +10% | Variation −10% | ||
| Use | Deviation (%) | Use | Deviation (%) |
| 0.763879 | 0.12% | 0.762382 | −0.08% |
| Costs associated with the devices | |||
| Variation +10% | Variation −10% | ||
| Use | Deviation (%) | Use | Deviation (%) |
| 0.761012 | −0.26% | 0.765248 | 0.30% |
Table 30.
Sensitivity analysis for defibrillator.
| Original Use | 0.783709 | ||
|---|---|---|---|
| Function | |||
| Variation +10% | Variation −10% | ||
| Use | Deviation (%) | Use | Deviation (%) |
| 0.782693 | −0.13% | 0.783322 | −0.05% |
| Age of device | |||
| Variation +10% | Variation −10% | ||
| Use | Deviation (%) | Use | Deviation (%) |
| 0.790419 | 0.86% | 0.775595 | −1.04% |
| Availability support | |||
| Variation +10% | Variation −10% | ||
| Use | Deviation (%) | Use | Deviation (%) |
| 0.784127 | 0.05% | 0.781887 | −0.23% |
| Impact of operation | |||
| Variation +10% | Variation −10% | ||
| Use | Deviation (%) | Use | Deviation (%) |
| 0.789011 | 0.68% | 0.777004 | −0.86% |
| Staff preferences | |||
| Variation +10% | Variation −10% | ||
| Use | Deviation (%) | Use | Deviation (%) |
| 0.780713 | −0.38% | 0.785302 | 0.20% |
| Equipment failures or breakdowns | |||
| Variation +10% | Variation −10% | ||
| Use | Deviation (%) | Use | Deviation (%) |
| 0.784083 | 0.05% | 0.781932 | −0.23% |
| Costs associated with the devices | |||
| Variation +10% | Variation −10% | ||
| Use | Deviation (%) | Use | Deviation (%) |
| 0.779864 | −0.49% | 0.786151 | 0.31% |
Table 31.
Sensitivity analysis for X-ray surgical C-arm device.
| Original Use | 0.574723 | ||
|---|---|---|---|
| Function | |||
| Variation +10% | Variation −10% | ||
| Use | Deviation (%) | Use | Deviation (%) |
| 0.570248 | −0.78% | 0.577359 | 0.46% |
| Age of device | |||
| Variation +10% | Variation −10% | ||
| Use | Deviation (%) | Use | Deviation (%) |
| 0.572877 | −0.32% | 0.57473 | 0.00% |
| Availability support | |||
| Variation +10% | Variation −10% | ||
| Use | Deviation (%) | Use | Deviation (%) |
| 0.575673 | 0.17% | 0.571934 | −0.49% |
| Impact of operation | |||
| Variation +10% | Variation −10% | ||
| Use | Deviation (%) | Use | Deviation (%) |
| 0.584366 | 1.68% | 0.563241 | −2.00% |
| Staff preferences | |||
| Variation +10% | Variation −10% | ||
| Use | Deviation (%) | Use | Deviation (%) |
| 0.572858 | −0.32% | 0.574749 | 0.00% |
| Equipment failures or breakdowns | |||
| Variation +10% | Variation −10% | ||
| Use | Deviation (%) | Use | Deviation (%) |
| 0.572077 | −0.46% | 0.575529 | 0.14% |
| Costs associated with the devices | |||
| Variation +10% | Variation −10% | ||
| Use | Deviation (%) | Use | Deviation (%) |
| 0.572226 | −0.43% | 0.57538 | 0.11% |
Table 32.
Sensitivity analysis for X-ray CT room.
| Original Use | 0.680697 | ||
|---|---|---|---|
| Function | |||
| Variation +10% | Variation −10% | ||
| Use | Deviation (%) | Use | Deviation (%) |
| 0.675015 | −0.83% | 0.684753 | 0.60% |
| Age of device | |||
| Variation +10% | Variation −10% | ||
| Use | Deviation (%) | Use | Deviation (%) |
| 0.688758 | 1.18% | 0.67101 | −1.42% |
| Availability support | |||
| Variation +10% | Variation −10% | ||
| Use | Deviation (%) | Use | Deviation (%) |
| 0.681342 | 0.09% | 0.678426 | −0.33% |
| Impact operation | |||
| Variation +10% | Variation −10% | ||
| Use | Deviation (%) | Use | Deviation (%) |
| 0.688224 | 1.11% | 0.671544 | −1.34% |
| Staff preferences | |||
| Variation +10% | Variation −10% | ||
| Use | Deviation (%) | Use | Deviation (%) |
| 0.678281 | −0.35% | 0.681487 | 0.12% |
| Equipment failures or breakdowns | |||
| Variation +10% | Variation −10% | ||
| Use | Deviation (%) | Use | Deviation (%) |
| 0.674816 | −0.86% | 0.684952 | 0.63% |
| Costs associated with the devices | |||
| Variation +10% | Variation −10% | ||
| Use | Deviation (%) | Use | Deviation (%) |
| 0.679933 | −0.11% | 0.679835 | −0.13% |
Table 33.
Sensitivity analysis for video colonoscope.
| Original Use | 0.151 | ||
|---|---|---|---|
| Function | |||
| Variation +10% | Variation −10% | ||
| Use | Deviation (%) | Use | Deviation (%) |
| 0.150 | −0.66% | 0.152 | 0.66% |
| Age of device | |||
| Variation +10% | Variation −10% | ||
| Use | Deviation (%) | Use | Deviation (%) |
| 0.150 | −0.66% | 0.151 | 0% |
| Availability support | |||
| Variation +10% | Variation −10% | ||
| Use | Deviation (%) | Use | Deviation (%) |
| 0.154 | 1.99% | 0.147 | −2.65% |
| Impact operation | |||
| Variation +10% | Variation −10% | ||
| Use | Deviation (%) | Use | Deviation (%) |
| 0.148 | −1.99% | 0.153 | 1.32% |
| Staff preferences | |||
| Variation +10% | Variation −10% | ||
| Use | Deviation (%) | Use | Deviation (%) |
| 0.152 | 0.66% | 0.149 | −1.32% |
| Equipment failures or breakdowns | |||
| Variation +10% | Variation −10% | ||
| Use | Deviation (%) | Use | Deviation (%) |
| 0.149 | −1.32% | 0.153 | 1.32% |
| Costs associated with the devices | |||
| Variation +10% | Variation −10% | ||
| Use | Deviation (%) | Use | Deviation (%) |
| 0.150 | −0.66% | 0.152 | 0.66% |
© 2020 by the authors. Licensee MDPI, Basel, Switzerland. This article is an open access article distributed under the terms and conditions of the Creative Commons Attribution (CC BY) license (http://creativecommons.org/licenses/by/4.0/).
Share and Cite
MDPI and ACS Style
Domínguez, S.; Carnero, M.C. Fuzzy Multicriteria Modelling of Decision Making in the Renewal of Healthcare Technologies. Mathematics 2020, 8, 944. https://doi.org/10.3390/math8060944
AMA Style
Domínguez S, Carnero MC. Fuzzy Multicriteria Modelling of Decision Making in the Renewal of Healthcare Technologies. Mathematics. 2020; 8(6):944. https://doi.org/10.3390/math8060944
Chicago/Turabian StyleDomínguez, Sergio, and María Carmen Carnero. 2020. "Fuzzy Multicriteria Modelling of Decision Making in the Renewal of Healthcare Technologies" Mathematics 8, no. 6: 944. https://doi.org/10.3390/math8060944
Note that from the first issue of 2016, this journal uses article numbers instead of page numbers. See further details here.