

Mathematical Model Predicting the Kinetics of Intracellular LCMV Replication
by
 , , , , and
Julia Sergeeva
1,2,†,
Dmitry Grebennikov
3,4,5,†,
Valentina Casella
6 ,
,
Paula Cebollada Rica
6,
Andreas Meyerhans
6,7 and
Gennady Bocharov
3,4,8,* 1
Moscow Institute of Physics and Technology (National Research University), 141700 Dolgoprudny, Russia
2
Skolkovo Institute of Science and Technology, 121205 Moscow, Russia
3
Marchuk Institute of Numerical Mathematics of the RAS, 119333 Moscow, Russia
4
Moscow Center of Fundamental and Applied Mathematics at INM RAS, 119234 Moscow, Russia
5
World-Class Research Center “Digital Biodesign and Personalized Healthcare”, Sechenov First Moscow State Medical University, 119991 Moscow, Russia
6
Infection Biology Laboratory, Universitat Pompeu Fabra, 08003 Barcelona, Spain
7
ICREA, Pg. Lluis Companys 23, 08010 Barcelona, Spain
8
Institute for Computer Science and Mathematical Modelling, Sechenov First Moscow State Medical University, 119991 Moscow, Russia
*
Author to whom correspondence should be addressed.
†
These authors contributed equally to this work.
Mathematics 2023, 11(21), 4454; https://doi.org/10.3390/math11214454
Submission received: 28 September 2023
/
Revised: 19 October 2023
/
Accepted: 25 October 2023
/
Published: 27 October 2023
(This article belongs to the Special Issue Mathematical Modeling and Analysis of Problems in Ecology, Epidemiology and Oncology)
Abstract
:The lymphocytic choriomeningitis virus (LCMV) is a non-cytopathic virus broadly used in fundamental immunology as a mouse model for acute and chronic virus infections. LCMV remains a cause of meningitis in humans, in particular the fatal LCMV infection in organ transplant recipients, which highlights the pathogenic potential and clinical significance of this neglected human pathogen. Paradoxically, the kinetics of the LCMV intracellular life cycle has not been investigated in detail. In this study, we formulate and calibrate a mathematical model predicting the kinetics of biochemical processes, including the transcription, translation, and degradation of molecular components of LCMV underlying its replication in infected cells. The model is used to study the sensitivity of the virus growth, providing a clear ranking of intracellular virus replication processes with respect to their contribution to net viral production. The stochastic formulation of the model enables the quantification of the variability characteristics in viral production, probability of productive infection and secretion of protein-deficient viral particles. As it is recognized that antiviral therapeutic options in human LCMV infection are currently limited, our results suggest potential targets for antiviral therapies. The model provides a currently missing building module for developing multi-scale mathematical models of LCMV infection in mice.
Keywords:
LCMV; intracellular replication; mathematical model; stochastic description; sensitivity analysisMSC:
92-10; 92B05; 92C45; 92C701. Introduction
Infectious diseases caused by viruses (e.g., HIV-1, HBV or SARS-CoV-2) present a serious problem to human health worldwide. To understand their pathogenesis, infections are studied experimentally and by mathematical modelling approaches. The current technologies including multiplex analyses, microscopic and mesoscopic visualization; “omics-” technologies and bioinformatic analyses now allow for a multi-physics assessment of the processes regulating virus–host interactions at molecular-, cellular-, and systemic levels [1,2,3]. However, the adequate construction of mathematical models for studying the course and outcome of infectious diseases in terms of the description details to the level of understanding of its structure and functional components remains to be a great challenge. Indeed, models need to consider (1) virus replication at a single cell level, (2) spatial infection spreading across cell populations and (3) the systemic dynamics of disease characteristics. At present, mostly the population dynamics of antiviral immune responses has received substantial attention (e.g., [4,5,6]), while the development of integrative models is in its infancy. The latter requires models of intracellular virus life cycles, as single infected cells are the initiating and fuelling events in systemic virus spreading and key targets for combination therapies.
The lymphocytic choriomeningitis virus (LCMV) is a non-cytopathic virus broadly used in fundamental immunology as a mouse model for acute and chronic virus infections [7]. Based on the experimental LCMV infection model system, many conceptual discoveries in immunology have been made ranging from Major Histocompatibility Complex (MHC)-mediated immunological restriction to T-lymphocyte exhaustion (we refer to [8] for a comprehensive overview). Surprisingly, the intracellular kinetics of LCMV replication remains poorly understood. Modern experimental developments have enabled a high-dimensional characterization of LCMV infection across a number of scales [9,10]. To quantitatively describe, analyse and predict the LCMV-host interaction under various manipulations, consistent multi-scale mathematical models are required. So far, the population dynamics of CTL responses to LCMV infection were considered [8,11]. However, a quantitative understanding of the LCMV life cycle is lacking.
1.1. Molecular and Genome Structure of LCMV
LCMV has a bi-segmented, linear, negative strand RNA genome ((-)RNA) with ambisense coding of the viral proteins [12]. The ambisense coding strategy implies that virus proteins are coded in different directions (+polarity and -polarity). This means that the gene encoded on the -RNA strand needs to be transcribed into the +strand before it could be translated into protein. This type of coding strategy is believed to enable the temporal control of gene expression by regulating the two genes of an ambisense RNA segment differently.
The organization of LCMV is shown in Figure 1.
The LCMV RNA genome consists of two single-stranded RNA species: large L (7.2 kb) [13] and small S (3.4 kb) [14]. Each segment carries two viral genes in opposite orientation and is separated by an intergenic noncoding region (IGR) [15,16]. The IGR forms a relatively stable stem-loop structure, which functions as a transcription terminator and in virus assembly [17]. All proteins are translated from subgenomic viral-complementary mRNAs.
The L segment encodes the L protein (200 kDa) and the Z protein (11 kDa). The L protein is a RNA-dependent RNA polymerase (RdRp). It produces subgenomic mRNAs as well as full-length genomic and antigenomic RNAs via transcription and replication [18]. The viral RNA polymerase RdRp generates mostly encapsidated, uncapped full length (+)strand and (-)strand RNA species. The encapsidated RNAs are the templates for the synthesis of subgenomic, capped and non-polyadenylated mRNAs that are translated into viral proteins.
The Z protein is a matrix protein with multiple essential functions. In large concentrations, it inhibits replication and transcription by direct association with RdRp [19,20], facilitating assembly. Z plays a significant role in viral budding [21]: it interacts with the cellular ESCRT machinery and with virion components [22], and thus mediates their incorporation into nascent virions. In addition, Z interacts with several host cell proteins, such as the oncoprotein promyelocytic leukemia protein (PML), ribosomal P proteins, and the eukaryotic translation initiation factor 4E (eIF-4E) [23,24,25].
The S segment encodes the virus nucleoprotein (NP) and the glycoprotein precursor (GP-C). The NP protein associates with the viral RNA genome to form the nucleocapsid. This interacts with the viral polymerase and constitutes the viral ribonucleoprotein (RNP). This complex mediates transcription and replication, and is considered as the minimum unit of LCMV infectivity. NP availability determines the transition of the polymerase from transcription to replication by attenuating the structure-dependent transcription termination of the intergenome region (IGR) located between the encoded genes [26].
GP-Cs undergo post-translational modifications, which include glycosylation and then proteolytic cleavages. Firstly, the stable signal peptide (SSP) is cleaved within the endoplasmic reticulum by a cellular signal peptidase. This 58-amino-acid long SSP is then retained as a stable subunit. It is a critical component for downstream, mature glycoprotein complex formation [27]. In addition, SSP interacts with the immature GP1/2 precursor, which is cleaved by the cellular protease SKI-1/S1P in the Golgi complex to produce the GP1 and GP2 subunits [28]. The three subunits, SSP, GP1, and GP2, then traffic to the cellular plasma membrane where virus assembly and egress occurs. GP-1, GP-2 and SSP associate non-covalently. They form club-shaped projections on virions and mediate cell entry. GP-1 is a peripheral membrane protein and is responsible for binding to the virus receptor -Dystroglycan (-DG) [29]. GP-2 is an integral membrane protein and it, in concert with SSP, mediates the fusion of the viral envelope with the cellular membrane.
1.2. Intracellular Replication of LCMV
The LCMV life cycle starts with the infection of target cells. For this, the virion surface GP-1 protein interacts with cell surface -DG that is mainly expressed on dendritic cells (DCs) [30,31,32]. The virion then enters target cells via non-coated vesicles that direct it to late endosomes [33,34,35]. This internalization process is cholesterol-dependent but clathrin-independent. At the late endosomes, a pH-dependent fusion between virion and endosome membranes occurs which releases virus genomic RNAs and L proteins into the cytoplasm. The L protein then initiates virus genome replication and viral mRNA generation. Subsequent translation of NP, L and Z mRNAs occurs in the cytoplasm while GPC mRNA is translated at the endoplasmic reticulum. The precursor GPC protein is post-translationally cleaved in the Golgi apparatus into the stable signal peptide SSP and the glycoproteins GP-1 and GP-2. The increase in Z protein concentration leads to the inhibition of the L polymerase and a shift towards virus assembly and release. The genomic RNAs are coated with NP proteins and transported with GP, Z and L proteins to the cell membrane, where virions are assembled and released from the infected cell by budding. The overall scheme of the intracellular LCMV replication stages is presented in Figure 2. The scheme is used to formulate the mathematical model of the LCMV life cycle.
In Section 2, we present the reference data available for model calibration and the computation tools used for simulations and analysis. In Section 3, the mathematical model is constructed both in deterministic and stochastic formulations. Section 4 presents the model-based prediction of the parameter sensitivity of net single cell LCMV production and the characteristics of the variability in viral production, including the secretion of protein-deficient viral particles. The study results are discussed in Section 5.
2. Experimental Data and Methods
2.1. Kinetics of Virion Components in the Cell
Experiments on the kinetics of LCMV were examined in [19]. RNAs were isolated at 6 time points between 0 and 72 h after infection, and the NP mRNA, Z mRNA, L RNA, and S RNA levels were analyzed using Northern blot hybridization. The level of the Z protein was analyzed by Western blotting. Some qualitative conclusions can be drawn from these experiments:
- At all time points, the number of S RNA was significantly larger than L RNA. During the first hours of infection, S RNA was observed in large numbers, whereas L RNA abundance was characterized by undetectable numbers;
- NP mRNA reaches peak concentration in the early hours of cell infection;
- Z mRNA and Z protein concentrations increase at the end of the virus life cycle.
The growth curves, i.e., the time-dependence of the number of virions released from the infected cells in an in vitro culture, were obtained in a number of studies [34,36,37,38]. To obtain the kinetics of virion production per cell, growth curves were normalized by dividing the growth curve values by the respective MOI and the estimated total number of cells in the plate, assuming that all cells were infected simultaneously at the beginning, and no secondary infection occurred. The following re-scaling formula was used:
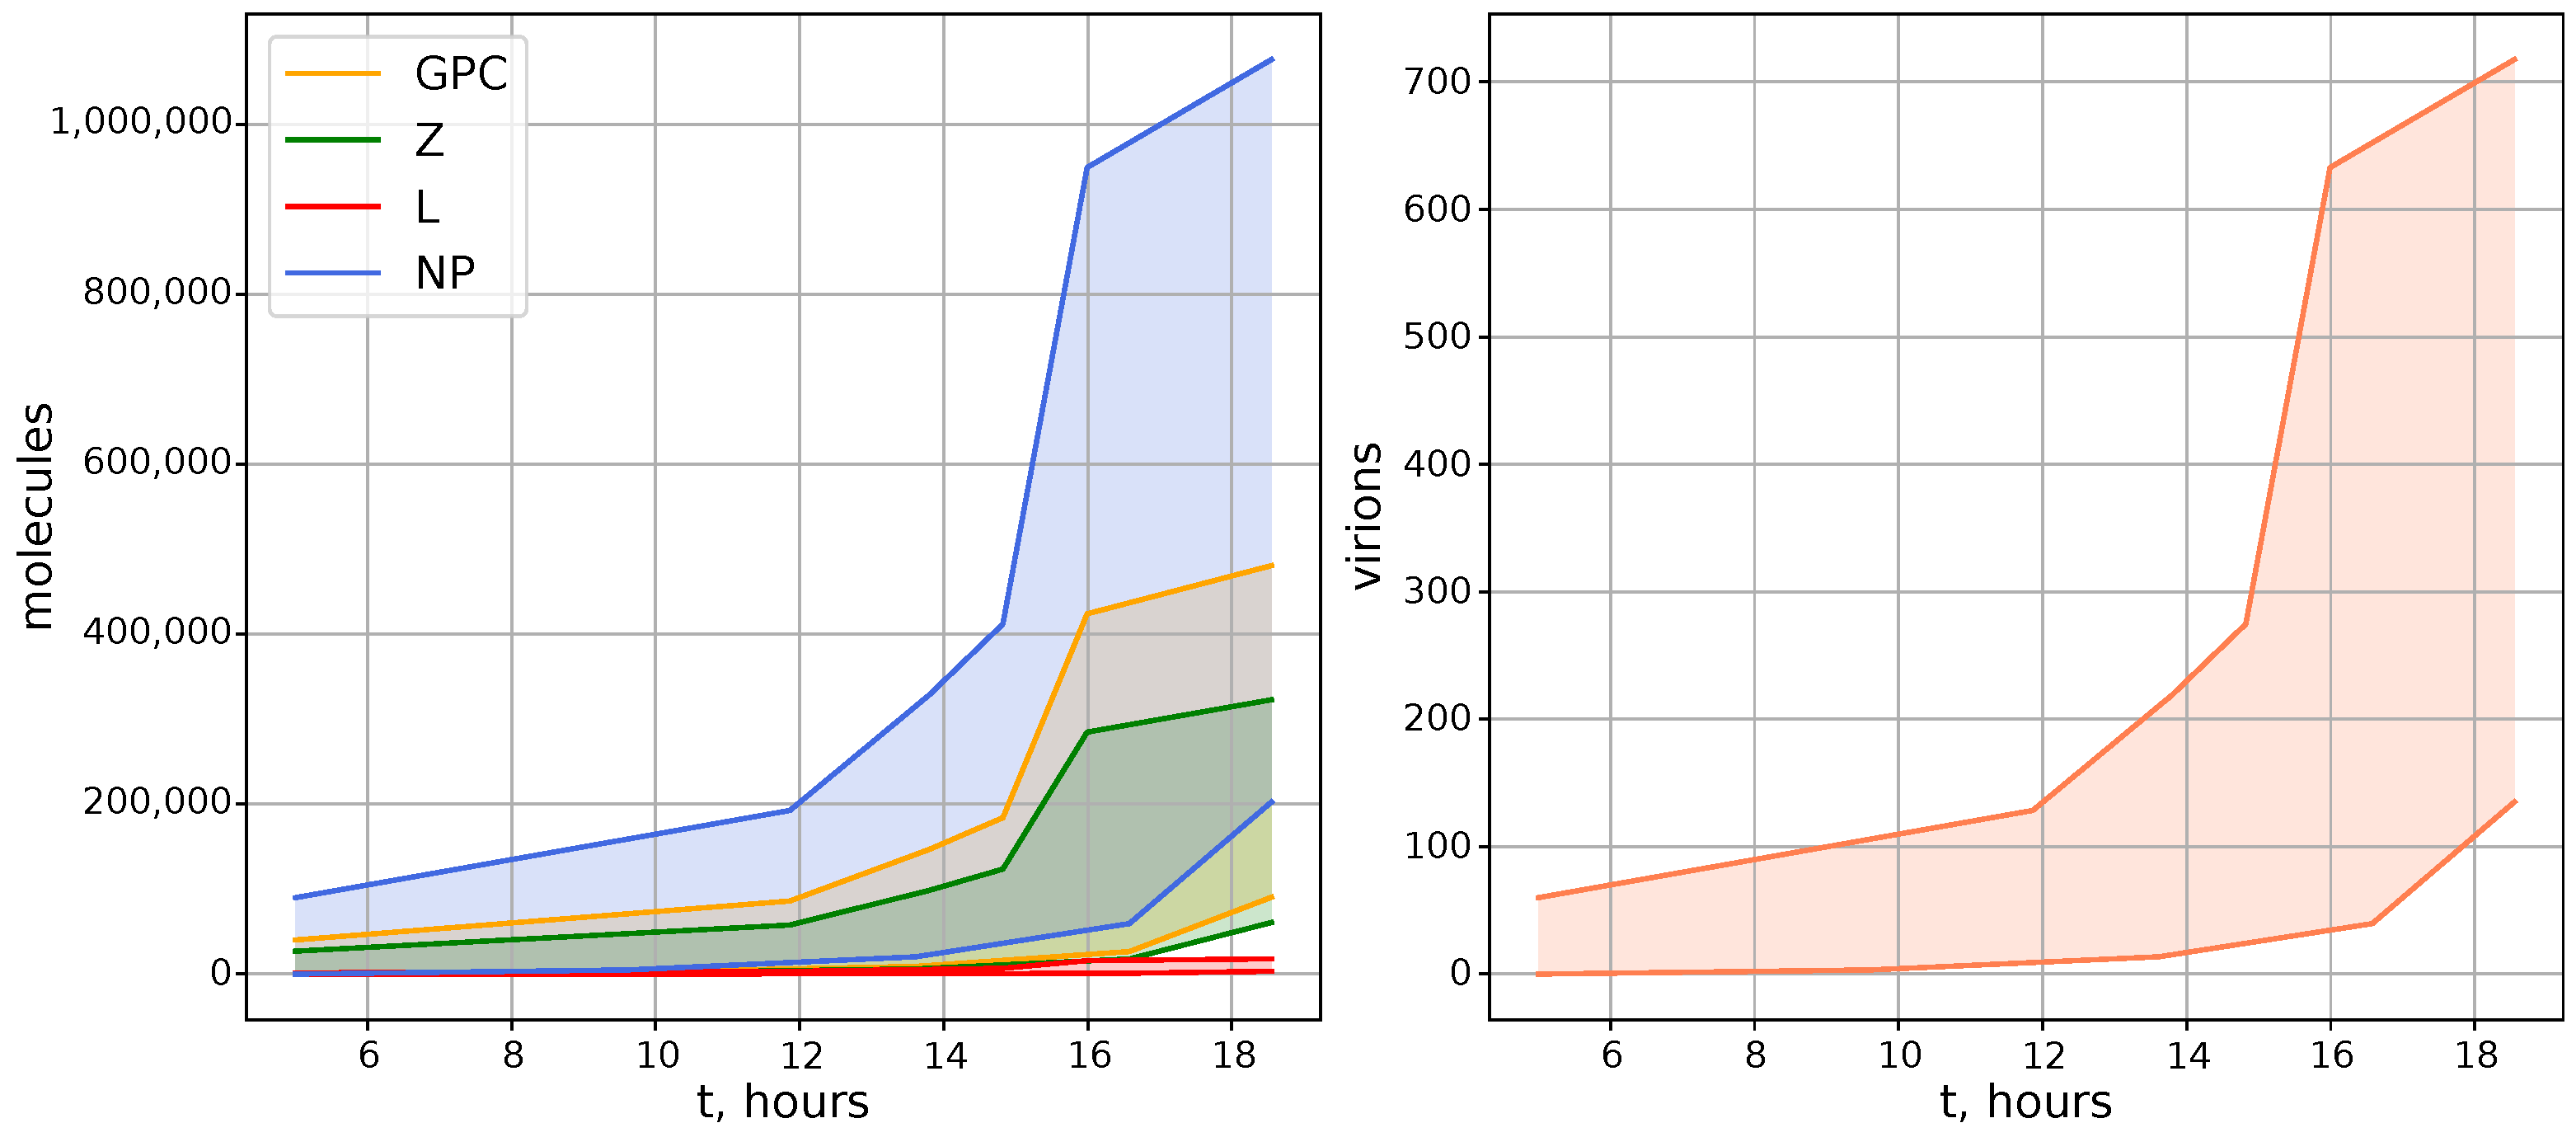
where is the number of virions per cell, stands for the number of virions in the entire culture, and MOI is the multiplicity of infection. According to the known ratios of protein concentrations during infection in the cell for the arenavirus family [39], and the numbers of each protein in the LCMV virion [40], one can generate the expected curves for proteins. To do this, the growth curves must be multiplied by the number of proteins. From the obtained kinetic curves and the known quantitative data, the following general conclusions can be drawn:
- At the end of the life cycle, the expected number of LCMV virions is estimated to be about several hundreds;
- The ratio of protein components should be as follows: NP > GPC > Z > L;
- The LCMV life cycle lasts from 20 to 40 h.
The resulting empirical data summarized in Figure 3 were used to calibrate the model solution .
2.2. Z Protein-Mediated Inhibition Kinetics
A number of studies explore the kinetics and mechanisms of Z-protein-based regulation [19,20,41]. As previously described, Z inhibits RNA-dependent RNA polymerase L at high concentrations, which leads to the inhibition of transcription and replication and promotes the transition to assembly and budding. According to [20], it is known from studies of Machupo virus (MACV), another arenavirus, that untagged MACV Z inhibits the viral RNA synthesis in the mid-nanomolar range ( 0.32 M), and GST-tagged MACV Z has a slightly higher (1.36 M), due to an altered protein solubility. It can be assumed for LCMV that Z protein-inhibition occurs over the same concentration range. Multiplied by the characteristic cell volume (1 pL), the number of Z molecules required for half-maximal inhibition can be estimated as molecules for Machupo virus. Based on the above arguments, we take the inhibition constant for LCMV as molecules.
2.3. Basic Computational Tools
The following libraries in Julia language were used to simulate and analyze the model: DifferentialEquations v7.10.0 (numerical solution of the deteministic model), SciMLSensitivity v7.46.0 (local sensitivity analysis), JumpProcesses v9.8.0 (numerical solution of the stochastic model), PyPlot v2.11.2 and Plots v1.39.0 (visualizations).
2.4. Stochastic Modelling Algorithm
The deterministic model of LCMV replication described by a system of ODEs is translated into a stochastic Markov chain-based description following the dynamic Monte Carlo approach. To implement the dynamic MC description numerically, a number of methods (stochastic simulation algorithms) are available, including the popular Gillespie’s direct method [42,43] and a number of exact and approximate SSA variations [44]. Previously, we proposed the hybrid stochastic-deterministic approximate method [45] to accelerate computations. Here, we use the rejection SSA (RSSA) with composition-rejection search (RSSA-CR) [46] implemented in JumpProcesses Julia library. In contrast to Gillespie’s direct method, the rejection-based SSA delays the need to update the propensity rates (which is conducted after each transition in the direct method), which can be time-consuming for systems with many complex nonlinear processes.
Table 1 lists the propensities of all transitions that take place in the Markov chain-based stochastic system. The variables of the stochastic model can have only nonnegative integer values. The transitions correspond to increments and decrements of variable values by one unit (particle or molecule), except for the transition processes number 15 and 18 (which correspond to and formation) and the process number 38 (which corresponds to virion assembly with production of ). In these transitions, the number of NP, GPC, Z and L proteins is reduced by , , and , which are the number of protein molecules required for packing the ribonucleocapsids and for the assembly of LCMV virions. Therefore, if the current number of molecules in the cell is less than the required amount for these events, the ribonucleocapsids and the assembled virions are packed with an incomplete number of constitutive protein molecules, while the corresponding protein molecules in the cell are reduced to zero, as indicated in Table 1. This MC formulation allows us to analyse the production kinetics and protein content distribution in protein-deficient particles (see Section 4.5).
2.5. Sensitivity Analysis
To examine the relationship between the net production of LCMV and the parameters of the intracellular biochemical reactions, we used the sensitivity analysis. Two characteristics of the virus net growth were considered: (i) The cumulative number of released virions and (ii) the total number of new virions secreted by an infected cell during time T (20 h) from the beginning of infection (thus, disregarding their degradation). The first one is denoted as and is calculated as an area under the model solution component curve, i.e., the integral of the solution component with respect to the time variable t on an interval . The second characteristic is denoted and is calculated as the integral of the release rate of assembled virions . Computationally, we follow our previous approach [47] to analyse the local sensitivity of the total number of released virions, i.e., functional , and the total number of produced virions, functional , for h. The local sensitivity analysis was performed via the adjoint equations method implemented in Julia using the DiffEqSensitivity library. To compare contributions of the biochemical processes, the sensitivity coefficients were multiplied by the corresponding parameter values. The results were ranked by decreasing absolute values and visualized as histograms (separately for negative and positive derivatives).
3. Mathematical Model
In this section, we present the deterministic ODE-based model of the LCMV life cycle by adapting the approach used in our previous work, which focused on modeling the ontogeny of another RNA virus, namely SARS-CoV-2 [48]. The notation for the time-dependent variables is introduced that is lately used for the formulation of the stochastic model. The calibrated deterministic model parameters and functional forms of the calibrated reaction kinetics are transformed into the propensities of the respective transitions of the MCMC-based stochastic model, as described in Section 2.4.
3.1. Deterministic Model of Intracellular LCMV Replication
The LCMV life cycle shown in Figure 2 suggests the following set of time-dependent variables listed in Table 2. The ordinary differential equations (ODEs) are used to model the key replication steps, which include: (a) cell entry, (b) replication, (c) transcription, (d) translation of proteins, and (e) assembly and release of virions. The system of equations was formulated using the basic principles of chemical kinetics, especially the mass action law and Michaelis–Menten parameterization for describing the assembly, coating, replication and transcription processes.

Table 2.
Time-dependent variables and their biochemical meaning.
| Free virions outside the cell membrane | |
| Virions bound to -DG receptor | |
| Virions in endosomes | |
| L negative genomic RNAs, released from virions, that infect the cell | |
| S negative genomic RNAs, released from virions, that infect the cell | |
| L positive genomic RNAs | |
| S positive genomic RNAs | |
| L negative genomic RNAs | |
| S negative genomic RNAs | |
| NP RNAs | |
| GPC RNAs | |
| Z RNAs | |
| L RNAs | |
| NP proteins | |
| Z proteins | |
| L proteins | |
| GPC proteins | |
| coated with NP | |
| coated with NP | |
| Assembled virions in endosomes | |
| Virions released via exocytosis |
3.2. Cell Entry
The rate of change of the number of free, bound and endosome virions is described by the following three ODEs.
The first term describes binding free virions to the receptor; it means that become with constant . The second one corresponds to free virion degradation with constant . The last term depicts the dissociation of bound virions from the receptor; it means that become with rate constant .
The first term describes binding free virions to the receptor; it means that become with constant . The second term explains the fusion of bound virions; it means that become with constant . The third term depicts dissociation of bound virions from the receptor; it means that become with constant . The last term illustrates the degradation rate of bound virions with constant .
The first term describes the fusion of bound virions; it means that become with constant . The second term explains the uncoating of virions in endosomes; it means that uncoat with constant ; thus, the number of virions in endosomes decreases. The last term depicts the degradation of viruses in endosomes with constant .
3.3. Replication of Genomic RNAs
The rate of change of the number of L negative genomic RNAs, S negative genomic RNAs, L positive genomic RNAs, L positive genomic RNAs, L negative genomic RNAs and S negative genomic RNAs is modelled using the equations listed below.
The first term describes the uncoating of viruses in endosomes; it results in the decline and appearance of with constant . The second term depicts the degradation of with the rate constant .
The first term describes the uncoating of viruses in endosomes; it results in decline and appearance of with constant . The second term depicts degradation of with constant .
The first term describes replication; L protein (RdRp) produces using as a template in the Michaelis–Menten type of reaction with constant and (Michaelis constant—concentration of RNA at which the reaction rate is half-maximal). Also, the term is normalized by the length of the L segment ; since we obtain the length of the synthesized chain in nucleotides to obtain the number of copies, we need to divide by the length of the chain. The second term describes the degradation of with constant .
The first term describes replication; the initial L protein (RdRp) produces using as a template in reaction with constant . Also, the term is normalized by the length of the S segment ; since we obtain the length of the synthesized chain in nucleotides to obtain the number of copies, we need to divide by the length of the chain. The second term describes the degradation rate of with constant .
The first term describes replication; the initial L protein (RdRp) produces using as a template with constant . Also, this term is multiplied by . It indicates that Z inhibits L. Then, the term is normalized by the length of the L segment , since we obtain the length of the synthesized chain in nucleotides to obtain the number of copies, we need to divide by the length of the chain. The second term explains the degradation rate of with constant . The third term depicts the coating of RNA with a NP protein; the number of declines because it is coated with NP protein in the Michaelis–Menten type of reaction with reaction constant and (Michaelis constant—concentration of NP protein at which the reaction rate is half-maximal). The following notation is used for taking into account saturation effects:
In the above equation, the first term describes replication; the L protein (RdRp) produces using as a template in the Michaelis–Menten type of reaction with constant and (Michaelis constant—concentration of RNA at which the reaction rate is half-maximal). Also, this term is multiplied by . It indicates that Z inhibits L. Also, the term is normalized by the length of the S segment ; since we obtain the length of the synthesized chain in nucleotides, to obtain the number of copies, we need to divide by the length of the chain. The second term describes the degradation of with constant . The last term depicts the coating of RNA with NP protein, declines, because it coats with the NP protein in the Michaelis–Menten type of reaction with reaction constant and (Michaelis constant—concentration of NP protein at which the reaction rate is half-maximal).
3.4. Transcription
To describe the transcription of matrix RNAs, the following equations are used.
The first term accounts for transcription; the L protein (RdRp) produces NP RNA using as a template in the Michaelis–Menten type of reaction with constant and (Michaelis constant—concentration of RNA at which the reaction rate is half-maximal). Also, the term is normalized by the length of the NP RNA , since we obtain the length of the synthesized chain in nucleotides; to obtain the number of RNAs, we need to divide by the length of the RNA. In addition, this term is multiplied by . It indicates that Z inhibits L. The second term is responsible for the degradation of NP RNA with rate constant .
The first term corresponds to transcription; the L protein (RdRp) produces GPC RNA using as a template in the Michaelis–Menten type of reaction with constant and (Michaelis constant—concentration of RNA at which the reaction rate is half-maximal). Also, this term is multiplied by . It indicates that Z inhibits L. Also, the term is normalized by the length of the GPC RNA , since we obtain the length of the synthesized chain in nucleotides; to obtain the number of RNAs, we need to divide by the length of the RNA. The second term depicts the degradation rate of GPC RNA with constant .
The first term accounts for transcription; the L protein (RdRp) produces Z RNA using as a template in the Michaelis–Menten type of reaction with constant and (Michaelis constant—concentration of RNA at which the reaction rate is half-maximal). Also, this term is multiplied by . It indicates that Z inhibits L. Also, the term is normalized by the length of the Z RNA , since we obtain the length of the synthesized chain in nucleotides; to obtain the number of RNAs, we need to divide by the length of the RNA. The second term is responsible for the degradation of Z RNA with constant .
The first term describes transcription; the L protein (RdRp) produces L RNA using as a template in the Michaelis–Menten type of reaction with constant and (Michaelis constant—concentration of RNA at which the reaction rate is half-maximal). Also, this term is multiplied by . It indicates that Z inhibits L. Also, the term is normalized by the length of the L RNA , since we obtain the length of the synthesized chain in nucleotides; to obtain the number of RNAs, we need to divide by the length of the RNA. The second term describes the degradation rate of L RNA with constant .
3.5. Translation
The rate of change of the abundance of viral proteins is modelled using the equations listed below.
The first term is responsible for the translation of the NP protein from NP RNA: ribosomes synthesize the NP protein using the NP RNA with constant that characterizes the general rate of translation in the number of nucleotides passed per hour, which is divided by the length of NP RNA to specify that the production of one protein is equal to passing through that particular protein’s RNA (through its length). The second term corresponds to the degradation of the NP protein with constant . The third term accounts for the coating of RNA with the NP protein; NP coats and in the Michaelis–Menten type of reaction with reaction constant and (Michaelis constant—concentration of NP protein at which the reaction rate is half of the maximum). Also, the term is multiplied by , because this term describes the rate of genome RNA decline; thus, to turn it to the NP decline rate, the term should be multiplied by the number of NP proteins per virion (one virion—one L and one S genome RNA).
The first term describes the unpackaging of the initial Z protein from the ( number of Z proteins per virion) with constant . The second term describes the translation of the Z protein from the Z RNA: ribosomes synthesize the Z protein using Z RNA with constant ,which characterizes the general rate of translation in the number of nucleotides passed per hour; this is divided by the length of Z RNA , specifying that the production of one protein is equal to passing through particular protein’s RNA (through its length). The third term describes the degradation rate of the Z protein with constant . The last term accounts for virion assembly—it is regarded as a reaction with constant between all components of the virion (coated RNA and all proteins). Also, the term is multiplied by ; because this term describes the assembled virions’ production rate, to turn it to the Z decline rate, the term should be multiplied by the number of Z proteins per virion. The saturation of the assembly process is parameterized using the product of Michaelis–Menten type functions:
The first term describes the unpackaging of the initial L protein from ( number of L proteins per virion) with constant . The second term is responsible for the translation of the L protein from L RNA. Ribosomes synthesize the L protein using the L RNA with constant that characterizes the general rate of translation in the number of nucleotides passed per hour, which is divided by the length of L RNA to specify that the production of one protein is equal to passing through the particular protein’s RNA (through its length). The third term accounts for the degradation rate of the L protein with constant . The last term describes virion assembly—it is regarded as a reaction with constant between all components of virion (coated RNA and all proteins). Also, the term is multiplied by , because this term describes assembled virions’ production rate; thus, to turn it to the L decline rate, the term should be multiplied by the number of L proteins per virion.
The first term describes the unpackaging of the initial GPC protein from ( is the number of GPC proteins per virion) with constant . The second term describes the translation of the GPC protein from GPC RNA; ribosomes synthesize the GPC protein using GPC RNA with constant that characterizes the general rate of translation in the number of nucleotides passed per hour, which is divided by the length of GPC RNA to specify that the production of one protein is equal to passing through the particular protein’s RNA (through its length). The third term depicts the degradation rate of the GPC protein with constant . The last term indicates the virion assembly—it is regarded as a reaction with constant between all components of the virion (coated RNA and all proteins). Also, the term is multiplied by , because this term describes the assembled virions’ production rate; thus, to relate to the GPC decline rate, the term should be multiplied by the number of GPC proteins per virion.
3.6. Assembly and Release of Virions
To model the rate of change of the assembled and released virions, we formulate the following equations.
The first term describes the virion assembly—it is regarded as a reaction with constant between all components of the virion (coated RNA and all proteins). This term describes the assembled virions’ production rate; thus, it is equal to the coated RNA decline rate. The second term describes the degradation rate of coated with constant . The third term indicates the coating of with the NP protein: the number of increases because coats with the NP protein in the Michaelis–Menten type of reaction with reaction constant and (Michaelis constant—concentration of NP protein at which the reaction rate is half-maximal).
The first term is responsible for virion assembly—it is regarded as a reaction with constant between all components of virion (coated RNA and all proteins). This term describes the assembled virions’ production rate; thus, it is equal to the coated RNA decline rate. The second term indicates the degradation rate of coated with constant . The third term describes the coating of with the NP protein: the number of increases because coats with the NP protein in the Michaelis–Menten type of reaction with reaction constant and (Michaelis constant—concentration of NP protein at which the reaction rate is half-maximal).
The first term is responsible for virion assembly—it is regarded as the reaction with constant between all components of virion (coated RNA and all proteins), but the Z protein is considered as the main assembly protein; therefore, it was used as an “enzyme” in the Michaelis–Menten equation. The second term depicts the release of assembled virions: turn to with constant . The third term indicates the degradation rate of assembled virions with constant .
The first term describes the release of assembled virions: turn to with constant . The second term accounts for the degradation of released virions with constant .
3.7. Calibration of LCMV Replication Model
The parameters of the model were quantified to match the model solution to empirical data described in Section 2, with the initial guesses for model parameters based on our previous models of SARS-CoV-2 and HIV-1 replication [47,48]. There are no experimental data for the degradation kinetics of LCMV virions in free, bound and endosomal states. We have, therefore, used the simplifying assumption that the degradation rates of free and bound virions are the same, and similar to those estimated for SARS-CoV-2, as described in reference [48]. This assumed rate then matches the description for Influenza viruses, for which around 50% of virions fail to release the virus genome upon cell entry [49].
The overall set of parameters is presented in Table 3.
Table 3.
Description of the model parameters.
| Rate of virion binding to -DG receptor, | 10 | [48] | |
| Clearance rate of extracellular virions, | 0.1 | [48] | |
| Dissociation rate constant of bound virions, | 0.51 | [48] | |
| Fusion rate constant, | 0.52 | [48] | |
| Uncoating rate constant, | 0.49 | [48] | |
| Degradation rate of virions in endosomes, | 0.05 | [48] | |
| Degradation rate of negative sense L RNAs in cell, | 0.1 | [48] | |
| Degradation rate of negative sense S RNAs in cell, | 0.1 | [48] | |
| Degradation rate of positive sense L RNAs in cell, | 0.1 | [48] | |
| Degradation rate of positive sense S RNAs in cell, | 0.1 | [48] | |
| Replication rate of positive sense RNAs, | 340 | [48] | |
| Replication rate of negative sense RNAs, | [48] | ||
| Rate of the nucleocapsid formation | 0.3 | [48] | |
| Threshold number of NP proteins at which nucleocapsid formation slows down, molecules | [48] | ||
| Threshold number of Z proteins at which assembly slows down, molecules | 450 | [40] | |
| Threshold number of L proteins at which assembly slows down, molecules | 25 | [40] | |
| Threshold number of GPC proteins at which assembly slows down, molecules | 670 | [40] | |
| Threshold number of RNA enhancing RNA transcription and replication, molecules | 20 | [40] | |
| Threshold number of Z molecules for half-maximal inhibition of L, molecules | [20] | ||
| Transcription rate of RNAs, copies | adjusted | ||
| Transcription rate of NP RNAs, copies | adjusted | ||
| Degradation rate of NP RNA in cell, | 0.31 | [48] | |
| Degradation rate of Z RNA in cell, | 0.3 | [48] | |
| Degradation rate of L RNA in cell, | 0.32 | [48] | |
| Degradation rate of GPC RNA in cell, | 0.29 | [48] | |
| Rate of virion assembly, | 1 | [48] | |
| Translation rate, nt/mRNA | [48] | ||
| Translation rate of Z, nt/mRNA | 2250 | [48] | |
| Degradation rate of NP protein in cell, | 0.021 | [48] | |
| Degradation rate of Z protein in cell, | 0.03 | [48] | |
| Degradation rate of L protein in cell, | 0.04 | [48] | |
| Degradation rate of GPC protein in cell, | 0.022 | [48] | |
| Degradation rate of ribonucleoprotein of , | 0.2 | [48] | |
| Degradation rate of ribonucleoprotein of , | 0.2 | [48] | |
| Rate of virion release via exocytosis, | 7 | [48] | |
| Assembled virion degradation rate, | 0.07 | [48] | |
| Number of NP protein per virion, molecules | 1500 | [40] | |
| Number of Z protein per virion, molecules | 450 | [40] | |
| Number of L protein per virion, molecules | 25 | [40] | |
| Number of GPC protein per virion, molecules | 670 | [40] | |
| Length of RNA genome coding NP protein, nt | 1674 | [50] | |
| Length of RNA genome coding Z protein, nt | 270 | [50] | |
| Length of RNA genome coding L protein, nt | 6630 | [50] | |
| Length of RNA genome coding GPC protein, nt | 1494 | [50] | |
| Length of S segment of genomic RNA, nt | 3400 | [50] | |
| Length of L segment of genomic RNA, nt | 7200 | [50] | |
| Number of Z proteins, initially released to the cell from , molecules | 450 | [40] | |
| Number of L proteins, initially released to the cell from , molecules | 25 | [40] | |
| Number of GPC proteins, initially released to the cell from , molecules | 670 | [40] |
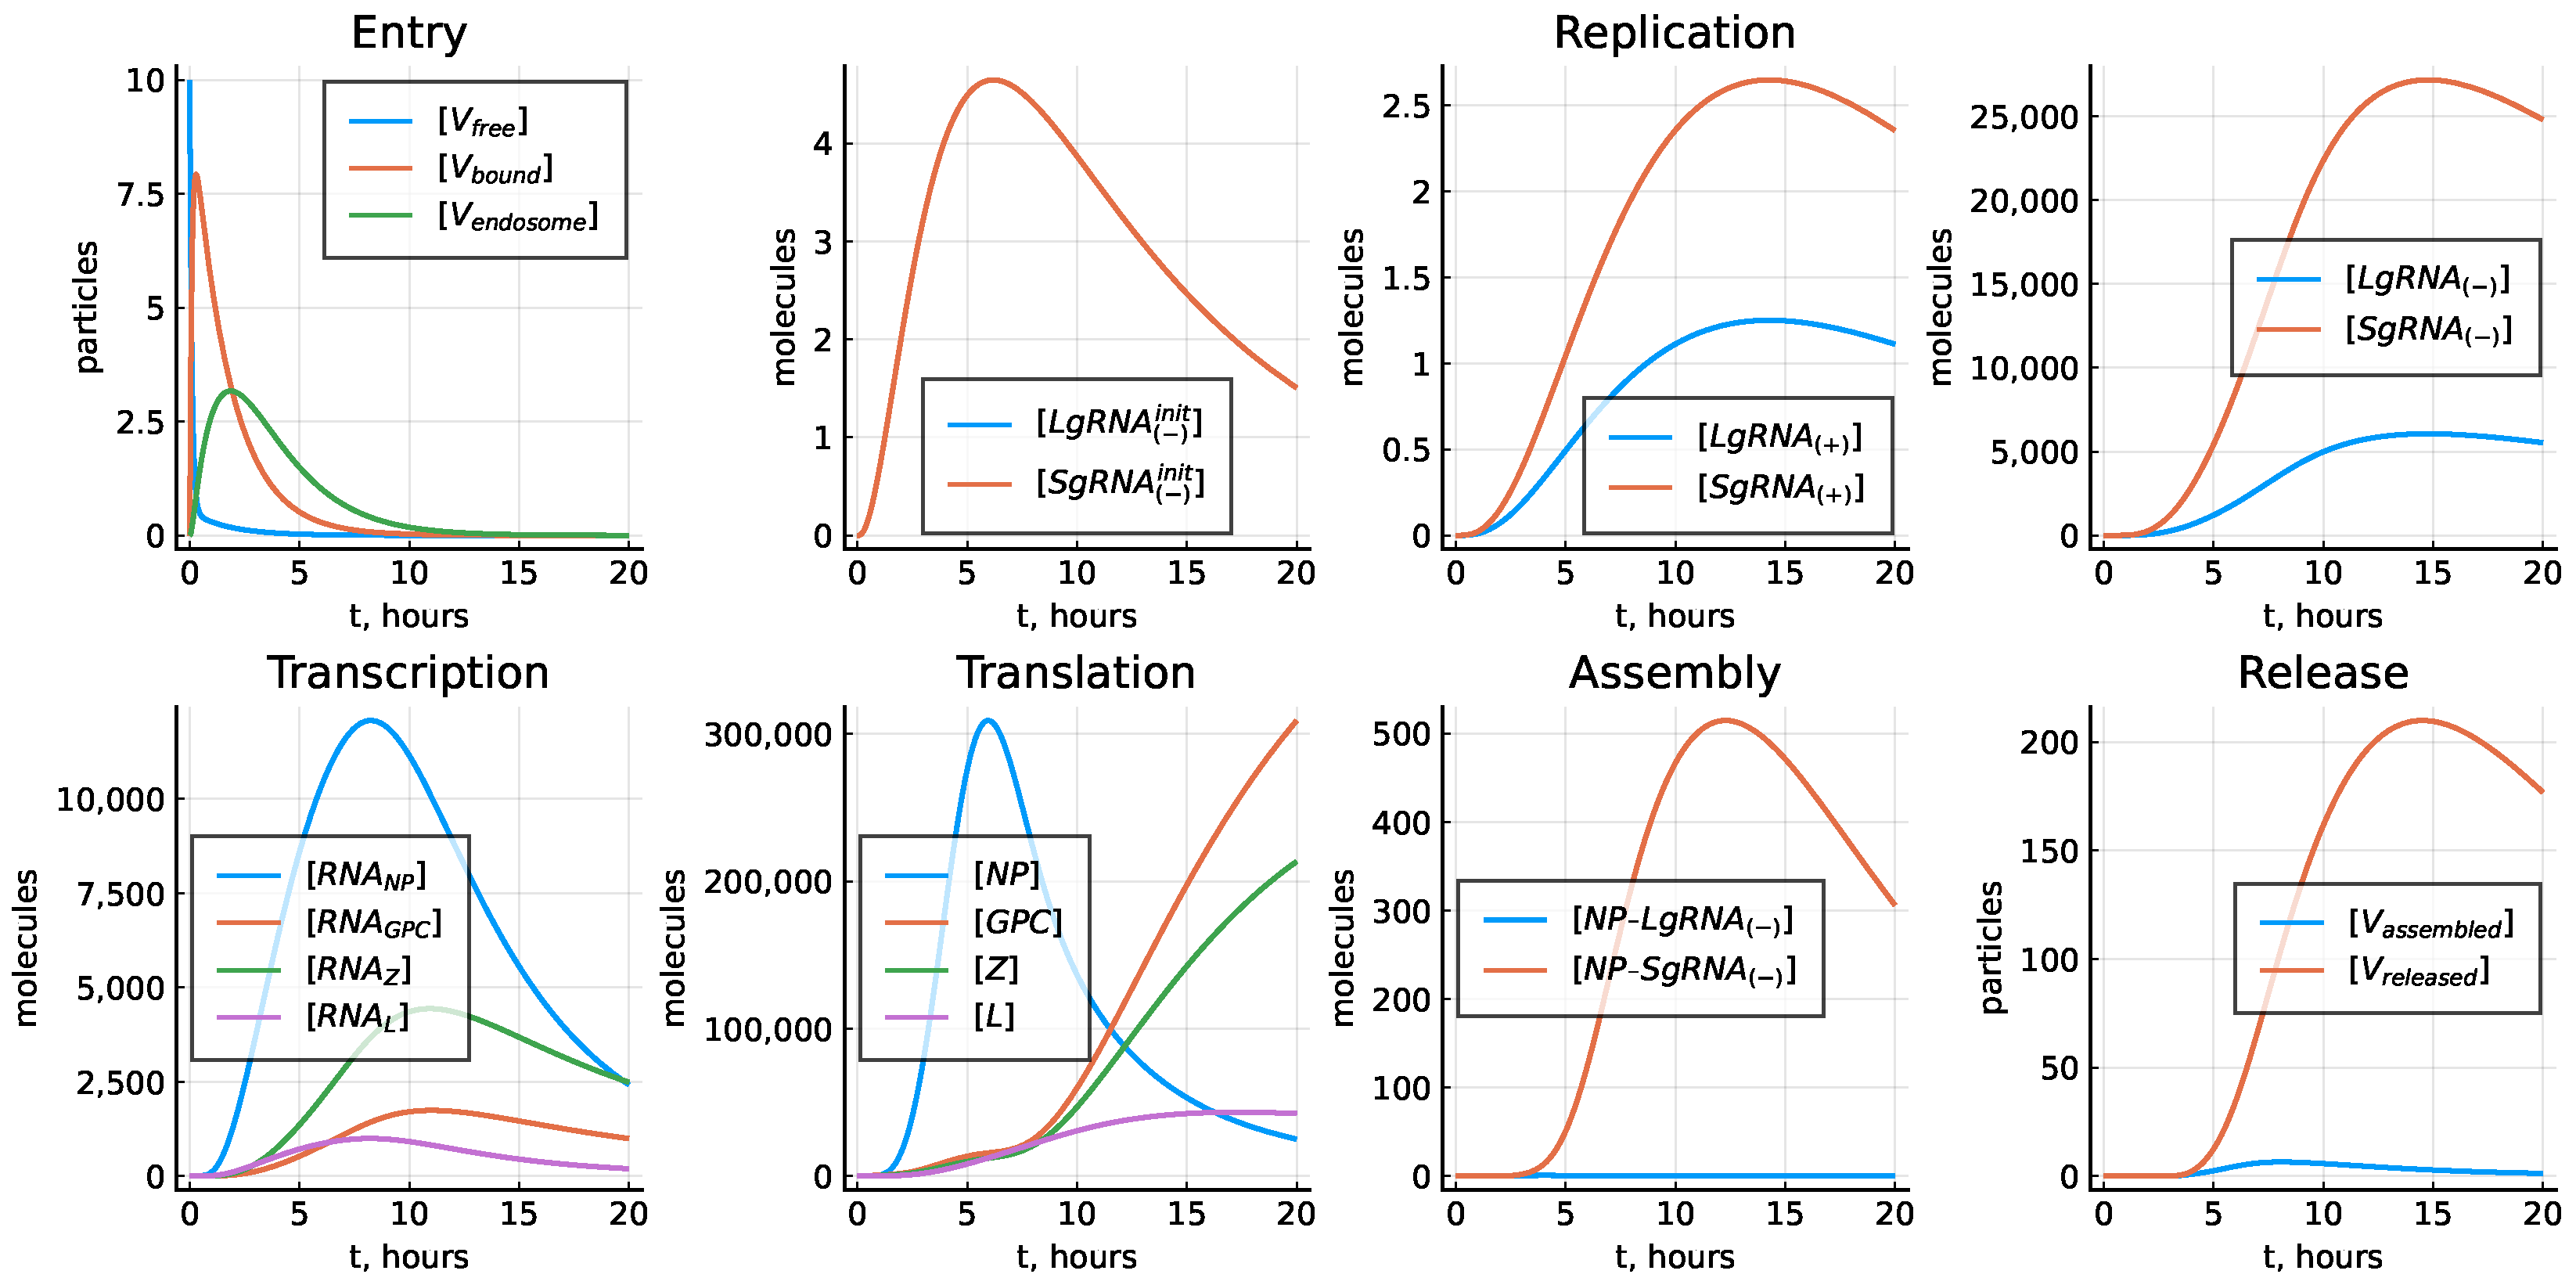
The corresponding solution of the deterministic model predicting the replication dynamics of LCMV in a single replication cycle is shown in Figure 4.
3.8. Stochastic Model
The Gillespie-based stochastic model of LCMV replication is derived using the elementary reactions terms of the deterministic equations as shown in Table 1.
The summary statistics of an ensemble of 10,000 realizations of the stochastic model is shown in Figure 5.
The predicted variability of the LCMV replication indicates that the uncertainty in the dynamics of released virions is much larger than that of the assembled ones. The same observation applies to versus and versus .
4. Results
4.1. Implications of the Model Calibration Uncertainty
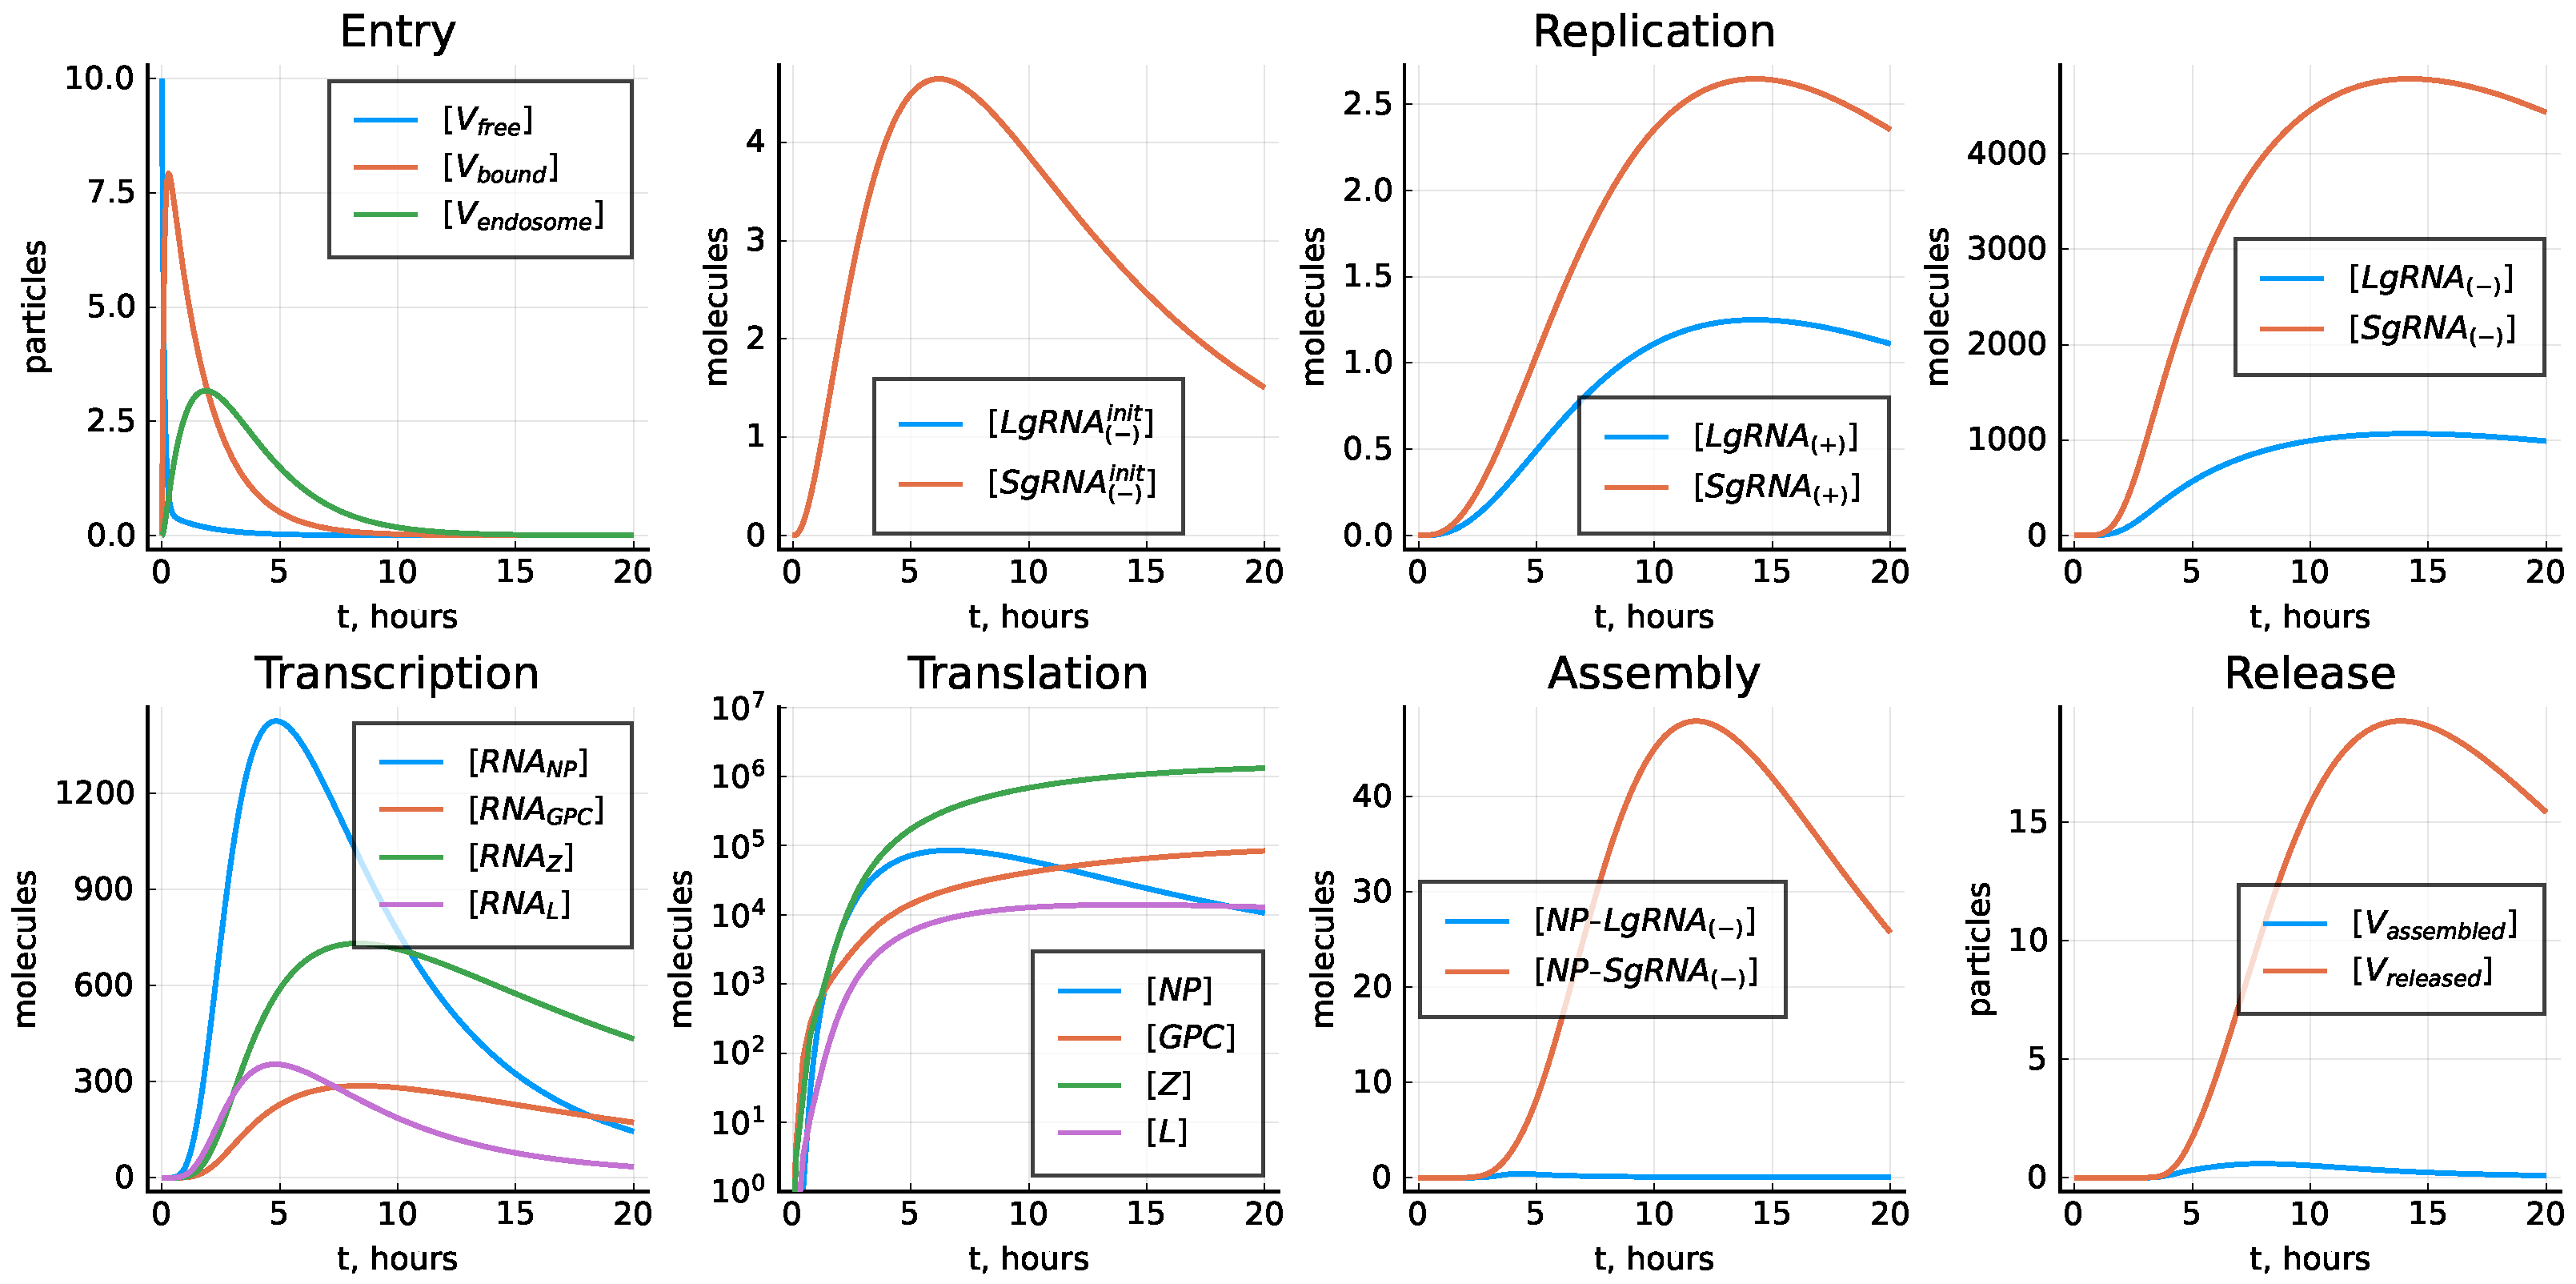
The model was calibrated to match the experimental LCMV growth curves under the assumptions that the number of the produced proteins should be determined by their presence in the infectious virions. As a consequence, we had two different values for the transcription rate constants and , as well as for the translation rate constants and . If these rate constants are set to be the same, the kinetics of the replication of viral components changes, as shown in Figure 6.
4.2. Sensitivity Analysis of the Deterministic Model
By conducting a local sensitivity analysis, we can determine which parameters cause significant changes to the value of the functional in a small vicinity of the baseline parameters. Figure 7 displays the sensitivity indices that are normalized for their comparison by the baseline parameter values and have both negative and positive effects on the functional. The results of the local sensitivity analysis predict that the following processes have the greatest effect on the total number of produced virions:
- Translation (negative effect for Z, positive for the rest);
- Transcription (positive effect for NP, negative for the rest);
- Degradation of NP mRNA (negative effect);
- Degradation of free virions (negative effect);
- Fusion with endosomal membrane (positive effect);
- Unpacking (positive effect);
- Replication (positive effect for (+)RNA replication, negative effect for (-)RNA).
4.3. Kinetic Variability of the LCMV Life Cycle
The low numbers of reaction constituents and the fluctuations in the reaction processes imply variability in the production of LCMV by an infected cell. Using the stochastic model, we estimated the uncertainty by plotting the histograms of the number of released virions, the area under the curve and the total number of produced virions over 20 h post infection, as presented in Figure 8. They indicate that a certain proportion of cell infections goes extinct (left vertical column in each histogram). Indeed, the initial stages of LCMV replication are characterized by small abundances of the reactants and a greater impact of random fluctuations on the reaction rates. In certain realizations, the degradation events can be more frequent than that of the sustaining/expanding reaction events, e.g., the turnover of genomic strands, thus resulting in an abortive infection.
4.4. Probability of Productive Infection
As some of the simulated infections of the target cells go extinct, we further quantified the probability of the productive infection for various numbers of LCMV entering the target cell, also known as MOI. The results are shown in Figure 9 (left). It is close to 0.9 for MOI = 10 and then saturates. The values of MOI affect the efficiency of the LCMV replication cycle, as one can observe from Figure 9 for the number of released (middle) and total number of produced (right) virions by 20 h.
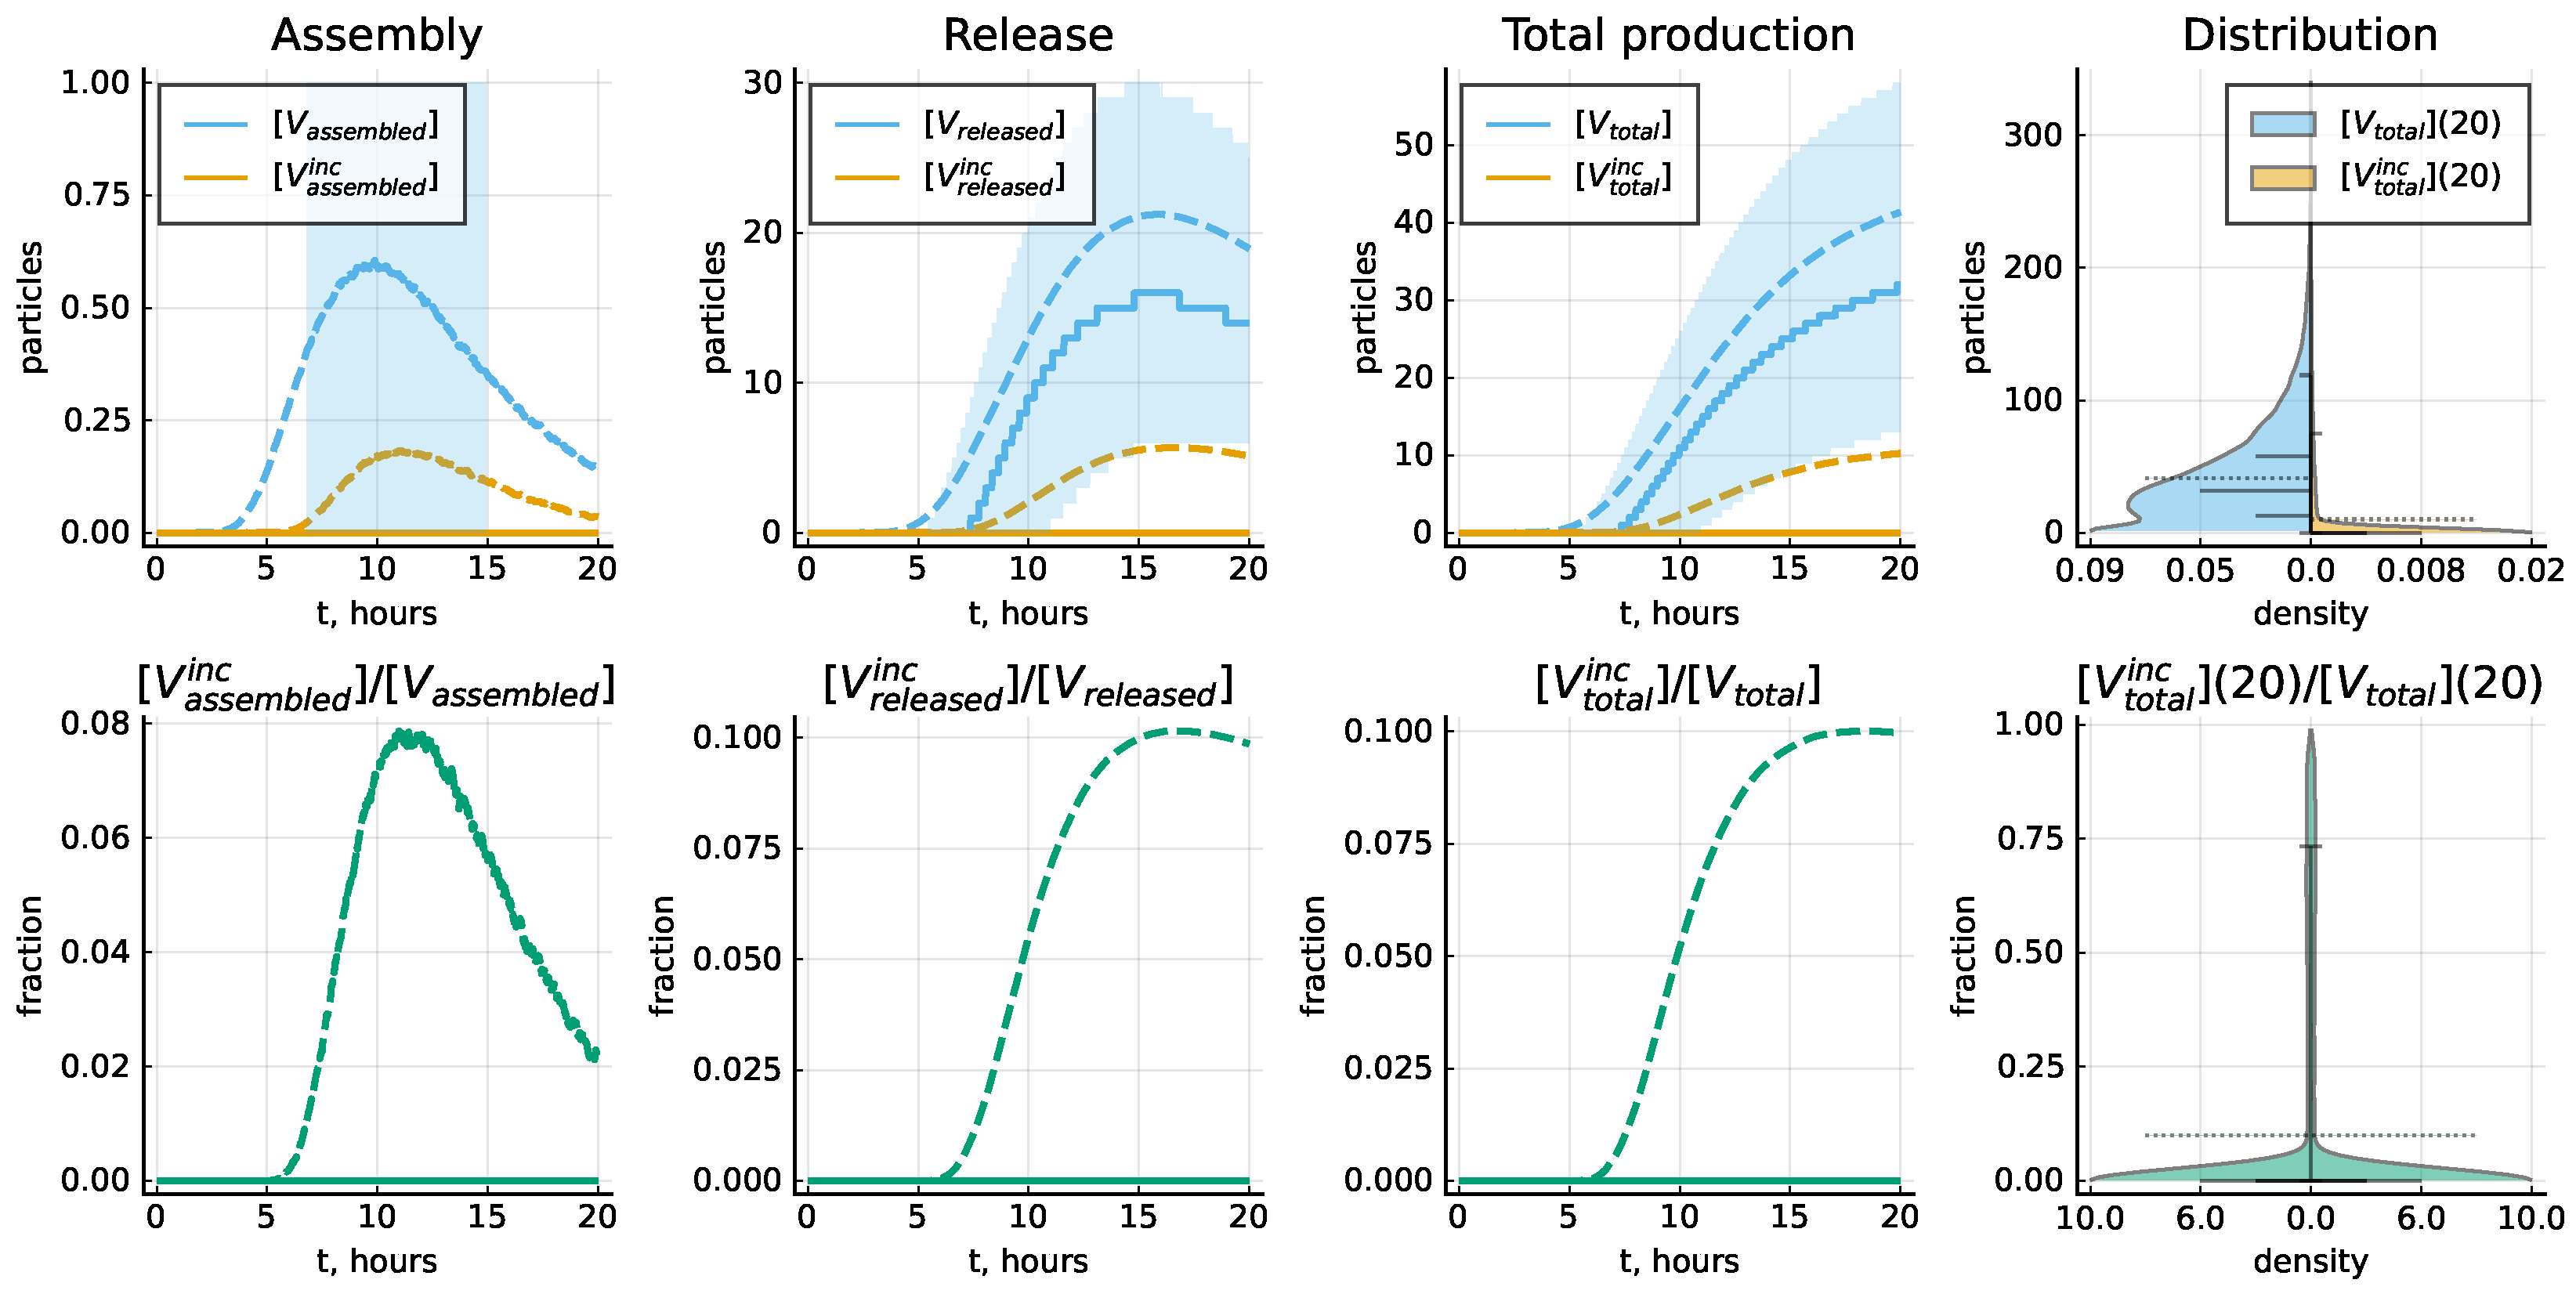
4.5. Protein-Deficient Virions
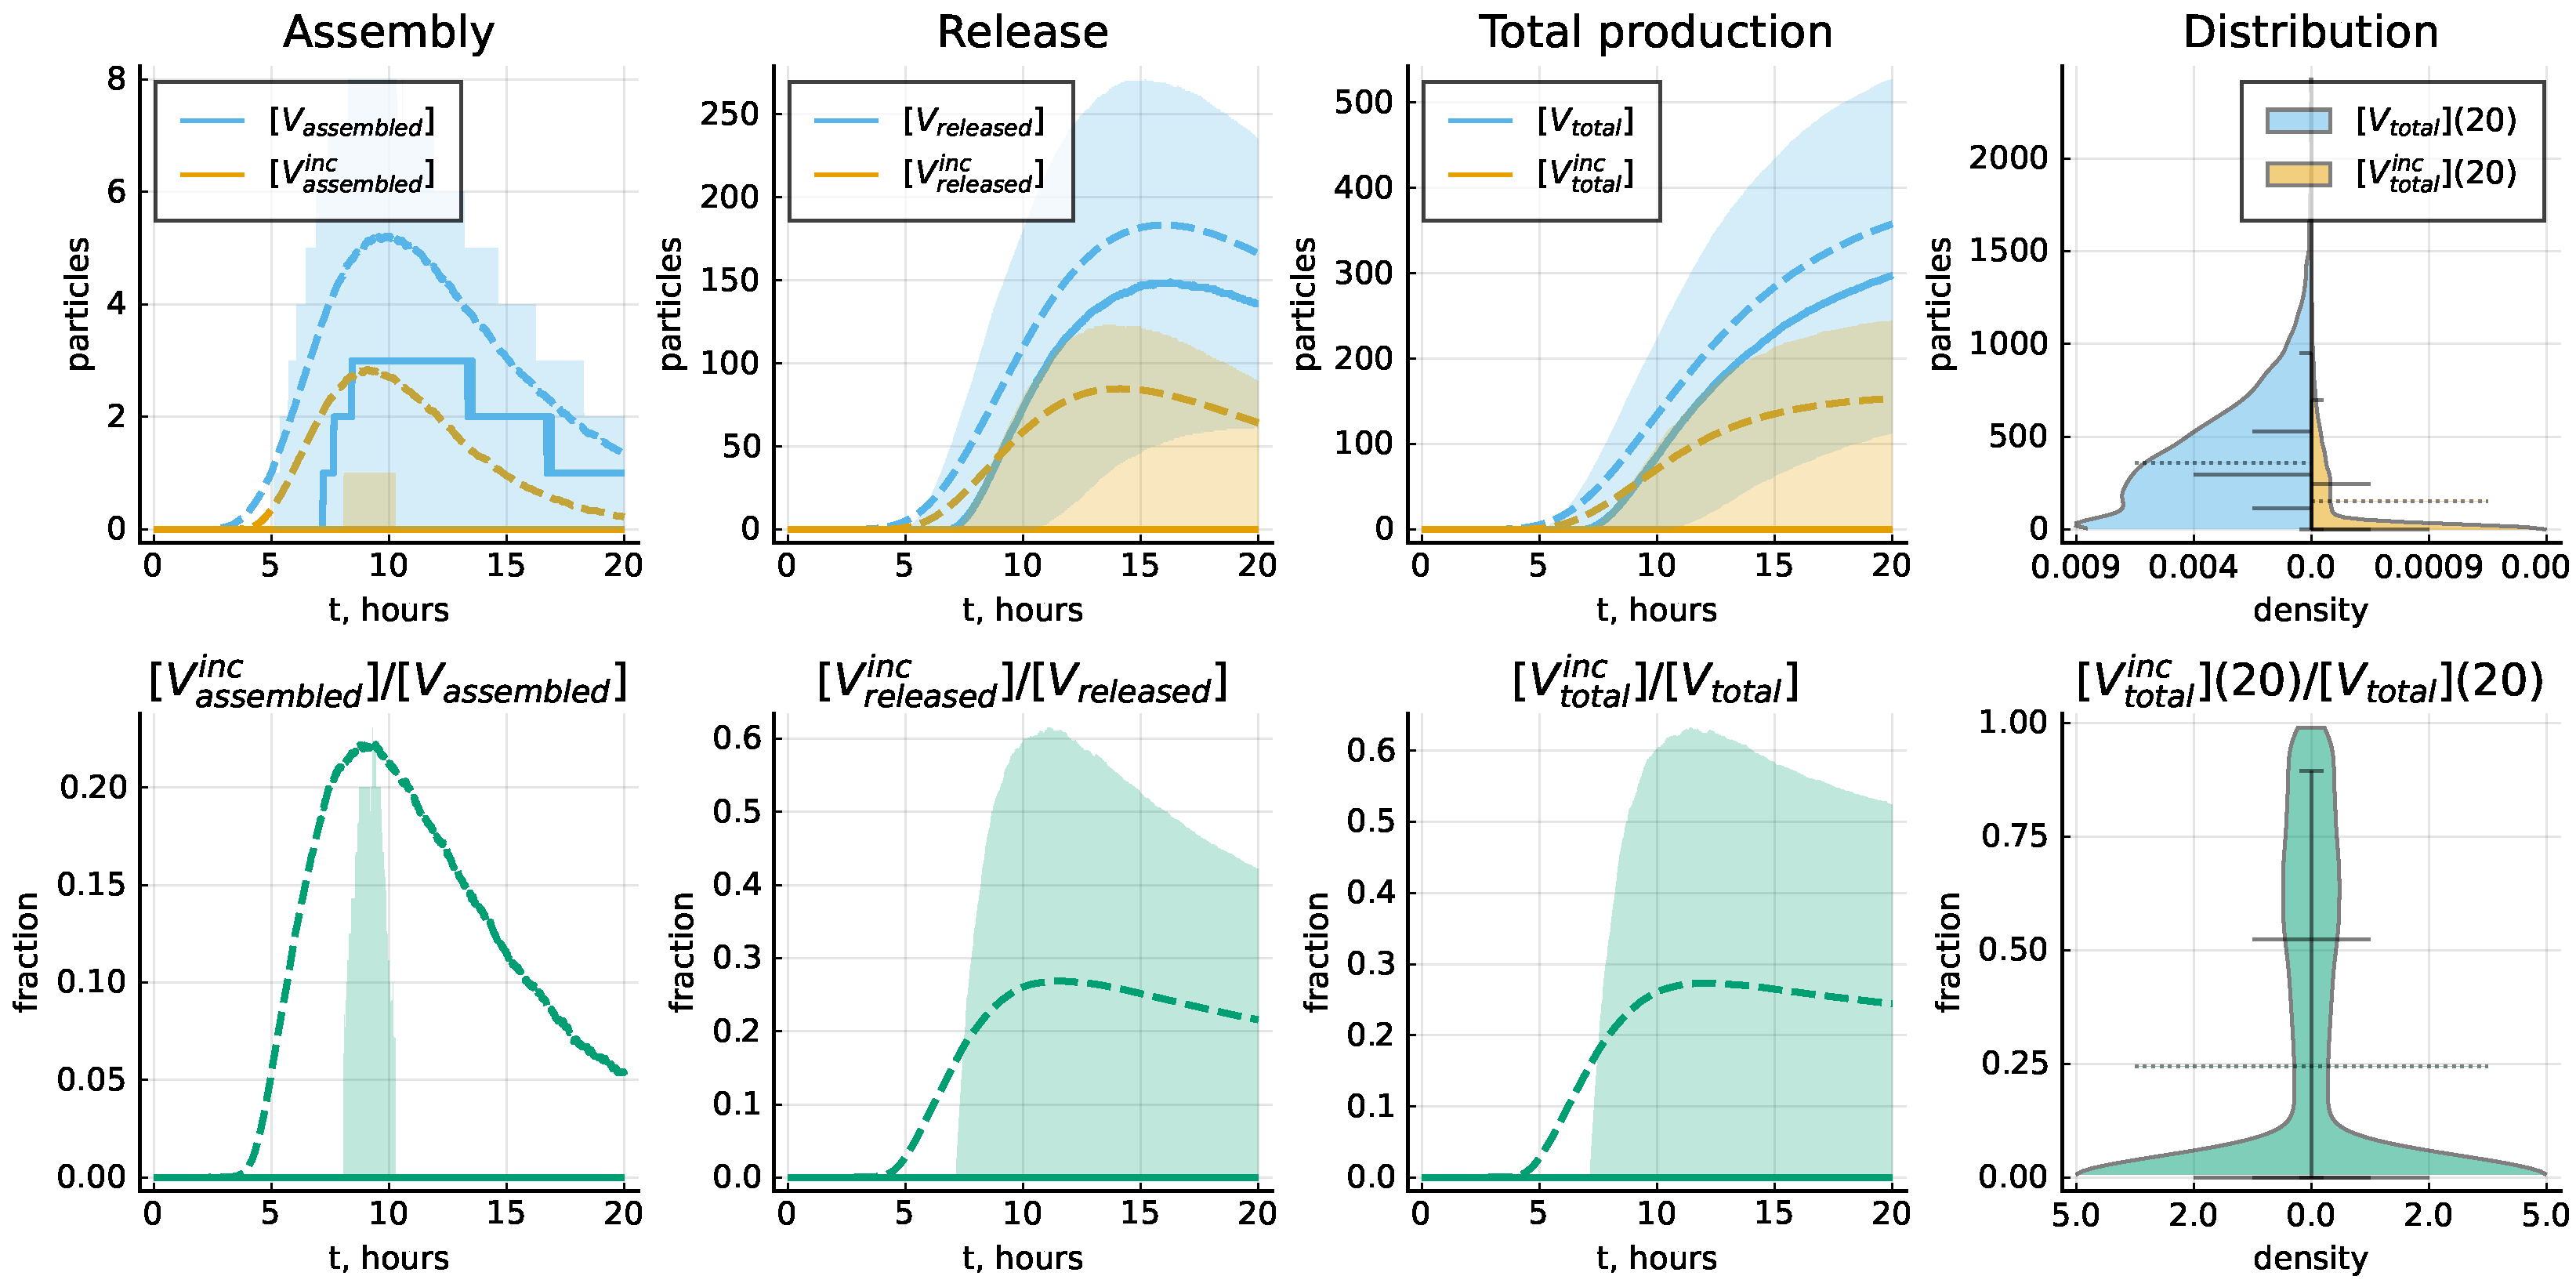
The life cycle of LCMV is characterized by some imbalance of the relative abundance of the viral proteins and genomic RNAs. As a consequence, a certain number of the secreted virions are non-infections because of a deficiency in some of the constitutive components. The stochastic model allows one to evaluate the fraction of the respective particles known in virology as defective interfering viruses (DIPs) and the nature of the deficiency. Our model does not describe the mutations of viral RNA but only the level of completeness in the number of proteins in the assembled virions; see method details in Section 2.4. The plots in Figure 10 specify the corresponding estimates of incomplete particles in an ensemble of 10,000 realizations of the stochastic model for the baseline set of model parameter values listed in Table 3. The variability of assembled particles with respect to their protein levels is shown in Figure 11. One can observe that the assembly of complete virions is limited by the availability of GPC and Z molecules.
As noted before, in calibrating the model, we assumed that the number of viral proteins should follow that of the infectious virions according to the composition of mature LCMV. To implement this assumption, the transcription and translation rates of some proteins are fixed to be different. If the assumption is relaxed, i.e., if the transcription and translation rates of all viral proteins are set to be the same, then the ensemble of stochastic realizations becomes different. The fraction of DIPs as well as the nature of the protein-related deficiencies is shown in Figure 12 and Figure 13, respectively. In this model modification, the assembly of complete virions is limited by the availability of only GPC molecules.
Paradoxically, the fraction of incomplete particles is reduced when the protein transcription and translation rates are set as equal, i.e., ad hoc constraints are not applied. This can be linked to the fact that the assembly events by themselves are rare in this modification of the model, and the sum of incompletely and completely assembled particles which are still not released does not exceed one virion throughout the moments of the life cycle (Figure 12). The distribution of the virion assembly event moments is also altered compared to the other version of the model (Figure 13).
5. Discussion
The aim of our study is to provide a complete quantitative description of the LCMV life cycle steps within an infected cell. This enables us to predict the robustness and fragility of each step with respect to the overall virus production, thus helping to identify weak spots that could be efficient targets for antiviral therapies. To generate the model, experimental data on LCMV growth in cell cultures, LCMV genome structure and replication steps, protein composition of LCMV virions as well as known rates of elementary biochemical reaction steps were used. The knowledge generated by our model goes far beyond the current qualitative understanding of the LCMV life cycle and includes novel quantitative characteristics such as the probability of productive infection, fraction of secreted protein-deficient virus particles and the variability of virus production between individual cells. Furthermore, we predict, via sensitivity analysis of the model, the particularly vulnerable steps that should be best targeted by antiviral drugs. This enables an informed screening for antiviral drugs and may reduce the underlying experimental work.
Viruses are very simple biological entities and thus share many common biochemical reaction steps in their life cycles, including viral genome replication, transcription, translation, virus particle assembly and virus release from the cell. However, they differ in genome length and arrangement, protein composition and structure. All these commonalities and differences were taken into account for the LCMV model presented here. Parameter values of the model, therefore, are a mix of some LCMV-specific parameters like protein composition, genome structure, replication stages and more general parameters that also characterise other viruses. The calibration of our model was conducted by a manual adjustment of parameter values to match the generalized kinetics of LCMV production illustrated in Figure 3 and described in Section 2.1 and Section 2.2. This was necessary because detailed single-cell experimental data are lacking and thus we could not apply a maximum likelihood approach. Moreover, some aspects of the LCMV replication cycle kinetics have not been empirically observed which resulted in a calibration uncertainty, as estimated in Section 4. As a starting point for model calibration, the parameter estimates from the previously developed mathematical models of IAV, HIV-1 and SARS-CoV-2 life cycles have been used, as well as the functional dependencies for the nonlinear regulation processes.
To assess the sensitivity of the model performance to parameter variations, we implemented the traditional deterministic local analysis. A complementary global sensitivity analysis method treats model parameters as random variables, and therefore, requires making certain assumptions on the distributions of the parameter values. In practice, uniform distributions in plausible parameter ranges are frequently used, as well as triangular and normal distributions. The results of the global sensitivity analysis, therefore, will depend on these additional assumptions, which cannot be robustly specified now due to the lack of respective quantitative experimental data on each model parameter. This aspect deserves further attention in future work.
To parameterize the assembly kinetics, we assumed that the assembly rate is proportional to all the components that constitute a viral particle, i.e., to the ribonucleocapsids [NP-LgRNA(-)] and [NP-SgRNA(-)], as well as to Z, L and GPC proteins. The dependence on protein concentration is nonlinear and is given by a product of Michaelis–Menten functions. This implies a saturation in the rate based on the availability of proteins. This parameterization of the assembly process has been previously used in models for IAV [51], HIV-1 [45] and SARS-CoV-2 [52] life cycles.
In our study, both deterministic and stochastic models are used. They should be considered as complementary to each other. The use of the ODE-based deterministic formulation for the biochemical species concentrations assumes that they vary continuously according to the Mass Action Law. This enables a calibration of the model parameters. However, when considering single cell infections, some of the LCMV replication steps may proceed with low numbers of reactants. In this case, the random fluctuations of the reaction rates are more prominent, thus invalidating to a certain degree the deterministic modelling approach. These limitations can be overcome by the stochastic re-formulation of the deterministic model. This can be achieved by considering the transitions that take place between the variables as Markov processes. Specifically, the discrete-state continuous-time Markov chain-based model can be formulated (in which individual simulation paths can be numerically implemented using Monte-Carlo techniques), in which the model variables can take discrete integer numbers, and the propensities of the individual reactions are defined through probabilities that the respective transitions would take place in an infinitesimal increment of time. Importantly, the probabilities are defined by the abundances of the chemical species, while the reaction rate constants are derived directly from the underlying deterministic model. To note, some predictions of the deterministic model might vary substantially from that of the stochastic model. The stochastic model enables one to quantify and explain the emergence of heterogeneities in the virus life cycle, including the variability in net viral progeny and the probability of a productive infection.
6. Conclusions
LCMV is a prototypic arenavirus which provides a widely used experimental model to investigate the pathogenesis of both acute and persistent virus infections [53]. It is applied to study the molecular biology of other arenaviruses, such as the important human pathogens Lassa virus and Junin virus, which can cause hemorrhagic fever disease with high mortality [54]. In our study, we formulated and calibrated a mathematical model predicting the kinetics of biochemical processes, including the transcription, translation and degradation of molecular components of LCMV underlying its replication in infected cells. To the best of our knowledge, it is the first quantitative mathematical model of intracellular LCMV growth. The model provides a building module for developing multi-scale mathematical models of LCMV infection in mice. The existing models for other viruses including HIV-1, Influenza A virus and SARS-CoV-2 are referenced in the discussion section, and distinctive features between these are mentioned.
LCMV remains an important cause of meningitis in humans, the fatal LCMV infection in organ transplant recipients in particular, which highlights the pathogenic potential and clinical significance of this neglected human pathogen [7]. It is recognized that antiviral therapeutic options in human LCMV infection are currently limited [7]. Our study provides a clear ranking of intracellular virus replication processes with respect to their contribution to the net viral production, thus suggesting potential targets for antiviral therapies.
Our mathematical model predicts the variability of the replication process and the probability of productive infection. The stochastic model enables us to predict the production of LCMV virions that are deficient in protein content. The predictions of our study require further experimental validation. The best option would be an experimental analysis of the LCMV life cycle, i.e., to follow the virus infections with simultaneous measurements of viral replication intermediates and host transcriptional changes as was previously made for other viruses, e.g., for HIV-1 [55], poliovirus [49].
Author Contributions
Conceptualization, J.S., D.G., A.M. and G.B.; Methodology, D.G., A.M. and G.B.; Software, J.S. and D.G.; Validation, J.S., D.G., V.C., P.C.R. and A.M.; Formal analysis, D.G.; Investigation, J.S., D.G. and G.B.; Data curation, J.S., D.G., V.C., P.C.R. and A.M.; Writing—original draft, J.S., D.G. and G.B.; Writing—review & editing, J.S., D.G., V.C., P.C.R., A.M. and G.B.; Visualization, J.S., D.G., V.C. and P.C.R.; Supervision, G.B.; Funding acquisition, G.B. All authors have read and agreed to the published version of the manuscript.
Funding
The work of G. Bocharov and A. Meyerhans was supported by the Russian Science Foundation according to the research project number 23-11-00116 (deterministic model development, calibration and sensitivity analysis presented in Section 1; Section 2.1, Section 2.2, Section 2.5; Section 3.1, Section 3.2, Section 3.3, Section 3.4, Section 3.5, Section 3.6, Section 3.7; Section 4.2; Section 5) and performed at Marchuk Institute of Numerical Mathematics of the Russian Academy of Sciences. A. Meyerhans is also supported by the Spanish Ministry of Science and Innovation grant no. PRPPID2022-141395OB-I00, and “Unidad de Excelencia María de Maeztu”, funded by the AEI (CEX2018-000792-M). The work of D. Grebennikov (stochastic model development and numerical simulations presented in Section 2.3 and Section 2.4; Section 3.8; Section 4.1, Section 4.3, Section 4.4, Section 4.5) was financed by the Ministry of Science and Higher Education of the Russian Federation within the framework of state support for the creation and development of World-Class Research Centers “Digital biodesign and personalized healthcare” No. 075-15-2022-304 and performed at Sechenov First Moscow State Medical University.
Data Availability Statement
No new data were created.
Conflicts of Interest
The authors declare no conflict of interest.
Abbreviations
The following abbreviations are used in this manuscript:
| LCMV | Lymphocytic choriomeningitis virus |
| RING | Really interesting gene |
| ESCRT | Endosomal sorting complexes required for transport |
| -DG | -Dystroglycan |
| RdRp | RNA-dependent RNA polymerase |
| RNP | Ribonucleoprotein |
| SSP | Stable signal peptide |
| SSA | Stochastic simulation algorithm |
| ODE | Ordinary differential equation |
| MC | Markov chain |
References
- Poon, M.M.L.; Farber, D.L. The Whole Body as the System in Systems Immunology. iScience 2020, 23, 101509. [Google Scholar] [CrossRef] [PubMed]
- Germain, R.N.; Radtke, A.J.; Thakur, N.; Schrom, E.C.; Hor, J.L.; Ichise, H.; Arroyo-Mejias, A.J.; Chu, C.J.; Grant, S. Understanding immunity in a tissue-centric context: Combining novel imaging methods and mathematics to extract new insights into function and dysfunction. Immunol. Rev. 2022, 306, 8–24. [Google Scholar] [CrossRef] [PubMed]
- Hor, J.L.; Germain, R.N. Intravital and high-content multiplex imaging of the immune system. Trends Cell Biol. 2022, 32, 406–420. [Google Scholar] [CrossRef]
- Cardozo-Ojeda, E.F.; Perelson, A.S. Modeling HIV-1 Within-Host Dynamics After Passive Infusion of the Broadly Neutralizing Antibody VRC01. Front. Immunol. 2021, 12, 710012. [Google Scholar] [CrossRef]
- Sanche, S.; Cassidy, T.; Chu, P.; Perelson, A.S.; Ribeiro, R.M.; Ke, R. A simple model of COVID-19 explains disease severity and the effect of treatments. Sci. Rep. 2022, 12, 14210. [Google Scholar] [CrossRef] [PubMed]
- Nikas, A.; Ahmed, H.; Moore, M.R.; Zarnitsyna, V.I.; Antia, R. When does humoral memory enhance infection? PLoS Comput Biol. 2023, 19, e1011377. [Google Scholar] [CrossRef] [PubMed]
- Vilibic-Cavlek, T.; Savic, V.; Ferenc, T.; Mrzljak, A.; Barbic, L.; Bogdanic, M.; Stevanovic, V.; Tabain, I.; Ferencak, I.; Zidovec-Lepej, S. Lymphocytic Choriomeningitis—Emerging Trends of a Neglected Virus: A Narrative Review. Trop. Med. Infect. Dis. 2021, 6, 88. [Google Scholar] [CrossRef] [PubMed]
- Bocharov, G.; Argilaguet, J.; Meyerhans, A. Understanding Experimental LCMV Infection of Mice: The Role of Mathematical Models. J. Immunol. Res. 2015, 2015, 739706. [Google Scholar] [CrossRef]
- Argilaguet, J.; Pedragosa, M.; Esteve-Codina, A.; Riera, G.; Vidal, E.; Peligero-Cruz, C.; Casella, V.; Andreu, D.; Kaisho, T.; Bocharov, G.; et al. Systems analysis reveals complex biological processes during virus infection fate decisions. Genome Res. 2019, 29, 907–919. [Google Scholar] [CrossRef]
- Pedragosa, M.; Riera, G.; Casella, V.; Esteve-Codina, A.; Steuerman, Y.; Seth, C.; Bocharov, G.; Heath, S.; Gat-Viks, I.; Argilaguet, J.; et al. Linking Cell Dynamics With Gene Coexpression Networks to Characterize Key Events in Chronic Virus Infections. Front. Immunol. 2019, 10, 1002. [Google Scholar] [CrossRef]
- Bocharov, G.A. Modelling the dynamics of LCMV infection in mice: Conventional and exhaustive CTL responses. J. Theor. Biol. 1998, 192, 283–308. [Google Scholar] [CrossRef] [PubMed]
- Nguyen, M.; Haenni, A.L. Expression strategies of ambisense viruses. Virus Res. 2003, 93, 141–150. [Google Scholar] [CrossRef] [PubMed]
- Salvato, M.S.; Shimomaye, E.M. The completed sequence of lymphocytic choriomeningitis virus reveals a unique RNA structure and a gene for a zinc finger protein. Virology 1989, 173, 1–10. [Google Scholar] [CrossRef] [PubMed]
- Southern, P.J.; Singh, M.K.; Riviere, Y.; Jacoby, D.R.; Buchmeier, M.J.; Oldstone, M.B. Molecular characterization of the genomic S RNA segment from lymphocytic choriomeningitis virus. Virology 1987, 157, 145–155. [Google Scholar] [CrossRef] [PubMed]
- Meyer, B.J.; De La Torre, J.C.; Southern, P.J. Arenaviruses: Genomic RNAs, Transcription, and Replication. Curr. Top. Microbiol. Immunol. 2002, 262, 139–157. [Google Scholar] [CrossRef] [PubMed]
- Salvato, M.S.; Clegg, J.C.S.; Buchmeier, M.J.; Charrel, R.N.; Gonzales, J.P.; Lukashevich, I.S.; Peters, C.J.; Rico-Hesse, R.; Romanowski, V. Family Arenaviridae. In Virus Taxonomy: Ninth Report of the International Committee on Taxonomy of Viruses; King, A.M.Q., Adams, M.J., Carstens, E.B., Lefkowitz, E.F., Eds.; Elsevier: San Diego, CA, USA, 2012; pp. 715–723. [Google Scholar]
- Pinschewer, D.D.; Perez, M.; de la Torre, J.C. Dual role of the lymphocytic choriomeningitis virus intergenic region in transcription termination and virus propagation. J. Virol. 2005, 79, 4519–4526. [Google Scholar] [CrossRef] [PubMed]
- Lee, K.J.; Novella, I.S.; Teng, M.N.; Oldstone, M.B.; de la Torre, J.C. NP and L proteins of lymphocytic choriomeningitis virus (LCMV) are sufficient for efficient transcription and replication of LCMV genomic RNA analogs. J. Virol. 2000, 74, 3470–3477. [Google Scholar] [CrossRef] [PubMed]
- Cornu, T.I.; de la Torre, J.C. RING finger Z protein of lymphocytic choriomeningitis virus (LCMV) inhibits transcription and RNA replication of an LCMV S-segment minigenome. J. Virol. 2001, 75, 9415–9426. [Google Scholar] [CrossRef]
- Kranzusch, P.J.; Whelan, S.P. Arenavirus Z protein controls viral RNA synthesis by locking a polymerase–promoter complex. Proc. Natl. Acad. Sci. USA 2011, 108, 19743–19748. [Google Scholar] [CrossRef]
- Perez, M.; Craven, R.C.; de la Torre, J.C. The small RING finger protein Z drives arenavirus budding: Implications for antiviral strategies. Proc. Natl. Acad. Sci. USA 2003, 100, 12978–12983. [Google Scholar] [CrossRef]
- Fehling, S.K.; Lennartz, F.; Strecker, T. Multifunctional nature of the arenavirus RING finger protein Z. Viruses 2012, 4, 2973–3011. [Google Scholar] [CrossRef] [PubMed]
- Borden, K.L.; Campbell Dwyer, E.J.; Salvato, M.S. An arenavirus RING (zinc-binding) protein binds the oncoprotein promyelocyte leukemia protein (PML) and relocates PML nuclear bodies to the cytoplasm. J. Virol. 1998, 72, 758–766. [Google Scholar] [CrossRef] [PubMed]
- Borden, K.L.; CampbellDwyer, E.J.; Carlile, G.W.; Djavani, M.; Salvato, M.S. Two RING finger proteins, the oncoprotein PML and the arenavirus Z protein, colocalize with the nuclear fraction of the ribosomal P proteins. J. Virol. 1998, 72, 3819–3826. [Google Scholar] [CrossRef] [PubMed]
- Campbell, D.E.J.; Lai, H.; MacDonald, R.C.; Salvato, M.S.; Borden, K.L. The lymphocytic choriomeningitis virus RING protein Z associates with eukaryotic initiation factor 4E and selectively represses translation in a RING-dependent manner. J. Virol. 2000, 74, 3293–3300. [Google Scholar] [CrossRef]
- Pinschewer, D.D.; Perez, M.; de la Torre, J.C. Role of the virus nucleoprotein in the regulation of lymphocytic choriomeningitis virus transcription and RNA replication. J. Virol. 2003, 77, 3882–3887. [Google Scholar] [CrossRef] [PubMed]
- Bederka, L.H.; Bonhomme, C.J.; Ling, E.L.; Buchmeier, M.J. Arenavirus stable signal peptide is the keystone subunit for glycoprotein complex organization. MBio 2014, 5, e02063-14. [Google Scholar] [CrossRef] [PubMed]
- Wright, K.E.; Spiro, R.C.; Burns, J.W.; Buchmeier, M.J. Post-translational processing of the glycoproteins of lymphocytic choriomeningitis virus. Virology 1990, 177, 175–183. [Google Scholar] [CrossRef]
- Cao, W.; Henry, M.D.; Borrow, P.; Yamada, H.; Elder, J.H.; Ravkov, E.V.; Nichol, S.T.; Compans, R.W.; Campbell, K.P.; Oldstone, M.B.A. Identification of α-dystroglycan as a receptor for lymphocytic choriomeningitis virus and Lassa fever virus. Science 1998, 282, 2079–2081. [Google Scholar] [CrossRef]
- Sevilla, N.; Kunz, S.; Holz, A.; Lewicki, H.; Homann, D.; Yamada, H.; Campbell, K.P.; de la Torre, J.C.; Oldstone, M.B.A. Immunosuppression and resultant viral persistence by specific viral targeting of dendritic cells. J. Exp. Med. 2000, 192, 1249–1260. [Google Scholar] [CrossRef]
- Kunz, S.; Sevilla, N.; McGavern, D.B.; Campbell, K.P.; Oldstone, M.B.A. Molecular analysis of the interaction of LCMV with its cellular receptor α-dystroglycan. J. Cell Biol. 2001, 155, 301–310. [Google Scholar] [CrossRef]
- Oldstone, M.B.; Campbell, K.P. Decoding arenavirus pathogenesis: Essential roles for alpha-dystroglycan-virus interactions and the immune response. Virology 2011, 411, 170–179. [Google Scholar] [CrossRef]
- Quirin, K.; Eschli, B.; Scheu, I.; Poort, L.; Kartenbeck, J.; Helenius, A. Lymphocytic choriomeningitis virus uses a novel endocytic pathway for infectious entry via late endosomes. Virology 2008, 378, 21–33. [Google Scholar] [CrossRef] [PubMed]
- Rojek, J.M.; Sanchez, A.B.; Nguyen, N.T.; de la Torre, J.C.; Kunz, S. Different mechanisms of cell entry by human-pathogenic Old World and New World arenaviruses. J. Virol. 2008, 82, 7677–7687. [Google Scholar] [CrossRef] [PubMed]
- Rojek, J.M.; Perez, M.; Kunz, S. Cellular entry of lymphocytic choriomeningitis virus. J. Virol. 2008, 82, 1505–1517. [Google Scholar] [CrossRef] [PubMed]
- Lehmann-Grube, F.; Slenczka, W. Über die Vermehrung von LCM-Virus (Stamm WE3) in Zell-kulturen. Zentralblatt Bakteriol. Infekt. 1967, 206, 525. [Google Scholar]
- Sullivan, B.M.; Emonet, S.F.; Welch, M.J.; Lee, A.M.; Campbell, K.P.; de la Torre, J.C.; Oldstone, M.B. Point mutation in the glycoprotein of lymphocytic choriomeningitis virus is necessary for receptor binding, dendritic cell infection, and long-term persistence. Proc. Natl. Acad. Sci. USA 2011, 108, 2969–2974. [Google Scholar] [CrossRef]
- Wen, Y.; Xu, H.; Wan, W.; Shang, W.; Jin, R.; Zhou, F.; Mei, H.; Wang, J.; Xiao, G.; Chen, H.; et al. Visualizing lymphocytic choriomeningitis virus infection in cells and living mice. iScience 2022, 25, 105090. [Google Scholar] [CrossRef] [PubMed]
- Strecker, T.; Eichler, R.; Meulen, J.T.; Weissenhorn, W.; Dieter Klenk, H.; Garten, W.; Lenz, O. Lassa virus Z protein is a matrix protein sufficient for the release of virus-like particles. J. Virol. 2003, 77, 10700–10705. [Google Scholar] [CrossRef] [PubMed]
- Salvato, M.S.; Schweighofer, K.J.; Burns, J.; Shimomaye, E.M. Biochemical and immunological evidence that the 11 kDa zinc-binding protein of lymphocytic choriomeningitis virus is a structural component of the virus. Virus Res. 1992, 22, 185–198. [Google Scholar] [CrossRef]
- Kang, H.; Cong, J.; Wang, C.; Ji, W.; Xin, Y.; Qian, Y.; Li, X.; Chen, Y.; Rao, Z. Structural basis for recognition and regulation of arenavirus polymerase L by Z protein. Nat. Commun. 2021, 12, 4134. [Google Scholar] [CrossRef]
- Gillespie, D.T. A general method for numerically simulating the stochastic time evolution of coupled chemical reactions. J. Comput. Phys. 1976, 22, 403–434. [Google Scholar] [CrossRef]
- Gillespie, D.T. Exact stochastic simulation of coupled chemical reactions. J. Phys. Chem. 1977, 81, 2340–2361. [Google Scholar] [CrossRef]
- Marchetti, L.; Priami, C.; Thanh, V.H. Simulation Algorithms for Computational Systems Biology; An EATCS Series; Texts in Theoretical Computer Science; Springer International Publishing: Cham, Switzerland, 2017; ISBN 9783319631110. [Google Scholar]
- Sazonov, I.; Grebennikov, D.; Meyerhans, A.; Bocharov, G. Markov Chain-Based Stochastic Modelling of HIV-1 Life Cycle in a CD4 T Cell. Mathematics 2021, 9, 2025. [Google Scholar] [CrossRef]
- Thanh, V.H.; Zunino, R.; Priami, C. Efficient Constant-Time Complexity Algorithm for Stochastic Simulation of Large Reaction Networks. IEEE/ACM Trans. Comput. Biol. Bioinf. 2017, 14, 657–667. [Google Scholar] [CrossRef] [PubMed]
- Shcherbatova, O.; Grebennikov, D.; Sazonov, I.; Meyerhans, A.; Bocharov, G. Modeling of the HIV-1 life cycle in productively infected cells to predict novel therapeutic targets. Pathogens 2020, 9, 255. [Google Scholar] [CrossRef] [PubMed]
- Grebennikov, D.; Kholodareva, E.; Sazonov, I.; Karsonova, A.; Meyerhans, A.; Bocharov, G. Intracellular life cycle kinetics of SARS-CoV-2 predicted using mathematical modelling. Viruses 2021, 13, 1735. [Google Scholar] [CrossRef] [PubMed]
- Heldt, F.S.; Kupke, S.Y.; Dorl, S.; Reichl, U.; Frensing, T. Single-cell analysis and stochastic modelling unveil large cell-to-cell variability in influenza A virus infection. Nat. Commun. 2015, 6, 8938. [Google Scholar] [CrossRef]
- UniProt Consortium. UniProt: A worldwide hub of protein knowledge. Nucleic Acids Res. 2019, 47, D506–D515. [Google Scholar] [CrossRef]
- Heldt, F.S.; Frensing, T.; Reichl, U. Modeling the intracellular dynamics of influenza virus replication to understand the control of viral RNA synthesis. J. Virol. 2012, 86, 7806–7817. [Google Scholar] [CrossRef]
- Sazonov, I.; Grebennikov, D.; Meyerhans, A.; Bocharov, G. Sensitivity of SARS-CoV-2 Life Cycle to IFN Effects and ACE2 Binding Unveiled with a Stochastic Model. Viruses 2022, 14, 403. [Google Scholar] [CrossRef]
- Zhou, X.; Ramach, R.S.; Mann, M.; Popkin, D.L. Role of lymphocytic choriomeningitis virus (LCMV) in understanding viral immunology: Past, present and future. Viruses 2012, 4, 2650–2669. [Google Scholar] [CrossRef]
- Lee, A.M.; Cruite, J.; Welch, M.J.; Sullivan, B.; Oldstone, M.B. Pathogenesis of Lassa fever virus infection: I. Susceptibility of mice to recombinant Lassa Gp/LCMV chimeric virus. Virology 2013, 442, 114–121. [Google Scholar] [CrossRef]
- Mohammadi, P.; Desfarges, S.; Bartha, I.; Joos, B.; Zangger, N.; Muñoz, M.; Günthard, H.F.; Beerenwinkel, N.; Telenti, A.; Ciuffi, A. 24 hours in the life of HIV-1 in a T cell line. PLoS Pathog. 2013, 9, e1003161. [Google Scholar] [CrossRef]
Figure 1.
Virion structure and genome organization. (A) Schematic representation of a lymphocytic choriomeningitis virus (LCMV) virion. It consists of a lipid bilayer (light blue) from the host cell plasma membrane in which glycoprotein spikes (green) are incorporated. The glycoprotein mediates virus entry into target cells after receptor binding. The Z protein (pink) builds a matrix structure below the lipid bilayer. The nucleoprotein NP (violet) in association with the polymerase L (yellow) and the genomic RNA form the ribonucleoprotein (RNP) complex. (B) Genome organization of LCMV. LCMV has a bi-segmented (-)RNA genome that is composed of small S and large L RNA segments. The respective segments encode viral proteins in ambisense orientation. Intergenic regions (black) separate the open reading frames. The S segment encodes the virus nucleoprotein (NP) and the glycoprotein precursor (GP-C). The L segment encodes the L protein and the Z protein. (C) LCMV replication and transcription stages. The NP mRNA is transcribed from S (-)RNA, the GPC mRNA is transcribed from S (+)RNA, L mRNA is transcribed from L (-)RNA and Z is transcribed from L (+)RNA. Intergenic and non-coding regions are in black.

Figure 2.
Biochemical scheme of the LCMV life cycle. The individual steps in the LCMV life cycle that are incorporated into the mathematical model are shown schematically. Details are described in the text. “init” refers to initial incoming virus genome.
Figure 2.
Biochemical scheme of the LCMV life cycle. The individual steps in the LCMV life cycle that are incorporated into the mathematical model are shown schematically. Details are described in the text. “init” refers to initial incoming virus genome.

Figure 3.
Generalized kinetics of LCMV growth in an infected cell. Estimates of the number of the LCMV proteins (left) and released virions (right) as a function of time after infection derived from [18,19,20,34,36,37,38,39,40,41]. The shaded areas represent observed ranges of abundances.

Figure 4.
Reference model solution with parameters estimated in Table 3, .
Figure 4.
Reference model solution with parameters estimated in Table 3, .

Figure 5.
Statistics of an ensemble of 10,000 realizations of the stochastic model. Solid lines indicate the medians, dashed lines—mean values, and filled area—interquantile ranges.
Figure 5.
Statistics of an ensemble of 10,000 realizations of the stochastic model. Solid lines indicate the medians, dashed lines—mean values, and filled area—interquantile ranges.

Figure 6.
Model solution with parameters estimated in Table 3 except for and , .
Figure 6.
Model solution with parameters estimated in Table 3 except for and , .

Figure 7.
Model parameters ranked according to their normalized sensitivity indices. (Top): sensitivity towards the total number of produced virions . (Bottom): sensitivity towards the cumulative viral load . (Left): indices having negative effect. (Right): indices having positive effect.
Figure 7.
Model parameters ranked according to their normalized sensitivity indices. (Top): sensitivity towards the total number of produced virions . (Bottom): sensitivity towards the cumulative viral load . (Left): indices having negative effect. (Right): indices having positive effect.

Figure 8.
Variability of the virus production indices estimated by realizations of the stochastic model. (Left): number of released virions. (Center): area under the curve. (Right): total number of produced virions.
Figure 8.
Variability of the virus production indices estimated by realizations of the stochastic model. (Left): number of released virions. (Center): area under the curve. (Right): total number of produced virions.

Figure 9.
Probability of productive infection (left) and produced infectious viruses (middle and right) for various MOI estimated by realizations of the stochastic model.
Figure 9.
Probability of productive infection (left) and produced infectious viruses (middle and right) for various MOI estimated by realizations of the stochastic model.

Figure 10.
The kinetics of complete and incomplete virion production. Top panel shows the number of assembled and released virions and total number of produced virions as function of time, as well as the distribution of the total number of complete and incomplete virions throughout 20 h. Bottom panel shows the fraction of incomplete virions as function of time, as well as the distribution of the total number of complete and incomplete virions throughout 20 h. Solid lines indicate the median values, dashed lines—mean values and filled areas—interquantile ranges. Violin plots indicate the estimated probability density, as well as the mean values (dashed), median values and the following percentiles: 0.05, 0.25, 0.75 and 0.95. Baseline set of parameters from Table 3 is considered.

Figure 11.
The kinetics of protein number distribution in incomplete virions. Top panel shows the number of GPC, Z and L proteins in the assembled incomplete virions as function of time. Bottom panel shows the distribution of virion assembly moments for complete and incomplete particles, as well as evolution of the distributions of GPC and Z protein numbers in incompletely assembled virions. Solid lines indicate the median values, dashed lines—mean values and filled areas—interquantile ranges. Violin plots indicate the estimated probability density, as well as the mean values (dashed), median values and the following percentiles: 0.05, 0.25, 0.75 and 0.95. Baseline set of parameters from Table 3 is considered.

Figure 12.
The kinetics of complete and incomplete virion production. Top panel shows the number of assembled, released virions and total number of produced virions as function of time, as well as the distribution of the total number of complete and incomplete virions throughout 20 h. Bottom panel shows the fraction of incomplete virions as function of time, as well as the distribution of the total number of complete and incomplete virions throughout 20 h. Solid lines indicate the median values, dashed lines—mean values and filled areas—interquantile ranges. Violin plots indicate the estimated probability density, as well as the mean values (dashed), median values and the following percentiles: 0.05, 0.25, 0.75 and 0.95. Modified set of parameters with the transcription and translation rates of all proteins being the same is considered.

Figure 13.
The kinetics of protein number distribution in incomplete virions. Top panel shows the number of GPC, Z and L proteins in the assembled incomplete virions as function of time. Bottom panel shows the distribution of virion assembly moments for complete and incomplete particles, as well as evolution of the distributions of GPC protein numbers in incompletely assembled virions. Solid lines indicate the median values, dashed lines—mean values and filled areas—interquantile ranges. Violin plots indicate the estimated probability density, as well as the mean values (dashed), median values and the following percentiles: 0.05, 0.25, 0.75 and 0.95. Modified set of parameters with the transcription and translation rates of all proteins being the same is considered.

Table 1.
Stochastic model formulated as a Markov chain showing the reactions (transition processes) and their propensities (intensities). The biological meaning of the time-dependent variables of the model is explained in Table 2 and the parameters are determined in Table 3.
| m | Elementary Reaction | Transition Intensity, |
|---|---|---|
| Cell entry | ||
| 1 | ||
| 2 | ||
| 3 | ||
| 4 | ||
| 5 | ||
| 6 | ||
| 7 | ||
| Replication | ||
| 8 | ||
| 9 | ||
| 10 | ||
| 11 | ||
| 12 | ||
| 13 | ||
| 14 | ||
| 15 | ||
| 16 | ||
| 17 | ||
| 18 | ||
| 19 | ||
| Transcription | ||
| 20 | ||
| 21 | ||
| 22 | ||
| 23 | ||
| 24 | ||
| 25 | ||
| 26 | ||
| 27 | ||
| Translation | ||
| 28 | ||
| 29 | ||
| 30 | ||
| 31 | ||
| 32 | ||
| 33 | ||
| 34 | ||
| 35 | ||
| Assembly and release | ||
| 36 | ||
| 37 | ||
| 38 | ||
| 39 | ||
| 40 | ||
| 41 | ||
Disclaimer/Publisher’s Note: The statements, opinions and data contained in all publications are solely those of the individual author(s) and contributor(s) and not of MDPI and/or the editor(s). MDPI and/or the editor(s) disclaim responsibility for any injury to people or property resulting from any ideas, methods, instructions or products referred to in the content. |
© 2023 by the authors. Licensee MDPI, Basel, Switzerland. This article is an open access article distributed under the terms and conditions of the Creative Commons Attribution (CC BY) license (https://creativecommons.org/licenses/by/4.0/).
Share and Cite
MDPI and ACS Style
Sergeeva, J.; Grebennikov, D.; Casella, V.; Cebollada Rica, P.; Meyerhans, A.; Bocharov, G. Mathematical Model Predicting the Kinetics of Intracellular LCMV Replication. Mathematics 2023, 11, 4454. https://doi.org/10.3390/math11214454
AMA Style
Sergeeva J, Grebennikov D, Casella V, Cebollada Rica P, Meyerhans A, Bocharov G. Mathematical Model Predicting the Kinetics of Intracellular LCMV Replication. Mathematics. 2023; 11(21):4454. https://doi.org/10.3390/math11214454
Chicago/Turabian StyleSergeeva, Julia, Dmitry Grebennikov, Valentina Casella, Paula Cebollada Rica, Andreas Meyerhans, and Gennady Bocharov. 2023. "Mathematical Model Predicting the Kinetics of Intracellular LCMV Replication" Mathematics 11, no. 21: 4454. https://doi.org/10.3390/math11214454
Note that from the first issue of 2016, this journal uses article numbers instead of page numbers. See further details here.