
ACMKC: A Compact Associative Classification Model Using K-Modes Clustering with Rule Representations by Coverage


1
Computer Science Department, Urgench State University, Khamid Alimdjan 14, Urgench 220100, Uzbekistan
2
Computer Science Department, California State University of Fullerton, 2555 Nutwood Avenue, Fullerton, CA 92831, USA
3
Department of Information Sciences and Technologies, University of Primorska, Glagoljaška 8, 6000 Koper, Slovenia
4
AI Laboratory, Jožef Stefan Institute, Jamova Cesta 39, 1000 Ljubljana, Slovenia
*
Author to whom correspondence should be addressed.
Mathematics 2023, 11(18), 3978; https://doi.org/10.3390/math11183978
Submission received: 10 August 2023
/
Revised: 9 September 2023
/
Accepted: 15 September 2023
/
Published: 19 September 2023
(This article belongs to the Special Issue Data Mining and Machine Learning with Applications)
Abstract
:The generation and analysis of vast amounts of data have become increasingly prevalent in diverse applications. In this study, we propose a novel approach to address the challenge of rule explosion in association rule mining by utilizing the coverage-based representations of clusters determined by K-modes. We utilize the FP-Growth algorithm to generate class association rules (CARs). To further enhance the interpretability and compactness of the rule set, we employ the K-modes clustering algorithm with a distance metric that binarizes the rules. The optimal number of clusters is determined using the silhouette score. Representative rules are then selected based on their coverage within each cluster. To evaluate the effectiveness of our approach, we conducted experimental evaluations on both UCI and Kaggle datasets. The results demonstrate a significant reduction in the rule space (71 rules on average, which is the best result among all state-of-the-art rule-learning algorithms), aligning with our goal of producing compact classifiers. Our approach offers a promising solution for managing rule complexity in association rule mining, thereby facilitating improved rule interpretation and analysis, while maintaining a significantly similar classification accuracy (ACMKC: 80.0% on average) to other rule learners on most of the datasets.
MSC:
90C901. Introduction
In the modern era of data-driven applications, there has been a significant increase in the gathering and retention of large amounts of data. Extracting association rules from these extensive datasets and reducing their complex combinations has become a crucial method for uncovering valuable insights [1]. However, a major hurdle lies in the sheer number of rules discovered in real-world datasets, which requires the crucial task of pruning and clustering rules to create classifiers that are concise, precise, and easy to understand.
Association rule (AR) mining [2] seeks to create all relevant rules in a database, adhering to user-defined thresholds for minimum support and confidence. On the other hand, classification rule mining focuses on extracting a subset of rules to develop precise and effective models for predicting labels of ambiguous objects. Combining these two crucial data-mining methods in Associative Classification (AC) allows for the creation of a cohesive framework [3,4]. Association rules utilize many of the AC techniques presented by researchers to create efficient and accurate classifiers [5,6,7,8,9,10,11,12]. Although their effectiveness depends on user-defined factors like minimum support and confidence, research investigations have shown that AC methods can be more accurate than conventional categorization systems. Unsupervised learning techniques like clustering [13,14,15] also play a significant part. Partitional clustering or hierarchical clustering are two categories of clustering techniques. In partitional clustering [16,17], objects are divided into distinct clusters to ensure that objects inside a cluster are more similar than those in other clusters. On the other hand, nested partitions make up a hierarchy in hierarchical clustering [18]. While the top–down method starts with a single cluster that contains all items and then splits them into smaller clusters, the bottom–up method joins smaller clusters to create bigger ones.
Our research focuses on generating strong class association rules (CARs) using the “FP-Growth” algorithm for frequent itemsets, satisfying minimum support and confidence requirements. Additionally, we propose an approach to associative classification utilizing K-modes clustering with a novel distance metric built on direct measurements like rule items to reduce the rule space. Our method represents rules as binary vectors of itemsets, enabling efficient similarity calculation and making it compatible with clustering techniques like K-modes. We explore the benefits and methodology of K-modes clustering, which reveals hidden patterns in itemsets and provides computational efficiency for large datasets compared to other clustering approaches. Moreover, we introduce a two-step process using the silhouette score to determine the optimal number of clusters, ensuring a balance between cohesion and separation. After clustering the CARs, we select a representative CAR for each cluster using two approaches based on dataset coverage and rules similarity, aiming to enhance coverage and classification accuracy.
In order to assess the effectiveness of our proposed techniques, we carried out experiments on 13 meticulously chosen datasets sourced from the UCI Machine Learning Database Repository [19] and Kaggle. A comparative evaluation was conducted, comparing our methods against seven well-known associative and classical classification algorithms. These algorithms include Decision Table and Naïve Bayes (DTNB) [20], Decision Table (DT) [21], Classification Based on Predictive Association rules (CPAR) [22], Classification based on Multiple Association Rules (CMAR) [18], C4.5 [23], Classification-Based Association (CBA) [3], and Simple Associative Classifier (SA) [24].
Experimental results showed that ACMKC achieved the best result when comparing the average number of classification rules while maintaining the similar classification accuracy with other models. The ACMKC model showed great advantage to produce statistically smaller classifiers on bigger datasets, which was the primary goal of the study.
The following sections of the paper are structured as follows: Section 2 includes past works related to our research. Section 3 presents a comprehensive explanation of our proposed methodology. Section 4 focuses on the experimental evaluation. Section 5 outlines the conclusion and future plans. The paper concludes with the Acknowledgement and References sections.
2. Related Work
Our proposed approach introduces innovation in the selection of “strong” class association rules, the clustering process, and the determination of a “representative” class association rule for each cluster. Other relevant studies also address the concept of clustering CARs, but they employ various approaches. This section discusses these related approaches to clustering CARs, highlighting both the similarities and differences compared to our proposed approach.
To the best of our knowledge, and due to the lack of information relating to the combination of class association rules and clustering, our approach serves as a coalescence of these two to create a method of determining representative class association rules for clusters. While there are methods that employ associative classification and clustering to accomplish a similar feat, ours differs in that it uses CARS instead of associative classification.
The techniques used in [25] involve Association Rule Classification and Clustering units. In the Association Rule Classification unit, the Apriori Algorithm is applied to identify regularities between flow parameters; it is used for the finer classification and prediction of IPs and ports for future application servicing. This approach focuses on deriving association rules to enhance classification accuracy. On the other hand, in the Clustering unit, both K-Mean and Model-based clustering algorithms are compared to determine the optimum performance. Unsupervised clustering techniques group datasets with similar characteristics together, aiding the classification process. K-Mean partitions data into k groups to minimize the Euclidean distance of cluster centers. Model-Based Clustering assumes a data model and utilizes the Mclust package with Expectation–Maximization (EM) for parameter estimation and hierarchical clustering. These techniques differ from K-modes and class association rules by exploring distinct approaches to data representation, rule generation, and clustering strategies for classification tasks.
A new method researchers propose utilizes K-means (partitional) clustering to cluster association rules [26]. The primary objective of this research is to cluster discovered association rules to facilitate user selection of the most suitable rules. Four steps make up the algorithm: (1) The “Apriori” algorithm is used to extract ARs from frequent patterns; (2) Lift, Cosinus, Conviction, and Information Gain are computed for all rules generated in step 1; (3) Using the K-means algorithm, a set of association rules is divided into disjoint clusters; they attempt to cluster the rules that share the fewest similarities. Euclidean and degree of similarity distances are used; (4) Finally, the group of rules is ranked from best to worst based on the centroid of each cluster.
The CPAR algorithm is introduced by Yin and Han as a fusion of associative classification and traditional rule-based classification methods. CPAR employs a greedy algorithm and draws inspiration from the First-Order Inductive Learner (FOIL) [27] technique to directly generate rules from the training dataset, deviating from the generation of a vast number of candidate rules derived from frequent itemsets in other associative classification approaches. CPAR evaluates each rule using expected accuracy to address overfitting and employs a distinct classification process. Firstly, it selects all rules whose bodies match the testing example; then, it extracts the best k rules for each class among the selected rules. Finally, CPAR compares the average expected accuracy of the best k rules per class from step 2 and predicts the class label associated with the highest expected accuracy.
CMAR, an associative classification method, employs multiple association rules for classification. It extends the efficient FP-Growth algorithm [28] to mine large datasets and introduces a novel data structure called a CR-tree. The CR-tree aims to store and retrieve a large number of rules compactly and efficiently by utilizing a prefix tree structure that explores rule sharing, resulting in significant compactness. Additionally, the CR-tree acts as an index structure for rules, enabling efficient rule retrieval. In the rule selection phase, CMAR identifies highly confident and related rules by considering dataset coverage and analyzing their correlation. For each rule R, all examples covered by R are identified, and if R correctly classifies an example, it is selected for inclusion in the final classifier. The cover count of examples covered by R is incremented by 1, with a cover count threshold C initially applied. If the cover count of an example exceeds C, that example is removed. This iterative process continues until both the training dataset and rule set are empty.
Liu, Hsu, and Ma developed the heuristic technique known as CBA [3] in 1998. Its structure is similar to associative classification algorithms and includes steps for rule development and selection. CBA uses an iterative process for rule creation comparable to the Apriori algorithm [2]. CBA detects frequent rule-items and creates strong class association rules from these frequent itemsets by repeatedly examining the data. A pruning technique based on a pessimistic error rate is used in the rule-generation phase. Rules are extracted depending on dataset coverage during the rule-selection step. A rule qualifies as a prospective classifier candidate if it accurately classifies at least one example. Finally, based on the assessment of total error, rules are added to the final classifier.
In reference [29], a classifier named J&B was developed through a thorough exploration of the complete example space, resulting in a straightforward and accurate classifier. Our selection of strong class association rules was based on their contribution to enhancing the coverage of the learning set. J&B incorporates a stopping criterion in the rule-selection process, which relies on the coverage of the training dataset. In the representative CAR-selection process of this study, we employed the J&B approach without using a stopping condition. There is no need to use a stopping criterion in this method because the size of the classifier, which is decided by the number of clusters, is determined using a separate strategy.
Conditional market-basket difference (CMBP) and conditional market-basket log-likelihood (CMBL) approaches are two further strategies suggested in [30]. This method groups association rules using a new normalized distance metric. Agglomerative clustering is used to group the rules based on distance. In addition, the rules are clustered using self-organizing maps and multi-dimensionally scaled in a vector space. This approach is relatively similar to ours, but instead of using “indirect” measurements based on CAR support and coverage, we suggest a new normalized distance metric based on “direct” and “combined” distances between class association rules.
Another related strategy is mining clusters with ARs [31]. The FP-Growth algorithm generates the rules in this case. However, a unique distance metric (based on K-modes) is afterward applied to identify similarities between rules. Provided is the list of products purchased by each client, and rules are clustered using a top–down hierarchical clustering algorithm to identify clusters in a population of customers. After clustering the rules, we introduce a specific distance metric to assess the effectiveness of the clustering process.
3. Methodology
Our approach (Compact, Accurate and Descriptive Associative Classifier) is divided into 3 main actions outlined in the preceding section. The following subsections go into further depth about each of these steps.
3.1. Class Association Rule Generation
In this subsection, we address the method of finding the strong CARs from frequent itemsets. The process of creating ARs typically consists of two primary stages: first, all frequent itemsets from the training dataset are found using the least support; then, we use these frequent itemsets along with minimum confidence to create strong association rules. The identical process used for AR creation is also followed in the discovery of CARs. The main distinction is that in the rule-generation phase, the rule’s result in CAR generation comprises just the class label, whereas the rule’s result in AR generation might contain any frequent itemset. In the first step, the “FP-Growth” algorithm is employed to discover frequent itemsets. The “FP-Growth” algorithm uses a “growth” technique to decrease the number of itemset candidates at each level, therefore speeding up the search process. To create the 2-frequent itemset and beyond, it starts by determining the 1-frequent itemset. Since they cannot add to frequent itemsets, any infrequent itemsets found during the procedure are discarded. By completing this trimming step before calculating the support at each level, the temporal complexity of the algorithm is decreased. After obtaining every frequent itemset from the training datasets, creating strong class association rules (CARs) that meet the minimal support and minimum confidence requirements is a simple process. The frequent itemsets found in the first stage serve as the basis for these rules. The confidence of a rule can be calculated using the following formula:
In Equation (1), the support count of an itemset is used, where A represents the premise (itemset on the left-hand side of the rule), B represents the consequence (class label on the right-hand side of the rule), represents the number of transactions that contain both itemsets A and B, and represents the number of transactions that contain itemset A. On the basis of the prior equation, the following procedures can be used to build strong class association rules that satisfy the minimum confidence threshold:
- Generate all nonempty subsets S for each frequent itemset L and a class label C.
- For each nonempty subset S of L, output the strong rule R in the form of “” if , where represents the minimum confidence threshold.
3.2. Clustering
Clustering algorithms put comparable examples together into clusters, where the examples in each cluster differ from the examples in other clusters and share commonalities with each other. Among the different clustering techniques, K-modes is a noteworthy one. Because of its unique benefits in some situations, such as efficiently managing datasets with discrete qualities or categorical variables, like the suggested distance matrix we use to describe association rules, the K-modes technique is used.
3.2.1. Distance Metric
We suggest a new distance metric in this part that is based on direct measurements for rule items. Our main objective is to decrease the rule space by using direct distance measurements for clustering.
The encoding of rules as a binary vector of itemsets is one of our work’s contributions. With this structure, calculating similarities across rules is quick and easy, and our binary governed dataset is a perfect fit for clustering methods like K-modes.
The antecedent, or left side of the rule, is taken into consideration when we are calculating the distance between the rules that have the same class value.
Let be a rule set, and each rule is denoted as follows: , where are values of the attribute and c is a class value. We first transfer the rule items into a binary vector. The existing attribute’s value is replaced with 1 and the remaining attribute’s values (which were not present in a rule) are replaced with 0.
Example: Let us assume that attribute Windy has two values: “T” and “F”, and attribute Temperature has three values: “Hot”, “Mild” and “Cool”. An antecedent of the example rule is as follows: Windy = T and Temp = Cool; a subsetted example of the represented rule is shown below.
| Rule | Windy = T | Windy = F | Temp = Hot | Temp = Mild | Temp = Cool |
| {Windy=T, Temp=Cool} | 1 | 0 | 0 | 0 | 1 |
After transferring the rules into binary vectors, we use a simple method of computing the distance between two rules as follows:
Given two rules (rule1, rule2):
where, and . We compute the similarity between and as follows:
3.2.2. K-Modes
In K-modes, the clustering process involves iteratively assigning examples to clusters, considering the modes (the most frequent values) of the categorical attributes. This approach seeks to identify groups of examples that share similar modes across all categorical variables, ensuring that the resulting clusters are internally cohesive. By employing K-modes, we can achieve several benefits. Firstly, it allows us to capture the inherent structure within the itemsets contained in the rules, revealing patterns and associations that might be hidden in numerical-based clustering methods. Secondly, K-modes offers computational efficiency and scalability for large datasets with categorical variables. It can handle high-dimensional data and handle a large number of categories within each attribute, making it suitable for real-world applications with diverse and complex categorical data. The K-modes algorithm is described in Algorithm 1.
| Algorithm 1 The K-modes algorithm for partitioning, where each cluster’s center is represented by the median value of the objects in the cluster. |
| Input: k: the number of clusters, D: a dataset containing n rules |
| Output: A set of k clusters |
|
We run the K-modes method twice. Since Algorithm 1 takes the number of clusters in advance, we initially run the algorithm to determine the optimal number of clusters. Then, the algorithm is run again with the determined optimal clusters. When determining the optimal number of clusters in K-modes, the silhouette score can be utilized as a metric. The silhouette score assists in identifying the “natural” number of clusters by evaluating the cohesion and separation of examples within the clusters.
To calculate the silhouette score, each example is assigned to a cluster, and the following values are computed:
- The average dissimilarity (distance) between an example i and all other examples within the same cluster. This value measures how well an example fits within its assigned cluster with lower values indicating better cohesion.
- The average dissimilarity (distance) between an example i and all examples in the nearest neighboring cluster. This value captures the separation or dissimilarity between an example and other clusters with higher values indicating greater dissimilarity.
By computing the silhouette scores for all examples across a range of cluster numbers, the optimal number of clusters can be identified. The “natural” number of clusters corresponds to the point where the silhouette score is highest, indicating the configuration with the best balance of cohesion and separation. The algorithm that identifies the “natural” number of clusters is presented in Algorithm 2.
| Algorithm 2 Computing the optimal number of clusters. |
Input: D: a dataset containing n rules; : the maximum number of clusters to search for Output: Optimal number of clusters 1: 2: 3: for ( do 4: Run K-modes with dataset D and number of clusters as k; 5: Calculate ; 6: if then 7: ; 8: ; 9: end if 10: end for 11: return |
3.3. Extracting the Representative CAR
After locating each cluster, the last step is to separate the representative CARs from each cluster to create a descriptive, compact, and useful associative classifier. In this work, we extracted representative rules based on dataset coverage while considering the rules similarity.
The decision was made to utilize this approach in order to raise the classification accuracy and overall coverage. It is not necessary to consider the outer-class overlapping problem—which indicates that some samples from different classes have similar characteristics—because we are clustering similar rules with the same class value. However, we should avoid the inter-class overlapping problem, which arises when multiple rules from the same class cover the same samples. By choosing the representative CARs according to database coverage, we work around this issue. When the coverage of the rules is the same, we take into account how similar the rules are to each other. This means that we select the CAR that is closest to the cluster center (it has the lowest average distance to all other rules). The steps are described in Algorithm 3.
| Algorithm 3 A Representative CAR based on Dataset Coverage and Minimum Distance. |
Input: A set of class association rules in CARs array, a training dataset D and covered_traindata array Output: Three representative class association rules 1: CARs = sort(CARs, coverage, minimum_distance); 2: Representative_CARs. add (CARs[1]): 3: for ( do 4: for ( do 5: if then 6: if CARs[i] covers D[j] then 7: 8: increment of CARs[i] by 1; 9: end if 10: end if 11: end for 12: if of CARs[i] > 0 then 13: Representative_CARs. add (CARs[i]); 14: ; 15: end if 16: if Representative_CARs. length = 3 then 17: return ; 18: end if 19: end for |
Firstly, class association rules within the cluster are sorted (line 1) by coverage and minimum_distance in descending order by the following criteria: Given two rules and R1 is said to have a higher rank than R2, which is denoted as ,
- If and only if, ; or
- If but, ;
- If the entire set of parameters of the rules is equal, we may choose any of one of them.
After sorting the rules based on coverage and minimum distance, we extracted the top three rules for each cluster. We selected three rules as optimal according to experiments. Each potential rule is checked (Lines 3–19); if it covers at least one new example (Lines 12–15), then we add it to the representative CARs array and remove all the examples covered by that rule; otherwise, we continue.
Associative Classification Model
After extracting the representative class association rules, we produce our explainable, compact and descriptive model which is represented in Algorithm 4.
| Algorithm 4 Compact and Explainable Associative Classification Model. |
| Input: A distance matrix d and number of clusters S |
| Output: Cluster heights (AHCCLH), Cluster of CARs (AHCCLC) |
|
4. Results
Experimental assessment supported the accomplishment of the scientific goals. Thirteen real-world datasets from Kaggle and the UCI Machine Learning Database Repository were used to test our models. By comparing our classifier’s classification accuracy and rule count to those of eight well-known rule-based classification algorithms (DTNB, DT, C4.5, CPAR, CMAR, CBA, and SA), we were able to assess its performance. A paired t-test was used to determine the statistical significance of each difference (with a 95% level of significance).
Associative classifiers were run with default parameters at minimum support = 1% and minimum confidence = 50%. We utilized their WEKA workbench implementation with default parameters for the other classification models. The description of the datasets is shown in Table 1.
An evaluation methodology that uses 10-fold cross-validation was used to achieve all experimental outcomes. Table 2 displays the experimental findings for classification accuracy (mean values throughout the 10-fold cross-validation with standard deviations).
Table 2 shows that the ACMKC model achieved the best accuracies on the “Abalone”, “Adult”, “Connect4” and “Diabetes” datasets among all classification models and obtained comparable accuracies on other datasets. Our proposed model attained the third highest result on average accuracy with 80.0%, which was slightly lower than the results of the C4.5 (82.7%) and CMAR (82.4%) models. Rule-based models DTNB, DT, and C4.5 obtained better accuracies on the “Car.Evn” and “Nursery” datasets than associative classifications CPAR, CMAR, CBA, SA, and ACMKC. The main reason is that those datasets are imbalanced, which causes a problem in the rule-generation part of AC models (AC models were not able to produce enough class association rules for each class value with imbalanced datasets). Interestingly, CPAR and CMAR achieved over 99% accuracy on the “Mushroom” dataset, which was 15–25% higher than other rule learners.
Table 3 displays statistically significant testing (wins/losses counts) on accuracy between ACMKC and other classification methods. The following represent the results displayed below: W: our approach was significantly better than the algorithms being compared; L: the selected rule-learning algorithm significantly outperformed our algorithm; N: no significant difference has been detected in the comparison.
It can be seen from Table 3 that our proposed model outperformed SA (8/3/2) and CPAR (7/3/3) methods based on win/losses counts. Although ACMKC statistically lost to the C4.5 model on 6 datasets out of 13, it achieved comparable results with DTNB, DT and CMAR algorithms and had a slightly better result than CBA (5/3/5) in terms of win/losses counts.
In our goal to develop an association rule-based model that significantly reduces the required number of rules, we find our model uses far less rules that many other common rule-based and associative classification models, which is shown in Table 4. On average, for the datasets we tested, our model produced 71 rules with the other two closest algorithms being CPAR at 90 rules and CBA at 95 rules. Our method beats the other compared methods for seven out of thirteen datasets and performs in the top two for the least amount of rules for ten of the thirteen tested datasets. The other models in comparison produced far more rules on average.
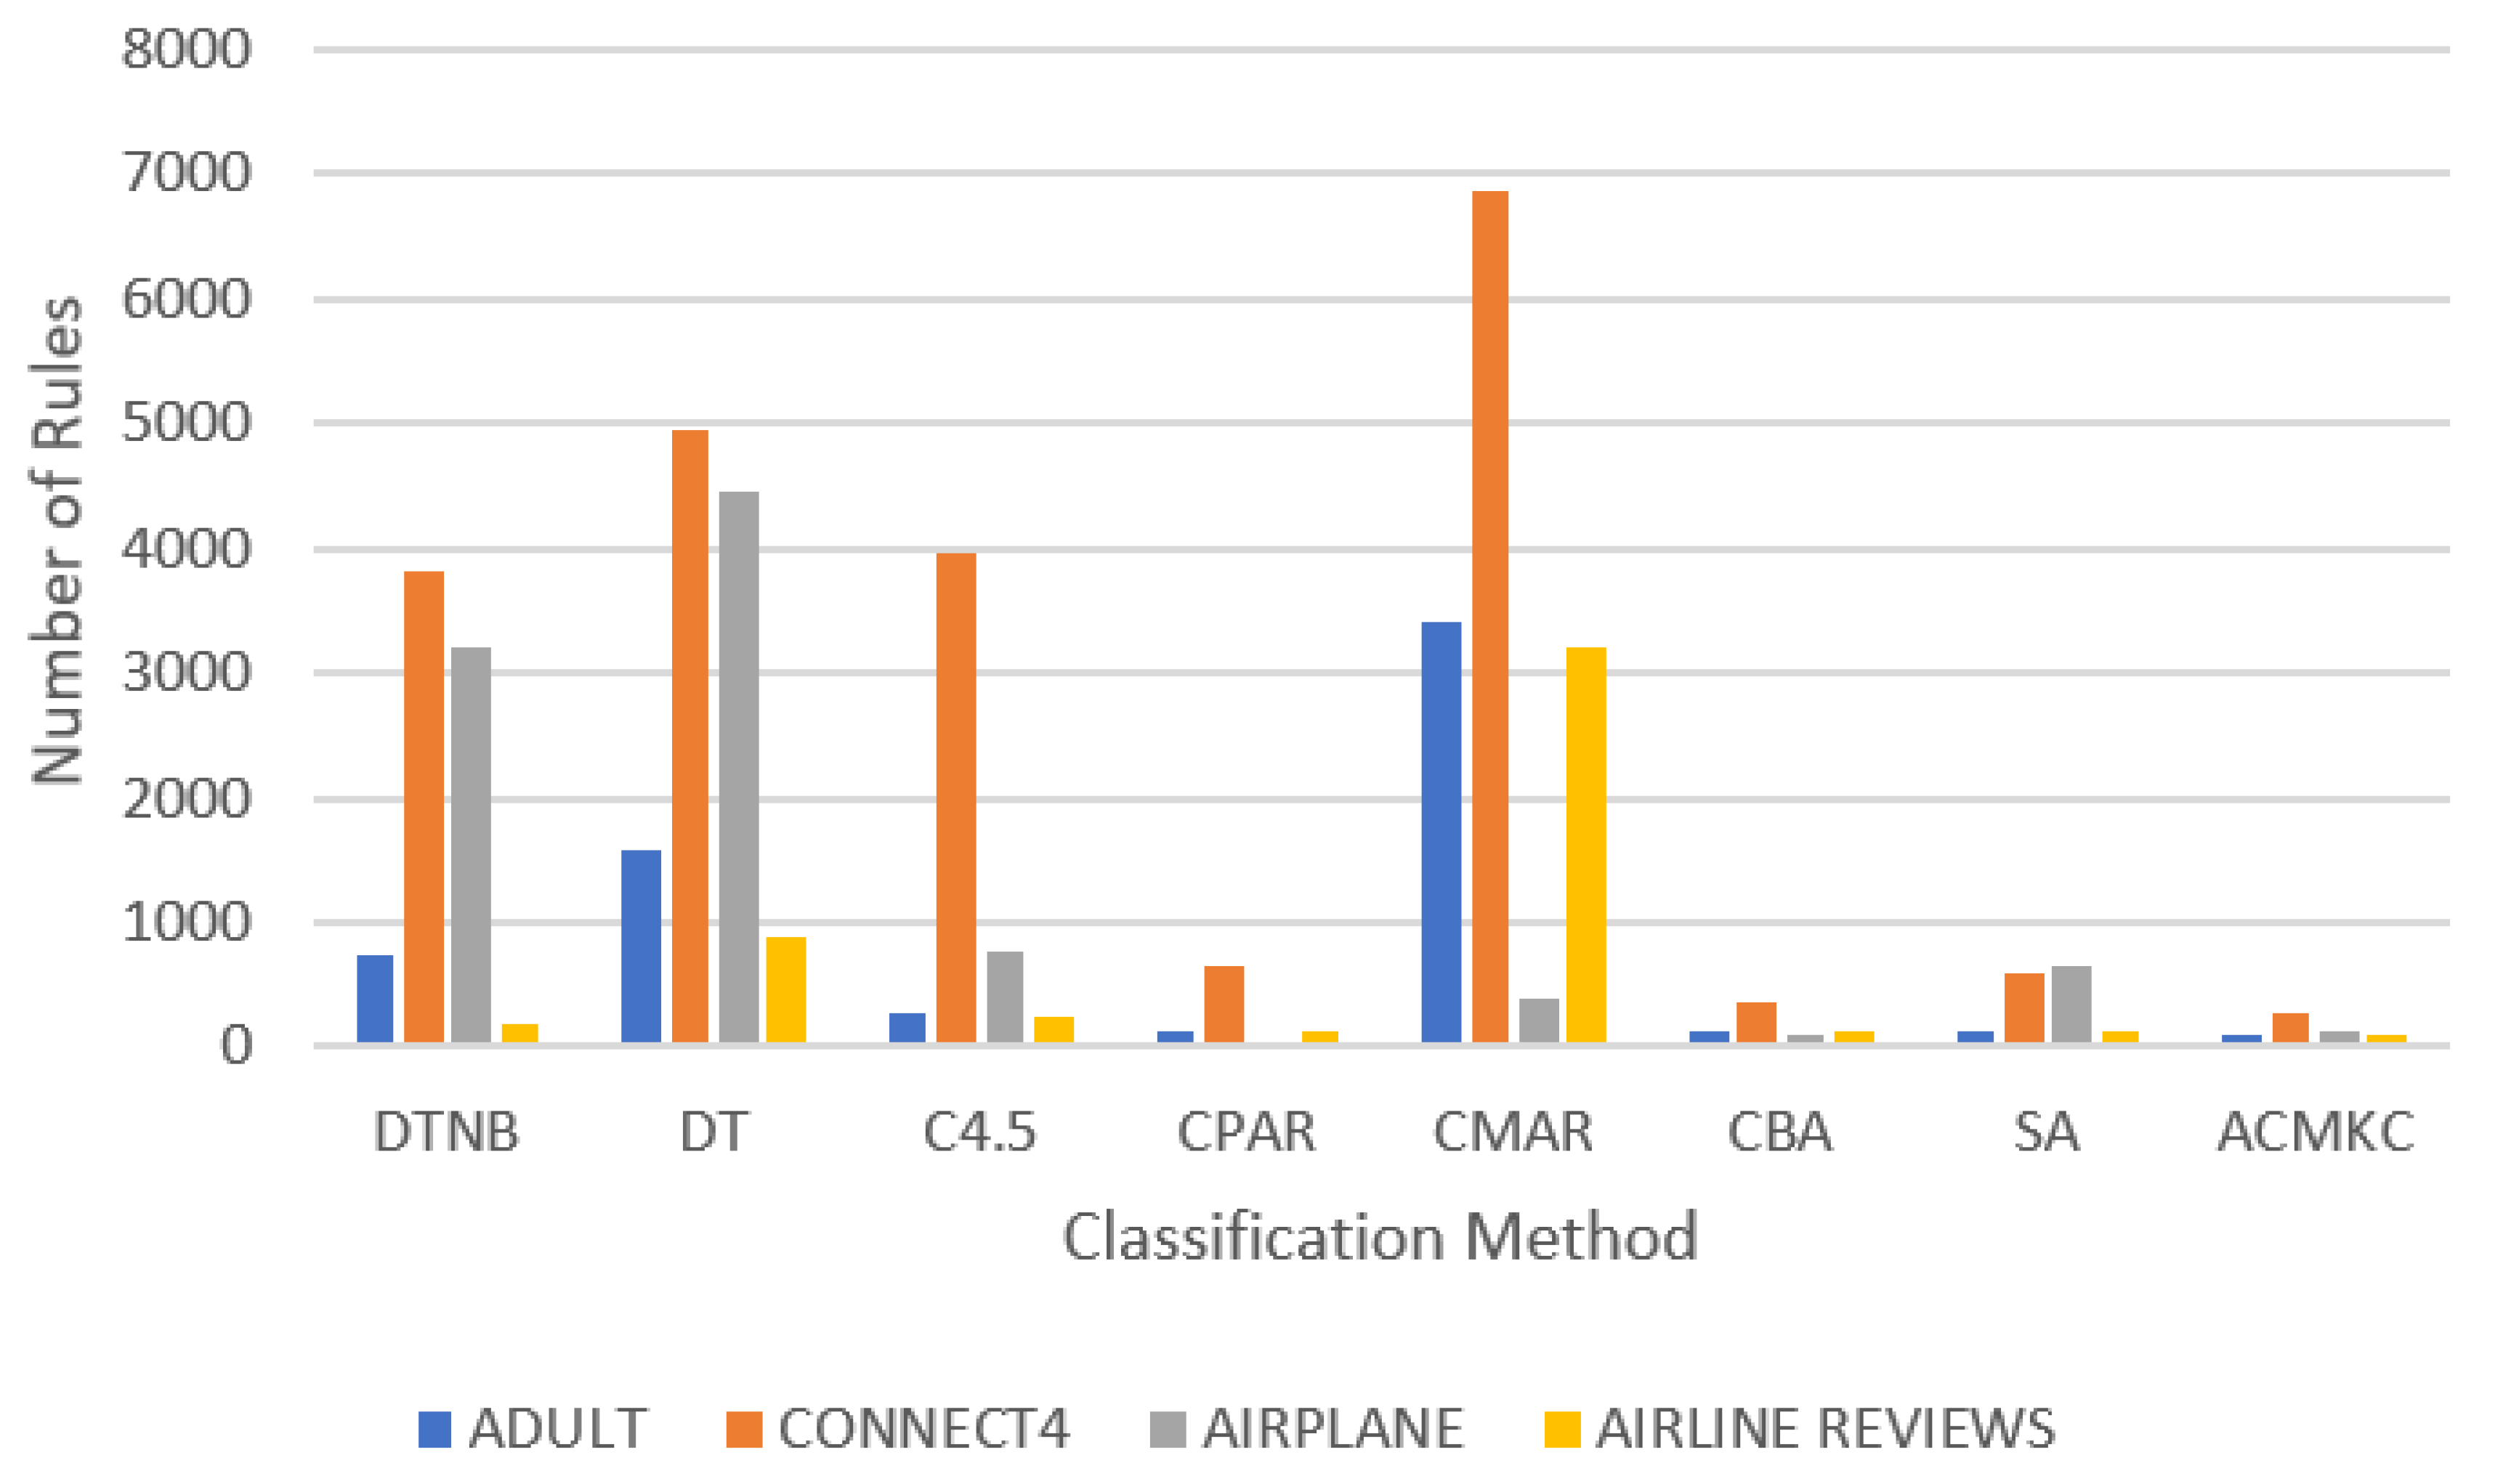
The main advantage of our model is producing noticeably smaller classifiers on bigger datasets comparing to other rule-based and associative classification models (illustrated in Figure 1).
When the size of the dataset increases, the number of rules in the DTNB, DT, C4.5 and CMAR models also rises. However, ACMKC is not sensitive to the dataset size, which can be proven on selected datasets in Figure 1. Figure 1 illustrates the huge advantage of our proposed model compared to other classification models in terms of classifier size. Table 5 provides detailed information on the statistically significant win/loss counts of our methods when compared to other classification models for the number of rules.
Table 5 shows that ACMKC statistically outperformed all the models on the number of rules according to the win/losses counts. Although ACMKC achieved slightly worse results than the C4.5 and CMAR algorithms on accuracy, it produced statistically smaller classifiers than those models in all datasets. Our proposed model achieved statistically better results than DTNB on every dataset and DT on 12 datasets out of 13 in terms of classifier size. Our model had a statistically worse result than CBA on three datasets and CPAR on four datasets, and there were no statistical differences between those methods on three datasets out of 13.
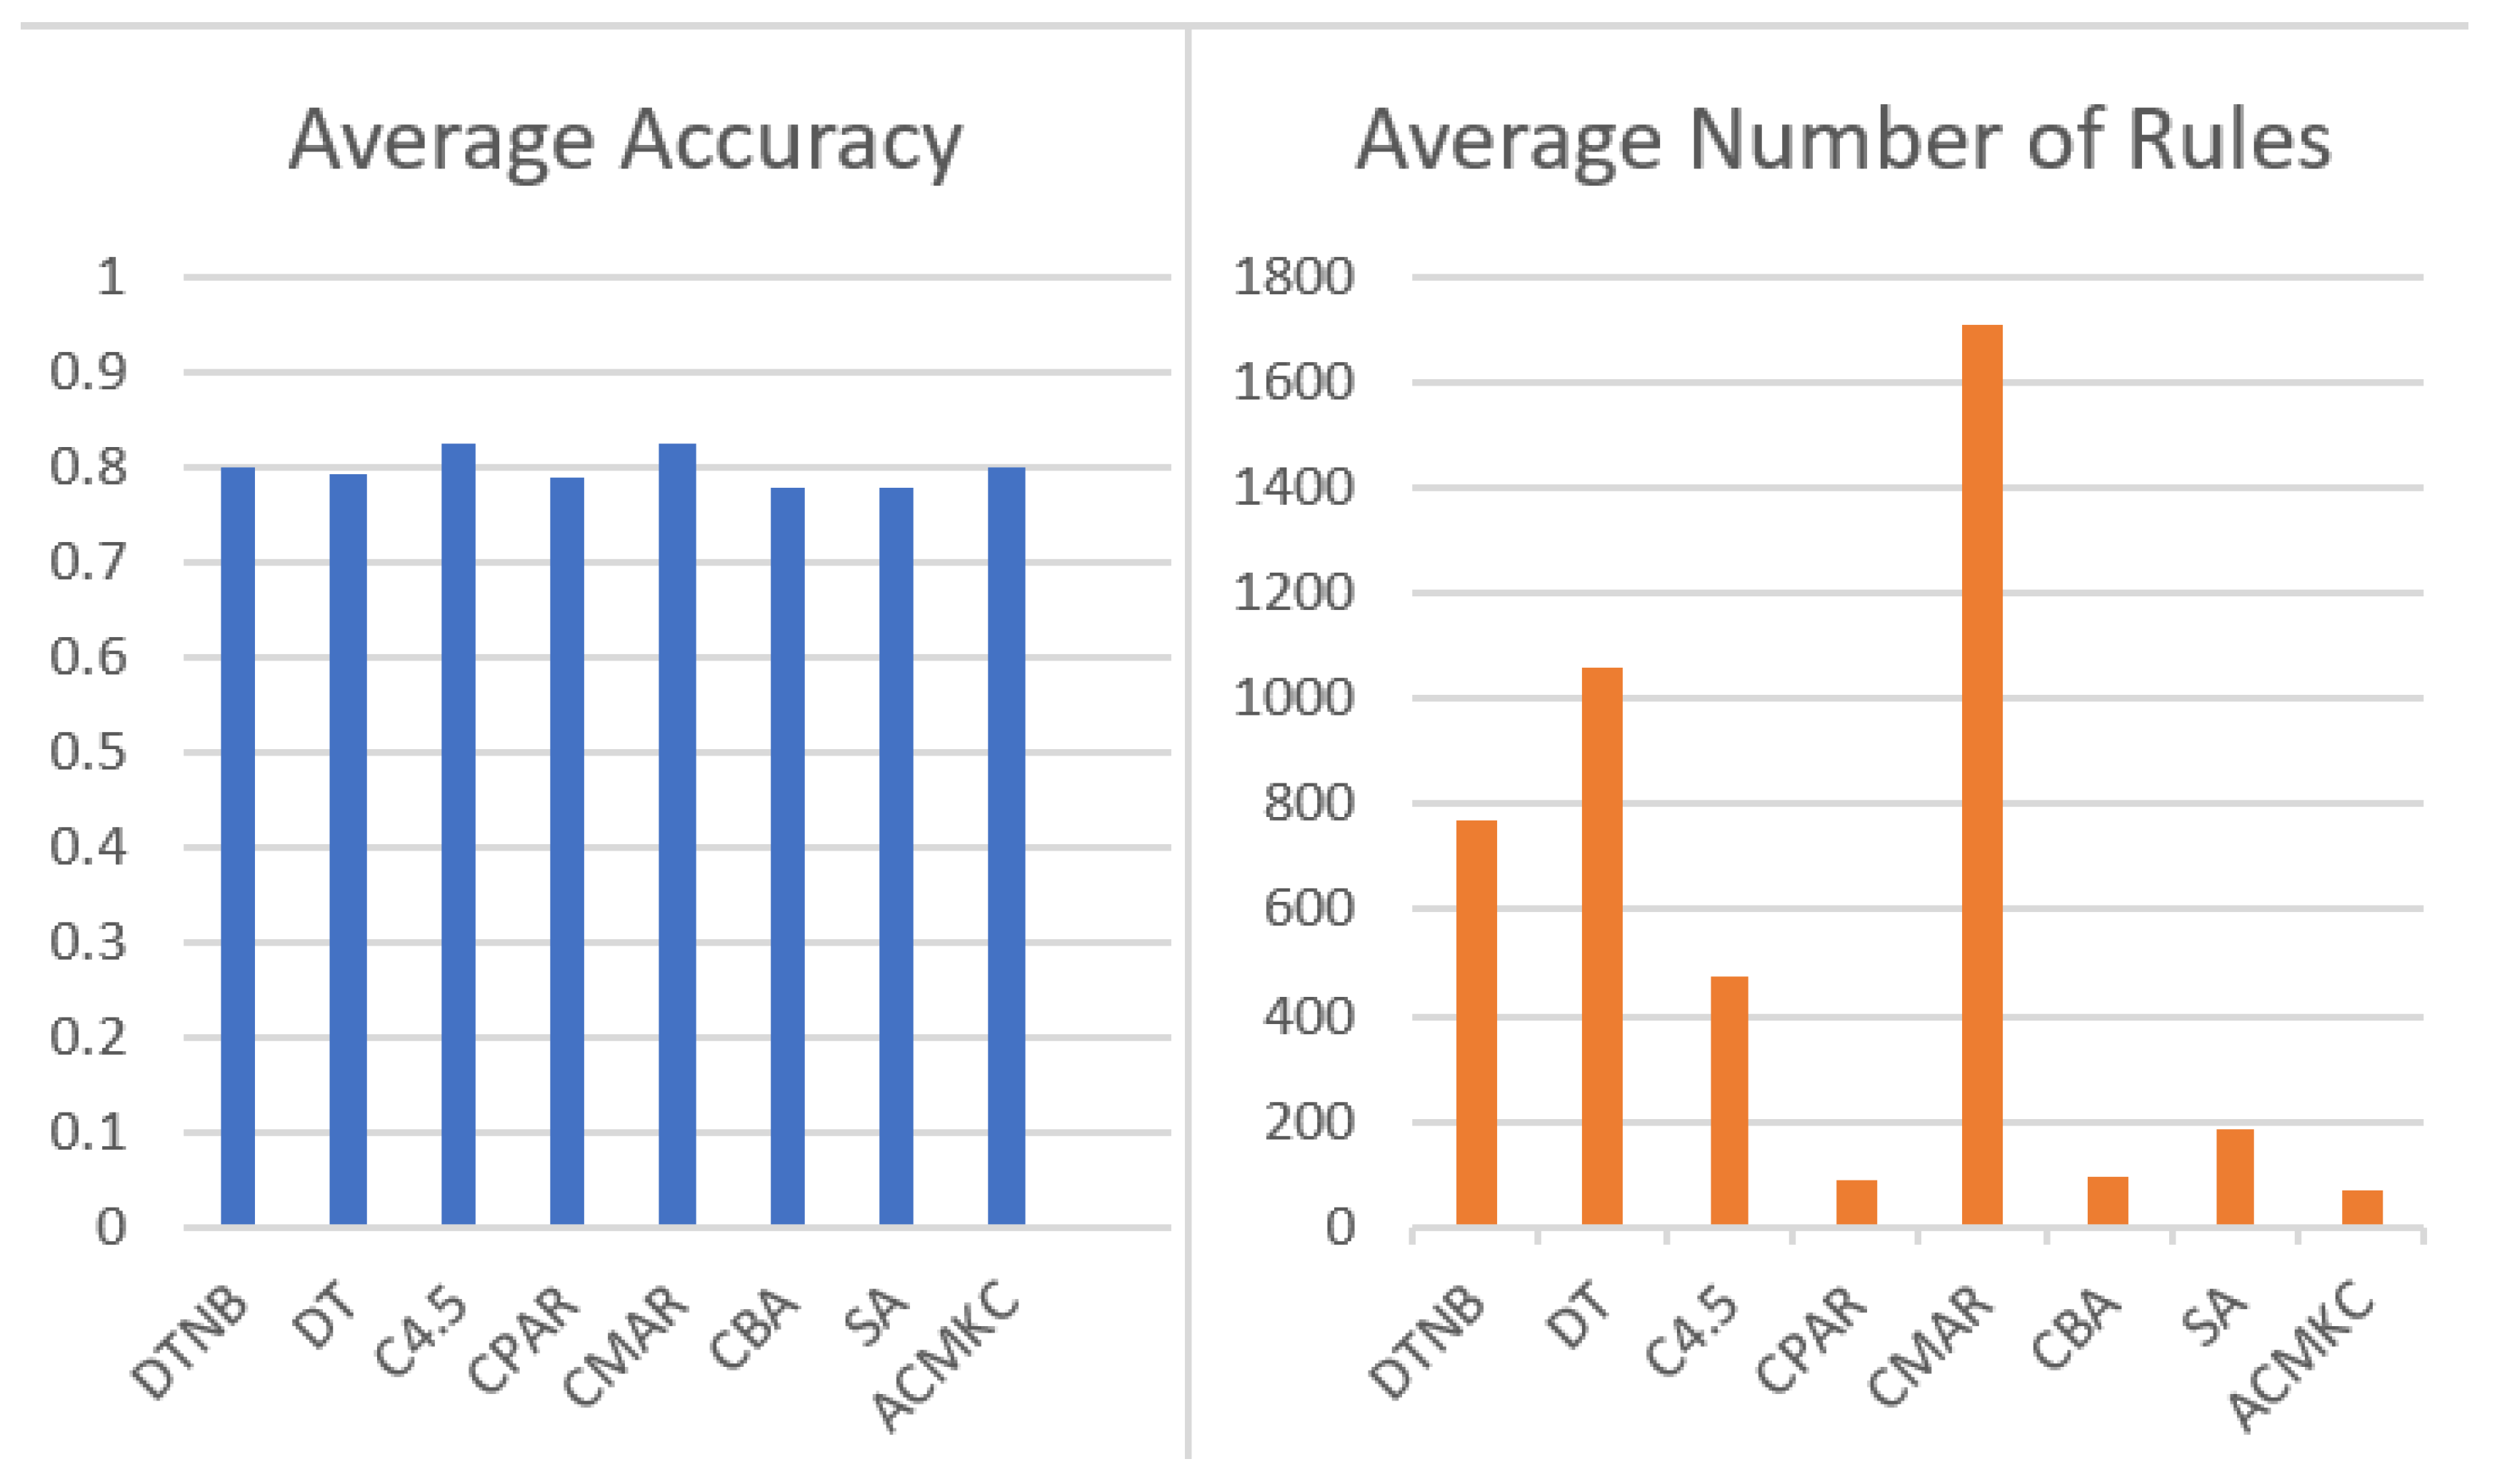
As displayed in Figure 2, our method provides competitive accuracies against the other classification models while utilizing significantly less rules. Only the CPAR algorithm provides a similar result when trading accuracy and number of rules; yet, on average, our method utilizes far less rules.
It is of note that not only does our method perform comparably and sometimes better in regard to accuracy, it also has better precision, recall and F-measure scoreswhen comparing our method to other class association rule algorithms used in classification tasks (shown in Figure 3). As mentioned above, it does this while producing significantly fewer rules than other methods, which was the main goal of this research.
5. Conclusions
By exhaustively searching the whole example space utilizing constraints and clustering, the fundamental goal of this research is to produce a compact and meaningful yet accurate classifier. According to experimental findings, ACMKC greatly decreased the number of classification rules while retaining classification accuracy, which was the major objective of this study. More specifically, the ACMKC method outperformed all other models in terms of average number of rules with 71 rules, which was ten times better than the results of the DTNB, DT, and CMAR algorithms. The proposed model’s overall accuracy was on par with that of all other models, and it was the third highest between all classification models.
The advantage of the proposed model over previous rule-based and associative classification models was demonstrated experimentally by the fact that it produced smaller classifiers on larger datasets.
In future work, we plan to optimize our model ACMKC to improve its time complexity, which is a major drawback of our method. We also would like to investigate ways of including numeric attributes into the associative classification models, as using clustering on class association rules with numeric attributes may reveal new interesting perspectives on the subject.
Author Contributions
Conceptualization, J.M., M.D. and B.K.; methodology, J.M. and M.D.; software, J.M. and M.D.; validation, J.M. and M.D.; formal analysis, J.M., M.D. and B.K.; writing—original draft preparation, J.M. and M.D.; writing—review and editing, J.M. and B.K. All authors have read and agreed to the published version of the manuscript.
Funding
Jamolbek Mattiev acknowledges funding by the Ministry of “Innovative Development” of the Republic of Uzbekistan, grant: UZ-N47.
Data Availability Statement
The dataset used in this paper can be found at https://www.kaggle.com/datasets?tags=13302-Classification and https://archive.ics.uci.edu/ (accessed on 27 June 2023).
Acknowledgments
The Slovenian Research Agency ARRS provided financing for the project J2-2504, which the first and third authors recognize. They also express their gratitude to the Republic of Slovenia (Investment funding of the Republic of Slovenia and the European Union of the European Regional Development Fund) and the European Commission for supporting the InnoRenewCoE project through the Horizon2020 Widespread-Teaming program, respectively (Grant Agreement #739574). The Ministry of “Innovative Development” of the Republic of Uzbekistan, which provided money for this study, is also acknowledged and sincerely thanked by the first author. The second author was partially funded by the National Science Foundation (NSF) grant of the Californian State University (grant number #1826490).
Conflicts of Interest
The authors declare no conflict of interest.
References
- Lent, B.; Swami, A.; Widom, J. Clustering association rules. In Proceedings of the 13th International Conference on Data Engineering, Birmingham, UK, 7–11 April 1997; pp. 220–231. [Google Scholar] [CrossRef]
- Agrawal, R.; Srikant, R. Fast algorithms for mining association rules. In Proceedings of the 20th International Conference on Very Large Data Bases, VLDB, Santiago, Chile, 12–15 September 1994; Volume 1215, pp. 487–499. [Google Scholar]
- Liu, B.; Hsu, W.; Ma, Y. Integrating Classification and Association Rule Mining. In Proceedings of the Fourth International Conference on Knowledge Discovery and Data Mining, New York, NY, USA, 27–31 August 1998; KDD’98; AAAI Press: Washington, DC, USA, 1998; pp. 80–86. [Google Scholar]
- Mattiev, J.; Kavšek, B. CMAC: Clustering Class Association Rules to Form a Compact and Meaningful Associative Classifier. In Machine Learning, Optimization, and Data Science, Proceedings of the 6th International Conference, LOD 2020, Siena, Italy, 19–23 July 2020; Springer: Berlin/Heidelberg, Germany, 2020; pp. 372–384. [Google Scholar] [CrossRef]
- Hu, L.Y.; Hu, Y.H.; Tsai, C.F.; Wang, J.S.; Huang, M.W. Building an associative classifier with multiple minimum supports. SpringerPlus 2016, 5, 528. [Google Scholar] [CrossRef] [PubMed]
- Deng, H.; Runger, G.; Tuv, E.; Bannister, W. CBC: An Associative Classifier with a Small Number of Rules. Decis. Support Syst. 2014, 59, 163–170. [Google Scholar] [CrossRef]
- Rajab, K. New Associative Classification Method Based on Rule Pruning for Classification of Datasets. IEEE Access 2019, 7, 157783–157795. [Google Scholar] [CrossRef]
- Mattiev, J.; Kavšek, B. Coverage-Based Classification Using Association Rule Mining. Appl. Sci. 2020, 10, 7013. [Google Scholar] [CrossRef]
- Thabtah, F.; Cowling, P.; Peng, Y. MCAR: Multi-class Classification based on Association Rule. In Proceedings of the 3rd ACS/IEEE International Conference onComputer Systems and Applications, Cairo, Egypt, 6 January 2005; Volume 2005, p. 33. [Google Scholar] [CrossRef]
- Thabtah, F.; Cowling, P.; Peng, Y. MMAC: A new multi-class, multi-label associative classification approach. In Proceedings of the Fourth IEEE International Conference on Data Mining (ICDM’04), Brighton, UK, 1–4 November 2004; pp. 217–224. [Google Scholar] [CrossRef]
- Mattiev, J.; Kavsek, B. Distance based clustering of class association rules to build a compact, accurate and descriptive classifier. Comput. Sci. Inf. Syst. 2021, 18, 791–811. [Google Scholar] [CrossRef]
- Chen, G.; Liu, H.; Yu, L.; Wei, Q.; Xing, Z. A new approach to classification based on association rule mining. Decis. Support Syst. 2006, 42, 674–689. [Google Scholar] [CrossRef]
- Kaufman, L.; Rousseeuw, P. Finding Groups in Data: An Introduction to Cluster Analysis; John Wiley & Sons: Hoboken, NJ, USA, 1990. [Google Scholar] [CrossRef]
- Zaït, M.; Messatfa, H. A comparative study of clustering methods. Future Gener. Comput. Syst. 1997, 13, 149–159. [Google Scholar] [CrossRef]
- Arabie, P.; Hubert, L.J. An Overview of Combinatorial Data Analysis. In Clustering and Classification; Arabie, P., Hubert, L.J., Soete, G.D., Eds.; World Scientific Publishing: Hackensack, NJ, USA, 1996; pp. 5–63. [Google Scholar]
- Ng, T.R.; Han, J. Efficient and Effective Clustering Methods for Spatial Data Mining. In Proceedings of the 20th Conference on Very Large Data Bases (VLDB), Santiago, Chile, 12–15 September 1994; pp. 144–155. [Google Scholar]
- Zhang, T.; Ramakrishnan, R.; Livny, M. BIRCH: An Efficient Data Clustering Method for Very Large Databases. In Proceedings of the 1996 ACM SIGMOD International Conference on Management of Data, New York, NY, USA, 22–27 June 2013 1996; SIGMOD’96. pp. 103–114. [Google Scholar] [CrossRef]
- Theodoridis, S.; Koutroumbas, K. Chapter 13. Clustering Algorithms II: Hierarchical Algorithms; Academic Press: San Diego, CA, USA, 2009; pp. 653–700. [Google Scholar] [CrossRef]
- Dua, D.; Graff, C. UCI Machine Learning Repository; University of California: Irvine, CA, USA, 2019. [Google Scholar]
- Hall, M.; Frank, E. Combining Naive Bayes and Decision Tables. In Proceedings of the Twenty-First International Florida Artificial Intelligence Research Society Conference, Coconut Grove, FL, USA, 15–17 May 2008; AAAI Press: Washington, DC, USA, 2008. [Google Scholar]
- Kohavi, R. The Power of Decision Tables. In European Conference on Machine Learning; Springer: Berlin/Heidelberg, Germany, 1995; pp. 174–189. [Google Scholar]
- Yin, X.; Han, J. CPAR: Classification Based on Predictive Association Rules. In Proceedings of the 2003 SIAM International Conference on Data Mining. Society for Industrial and Applied Mathematics, San Francisco, CA, USA, 1–3 May 2003; Volume 3. [Google Scholar] [CrossRef]
- Salzberg, S.L. C4.5: Programs for Machine Learning by J. Ross Quinlan; Springer: Berlin/Heidelberg, Germany, 1994; Volume 16, pp. 235–240. [Google Scholar] [CrossRef]
- Mattiev, J.; Kavšek, B. Simple and Accurate Classification Method Based on Class Association Rules Performs Well on Well-Known Datasets. In Machine Learning, Optimization, and Data Science, Proceedings of the 5th International Conference, LOD 2019, Siena, Italy, 10–13 September 2019; Springer: Berlin/Heidelberg, Germany, 2019; pp. 192–204. [Google Scholar] [CrossRef]
- Chaudhary, U.; Papapanagiotou, I.; Devetsikiotis, M. Flow classification using clustering and association rule mining. In Proceedings of the 2010 15th IEEE International Workshop on Computer Aided Modeling, Analysis and Design of Communication Links and Networks (CAMAD), Miami, FL, USA, 3–4 December 2010. [Google Scholar] [CrossRef]
- Dahbi, A.; Mohammed, M.; Balouki, Y.; Gadi, T. Classification of association rules based on K-means algorithm. In Proceedings of the 2016 4th IEEE International Colloquium on Information Science and Technology (CiSt), Tangier, Morocco, 24–26 October 2016; pp. 300–305. [Google Scholar] [CrossRef]
- Quinlan, J.R.; Cameron-Jones, R.M. FOIL: A midterm repor. In Machine Learning: ECML-93, Proceedings of the European Conference on Machine Learning Vienna, Austria, 5–7 April 1993; Springer: Berlin/Heidelberg, Germany, 1993; Volume 667, pp. 3–20. [Google Scholar] [CrossRef]
- Han, J.; Pei, J.; Yin, Y. Mining Frequent Patterns without Candidate Generation; Association for Computing Machinery: New York, NY, USA, 2000; pp. 1–12. [Google Scholar]
- Mattiev, J.; Kavšek, B. A compact and understandable associative classifier based on overall coverage. Procedia Comput. Sci. 2020, 170, 1161–1167. [Google Scholar] [CrossRef]
- Gupta, K.G.; Strehl, A.; Ghosh, J. Distance based clustering of association rules. In Proceedings of the Artificial Neural Networks in Engineering Conference, St. Louis, MI, USA, 7–10 November 1999; pp. 759–764. [Google Scholar]
- Kosters, W.A.; Marchiori, E.; Oerlemans, A.A.J. Mining Clusters with Association Rules. In Proceedings of the Advances in Intelligent Data Analysis, Amsterdam, The Netherlands, 9–11 August 1999; Hand, D.J., Kok, J.N., Berthold, M.R., Eds.; Springer: Berlin/Heidelberg, Germany, 1999; pp. 39–50. [Google Scholar]
Figure 1.
Comparison of classification models on bigger datasets based on classifier size.

Figure 2.
Comparison of classification models in terms of average accuracy and number of rules.

Figure 3.
Comparison of classification models on “precision”, “recall” and “F-measure”.


Table 1.
Datasets description.
| Dataset | Attributes | Classes | Records | Analyzed Rules |
|---|---|---|---|---|
| Car.Evn | 7 | 4 | 1728 | 10,000 |
| Tic-Tac-Toe | 10 | 2 | 958 | 10,000 |
| Nursery | 9 | 5 | 12,960 | 20,000 |
| Mushroom | 23 | 2 | 8124 | 20,000 |
| Abalone | 9 | 3 | 4177 | 10,000 |
| Adult | 15 | 2 | 45,221 | 20,000 |
| Laptop | 11 | 3 | 1303 | 10,000 |
| Chess | 37 | 2 | 3196 | 10,000 |
| Connect4 | 43 | 3 | 67,557 | 10,000 |
| Airplane | 17 | 2 | 103,904 | 20,000 |
| Airline Reviews | 8 | 2 | 129,455 | 20,000 |
| Diabetes | 13 | 2 | 70,692 | 10,000 |
| Recruitment | 7 | 2 | 215 | 1000 |
Table 2.
Evaluation of classification models on accuracy.
| Dataset | DTNB | DT | C4.5 | CPAR | CMAR | CBA | SA | ACMKC |
|---|---|---|---|---|---|---|---|---|
| Car.Evn | 95.4 ± 0.8 | 91.3 ± 1.7 | 92.1 ± 1.7 | 78.1 ± 2.5 | 86.7 ± 2.1 | 91.2 ± 3.9 | 86.2 ± 2.1 | 83.0 ± 3.0 |
| Tic-Tac-Toe | 69.9 ± 2.7 | 74.4 ± 4.4 | 85.2 ± 2.7 | 70.5 ± 1.6 | 95.3 ± 1.8 | 73.1 ± 0.8 | 91.7 ± 1.5 | 74.4 ± 3.7 |
| Nursery | 94.0 ± 1.5 | 93.6 ± 1.2 | 95.4 ± 1.4 | 78.9 ± 1.2 | 91.7 ± 2.2 | 92.1 ± 2.4 | 91.6 ± 1.2 | 85.6 ± 1.3 |
| Mushroom | 75.0 ± 7.2 | 53.4 ± 8.3 | 78.7 ± 8.4 | 99.1 ± 0.0 | 99.4 ± 0.0 | 75.6 ± 10.9 | 73.1 ± 6.0 | 83.0 ± 0.9 |
| Abalone | 62.1 ± 1.3 | 61.8 ± 1.5 | 62.3 ± 1.2 | 60.2 ± 1.1 | 58.3 ± 1.7 | 61.1 ± 1.0 | 61.0 ± 0.9 | 66.9 ± 5.3 |
| Adult | 73.0 ± 4.1 | 82.0 ± 2.3 | 82.4 ± 4.7 | 77.4 ± 2.9 | 80.2 ± 2.4 | 81.8 ± 3.4 | 80.8 ± 2.6 | 82.8 ± 4.5 |
| Laptop | 75.7 ± 2.6 | 72.9 ± 2.9 | 75.3 ± 2.3 | 70.9 ± 2.7 | 72.8 ± 1.0 | 75.4 ± 2.0 | 72.0 ± 1.4 | 71.5 ± 3.3 |
| Chess | 93.7 ± 3.0 | 97.3 ± 3.1 | 98.9 ± 3.6 | 93.7 ± 3.2 | 93.8 ± 2.9 | 95.4 ± 2.9 | 92.2 ± 3.8 | 95.7 ± 2.7 |
| Connect4 | 78.8 ± 5.9 | 76.7 ± 7.7 | 80.0 ± 6.8 | 68.6 ± 4.4 | 68.8 ± 4.7 | 80.9 ± 8.1 | 78.7 ± 6.0 | 82.4 ± 4.4 |
| Airplane | 89.6 ± 0.9 | 93.2 ± 0.3 | 95.7 ± 0.2 | 88.2 ± 1.3 | 91.7 ± 2.2 | 75.7 ± 6.9 | 77.4 ± 8.1 | 83.2 ± 0.8 |
| Airline Reviews | 94.0 ± 1.0 | 94.0 ± 1.9 | 93.8 ± 1.4 | 96.0 ± 0.9 | 94.2 ± 1.2 | 74.2 ± 1.8 | 76.2 ± 2.6 | 92.1 ± 2.1 |
| Diabetes | 72.9 ± 0.6 | 73.1 ± 0.5 | 72.9 ± 0.4 | 69.9 ± 1.7 | 70.9 ± 0.6 | 71.7 ± 2.4 | 70.0 ± 1.7 | 74.2 ± 1.5 |
| Recruitment | 65.1 ± 5.2 | 67.5 ± 5.9 | 63.0 ± 6.4 | 63.8 ± 3.4 | 67.2 ± 2.8 | 64.4 ± 2.5 | 61.6 ± 4.1 | 65.3 ± 5.5 |
| Average (%): | 79.9 ± 2.8 | 79.3 ± 3.2 | 82.7 ± 3.2 | 78.8 ± 2.1 | 82.4 ± 2.0 | 77.8 ± 3.8 | 77.9 ± 3.2 | 80.0 ± 3.0 |
Table 3.
Comparison of classification models on accuracy based on statistically significant wins/losses counts.
Table 3.
Comparison of classification models on accuracy based on statistically significant wins/losses counts.
| DTNB | DT | C4.5 | CPAR | CMAR | CBA | SA | |
|---|---|---|---|---|---|---|---|
| W | 5 | 3 | 3 | 7 | 4 | 5 | 8 |
| L | 4 | 3 | 6 | 3 | 5 | 3 | 3 |
| N | 4 | 7 | 4 | 3 | 4 | 5 | 2 |
Table 4.
Evaluation of classification models based on number of rules.
| Dataset | DTNB | DT | C4.5 | CPAR | CMAR | CBA | SA | ACMKC |
|---|---|---|---|---|---|---|---|---|
| Car.Evn | 144 | 432 | 123 | 40 | 567 | 72 | 160 | 21 |
| Tic-Tac-Toe | 258 | 121 | 88 | 11 | 166 | 23 | 60 | 48 |
| Nursery | 1240 | 804 | 301 | 60 | 1935 | 141 | 175 | 132 |
| Mushroom | 50 | 50 | 26 | 19 | 100 | 15 | 70 | 12 |
| Abalone | 165 | 60 | 49 | 17 | 834 | 132 | 155 | 36 |
| Adult | 737 | 1571 | 279 | 120 | 3411 | 126 | 130 | 101 |
| Laptop | 101 | 101 | 72 | 41 | 783 | 39 | 75 | 45 |
| Chess | 507 | 101 | 31 | 14 | 282 | 14 | 120 | 12 |
| Connect4 | 3826 | 952 | 3973 | 657 | 6877 | 349 | 600 | 267 |
| Airplane | 3201 | 4444 | 772 | 41 | 391 | 104 | 660 | 120 |
| Airline Reviews | 186 | 890 | 259 | 117 | 3218 | 121 | 140 | 99 |
| Diabetes | 160 | 244 | 221 | 37 | 3572 | 95 | 160 | 24 |
| Recruitment | 20 | 8 | 13 | 10 | 106 | 15 | 14 | 12 |
| Average: | 773 | 1060 | 477 | 90 | 1710 | 95 | 184 | 71 |
Table 5.
Comparison of classification models on rules based on statistically significant wins/losses counts.
Table 5.
Comparison of classification models on rules based on statistically significant wins/losses counts.
| DTNB | DT | C4.5 | CPAR | CMAR | CBA | SA | |
|---|---|---|---|---|---|---|---|
| W | 13 | 12 | 12 | 6 | 13 | 7 | 12 |
| L | 0 | 1 | 0 | 4 | 0 | 3 | 0 |
| N | 0 | 0 | 1 | 3 | 0 | 3 | 1 |
Disclaimer/Publisher’s Note: The statements, opinions and data contained in all publications are solely those of the individual author(s) and contributor(s) and not of MDPI and/or the editor(s). MDPI and/or the editor(s) disclaim responsibility for any injury to people or property resulting from any ideas, methods, instructions or products referred to in the content. |
© 2023 by the authors. Licensee MDPI, Basel, Switzerland. This article is an open access article distributed under the terms and conditions of the Creative Commons Attribution (CC BY) license (https://creativecommons.org/licenses/by/4.0/).
Share and Cite
MDPI and ACS Style
Mattiev, J.; Davityan, M.; Kavsek, B. ACMKC: A Compact Associative Classification Model Using K-Modes Clustering with Rule Representations by Coverage. Mathematics 2023, 11, 3978. https://doi.org/10.3390/math11183978
AMA Style
Mattiev J, Davityan M, Kavsek B. ACMKC: A Compact Associative Classification Model Using K-Modes Clustering with Rule Representations by Coverage. Mathematics. 2023; 11(18):3978. https://doi.org/10.3390/math11183978
Chicago/Turabian StyleMattiev, Jamolbek, Monte Davityan, and Branko Kavsek. 2023. "ACMKC: A Compact Associative Classification Model Using K-Modes Clustering with Rule Representations by Coverage" Mathematics 11, no. 18: 3978. https://doi.org/10.3390/math11183978
Note that from the first issue of 2016, this journal uses article numbers instead of page numbers. See further details here.