

Studies on Finite Element Analysis in Hydroforming of Nimonic 90 Sheet
School of Mechanical Engineering, Vellore Institute of Technology, Vellore 632014, India
*
Author to whom correspondence should be addressed.
Mathematics 2023, 11(11), 2437; https://doi.org/10.3390/math11112437
Submission received: 27 April 2023
/
Revised: 20 May 2023
/
Accepted: 23 May 2023
/
Published: 24 May 2023
(This article belongs to the Special Issue Numerical Simulation and Computational Methods in Engineering and Sciences)
Abstract
:The primary goal of this study was to investigate the formability of Nimonic 90 sheet which performs well at high temperatures and pressures, making it ideal for applications in the aerospace, processing, and manufacturing industries. In this present study, finite element analysis (FEA) and optimization of process parameters for formability of Nimonic 90 in sheet hydroforming were investigated. The material’s mechanical properties were obtained by uniaxial tensile tests as per the standard ASTM E8/E8M. The sheet hydroforming process was first simulated to obtain maximum pressure (53.46 MPa) using the FEA and was then validated using an experiment. The maximum pressure obtained was 50.5 MPa in experimentation. Since fully experimental or simulation designs are impractical, the Box–Behnken design (BBD) was used to investigate various process parameters. Formability was measured by the forming limit diagram (FLD) and maximum deformation achieved without failure. Analysis of variance (ANOVA) results also revealed that pressure and thickness were the most effective parameters for achieving maximum deformation without failure. Response surface methodology (RSM) optimizer was used to predict optimized process parameter to achieve maximized response (deformation) without failure. Experimental validation was carried out for the optimized parameters. The percentage of error between experimental and simulation results for maximum deformation was less than 5%. The findings revealed that all the aspects in the presented regression model and FEM simulation were effective on response values.
Keywords:
simulation; sheet hydroforming; optimization; Nimonic 90; mechanical properties; formability; design of experiments; finite element analysis; Box–Behnken designMSC:
65-04; 65-05; 65K101. Introduction
In most the industries, including the automotive and aerospace sectors, hydroforming was used to manufacture components which are challenging in metal forming [1]. It produces structurally strong components with complex geometry quickly, efficiently, and cost-effectively [1,2,3]. The benefits of hydroformed parts include improved strength to weight ratios, weight savings from section designs that are more effective, fewer parts, and reduced costs associated with tooling development, better dimensional stability and reproducibility of produced components, and subassemblies [4]. Since there are no welding joints, the parts produced in hydroforming can absorb more crash energy. This means that vehicles are more crashworthy, which translates into improved safety for vehicle occupants in the event of a crash [2]. All complex geometries of automotive components, such as rear axle subframe, a front axle, twin elbow exhaust manifold, fuel tank and roofs for luxury class cars, can be obtained through hydroforming [2,5]. Hydroforming processes are eco-friendly, as they reduce the amount of scrap, emit less noise pollution, and protect the environment, as forming is carried out only by the liquid medium [2]. Tube hydroforming and sheet hydroforming are the two primary divisions of the hydroforming process [4]. Sheet hydroforming is a near net shape manufacturing process, which means the parts it produces are very close to the final specified geometry and require very little rework [1]. This process will result in a reduction in the number of production steps and components in an assembly. This would reduce dimensional variations and make assembly easier [3]. The sheet hydroforming process, as shown in Figure 1, uses high pressure fluid for deformation of a blank (sheet) into a desired shape with die.
The most common material instabilities in sheet metals are wrinkling and tearing. Parameters of the sheet hydroforming process must be adequately modified to produce the desired results without wrinkling and tearing. The forming process parameters of sheet hydroforming includes pressure, blank holder force, sheet thickness, etc. Although most hydroforming operations are kept under 1000 bar, pressure intensification systems on high pressure hydroforming equipment can reach pressures ranging from 1000 to 4000 bar. Exceeding 4000 bar is possible, but it reduces the equipment’s service life while drastically increasing its complexity [6,7]. Blank holding force (BHF) will depend on the magnitude of the fluid pressure and the area of the blank in contact with the blank holder. It should be noted that in sheet hydroforming, the area of the blank in contact with the blank holder continuously decreases, and so, proper BHF is required to avoid wrinkling and rupture [8]. Sheet thickness influences formability and forming limits [9].
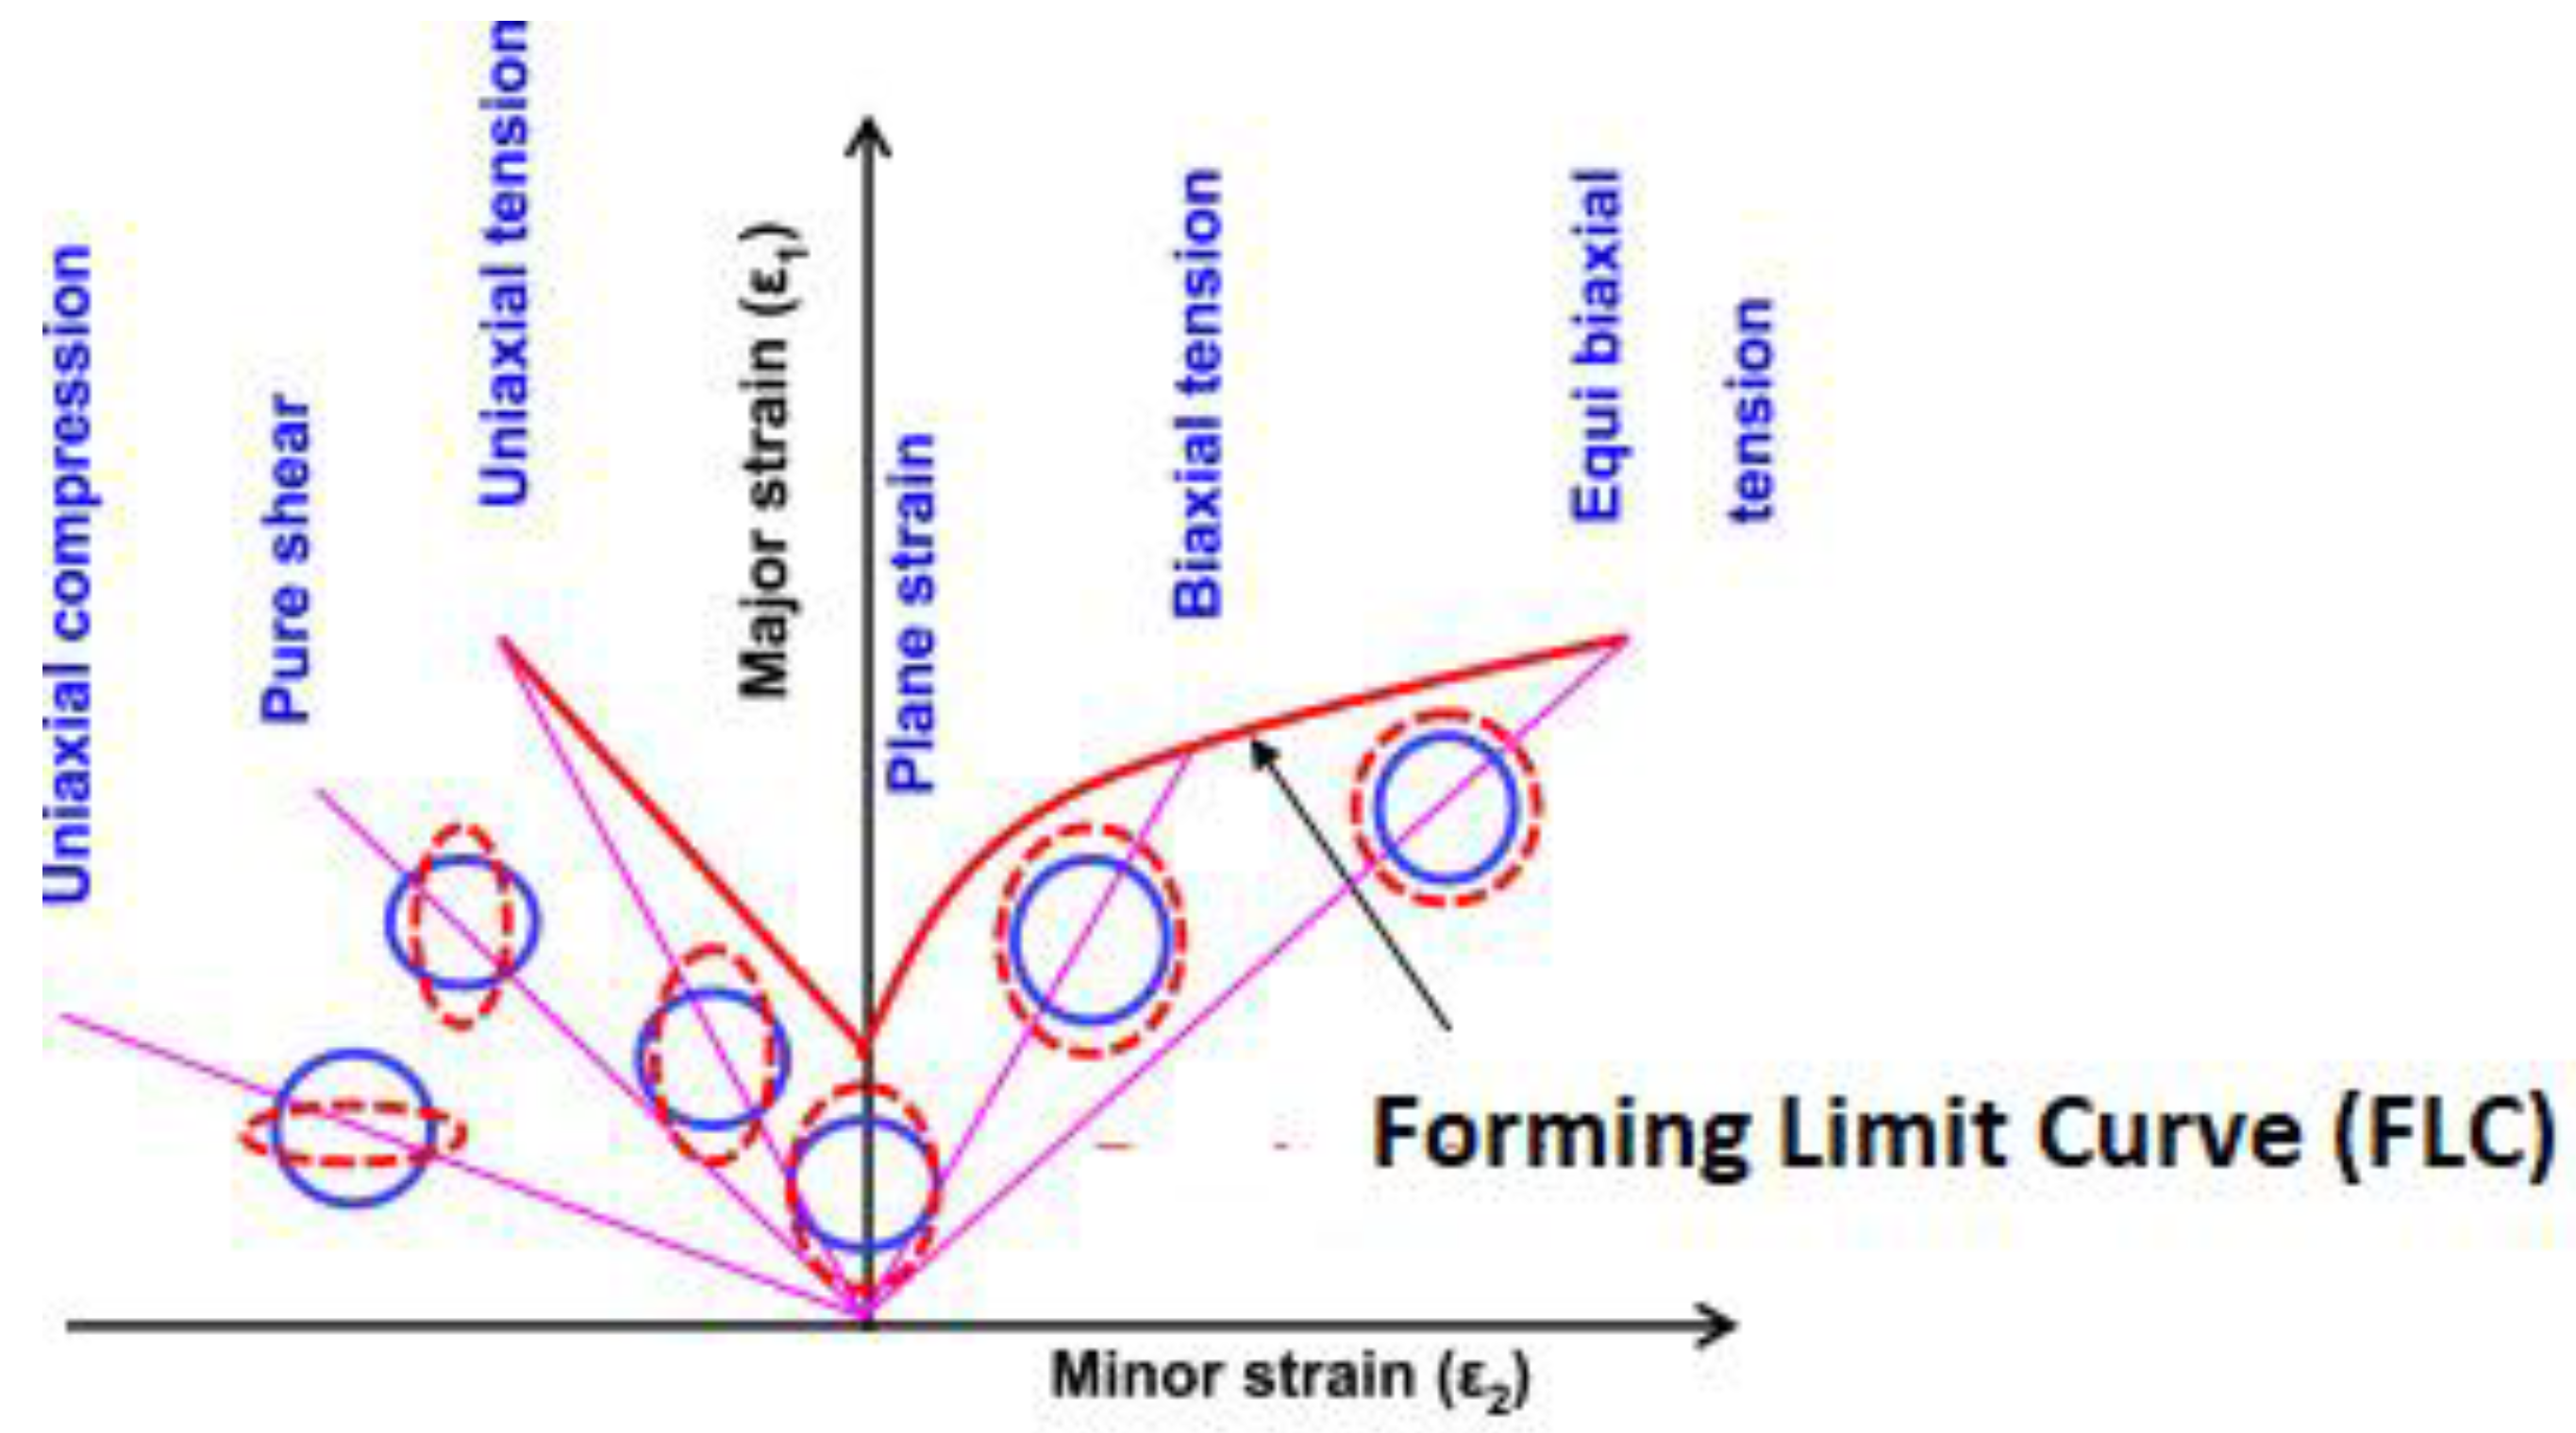
Improved formability in hydroforming is primarily caused by more evenly distributed strain, which results in less thinning at the corners [10]. In all forming operations using sheet metal as an input material, it is critical to understand the conditions that cause necking (instability of material) or fracture. Such limits can be represented as a forming limit diagram (FLD) shown in Figure 2, which plots the curve of major and minor strain coordinates [11]. The strain in the direction of the maximum strain is defined as the major strain. The strain perpendicular to the major strain is known as the minor strain. The major strain is always positive and is plotted vertically, while the minor strain is plotted horizontally [12]. The combinations of major and minor strains lying below the forming limit curve (FLC) define a safe operating region and failure is represented by the region above the FLC. FLD offers a useful summary. Formability helps to quickly identify key areas that need additional investigation, especially for early feasibility studies.
As the experimental procedure for the metal forming process is costly and time-consuming, the finite element method (FEM) has the advantage of lowering production costs by predicting part defects such as spring-back, rupture, wrinkling, buckling, and shape errors, as well as optimizing process parameters [13].
Design of experiments (DOE) approaches were used to maximize response variables in the presence of multiple factors. DOE is the process of using geometric concepts to statistical sampling in order to produce desired outputs. The DOE’s primary goal is to obtain the desired response with the fewest possible trials because conducting fewer experiments results in a reduction in the cost and time needed to carry out the experiments [14].
Nickel alloys are long-lasting materials known for their ability to operate at extremely high temperatures for extended periods of time. Nickel-based superalloys with outstanding high-temperature tensile strength, improved oxidation resistance, weldability, fatigue resistance, corrosion resistance, and long-term structural stability were used in high-temperature parts of aeroengines and industrial gas turbines [15]. Single crystal superalloys based on nickel have outstanding high-temperature mechanical properties and are commonly employed as turbine blade materials in current aviation gas turbine engines [16]. Although strong, nickel alloys are also relatively ductile, allowing them to be formed using a variety of different processes, although at higher pressures than other metals [17]. Nimonic 90, an nickel alloy, is an ideal material to use in aircraft parts, exhaust nozzles, and gas turbine components where the pressure and heat are extreme [18]. Nimonic 90 has high strength at high temperature levels, and it is highly resistant to scaling, oxidation, heat, and corrosion [19].
Existing studies lack in hydroforming Nimonic 90 sheet. The aim of this study is to propose an FEA model for formability analysis in the hydroforming of Nimonic 90 sheets. The following objectives will help to achieve this goal:
- Derivation of FEA model for sheet hydroforming;
- Validation of FEA result with experimentation;
- Evaluation of forming limit diagram;
- Determination of optimum process parameters for hydroforming of Nimonic 90 sheet;
- Discussion of the FEA model’s accuracy.
In this present study, first, mechanical properties of Nimonic 90 sheet were obtained by uniaxial tensile test as per the standard ASTM E8/E8M. Secondly, finite element method (FEM) simulation of the process was run to obtain the maximum pressure and blank holder force and was compared to experimental results. Thirdly, Box–Behnken design (BBD) of response surface methodology (RSM) was used to design the experiments by using lower and higher levels of variable parameters. Fourthly, FEM simulations were carried out as per the design of experiments (DOE). Fifthly, the impact of process factors (Pressure, Blank Holder Force, and Sheet Thickness) during the hydroforming of Nimonic 90 sheets was analyzed using RSM. Sixth, RSM optimizer was used to predict the optimized process parameter to achieve maximized response (deformation) without failure (crack or wrinkling). Lastly, a validation experiment was conducted, and the findings were discussed.
2. Material and Methodology
In this section, details of material properties, computer-aided design (CAD) modeling, FEM simulation, experimentation DOE, and optimization are discussed.
2.1. Material and Its Properties
In this study, the material used was Nimonic 90. The material was tested in the AUM Meta Lab, Mumbai, India, to obtain the chemical composition that is illustrated in Table 1.
Uniaxial tensile tests were carried out as per the standard ASTM E8/E8M as shown in Figure 3. The specimens were cut using electrical discharge machining, as shown in Figure 4.
The mechanical properties of the Nimonic 90 sheet as determined from the tensile test are given in Table 2. True stress (σt) and True strain (εt) [20] were calculated using Equation (1).
where σe is Engineering stress and εe is Engineering strain.
σt = σe (1 + εe), and εt = ln(1 + εe),
The multilinear points of the stress–strain curve can be obtained using Ramberg–Osgood equation [21]. Where is strain, E is Young’s modulus, σ is stress, σy is yield strength, and n is strain-hardening coefficient
This Ramberg–Osgood equation shown in Equation (2) was used to approximate the non-linear relationship between strain and stress.
2.2. CAD Modeling and Finite Element Simulation
2.2.1. CAD Modeling
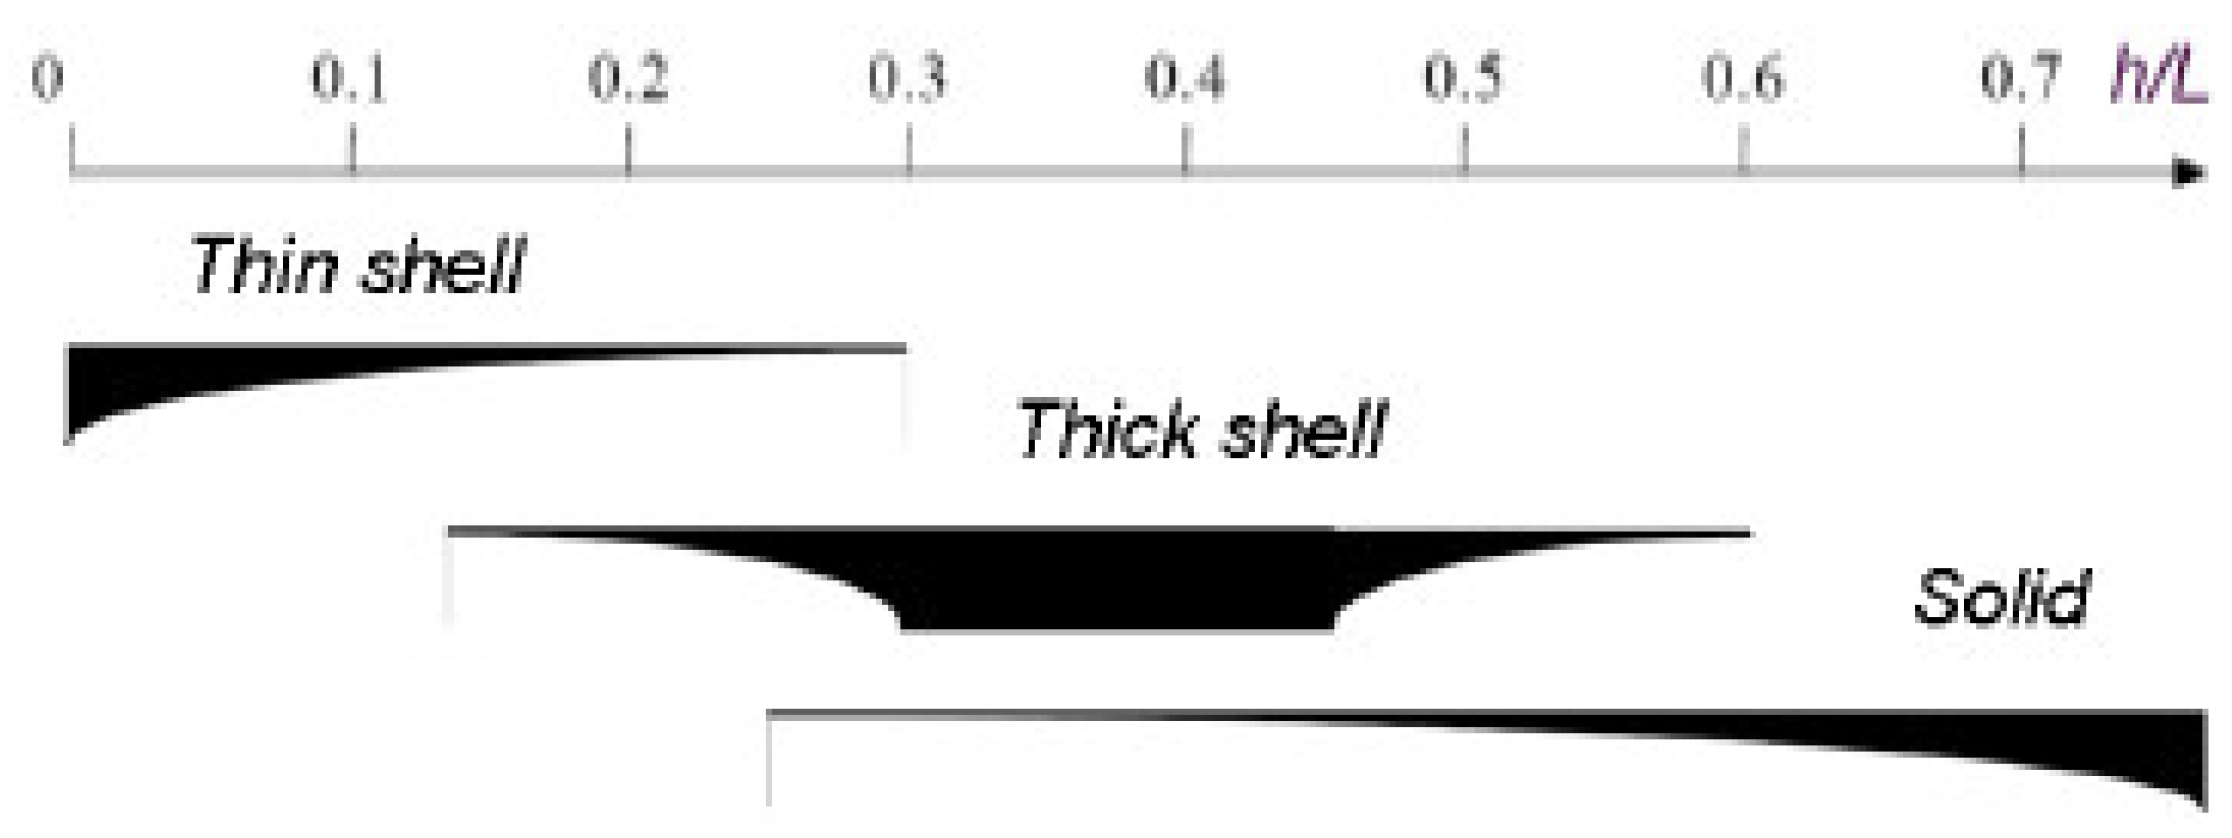
In this study, Autodesk Fusion 360 software was used to model components as shell elements for FEA simulations, as shown in Figure 5 Shell elements were used in FEA to achieve better results, because they allowed modelling of narrow features with fewer mesh components [22], and computational time was reduced. As per the approximation model shown in Figure 6, thin shell approximation was applied in this model as the ratio between thickness and length (h/L Chart) was within 0.3 [23].
2.2.2. Development of Finite Element Model
To input the properties of Nimonic 90, two regions, elastic and plastic regions, were considered. The elastic properties were assigned as listed in Table 2 and true stress and true strain of the plastic region of the material were given as per Figure 7.
Meshing was carried out using Ansys Mechanical. The elements used for meshing were quadrilateral elements as they produced far smoother surfaces than triangular elements, as triangular elements frequently produced visible anomalies on the surface [25]. All the free elements were set to quad type and the element size was 2 mm. Some of the critical areas such as the blank surface, fillets, and corner surfaces were defined with smaller element sizes of 1 mm using the face sizing option. Figure 8a–c shows the FEA mesh model. Once the mesh was generated, it was exported in STL format to LS Dyna. In this work, mesh refinement for convergence study was performed. Simulations were run for various mesh refinement stages.
2.3. Development of Experiment Model
To validate the outcomes of numerical simulations and identify the optimum process parameters, experimental work was carried out using a 100-ton hydraulic press, as shown in Figure 9, and 1000 bar pressure pump.
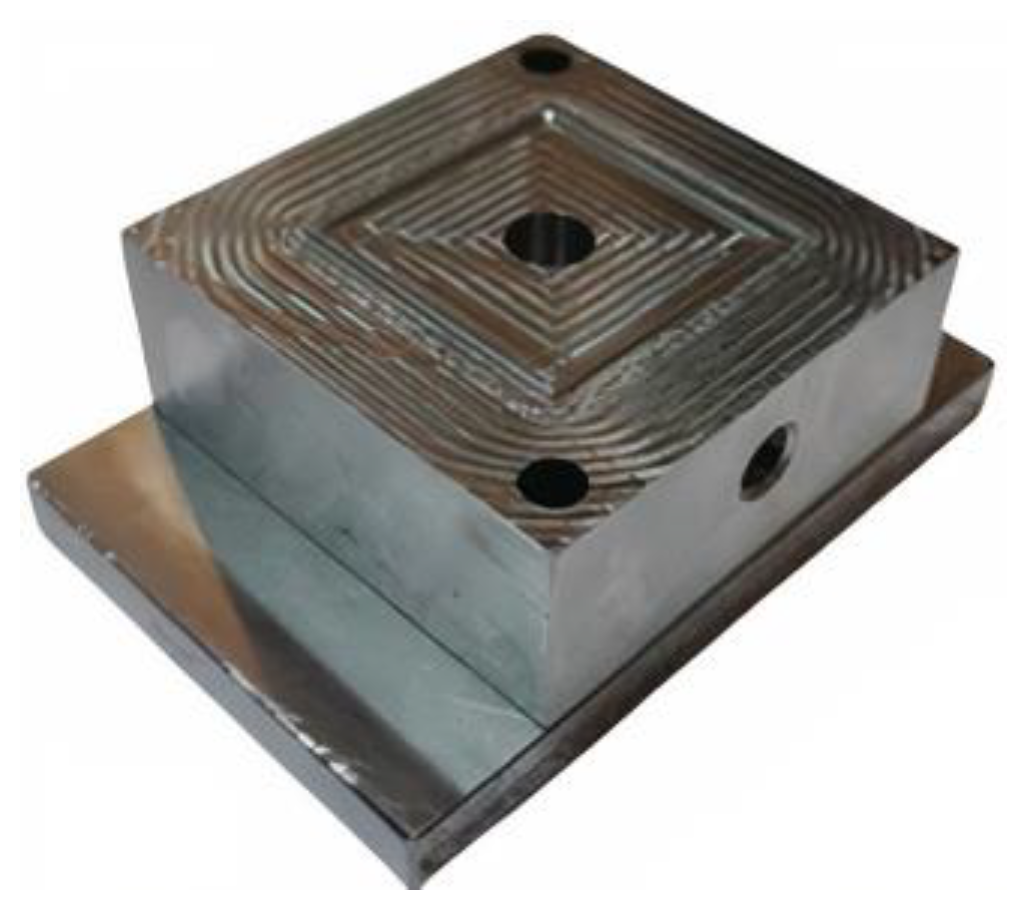
The dies shown in Figure 10 and Figure 11 were made of P20 tool steel material which has a high degree of resistance to the deformation [26].The top plate and the bottom plate were attached to the respective dies with M8 bolts, which allowed the die to be clamped with the hydraulic press. The dimension of die and sheet used are given in Table 3. The specimen, Nimonic 90, was cut as per the dimension shown in Figure 12 using a laser cutting machine.
The validation experiment was conducted for maximum pressure and for the optimum process parameters that were obtained using an RSM optimizer.
Since the finite element simulation was validated using the experimental model and it was in the permissible limit, the same was proceeded with in the design of experiments approach.
2.4. Design of Experiments
The Box–Behnken design (BBD) of RSM was used in this study to analyze the regression model and determine the effects of variable parameters on the outputs. In the present study, three processing parameters including pressure (Pr), blank holder force (BHF), and thickness (T) of sheet were considered and their effects on the deformation without failure were investigated using RSM. The experiments were designed in accordance with the BBD by using lower and higher levels of variable parameters, procuring 15 experiments to run using Minitab software. Table 4 illustrates the conditions under which the simulations were performed.
The primary goal of RSM was to achieve an optimal response through a series of designed experiments. In most cases, the RSM regression model was a quadratic full equation [13] as Equation (3), where y is the response variable. Additionally, α0, α1, α2, and α3 are constant, linear, quadratic, and interaction coefficients, respectively. Additionally, xi and xj are the independent variables and E is the statistical error. The effectiveness of the regression model was then assessed using R2 as Equation (3), which can be obtained from ANOVA.
3. Results and Discussion
Figure 13 shows the analysis result of maximum pressure for failure. The simulation result for maximum pressure was validated using experimentation. Figure 14 represents the validation result of maximum pressure for failure during hydroforming.
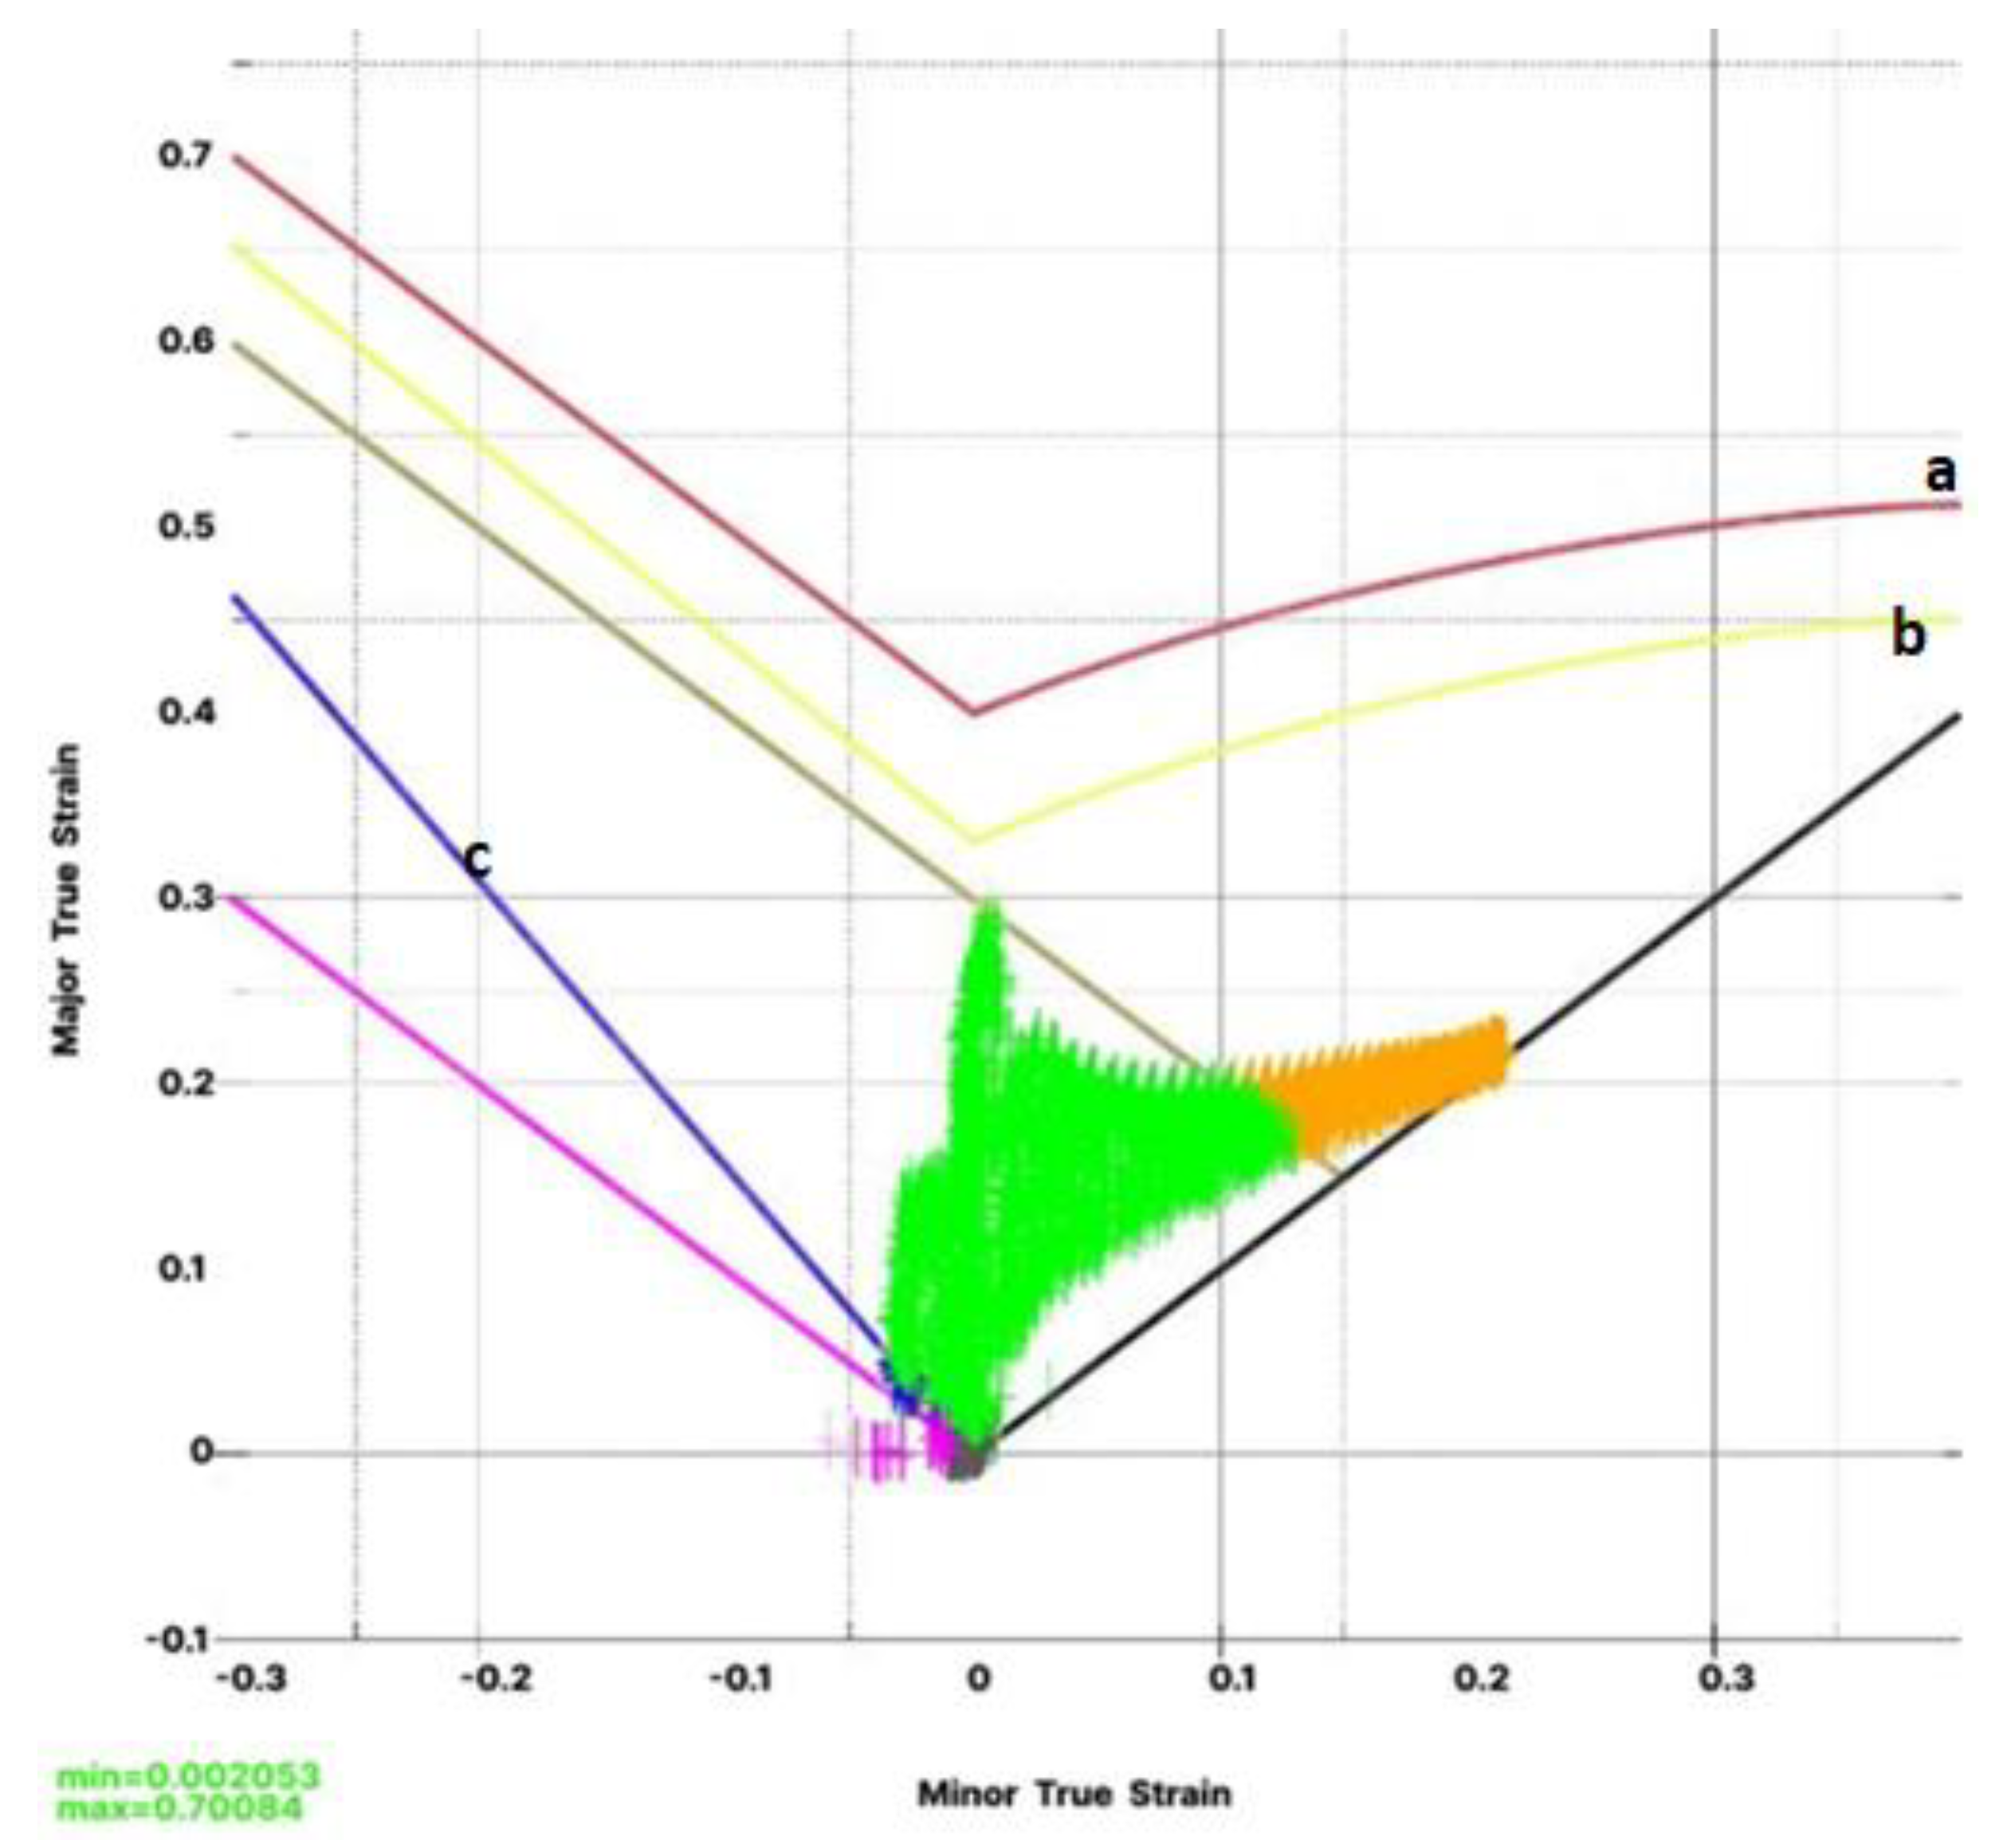
Table 5 represents the maximum pressure obtained during hydroforming in FEA simulation and experimentation. Then, the finite element simulation process was carried out under different conditions according to the design of experiments (Table 4), and the response variable, i.e., deformation (De), was obtained, as shown in Table 6. Forming limit diagram obtained using LSdyna, as shown in Figure 15, depicts the major and minor strain of Nimonic 90 in hydroforming. Strain combinations over the FLC will result in fracture, whereas those below the wrinkling limit line will result in wrinkles. For a fixed minor strain, a larger gap between the FLC and wrinkling limit lines signifies more potential for forming [27]. In Figure 15, the gap between the FLC and wrinkling limit line was more, the Nimonic 90 sheet was more suitable for forming.
The ANOVA analysis yielded regression models for estimating the value of deformation (De) for Nimonic 90 as Equation (5).
De = 8.52 + 0.3483 × Pr − 0.00044 × BHF − 14.59 × T + 0.000262 × Pr × Pr − 0.000001 × BHF × BHF + 7.344 × T × T − 0.000000 × Pr × BHF − 0.1925 × Pr × T + 0.00031 × BHF × T
During this study, a confirmatory experiment was carried out to validate the optimized RSM solutions. Figure 16 shows the deformed Nimonic 90 sheet. Table 7 compares the predicted and experimental results of the response (deformation) in the formability of Nimonic 90. The table shows that the error percentage between predicted and experimental results was less than 5%.
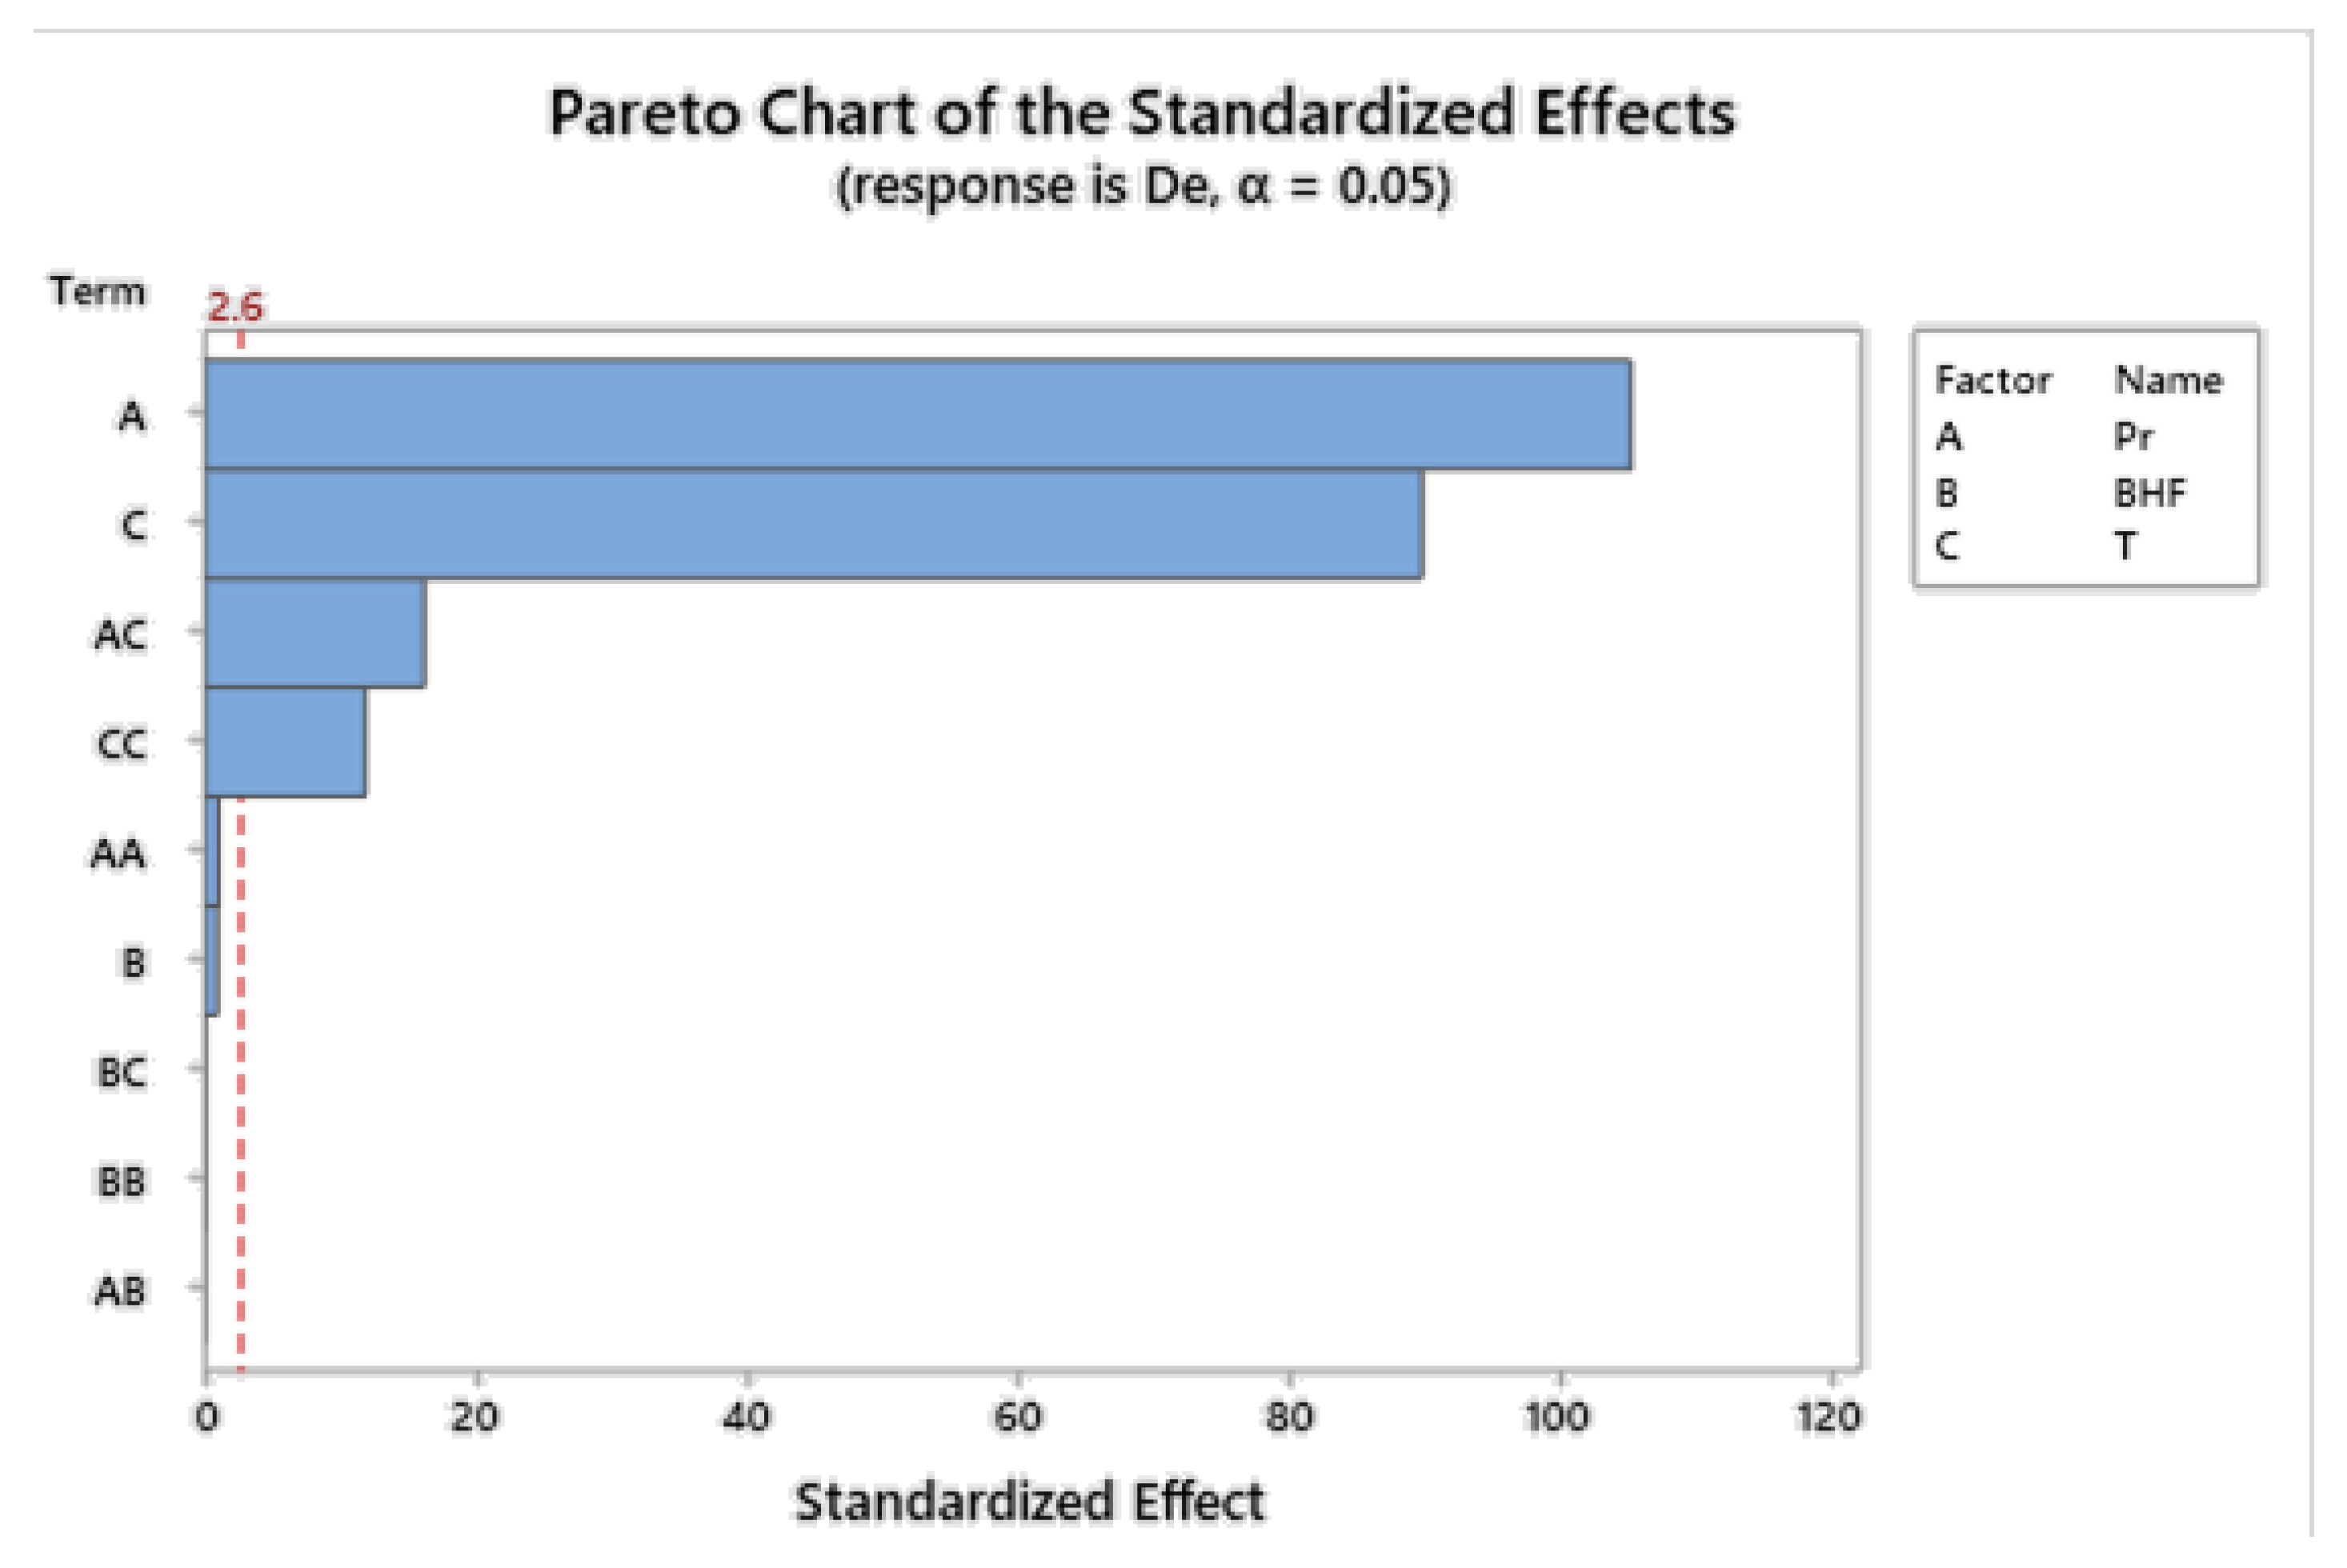
ANOVA (analysis of variance) generally helps to understand the influence of independent input parameters on dependent output parameter(s). ANOVA helps the users to prove cause and effect relationships in various forms such as R2 value, pareto chart, p-values, etc. Here, the Pareto chart shown in Figure 17 depicts the standardized effects of input parameters on output parameter (i.e., deformation). The R2 value for the present regression model of deformation regarding formability of Nimonic 90 was greater than 95%, indicating the authenticity of model [17]. Furthermore, according to Table 8, the p value for most of the input terms were less than 0.05, implying that these terms had a significant influence on the value of deformation in the sheet [28].
Figure 18 shows the optimized process parameter achieved in RSM optimizer. In experimental validation, the error percentage between experimental and simulation was less than 10%. This indicates that the proposed simulation model is capable of making accurate predictions [28,29]. Figure 19 shows the mesh convergence study.
4. Conclusions
In this study, a finite element simulation of formability of Nimonic 90 in sheet hydroforming for investigating required pressure, blank holder force, and thickness reductions was conducted. The main conclusions from this study can be concisely summarized as follows.
- The Nimonic 90 sheet tested showed good formability. The formability was higher in the plane strain and biaxial tension condition compared to the tension–compression condition;
- The fluid pressure in sheet hydroforming caused the sheet to stretch in the flange area, forcing strains above the wrinkling limit curve in the forming limit diagram (FLD);
- Since the FLD indicated no failure zone, these process parameter values were acceptable;
- As p value in the two-way interaction between pressure and thickness was less than 0.05, it was vital in achieving maximum deformation;
- Based on finite element analysis and verified experiments, BHF of 144.04 kN, pressure of 42.32 MPa, and sheet thickness of 0.8 mm were the key parameters to prevent wrinkling under the forming state for achieving the maximum deformation;
- The statistical results revealed that the models proposed in analysis had a high accuracy to estimate the optimum pressure, blank holder force, and thickness for achieving maximum deformation in formability of Nimonic 90 sheets in sheet hydroforming;
- The results demonstrated that the most effective parameters on deformation were pressure and thickness;
- The proposed FEA model is capable of accurate predictions, as the error percentage between the experiment and simulation was less than 5%
Future research will include unconventional optimization techniques to predict the optimum process parameters for better formability and applying the same methodology for different super alloys and different shapes that are more complex. An optimization code will be utilized to create the multiple response optimization for hydroforming complex automotive parts.
Author Contributions
F.A.A.J. designed and performed the FEA and optimization; P.C. was responsible for the tensile test, experimentation study, and behavior study. All authors have read and agreed to the published version of the manuscript.
Funding
This research received no external funding and the APC was funded by the authors.
Data Availability Statement
The data presented in this study are available on request from the corresponding author.
Conflicts of Interest
The authors declare no conflict of interest.
References
- Bell, C.; Corney, J.; Zuelli, N.; Savings, D. A state of the art review of hydroforming technology: Its applications, research areas, history, and future in manufacturing. Int. J. Mater. Form. 2020, 13, 789–828. [Google Scholar] [CrossRef]
- Pavithra, E.; Kumar, V.S.S. Hydroforming developments: Insights of other researchers. In Proceedings of the Applied Mechanics and Materials; Trans Tech Publications Ltd.: Zurich, Switzerland, 2012; Volume 110–116, pp. 1748–1752. [Google Scholar]
- Bakhshi-Jooybari, M.; Gorji, A.; Elyasi, M. Developments in Sheet Hydroforming for Complex Industrial Parts. In Metal Forming-Process, Tools, Design; InTech: Houston TX, USA, 2012. [Google Scholar]
- Oh, S.I.; Jeon, B.H.; Kim, H.Y.; Yang, J.B. Applications of hydroforming processes to automobile parts. J. Mater. Process. Technol. 2006, 174, 42–55. [Google Scholar] [CrossRef]
- Hu, H.; Wang, J.-F.; Fan, K.-T.; Chen, T.; Wang, S.-Y. Development of sheet hydroforming for making an automobile fuel tank. Proc. Inst. Mech. Eng. Part B J. Eng. Manuf. 2015, 229, 654–663. [Google Scholar] [CrossRef]
- Bell, C.; Dixon, C.; Blood, B.; Corney, J.; Savings, D.; Jump, E.; Zuelli, N. Enabling sheet hydroforming to produce smaller radii on aerospace nickel alloys. Int. J. Mater. Form. 2019, 12, 761–776. [Google Scholar] [CrossRef]
- Gürün, H.; Karaağaç, İ. The Experimental Investigation of Effects of Multiple Parameters on the Formability of the DC01 Sheet Metal. Strojniški Vestn.-J. Mech. Eng. 2015, 61, 651–662. [Google Scholar] [CrossRef]
- Abedrabbo, N.; Zampaloni, M.A.; Pourboghrat, F. Wrinkling control in aluminum sheet hydroforming. Int. J. Mech. Sci. 2005, 47, 333–358. [Google Scholar] [CrossRef]
- Anand, D.; Ravi Kumar, D. Effect of Sheet Thickness and Grain Size on Forming Limit Diagrams of Thin Brass Sheets. In Innovations in Infrastructure; Springer: Berlin/Heidelberg, Germany, 2019; pp. 435–444. [Google Scholar] [CrossRef]
- Feyissa, F.T.; Kumar, D.R. Enhancement of drawability of cryorolled AA5083 alloy sheets by hydroforming. J. Mater. Res. Technol. 2019, 8, 411–423. [Google Scholar] [CrossRef]
- Rubešová, K.; Rund, M.; Rzepa, S.; Jirková, H.; Jeníček, Š.; Urbánek, M.; Kučerová, L.; Konopík, P. Determining Forming Limit Diagrams Using Sub-Sized Specimen Geometry and Comparing FLD Evaluation Methods. Metals 2021, 11, 484. [Google Scholar] [CrossRef]
- Uijl, N.J.D.; Carless, L.J. Advanced metal-forming technologies for automotive applications. In Advanced Materials in Automotive Engineering; Elsevier: Amsterdam, The Netherlands, 2012; pp. 28–56. [Google Scholar] [CrossRef]
- Kahhal, P.; Ahmadi Brooghani, S.Y.; Deilami Azodi , H. Multi-objective optimization of sheet metal forming die using FEA coupled with RSM. J. Mech. Sci. Technol. 2013, 27, 3835–3842. [Google Scholar] [CrossRef]
- Hasan Nejad, S.J.; Hasanzadeh, R.; Doniavi, A.; Modanloo, V. Finite element simulation analysis of laminated sheets in deep drawing process using response surface method. Int. J. Adv. Manuf. Technol. 2017, 93, 3245–3259. [Google Scholar] [CrossRef]
- Ma, K.; Wang, J. Microstructural Characteristics and Mechanical Properties of an Additively Manufactured Nickel-Based Superalloy. Crystals 2022, 12, 1358. [Google Scholar] [CrossRef]
- Feng, Z.; Wen, Z.; Lu, G.; Zhao, Y. Influence of Cooling Scenarios on the Evolution of Microstructures in Nickel-Based Single Crystal Superalloys. Crystals 2022, 12, 74. [Google Scholar] [CrossRef]
- Horke, K.; Meyer, A.; Singer, R.F. Metal injection molding (MIM) of nickel-base superalloys. In Handbook of Metal Injection Molding; Elsevier: Amsterdam, The Netherlands, 2019; pp. 575–608. [Google Scholar] [CrossRef]
- Madderla Sandhya, D.; Ramasamy, I.K.; Anil, K.S.; Chandramouli, G.; Vinod, K. Optimization of process parameters in machining of nimonic super-alloy on EDM using genetic algorithm. Maejo Int. J. Energy Environ. Commun. 2020, 2, 35–44. [Google Scholar] [CrossRef]
- Henry Wiggin & Company Ltd. NIMONIC 90: Heat and Corrosion Resistant Nickel-Base Alloy. Alloy Dig. 1961, 10, Ni-6. [Google Scholar] [CrossRef]
- Arasaratnam, P.; Sivakumaran, K.S.; Tait, M.J. True Stress-True Strain Models for Structural Steel Elements. ISRN Civ. Eng. 2011, 2011, 1–11. [Google Scholar] [CrossRef]
- Lanzagorta, J.L.; Martín-Meizoso, A. 3-Point Bending of Bars and Rods Made of Materials Obeying a Ramberg-Osgood Criterion. World J. Mech. 2011, 1, 71–77. [Google Scholar] [CrossRef]
- Nakasumi, S.; Suzuki, K.; Ohtsubo, H.; Fujii, D. Mixed analysis of shell and solid elements using overlaying mesh method. J. Soc. Nav. Archit. Japan 2001, 2001, 219–224. [Google Scholar] [CrossRef]
- Akin, J.E. Finite Element Analysis Concepts: Via SolidWorks; Rice University: Houston, TX, USA, 2010; p. 348. [Google Scholar] [CrossRef]
- SCHULER GmbH. Sheet metal forming and blanking. In Metal Forming Handbook; Springer: Berlin/Heidelberg, Germany, 1998; pp. 123–404. [Google Scholar] [CrossRef]
- Docampo-Sanchez, J.; Haimes, R. Towards fully regular quad mesh generation. In Proceedings of the AIAA Scitech 2019 Forum, San Diego, CA, USA, 7–11 January 2019; American Institute of Aeronautics and Astronautics: Reston, Virginia, 2019. [Google Scholar] [CrossRef]
- Priyadarshini, M.; Behera, A.; Biswas, C.K.; Rajak, D.K. Experimental Analysis and Mechanical Characterization of AISI P20 Tool Steel through Heat-Treatment Process. J. Bio-Tribo-Corrosion 2022, 8, 3. [Google Scholar] [CrossRef]
- Narayanasamy, R.; Narayanan, C.S. Forming, fracture and wrinkling limit diagram for if steel sheets of different thickness. Mater. Des. 2008, 29, 1467–1475. [Google Scholar] [CrossRef]
- Foster, F.D.; Smith, T.; Whaley, R.E. Assessing Goodness-Of-Fit of Asset Pricing Models: The Distribution of the Maximal R 2. J. Financ. 1997, 52, 591. [Google Scholar] [CrossRef]
- Jankovic, A.; Chaudhary, G.; Goia, F. Designing the design of experiments (DOE)—An investigation on the influence of different factorial designs on the characterization of complex systems. Energy Build. 2021, 250, 111298. [Google Scholar] [CrossRef]
Figure 1.
The Schematic of the Sheet Hydroforming Process.

Figure 2.
The Schematic of Forming Limit Diagram.

Figure 3.
Schematic of tensile test specimen.

Figure 4.
Tensile Test Specimen.

Figure 5.
CAD model.

Figure 6.
h/L Chart.

Figure 7.
True Stress—True Strain Curve of Nimonic 90.

Figure 8.
(a) FEA mesh model of top die. (b) FEA mesh model of bottom die. (c) FEA mesh model of sheet.
Figure 8.
(a) FEA mesh model of top die. (b) FEA mesh model of bottom die. (c) FEA mesh model of sheet.


Figure 9.
Hydraulic Press.

Figure 10.
Top Die with Plate.

Figure 11.
Bottom Die with Plate.

Figure 12.
Specimen-Nimonic 90.

Figure 13.
FEA analysis for maximum pressure.

Figure 14.
Experimentation result for maximum pressure.

Figure 15.
Forming Limit Diagram for Nimonic 90 ![Mathematics 11 02437 i001]() Safe
Safe ![Mathematics 11 02437 i002]() Severe thinning. (a) Forming limit curve (FLC), (b) Risk of Failure. (c) Wrinkling limit line.
Severe thinning. (a) Forming limit curve (FLC), (b) Risk of Failure. (c) Wrinkling limit line.
 Safe
Safe  Severe thinning. (a) Forming limit curve (FLC), (b) Risk of Failure. (c) Wrinkling limit line.
Figure 15.
Forming Limit Diagram for Nimonic 90 ![Mathematics 11 02437 i001]() Safe
Safe ![Mathematics 11 02437 i002]() Severe thinning. (a) Forming limit curve (FLC), (b) Risk of Failure. (c) Wrinkling limit line.
Severe thinning. (a) Forming limit curve (FLC), (b) Risk of Failure. (c) Wrinkling limit line.
Safe Severe thinning. (a) Forming limit curve (FLC), (b) Risk of Failure. (c) Wrinkling limit line.
Figure 16.
Deformed Nimonic 90 sheet for optimized parameter.

Figure 17.
Pareto chart.

Figure 18.
Optimized parameters.

Figure 19.
Mesh Convergence Study.


Table 1.
Composition of Nimonic 90.
| Ni | Cr | Co | Ti | Al | Fe | Mn | Si | Cu | C | P | S |
|---|---|---|---|---|---|---|---|---|---|---|---|
| Bal | 18.65 | 16.7 | 2.37 | 1.38 | 0.98 | 0.67 | 0.34 | 0.085 | 0.082 | 0.008 | 0.007 |
Table 2.
Mechanical Properties of Nimonic 90.
| Material Properties | Value |
|---|---|
| Yield stress (0.2%) | 587 MPa |
| Young’s Modulus | 105.95 GPa |
| Poisson’s Ratio | 0.28 |
| Ultimate Tensile Stress | 1271 MPa |
| Strain Hardening Exponent at n value | 0.30398 |
| Strength Coefficient at n value | 1555.36974 |
Table 3.
Dimensions of Die and Sheet.
| Component | Dimension (mm) |
|---|---|
| Top Die | 100 × 100 |
| Bottom Die | 100 × 100 |
| Sheet | 65 × 65 |
| Sheet Thickness | 0.8, 1 and 1.2 |
| Die Cavity | 38 × 38 × 20 |
Table 4.
BBD- Design of Experiments.
| Std Order | Run Order | Pt Type | Blocks | Pressure (MPa) | BHF (kN) | Thickness (mm) |
|---|---|---|---|---|---|---|
| 14 | 1 | 0 | 1 | 40 | 180 | 1 |
| 4 | 2 | 2 | 1 | 50 | 220 | 1 |
| 12 | 3 | 2 | 1 | 40 | 220 | 1.2 |
| 1 | 4 | 2 | 1 | 30 | 140 | 1 |
| 3 | 5 | 2 | 1 | 30 | 220 | 1 |
| 15 | 6 | 0 | 1 | 40 | 180 | 1 |
| 6 | 7 | 2 | 1 | 50 | 180 | 0.8 |
| 8 | 8 | 2 | 1 | 50 | 180 | 1.2 |
| 9 | 9 | 2 | 1 | 40 | 140 | 0.8 |
| 10 | 10 | 2 | 1 | 40 | 220 | 0.8 |
| 11 | 11 | 2 | 1 | 40 | 140 | 1.2 |
| 13 | 12 | 0 | 1 | 40 | 180 | 1 |
| 7 | 13 | 2 | 1 | 30 | 180 | 1.2 |
| 2 | 14 | 2 | 1 | 50 | 140 | 1 |
| 5 | 15 | 2 | 1 | 30 | 180 | 0.8 |
Table 5.
Maximum Pressure obtained by FEA Simulation and Experiment.
| Maximum Pressure (MPa) | Percentage Error (%) | |
|---|---|---|
| FEA Simulation | 53.46 | 5.53 |
| Experimentation | 50.5 |
Table 6.
Deformation results obtained from FEA Simulation.
| Inputs | Output | |||
|---|---|---|---|---|
| Run Order | Pr (MPa) | BHF (kN) | T (mm) | De (mm) |
| 1 | 40 | 180 | 1 | 7.88 |
| 2 | 50 | 220 | 1 | 9.62 |
| 3 | 40 | 220 | 1.2 | 6.65 |
| 4 | 30 | 140 | 1 | 6.19 |
| 5 | 30 | 220 | 1 | 6.16 |
| 6 | 40 | 180 | 1 | 7.88 |
| 7 | 50 | 180 | 0.8 | 11.9 |
| 8 | 50 | 180 | 1.2 | 8.11 |
| 9 | 40 | 140 | 0.8 | 9.7 |
| 10 | 40 | 220 | 0.8 | 9.66 |
| 11 | 40 | 140 | 1.2 | 6.68 |
| 12 | 40 | 180 | 1 | 7.88 |
| 13 | 30 | 180 | 1.2 | 5.27 |
| 14 | 50 | 140 | 1 | 9.65 |
| 15 | 30 | 180 | 0.8 | 7.52 |
Table 7.
Confirmatory test results.
| Process Parameter | Predicted | Experimental | Percentage Error (%) | ||
|---|---|---|---|---|---|
| Pressure (MPa) | BHF (kN) | T (mm) | Deformation (mm) | Deformation (mm) | |
| 42.32 | 144.04 | 0.8 | 10.199 | 9.72 | 4.92 |
Table 8.
ANOVA results for each coefficient for deformation.
| Coefficient of Regression Model | p-Value |
|---|---|
| Model | 0.000 |
| Linear | 0.000 |
| Pr | 0.000 |
| BHF | 0.378 |
| T | 0.000 |
| Square | 0.000 |
| Pr × Pr | 0.337 |
| BHF × BHF | 0.962 |
| T × T | 0.000 |
| 2-Way Interaction | 0.000 |
| Pr × BHF | 1.000 |
| Pr × T | 0.000 |
| BHF × T | 0.920 |
Disclaimer/Publisher’s Note: The statements, opinions and data contained in all publications are solely those of the individual author(s) and contributor(s) and not of MDPI and/or the editor(s). MDPI and/or the editor(s) disclaim responsibility for any injury to people or property resulting from any ideas, methods, instructions or products referred to in the content. |
© 2023 by the authors. Licensee MDPI, Basel, Switzerland. This article is an open access article distributed under the terms and conditions of the Creative Commons Attribution (CC BY) license (https://creativecommons.org/licenses/by/4.0/).
Share and Cite
MDPI and ACS Style
Ahamed J, F.A.; Chinnaiyan, P. Studies on Finite Element Analysis in Hydroforming of Nimonic 90 Sheet. Mathematics 2023, 11, 2437. https://doi.org/10.3390/math11112437
AMA Style
Ahamed J FA, Chinnaiyan P. Studies on Finite Element Analysis in Hydroforming of Nimonic 90 Sheet. Mathematics. 2023; 11(11):2437. https://doi.org/10.3390/math11112437
Chicago/Turabian StyleAhamed J, Fakrudeen Ali, and Pandivelan Chinnaiyan. 2023. "Studies on Finite Element Analysis in Hydroforming of Nimonic 90 Sheet" Mathematics 11, no. 11: 2437. https://doi.org/10.3390/math11112437
Note that from the first issue of 2016, this journal uses article numbers instead of page numbers. See further details here.