
An Analysis of PISA 2018 Mathematics Assessment for Asia-Pacific Countries Using Educational Data Mining

1
Institute of Science and Technology, Yildiz Technical University, Istanbul 34220, Turkey
2
Department of Mathematics, İstanbul Technical University, Istanbul 34469, Turkey
3
Department of Statistics, Yildiz Technical University, Istanbul 34220, Turkey
*
Authors to whom correspondence should be addressed.
Mathematics 2023, 11(6), 1318; https://doi.org/10.3390/math11061318
Submission received: 1 February 2023
/
Revised: 5 March 2023
/
Accepted: 7 March 2023
/
Published: 9 March 2023
(This article belongs to the Special Issue Applications of Data Mining Algorithms and Big Data Analytics in Education)
Abstract
:The purpose of this paper is to determine the variables of high importance affecting the mathematics achievement of the students of 12 Asia-Pacific countries participating in the Program for International Student Assessment (PISA) 2018. For this purpose, we used random forest (RF), logistic regression (LR) and support vector machine (SVM) models to classify student achievement in mathematics. The variables affecting the student achievement in mathematics were examined by the feature importance method. We observed that the variables with the highest importance for all of the 12 Asia-Pacific countries we considered are the educational status of the parents, having access to educational resources, age, the time allocated to weekly lessons, and the age of starting kindergarten. Then we applied two different clustering analysis by using the variable importance values and socio-economic variables of these countries. We observed that Korea, Japan and Taipei form one group of Asia-Pacific countries, while Thailand, China, Indonesia, and Malaysia form another meaningful group in both clustering analyses. The results we obtained strongly suggest that there is a quantifiable relationship between the educational attainment and socio-economic levels of these 12 Asia-Pacific countries.
1. Introduction
Data mining is a multidisciplinary field in which various methods and algorithms are applied to discover hidden patterns among large data sets, and to extract new information and meaningful conclusions. There is also an increasing interest in the use of data mining methods to investigate questions in education research [1,2,3,4,5,6]. Educational data mining (EDM) is an expanding research area in which data mining methods are applied to develop novel analysis methods to extract actionable information from large data sets coming from the educational domain [7].
EDM research aims to provide a comprehensive computational methodology in many areas of educational research, such as predicting student behavior, identifying important factors affecting their success, bringing new data-based approaches to a wide range of learning theories and education policies, or making socio-cultural and socio-economic inferences [8,9,10]. An important example of such an approach is [11], where the authors conducted a comprehensive literature review of the EDM research between 1995 and 2005 and concluded that EDM can be used as an effective tool for testing educational data, generating hypotheses, and improving student performance. Similarly, in Refs. [12,13,14], extensive literature reviews of the EDM research were conducted. Another such example is Refs. [15,16,17], where the authors investigated classical machine learning techniques, such as prediction, clustering, and relation mining, on educational data.
The data used in EDM applications can be obtained from different educational environments. National and international large-scale assessments that countries participate in are frequently used for this purpose. Countries participate in these assessments to measure and compare their academic performance in order to assess their quality of education and to guide their education policies.
An important example of such an international evaluation is the Program for International Student Assessment (PISA) conducted by the Organization for Economic Co-operation and Development (OECD). PISA is a comprehensive educational assessment survey applied in mathematics, science literacy, and reading skills of students aged 15 years. First organized in 2000, PISA continues to be held every three years [18], PISA 2021 was postponed to 2022 due to the COVID-19 pandemic [19]. Apart from collecting data on the cognitive abilities of the students, the PISA exam aims to collect data about students’ motivations, self-assessments, learning styles, school environments and families. The collected data are important in determining the factors related to the academic achievement of the students [20].
The data set used in this research belongs to the PISA 2018 assessment. The report for this assessment was published by the OECD in 2019 [21]. The main purpose of this study is to use data mining techniques to investigate the socio-economic and demographic factors that affect the student achievement in mathematics in the PISA 2018 assessment, and to give a data-based investigation of relationships between PISA scores of the countries, and their socio-economic levels.
The main contributions of this research are listed as follows:
- In this study, we compared three EDM algorithms (LR, RF and SVM) in their performance in predicting the PISA 2018 mathematical achievement for each of the Asia-pacific countries. Then, through these models, we determined the important variables affecting the PISA 2018 mathematics achievement for each of the twelve Asia-Pacific countries we considered in this study. Determining these variables reveals which variables should be focused on in order to increase the mathematics achievement of the countries.
- We clustered Asia-Pacific countries separately using PISA 2018 mathematics achievement and socio-economic features of these countries. We examined the similarities and differences between these two clusters and to test whether a relationship between the PISA 2018 results and the socio-economic levels of the countries can be found.
2. Related Works
EDM applies data mining methods on educational data in order to examine, analyze, and assess existing educational methods. EDM methods can be used in educational research on data coming from educational environments from different disciplines, and for different purposes. For example, EDM methods can be used to classify, predict, and cluster educational data. Such an example is [11], in which authors analyzed the suitability of different classification methods for widely used educational data, such as decision trees, Bayesian networks, neural networks, K-nearest neighbor classifiers, support vector machines (SVMs) and different types of regression-based techniques. According to [22], artificial neural networks, random forest (RF), SVM, regression trees and logistic regression (LR) are the most popular methods for classification used in EDM.
In the EDM literature, these classification and clustering methods are frequently used on large data sets obtained from national and international evaluations [23,24,25]. For example, in [10], the author used CART, RF and SVM algorithms to predict proficiency levels in science literacy (low or high) of the students who participated in the PISA 2015. In the study, the author built various classification models and then compared the performance of these models. The author concluded that the RF model was the best-performing model. Using the PISA 2012 Turkey data in [26], researchers used a logistic regression model to determine the students’ interest in mathematics, their learning skills, their attitude toward the lessons, and their achievements against the educational level of their parents.
There are also studies that incorporate exogenous socio-economic data. The factors affecting the achievement of students have been widely studied for a long time [27]. For example, in [28], the authors suggest that personal factors play a more important role in explaining academic achievement than social, familial or school-related factors using EDM methods. In a similar study that also uses exogenous data [29], the authors estimated the academic achievement of students using 16 different demographic characteristics, such as age, gender, class attendance, internet access, computer ownership and the number of courses taken. Authors modeled the student performance using RF, LR, k-nearest neighbors and SVM. In [30] authors used RF, naive Bayes (NB), multi-layer perceptron, and SVM to predict the students’ achievement levels. The authors compared the accuracy levels of the classification algorithms they used to determine the best classifier.
The EDM literature has many different types of research on PISA data. For example, in [31], the PISA 2000 data from 41 countries is studied to determine the variables affecting the student achievement in mathematics. The study concludes that students with higher socio-economic status, educational resources at home, and strong family support have higher mathematics achievement scores. In [32], researchers compared the estimation capabilities of different data mining methods on PISA 2015 mathematical literacy data. The factors they identified as important in affecting mathematical literacy were the mother’s education level and father’s education level. Contrary to the results of this research, in [33,34] the researchers identified that the education level of the mother came before the education level of the father in the ranking of the factors affecting student achievement. On the other hand, in [35], the researchers aimed to determine the socioeconomic factors associated with the students’ achievement in mathematics using national data 2009 ÖBBS together with the PISA 2009 data. Researchers considered socio-economic factors at the school- and student levels and concluded that the determining factors associated with student achievement in mathematics were the educational status of the student’s father and the educational resources that the student had. At the school level, it was found that the educational development level of the city where the school is located is also related to the student achievement in mathematics. In [36], the researchers used the random forest algorithm to determine the factors that can best predict the reading success of Macau students using PISA 2018 data. An integrative theoretical model was used that takes into account the critical roles of 41 different demographic, personal, and social-contextual factors in predicting reading achievement. In a different study [37] for PISA 2018, the researchers used binary classification methods to identify the variables that best predicted reading proficiencies of Filipino students. In [38], the researchers investigated the moderating effect of gender on the relationship between academic achievement and parental emotional–academic support. Similarly, [39] examines whether the effect of reading performance on the mathematics performance, taking into account the gender and family social and economic status background. Other studies [40,41,42] also concluded that there are important socio-economic factors that affect student achievement, such as educational opportunities at home, the socioeconomic level of the family, environmental factors, and learning–teaching opportunities at school.
Clustering algorithms are frequently used data mining techniques in EDM [43]. These studies generally aim to determine the best clustering models for students, schools, or countries according to the similarities in the student achievement levels or socio-economic characteristics of the countries. For example, in [44], using multivariate linear regression model and clustering analysis, researchers investigated whether there is a quantifiable relationship between PISA 2015 results from 71 countries and the socio-economic indicators of these countries. The study concluded that the GDP-PPP and the government expenditure per capita on primary education are the determining factors on the student achievement in PISA 2015 exam.
Similarly, in [45,46,47] the researchers applied hierarchical clustering analysis to the member countries of the Economic Cooperation Organization (ECO) using socio-economic indicators, such as the income level and the university enrollment rate, and the schooling rate. On the other hand, in [48], researchers applied hierarchical clustering analysis by using economic freedom indexes on Eastern European countries. A similar clustering analysis of the OECD member countries was carried out in [49] using K-means and hierarchical clustering on the 2011 freedom index data. On the education side, in [50], the researchers investigated how the OECD and the other participating countries are clustered using the PISA 2012 data and used a hierarchical clustering model to reveal the similarities and differences between the countries.
All the studies we mentioned above are aimed at contributing to the development and execution of the educational policies of the participating countries. They aim to achieve this goal by determining the main factors affecting the student achievement, and to the provision of solutions for useful educational strategies. However, it seems that many studies have focused on either a limited number of variables or a limited number of EDM methods.
In this research, we study the student achievements in mathematics of the Asia-Pacific countries participating in the PISA 2018 evaluation using certain EDM algorithms. The main goal of this research is to determine the important features that affect student achievement in mathematics using the LR, RF, and SVM models on both the PISA data and exogenous socio-economic and demographic data on the Asia-Pacific countries. We are also going to cluster these countries using the PISA 2018 student achievement data, and the exogenous socio-economic and demographic data separately, and then compare these clusters. By comparing the two different clustering analyses, we aim to determine whether there is a relationship between the student achievement levels of the countries and their socio-economic levels.
3. Materials and Methods
In this study, we use two different data sets belonging to the 12 Asia-Pacific countries in the OECD. These countries are Brunei Darussalam, Hong Kong, Indonesia, Japan, Korea, Macao, Malaysia, Philippines, China, Singapore, Thailand, and Chinese Taipei. The large-scale educational data set used to conduct clustering and classification analyses includes the mathematics test results of students from the 12 Asia-Pacific countries participating in the PISA 2018 assessment, and the self-reported survey data from the same assessment. This is an open access data set published by the OECD [51]. The socio-economic development data that we used for our clustering analysis consists of the gross domestic product per capita (GDP-PPP), Human Development Index (HDI), Gender Inequality Index (GII) and economic freedom (EF) for the year 2018. The data for 2018 were obtained from the data published by the World Bank [52], The Heritage Foundation [53] and Human Development Index Database [54,55].
3.1. Data
3.1.1. PISA Data
PISA is an international assessment conducted by the Organization for Economic Cooperation and Development (OECD) that evaluates the knowledge and skills of 15-year-old students in reading, mathematics, and science. It aims to reveal students’ desire to learn, their attitudes and concerns toward lessons, and their preferences in learning environments, as well as the knowledge and skills they learn at school. This assessment, which was first implemented in 2000, was organized every three years. The PISA 2018 assessment is taken by approximately 612,000 students from 79 countries. The assessment consists of two main parts: A knowledge test and a questionnaire that collects data on socio-economic factors, demographic characteristics, learning environments and learning approaches.
OECD uses a two-stage sampling method in PISA applications. In the first stage, schools in the country are selected with the systematic proportional probability sampling procedure. In the second stage, students who can participate in the application at the determined schools are listed and randomly selected.
The data of this research are taken from the publicly available PISA 2018 data on the OECD website [51]. The data set was created by combining the 10 PV values, which are the representative success scores of the PISA 2018 Mathematical literacy test of students from 12 Asia-Pacific countries, and the socio-economic and demographic variables of the questionnaires applied to the students. The descriptive information of the data set used is summarized in Table 1.
The purpose of large-scale assessments, such as PISA, is to determine the score individuals get rather than describing the performance of the population or subgroups within it [56]. For this reason, test results are reported as plausible values (PVs) in large-scale tests. PVs correspond to the distribution of abilities a student might have based on the students’ responses to the items. Using item response theory (IRT), 10 PVs are obtained by drawing random values from the posterior probability distribution of ability values. It is stated that since plausible values are not the individual scores of the students used in the traditional sense, the use of the average of the plausible values makes more biased estimations than the use of the average of the statistics obtained as a result of the analyses made with each of these values; thus, they should not be used [57,58]. For this reason, 5 PVs were randomly selected among 10 different PVs in the data set, and they were determined as the dependent variable. The results were evaluated by making a separate analysis with each of them, separately. The labels were assigned regarding each selected PV as being successful if it was higher than the OECD mathematics achievement average (489) and unsuccessful if it was lower. These labels were encoded as 0 and 1, respectively.
In Table 2, PVs, which are dependent variables, and features containing demographic and socio-economic information used in this study are shown with their definitions and variable codes in the PISA questionnaire.
3.1.2. Socio-Economic Data
A new data set was used in order to cluster the countries according to their socio-economic levels. The variables representing the socio-economic levels in 2018 of the countries in this data set were taken from the World Bank [52], The Heritage Foundation [53] and the Human Development Index Database [54,55] and brought together for use in this study. Definitions of the four features used in the analysis are given below, and their values for corresponding countries are shown in Table 3.
- Gross Domestic Product per Capita (GDP-PPP): GDP is used to determine the average living standards of nations and for measuring their economic well-being [59]. GDP is obtained by dividing the GDP by the population of the country. Purchasing power parity (PPP) is a measure to compare the value of money in different countries by accounting for differences in the cost of living and inflation rates between them. PPP can be used to convert one country’s economic statistics, such as GDP or income, into a common currency to facilitate cross-country comparisons. GDP adjusted by purchasing power parity (PPP) accounts for the variations in the cost of living between countries and reflects the actual value of goods and services produced in a particular country [60].
- Economic Freedom Index: Economic freedom refers to the economic activities of each individual without the interference of government and other individuals. Economic freedom is also an important determinant of growth, efficiency, and welfare [61]. In the index prepared by the Heritage Foundation, 12 sub-components were analyzed under four main titles [62].
- Gender Inequality (GII): The Gender Inequality Index measures gender inequality. Published by the United Nations Development Program, it is a composite measure that uses the three dimensions of gender inequality: empowerment, economic activity, and reproductive health. It ranges from 0, where men and women are equal, to 1, where inequality is greatest [63].
- Human Development Index (HDI): The human development index aims to compare the welfare and relative development of nations by bringing together indicators related to income, education and living standards, such as the average literacy rate of people living in any country, per capita income, and life expectancy [64]. Index is calculated by taking into account the features which are important in terms of economic and social aspects, such as adult literacy rate, average life expectancy and GDP per capita by purchasing parity.
The variables in the data showing the socio-economic levels of the countries have a positive and significant correlation with each other, except for the GII. Although GII is not correlated with other variables, it is an important variable that shows the level of development of countries [65].
3.2. Classification and Clustering Algorithms
3.2.1. Logistic Regression Classifier (LR)
The aim of LR is to achieve the best defining model between dependent and independent variables as in the case of standard regression models [66]. The main difference between the OLS regression and the LR is that OLS regression models a continuous response variable while a LR models a binary categorical dependent variable. It is a highly flexible model since the strict assumptions for the linear regression are not required for the logistic regression case. The values for the response variable are mapped to the unit interval [0, 1] via the sigmoid activation function. The classification then is performed by evaluating the value of the output by setting a threshold. A class with a label 1 is assigned if the output of the model is greater than the preset threshold, and 0 otherwise [67]. The output probabilities of the LR are generally well-calibrated, and thus the output values can be regarded safely as class probabilities.
The simplest binary logistic regression model is given by
where X is the independent, and y is the dependent variable. By applying the logit transform, the function in the equation becomes linear:
Then using the maximum likelihood estimation method, unknown regression coefficients are estimated.
3.2.2. Random Forest Classifier (RF)
The RF algorithm is an ensemble learning method used in both classification and regression problems. It works by collecting and evaluating the predictions produced by multiple decision trees. These decision trees are obtained independently of each other using the bagging method. For a classification task, the prediction results of different decision trees are collected, and the final decision is made for the class that obtains the most votes [68]. In addition to the features used to construct the independent decision trees, the data samples are randomly selected by combining bootstrapping and random subspace methods [69].
3.2.3. Support Vector Machine Classifier (SVM)
SVM is another supervised machine learning algorithm used for classification and regression problems. The SVM method is a binary classification method based on statistical learning theory and structural risk minimization [70]. Although it was originally developed for the classification problem of linear data with two classes, it was later generalized for multi-class and nonlinear problems.
The algorithm works by finding the optimal n-dimensional hyperplane that separates the two different classes, without any prior assumption about the distribution of data. It draws a boundary (hyper-plane) between two groups for classification, and this boundary must be in the furthest position (maximum margin) from the members of the two groups [71].
Let X be a training set of n examples expressing the feature vectors and class labels :
The optimal hyperplane can then be defined as
where x is the input feature vector, w is the weight vector, and b is the bias. The hyperplane provides the following constraints for all elements of the training set:
The purpose of the SVM is to determine the vector w and scalar b, which defines the optimal hyperplane separating the data by maximizing margin [72]. There are two types of SVM methods characterized according to the linear separation and non-separation of the data set.
- Linear Support Vector Machine: This method tries to find an optimal hyperplane whose limit is the maximum among the infinite number of hyperplanes that separate samples in the input space.
- Non-Linear Support Vector Machine: Data that cannot be separated linearly are transformed into a linearly separable form with the help of kernel functions. The purpose of kernel functions is to extend the feature space to create nonlinear boundaries between classes.
3.2.4. Hierarchical Clustering Algorithm
Hierarchical clustering is an unsupervised machine learning algorithm that clusters data using a distance metric or a similarity measure. This clustering technique is divided into two types with respect to their approach: (i) agglomerative hierarchical clustering (bottom-up) and, (ii) divisive hierarchical clustering (top-down). In the agglomerative approach, each data point is initially considered as a separate cluster. At each iteration, similar clusters are combined with other clusters until one or K clusters are formed. In the divisive approach, all data points are treated as a single cluster, and different subsets are created by separating dissimilar data points from the cluster in each iteration until we reach the desired number of clusters.
In hierarchical cluster algorithm, the similarity and distance calculations between data are updated at each step. One can use different linkage methods in calculating the distances between the clusters. The single, complete, average and Ward linkages are widely used distance calculation methods [73].
3.3. Feature Selection
Permutation feature importance (PFI) is a post-model analysis technique used to measure the importance values of variables. It is useful both for linear and especially for non-linear estimators. The method to estimate the importance value works as follows: the feature whose feature importance is in question is randomly shuffled in the evaluation set, and then the model is evaluated both with the shuffled and original data sets. If the modified feature has a strong relationship with the dependent variable, it is observed that the prediction error increases significantly, and the model score decreases [68]. This technique takes advantage of being model agnostic and can be computed multiple times with different permutations of the feature to estimate the error on the feature importance. The pseudo-code version of the algorithm taken from [76] is given below:
- Inputs: trained model m, evaluation data set D (data not used in training the model).
- Calculate the reference score s of the model m on data D (for example the accuracy for a classifier).
- For each feature j (column of D):
- ○
- For each repetition k in 1, ..., K:
- ▪
- A new modified data set named is created by randomly shuffling column j in data set D.
- ▪
- , score is calculated on model m for modified data set.
- ○
- Importance for feature fi is defined as
3.4. Metrics and Classification Criteria
3.4.1. Kullback–Leibler Divergence (KL Divergence)
KL divergence is statistical distance that is used to measure the difference between two probability distributions on the same x variable. The measure is asymmetric in the variables, and therefore, is not technically a distance measure. In information theory and machine learning, it is referred to as the information gain or loss achieved by using an alternative distribution Q instead of a distribution P [77]. KL divergence of the probability distributions p(x) and q(x) on a random variable x is defined as
) is a non-negative measure. and if and only if P = Q.
3.4.2. Accuracy
Different metrics are used to evaluate the classification performance of machine learning methods. Accuracy is one of the metrics calculated by the ratio of number of correctly classified data points by the model to the total number of data points of the whole data set. This value is calculated using the confusion matrix, which compares the estimates of the model and actual values [78]. The confusion matrix is shown in Table 4 below.
3.4.3. Precision
Precision is the ratio of the number of positive instances that are correctly classified to the total number of instances that are predicted as positive. It obtains a value in the range [0, 1] [78]:
3.4.4. Recall
Recall is the ratio of the correctly classified number of positive instances to the number of all instances whose actual class is positive. Recall is also called the true positive rate. Gets a value in the range [0, 1] [78]:
3.4.5. F-Measure
The precision and recall criteria alone are not sufficient to draw a meaningful comparison result. For this reason, the F criterion, which evaluates the two criteria together, is used for more accurate and sensitive results. It is calculated by taking the harmonic average of the precision and recall values. The F-criterion takes values between 0 and 1. A classifier that makes correct predictions is expected to have an F-measure value close to 1 [78]:
4. Application
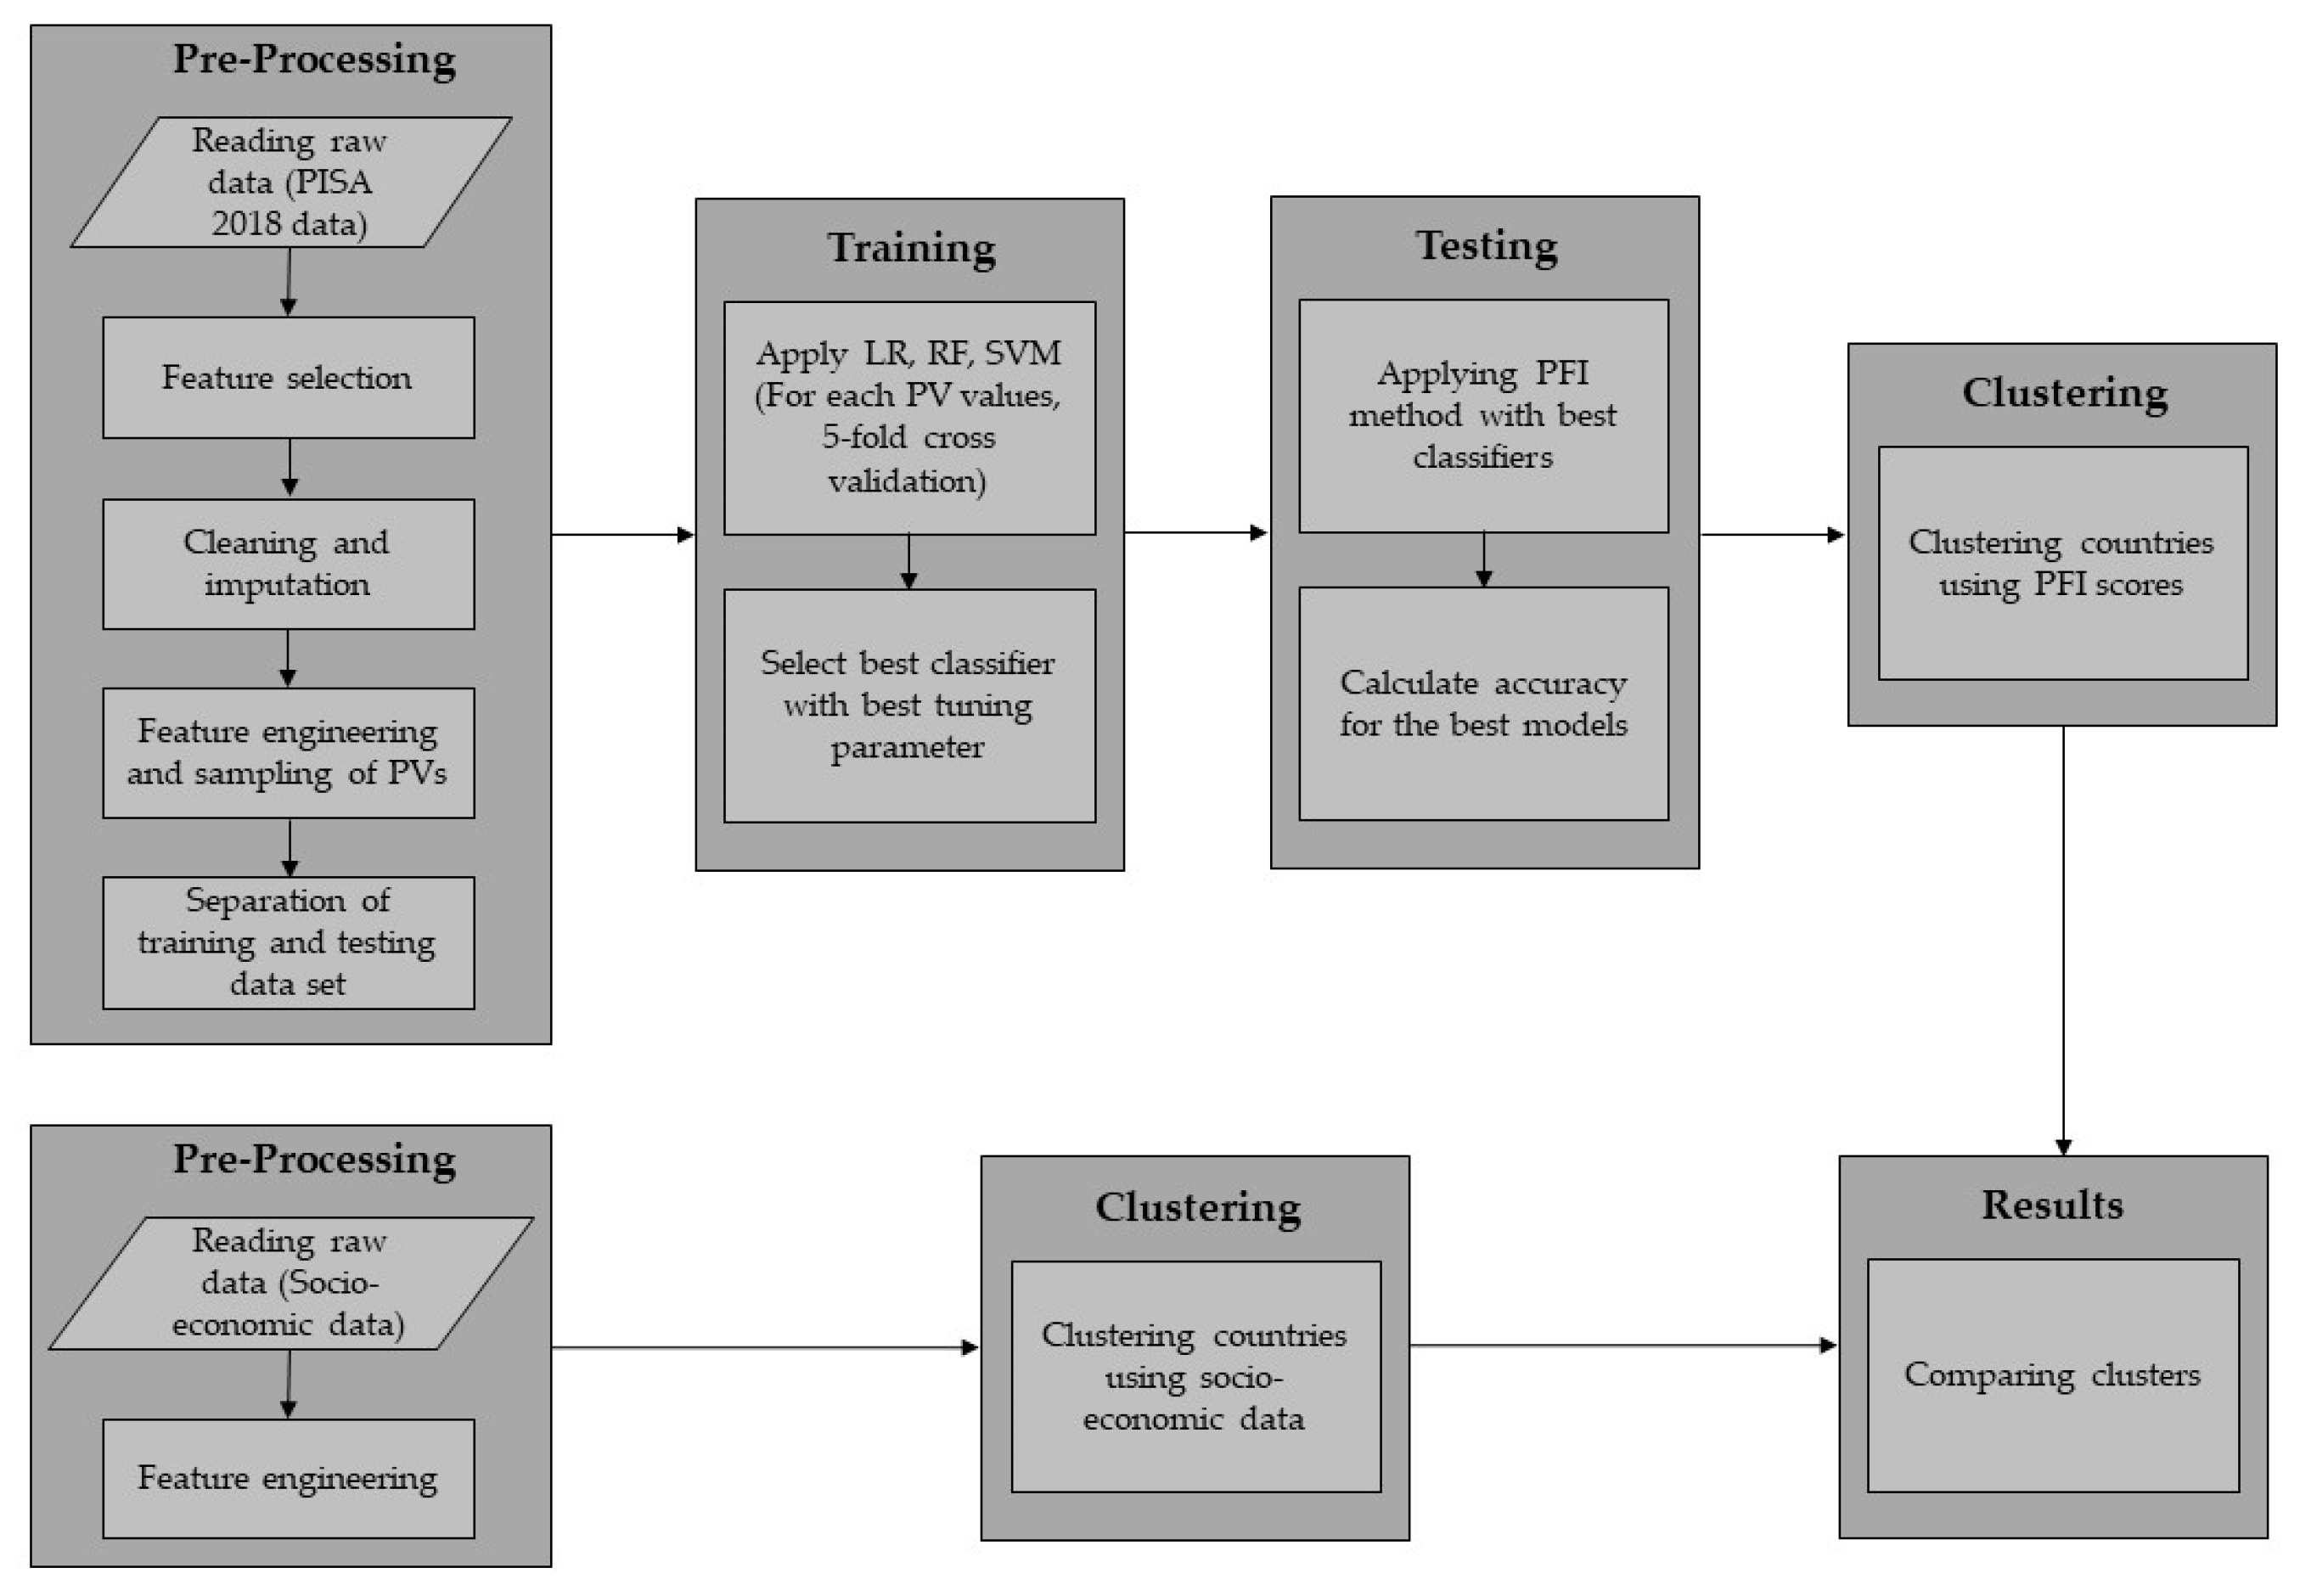
In this research, we used data from the PISA 2018 cognitive tests from mathematics literacy and student questionnaires of the 12 Asia Pacific countries and along with the socio-economic data of these countries from World Bank. These countries are Brunei Darussalam, Hong Kong, Indonesia, Japan, Korea, Macao, Malaysia, Philippines, China, Singapore, Thailand, and Chinese Taipei. In this research, the opensource software Python programming language was used to visualize and analyze the data [79]. Python has a large number of libraries used for various applications, such as software development, data science, and machine learning (ML). In our analyses, specifically, we used NumPy, pandas and scikit-learn numerical data analysis libraries. Moreover, to compare dendrograms, we used tools from the dendextend [80] packages of the R programming language [81]. The flowchart of the steps to be performed in the application section is given in Figure 1.
4.1. Pre-Processing
In the study, the data set was created by selecting the relevant features of 12 Asia-Pacific countries from the raw data set of the PISA 2018 assessment. Initially, there are 89,541 samples in the created data set. The raw data need to be pre-processed before we apply any machine learning model. Firstly, in this data set, if the value of any feature is missing (i.e., empty), the data of the relevant student are dropped and not considered. At the end of this process, 3% of the raw data set was dropped out, and 86,886 samples remained. In addition, evaluations such as “Valid Skip”, “Not applicable”, “Invalid”, and “No Response” were imputed by filling them with the mode for the relevant column.
The response feature mathematics achievement index was calculated using the plausible values (PVs). Since PVs are treated as randomly sampled values from the student achievement distribution, the mathematics achievement index was calculated by sampling five values among 10 given PVs with replacement. Binary values for test results were calculated for each of the sampled five PVs, encoding successful students with 1 and unsuccessful ones with 0. A student was considered successful if the corresponding PV was greater than or equal to the OECD Mathematics average (489), and unsuccessful otherwise. In the analysis, these values were used as dependent variables.
After assigning the class labels (successful/unsuccessful) for the data points, we observed that the number of samples corresponding to different classes was significantly different. In a classification problem, the training set is imbalanced when one class is more heavily represented than the other. This problem has received much attention in studies in the field of statistics and machine learning [82,83,84,85,86,87]. Various approaches try to balance the class distribution in the training set by either up sampling the minority class or down sampling the majority class. In order to achieve a balanced sampling, we used the down-sampling approach. This approach randomly down samples the majority class to equate the number of minority and majority class samples [88].
The final data set consists of both numerical and categorical features. The categorical features were transformed into binary categorical features using one-hot encoding [89]. Numerical features were normalized by mapping them to the [0, 1] interval. This scaling is necessary especially for the logistic regression model.
4.2. Classification
We used three machine learning methods: LR, RF, and SVM. Before we started building models specific to each country, we split our data set into the train and the test data sets with sizes 90% and 10% per country, respectively. Then we performed 5-fold cross validations on the training data sets to find the best model by performing a hyper-parameter optimization (a grid search) for each model and for each country. Five is a commonly used number of folds and gives a good trade-off between speed and bias [90]. For LR models, we used the “L2 penalty” function with the mixture parameter “C” chosen from the interval [–3, 3] for the grid search. For SVM, we used RBF, linear and polynomial kernels for the grid search.
Next, we determined the accuracy of the models on each test data set for each country. In order to remove the possible bias that splitting the data set into fixed training and test sets would incur, we applied the same steps five times by creating different training and test set combinations. We estimated the mean accuracy score using multiple test set variations with the best models given by the grid search method.
Significant variables were determined using PFI [91]. PFI works by shuffling each feature in the test data set. Then, we assess the model performance using the modified data set. The change in the model performance gives a measure of the importance of the feature in question. This method is independent of the type of the model and gives a numerical estimate of the feature importance. The PFI scores for each feature were calculated multiple times to obtain better statistical control.
Note that the determination of the best models, their accuracies, and the corresponding importance scores is carried out using a single PV for each student. Using a single sampled PV amounts to analyzing a single PISA 2018 exam. In order to obtain a better statistical handling of the parameters and the accuracies, we randomly sampled PVs 5 different times. This is analogous to performing a Monte Carlo simulation on the data set. The same procedure was applied for all five PVs sampled (with replacement) from the given PV distribution, as the reasoning explained in Section 3.1.1. Thus, we obtained 25 models (5 for each PV), their accuracies and importance scores for each feature specific to each model for each country.
4.3. Clustering of PISA Data
In the analysis, five different sets of feature importance values were obtained for each country. They were combined together so that each country was represented with a fixed-length feature vector. Initially there were five importance score lists obtained for each PV of each country. Five different importance scores of each feature were summed up, and their final importance scores were obtained. If a variable is not included in the list of important features for that country, or if the importance score is negative, the importance score of that variable is set to be zero. The final importance score vectors were normalized, and thus the sum of feature importances for a given country became 1. These normalized feature importance vectors are represented as histograms and treated as discrete probability distributions, where the feature names are the discrete states and the feature importances are the probability mass values. Thus, pairwise similarities between importances were calculated with KL divergence, which calculates the distance between two probability distributions. The distance obtained by calculating the KL divergence between the feature importance vectors of two countries was used as the similarity score between these countries. A new feature vector was created for every country using the pairwise KL divergence of a country with the all the rest of the countries. These final vectors were used as new features to cluster the countries using hierarchical clustering method. Clustering was used to understand the clustering of countries using the KL-divergence similarities of feature importances given by the machine learning models. The results are shown and analyzed in Section 5.
4.4. Clustering of Socio-Economic Data
The data set, which includes the socio-economic variables we used, was created based on the variables that are most frequently used in the literature and are easily accessible from public sources. This raw data set had to be processed before the analysis was performed. We normalized the data set by using the min-max normalization by mapping each numerical feature to the unit interval.
In order to group the countries, we used hierarchical clustering analysis with the Ward linkage. This technique creates clusters by maximizing homogeneity between clusters [73]. After applying the cluster analysis, we used a dendrogram to visualize the results. In the process, we created two hierarchical clustering models: one on the PISA data, and the other on the socio-economic data. We then used a tanglegram to compare the cluster groups.
5. Results
5.1. Results of Classification Algorithms
The performance evaluation criteria for each model are calculated on randomly selected PVs among a list of PVs of the countries. The averages of the classification performance results and their 95% confidence intervals based on PVs were calculated to determine the best classification algorithm. The results are displayed in Table 5.
According to Table 5, the accuracy values of the classification performance of the three different algorithms are close. However, the SVM algorithm has the best mean accuracy of 73% compared to other classifiers. Table 5 also shows the precision, recall and F1-scores of the three classifiers we used. Considering these criteria, the SVM model still performs better than the LR and RF classification models.
According to Table 5, the most successful algorithms in classifying success in mathematics in PISA 2018 by country are the LR classifier for Indonesia, Japan, Korea; the RF classifier for Macao, Singapore, Thailand; and the SVM classifier for Brunei, Hong Kong, Malaysia, Philippines, China and Taipei.
The hyper-parameter optimization of the classification models was performed using the grid search method. After the best parameters for each algorithm were determined, the PFI was applied to the model built using these best parameters. Then the importance values of the features were calculated, and the most explanatory features were determined. The features with high importance are shown in Table 6, starting with the highest.
Table 6 shows the socio-economic and demographic features of each country with high importance that affect the mathematics achievement of students in PISA 2018. The important features determined by three different models were associated with the mathematics achievement of the countries. We conclude that “PerWeekScience”, “ISCED0”, “Books”, “Age”, “PerWeek_FLanguage” features are the common important features that determine the mathematics achievement of students in PISA 2018 in all countries. We also observe that “FISCED”, “MISCED”, “Smartphone” and “PerWeek_TLanguage” are the most important features common to all countries, except Indonesia, Singapore, and Japan, the Philippines.
After creating the classification models with all selected features, another set of models was made only using the most important features as discussed in Section 4. The accuracy values representing the model performance results on all features and on only the most important features are shown in Table 7.
Accuracy values of all classification models only on the most important features vary between about 67% and 72%. While the RF algorithm showed the most successful classification performance with an accuracy value of about 72%, the LR algorithm had an accuracy of 70%, and the SVM had 68%. We did not observe a statistically significant difference between the accuracy values of all three models built on the most important features versus on all the features. Nevertheless, the SVM and LR models seem to be sensitive to removing features (dropping their accuracy from 73% to 68% and 72% to 69%, respectively), while the RF model did not suffer any performance losses.
5.2. Results of the Clustering Algorithms
The importance values of the features representing the socio-economic and demographic characteristics of students in 12 Asia-Pacific countries in the PISA data set were calculated by using the PFI method as described in Section 4. We then used the hierarchical clustering method to create clusters using these importance values of 131 features obtained for each country.
In addition to the feature importance data, we used the data set containing socio-economic features in our analysis to create a separate clustering analysis to group the countries in terms of their socio-economic development levels.
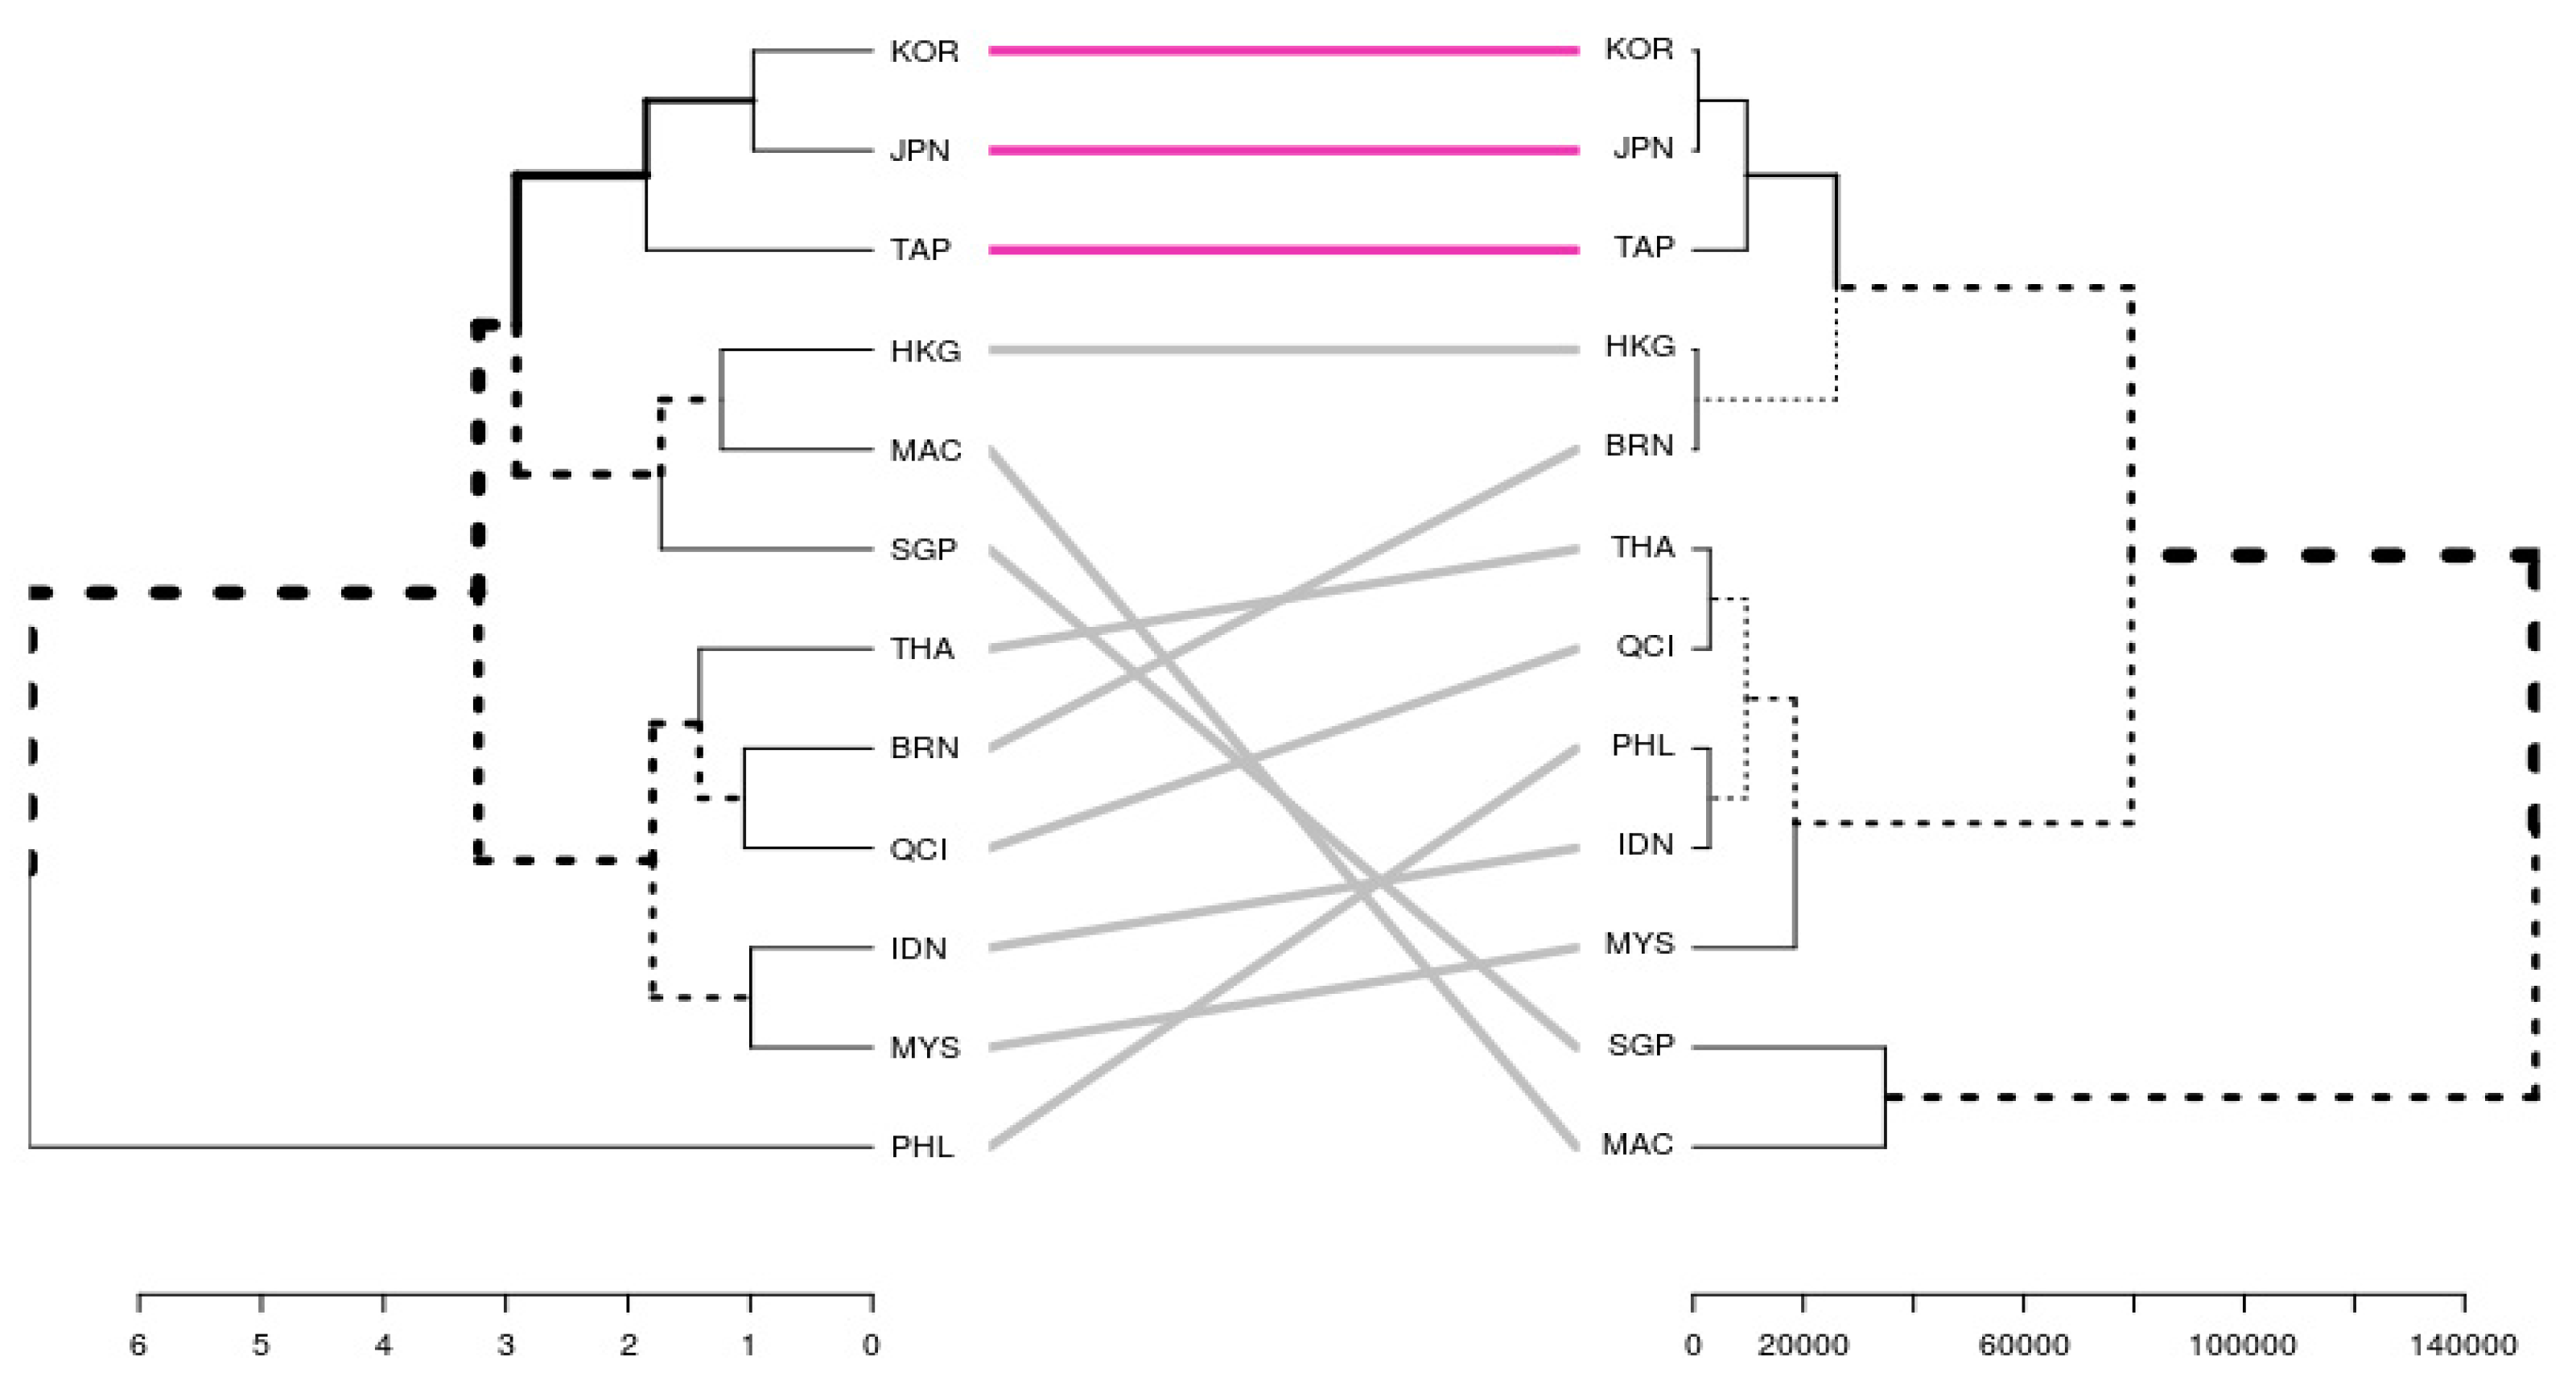
The findings of the clustering analysis results applied to two different data sets were visualized separately using dendrograms. The resulting dendrograms are visualized with a tanglegram in Figure 2 by aligning the labels from both dendrograms.
When we examine the dendrograms, we observe four clusters. In terms of indicators related to variables affecting mathematics achievement, Korea, Japan, and Taipei are in the first cluster; Hong Kong, Macao, and Singapore are in the second cluster; Thailand, Brunei, China, Indonesia, and Malaysia are in the third cluster; and Philippines, by itself, is in the fourth cluster.
On the socio-economic data set, we observe three clusters. The first cluster includes Korea, Japan, Taipei, Hong Kong, and Brunei; the second cluster includes Thailand, China, the Philippines, Indonesia, and Malaysia; and the third cluster includes Singapore and Malaysia.
According to the Tanglegram representation, using the match between the labels placed on the branches, it was observed that countries Korea, Japan and Taipei are clustered in the same way, based on data related to both education and socio-economic status. While Thailand, China, Indonesia, and Malaysia were clustered together according to both assessments, Philippines formed a separate cluster from other countries according to education-related data but was included in this cluster when evaluated according to its socio-economic level. Singapore and Macao were separated from other groups especially in terms of their socio-economic level but clustered together according to both assessments. Although Hong Kong and Brunei are in different clusters according to education-related evaluations, they cluster together when evaluated according to socio-economic levels.
6. Discussion
In this research, the PISA 2018 mathematics achievement performance results of 12 Asia-Pacific OECD countries were classified using educational data mining techniques, and important factors affecting students’ mathematics achievement were determined. Based on the similarities and differences of the determined effective factors, the countries were clustered, and the results were compared with the average of the OECD countries in their mathematics achievement. A similar clustering analysis was applied to a secondary data set consisting of variables representing the socio-economic levels of these countries. By looking at the clusters we obtained from the two clustering analyses, the relationship between the educational and socio-economic levels of the countries was interpreted.
We created two sets of models to classify student achievement in mathematics: one set on the full data set while the other on the important features only. When features with high importance were used instead of all the features, we observed that there was no change in the accuracy values of the RF model, and there was a 2% decrease in the accuracy value of the LR model and a 6% decrease in the SVM model. Therefore, we can conclude that the determined features with high importance directly affect the classification performance, but the effects of the rest of the features with relatively lower importance still show an observable effect on student achievement in mathematics.
The LR models were found to be the best performing models in determining the academic performance of students in [92]. The EDM literature suggests that RF performs well in classification problems in data sets containing both categorical and numerical features [10,93]. These models are widely used in many data mining applications because of their ease of applicability and classification performance. In this study, we used LR, RF and SVM models to classify student achievement in mathematics. In performance comparisons of the classification algorithms using our data sets, we observed that RF and SVM were the best algorithms for the most part. The SVM algorithm showed the highest performance with 73% accuracy comparable to the LR and RF models, showing approximately 72% accuracy. The classification accuracy values obtained in this study are comparable to other educational studies in the literature on international assessments, such as PISA and TIMMS [25,94].
We used the PFI method to determine the features with high importance that affect student achievement in mathematics. The common features that have a high effect on mathematics achievement in the 12 Asia-Pacific countries we investigated are number of class periods per week in science (“PerWeekScience”), the age of starting kindergarten (“ISCED0”), number of books in the house (“Books”), age, and number of class periods per week in foreign language (“PerWeek_FLanguage”). On the other hand, fathers` education (“FISCED”), number of smartphones in the house (“Smartphone”), number of class periods per week in test language (“PerWeek_Tlanguage) and the mothers’ education (“MISCED”) are features with high importance common to every country, except for Indonesia, the Philippines, Singapore and Japan. The results we obtained are consistent with the existing literature. Previous studies found that the number of class hours in schools have an effect on student performance. For example, [95,96] investigated the effect of changing course hours in schools on student performance and showed that student performance could indeed be improved by increasing teaching time. Our machine learning models indicate that the variables “PerWeek_FLanguage” and “PerWeekScience” are among the high-importance variables, consistent with the cited literature.
The results we obtained are again consistent with [97], where a clustering analysis revealed the “ISCED0” as an important feature in estimating the mathematics achievement of these schools. In a similar example, [98] stated that students enrolled in kindergarten performed better in mathematics exams than those who did not attend kindergarten. We were also able to show that the age of starting kindergarten had a positive effect on the academic achievement of students.
In a similar vein, [99] revealed that educational resources at home had a positive effect on success, and [100] concluded that the educational along with cultural resources at home had a significant positive effect on the mathematics achievement scores of the students.
In these studies, the available technological devices, the number of books and physical conditions at home are included under the title of educational resources at home [25,99,101]. In our study, we found that only the “Books” feature among this group had statistically high importance for all Asia-Pacific countries. Accordingly, we can conclude that the effect of the “Books” variable on mathematics achievement is higher than that of other educational resources at home for all countries.
Next, we constructed hierarchical clustering models by using features explaining educational and socio-economic levels. We observed that the countries Korea, Japan and Taipei are similar in their educational achievements and in their socio-economic levels. Similarly, Thailand, China, Indonesia and Malaysia are also grouped together. The clustering analysis based on the educational data, indicates that the Philippines stays separately from all countries, but is grouped together with Thailand, China, Indonesia and Malaysia if we use a clustering analysis using socio-economic data. According to the results we obtained, we can conclude that there is a relationship between the educational and socio-economic levels of the countries. More detailed inferences can be made about these clusters by looking at the similarities and differences of the important features that affect the student achievements in mathematics in different countries. The methodology we developed in this study can be used to investigate similar questions for different countries and for different large-scale student assessments.
7. Conclusions
In this research, we studied the data set containing the PISA 2018 mathematics scores and student questionnaires from the 12 Asia-Pacific countries in the OECD along with the data on their socio-economic levels. The PISA data set contains many features on the demographic characteristics of the students, their physical conditions at home, and 10 different plausible values for their mathematics achievement. In order to classify the mathematics achievements of students, we built machine learning models using LR, RF and SVM algorithms, and then we determined which socio-economic and demographic features had a quantifiable impact on student achievement in mathematics. We expect the resulting insights to contribute to the EDM literature and educational policy making. We applied two different clustering analyses by using separate data sets on educational attainment and socio-economic levels and observed that there is a relationship between the educational attainment and the socio-economic levels as a result.
Future studies can be conducted on a larger scale by including the results of the science literacy and reading proficiency of the PISA survey. The EDM methods that we developed in this study can also be applied to other national/international surveys.
Author Contributions
Conceptualization, E.G.B. and E.Ö.; Methodology, E.G.B. and A.K.; Software, E.G.B. and A.K.; Validation, A.K. and E.Ö.; Investigation, E.G.B.; Writing—original draft, E.G.B.; Writing—review & editing, E.G.B. and A.K.; Supervision, E.Ö. All authors have read and agreed to the published version of the manuscript.
Funding
This research received no external funding.
Data Availability Statement
The data used for this paper are available at the OECD following link: http://www.oecd.org/pisa/data/2018database/, accessed on 9 August 2022.
Acknowledgments
This research was supported by the Turkish Higher Education Institution (YÖK) 100/2000 doctoral project.
Conflicts of Interest
The authors declare no conflict of interest.
References
- Romero, C.; Ventura, S.; Pechenizkiy, M.; Baker, R.S. Handbook of Educational Data Mining; CRC Press: Boca Raton, FL, USA, 2010. [Google Scholar]
- Baradwaj, B.K.; Pal, S. Mining educational data to analyze students’ performance. Int. J. Adv. Comput. Sci. Appl. 2011, 2, 63–69. [Google Scholar]
- Witten, I.H.; Frank, E.; Hall, M.A.; Pal, C.J. Data Mining: Practical Machine Learning Tools and Techniques; Morgan Kaufmann Publishers: Burlington, MA, USA, 2005; Volume 2, No. 4. [Google Scholar]
- Maimon, O.; Rokach, L. (Eds.) Data Mining and Knowledge Discovery Handbook; Springer: Berlin/Heidelberg, Germany, 2005. [Google Scholar]
- Han, J.; Kamber, M.; Pei, J. Data Mining Concepts and Techniques, 3rd ed.; University of Illinois at Urbana-Champaign Micheline Kamber Jian Pei Simon Fraser University: Champaign, IL, USA, 2012. [Google Scholar]
- Ranjan, J.; Malik, K. Effective educational process: A data-mining approach. Vine 2007, 37, 502–515. [Google Scholar] [CrossRef]
- Siemens, G.; Baker, R.S.D. Learning analytics and educational data mining: Towards communication and collaboration. In Proceedings of the 2nd International Conference on Learning Analytics and Knowledge, Vancouver, BC, Canada, 29 April–2 May 2012; pp. 252–254. [Google Scholar]
- Viberg, O.; Hatakka, M.; Bälter, O.; Mavroudi, A. The current landscape of learning analytics in higher education. Comput. Hum. Behav. 2018, 89, 98–110. [Google Scholar] [CrossRef]
- Thakar, P.; Mehta, A. Performance analysis and prediction in educational data mining: A research travelogue. arXiv 2015, preprint. arXiv:1509.05176. [Google Scholar]
- Bulut, O.; Yavuz, H.C. Educational data mining: A tutorial for the rattle package in R. Int. J. Assess. Tools Educ. 2019, 6, 20–36. [Google Scholar] [CrossRef] [Green Version]
- Romero, C.; Ventura, S. Educational data mining: A review of the state of the art. IEEE Trans. Syst. Man Cybern. Part C 2010, 40, 601–618. [Google Scholar] [CrossRef]
- Kumar, A.D.; Selvam, R.P.; Kumar, K.S. Review on prediction algorithms in educational data mining. Int. J. Pure Appl. Math. 2018, 118, 531–537. [Google Scholar]
- Peña-Ayala, A. Educational data mining: A survey and a data mining-based analysis of recent works. Expert Syst. Appl. 2014, 41, 1432–1462. [Google Scholar] [CrossRef]
- Yağcı, M. Educational data mining: Prediction of students’ academic performance using machine learning algorithms. Smart Learn. Environ. 2022, 9, 11. [Google Scholar] [CrossRef]
- Baker, R.S.; Yacef, K. The state of educational data mining in 2009: A review and future visions. J. Educ. Data Min. 2009, 1, 3–17. [Google Scholar]
- Cheng, J. Data-mining research in education. arXiv 2017, arXiv:1703.10117. [Google Scholar]
- Dutt, A.; Ismail, M.A.; Herawan, T. A systematic review on educational data mining. IEEE Access 2017, 5, 15991–16005. [Google Scholar] [CrossRef]
- MoNE (Ministry of National Education). PISA 2018 Türkiye ön Raporu; Eğitim Analiz ve Değerlendirme Raporları Serisi; MEB Publishing: Ankara, Turkey, 2019; Volume 10. [Google Scholar]
- OECD. PISA Web Site, Next Steps. 2022. Available online: https://www.oecd.org/pisa/ (accessed on 9 August 2022).
- Özer, Y.; Anil, D. Examining the factors affecting students’science and mathematics achievement with structural equation modeling. Hacettepe Universitesi Egitim Fakultesi Dergisi-Hacettepe. Univ. J. Educ. 2011, 41, 313–324. [Google Scholar]
- OECD. PISA 2018 Results (Volume I): What Students Know and Can Do; PISA, OECD Publishing: Paris, France, 2019. [Google Scholar] [CrossRef]
- Baker, R.S.J.D. Data mining for education. Int. Encycl. Educ. 2010, 7, 112–118. [Google Scholar]
- Pai, P.F.; Chen, C.T.; Hung, Y.M.; Hung, W.Z.; Chang, Y.C. A group decision classifier with particle swarm optimization and decision tree for analyzing achievements in mathematics and science. Neural Comput. Appl. 2014, 25, 2011–2023. [Google Scholar] [CrossRef]
- Aksu, G.; Guzeller, C.O. Classification of PISA 2012 mathematical literacy scores using decision-tree method: Turkey sampling. Eğitim Ve Bilim 2016, 41, 185. [Google Scholar] [CrossRef] [Green Version]
- Filiz, E.; Öz, E. Finding the Best Algorithms and Effective Factors in Classification of Turkish Science Student Success. J. Balt. Sci. Educ. 2019, 18, 239–253. [Google Scholar] [CrossRef]
- Mutluer, C.; Büyükkidik, S. PISA 2012 verilerine göre matematik okuryazarlığının lojistik regresyon ile kestirilmesi. Marmara Üniversitesi Atatürk Eğitim Fakültesi Eğitim Bilim. Derg. 2017, 46, 97–112. [Google Scholar] [CrossRef] [Green Version]
- De Witte, K.; Kortelainen, M. What explains the performance of students in a heterogeneous environment? Conditional efficiency estimation with continuous and discrete environmental variables. Appl. Econ. 2013, 45, 2401–2412. [Google Scholar] [CrossRef]
- Martinez Abad, F.; Chaparro Caso López, A.A. Data-mining techniques in detecting factors linked to academic achievement. Sch. Eff. Sch. Improv. 2017, 28, 39–55. [Google Scholar] [CrossRef]
- Cruz-Jesus, F.; Castelli, M.; Oliveira, T.; Mendes, R.; Nunes, C.; Sa-Velho, M.; Rosa-Louro, A. Using artificial intelligence methods to assess academic achievement in public high schools of a European Union country. Heliyon 2020, 6, e04081. [Google Scholar] [CrossRef]
- Jalota, C.; Agrawal, R. Analysis of educational data mining using classification. In Proceedings of the 2019 International Conference on Machine Learning, Big Data, Cloud and Parallel Computing (COMITCon), Faridabad, India, 14–16 February 2019; pp. 243–247. [Google Scholar] [CrossRef]
- Chiu, M.M.; Xihua, Z. Family and motivation effects on mathematics achievement: Analyses of students in 41 countries. Learn. Instr. 2008, 18, 321–336. [Google Scholar] [CrossRef]
- Güre, Ö.B.; Kayri, M.; Erdoğan, F. Analysis of Factors Effecting PISA 2015 Mathematics Literacy via Educational Data Mining. Educ. Sci. 2020, 45, 202. [Google Scholar] [CrossRef]
- Gürsakal, S. PISA 2009 öğrenci başari düzeylerini etkileyen faktörlerin değerlendirilmesi. Suleyman Demirel Univ. J. Fac. Econ. Adm. Sci. 2012, 17, 441–452. [Google Scholar]
- Savaş, E.; Taş, S.; Duru, A. Factors affecting students’ achievement in mathematics. Math. Learn. 2010, 11, 113–132. [Google Scholar]
- Özkan, Y.Ö.; Güvendir, M.A. Socioeconomic Factors of Students’ Relation to Mathematic Achievement: Comparison of PISA and ÖBBS. Int. Online J. Educ. Sci. 2014, 6, 776–789. [Google Scholar] [CrossRef]
- Wang, Y.; King, R.; Haw, J.; Leung, S.O. What explains Macau students’ achievement? An integrative perspective using a machine learning approach. J. Study Educ. Dev. 2022, 46, 71–108. [Google Scholar] [CrossRef]
- Bernardo, A.B.; Cordel, M.O.; Lucas RI, G.; Teves JM, M.; Yap, S.A.; Chua, U.C. Using machine learning approaches to explore non-cognitive variables influencing reading proficiency in English among Filipino learners. Educ. Sci. 2021, 11, 628. [Google Scholar] [CrossRef]
- Sanchez EM, T.; Miguelanez, S.O.; Abad, F.M. Explanatory factors as predictors of academic achievement in PISA tests. An analysis of the moderating effect of gender. Int. J. Educ. Res. 2019, 96, 111–119. [Google Scholar] [CrossRef]
- Ding, H.; Homer, M. Interpreting mathematics performance in PISA: Taking account of reading performance. Int. J. Educ. Res. 2020, 102, 101566. [Google Scholar] [CrossRef]
- Caso Niebla, J.; Hernández Guzmán, L. Modelo explicativo del bajo rendimiento escolar: Un estudio con adolescentes mexicanos. RIEE. Rev. Iberoam. De Evaluación Educ. 2010, 3, 145–159. [Google Scholar]
- Strayhorn, T.L. Factors influencing the academic achievement of first-generation college students. J. Stud. Aff. Res. Pract. 2007, 43, 1278–1307. [Google Scholar] [CrossRef]
- Aydın, A.; Sarıer, Y.; Uysal, Ş. Sosyoekonomik ve sosyokültürel değişkenler açısından PISA matematik sonuçlarının karşılaştırılması. Eğitim Ve Bilim 2012, 37, 20–30. [Google Scholar]
- Dutt, A.; Aghabozrgi, S.; Ismail, M.A.B.; Mahroeian, H. Clustering algorithms applied in educational data mining. Int. J. Inf. Electron. Eng. 2015, 5, 112. [Google Scholar] [CrossRef] [Green Version]
- Mazurek, J.; Mielcová, E. On the relationship between selected-socio-economic indicators and student performances in the PISA 2015 study. Economics 2019, XXII, 2. [Google Scholar] [CrossRef]
- Acemoglu, D.; Pischke, J.-S. Changes in the wage structure, family income, and children’s education. Eur. Econ. Rev. 2001, 45, 890–904. [Google Scholar] [CrossRef] [Green Version]
- Ellwood, D.; Kane, T.J. Who Is Getting a College Education? Family Background and the Growing Gaps in Enrollment. In Securing the Future: Investing in Children from Birth to College; Russell Sage: New York, NY, USA, 2000; pp. 283–324. [Google Scholar]
- Kaynak, S.; Rashid, Y. Sosyo-Ekonomik Göstergelerine Göre Eco Üyesi Ülkelerin Hiyerarşik Kümeleme Metoduyla Kümelenmesi. Hitit Üniversitesi Sos. Bilim. Enstitüsü Derg. 2020, 13, 69–81. [Google Scholar] [CrossRef]
- Şahin, D. Kümelenme Analizi ile Doğu Avrupa Ülkelerinin Ekonomik Özgürlükler Açısından Değerlendirilmesi. Hitit Üniversitesi Sos. Bilim. Enstitüsü Derg. 2017, 10, 1299–1314. [Google Scholar]
- Kangalli, S.; Umut, U.Y.A.R.; Buyrukoğlu, S. OECD ülkelerinde ekonomik özgürlük: Bir kümeleme analizi. Uluslararası Alanya İşletme Fakültesi Derg. 2014, 6, 95–109. [Google Scholar]
- Aksu, G.; Güzeller, C.; Eser, M. Clustering Study of PISA 2012 Results According to Affective Attributes. Hacet. Univ. Egit. Fak. Derg. Hacet. Univ. J. Educ. 2017, 32, 838–862. [Google Scholar] [CrossRef]
- OECD. PISA 2018 Database [Data Set]. 2020. Available online: http://www.oecd.org/pisa/data/2018database/ (accessed on 9 August 2022).
- World Bank. GDP per Capita (Current US$). 2018. Available online: http://databank.worldbank.org (accessed on 23 November 2022).
- The Heritage Foundation. Index of Economic Freedom. Available online: http://www.heritage.org/Index/about (accessed on 23 November 2022).
- UNDP. Human Development Data (1990–2018). 2019. Available online: http://hdr.undp.org/en/data (accessed on 24 November 2022).
- United Nations Development Programme. Human Development Report. 2019. “Human Development Index”. Available online: http://hdr.undp.org/en/composite/HDI (accessed on 22 November 2022).
- Monseur, C.; Adams, R. Plausible values: How to deal with their limitations. J. Appl. Meas. 2009, 10, 320–334. [Google Scholar]
- Von Davier, M.; Gonzalez, E.; Mislevy, R. What are plausible values and why are they useful. IERI Monogr. Ser. 2009, 2, 9–36. [Google Scholar]
- OECD. PISA Data Analysis Manual: SPSS and SAS, 2nd ed.; OECD Publishing: Paris, France, 2009. [Google Scholar] [CrossRef]
- OECD Publishing; Organisation for Economic Co-Operation and Development Staff. National Accounts of OECD Countries 2002; OECD Publishing: Paris, France, 2002; Volume I. [Google Scholar]
- Mankiw, N.G.; Taylor, M.P.; Ashwin, A.K. Economics, 3rd ed.; Cengage Learning: Boston, MA, USA, 2014. [Google Scholar]
- Tunçsiper, B.; Biçen, Ö.F. Ekonomik özgürlükler ve ekonomik büyüme arasındaki ilişkinin panel regresyon yöntemiyle incelenmesi. Eskişehir Osman. Üniversitesi İktisadi Ve İdari Bilim. Derg. 2014, 9, 25–46. [Google Scholar]
- Miller, T.; Kim, A.B.; Roberts, J.M. Index of Economic Freedom; The Heritage Foundation: Washington, DC, USA, 2019. [Google Scholar]
- Miščević, N. United Nations development programme, human development report 2020. The next frontier human development and the anthropocene. Croat. J. Philos. 2021, 21, 231–235. [Google Scholar]
- United Nations Development Programme (UNDP). Human Development Indices and Indicators: 2018 Statistical Update, Published for the United Nations Development Programme; United Nations Development Programme (UNDP): Washington, DC, USA, 2018. [Google Scholar]
- Hou, J.; Walsh, P.P.; Zhang, J. The dynamics of human development index. Soc. Sci. J. 2015, 52, 331–347. [Google Scholar] [CrossRef]
- Hosmer, D.W., Jr.; Lemeshow, S.; Sturdivant, R.X. Applied Logistic Regression; John Wiley & Sons: Hoboken, NJ, USA, 2013. [Google Scholar]
- Dayton, C. Mitchell. Logistic regression analysis. Stat 1992, 474, 574. [Google Scholar]
- Breiman, L. Random forests. Mach. Learn. 2001, 45, 5–32. [Google Scholar] [CrossRef] [Green Version]
- Biau, G.; Scornet, E. A random forest guided tour. Test 2016, 25, 197–227. [Google Scholar] [CrossRef] [Green Version]
- Cortes, C.; Vapnik, V. Support-vector networks. Mach. Learn. 1995, 20, 273–297. [Google Scholar] [CrossRef]
- Noble, W.S. What is a support vector machine? Nat. Biotechnol. 2006, 24, 1565–1567. [Google Scholar] [CrossRef]
- Alp, S.; Öz, E. Makine Öğrenmesinde Sınıflandırma Yöntemleri ve R Uygulamaları; Nobel Akademik Yayıncılık: Ankara, Turkey, 2019. [Google Scholar]
- Güzel, İ.; Kaygun, A. A new non-archimedean metric on persistent homology. Comput. Stat. 2022, 37, 1963–1983. [Google Scholar] [CrossRef]
- Nielsen, F.; Nielsen, F. Hierarchical clustering. In Introduction to HPC with MPI for Data Science; Springer: Berlin/Heidelberg, Germany, 2016; pp. 195–211. [Google Scholar]
- Murtagh, F.; Contreras, P. Algorithms for hierarchical clustering: An overview. Wiley Interdiscip. Rev. Data Min. Knowl. Discov. 2012, 2, 86–97. [Google Scholar] [CrossRef]
- Pedregosa, F.; Varoquaux, G.; Gramfort, A.; Michel, V.; Thirion, B.; Grisel, O.; Blondel, M.; Prettenhofer, P.; Weiss, R.; Dubourg, V.; et al. Scikit-learn: Machine learning in Python. J. Mach. Learn. Res. 2011, 12, 2825–2830. [Google Scholar] [CrossRef]
- Martins, A.M.; Neto, A.D.; de Melo, J.D.; Costa, J.A.F. Clustering Using Neural Networks and Kullback-Leibler Divergency. In Proceedings of the 2004 IEEE International Joint Conference on Neural Networks, Budapest, Hungary, 25–29 July 2014; IEEE: Piscataway, NJ, USA, 2004; pp. 2813–2817. [Google Scholar] [CrossRef]
- Japkowicz, N.; Shah, M. Evaluating Learning Algorithms: A Classification Perspective; Cambridge University Press: Cambridge, UK, 2011. [Google Scholar]
- Brownlee, J. Machine Learning Mastery; 2022. Available online: http//machinelearningmastery.com (accessed on 21 September 2022).
- Galili, T. Dendextend: An R package for visualizing, adjusting and comparing trees of hierarchical clustering. Bioinformatics 2015, 31, 3718–3720. [Google Scholar] [CrossRef] [Green Version]
- R Core Team. R: A Language and Environment for Statistical Computing; R Foundation for Statistical Computing: Vienna, Austria, 2021. [Google Scholar]
- Chawla, N.V.; Japkowicz, N.; Kolcz, A. Workshop on learning from imbalanced datasets II. In Proceedings of the 20th International Conference on Machine Learning, Washington, DC, USA, 21–24 August 2003. [Google Scholar]
- Kubat, M.; Matwin, S. Addressing the curse of imbalanced training sets. In Proceedings of the International Conference on Machine Learning, San Francisco, CA, USA, 8–12 July 1997; pp. 179–186. [Google Scholar]
- Laurikkaka, J. Improving Identification of Difficult Small Classes by Balancing Class Distribution; Technical Report; Department of Computer and Information Science, University of Tampere: Tampere, Finland, 2001. [Google Scholar]
- Japkowicz, N.; Stephen, S. The class imbalance problem: A systematic study. Intell. Data Anal. 2002, 6, 429–450. [Google Scholar] [CrossRef]
- Lee, S. Noisy replication in skewed binary classification. Comput. Stat. Data Anal. 2000, 34, 165–191. [Google Scholar] [CrossRef]
- Liu, Y.; Chawla, N.V.; Harper, M.P.; Shriberg, E.; Stolcke, A. A study in machine learning from imbalanced data for sentence boundary detection in speech. Comput. Speech Lang. 2006, 20, 468–494. [Google Scholar] [CrossRef]
- Wongvorachan, T.; He, S.; Bulut, O. A Comparison of Undersampling, Oversampling, and SMOTE Methods for Dealing with Imbalanced Classification in Educational Data Mining. Information 2023, 14, 54. [Google Scholar] [CrossRef]
- Molnar, C. Interpretable Machine Learning. 2020. Available online: https://originalstatic.aminer.cn/misc/pdf/Molnar-interpretable-machine-learning_compressed.pdf (accessed on 17 September 2022).
- Hastie, T.; Tibshirani, R.; Friedman, J.H.; Friedman, J.H. The Elements of Statistical Learning: Data Mining, Inference, and Prediction; Springer: New York, NY, USA, 2009; Volume 2, pp. 1–758. [Google Scholar]
- SHARMA, S. Applied Multivariate Techniques; John Wiley & Sons., Inc: New York, NY, USA, 1996. [Google Scholar]
- Depren, S.K.; Aşkin, Ö.E.; Öz, E. Identifying the classification performances of educational data mining methods: A case study for TIMSS. Educ. Sci. Theory Pract. 2017, 17. [Google Scholar] [CrossRef] [Green Version]
- Fernández-Delgado, M. Do we need hundreds of classifiers to solve real world classification problems? J. Mach. Learn. Res. 2014, 15, 3133–3181. [Google Scholar]
- Büyükkıdık, S.; Bakırarar, B.; Bulut, O. Comparing the Performance of Data Mining Methods in Classifying Successful Students with Scientific Literacy in PISA 2015. Comput. Sci. 2018, 68–75. [Google Scholar] [CrossRef]
- Huebener, M.; Kuger, S.; Marcus, J. Increased instruction hours and the widening gap in student performance. Labour Econ. 2017, 47, 15–34. [Google Scholar] [CrossRef]
- Martínez-Abad, F.; Gamazo, A.; Rodriguez-Conde, M.J. Educational Data Mining: Identification of factors associated with school effectiveness in PISA assessment. Stud. Educ. Eval. 2020, 66, 100875. [Google Scholar] [CrossRef]
- Gamazo, A.; Martínez-Abad, F. An exploration of factors linked to academic performance in PISA 2018 through data mining techniques. Front. Psychol. 2020, 11, 575167. [Google Scholar] [CrossRef]
- Blau, D.; Currie, J. Pre-School, Day Care, and After-School Care: Who’s Minding the Kids? In Handbook of the Economics of Education; Elsevier: Amsterdam, The Netherlands, 2006; Volume 2, pp. 1163–1278. [Google Scholar] [CrossRef]
- Topçu, M.S.; Erbilgin, E.; Arikan, S. Factors predicting Turkish and Korean students’ science and mathematics achievement in TIMSS 2011. EURASIA J. Math. Sci. Tech. Ed. 2016, 12, 1711–1737. [Google Scholar] [CrossRef]
- Koçak, G. The Comparison of Variables Effecting Success in Turkey, Singapore, Canada and Estonia in Pisa 2018. Master Thesis, Hacettepe University, Ankara, Turkey, 2022. [Google Scholar]
- Depren, S.K. Prediction of students’science achievement: An application of multivariate adaptive regression splines and regression trees. J. Balt. Sci. Educ. 2018, 17, 887–903. [Google Scholar] [CrossRef]
Figure 1.
Flowchart of application.

Figure 2.
Tanglegram of the dendrograms of the PISA data set (left) and socio-economic data set (right).
Figure 2.
Tanglegram of the dendrograms of the PISA data set (left) and socio-economic data set (right).


Table 1.
PISA data description.
| Country | Total Student | Female | Male |
|---|---|---|---|
| Brunei Darussalam (BRN) | 5374 | 2654 | 2720 |
| Hong Kong (HKG) | 5659 | 2786 | 2873 |
| Indonesia (IDN) | 12,023 | 6198 | 5825 |
| Japan (JPN) | 6054 | 3088 | 2966 |
| Korea (KOR) | 6636 | 3185 | 3451 |
| Macao (MAC) | 3769 | 1860 | 1909 |
| Malaysia (MYS) | 6036 | 3088 | 2948 |
| Philippines (PHL) | 7118 | 3806 | 3312 |
| B-S-J-Z China (QCI) | 11,989 | 5740 | 6249 |
| Singapore (SGP) | 6556 | 3210 | 3346 |
| Thailand (THA) | 8511 | 4621 | 3890 |
| Chinese Taipei (TAP) | 7161 | 3581 | 3580 |
Table 2.
The list of the variables used in this research.
| Variable | Description in Research | PISA Survey Code | |
|---|---|---|---|
| Age | Age | Age | |
| Gender | Gender | ST004D01T | |
| Mothers’ and fathers’ education level | Mothers’ Education and Fathers’ Education | ST005Q01TA, ST007Q01TA | |
| Mothers and Fathers’ qualifications by ISCED level | Mother qualifications, Father qualifications | ST006Q01TA, ST006Q02TA, ST006Q03TA, ST008Q01TA, ST008Q02TA, ST008Q03TA | |
| How old were you when you started ISCED 0? | ISCED0 | ST125Q01NA | |
| Mothers’ and Fathers’ Education (ISCED) | MISCED, FISCED | MISCED, FISCED | |
| Highest Education of parents (ISCED) | HISCED | HISCED | |
| In your home: | A desk to study at | Desk, Room, Quite Place, PC for School, Edu Software, Internet, Classic literature, Books of poetry, Works of art, Books for school, Technical books, Dictionary, Art Books | ST011Q01TA, ST011Q02TA, ST011Q03TA, ST011Q04TA, ST011Q05TA, ST011Q06TA, ST011Q07TA, ST011Q08TA, ST011Q09TA, ST011Q10TA, ST011Q11TA, ST011Q12TA, ST011Q16NA |
| A room of your own | |||
| A quiet place to study | |||
| A computer you can use for schoolwork | |||
| Educational software | |||
| A link to the Internet | |||
| Classic literature | |||
| Books of poetry | |||
| Works of art | |||
| Books to help with your schoolwork | |||
| Technical reference books | |||
| A dictionary | |||
| Books on art, music, or design | |||
| How many in your home: | Televisions | TV, Cars, Bath, Smartphones, Computers, Tablet, E-book, Musical instruments, Books | ST012Q01TA, ST012Q02TA, ST012Q03TA, ST012Q05NA, ST012Q06NA, ST012Q07NA, ST012Q08NA, ST012Q09NA, ST013Q01TA |
| Cars | |||
| Rooms with a bath or shower | |||
| Smartphones | |||
| Computers | |||
| Tablet computers | |||
| E-book readers | |||
| Musical instruments | |||
| Books | |||
| Thinking about (this academic year): | My parents support my educational efforts and achievements. | Support achievements, Support difficulties, Encourage. | ST123Q02NA, ST123Q03NA, ST123Q04NA |
| My parents support me when I am facing difficulties at school. | |||
| My parents encourage me to be confident. | |||
| Typically required to attend: Number of class periods per week in: | Test language lessons | PerWeek_TLanguage, PerWeek_Math, PerWeek_Science, PerWeek_FLanguage | ST059Q01TA, ST059Q02TA, ST059Q03TA, ST059Q04HA |
| Mathematics | |||
| Science | |||
| Foreign language | |||
| Plausible Values in Global Competency | PV1SCIE-PV10SCIE | PV1SCIE-PV10SCIE | |
| Response Variable | |||
| Mathematics Achievement | RS1-RS5 | Randomly selected 5 PVs | |
Table 3.
Socio-economic indexes.
| Country | GDP PPP (Per Capita) | Economic Freedom | Human Development Index (HDI) | Gender Inequality (GII) |
|---|---|---|---|---|
| Brunei Darussalam (BRN) | 61,831 | 64.2 | 0.83 | 0.255 |
| Hong Kong (HKG) | 62,513 | 90.2 | 0.949 | 0.466 |
| Indonesia (IDN) | 11,643 | 64.2 | 0.71 | 0.453 |
| Japan (JPN) | 42,116 | 72.3 | 0.923 | 0.466 |
| Korea (KOR) | 43,044 | 73.8 | 0.919 | 0.087 |
| Macao (MAC) | 135,535 | 70.9 | 0.922 | 0.466 |
| Malaysia (MYS) | 28,236 | 74.5 | 0.807 | 0.225 |
| Philippines (PHL) | 8719 | 65 | 0.71 | 0.422 |
| B-S-J-Z China (QCI) | 15,495 | 57.8 | 0.755 | 0.206 |
| Singapore (SGP) | 100,686 | 88.8 | 0.94 | 0.049 |
| Thailand (THA) | 18,533 | 67.1 | 0.795 | 0.405 |
| Chinese Taipei (TAP) | 51,011 | 76.6 | 0.916 | 0.466 |
Table 4.
Confusion matrix.
| Predicted Condition | ||
|---|---|---|
| Actual condition | True Positive-TP | False Negative-FN |
| False Positive-FP | True Negative-TN | |
Table 5.
Average results of classification performance measures based on PVs.
| Logistic Regression | Random Forest | SVM | ||||||||||
|---|---|---|---|---|---|---|---|---|---|---|---|---|
| Country | Accuracy (95% CI) | Precision | Recall | F-Score | Accuracy (95% CI) | Precision | Recall | F-Score | Accuracy (95% CI) | Precision | Recall | F-Score |
| BRN | 0.757 [0.72, 0.79] | 0.747 | 0.778 | 0.762 | 0.741 [0.71, 0.77] | 0.742 | 0.737 | 0.739 | 0.768 [0.76, 0.78] | 0.766 | 0.776 | 0.770 |
| HKG | 0.659 [0.63, 0.69] | 0.648 | 0.697 | 0.671 | 0.661 [0.61, 0.72] | 0.650 | 0.696 | 0.672 | 0.663 [0.64, 0.69] | 0.660 | 0.676 | 0.667 |
| IDN | 0.764 [0.74, 0.79] | 0.768 | 0.757 | 0.762 | 0.751 [0.74, 0.77] | 0.744 | 0.765 | 0.754 | 0.758 [0.72, 0.8] | 0.744 | 0.788 | 0.765 |
| JPN | 0.704 [0.68, 0.73] | 0.71 | 0.696 | 0.701 | 0.7 [0.67, 0.73] | 0.710 | 0.675 | 0.692 | 0.679 [0.66, 0.7] | 0.677 | 0.685 | 0.681 |
| KOR | 0.683 [0.64, 0.73] | 0.677 | 0.701 | 0.689 | 0.671 [0.63, 0.71] | 0.671 | 0.676 | 0.673 | 0.659 [0.64, 0.68] | 0.658 | 0.667 | 0.662 |
| MAC | 0.633 [0.61, 0.66] | 0.636 | 0.633 | 0.633 | 0.651 [0.62, 0.68] | 0.668 | 0.605 | 0.634 | 0.639 [0.56, 0.72] | 0.639 | 0.644 | 0.641 |
| MYS | 0.697 [0.67, 0.73] | 0.691 | 0.713 | 0.702 | 0.7 [0.67, 0.72] | 0.721 | 0.649 | 0.683 | 0.712 [0.67, 0.75] | 0.721 | 0.700 | 0.71 |
| PHL | 0.774 [0.73, 0.82] | 0.784 | 0.763 | 0.770 | 0.788 [0.74, 0.84] | 0.796 | 0.781 | 0.787 | 0.824 [0.77, 0.88] | 0.802 | 0.863 | 0.831 |
| QCI | 0.740 [0.7, 0.78] | 0.743 | 0.737 | 0.738 | 0.741 [0.72, 0.76] | 0.763 | 0.701 | 0.730 | 0.753 [0.72, 0.79] | 0.756 | 0.749 | 0.752 |
| SGP | 0.734 [0.69, 0.78] | 0.757 | 0.696 | 0.724 | 0.75 [0.68, 0.81] | 0.769 | 0.714 | 0.74 | 0.733 [0.69, 0.78] | 0.736 | 0.735 | 0.735 |
| THA | 0.790 [0.75, 0.83] | 0.815 | 0.755 | 0.783 | 0.796 [0.79, 0.8] | 0.811 | 0.775 | 0.792 | 0.787 [0.76, 0.82] | 0.803 | 0.762 | 0.782 |
| TAP | 0.684 [0.65, 0.72] | 0.683 | 0.688 | 0.685 | 0.685 [0.65, 0.72] | 0.684 | 0.690 | 0.686 | 0.705 [0.68, 0.73] | 0.698 | 0.724 | 0.711 |
| Mean of Performance Measures (95% CI) | ||||||||||||
| 0.718 [0.69, 0.75] | 0.722 [0.69, 0.76] | 0.718 [0.69, 0.74] | 0.718 [0.69, 0.75] | 0.717 [0.69, 0.75] | 0.73 [0.69, 0.76] | 0.705 [0.67, 0.74] | 0.715 [0.68, 0.75] | 0.73 [0.69, 0.76] | 0.722 [0.69, 0.76] | 0.731 [0.69, 0.77] | 0.726 [0.69, 0.76] | |
Table 6.
High-importance features of countries according to three classification algorithms.
| Country | LR Algorithm | RF Algorithm | SVM |
|---|---|---|---|
| BRN | PerWeek_Science, TV, Smartphones, FatherHighestSchooling, ISCED0, FISCED, HISCED, Support_Difficulties, Support_Achievements | PerWeek_Science, ISCED0, Smartphones, TV, PerWeek_TLanguage, Computers, PerWeek_Math, Age, PerWeek_FLanguage, Technical_Books, Support_Achievements | PerWeek_Science, ISCED0, Computers, Support_Achievements, TV, FISCED, FatherHighestSchooling, Books, Support_Difficulties, MISCED, Smartphones, MotherHighestSchooling |
| HKG | Books, E-Book, PerWeek_Science, Smartphones, FISCED, Tablet, Cars, Musical_instruments, Art_Books, FatherHighestSchooling | PerWeek_Science, Books, Art_Books PerWeek_FLanguage, Age, ISCED0, PerWeek_TLanguage, Smartphones, PerWeek_Math, InYourHome_ArtWorks, | Books, PerWeek_Science, E-Book, Musical_instruments, MotherHighestSchooling, FISCED, Cars, Tablet, FatherHighestSchooling |
| IDN | MISCED, MotherHighestSchooling, PerWeek_Science, Computers, Tablet, PerWeek_Math, Musical_instruments, Support_Achievements, Smartphones, FatherHighestSchooling, PerWeek_FLanguage, Bath | Computers, PerWeek_Science, PerWeek_Math, PerWeek_FLanguage, ISCED0, PerWeek_TLanguage, Age, InYourHome_Internet, FatherHighestSchooling, Smartphones | PerWeek_Science, MISCED, MotherHighestSchooling, Computers, Tablet, ISCED0, Bath, Support_Achievements, PerWeek_FLanguage, Smartphones, Encourage |
| JPN | PerWeek_FLanguage, MISCED, HISCED, Encourage, MotherHighestSchooling, MotherQualification, E-Book, Books, Classic_literature, PerWeek_TLanguage, FatherQualification, PerWeek_Math | PerWeek_FLanguage, PerWeek_Math, Classic_literature, Age, E-Book, ISCED0, PerWeek_Science, HISCED, Technical_Books, PerWeek_TLanguage, Musical_instruments, TV | PerWeek_FLanguage, E-Book, FISCED, Support_Achievements, MISCED, PerWeek_TLanguage, Books, HISCED, Classic_literature, MotherHighestSchooling, Encourage, PerWeek_Math |
| KOR | Support_Achievements, FISCED, Books, MISCED, PerWeek_FLanguage, Bath, MotherQualification, PerWeek_Science, E-Book, Support_Difficulties, Art_Books, MotherHighestSchooling, Smartphones | PerWeek_FLanguage, Age, Musical_instruments, PerWeek_Science, Classic_literature, Books, ISCED0, Support_Achievements, Smartphones, PerWeek_TLanguage, PerWeek_Math, Bath | FISCED, Support_Achievements, MotherQualification, E-Book, MISCED, Books, PerWeek_FLanguage, PerWeek_Science, Smartphones, Encourage |
| MAC | PerWeek_Science, E-Book, ISCED0, PerWeek_Math, MISCED, FISCED, Books, Smartphones, TV, Bath, HISCED, Computers, Tablet | PerWeek_Science, PerWeek_Math, PerWeek_FLanguage, Age, ISCED0, Classic_literature, PerWeek_TLanguage, Technical_Books, MotherHighestSchooling, Books, FatherHighestSchooling | PerWeek_Science, PerWeek_Math, Books, HISCED, Bath, FatherHighestSchooling, Age, E-Book, InYourHome_ArtWorks, TV, MotherQualification, Classic_literature |
| MYS | PerWeek_Science, FISCED, MISCED, PerWeek_TLanguage, HISCED, Support_Achievements, Smartphones, Computers, PerWeek_FLanguage, FatherQualification, Classic_literature | PerWeek_Science, PerWeek_FLanguage, Smartphones, PerWeek_Math, Computers, PerWeek_TLanguage, Age, MotherHighestSchooling, ISCED0, Support_Achievements, Books | PerWeek_Science, FISCED, MISCED, Smartphones, PerWeek_FLanguage, FatherQualification, Bath, Tablet, Support_Difficulties, Support_Achievements, Computers, MotherQualification |
| PHL | Books, Smartphones, Musical_instruments, MotherHighestSchooling, HISCED, Bath, Classic_literature, Support_Achievements, Encourage, MotherQualification, FISCED | Musical_instruments, Smartphones, Books, ISCED0, Computers, HISCED, Age, PerWeek_FLanguage, InYourHome_Internet, Bath, MISCED | Computers, Tablet, TV, Musical_instruments, Classic_literature, MotherHighestSchooling, Cars, Support_Difficulties, Encourage, InYourHome_OwnRoom, Books, InYourHome_Desk, FatherHighestSchooling |
| QCI | PerWeek_Science, FatherQualification, FISCED, Support_Achievements, Books, Smartphones, MotherHighestSchooling, Tablet, ISCED0, MISCED, PerWeek_TLanguage | PerWeek_Science, PerWeek_TLanguage, ISCED0, Age, PerWeek_FLanguage, PerWeek_Math, MotherHighestSchooling, Books, FatherHighestSchooling, Smartphones, Support_Achievements, TV | PerWeek_Science, Books, FISCED, MISCED, MotherHighestSchooling, FatherQualification, ISCED0, PerWeek_TLanguage, Support_Achievements, Tablet |
| SGP | PerWeek_Science, PerWeek_TLanguage, FatherQualification, FISCED, HISCED, Encourage, Support_Achievements, Books, MISCED, FatherHighestSchooling, MotherHighestSchooling, TV | PerWeek_Science, PerWeek_TLanguage, PerWeek_FLanguage, Books, ISCED0, PerWeek_Math, Age, FatherQualification, Art_Books, Musical_instruments, Computers | PerWeek_Science, PerWeek_TLanguage, Books, FatherQualification, HISCED, FISCED, MotherHighestSchooling, Art_Books, Encourage, Cars, MISCED |
| THA | PerWeek_Science Support_Achievements, PerWeek_FLanguage, Encourage, Books, PerWeek_TLanguage, Musical_instruments, PerWeek_Math, FatherHighestSchooling, MISCED, FISCED, Computers, E-Book | PerWeek_Science, PerWeek_FLanguage, PerWeek_Math, HISCED, Age, PerWeek_TLanguage, Computers, MISCED, ISCED0, Books, Smartphones, Support_Achievements | PerWeek_Science, Support_Achievements, PerWeek_FLanguage, PerWeek_TLanguage, FISCED, PerWeek_Math, MISCED, MotherHighestSchooling, Encourage, Books, Computers, E-Book |
| TAP | Support_Achievements, Books, FatherHighestSchooling, Smartphones, FISCED, MotherHighestSchooling, PerWeek_Science, PerWeek_Math, Encourage | Books, PerWeek_Math, PerWeek_Science, PerWeek_FLanguage, Musical_instruments, Age, ISCED0, MotherHighestSchooling, Support_Achievements, PerWeek_TLanguage, FatherHighestSchooling, Classic_literature | Support_Achievements, Books, MotherHighestSchooling, PerWeek_Science, FatherHighestSchooling, FISCED, PerWeek_Math, Encourage, HISCED, Age, ISCED0, Smartphones |
Table 7.
Comparison of the performance of models created using all features and models created using high-importance features.
Table 7.
Comparison of the performance of models created using all features and models created using high-importance features.
| LR Algorithm | RF Algorithm | SVM Algorithm | ||||
|---|---|---|---|---|---|---|
| All F. | Imp. F. | All F. | Imp. F. | All F. | Imp. F. | |
| BRN | 0.757 | 0.738 | 0.741 | 0.738 | 0.768 | 0.712 |
| HKG | 0.659 | 0.638 | 0.661 | 0.654 | 0.663 | 0.629 |
| IDN | 0.764 | 0.748 | 0.751 | 0.751 | 0.758 | 0.706 |
| JPN | 0.704 | 0.68 | 0.67 | 0.700 | 0.679 | 0.64 |
| KOR | 0.683 | 0.646 | 0.671 | 0.669 | 0.659 | 0.611 |
| MAC | 0.633 | 0.615 | 0.651 | 0.645 | 0.639 | 0.609 |
| MYS | 0.697 | 0.677 | 0.699 | 0.694 | 0.712 | 0.656 |
| PHL | 0.774 | 0.682 | 0.788 | 0.744 | 0.824 | 0.679 |
| QCI | 0.740 | 0.728 | 0.741 | 0.751 | 0.753 | 0.738 |
| SGP | 0.734 | 0.726 | 0.749 | 0.757 | 0.733 | 0.692 |
| THA | 0.790 | 0.771 | 0.796 | 0.797 | 0.787 | 0.773 |
| TAP | 0.684 | 0.663 | 0.685 | 0.685 | 0.705 | 0.681 |
| Mean of Accuracies (95% CI) | ||||||
| 0.718 [0.69, 0.75] | 0.693 [0.66, 0.72] | 0.717 [0.69, 0.75] | 0.715 [0.69, 0.75] | 0.73 [0.69, 0.76] | 0.677 [0.64, 0.71] 1 | |
1 Using all features = All F., Using high-importance features = Imp. F.
Disclaimer/Publisher’s Note: The statements, opinions and data contained in all publications are solely those of the individual author(s) and contributor(s) and not of MDPI and/or the editor(s). MDPI and/or the editor(s) disclaim responsibility for any injury to people or property resulting from any ideas, methods, instructions or products referred to in the content. |
© 2023 by the authors. Licensee MDPI, Basel, Switzerland. This article is an open access article distributed under the terms and conditions of the Creative Commons Attribution (CC BY) license (https://creativecommons.org/licenses/by/4.0/).
Share and Cite
MDPI and ACS Style
Bayirli, E.G.; Kaygun, A.; Öz, E. An Analysis of PISA 2018 Mathematics Assessment for Asia-Pacific Countries Using Educational Data Mining. Mathematics 2023, 11, 1318. https://doi.org/10.3390/math11061318
AMA Style
Bayirli EG, Kaygun A, Öz E. An Analysis of PISA 2018 Mathematics Assessment for Asia-Pacific Countries Using Educational Data Mining. Mathematics. 2023; 11(6):1318. https://doi.org/10.3390/math11061318
Chicago/Turabian StyleBayirli, Ezgi Gülenç, Atabey Kaygun, and Ersoy Öz. 2023. "An Analysis of PISA 2018 Mathematics Assessment for Asia-Pacific Countries Using Educational Data Mining" Mathematics 11, no. 6: 1318. https://doi.org/10.3390/math11061318
Note that from the first issue of 2016, this journal uses article numbers instead of page numbers. See further details here.