

The Choice of Machine Learning Algorithms Impacts the Association between Brain-Predicted Age Difference and Cognitive Function
Department of Software Convergence, Kyung Hee University, Yongin 17104, Republic of Korea
Mathematics 2023, 11(5), 1229; https://doi.org/10.3390/math11051229
Submission received: 8 February 2023
/
Revised: 25 February 2023
/
Accepted: 1 March 2023
/
Published: 2 March 2023
(This article belongs to the Special Issue New Trends of Machine Learning Applications in Computer Graphics and Image Processing)
Abstract
:Machine learning has been increasingly applied to neuroimaging data to compute personalized estimates of the biological age of an individual’s brain (brain age). The difference between an individual’s brain-predicted age and their chronological age (brainPAD) is used as a biomarker of brain aging and disease, but the potential contribution of different machine learning algorithms used for brain age prediction to the association between brainPAD and cognitive function has not been investigated yet. Here, we applied seven commonly used algorithms to the same multimodal brain imaging data (structural and diffusion MRI) from 601 healthy participants aged 18–88 years in the Cambridge Centre for Ageing and Neuroscience to assess variations in brain-predicted age. The inter-algorithm similarity in brain-predicted age and brain regional regression weights was examined using the Pearson’s correlation analyses and hierarchical clustering. We then assessed to what extent machine learning algorithms impact the association between brainPAD and seven cognitive variables. The regression models achieved mean absolute errors of 5.46–7.72 years and Pearson’s correlation coefficients of 0.86–0.92 between predicted brain age and chronological age. Furthermore, we identified a substantial difference in linking brainPAD to cognitive measures, indicating that the choice of algorithm could be an important source of variability that confounds the relationship between brainPAD and cognition.
Keywords:
magnetic resonance imaging; diffusion magnetic resonance imaging; machine learning; brain age prediction; cognitionMSC:
68T011. Introduction
Genetic and environmental factors influence the rate of age-related biological changes in the brain [1]. However, the rate of change shows inter-individual variation [2,3]. Machine learning algorithms can be applied to neuroimaging data to generate estimates of the biological age of an individual’s brain (i.e., brain age) [4]. In each individual, subtracting their chronological age from their brain-predicted age generates a brain-predicted age difference (brainPAD) score [5,6], which indicates whether their brain appears “older” (positive score) or “younger” (negative score) than their actual age. This metric reflects the deviation from typical lifespan trajectories and is used as a biomarker of brain aging and disease [7].
Brain-predicted age and brainPAD are biologically meaningful metrics. A higher brainPAD has been associated with key physiological markers of age-related frailty, such as lower grip strength and lower cognitive function [1,8], as well as risk factors for accelerated aging, such as smoking and poor physical health [9,10]. Conversely, a lower brainPAD has been used to illustrate positive influences relating to higher education and physical activity [11]. A higher brainPAD has been found in Alzheimer’s disease [12], traumatic brain injuries [13], and psychiatric disorders [14,15]. It is associated with cognitive decline [16] and can predict future conversion from mild cognitive impairment to Alzheimer’s disease [12,17].
Neuroimaging-based brain age estimates can be influenced by many parameters including sample size, sample composition, the type of neuroimaging features used, and the choice of the machine learning algorithm applied to the data [15,18]. Brain-predicted age has the potential to enter clinical settings as a potential biomarker of brain health [7,19]. Clinical applications have real-life consequences in terms of advice given to help-seeking individuals or in terms of evaluating the impact of interventions. In this respect, it is important that we improve, quantify, and harmonize the methods applied to the computation of brain age. Here, we focus specifically on the role of the statistical method by undertaking a comparative evaluation of the most commonly used machine learning algorithms for brain age prediction. We also aim to investigate to what extent the choice of machine learning algorithms impacts the association between brainPAD and cognitive function.
To address these aims, we established a machine learning model to predict brain age using multimodal imaging features comprising regional structural measures derived from structural magnetic resonance imaging (MRI) data and regional diffusion measures of white matter integrity (fractional anisotropy and mean, axial, and radial diffusivity) derived from diffusion MRI data, acquired from the Cambridge Centre for Ageing and Neuroscience Project (Cam-CAN) [20,21], which is led by the University of Cambridge, UK. The project used epidemiological, cognitive, and neuroimaging data acquired from adults aged 18–88 years in an effort to elucidate mechanisms related to aging. We compared seven commonly used machine learning algorithms, including ordinary least squares (OLS) regression, ridge regression, least absolute shrinkage and selection operator (Lasso) regression, elastic-net regression, support vector regression (SVR), relevance vector regression (RVR), and Gaussian process regression (GPR), in brain age prediction by performing the Pearson’s correlation analyses and hierarchical clustering. We determined the deviation between brain-predicted age and chronological age (brainPAD) for each algorithm and then examined the impact of the algorithm choice on the association between brainPAD and cognitive function.
2. Materials and Methods
2.1. Sample
The present study included 601 participants (age range = 18–88 years) from the Cambridge Centre for Ageing and Neuroscience (Cam-CAN) [20]. These participants were cognitively healthy adults recruited from the local community. The Cam-CAN cohort is a public access database funded by the Biotechnology and Biological Sciences Research Council, the UK Medical Research Council, and the University of Cambridge. All individuals were screened according to local study protocols to ensure they had no history of neurological, psychiatric, or major medical conditions. Ethical approvals and informed consents were obtained locally for each study, covering both participation and subsequent data sharing.
2.2. Neuroimaging Acquisition and Processing
In all Cam-CAN participants, T1-weighted and diffusion-weighted images were acquired on a 3T Siemens TIM Trio scanner (details in Supplementary Materials). Structural T1-weighted MRI images were processed using FreeSurfer 6.0 (http://surfer.nmr.mgh.harvard.edu, accessed on 1 September 2020). Cortical parcellation was based on the Desikan–Killiany atlas [22,23], while subcortical segmentation was carried out using the probabilistic atlas in FreeSurfer [24] (details in Supplementary Materials). This procedure generated 153 structural features (total intracranial volume, 68 regional measures of cortical thickness, 68 regional measures of cortical surface area, and 16 measures of subcortical volume) (details in Supplementary Table S1).
Diffusion image processing was performed using FSL (version 6.0), which is a part of the Functional Magnetic Resonance Imaging of the Brain (FMRIB) Software Library. Eddy currents and movement were corrected using FSL’s eddy tool. Fractional anisotropy (FA), mean (MD), axial (AD), and radial diffusivity (RD) maps were computed by fitting a tensor model to the corrected diffusion tensor imaging (DTI) data using FSL’s dtifit tool (details in Supplementary Materials). The Johns Hopkins University (JHU) parcellation atlas was used to estimate regional measures of white matter tracts. This procedure resulted in 192 white matter diffusion features (48 regional measures of each diffusion metric—FA, MD, AD, and RD) for each individual (details in Supplementary Table S1). Both brain morphological and diffusion measures were used as input features to machine learning algorithms.
2.3. Machine Learning Algorithms
Brain age prediction was performed using seven machine learning algorithms that are validated and most commonly reported in the literature [1,5,18,25,26,27,28,29].
2.3.1. Ordinary Least Squares (OLS) Regression
This is an approach to fit a linear model by minimizing the residual sum of squares between the observed value in the training dataset (i = 1, …, N, the sample size) and the values predicted by the ordinary least squares regression model. The object function is as follows:
where is the actual value of the chronological age and is the value of the ith feature of the ith subject. The least squares solution was computed using the singular value decomposition (SVD).
2.3.2. Ridge Regression
This is a form of regularized linear regression using a L2-norm penalty that aims to minimize the sum of the squared prediction error in the training data. This algorithm tends to make the coefficients close to zero [30]. The object function is as follows:
where N is the sample size, is the actual value of the chronological age, is the value of the ith feature of the ith subject, is the values predicted by the linear model, p is the number of features, and is the regression coefficient. This algorithm shrinks the coefficients, and it helps to reduce the model complexity and multicollinearity. The tuning parameter controls the model’s complexity. We determined the optimal choice of parameter using 10-fold cross-validation.
2.3.3. Least Absolute Shrinkage and Selection Operator (Lasso) Regression
This is a regularized linear regression using a L1-norm penalty that aims to minimize the sum of the absolute value of the regression coefficients [31]. The objective function is as follows:
where N is the sample size, is the actual value of the chronological age, is the value of the ith feature of the ith subject, p is the number of features, and is the regression coefficient. The L1-norm regularization tends to make some coefficients that are exactly zero. It retains one random feature among the correlated ones, thus yielding a sparse model that facilitates optimization of the predictors and reduces the model complexity. We tuned a hyperparameter using 10-fold cross-validation.
2.3.4. Elastic-Net Regression
This is a regularized linear regression model that combines both the L1-norm and L2-norm regularizations in the OLS loss function [32]. The object function is as follows:
where is the age of the ith individual, p is the number of features, is the value of the jth feature of the ith subject, and is the regression coefficient. This algorithm performs variable selection and regularization simultaneously. This method is most appropriate where the number of features is greater than the number of samples. This allows the number of selected features to be larger than the sample size while achieving a sparse model. We tuned a hyperparameter parameter (between 0 and 1) to adjust the relative weighting of the L1-norm and L2-norm contributions. The optimal parameter was chosen based on 10-fold cross-validation.
2.3.5. Support Vector Regression (SVR)
SVR is characterized by the use of kernels, sparsity, control of the margin of tolerance (epsilon, ), and the number of support vectors. This algorithm aims to find a function whose predictive value deviates by no more than a required accuracy from the actual for all the training data while maximizing the flatness of the function [33]. This algorithm uses the L2-norm regularization that aims to minimize the squared sum of the regression coefficients. The object function is as follows:
where is the quantity of support vectors, which are the samples that deviate by more than from the actual used to fit the model. A parameter C regulates the smoothness of function . The slack variables and are introduced to cope with the infeasible constraints of the optimization problem. We chose the optimal C parameter using 10-fold cross-validation.
2.3.6. Relevance Vector Regression (RVR)
RVR is a Bayesian sparse kernel method for regression. RVR has an identical functional form to SVR [34]. The function is as follows:
where is a vector of weights and is a linear kernel function defining the basis function. The sparsity of RVR is induced by the hyperpriors on model parameters in a Bayesian framework with the maximum a posteriori (MAP) principle. RVR determines the relationship between the target output and the covariates by enforcing sparsity. The L1-norm-like regularization used in RVR encourages the sum of absolute values to be small, which often drives many parameters to zero and provides few basic functions. Notably, RVR has no algorithm-specific parameter [34].
2.3.7. Gaussian Process Regression (GPR)
This is a non-parametric kernel-based probabilistic approach. GPR is a model that has the multivariate Gaussian distribution that can be applied over an infinite number of variables. The assumption in GPR is that any finite number of random variables has a multivariate Gaussian distribution with a mean function and a covariance function k(x, x′) = E[f(x) − m(x)f(x′) − m(x′)]. The prior belief about the relationship between variables is informed by the definition of these multivariate Gaussians to generate a model that represents the observed variance. Therefore, a GPR is applied to select an appropriate covariance function that measures the similarity between data points. As the multivariate Gaussian can represent local patterns of covariance between individual points, the combination of multiple Gaussians in a GPR can model non-linear relationships [35].
We implemented OLS regression, ridge regression, Lasso regression, and elastic-net regression using the scikit-learn library in Python [36]. We implemented SVR using the validated LIBSVM function (https://www.csie.ntu.edu.tw/~cjlin/libsvm/, accessed on 1 October 2020) in MATLAB (MathWorks, Natick, MA) [37]. The Pattern Recognition for Neuroimaging Toolbox (PRoNTo) (http://www.mlnl.cs.ucl.ac.uk/pronto/, accessed on 1 October 2020) [38] was used to implement RVR and GPR.
2.4. Brain Age Prediction and BrainPAD Estimation
The Cam-CAN dataset was split into a training set (n = 500) and a test set (n = 101). We performed statistical testing to ensure that there are no significant differences in age and sex between the two sets. Details about sample and demographic information are provided in Supplementary Table S2. We applied the seven commonly used regression algorithms separately to multimodal (combined structural and diffusion features) data. Each algorithm was applied separately to the dataset according to the following steps: (i) prior to modeling, each neuroimaging measure was linearly scaled so that all values in the feature set ranged between 0 and 1; (ii) a nested 10-fold cross-validation (10F-CV) was performed within the training data (n = 500) to estimate the brain age model performance: the training data were randomly split into 10 equal-sized subsets. For each cross-validation, one subset was left out as the test subset while the remaining nine subsets were used together as the training set for estimating the model parameters. These parameters were then applied to the left-out subset. Specifically, for ridge regression, Lasso regression, elastic-net regression, and SVR, a cross-validation procedure was applied with an outer 10F-CV to evaluate model generalizability and an inner 10F-CV to determine the optimal parameters for these algorithms; (iii) the performance of the trained brain age model was tested by predicting brain age in unseen individuals in the test set (n = 101); (iv) the performance of each algorithm was quantified by the Pearson’s correlation coefficient (r) and mean absolute error (MAE) between predicted brain age and chronological age; (v) for each algorithm, the regression weights for each brain region were also used for the comparative evaluation of the algorithms: the absolute value of these weights represents the importance of the corresponding features in the brain age prediction of the model [39]; (vi) the brain-predicted age difference (brainPAD) was calculated for each algorithm by subtracting the chronological age of each individual from their brain age predicted by that algorithm. BrainPAD is often overestimated in younger individuals and underestimated in older individuals due to the general statistical features of the regression analysis [40]. For age-bias correction, we regressed out the effect of age on brainPAD on the entire sample to correct for “regression to the mean” bias [40,41], and then used the resulting residuals in further analyses.
2.5. Association of BrainPAD with Cognitive Function
The Cam-CAN project provides cognitive assessment data collected outside of the MRI scanner. We used cognitive measures available in the Cam-CAN to evaluate the utility of our estimated brainPAD to capture cognitive phenotypes. In the current study, we used 7 cognitive measures that assess executive function, memory, motor function, and emotional processing, which are the most commonly used measures in the literature [20,21,42,43,44]. Executive function was measured using Cattell’s fluid intelligence test, the hotel test, and a proverb comprehension task. Memory was measured using the tip of the tongue (ToT) test. Motor function was assessed via a response time (RT) “choice” task and a RT “simple” task. Emotion processing was measured using Ekman’s emotion expression recognition test (see Supplementary Materials for detailed task descriptions) [20,21].
A general linear model was formulated to test whether brainPAD was associated with each of the cognitive measures in the entire sample of the Cam-CAN (n = 601). The brainPAD of the ith participant was modeled as
where and denote the residualized brainPAD and cognitive measure of the ith participant, respectively. denotes the fitted regression coefficients, and is the error term. The model was fitted independently to each of the 7 cognitive measures (details in Supplementary Table S3). The explanatory variable characterizing sex () and the age-by-cognition () and sex-by-cognition () interactions were not significant for each cognitive score, and thus were removed from the final model. The false discovery rate (FDR) was controlled at 5% across the 7 independent tests. In the supplemental analyses, we tested whether brainPAD was associated with each of the cognitive measures in the test sample (n = 101). This supplemental analysis was performed to determine whether the observed associations remained due to the choice of machine learning algorithms in the test sample.
3. Results
3.1. Performance of Machine Learning Algorithms in Brain Age Prediction
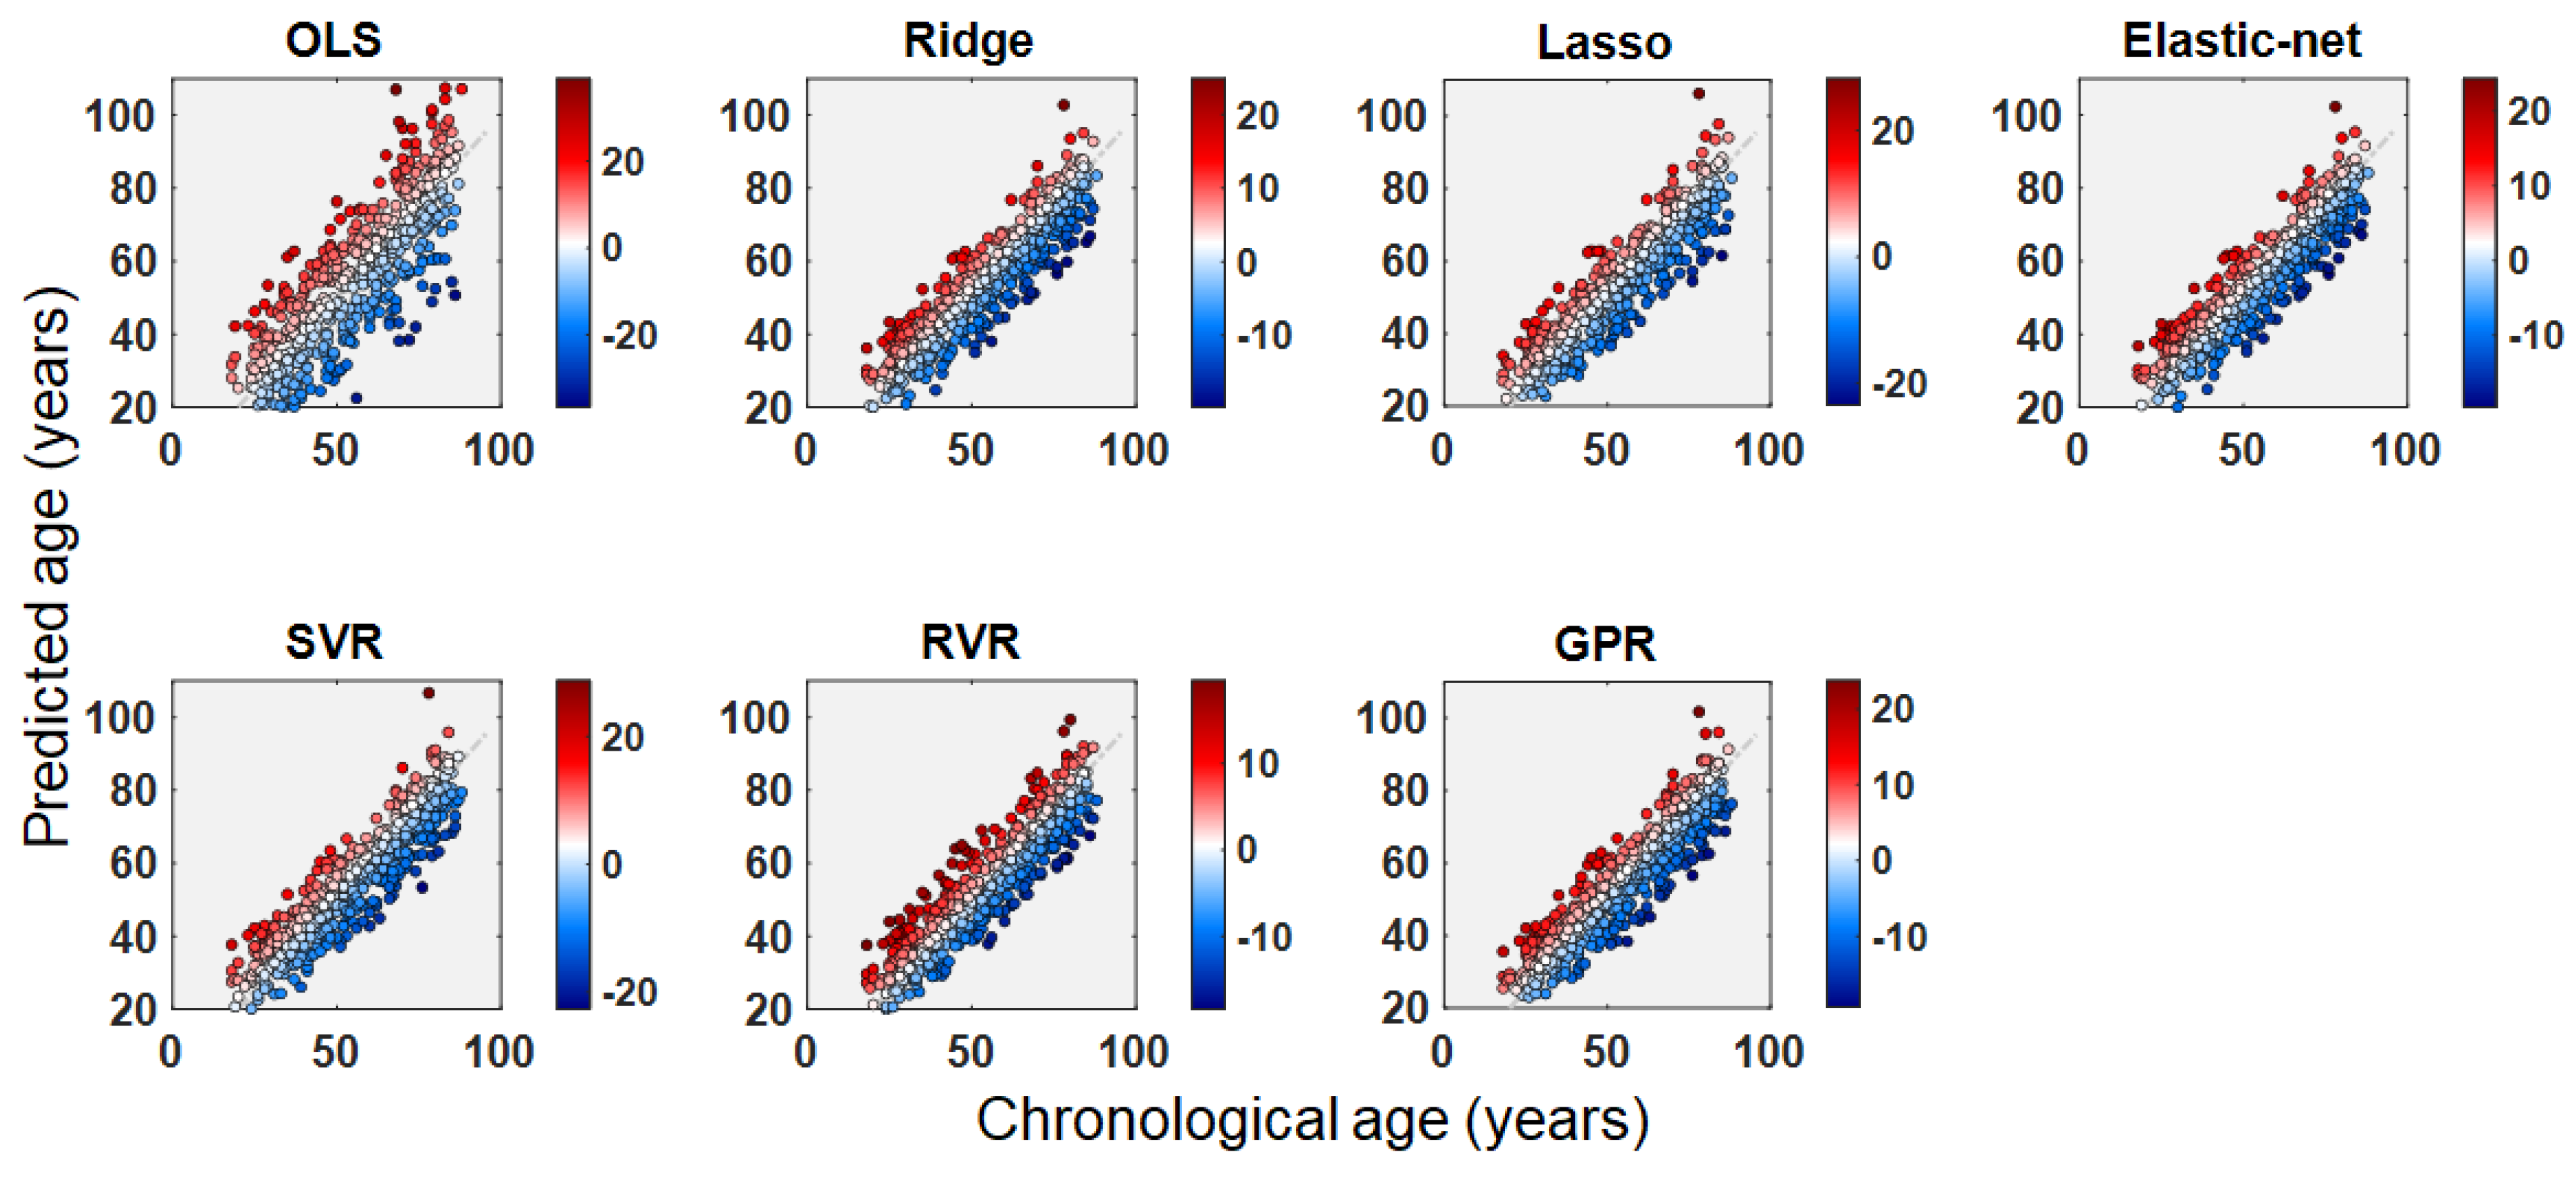
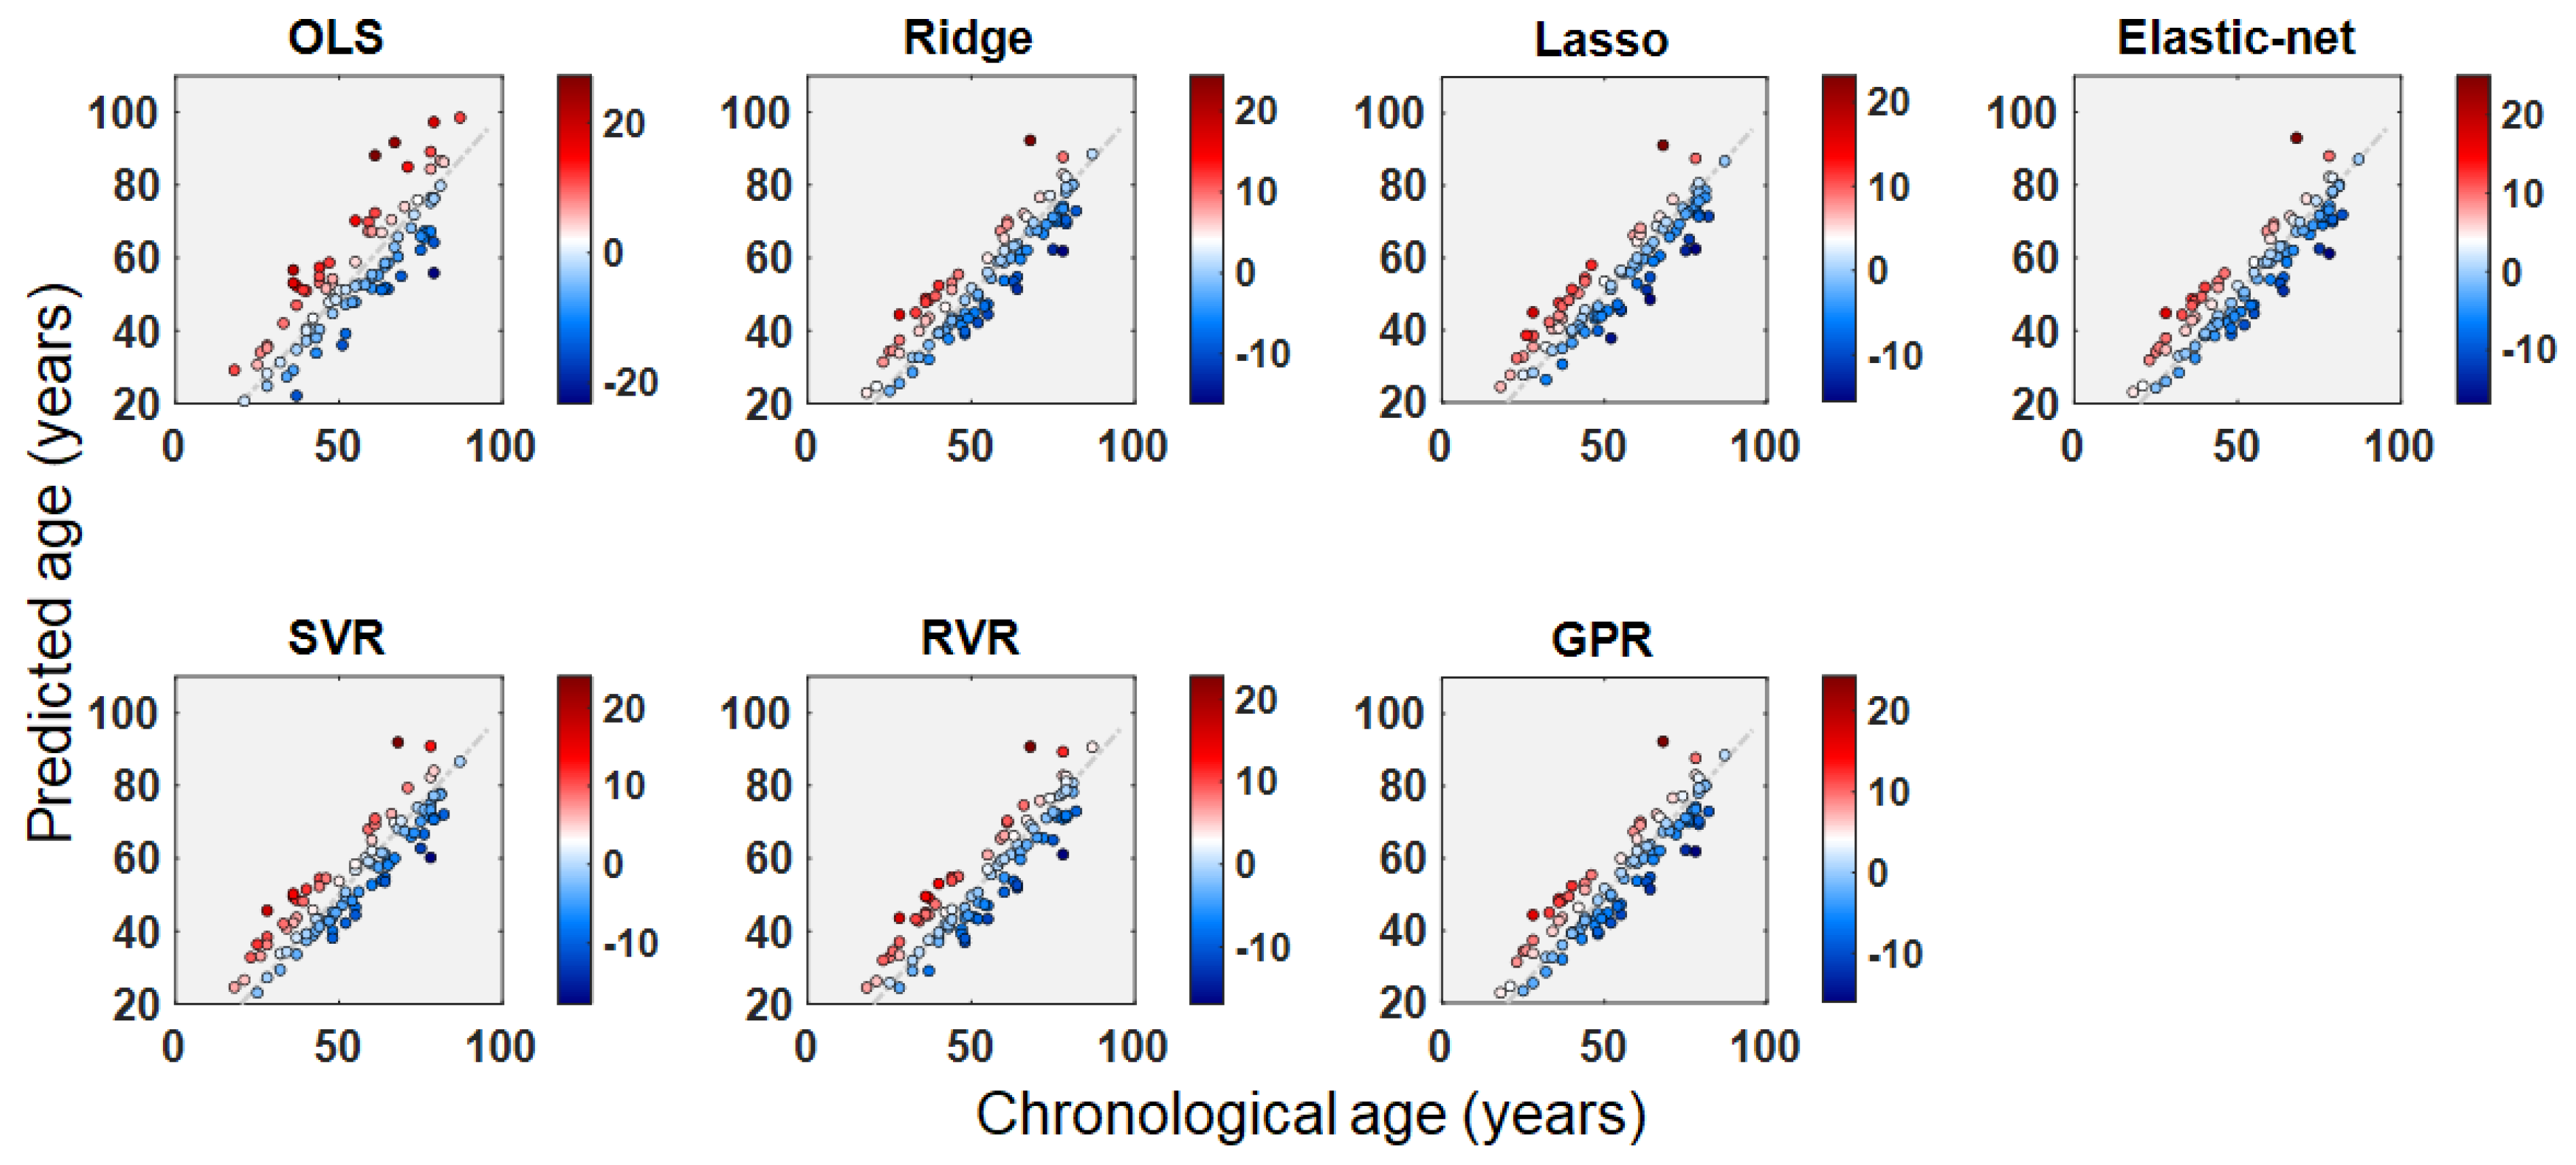
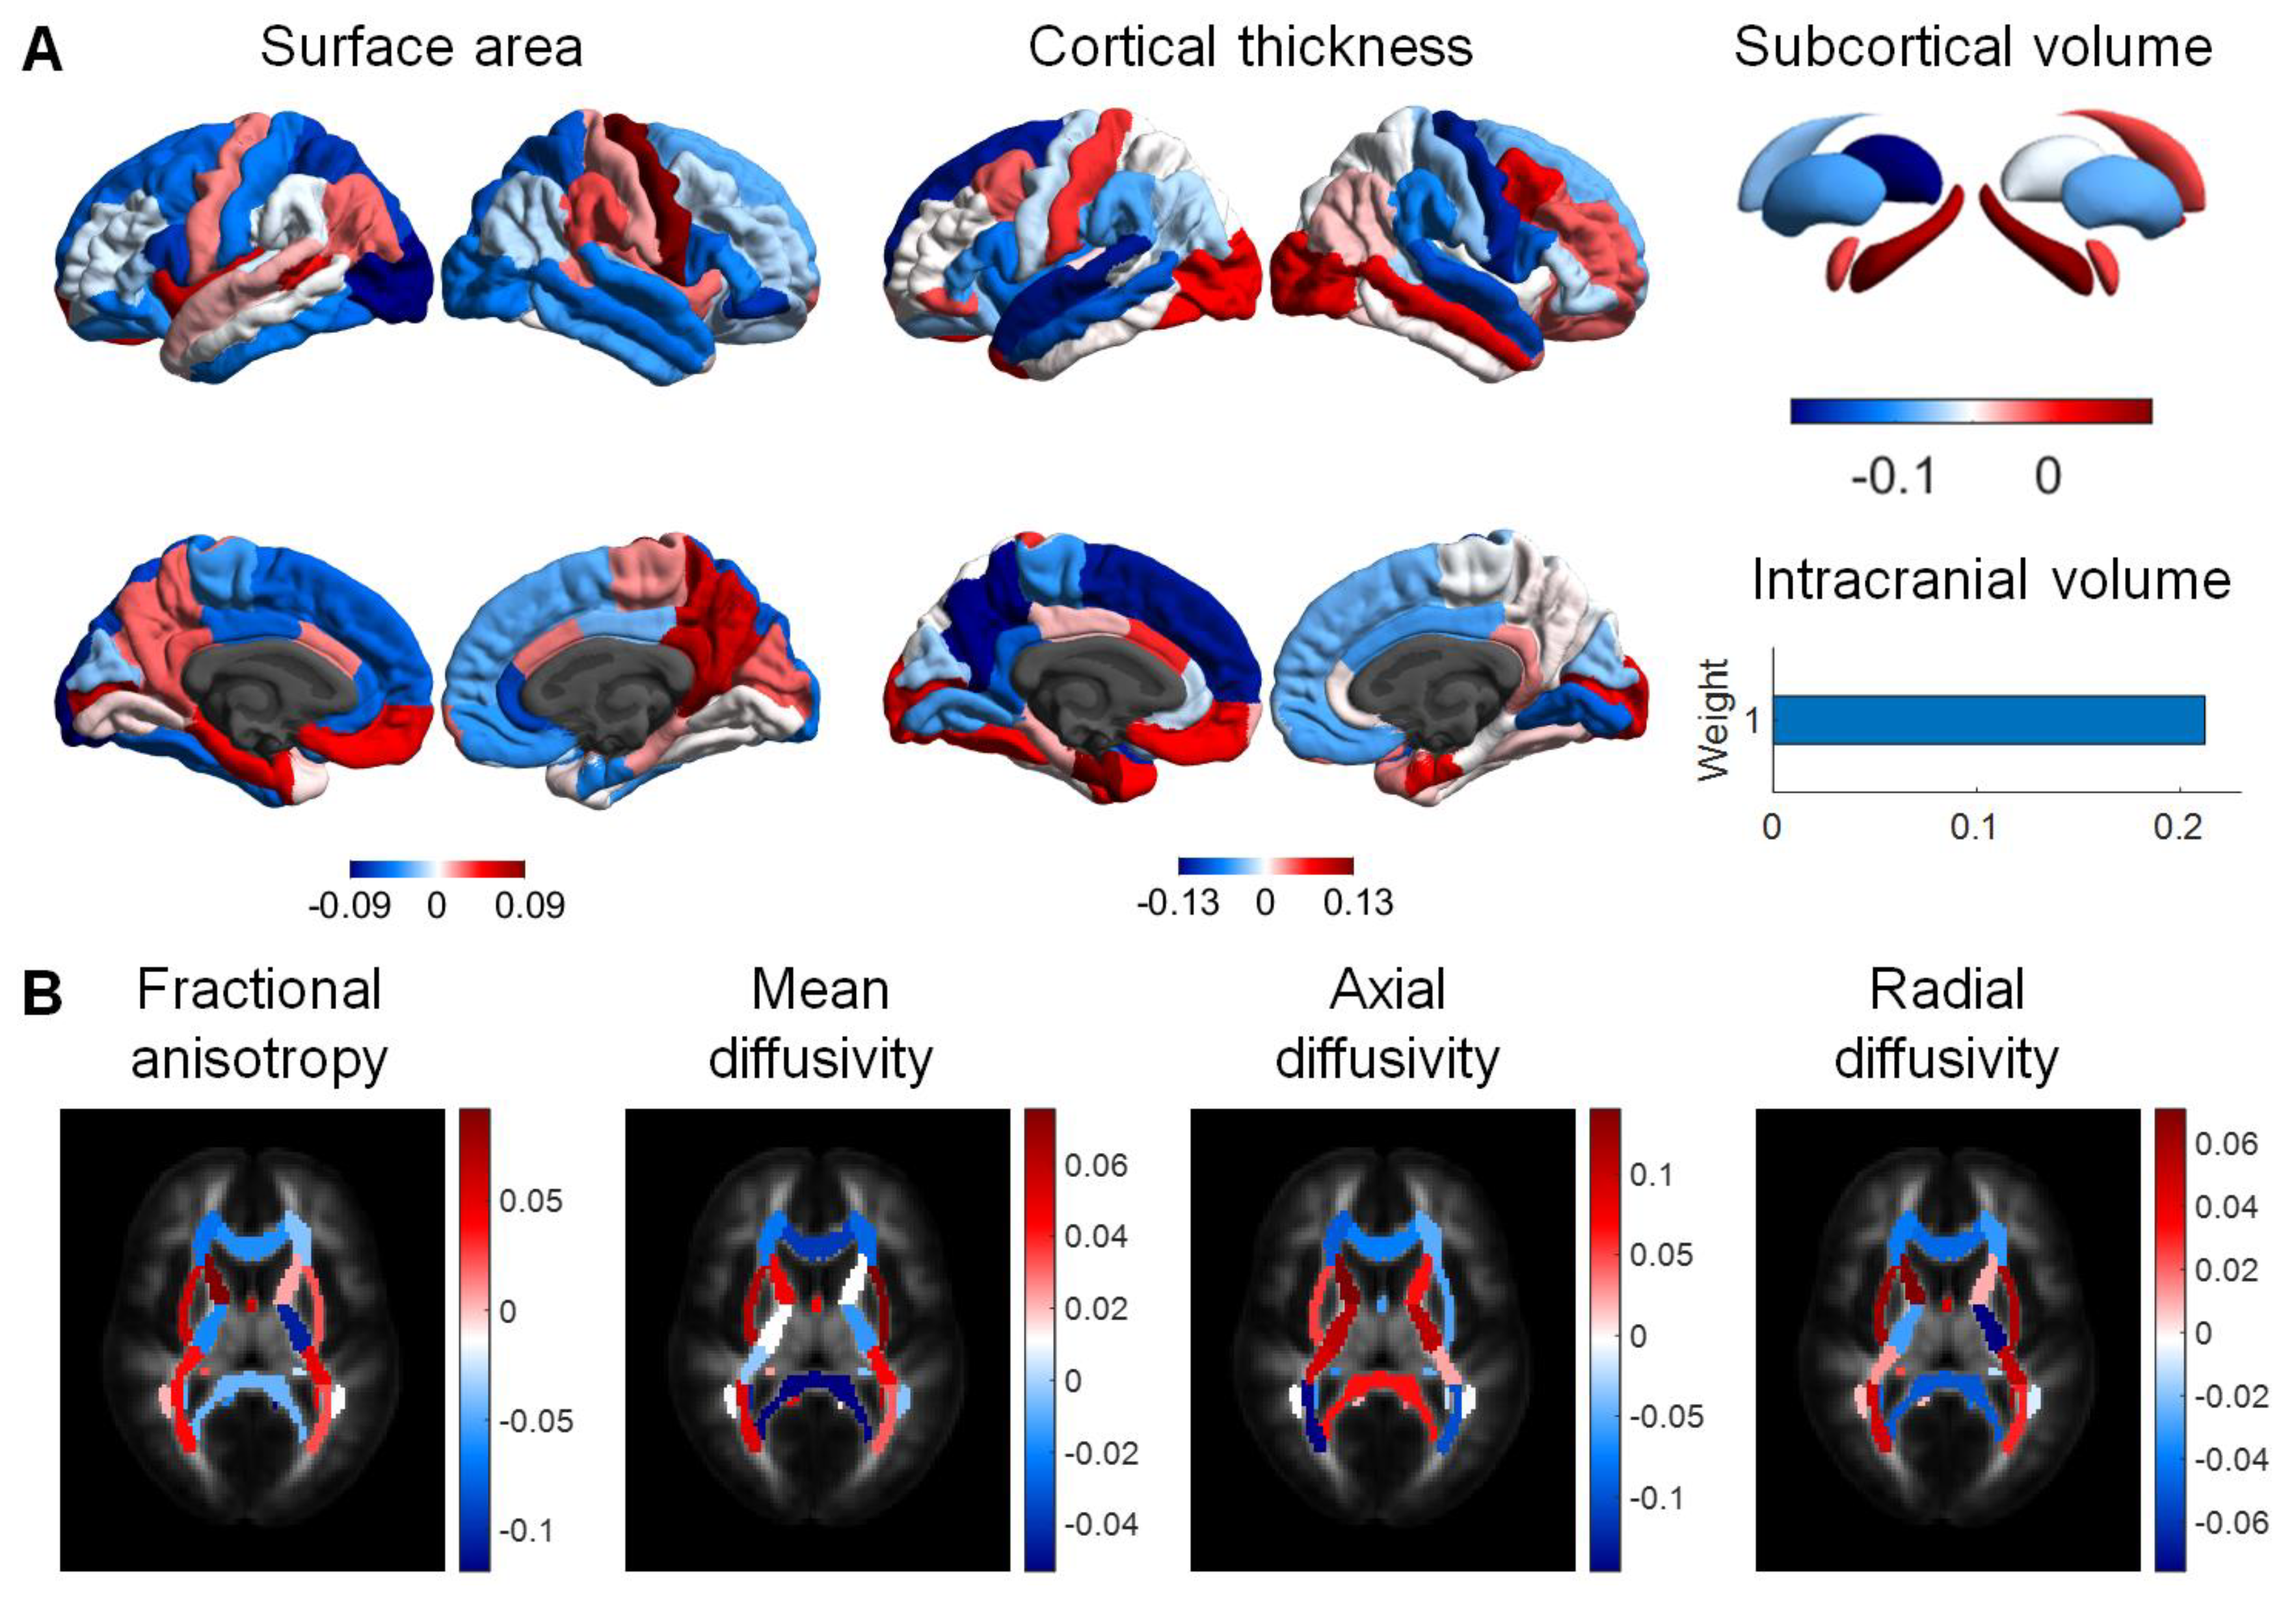
All seven algorithms tested using 10-fold cross-validation on the Cam-CAN training set showed that OLS regression had the lowest correlation of 0.78 and the highest MAE of 9.69 years, compared to the other six algorithms which had comparable correlations (range = 0.91–0.92) and MAEs (range = 5.65–5.93 years) between chronological age and predicted brain age (Table 1). In predicting brain age using the test set, all algorithms provided a similar performance in brain age prediction (r = 0.91–0.92; MAE = 5.46–5.89 years) with the exception of OLS regression (r = 0.86; MAE = 7.72 years). The predicted brain ages in the training data (Figure 1) and the test data (Figure 2) were plotted against chronological age for each of the seven regression algorithms. The weights of ridge regression for each of the structural and diffusion features in brain age prediction are visualized in Figure 3. The weights of all the other algorithms for each regional feature are provided in Supplementary Figures S1–S7. In addition, the total computation time to train the model using 10-fold cross-validation for each algorithm is provided in detail in Supplementary Table S4.
3.2. Comparative Evaluation of Machine Learning Algorithms
3.2.1. Brain-Predicted Age
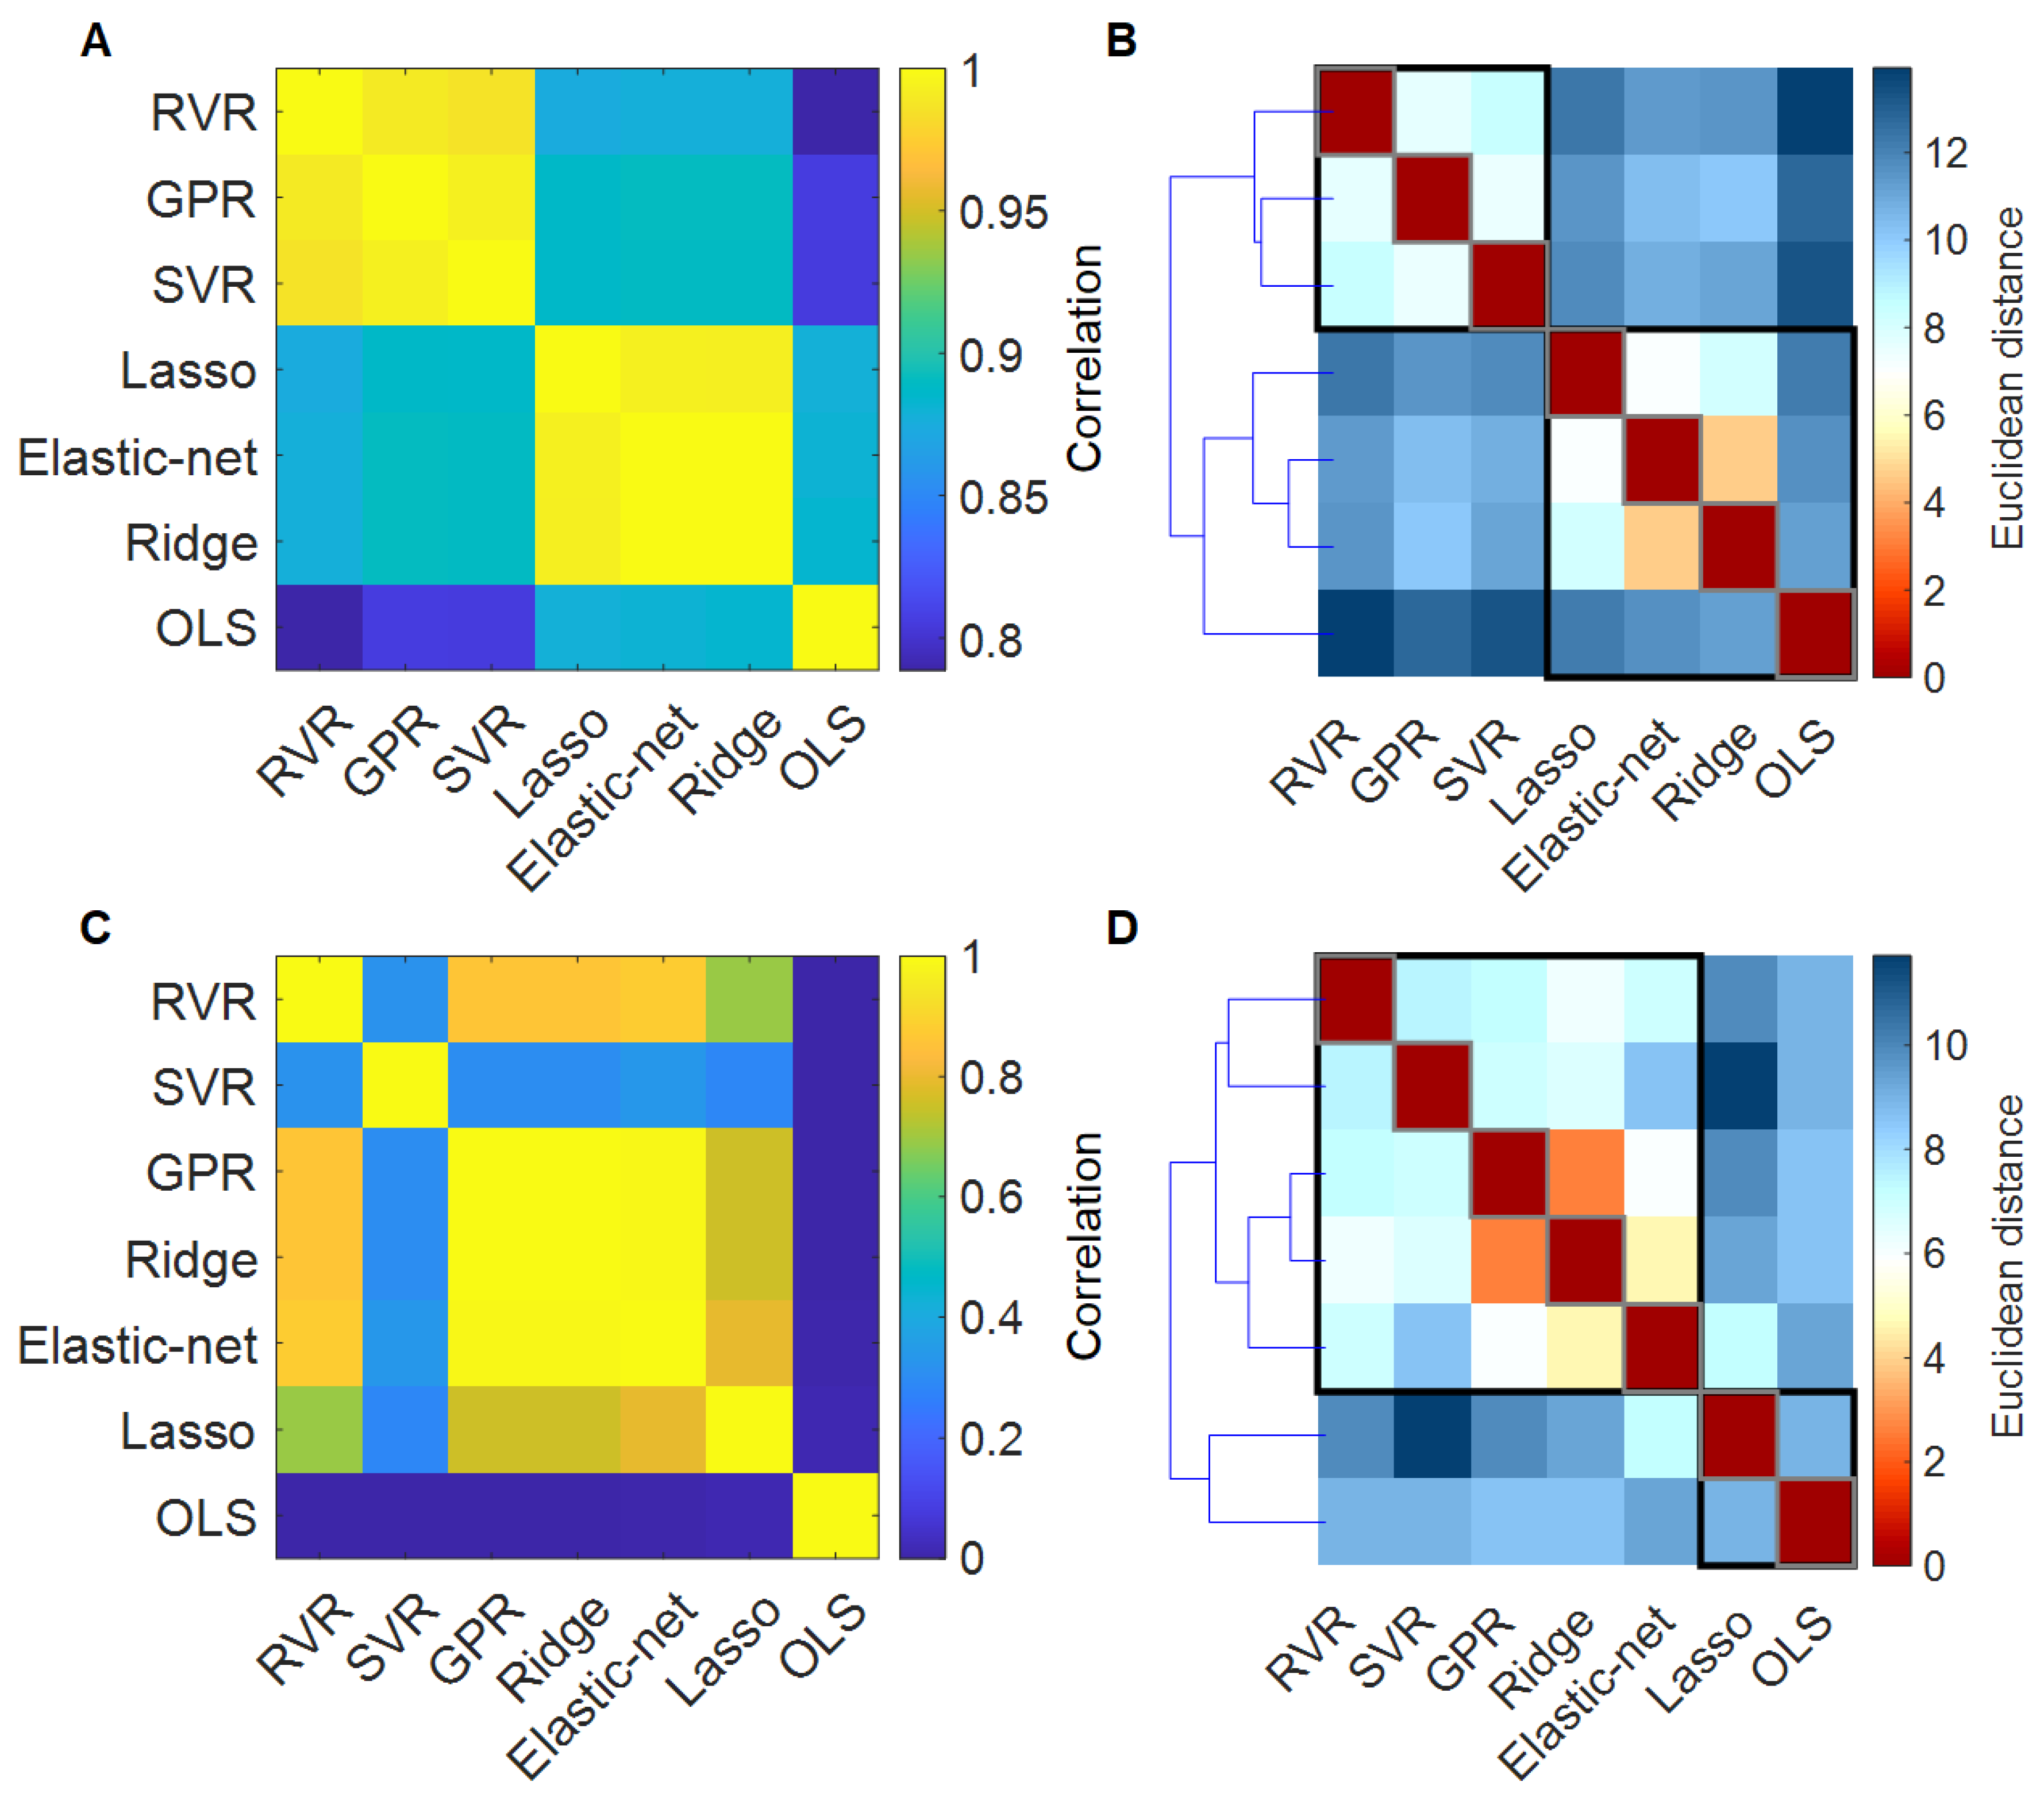
The correlation matrix of the predicted brain age across algorithms is shown in Figure 4A. Individual predicted brain ages showed high between-algorithm correlations (range = 0.78–0.99). Hierarchical clustering of the individual predicted brain ages showed that ridge regression and elastic-net regression together formed one cluster (showing high similarity among within-cluster algorithms, but relatively low similarity among algorithms outside their cluster), and SVR, RVR, and GPR formed another cluster; by contrast, OLS regression relatively showed a lower similarity with all the other algorithms (Figure 4B).
3.2.2. Brain Regional Regression Weights
The correlation matrix of the regression weights across algorithms is shown in Figure 4C. Between-algorithm correlations in regression weights ranged from 0 to 0.99 (Figure 4C). Hierarchical clustering of the absolute values of regression weights showed that GPR and ridge regression were most similar, whereas the weights of OLS regression were the least similar to those of all the other algorithms (Figure 4D).
3.3. Association between BrainPAD and Cognitive Measures
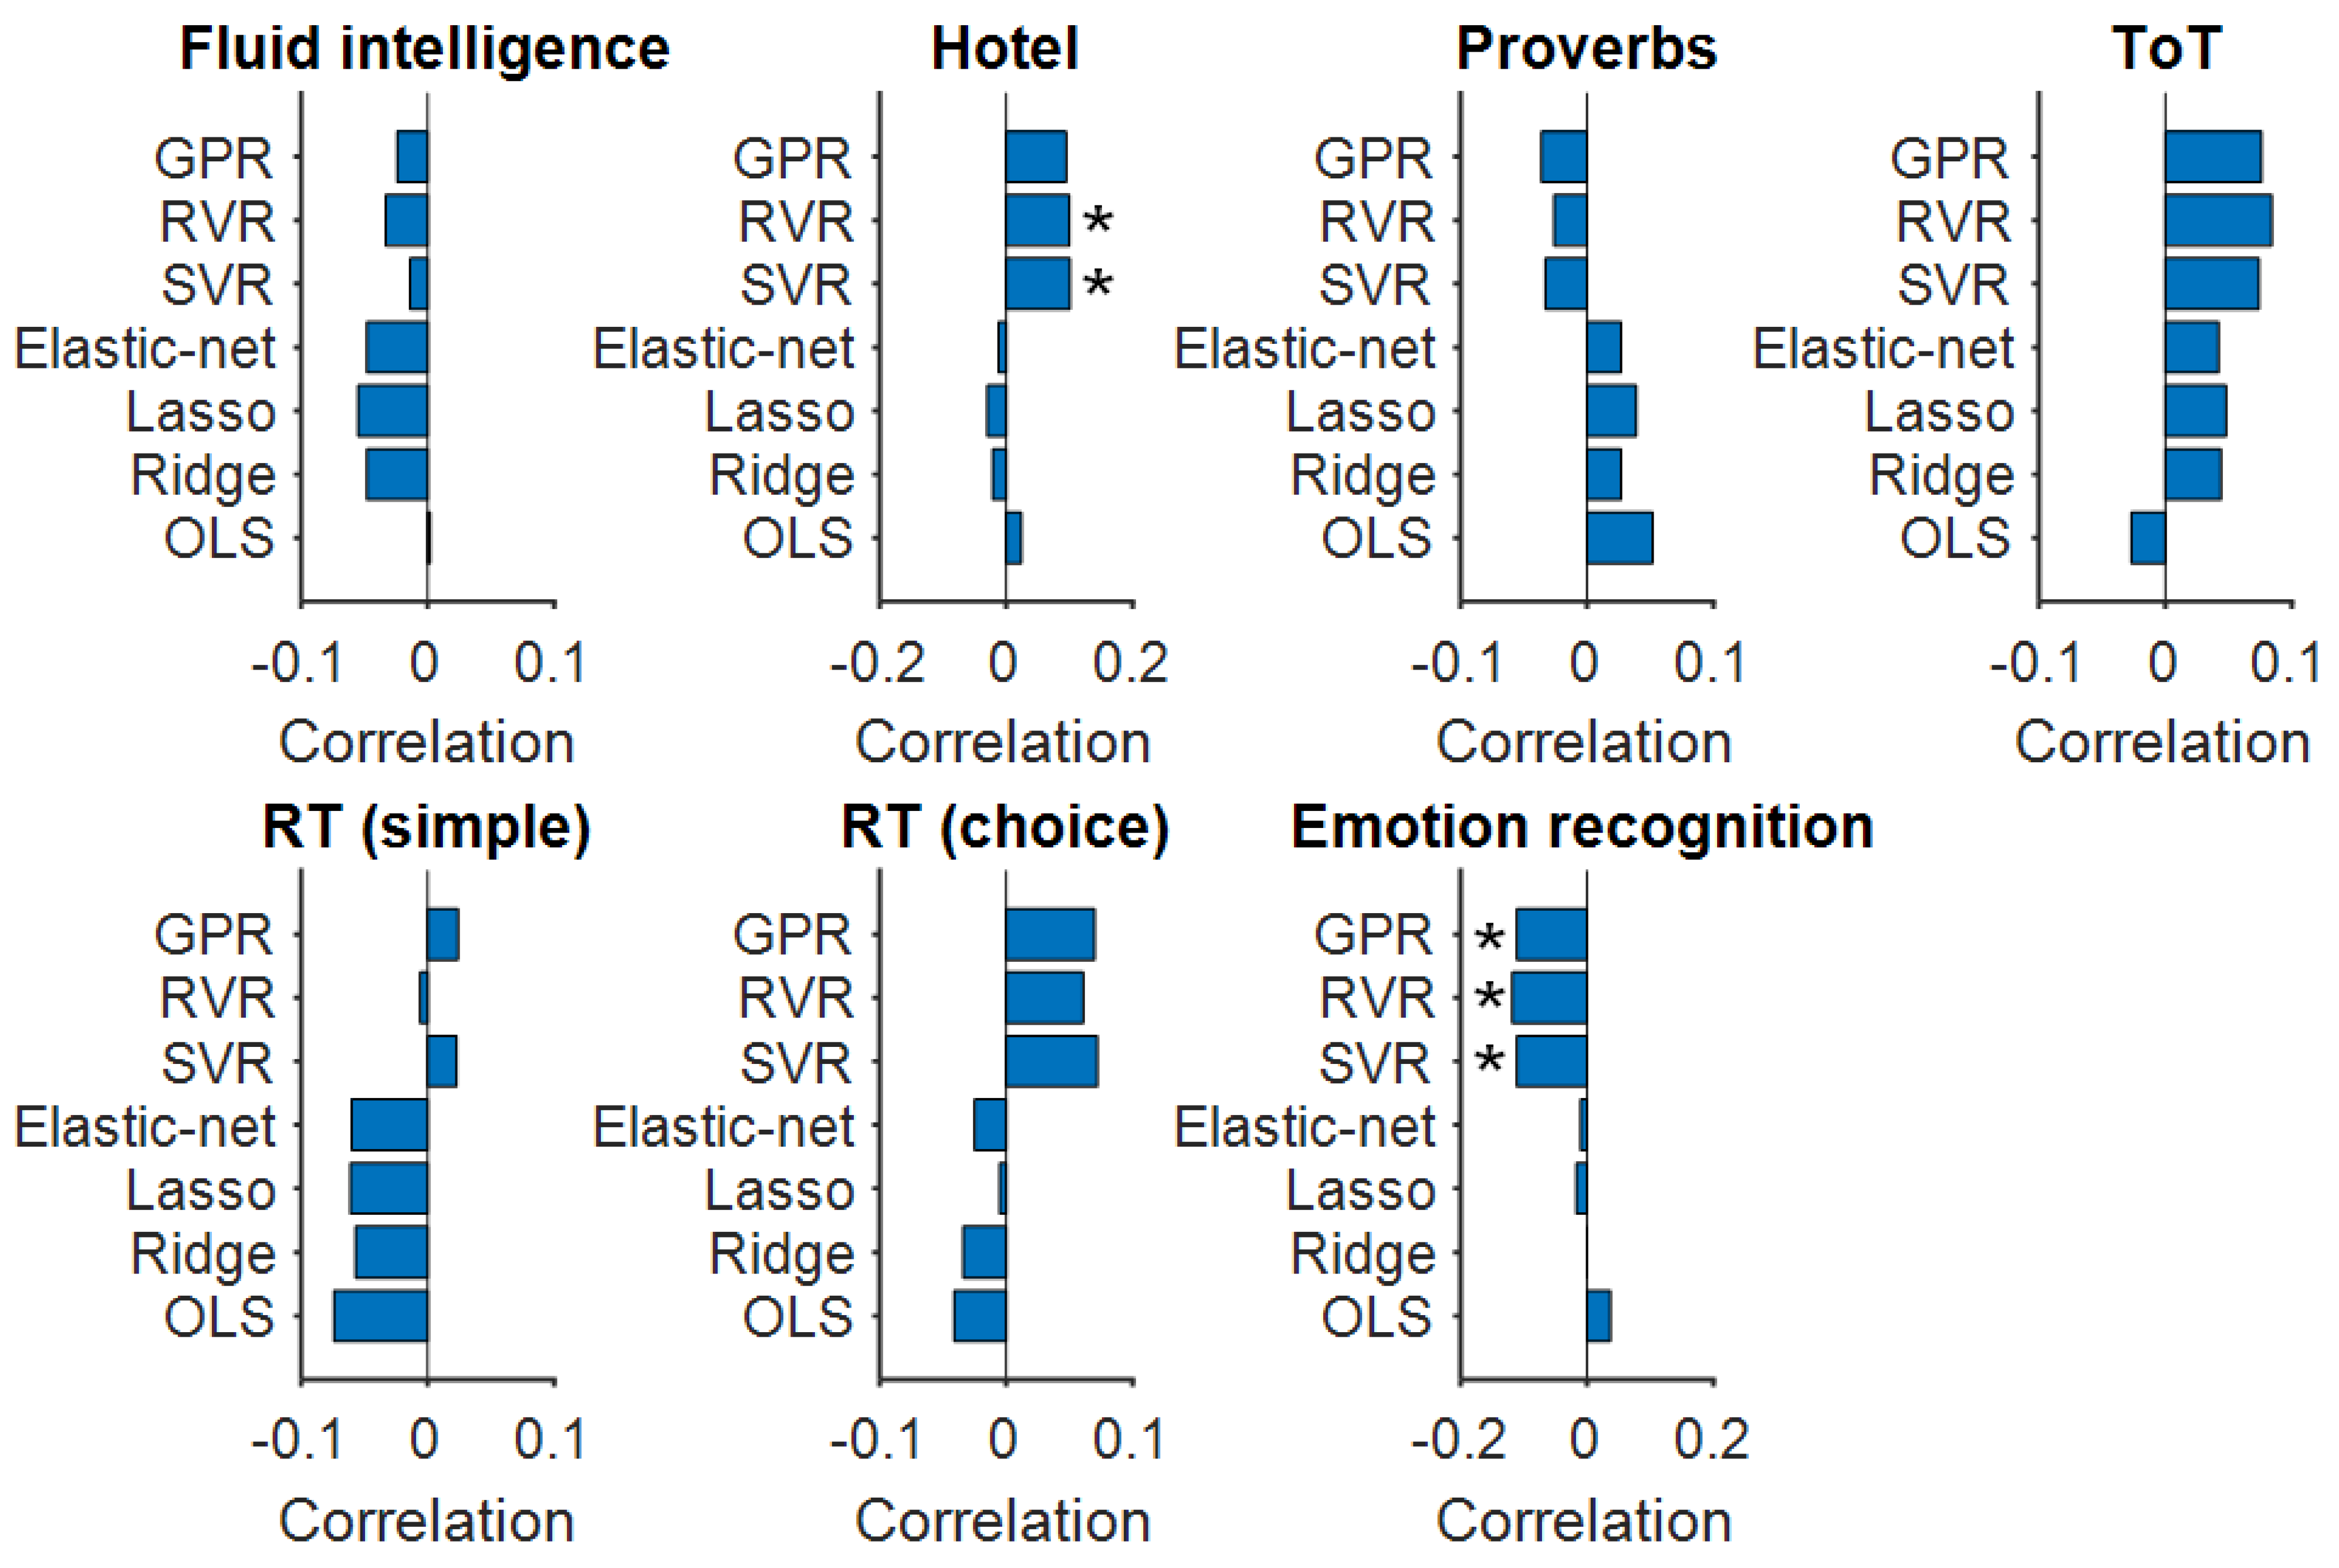
Individual variation in the brain-predicted age difference (brainPAD) was significantly associated with the hotel test (SVR: t = 2.48, p < 0.05, r = 0.10; RVR: t = 2.46, p < 0.05, r = 0.10) and emotion expression recognition (SVR: t = −2.70, p < 0.05, r = −0.11.10; RVR: t = −2.88, p < 0.05, r = −0.12; GPR: t = −2.71, p < 0.05, r = −0.11; Figure 5). BrainPAD was not associated with any of the other cognitive measures (p > 0.05; Table 2). Furthermore, our results revealed that there was a substantial variation in the association between brainPAD and cognitive measures due to the choice of algorithm. The associations between brainPAD and cognitive measures in the test set for each algorithm are provided in detail in Supplementary Table S5.
4. Discussion
Using a large community sample of cognitively healthy adults, we assessed variation in brain age predicted by seven commonly used algorithms, applied to the same structural and diffusion features. We examined the ability of estimated brainPAD (predicted brain age–chronological age) to capture cognitive phenotypes, and we investigated the contribution of different machine learning algorithms to the association between brainPAD and cognitive measures. We demonstrated that different machine learning algorithms introduce variations in predicted brain age when applied to multimodal brain features. We also found that the strength of the association between brainPAD and cognitive measures is influenced by the algorithm used for brain age prediction.
We applied seven commonly used algorithms to the same structural and diffusion features to predict brain age. With the exception of OLS regression (r = 0.86; MAE = 7.72), all other algorithms provided comparable performances (r = 0.91–0.92; MAE = 5.46–5.89), but they still resulted in variations in predicted brain age despite being applied to the same input data. OLS regression underperformed compared to other regression algorithms likely due to the collinearity of the brain imaging features, as suggested by the relative better performance of those linear algorithms that include the regularization terms in the models (e.g., ridge, Lasso, and elastic-net). These regularized algorithms penalize the coefficients with a tunable parameter, which regulates the strength of the penalty to avoid overfitting. Using penalty-based (regularization) shrinkage, they could make better predictive performance in brain age prediction by selecting relevant predictive features. Furthermore, the regularization (or penalty) term in the models helped to make them less vulnerable to the collinearity among the predictor variables [29].
We also found that the performance of GPR was similar to both SVR and RVR in terms of individual brain age prediction. GPR as a particular form of SVR uses kernels to define the covariance of a prior distribution over the target functions and uses training data to estimate a likelihood function [35]. We applied linear kernels for SVR and RVR. In contrast, GPR is a non-linear regression model that uses a Bayesian kernel that provides a general approach to assigning prior distributions to functions for non-parametric modeling. Despite the difference between these algorithms in the choice of kernel and loss function, our results showed that GPR, SVR, and RVR performed very similarly in brain age prediction on the basis of structural and diffusion measures. Future work could assess non-linear regression models such as SVR and RVR with non-linear kernels [34], as well as ensemble models such as adaptive boosting (AdaBoost) regression and extreme gradient boosting (XGBoost) [29].
There are relatively few studies predicting brain age with multimodal brain features. Several studies explored the value of multimodal imaging data for brain age prediction in healthy participants and in clinical populations, showing improved predictions of aging and disease markers. Rokicki et al. examined the performance of brain age prediction models using different combinations of cortical thickness, subcortical volume, cortical and subcortical T1/T2-weighted ratios, and cerebral blood flow based on arterial spin labeling in 750 healthy participants aged 18–86 years. They reported the highest prediction accuracy (r2 = 0.77; MAE = 6.4 years) in brain age prediction when integrating all modalities and feature sets [45]. Liem et al. explored the benefit of multimodal imaging data, namely cortical anatomy (cortical thickness, surface area, and subcortical volume) and whole-brain functional connectivity, in brain age prediction in 2354 healthy participants aged 19–82 years. They reported that multimodal imaging data improve the accuracy of brain age prediction (MAE = 4.29 years), and individual variation in brainPAD captures cognitive impairment [8]. Cole investigated whether brain age prediction can be improved by combining data from six different imaging modalities, namely T1-weighted MRI, T2-FLAIR, T2*, diffusion MRI, task functional MRI, and resting-state functional MRI, in 2205 healthy participants aged 45–80 years from UK Biobank [27]. The model with all six imaging modalities provided the highest prediction accuracy (r = 0.78; MAE = 3.55 years) with the strongest predictors being T1-weighted and diffusion MRI. Our previous studies showed variable prediction accuracies in brain-predicted age by conducting a comprehensive evaluation of 27 different machine learning algorithms based solely on brain morphological features derived from structural MRI scans [29]. We expanded our prior work by combining the structural and diffusion features as input data to the machine learning algorithms and examining the functional significance of brainPAD on specific cognitive measures that assess executive function, memory, motor function, and emotion processing.
We investigated whether the deviation of predicted brain age from actual age (brainPAD) explains individual variation in specific cognitive measures. We showed that higher brainPAD was significantly correlated with worse performance on executive function (hotel) and emotional expression recognition. The brain that appeared older than its true chronological age was related to poor cognitive performance, suggesting that cognitive factors can negatively impact brain aging and cognitive aging. Our results were in good agreement with experimental observations by Yin and colleagues, who found that older brain age was correlated with worse performance on cognitive measures such as executive function, emotional memory, word finding, and motor learning [42]. Moreover, Cole reported that an older-appearing brain was associated with poor cognitive performance on fluid intelligence and the trail-making task (duration to complete alphanumeric path trail 2 [13]) [27]. It is also important to note that these significant associations were captured when applying the SVR and RVR algorithms. Our findings indicate that the strength of the association between brainPAD and cognitive measures can be influenced by the choice of algorithm. This is important since the predictive power of brainPAD depends on how well the initial model performs.
We acknowledge several limitations that could be addressed in future studies. The focus of this study was on the evaluation of the different machine learning algorithms in relating the brainPAD scores to cognitive measures in cognitively healthy individuals, not on the examination of the functional significance of brainPAD on clinical variables in disease populations. Nevertheless, a normative model of brain age presented in this work can be easily applied to clinical populations to test whether the brainPAD scores can serve as a biomarker of age-related brain disease [1,8,14,42,46,47,48,49]. In this study, we have used regional measures of the 68 cortical regions of interest (ROIs) from the Desikan–Killiany parcellation and the 48 white matter ROIs from the JHU parcellation, which is a widely used approach in large neuroimaging studies [50,51]. Future research should replicate the current findings in independent neuroimaging datasets, across different atlases, and at different spatial resolutions [52]. Finally, we have shown that the choice of algorithm influences the strength of the association between brainPAD and cognitive measures, covering emotional processing, executive function, memory, and motor function. However, several studies have explored the ability of brainPAD to capture other phenotypes such as cognitive, biomedical, and lifestyle measures [27,42], which could be investigated in future studies.
5. Conclusions
In this paper, we conducted a comparative evaluation of the most commonly used machine learning algorithms, including OLS, ridge, Lasso, elastic-net, SVR, RVR, and GPR, for brain age prediction on the basis of multimodal brain features. Further, we investigated whether the choice of algorithm leads to variation in the association between brainPAD (predicted brain age–chronological age) and cognitive measures. Through applying different machine learning algorithms to the same multimodal brain features in the Cam-CAN dataset, the models tested achieved mean absolute errors of 5.46–7.72 years and Pearson’s correlation coefficients of 0.86–0.92 between predicted brain age and chronological age. Our results indicate that the choice of algorithm yields variations in predicted brain age. We also examined the predictive value of estimated brainPAD scores based on their performance on the association between brainPAD and cognitive phenotypes. We identified that the strength of the association between brainPAD and cognitive measures varies considerably by regression algorithms, resulting in a substantial difference in the association between brainPAD and cognitive measures. These findings suggest that the choice of algorithm could be an important source of variability that confounds the relationship between brain-predicted age difference and cognition.
Supplementary Materials
The following supporting information can be downloaded at: https://www.mdpi.com/article/10.3390/math11051229/s1, Figure S1: Spatial map of regression weights for cortical surface area for brain-age prediction in Cam-CAN individuals in each of the seven algorithms, Figure S2: Spatial map of regression weights for cortical thickness for brain-age prediction in Cam-CAN individuals in each of the seven algorithms, Figure S3: Spatial map of regression weights for subcortical volume for brain-age prediction in Cam-CAN individuals in each of the seven algorithms, Figure S4: A representative map of regression weights for fractional anisotropy for brain-age prediction in Cam-CAN individuals in each of the seven algorithms, Figure S5: A representative map of regression weights for mean diffusivity for brain-age prediction in Cam-CAN individuals in each of the seven algorithms, Figure S6: A representative map of regression weights for axial diffusivity for brain-age prediction in Cam-CAN individuals in each of the seven algorithms, Figure S7: A representative map of regression weights for radial diffusivity for brain-age prediction in Cam-CAN individuals in each of the seven algorithms, Table S1: Definition of the neuroimaging measures, Table S2: Sample and demographic information for the Cam-CAN cohort used for brain age prediction, Table S3: Cam-CAN cognitive measures tested (7 variables), Table S4: Comparison of computational speed of the algorithm for model training, Table S5: Association of brainPAD with cognitive measures for each algorithm in the hold-out test set (n = 101). References [22,23,24,53,54,55,56] are cited in the Supplementary Materials.
Funding
This work was supported by the National Research Foundation of Korea (NRF) grant funded by the Korea government (MSIT) (No. 2021R1C1C1009436), the Korea Health Technology R&D Project through the Korea Health Industry Development Institute (KHIDI), funded by the Ministry of Health and Welfare, Republic of Korea (grant number: HI22C0108), and the Institute for Information and Communications Technology Planning & Evaluation (IITP) grant funded by the Korea government (MSIT) (No. RS-2022-00155911, Artificial Intelligence Convergence Innovation Human Resources Development (Kyung Hee University)). The funding agencies had no role in the study design; the collection, analysis, or interpretation of data; the writing of the report; or the decision to submit the article for publication.
Institutional Review Board Statement
Not applicable.
Informed Consent Statement
Not applicable.
Data Availability Statement
All data used in this study are publicly available and can be accessed directly from the Cambridge Centre for Ageing and Neuroscience (https://www.cam-can.org, (accessed on 1 September 2020)).
Conflicts of Interest
The authors declare no conflict of interest.
References
- Cole, J.H.; Ritchie, S.J.; Bastin, M.E.; Valdes Hernandez, M.C.; Munoz Maniega, S.; Royle, N.; Corley, J.; Pattie, A.; Harris, S.E.; Zhang, Q.; et al. Brain age predicts mortality. Mol. Psychiatry 2018, 23, 1385–1392. [Google Scholar] [CrossRef] [Green Version]
- Belsky, D.W.; Caspi, A.; Houts, R.; Cohen, H.J.; Corcoran, D.L.; Danese, A.; Harrington, H.; Israel, S.; Levine, M.E.; Schaefer, J.D.; et al. Quantification of biological aging in young adults. Proc. Natl. Acad. Sci. USA 2015, 112, E4104–E4110. [Google Scholar] [CrossRef] [Green Version]
- Levine, M.E.; Lu, A.T.; Quach, A.; Chen, B.H.; Assimes, T.L.; Bandinelli, S.; Hou, L.; Baccarelli, A.A.; Stewart, J.D.; Li, Y.; et al. An epigenetic biomarker of aging for lifespan and healthspan. Aging 2018, 10, 573–591. [Google Scholar] [CrossRef] [Green Version]
- Franke, K.; Gaser, C. Ten Years of BrainAGE as a Neuroimaging Biomarker of Brain Aging: What Insights Have We Gained? Front. Neurol. 2019, 10, 789. [Google Scholar] [CrossRef] [Green Version]
- Franke, K.; Ziegler, G.; Kloppel, S.; Gaser, C.; Alzheimer’s Disease Neuroimaging Initiative. Estimating the age of healthy subjects from T1-weighted MRI scans using kernel methods: Exploring the influence of various parameters. Neuroimage 2010, 50, 883–892. [Google Scholar] [CrossRef] [PubMed]
- Schnack, H.G.; van Haren, N.E.; Nieuwenhuis, M.; Hulshoff Pol, H.E.; Cahn, W.; Kahn, R.S. Accelerated Brain Aging in Schizophrenia: A Longitudinal Pattern Recognition Study. Am. J. Psychiatry 2016, 173, 607–616. [Google Scholar] [CrossRef] [PubMed] [Green Version]
- Cole, J.H.; Franke, K. Predicting Age Using Neuroimaging: Innovative Brain Ageing Biomarkers. Trends Neurosci. 2017, 40, 681–690. [Google Scholar] [CrossRef] [Green Version]
- Liem, F.; Varoquaux, G.; Kynast, J.; Beyer, F.; Kharabian Masouleh, S.; Huntenburg, J.M.; Lampe, L.; Rahim, M.; Abraham, A.; Craddock, R.C.; et al. Predicting brain-age from multimodal imaging data captures cognitive impairment. Neuroimage 2017, 148, 179–188. [Google Scholar] [CrossRef] [PubMed]
- Smith, S.M.; Elliott, L.T.; Alfaro-Almagro, F.; McCarthy, P.; Nichols, T.E.; Douaud, G.; Miller, K.L. Brain aging comprises many modes of structural and functional change with distinct genetic and biophysical associations. Elife 2020, 9, e52677. [Google Scholar] [CrossRef] [Green Version]
- Franke, K.; Ristow, M.; Gaser, C.; Alzheimer’s Disease Neuroimaging Initiative. Gender-specific impact of personal health parameters on individual brain aging in cognitively unimpaired elderly subjects. Front Aging Neurosci 2014, 6, 94. [Google Scholar] [CrossRef] [Green Version]
- Steffener, J.; Habeck, C.; O’Shea, D.; Razlighi, Q.; Bherer, L.; Stern, Y. Differences between chronological and brain age are related to education and self-reported physical activity. Neurobiol. Aging 2016, 40, 138–144. [Google Scholar] [CrossRef] [PubMed] [Green Version]
- Franke, K.; Gaser, C. Longitudinal Changes in Individual BrainAGE in Healthy Aging, Mild Cognitive Impairment, and Alzheimer’s disease. GeroPsych 2012, 25, 235–245. [Google Scholar] [CrossRef]
- Cole, J.H.; Leech, R.; Sharp, D.J.; Alzheimer’s Disease Neuroimaging Initiative. Prediction of brain age suggests accelerated atrophy after traumatic brain injury. Ann. Neurol. 2015, 77, 571–581. [Google Scholar] [CrossRef] [PubMed] [Green Version]
- Kaufmann, T.; van der Meer, D.; Doan, N.T.; Schwarz, E.; Lund, M.J.; Agartz, I.; Alnaes, D.; Barch, D.M.; Baur-Streubel, R.; Bertolino, A.; et al. Common brain disorders are associated with heritable patterns of apparent aging of the brain. Nat. Neurosci. 2019, 22, 1617–1623. [Google Scholar] [CrossRef]
- Lee, W.H.; Antoniades, M.; Schnack, H.G.; Kahn, R.S.; Frangou, S. Brain age prediction in schizophrenia: Does the choice of machine learning algorithm matter? Psychiatry Res. Neuroimaging 2021, 310, 111270. [Google Scholar] [CrossRef]
- Richard, G.; Kolskar, K.; Sanders, A.M.; Kaufmann, T.; Petersen, A.; Doan, N.T.; Sanchez, J.M.; Alnaes, D.; Ulrichsen, K.M.; Dorum, E.S.; et al. Assessing distinct patterns of cognitive aging using tissue-specific brain age prediction based on diffusion tensor imaging and brain morphometry. Peerj 2018, 6, e5908. [Google Scholar] [CrossRef] [Green Version]
- Wang, J.; Knol, M.J.; Tiulpin, A.; Dubost, F.; de Bruijne, M.; Vernooij, M.W.; Adams, H.H.H.; Ikram, M.A.; Niessen, W.J.; Roshchupkin, G.V. Gray Matter Age Prediction as a Biomarker for Risk of Dementia. Proc. Natl. Acad. Sci. USA 2019, 116, 21213–21218. [Google Scholar] [CrossRef] [Green Version]
- Baecker, L.; Dafflon, J.; da Costa, P.F.; Garcia-Dias, R.; Vieira, S.; Scarpazza, C.; Calhoun, V.D.; Sato, J.R.; Mechelli, A.; Pinaya, W.H.L. Brain age prediction: A comparison between machine learning models using region- and voxel-based morphometric data. Hum. Brain Mapp. 2021, 42, 2332–2346. [Google Scholar] [CrossRef]
- Baecker, L.; Garcia-Dias, R.; Vieira, S.; Scarpazza, C.; Mechelli, A. Machine learning for brain age prediction: Introduction to methods and clinical applications. EBioMedicine 2021, 72, 103600. [Google Scholar] [CrossRef]
- Shafto, M.A.; Tyler, L.K.; Dixon, M.; Taylor, J.R.; Rowe, J.B.; Cusack, R.; Calder, A.J.; Marslen-Wilson, W.D.; Duncan, J.; Dalgleish, T.; et al. The Cambridge Centre for Ageing and Neuroscience (Cam-CAN) study protocol: A cross-sectional, lifespan, multidisciplinary examination of healthy cognitive ageing. BMC Neurol. 2014, 14, 204. [Google Scholar] [CrossRef] [Green Version]
- Taylor, J.R.; Williams, N.; Cusack, R.; Auer, T.; Shafto, M.A.; Dixon, M.; Tyler, L.K.; Cam, C.; Henson, R.N. The Cambridge Centre for Ageing and Neuroscience (Cam-CAN) data repository: Structural and functional MRI, MEG, and cognitive data from a cross-sectional adult lifespan sample. Neuroimage 2017, 144 Pt B, 262–269. [Google Scholar] [CrossRef]
- Fischl, B.; Salat, D.H.; van der Kouwe, A.J.; Makris, N.; Segonne, F.; Quinn, B.T.; Dale, A.M. Sequence-independent segmentation of magnetic resonance images. Neuroimage 2004, 23 (Suppl. S1), S69–S84. [Google Scholar] [CrossRef] [PubMed] [Green Version]
- Desikan, R.S.; Segonne, F.; Fischl, B.; Quinn, B.T.; Dickerson, B.C.; Blacker, D.; Buckner, R.L.; Dale, A.M.; Maguire, R.P.; Hyman, B.T.; et al. An automated labeling system for subdividing the human cerebral cortex on MRI scans into gyral based regions of interest. Neuroimage 2006, 31, 968–980. [Google Scholar] [CrossRef] [PubMed]
- Fischl, B.; Salat, D.H.; Busa, E.; Albert, M.; Dieterich, M.; Haselgrove, C.; van der Kouwe, A.; Killiany, R.; Kennedy, D.; Klaveness, S.; et al. Whole brain segmentation: Automated labeling of neuroanatomical structures in the human brain. Neuron 2002, 33, 341–355. [Google Scholar] [CrossRef] [Green Version]
- Cole, J.H.; Franke, K.; Cherbuin, N. Quantification of the biological age of the brain using neuroimaging. In Healthy Ageing and Longevity. Biomarkers of Human Aging; Springer: Berlin/Heidelberg, Germany, 2019; pp. 293–328. [Google Scholar]
- Valizadeh, S.A.; Hanggi, J.; Merillat, S.; Jancke, L. Age prediction on the basis of brain anatomical measures. Hum. Brain Mapp. 2017, 38, 997–1008. [Google Scholar] [CrossRef] [PubMed]
- Cole, J.H. Multimodality neuroimaging brain-age in UK biobank: Relationship to biomedical, lifestyle, and cognitive factors. Neurobiol. Aging 2020, 92, 34–42. [Google Scholar] [CrossRef]
- Ball, G.; Kelly, C.E.; Beare, R.; Seal, M.L. Individual variation underlying brain age estimates in typical development. Neuroimage 2021, 235, 118036. [Google Scholar] [CrossRef]
- Han, J.; Kim, S.Y.; Lee, J.; Lee, W.H. Brain Age Prediction: A Comparison between Machine Learning Models Using Brain Morphometric Data. Sensors 2022, 22, 8077. [Google Scholar] [CrossRef]
- Hoerl, A.E.; Kennard, R.W. Ridge Regression—Biased Estimation for Nonorthogonal Problems. Technometrics 1970, 12, 55–67. [Google Scholar] [CrossRef]
- Tibshirani, R. Regression shrinkage and selection via the Lasso. J. R. Stat. Soc. Ser. B Met. 1996, 58, 267–288. [Google Scholar] [CrossRef]
- Zou, H.; Hastie, T. Regularization and variable selection via the elastic net (vol B 67, pg 301, 2005). J. R. Stat. Soc. B 2005, 67, 301–320. [Google Scholar] [CrossRef]
- Smola, A.J.; Scholkopf, B. A tutorial on support vector regression. Stat. Comput. 2004, 14, 199–222. [Google Scholar] [CrossRef] [Green Version]
- Tipping, M.E. Sparse Bayesian learning and the relevance vector machine. J. Mach. Learn. Res. 2001, 1, 211–244. [Google Scholar]
- Rasmussen, C.E.; Williams, C.K.I. Gaussian Processes for Machine Learning; MIT Press: Cambridge, MA, USA, 2006; p. xviii. 248p. [Google Scholar]
- Pedregosa, F.; Varoquaux, G.; Gramfort, A.; Michel, V.; Thirion, B.; Grisel, O.; Blondel, M.; Prettenhofer, P.; Weiss, R.; Dubourg, V.; et al. Scikit-learn: Machine Learning in Python. J. Mach. Learn. Res. 2011, 12, 2825–2830. [Google Scholar]
- Chang, C.C.; Lin, C.J. LIBSVM: A Library for Support Vector Machines. ACM Trans. Intell. Syst. Technol. 2011, 2, 1–27. [Google Scholar] [CrossRef]
- Schrouff, J.; Rosa, M.J.; Rondina, J.M.; Marquand, A.F.; Chu, C.; Ashburner, J.; Phillips, C.; Richiardi, J.; Mourao-Miranda, J. PRoNTo: Pattern Recognition for Neuroimaging Toolbox. Neuroinformatics 2013, 11, 319–337. [Google Scholar] [CrossRef] [Green Version]
- Haufe, S.; Meinecke, F.; Gorgen, K.; Dahne, S.; Haynes, J.D.; Blankertz, B.; Biessmann, F. On the interpretation of weight vectors of linear models in multivariate neuroimaging. Neuroimage 2014, 87, 96–110. [Google Scholar] [CrossRef] [Green Version]
- Liang, H.; Zhang, F.; Niu, X. Investigating systematic bias in brain age estimation with application to post-traumatic stress disorders. Hum. Brain Mapp. 2019, 40, 3143–3152. [Google Scholar] [CrossRef] [Green Version]
- Le, T.T.; Kuplicki, R.T.; McKinney, B.A.; Yeh, H.W.; Thompson, W.K.; Paulus, M.P.; Tulsa, I. A Nonlinear Simulation Framework Supports Adjusting for Age When Analyzing BrainAGE. Front. Aging Neurosc.i 2018, 10, 317. [Google Scholar] [CrossRef] [Green Version]
- Yin, C.; Imms, P.; Cheng, M.; Amgalan, A.; Chowdhury, N.F.; Massett, R.J.; Chaudhari, N.N.; Chen, X.; Thompson, P.M.; Bogdan, P.; et al. Anatomically interpretable deep learning of brain age captures domain-specific cognitive impairment. Proc. Natl. Acad. Sci. USA 2023, 120, e2214634120. [Google Scholar] [CrossRef] [PubMed]
- Shafto, M.A.; Henson, R.N.; Matthews, F.E.; Taylor, J.R.; Emery, T.; Erzinclioglu, S.; Hanley, C.; Rowe, J.B.; Cusack, R.; Calder, A.J.; et al. Cognitive Diversity in a Healthy Aging Cohort: Cross-Domain Cognition in the Cam-CAN Project. J. Aging Health 2020, 32, 1029–1041. [Google Scholar] [CrossRef] [PubMed] [Green Version]
- Borgeest, G.S.; Henson, R.N.; Shafto, M.; Samu, D.; Kievit, R.A.; Cam-CAN. Greater lifestyle engagement is associated with better age-adjusted cognitive abilities. PLoS ONE 2020, 15, e0230077. [Google Scholar] [CrossRef] [PubMed]
- Rokicki, J.; Wolfers, T.; Nordhoy, W.; Tesli, N.; Quintana, D.S.; Alnaes, D.; Richard, G.; de Lange, A.G.; Lund, M.J.; Norbom, L.; et al. Multimodal imaging improves brain age prediction and reveals distinct abnormalities in patients with psychiatric and neurological disorders. Hum. Brain Mapp. 2021, 42, 1714–1726. [Google Scholar] [CrossRef] [PubMed]
- Wrigglesworth, J.; Yaacob, N.; Ward, P.; Woods, R.L.; McNeil, J.; Storey, E.; Egan, G.; Murray, A.; Shah, R.C.; Jamadar, S.D.; et al. Brain-predicted age difference is associated with cognitive processing in later-life. Neurobiol. Aging 2022, 109, 195–203. [Google Scholar] [CrossRef]
- Anaturk, M.; Kaufmann, T.; Cole, J.H.; Suri, S.; Griffanti, L.; Zsoldos, E.; Filippini, N.; Singh-Manoux, A.; Kivimaki, M.; Westlye, L.T.; et al. Prediction of brain age and cognitive age: Quantifying brain and cognitive maintenance in aging. Hum. Brain Mapp. 2021, 42, 1626–1640. [Google Scholar] [CrossRef]
- Gaser, C.; Franke, K.; Kloppel, S.; Koutsouleris, N.; Sauer, H.; Alzheimer’s Disease Neuroimaging Initiative. BrainAGE in Mild Cognitive Impaired Patients: Predicting the Conversion to Alzheimer’s Disease. PLoS ONE 2013, 8, e67346. [Google Scholar] [CrossRef] [Green Version]
- Bashyam, V.M.; Erus, G.; Doshi, J.; Habes, M.; Nasralah, I.; Truelove-Hill, M.; Srinivasan, D.; Mamourian, L.; Pomponio, R.; Fan, Y.; et al. MRI signatures of brain age and disease over the lifespan based on a deep brain network and 14,468 individuals worldwide. Brain 2020, 143, 2312–2324. [Google Scholar] [CrossRef]
- Barth, C.; Kelly, S.; Nerland, S.; Jahanshad, N.; Alloza, C.; Ambrogi, S.; Andreassen, O.A.; Andreou, D.; Arango, C.; Baeza, I.; et al. In vivo white matter microstructure in adolescents with early-onset psychosis: A multi-site mega-analysis. Mol. Psychiatry 2022, 28, 1159–1169. [Google Scholar] [CrossRef]
- Constantinides, C.; Han, L.K.M.; Alloza, C.; Antonucci, L.A.; Arango, C.; Ayesa-Arriola, R.; Banaj, N.; Bertolino, A.; Borgwardt, S.; Bruggemann, J.; et al. Brain ageing in schizophrenia: Evidence from 26 international cohorts via the ENIGMA Schizophrenia consortium. Mol. Psychiatry 2022, 28, 1201–1209. [Google Scholar] [CrossRef] [PubMed]
- Schaefer, A.; Kong, R.; Gordon, E.M.; Laumann, T.O.; Zuo, X.N.; Holmes, A.J.; Eickhoff, S.B.; Yeo, B.T.T. Local-Global Parcellation of the Human Cerebral Cortex from Intrinsic Functional Connectivity MRI. Cereb. Cortex 2018, 28, 3095–3114. [Google Scholar] [CrossRef] [Green Version]
- Segonne, F.; Dale, A.M.; Busa, E.; Glessner, M.; Salat, D.; Hahn, H.K.; Fischl, B. A hybrid approach to the skull stripping problem in MRI. Neuroimage 2004, 22, 1060–1075. [Google Scholar] [CrossRef] [PubMed]
- Sled, J.G.; Zijdenbos, A.P.; Evans, A.C. A nonparametric method for automatic correction of intensity nonuniformity in MRI data. IEEE Trans. Med. Imaging 1998, 17, 87–97. [Google Scholar] [CrossRef] [PubMed] [Green Version]
- Fischl, B.; Liu, A.; Dale, A.M. Automated manifold surgery: Constructing geometrically accurate and topologically correct models of the human cerebral cortex. IEEE Trans. Med. Imaging 2001, 20, 70–80. [Google Scholar] [CrossRef] [PubMed] [Green Version]
- Klapwijk, E.T.; van de Kamp, F.; van der Meulen, M.; Peters, S.; Wierenga, L.M. Qoala-T: A supervised-learning tool for quality control of FreeSurfer segmented MRI data. Neuroimage 2019, 189, 116–129. [Google Scholar] [CrossRef]
Figure 1.
Scatter plots of chronological age (x−axis) versus predicted age (y−axis) in the training data (n = 500) of the Cam-CAN sample for each of the seven algorithms. Color spectrum (blue−white−red) denotes the error of each individual’s predicted age from the chronological age (brainPAD). OLS = ordinary least squares regression; Lasso = least absolute shrinkage and selection operator regression; SVR = support vector regression; RVR = relevance vector regression; GPR = Gaussian process regression.

Figure 2.
Scatter plots of chronological age (x−axis) versus predicted age (y−axis) in the hold-out test data (n = 101) of the Cam-CAN sample for each of the seven algorithms. Color spectrum (blue−white−red) denotes the error of each individual’s predicted age from the chronological age (brainPAD). OLS = ordinary least squares regression; Lasso = least absolute shrinkage and selection operator regression; SVR = support vector regression; RVR = relevance vector regression; GPR = Gaussian process regression.

Figure 3.
Relative importance of structural and diffusion features in predicting brain age for ridge algorithm. (A) Spatial maps of the regression weights in each cortical region for surface area and cortical thickness as well as subcortical and intracranial volume in the prediction of brain age. (B) Visualized are the weights in each white matter region for fractional anisotropy and mean, axial, and radial diffusivity in the prediction of brain age. The weights for all the other algorithms are provided in Supplementary Figures S1−S7.

Figure 4.
Similarity in brain-predicted age and brain regional regression weights across seven algorithms. Brain-predicted age: (A) Similarity matrix representing between-algorithm correlations of individual brain-predicted age. (B) Distance matrix and dendrogram resulting from hierarchical clustering of the individual brain-predicted age of the seven algorithms. Brain regional regression weights: (C) Similarity matrix representing between-algorithm correlations of the absolute regression weights of the structural and diffusion features. (D) Distance matrix and dendrogram resulting from hierarchical clustering of brain regional regression weights of the seven algorithms. OLS = ordinary least squares regression; Lasso = least absolute shrinkage and selection operator regression; SVR = support vector regression; RVR = relevance vector regression; GPR = Gaussian process regression.

Figure 5.
Associations between brain-predicted age difference (brainPAD) from each algorithm and individual variation in cognitive measures. Individual variation in brainPAD was significantly associated with the hotel test (SVR: t = 2.48, p < 0.05, r = 0.10; RVR: t = 2.46, p < 0.05, r = 0.10) and the Ekman’s emotion expression recognition (SVR: t = −2.70, p < 0.05, r = −0.11.10; RVR: t = −2.88, p < 0.05, r = −0.12; GPR: t = −2.71, p < 0.05, r = −0.11). Asterisks indicate statistically significant associations between brainPAD and cognitive measures, controlling for the false discovery rate (FDR) at 5%. Proverbs = proverb comprehension; ToT = tip of the tongue; RT = response time; OLS = ordinary least squares regression; Lasso = least absolute shrinkage and selection operator regression; SVR = support vector regression; RVR = relevance vector regression; GPR = Gaussian process regression.


Table 1.
Algorithm performance based on the structural and diffusion features from the Cam-CAN individuals entered in the model for model performance in the training data (n = 500) and prediction performance in the hold-out test data (n = 101).
Table 1.
Algorithm performance based on the structural and diffusion features from the Cam-CAN individuals entered in the model for model performance in the training data (n = 500) and prediction performance in the hold-out test data (n = 101).
| Algorithm | Model Performance | Prediction Performance | ||
|---|---|---|---|---|
| r | MAE | r | MAE | |
| OLS | 0.78 | 9.69 | 0.86 | 7.72 |
| Ridge | 0.92 | 5.65 | 0.92 | 5.52 |
| Lasso | 0.92 | 5.73 | 0.91 | 5.48 |
| Elastic-net | 0.92 | 5.68 | 0.92 | 5.46 |
| SVR | 0.92 | 5.82 | 0.91 | 5.89 |
| RVR | 0.91 | 5.93 | 0.91 | 5.63 |
| GPR | 0.92 | 5.66 | 0.92 | 5.52 |
OLS = ordinary least squares regression; Lasso = least absolute shrinkage and selection operator regression; SVR = support vector regression; RVR = relevance vector regression; GPR = Gaussian process regression.
Table 2.
Association of brainPAD with cognitive measures for each algorithm.
| Algorithm | Fluid Intelligence | Hotel | Proverbs | ToT | RT Simple | RT Choice | Emotion Recognition | |||||||
|---|---|---|---|---|---|---|---|---|---|---|---|---|---|---|
| r | p | r | p | r | p | r | p | r | p | r | p | r | p | |
| OLS | 0.002 | 0.965 | 0.024 | 0.651 | 0.052 | 0.581 | −0.027 | 0.651 | −0.074 | 0.566 | −0.041 | 0.581 | 0.037 | 0.374 |
| Ridge | −0.048 | 0.687 | −0.021 | 0.709 | 0.027 | 0.709 | 0.044 | 0.687 | −0.057 | 0.687 | −0.034 | 0.709 | 0.000 | 0.996 |
| Lasso | −0.055 | 0.583 | −0.030 | 0.654 | 0.039 | 0.600 | 0.048 | 0.583 | −0.061 | 0.583 | −0.005 | 0.904 | −0.017 | 0.688 |
| Elastic-net | −0.048 | 0.738 | −0.012 | 0.894 | 0.027 | 0.774 | 0.042 | 0.738 | −0.060 | 0.738 | −0.025 | 0.774 | −0.010 | 0.809 |
| SVR | −0.014 | 0.727 | 0.101 | 0.047 | −0.033 | 0.599 | 0.074 | 0.157 | 0.023 | 0.691 | 0.072 | 0.157 | −0.111 | 0.007 |
| RVR | −0.033 | 0.581 | 0.100 | 0.049 | −0.026 | 0.622 | 0.084 | 0.103 | −0.006 | 0.893 | 0.061 | 0.273 | −0.118 | 0.004 |
| GPR | −0.024 | 0.580 | 0.095 | 0.070 | −0.036 | 0.545 | 0.076 | 0.156 | 0.024 | 0.580 | 0.070 | 0.178 | −0.111 | 0.007 |
Bold font denotes statistically significant associations between brainPAD and cognitive measures, controlling for the false discovery rate (FDR) at 5%. Proverbs = proverb comprehension; ToT = tip of the tongue; RT = response time; OLS = ordinary least squares regression; Lasso = least absolute shrinkage and selection operator regression; SVR = support vector regression; RVR = relevance vector regression; GPR = Gaussian process regression.
Disclaimer/Publisher’s Note: The statements, opinions and data contained in all publications are solely those of the individual author(s) and contributor(s) and not of MDPI and/or the editor(s). MDPI and/or the editor(s) disclaim responsibility for any injury to people or property resulting from any ideas, methods, instructions or products referred to in the content. |
© 2023 by the author. Licensee MDPI, Basel, Switzerland. This article is an open access article distributed under the terms and conditions of the Creative Commons Attribution (CC BY) license (https://creativecommons.org/licenses/by/4.0/).
Share and Cite
MDPI and ACS Style
Lee, W.H. The Choice of Machine Learning Algorithms Impacts the Association between Brain-Predicted Age Difference and Cognitive Function. Mathematics 2023, 11, 1229. https://doi.org/10.3390/math11051229
AMA Style
Lee WH. The Choice of Machine Learning Algorithms Impacts the Association between Brain-Predicted Age Difference and Cognitive Function. Mathematics. 2023; 11(5):1229. https://doi.org/10.3390/math11051229
Chicago/Turabian StyleLee, Won Hee. 2023. "The Choice of Machine Learning Algorithms Impacts the Association between Brain-Predicted Age Difference and Cognitive Function" Mathematics 11, no. 5: 1229. https://doi.org/10.3390/math11051229
Note that from the first issue of 2016, this journal uses article numbers instead of page numbers. See further details here.