

A Meta-Heuristic Multi-Objective Optimization Method for Alzheimer’s Disease Detection Based on Multi-Modal Data

1
Department of Management Information Systems, College of Business Administration, Al Yamamah University, Riyadh 11512, Saudi Arabia
2
Faculty of Computers and Information, Minia University, Minia 61519, Egypt
3
Computer Science Department, College of Computer Science and Information Technology, King Faisal University, Al Ahsa 400, Saudi Arabia
4
Computer Science, Faculty of Computers and Artificial Intelligence, Benha University, Al Qalyubia 13511, Egypt
*
Authors to whom correspondence should be addressed.
Mathematics 2023, 11(4), 957; https://doi.org/10.3390/math11040957
Submission received: 30 December 2022
/
Revised: 26 January 2023
/
Accepted: 9 February 2023
/
Published: 13 February 2023
(This article belongs to the Special Issue AI-Based on Mathematical Modelling for IoMT Devices and Networks)
Abstract
:Alzheimer’s disease (AD) is a neurodegenerative disease that affects a large number of people across the globe. Even though AD is one of the most commonly seen brain disorders, it is difficult to detect and it requires a categorical representation of features to differentiate similar patterns. Research into more complex problems, such as AD detection, frequently employs neural networks. Those approaches are regarded as well-understood and even sufficient by researchers and scientists without formal training in artificial intelligence. Thus, it is imperative to identify a method of detection that is fully automated and user-friendly to non-AI experts. The method should find efficient values for models’ design parameters promptly to simplify the neural network design process and subsequently democratize artificial intelligence. Further, multi-modal medical image fusion has richer modal features and a superior ability to represent information. A fusion image is formed by integrating relevant and complementary information from multiple input images to facilitate more accurate diagnosis and better treatment. This study presents a MultiAz-Net as a novel optimized ensemble-based deep neural network learning model that incorporate heterogeneous information from PET and MRI images to diagnose Alzheimer’s disease. Based on features extracted from the fused data, we propose an automated procedure for predicting the onset of AD at an early stage. Three steps are involved in the proposed architecture: image fusion, feature extraction, and classification. Additionally, the Multi-Objective Grasshopper Optimization Algorithm (MOGOA) is presented as a multi-objective optimization algorithm to optimize the layers of the MultiAz-Net. The desired objective functions are imposed to achieve this, and the design parameters are searched for corresponding values. The proposed deep ensemble model has been tested to perform four Alzheimer’s disease categorization tasks, three binary categorizations, and one multi-class categorization task by utilizing the publicly available Alzheimer neuroimaging dataset. The proposed method achieved (92.3 ± 5.45)% accuracy for the multi-class-classification task, significantly better than other network models that have been reported.
1. Introduction
In Alzheimer’s disease, neurons in the brain are lost due to a progressive degenerative process [1,2]. Approximately 70% of dementias affect memory, with a decline in its motor functions. Several biological signs indicate the emergence of early signs of Alzheimer’s disease before they become clinically evident [3]. As a result, it has been hypothesized that amyloid plaques, along with synapses, are responsible for damaging the neurons that lead to a gradual memory loss, with changes in behavior and thought [4]. Medical advancements and advancements in the renaissance have contributed to the rise of effective treatments for Alzheimer’s disease. It is true, however, that certain medicines can prevent Alzheimer from progressing to an advanced stage. The cause of AD is also multifactorial; it may be caused by diet, sleep disorders, lifestyle, genetic, and environmental factors [1,4]. The three phases of Alzheimer’s disease are pre-clinical, mild cognitive, and dementia. The clinical stage of Alzheimer’s begins without any symptoms for an extended period; however, it is characterized by the emergence of vital signs during the clinical phase (the progression of the physiological process), which makes it more susceptible with the disease; meanwhile, the MCI stage continues until AD appears with all its vital signs [2,3].
It is difficult to accurately predict stability versus Alzheimer’s or dementia based on biomarkers in the mild cognitive stage [3]. Early diagnosis of the disease can be assisted by the widespread use of neuroimages data to diagnose the structure of the brain [1]. Neuroimaging can diagnose AD and dementia in patients with cognitive impairment. Thus, doctors and specialists highly recommend such brain scans for patients with cognitive impairment [4]. Brain tissue can be identified using MRI scans because it offers a wide range of sequences. Brain atrophy is observed on MRI images due to cumulative neurological damage. MRI images require substantial experience and time to diagnose and extract features manually. Further complicating the manual diagnosis of AD are the similarities between healthy and soft neurons in MRI images [3].
Radiological-based medical imaging diagnosis has recently improved with deep learning (DL). Many medical image classifications are carried out using convolutional neural networks (CNN) [5,6,7,8]. The main objective of using CNNs for medical image classification is to use artificial intelligence techniques capable of diagnosing AD quickly and accurately. However, most of the AD prediction CNN models are trained on cohorts of individual modal images (i.e., cohorts); they cannot be used for other cohorts. Several studies have focused on single-modal image data. However, it is more intuitive to fuse multi-modal medical images to improve treatment and diagnosis accuracy. By combining images, information representations are enhanced in addition to modal features.
Further, the optimization algorithm facilitates in minimizing the cost function and maximizing the efficiency of the classification models [9,10]. The selection of hyperparameters in CNN training determines the speed and efficiency of the training process [9]. It is essential to carefully select the hyperparameter values relating to batch size, momentum, learning rate, regularization coefficient, and number of epochs when tuning the weights and biases of CNN models. Therefore, it is crucial to optimize these values before performing gradient descent training. It will take a considerable amount of time to change the hyperparameters and check the results if the parameters are incorrectly selected. Hyperparameters must therefore be optimized to automatically find optimal values and update them in accordance with the training data. The selection of hyperparameters for AD diagnosis is often made manually, leading to increased training time [9,11]. In addition, other optimization algorithms are limited by their dynamic nature, uncertainty, and the fact that they are devoted exclusively to a single objective.
To overcome the mentioned limitations, this paper proposes a deep ensemble learning architecture (MultiAz-Net) to detect Alzheimer’s disease automatically based on the fusion of multi-modal neuroimaging (MRI + PET). Several deep neural network models are utilized, including Alexnet, InceptionV3, and ResNet-18 [5,12,13]. The advantage of using ensemble models is to reduce the variance of the networks for fast random weights and biases. Additionally, ensembles of deep neural networks (DNNs) provide better performance and generalization results than single DNNs [14].
MultiAZ-Net utilizes a multi-objective grasshopper optimization algorithm (MOGOA) to optimize the hyperparameters of this ensemble network. This is, to our knowledge, the first study that examines the use of MOGOA when optimizing CNN for detecting Alzheimer’s disease using multi-modal data sources. With MOGOA optimization, the network’s hyperparameters will be tuned for accuracy, sensitivity, and specificity. AD (Alzheimer’s disease), MCI (Mild Cognitive Impairment), and CN (Cognitively Normal) are automatically extracted and classified by this architecture. A vital feature of the proposed MutiAZ-Net is its ability to produce an effective AD diagnosis system and to provide the best performance through extensive experimentation. In summary, the work can be summarized as follows:
- A CNN architecture of the ensemble network is adopted based on the analysis of multi-modal neuroimaging (MRI + PET) scans of an Alzheimer’s patient structured as a multi-objective optimization problem addressed by a MOGOA natural-inspired algorithm.
- The performance of the ensemble network is improved by automatically choosing and optimizing CNN’s hyperparameters using MOGOA with accuracy, specificity, and sensitivity as a multi-objective function for binary class and multi-class classification of Alzheimer’s disease.
- An extensive comparative analysis and performance evaluation of MultiAZ-Net has been conducted in this research paper based on various performance metrics.
The organization of this paper is as follows: the background and literature related to the proposed algorithm are presented in Section 1. In Section 2, the details of the proposed algorithm are described. Section 3 and Section 4 provide experimental design and numerical results to evaluate the performance of the proposed algorithm. In Section 5, we summarize the final conclusions and plans for future research.
2. Literature Review
Many scholars have recently focused on using machine learning in the health sciences. Improving AD diagnosis and prognosis is a popular area of study [17]. The use of deep learning in diagnosing Alzheimer’s disease using imaging or molecular data holds considerable promise. In this article, we will go into the current state-of-the-art of deep learning architectures for AD diagnosis and prediction.
Based on MRI scans, for the four-class classification of AD, Islam and Zhang [18] built a DCNN model. The training and evaluation of the Inception-V4 model was done on the OASIS dataset. The model’s accuracy was 73.75%. Still, this model had insufficient data and had a poor accuracy. A classification model, namely, extreme learning machine (ELM), for binary AD was presented by Zhang et al. [19]. First, manually segmented voxel-based morphometry pictures of 627 patients from the ADNI database were utilized.
A technique for multi-class detection for AD and cognitive impairment stages was first presented by Shanmugam et al. [20], and it was based on transfer learning. They employed 6000 MRI ADNI pictures for training and testing on Google’s GoogLeNet, AlexNet, and ResNet-18 networks. The best classification accuracy (98.63%) was accomplished by the ResNet-18 network. Using deep learning, Kong et al. [21] created a unique PET–MRI image fusion and a 3D CNN for AD multi-classification techniques. A total of 740 3D photos from the ADNI collection were used. This research proposes A3C-TL-GTO to categorize MRI images and detect AD. The A3C-TL-GTO empirical framework for atomatic and accurate AD classification was created and evaluated using the Alzheimer’s Dataset (four image classes) and the Alzheimer’s Disease Neuroimaging Initiative (ADNI).
The proposed framework reduces pre-processing bias and fine tuning variability for classifier models and datasets. The MRI-validated method is applicable to various imaging methods. It was discovered that proposal was a useful instrument for such a task and might improve patient care. ADNI’s online Alzheimer’s disease database was used to acquire MRI brain images. The proposed work achieves 96.65% accuracy on the Alzheimer’s Dataset and 96.25% accuracy on the ADNI Dataset, according to experimental results.
The absence of image examples within the datasets encourages overfitting. It reduces the effectiveness of deep learning models despite the necessity of a model with robust discriminative features for a high-performing classifier. Deep metrics learning is one type of few-shot learning developed to overcome this issue. Using just a metric learning technique, Orouskhani et al. [22] presented a unique deep triplet networking to evaluate brain MRIs and diagnose Alzheimer’s disease. In order to compensate for the lack of training data, the proposed deep triplet network applies a conditional loss function to improve model quality. The primary network of this model was inspired by VGG16, and experiments are performed using publicly available datasets from imaging research (OASIS).
Our work is inspired by the great ability of pre-trained models to classify image data in current research environments. Based on the efficient global and local search capabilities of the multi-objective optimization algorithms, we propose a new approach for the prediction of Alzheimer’s disease using a CNN. In this research, the MultiAz-Net is utilized to estimate and optimize an appropriate CNN architectural design with a multiobjective function based on a wide range of hyperparameters. Consequently, we emphasize the novelty of our work by modeling the parameters of convolutional neural networks as a multiobjective function to facilitate the process of finding the optimal parameters in a given search space, thereby overcoming the limitations of manual-based classifiers. The following can be inferred as the primary limitation of the present literature based on this review.
- Research has focused primarily on a rigid, manual optimization strategy for CNN architecture, which requires extensive knowledge of the design process for architectural search spaces. This study presented a novel black-box optimization algorithm for the design of CNN configurations.
- The majority of the studies have utilized single source data (MRI or PET images). Multi-modal fusion, however, has been devised, which has proven to be highly effective.
- Numerous studies have sought to improve AZ detection accuracy by improving a single objective function; however, we focused on multiobjective optimization.
- In comparison to binary categorization, the multi-class classification task introduces numerous confounding factors and presents a greater challenge. In the current study, binary-class and multi-class assessment tasks have been developed to ensure the effectiveness of the devised model.
3. Procedure & Methodology
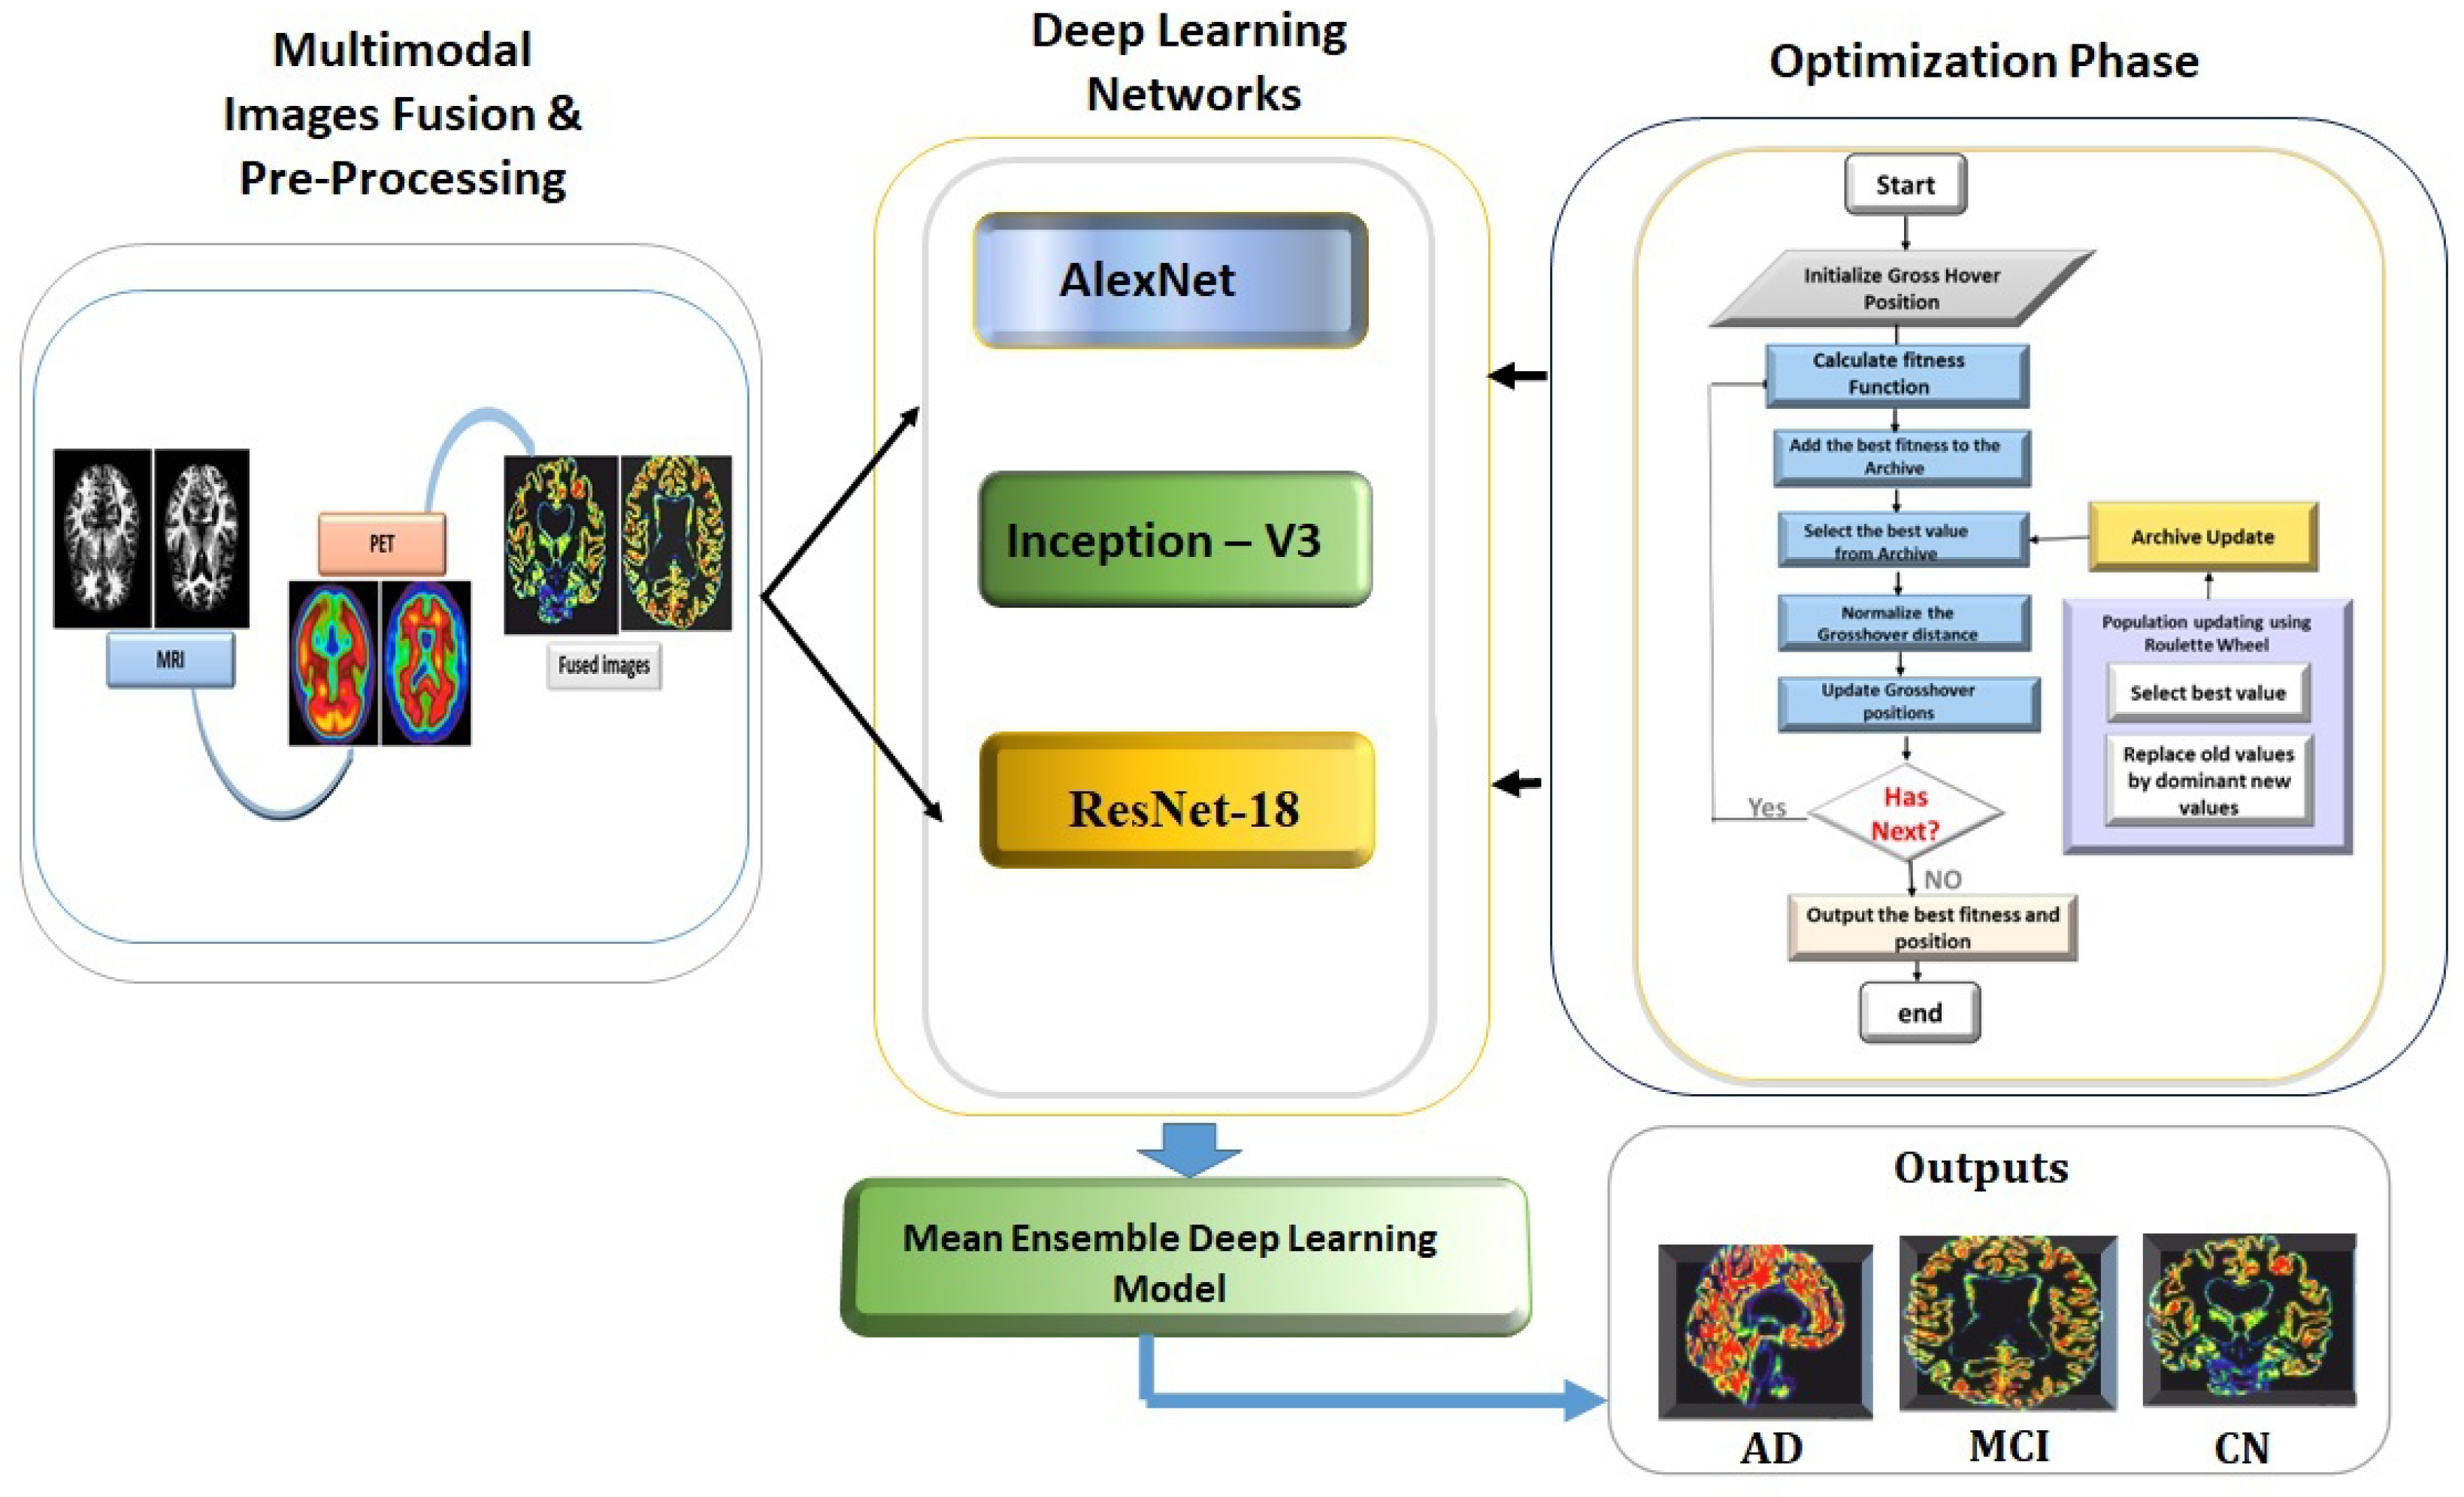
DL models are characterized by three major elements: the data it uses, the training parameters, and the network design. The main goal of any of the deep learning models is to achieve the proper balance between these three elements to perform the task as efficiently as possible. As a result, several trials are conducted to confirm the model’s design, in which a set of initial parameters is used, and the model’s performance is evaluated [12]. Suppose the version of the dataset, network architecture, or training parameters is below the desired level. In that case, the dataset, the training parameters, or the network architecture are modified until a satisfactory level of performance is achieved. This study aims to develop an ensemble model called MultiAZ-Net utilizing multiple multi-modal neuroimaging techniques (MRI + PET) to assist in the early diagnosis of AD. An illustration of our model’s pipeline is provided in Figure 1. The model starts by pre-processing MRI and PET neuroimaging collected from different sources. To find the most relevant subset of features to detect and classify Alzheimer’s’ disease, InceptionV3, AlexNet, and ResNet-18 are used. All the models are trained with multi-modal data (more informative and discriminative features), which has improved their classification performance. Additionally, as DNN networks, hyperparameter selection significantly impacts performance. For MultiAZ-Nets’ DNN networks, MOGOA was used, which is a multi-objective evolutionary algorithm to optimize network hyperparameters automatically based on accuracy, sensitivity, and specificity. The best-performing features from various modalities were used as input for the ensemble network. Finally, several classifiers, including a support vector machine (SVM), softmax, and a random forest (RF), are used to categorize them into three main classes (Figure 1):
- AD (Alzheimer’s disease): these images are of individuals diagnosed with Alzheimer’s disease.
- CN (Cognitively Normal): these images that describe healthy individuals (control).
- MCI (Mild Cognitive Impairment): these images that describe symptoms include a mild, but noticeable, decline in cognitive abilities.
The following sections describe the main stages involved in AD classification, the pre-trained networks, and their optimization.
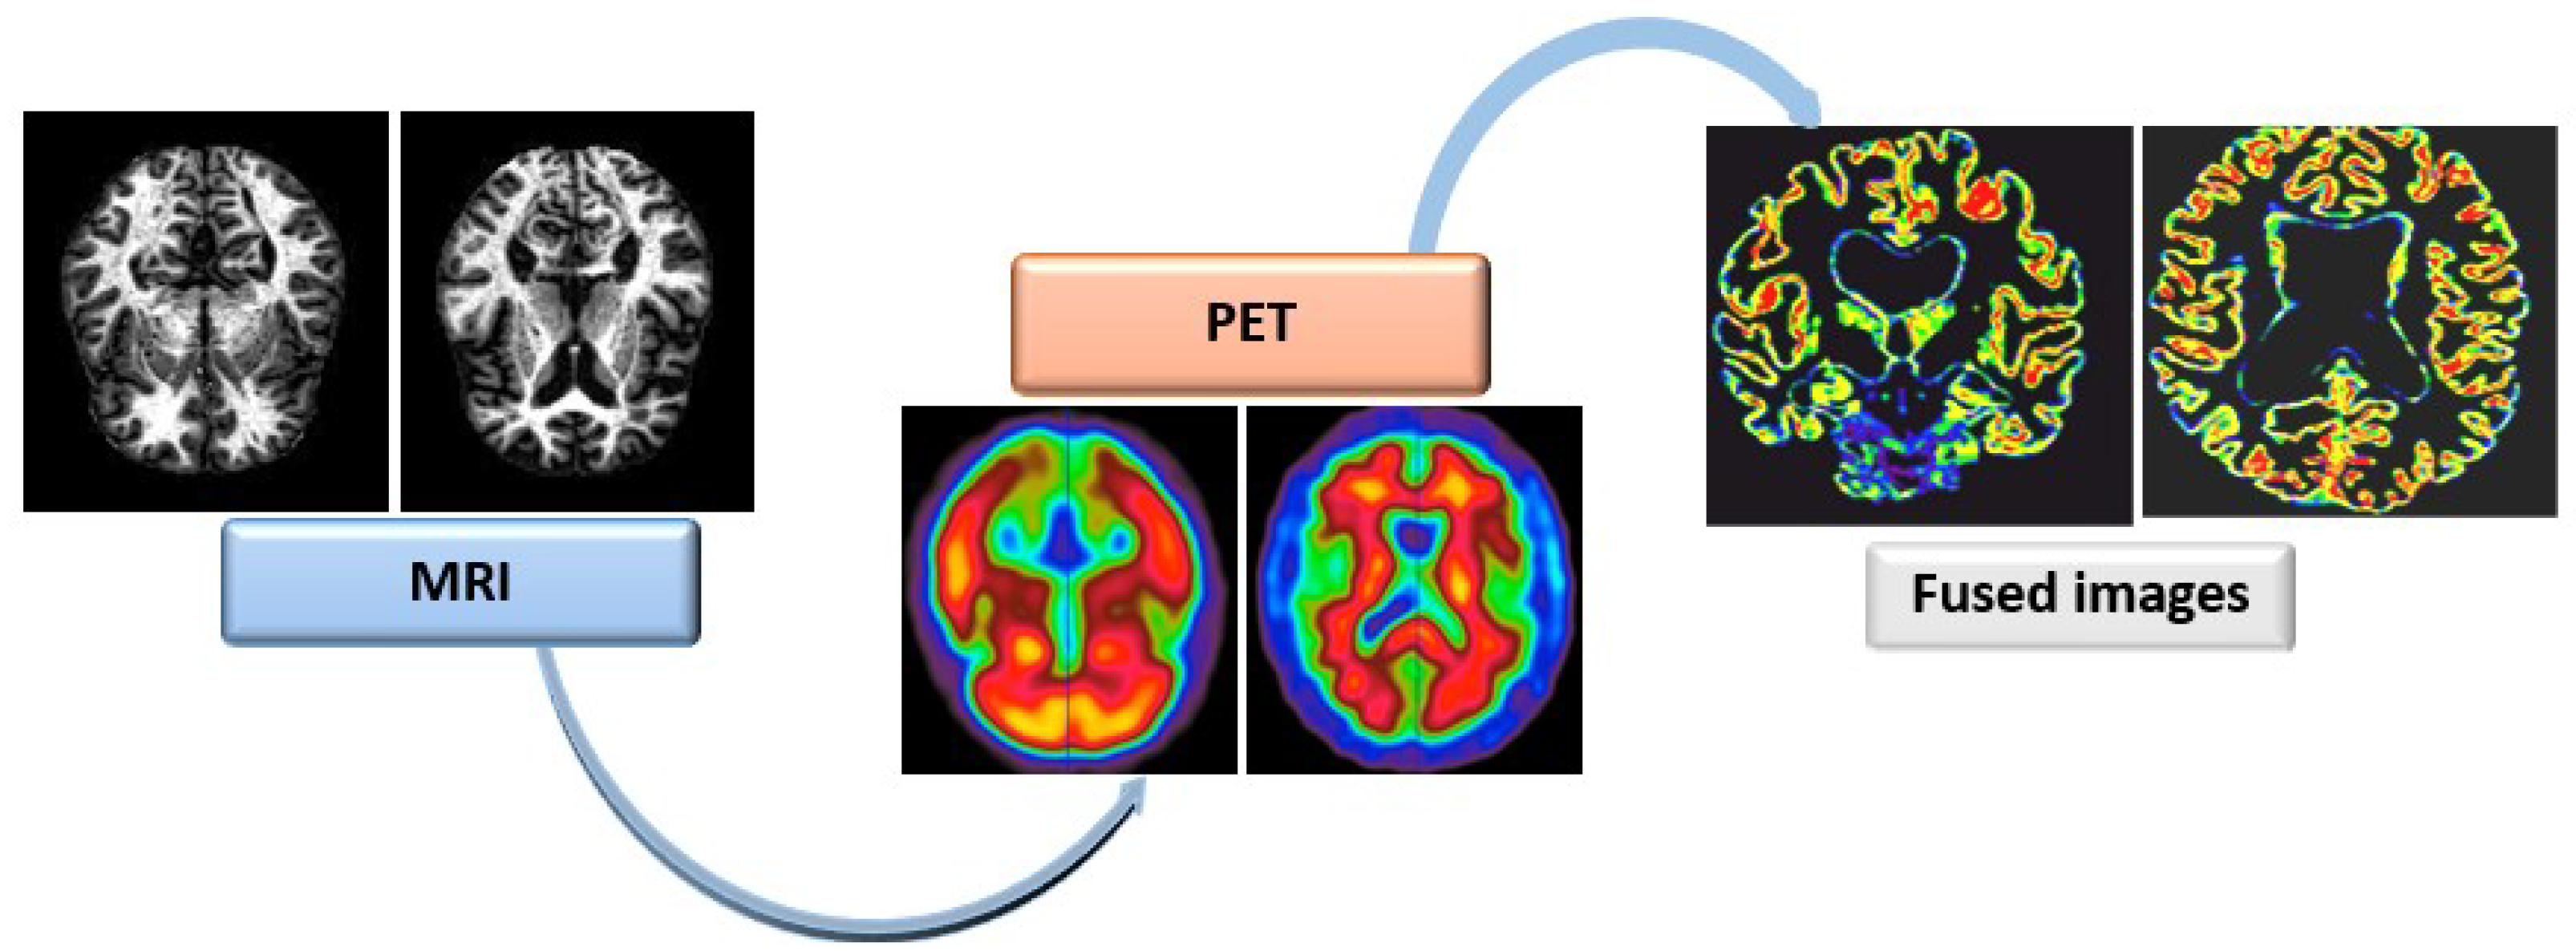
3.1. Multi-Modal Image Fusion
This study used a fusion of MRI and PET images to diagnose and categorize AD [11] extracted from the ADNI’s public dataset [23] (as shown in Figure 2). ADNI has primarily been designed to test if the serial MRI, PET, and basic subject information and ratings (neuropsychological assessments) can all be used to measure mild cognitive impairments (MCI), normal cohort (NC), and early Alzheimer’s disease (AD). Inspired by the outstanding achievement of medical image analysis [10,12,21], an FDG-PET image is fused with MRIs to achieve a multi-modal image fusion strategy. Due to the fact that the MRI and FDG-PET scans of each participant had several images captured at different times, the images of each subject were chosen based on the following steps:
- Select structural MRIs that were labeled with MPRAGE because they were thought to be the highest quality images.
- Filter the collected MRIs with the recent images of each subject.
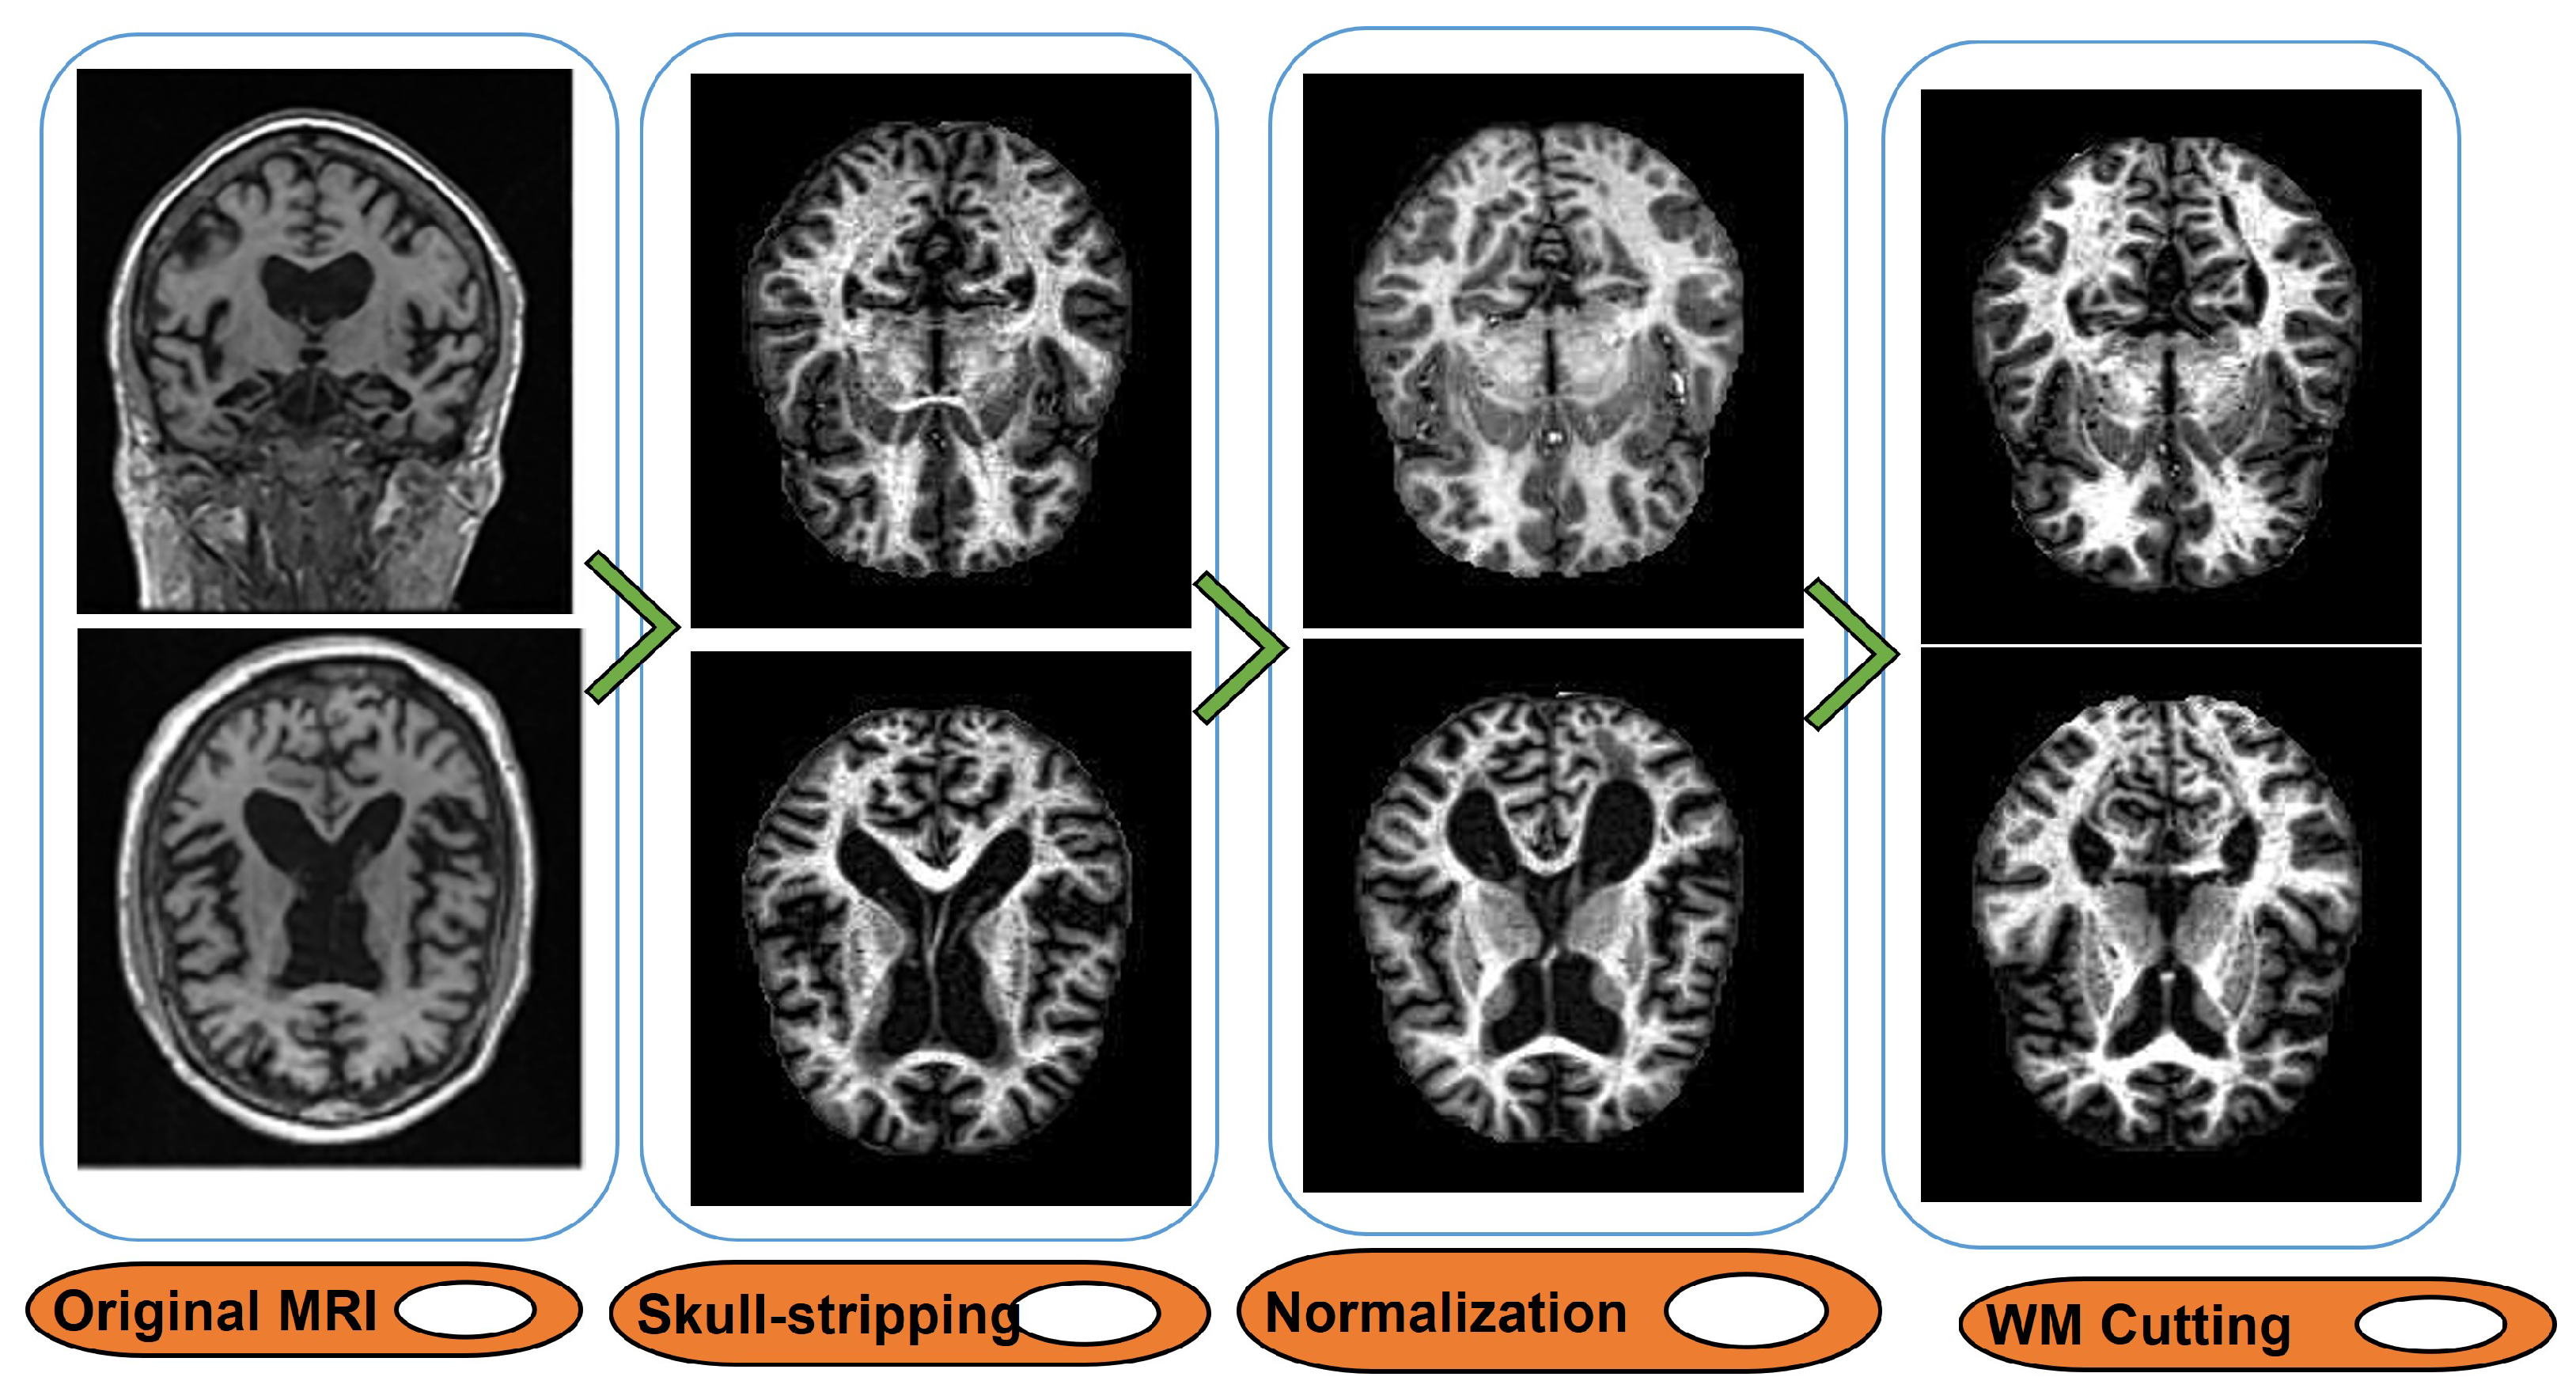
- Perform skull-stripping for each selected MRI, and then, use the FLIRT package to affine MRI to the global brain map model space (i.e., MNI152).
- Scan and register individuals MRI by eliminating any spatial variances
- Normalize and resize MRI to the dimension of 145 × 172 × 145.
- Recover the white matter (WM) region of the MRI images (a sample of pre-processed MRI is given in Figure 3).
- Co-register the standardized image associated with the first functional PET scan (with T1 weight) with its correspondence MRI.
- Normalize and resize PET images to the dimension of 160 × 160 × 121.
- Combine MRIs and PET images modality to a single picture area.
3.2. Deep Learning Networks
Several types of deep learning networks, including linear and nonlinear networks, use a huge quantity of training data to adjust the parameters and weights using stochastic learning and analytical techniques. Stochastic training results in different weights and biases for every iteration, resulting in different prediction results. Variance refers to the changes in the performance results caused by varying DNN parameters. The high variance in the classification task is resolved by ensemble learning, which trains several neural networks (NN) in parallel [20,24]. Hansen and Salamon [25] first proposed ensemble learning to train a finite number of neural networks for the same task. In addition to improving the network variance, ensemble learning also improves its ability to generalize. To construct ensemble networks, the proposed method MultiAZ-Net uses Alexnet, InceptionV3, and ResNet-18 DNN [5,12,13]. This selection of networks is based on the fact that they are designed in three distinct structures and feature a variety of characteristics. For the classification of AD phases, parallel training of all these designs is performed on the MRI and PET images for AD, NC, and MCI. Finally, all the extracted features of all networks are merged and classified using softmax, SVMs, and RF classifiers.
3.2.1. AlexNet
It is estimated that the smallest pre-trained network that can be used for transfer learning is Alexnet, which consists of 25 layers with an 8-layer depth. AlexNet consists of a sequence of convolutional layers, normalization layers, pooling layers, Rectified Linear Units (ReLUs), and fully connected layers. Based on both structure and classification accuracy, the Alexnet network is among the most effective pre-trained networks [5,12,13].
3.2.2. Inception V3
A team at Google developed Inception V3, which was introduced as GoogleLeNet. Inception V3 [26] is the latest version of the Inception model, which has 42 layers and a lower error rate than previous versions. To form the entire structure of Inception V3, convolution layers with different filter sizes are concatenated in the inception module to produce the output of the next layer. Thus, the concatenated feature map comprises the characteristics of the same input obtained from various filters in different regions. In this way, learning is made more effective.
3.2.3. ResNet-18
ResNet-18, a member of a ResNet architecture family, represents one of the architectures constructed by repeatedly adding residual blocks. These blocks streamline the network’s architecture, enhancing its performance. By adding additional convolution layers, the network’s depth is raised. Several additional networks employ the ResNet architecture for propagating the residue, which is the sum of input and convolution layers. This way, the overhead of propagating a more significant number of features is reduced. It is therefore possible to optimize larger networks more rapidly by reducing the over-fitting problem [5,12,13].
3.3. Hyperparameter Optimization using Multi-Objective Grasshopper Optimization Algorithm (MOGOA)
Ensemble DNN weights and biases are tuned by tuning hyperparameters such as learning rate, batch size, momentum, regularization coefficient, and number of epochs.
Increasing the network depth creates optimization concerns. In addition, an incorrect selection of hyperparameters may lead to subpar results. For ensemble DNN, the setting of the hyperparameters and analyzing the results can take a considerable amount of time. Therefore, hyperparameters must be tuned to find ideal values automatically and update them depending on training data. Optimizing a DNN is concerned with improving its accuracy, sensitivity, and specificity. Using these optimization algorithms, the optimization process starts with exploration, which describes the capability of the algorithm to have a broader range of values, followed by exploitation, which describes the ability to search in smaller areas [27]. An optimization algorithm called “Grasshopper Optimization Algorithm (GOA)” supports the behavior of a swarm of grasshoppers (GH) [25]. The GOA system is capable of balancing exploration and exploitation. To find prey (best feature), GH first move locally and then freely in different areas of the world to explore. According to the previously discussed optimization algorithms, exploration takes place before exploitation. To find the approximate solution to the objective function, GOA first identifies the regions in the ample feature space (exploration) and then searches locally (exploitation). Depending on which single objective to be met (i.e., the training loss mean and standard deviation drop below a threshold), the exploitation process is immediately terminated. Otherwise, exploration continues to evolve to create a new population. Multi-Objective GOA (MOGOA) is a version of GOA that incorporates multiple objectives.
Compared to other existing algorithms, MOGOA is very efficient and superior for optimizing the selection of hyperparameters of ensemble deep learning networks [28]. Such a process will reduce the risk factors for AD diagnostic errors by minimizing the number of predictors and improving accuracy, precision, and recall. Multi Objectives Optimization Problems (MOPs) are characterized by a set of mutually conflicting objective functions. A multi-objective optimization problem can be expressed as follows:
The vector x represents the input variables (design variables) and the vector F represents the objective functions . The problem constraints are represented by and . The objective of the proposed work is to optimize the hyperparameters of the ensemble DNN in order to improve , , and of the AD diagnosis capability.
A Pareto optimal solution is one in which no objective function can be improved without worsening at least another. Generally speaking, such a solution is not unique, and the set of Pareto optimal solutions is considered to be the Pareto front. Equation (2) presents a mathematical model for the optimization problem posed by GOA [28].
The upper bound is denoted by and the lower bound by , the bounds of the dth dimension. The target is represented by and c is a decreasing coefficient used to shrink the area of comfort and repulsion. In Equation (2), it is important to update c for each iteration of the algorithm to ensure that the balance between exploration and exploitation is maintained.
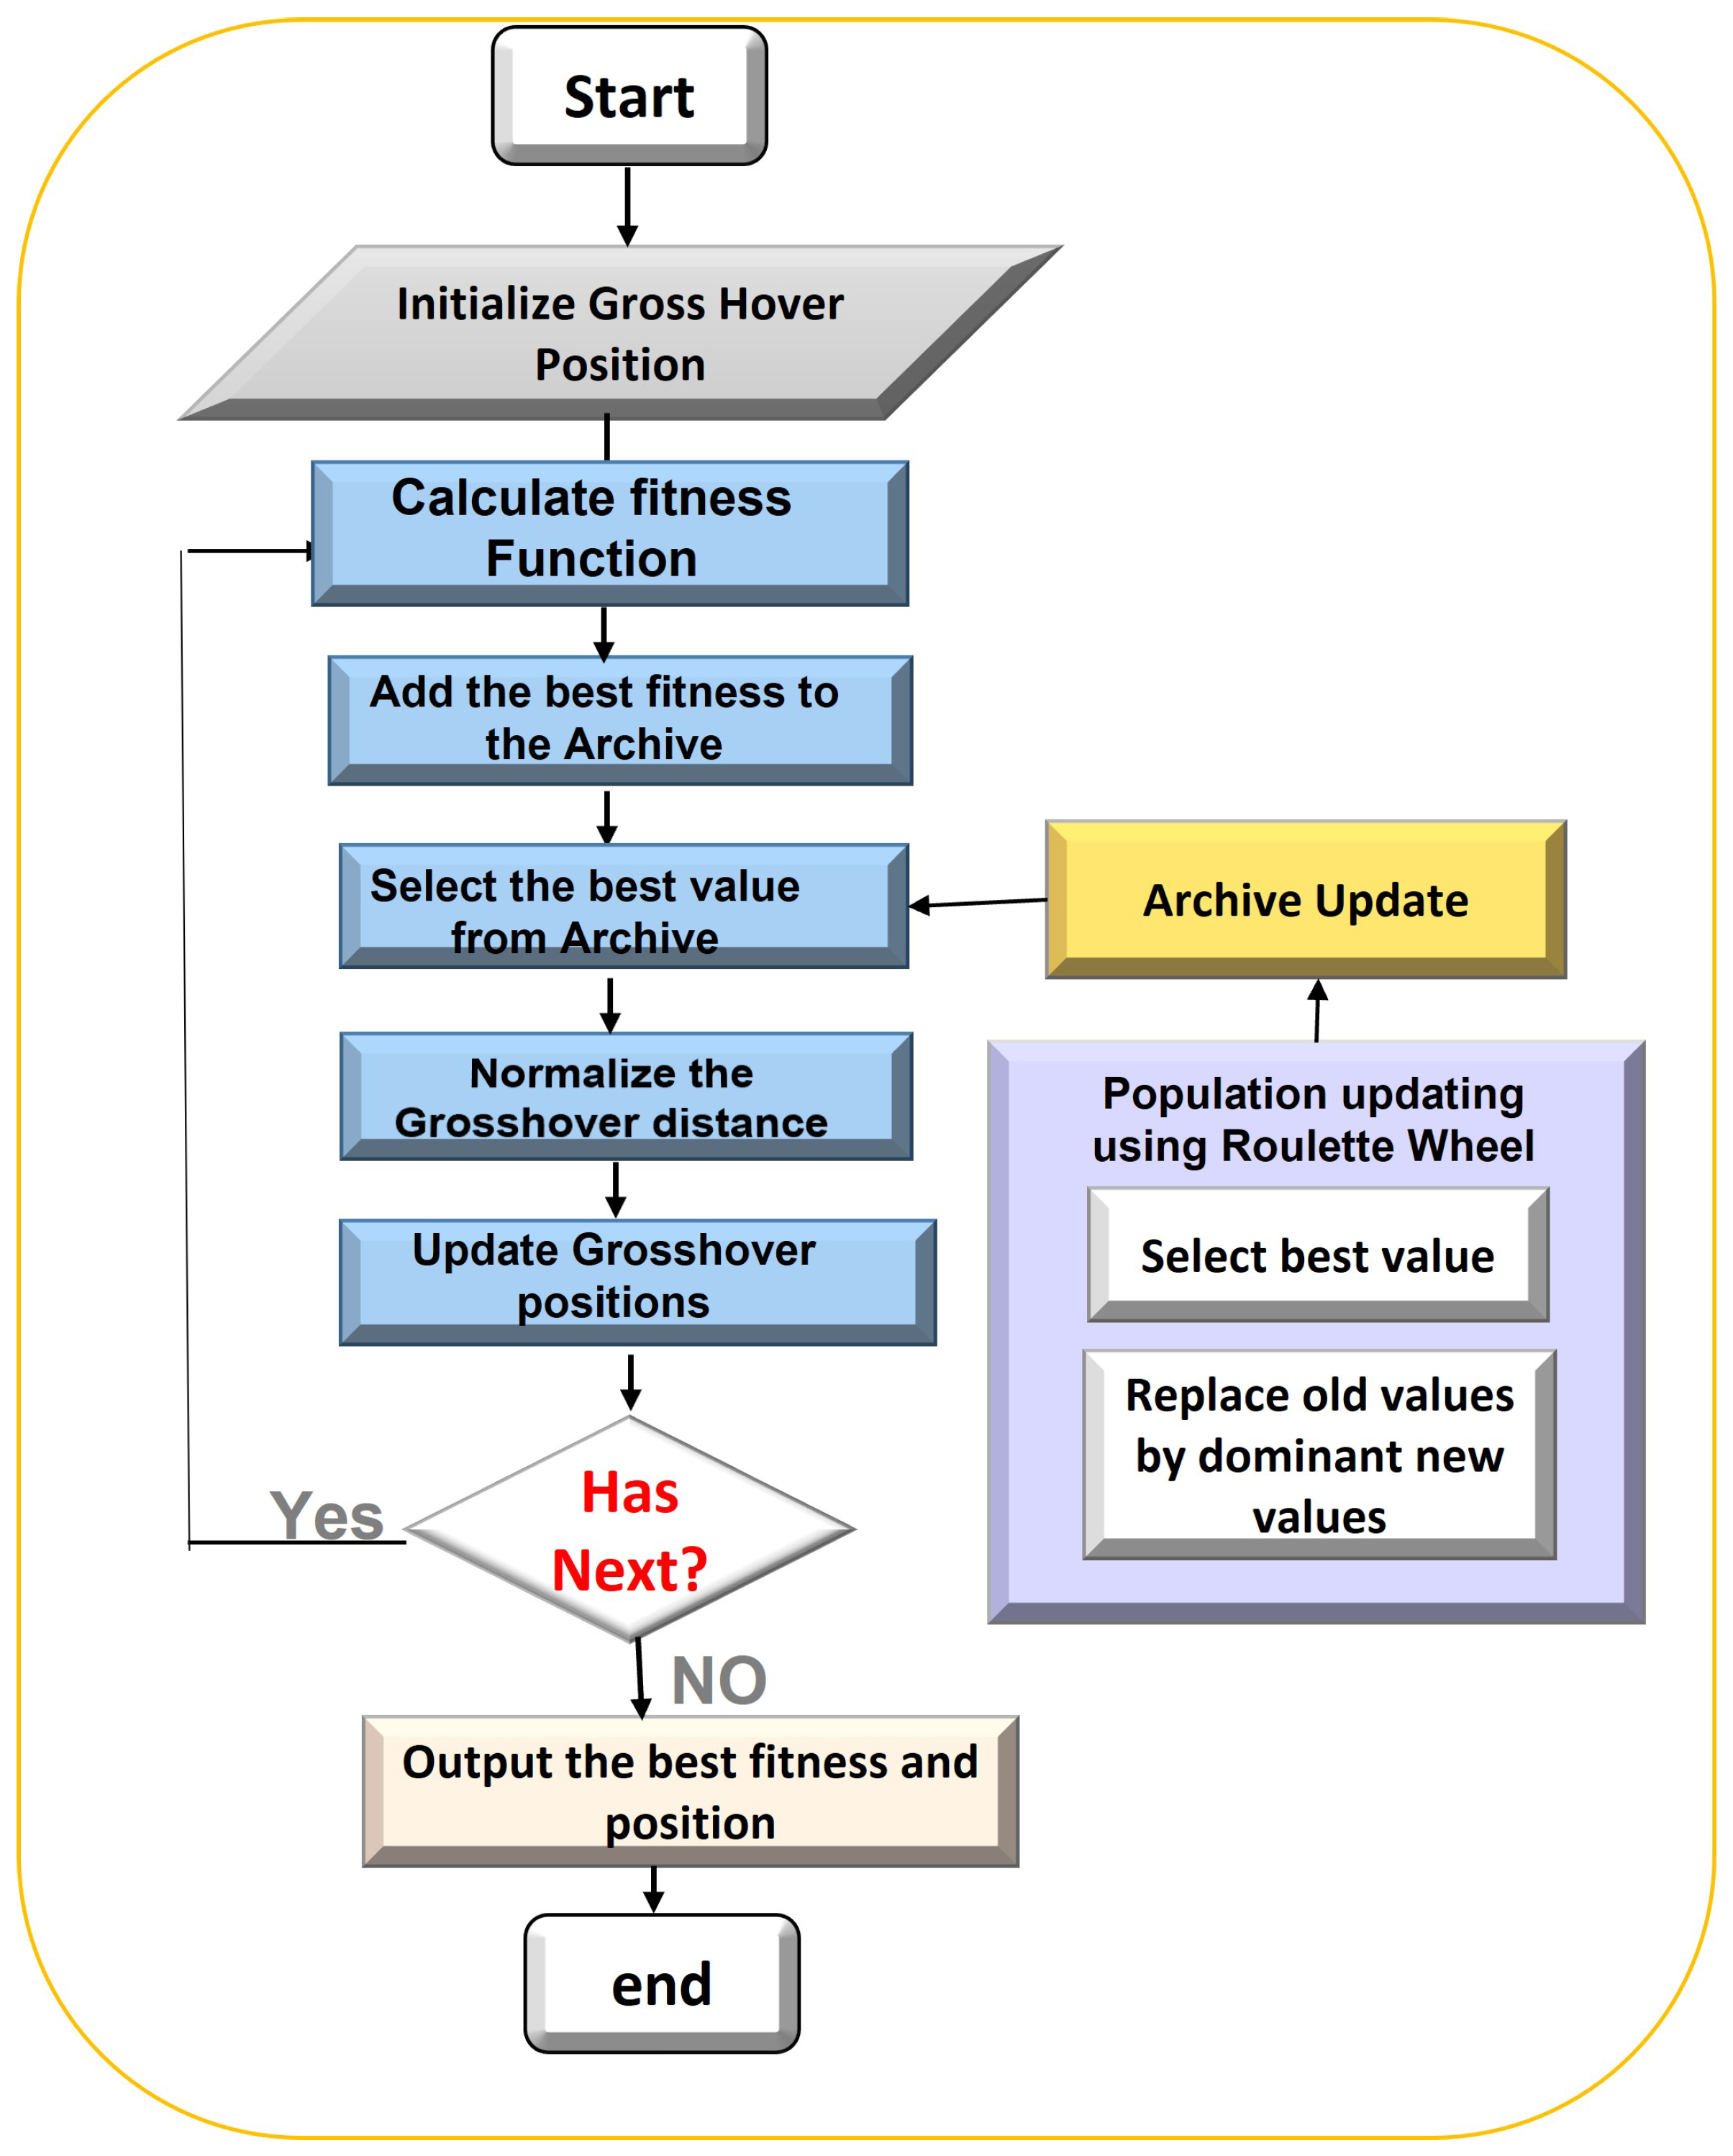
To solve the optimization problem, MOGOA generates more than solutions. The Pareto Optimality (PO) operator is used in order to compare multiple solutions. A MOGOA archive is created by first storing the best solution. The next major challenge in multi-objective optimization is selecting the target. As part of MOGOA, the target is chosen from a set of operators. In order to select a target, the number of neighborhood solutions of each operator stored in the archive is counted. This quantitative measure is used to select the target. Based on the number of neighborhood solutions, Equation (3) provides the probability that the target will be selected.
represents the number of solutions associated with the ith operator in the PO. Using Equation (3), the target is then selected by using a roulette wheel. The archive is regularly updated by replacing the solution in the archive with an external solution if the external solution dominates.
Figure 4 shows the exact details of MOGOA. First, the datasets are pre-processed and the initial population is generated for each network. Then, theMOGOA metaheuristic optimizer is used to optimize the different transfer learning parameters, including hyperparameters. The goal of this phase is to determine the best hyperparameter configurations for each pretrained transfer learning model. An iterative process is used to compute the steps for a maximum number of iterations . As part of this step, each solution’s fitness function score is evaluated. The best combination of learning iterations can be used to conduct any further analysis following the completion of the learning iterations.
3.4. MultiAz-Net for AD Classification
An overview of the proposed MultiAz-Net for AD classification, learning, and hyperparameters optimization approach is presented in Algorithm 1. The solutions must be initialized as a first step in the MultiAz-Net framework (Line 4). The solutions consist of random floating-point numbers 2 [0, 1]. Therefore, they must be converted (i.e., mapped) to the corresponding hyperparameters (Line 5). Each element in the solution is mapped to a hyperparameter, and then, the target pre-trained transfer learning model with the hyperparameters is compiled. MultiAz-Net initializes the employed iterations, dimensions, and multi-objective function (Line 6).
Each pre-trained CNN model was initialized during the training phase with the “ImageNet” dataset pre-trained weights (Lines 4–7). As part of the current study, every pre-trained transfer learning CNN model will begin learning on the split subsets for 7 epochs. A random sample of solutions is selected, and non-dominated solutions are stored in roulette wheel. They are then stored in solution, which is initially empty. In the next step of the MultiAz-Net, the best solutions are searched after they have been initialized. There is a loop that is repeated until TMax iterations are reached (Line 9). In each iteration, employed roulette wheel, grasshopper, and dimensions are utilized to determine the best solution. The employed grasshopper searches for a new solution using the roulette wheel probability value over the original solution (Lines 10–13).
Based on the strict dominance test results, the solution with the most dominance over the other is kept (Lines 14–16). Therefore, if the mutated solution is more dominant than the original solution, the original solution will be replaced by the mutated solution; otherwise, the original solution will remain. It is more likely for the archive to get full; therefore, it will automatically update and select the employed grosshover that are closely related to the best solutions with high accuracy, specificity, and sensitivity (Line 17–20). The final chosen solutions and parameters concerning the multi-objective function are used to test the remaining dataset value (Lines 23–26). All the selected features are fused and fed to 3 classifiers, SVM, Softmax, and RF, to find the final label of the fused neuroimaging (Lines 27–28).
| Algorithm 1 The suggested MultiAz-net framework pseudocode. |
| Input:Dataset Dt, Number of Classes C, Hyperparameters K1, K2, K3, K4, K5, Evaluation Function F |
| Output:Best Model, Accuracy, Specificity, Sensitivity. |
|
3.5. Experiment
This section presents the results of experimental studies conducted to prove the efficacy of the proposed MultiAz-Net with various classifications and optimization algorithms. Several experiments and parameter adjustments were conducted to measure the efficiency and effectiveness of the proposed model considering the single source (PET only or MRI only) and multi-modal (PET + MRI) themes of AD neuroimaging. Additionally, the model has been compared with the state-of-the-art non-optimized and single-objective evolutionary-based optimization algorithm for the binary- and multi-class AD classification task.
The Experimental Setting
To implement the proposed architecture, MATLAB R2021b has been used. The system configuration was NVidia, core i7, Windows 11, and 64 GB of RAM. The configuration of the experiments conducted is represented in Table 1.
A 70% split of the dataset is used for the model training and 30% for the model testing. There is an imbalance in the data between the three classes (AD, Early MCI, NC), and training with such data will most likely produce biased models. Therefore, data augmentation techniques are used to deal with this imbalance problem. Afterward, the multi-modal image features are extracted using three pre-trained CNN architectures. Using MOGOA, the hyperparameters of these networks have been optimized. Additionally, an evaluation of the performance of the proposed method was carried out by evaluating a 10-fold cross-validation method by dividing the labeled data into 10 groups. To ensure that samples are not contaminated, the ensemble model is randomly validated with one-third (40%) of the data and the rest for training in each fold. To understand the variability of the results, such 10-fold cross-validation experiments were repeated 30 times. We conducted a one-way analysis of variance (ANOVA) in order to compare the impact of different data modality on AZ classification performance. For the purpose of inferring statistical significance, a p-value of 0.05 was used.
For training the 3 models, 100 iterations were conducted with a range of 7 epochs selected to adjust the MOGOA parameters with an L2 regularization rate between 1.3042 × 10⁻⁴ and 0.9746 × 10⁻⁴ for 32 batch sizes with momentum between 0.5224 and 0.750. The model performed as predicted as a result of these parameters. Additionally, we determined in this research that the most significant results were obtained when the learning rate of the training data was set between 0.0923 and 0.0593 for classification tasks.
3.6. Performance Parameters and Evaluation Metrics
For evaluating the proposed MultiAz-Net, we used Accuracy, Sensitivity and Specificity measures. The accuracy value is calculated by the ratio of the number of correctly classified AD, McI, and NC samples to the total number of samples. Equations (4)–(6) illustrate how these evaluation metrics were calculated, where TP is the number of AD, MCI, and NC images correctly diagnosed, FP is The number of AD, MCI, and NC neuroimages that are misdiagnosed, TN is the false neuroimaging that is correctly diagnosed as AD, MCI, and NC, and FN is Alzheimer’s’ images that are misdiagnosed as AD, MCI, and NC themes. As part of the evaluation of MultiAz-Net, confusion matrices (CM) are used. In classification methods, the CM represents the characteristics of classification performance during execution.
3.7. Dataset Preprocessing
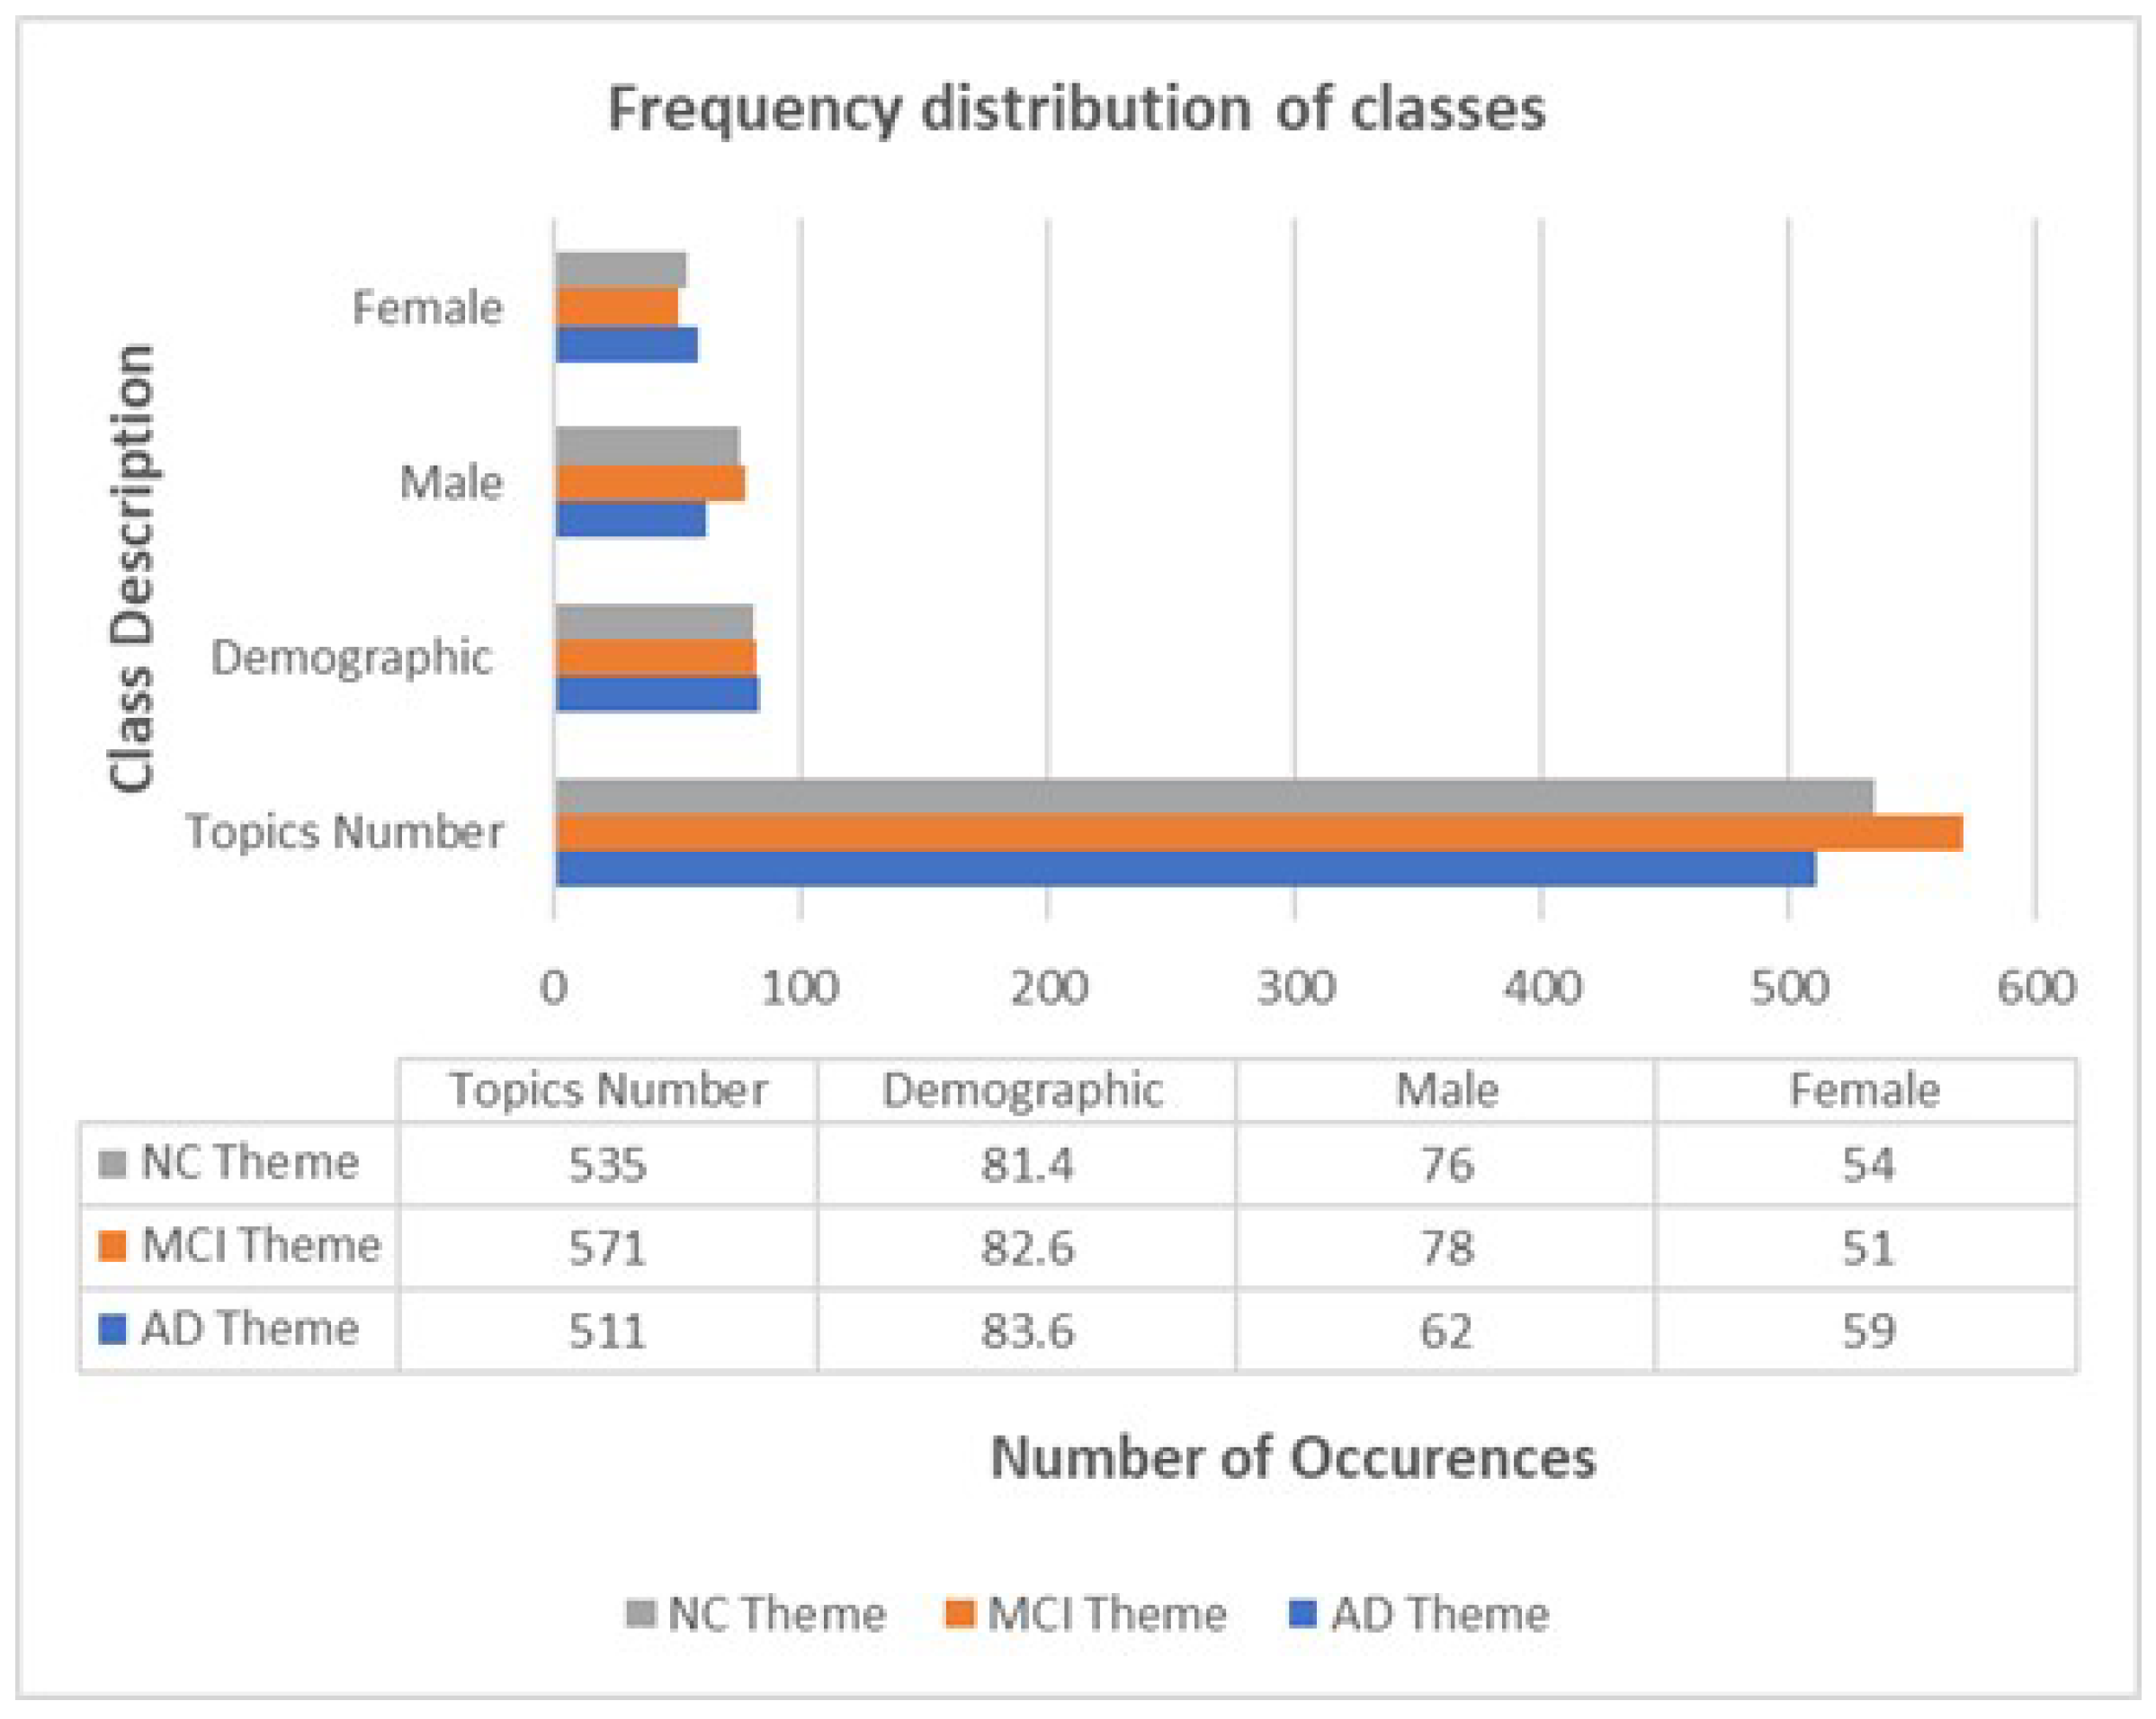
As a result of retrieval criteria mentioned in Section 3.1, the experimental dataset consisted of 1617 DICOM images of brain tissue. The images were collected as part of the Alzheimer’s disease Neuroimage Initiative (ADNI) study [23], which was conducted as part of clinical trials related to the treatment for Alzheimer’s disease. Among the major objectives of the ADNI database is to develop biomarkers that can be used to conduct clinical trials on the early stages of Alzheimer’s disease. The ADNI has accumulated thousands of data, including brain scans, genetic profiles, and biomarkers from cerebrospinal fluid. As a result of these biomarkers, cognitive decline can be predicted. Different types of imaging are used in ADNI, such as MRIs, fMRIs, PETs, etc. A total of 511 AD, 571 early MCI, and 535 NC themes acquired from MRI and PET scanning are incorporated in the current study. Details of the study population’s age and gender statistics are given in Figure 5.
4. Experimental Results and Discussion
The effectiveness of the proposed model is first tested for binary-class classification accuracy considering three tasks:
- AD: NC themes
As shown in Table 2, different modalities have been considered with the optimized ensemble network. The multi-modality-based techniques perform more effectively since they integrate MRI and PET data effectively. In terms of overall indicators, with SVM classifier, the MultiAz-Net for image fusion obtained the best classification ACC (accuracy) of (93.2 ± 5.5)%, SPE(specificity) of 94.0 ± 4.9%, and SEN (sensitivity) of (95.0 ± 4.5)%. The actual quality of our proposed approach was the best in the AD: NC classification test.
- MCI: NC themes
Three different approaches using MultiAz-Net were used to categorize Alzheimer’s disease in Table 3. Using SVM for the fused features classification, our technique achieved the highest levels of categorization with an ACC (93.2 ± 0.9), SEN (89.2 ± 4.0), and (96.0 ± 2.0) SPE for MCI: NC classification. Additionally, the proposed approach with multi-modal neuroimagong outperformed MRI uni-modal methods in categorization ACC, SEN, and SPE by 3.2, 4.2, and 1%, respectively. In some classification results, however, the accuracy obtained using PET images is greater than the fused images results.
- AD: MCI themes
In Table 4, the findings are presented for a variety of treatments used in the categorization of AD: MCI. By a significant margin, the multi-modal picture fusion approach has the highest ACC of (90.0 ± 3.9)%, SEN of (89.2 ± 6.5)%, and SPE of (93.3 ± 3.0)% using the optimized pretrained models with SVM classifier.
4.1. Multi-Class Classification Assessment
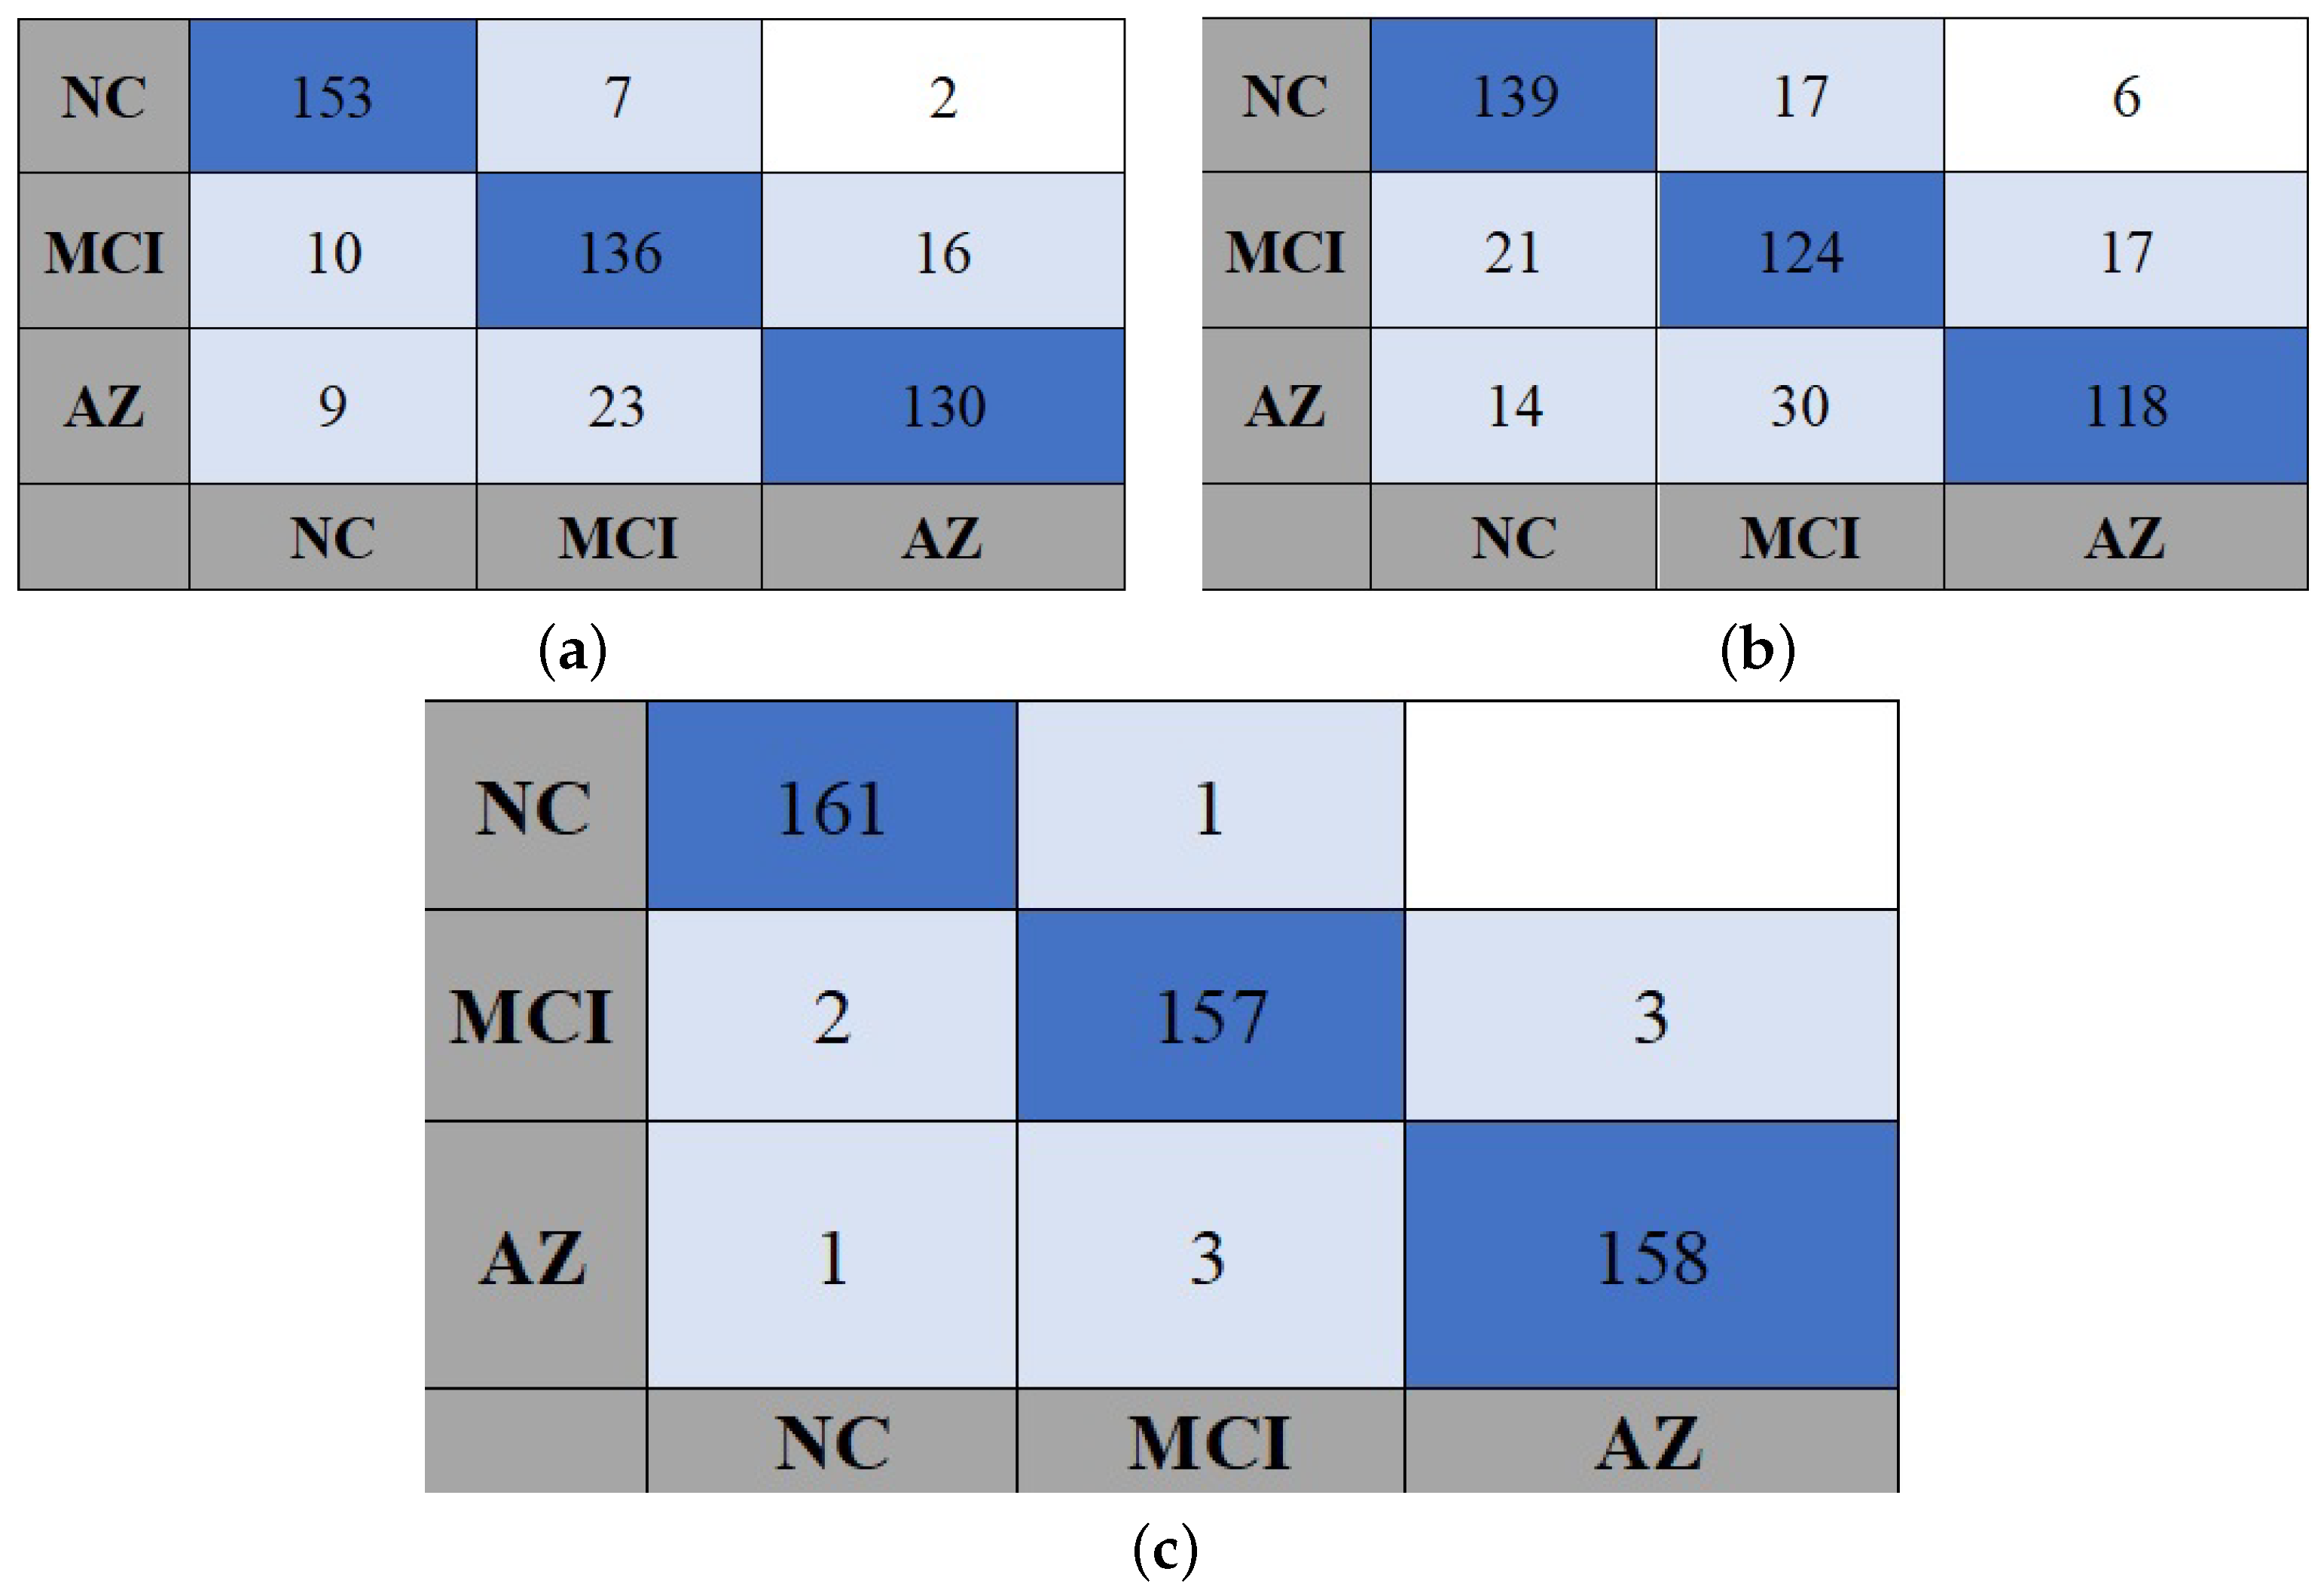
Finally, we used MultiAz-Net to categorize AD, MCI, and NC using several modalities. The multi-class task introduces numerous confounding factors because MCI is a transitory condition between AD and NC. This classification task presents a greater challenge than the previous binary categorization task. All evaluation indices showed that our approach outperformed the uni-modal PET-based or MRI-based methods, but the three-classification task required more power. According to the results of the proposed ensemble networks’ classification (considering SVM), accuracy was (92.3 ± 5.5)%. Based on the training results obtained with the test dataset, the confusion matrix for MOGOA-optimized ensemble models used in the study are presented in Figure 6.
The accuracies generated are shown in Table 5.
4.2. Performance of MOGOA Optimization
Our purpose in this section is to further evaluate the accuracy of the classification achieved by the MultiAz-Net design by comparing different optimization algorithms with MOGOA. Each classification task was analyzed in detail and compared with optimized work that represents state-of-the-art work that considers both single and multi-modal image fusion. The optimization of the ensemble network is achieved using genetic algorithm (GA), grid search strategy (GSS), and MOGOA Optimization algorithms. The details of the implementation environment for each algorithm are given in the following subsections:
- For the optimization of hyperparameters of DL networks, GSS is generally regarded as the most popular and conventional method. The hyperparameter space must be manually specified for the single objective to be optimized using GSS. In this phase, we utilized the GSS for optimizing the MuliAz-Net models’ parameters. As a result of GSS, all possible solutions to a given set of parameters are generated as a grid. According to the results from the grid, a set of hyperparameters will be selected. The optimization of a single objective is accomplished by specifying a hyperparameter space by hand. For a given set of parameters, the GSS creates a grid of all possible solutions [29]. From the grid, the hyperparameters that provide the best results will be selected.
- Additionally, a genetic algorithm is implemented to achieve a single-objective effective search for models’ hyperparameters selection in AD detection [30]. Darwin proposed evolutionary principles as the foundation for genetic algorithms, which are heuristic search methods [30]. Evolutionary ideas are based on natural selection and genetics considering a population’s survival of the fittest. Selection results in GA chromosome selection, crossover, and mutation. For MultiAz-Net, the GA population is a CNN hyperparameter, followed by a fitness evaluation step in which the chromosome is decoded to initialize the ensemble learning process. The scheme for searching the best parameters for MultiAz-Net architecture using the GA with the symbols listed in Table 6.
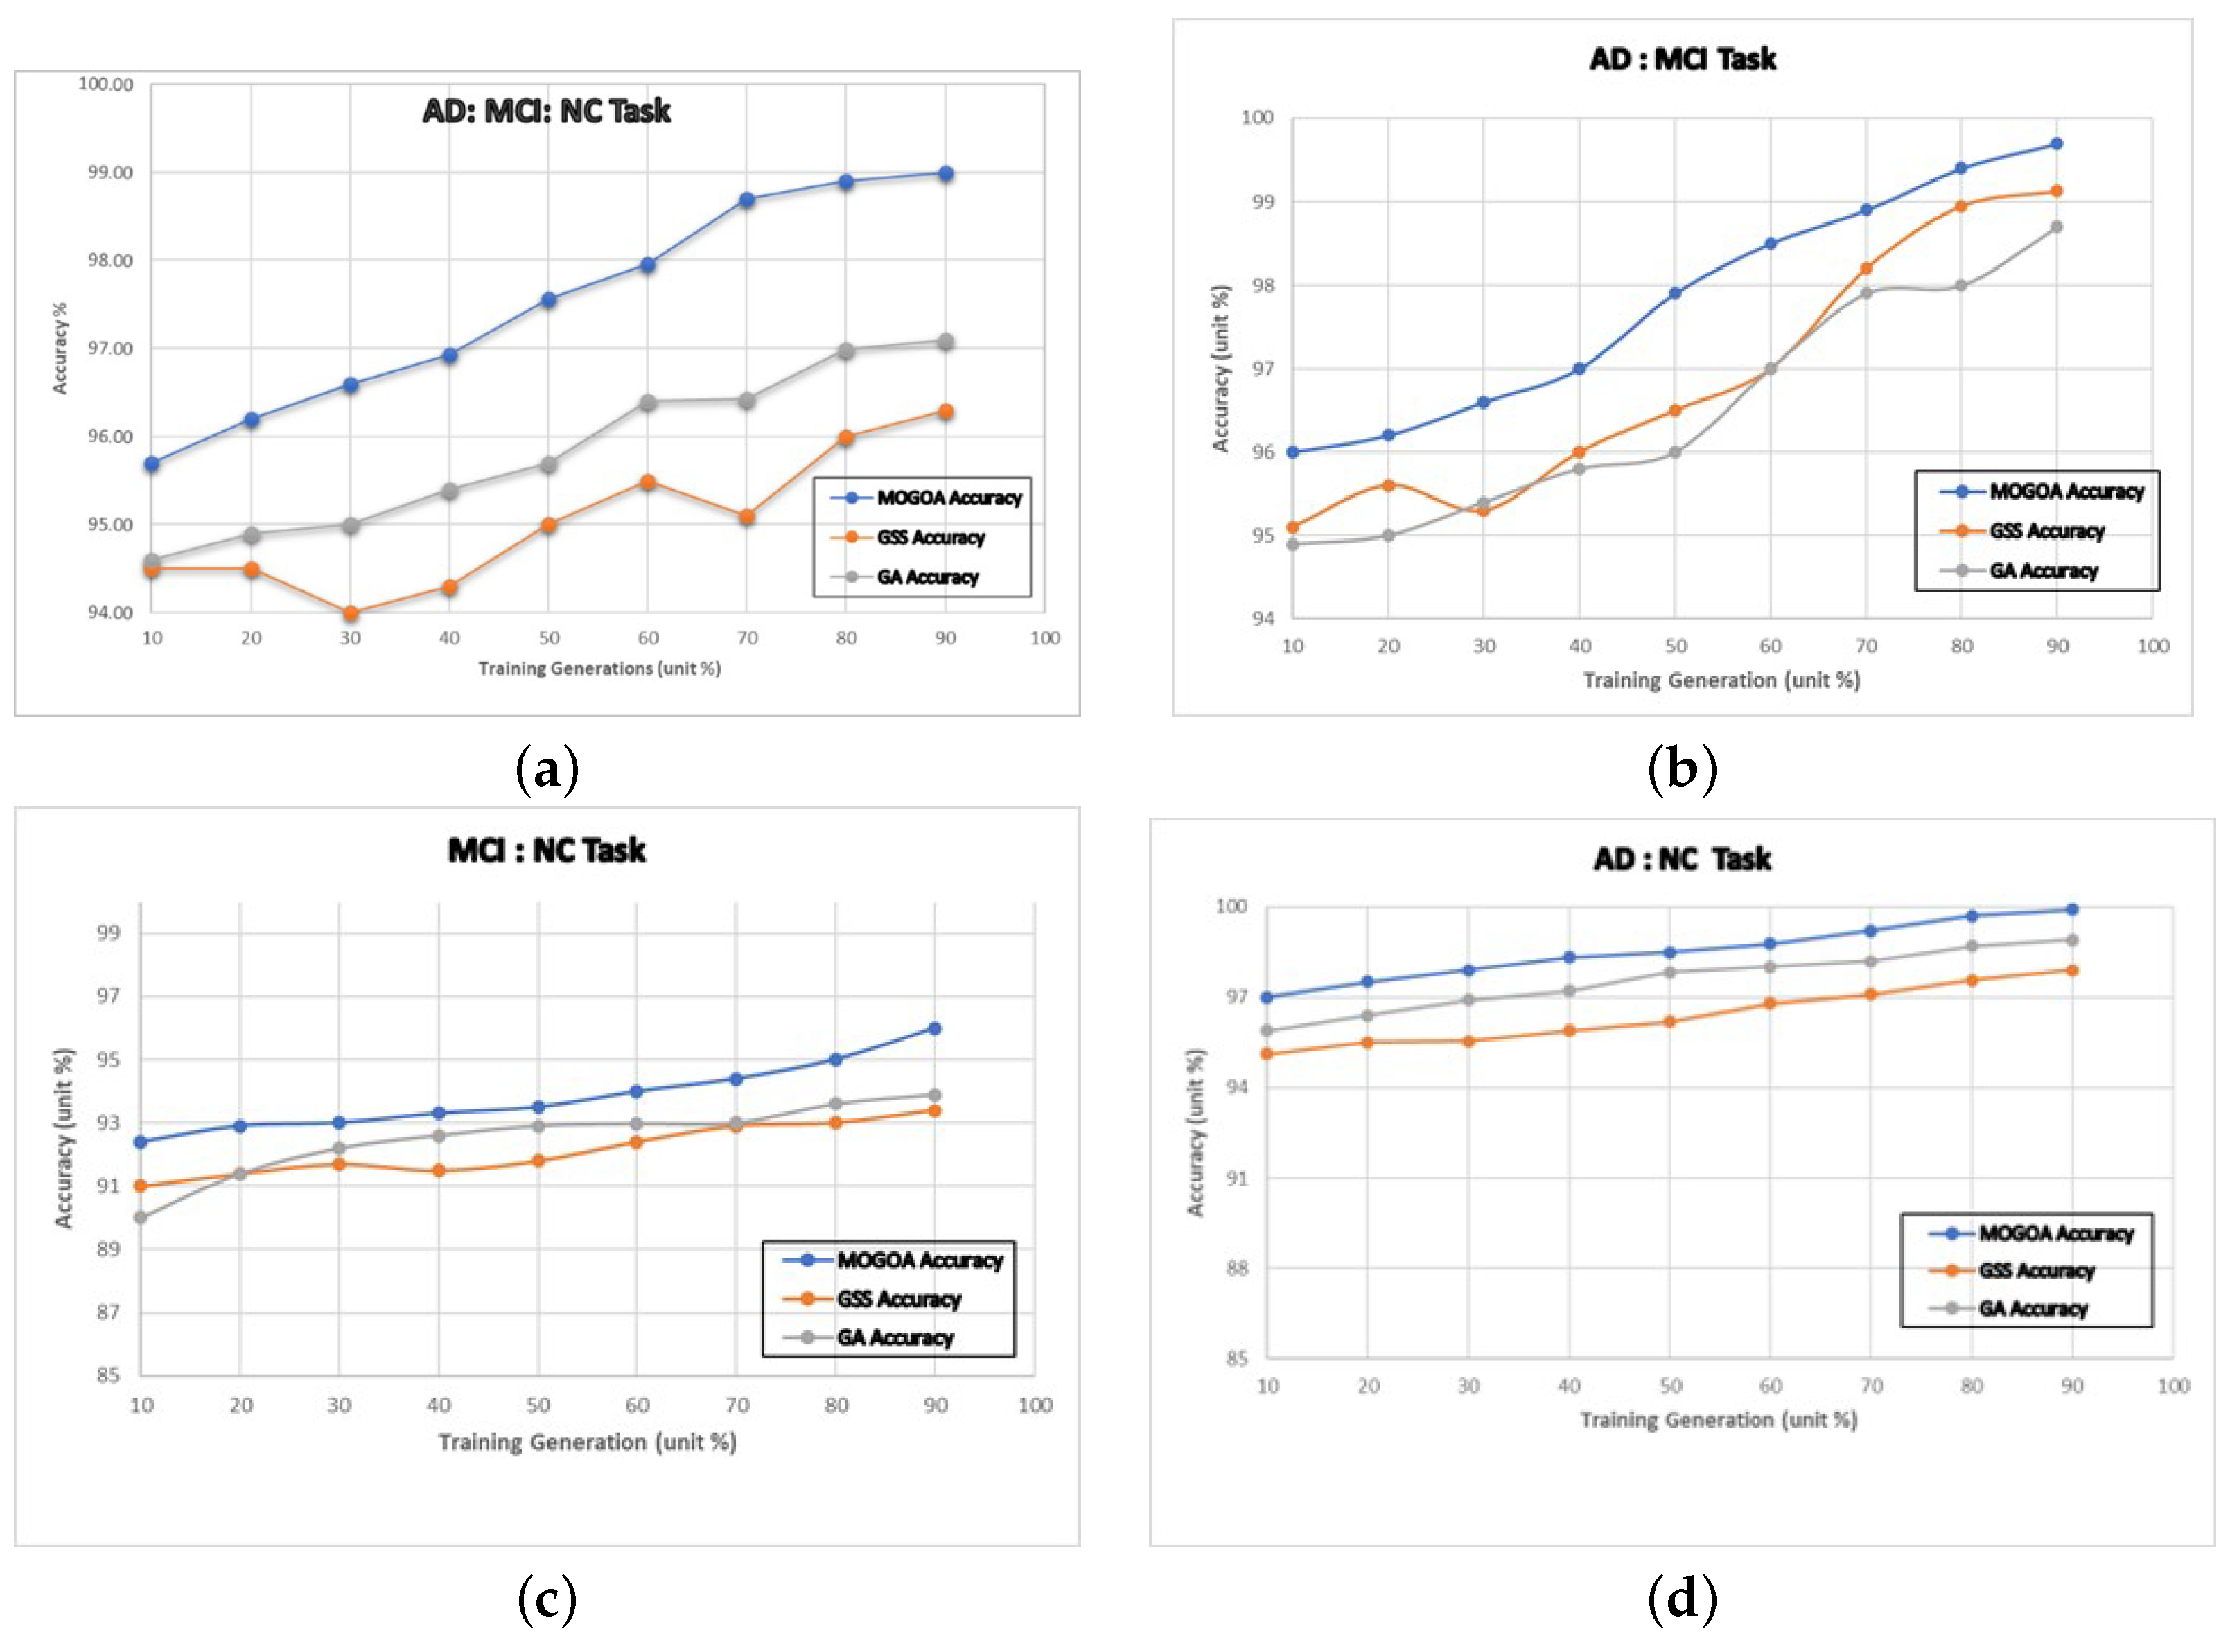
Each algorithm’s classification (GSS, GA, MOGOH) mean accuracy with different modality for the four-classification tasks is recorded, and the statistical results are plotted. On Figure 7, Figure 8 and Figure 9, the horizontal axis represents the training percentage from the original dataset and the vertical axis represents the mean accuracy of the test set.
According to the variation in the percentage of multi-modal images used for training. The mean multi-class and binary-class classification accuracy shown in Figure 7 increases bit by bit. Then, it sharply increases during the training evolution process considering different percentages of the multi-modal fused images, ranging from 10% to 100%. It is observed that the proposed algorithm’s classification accuracy converges at steady state.
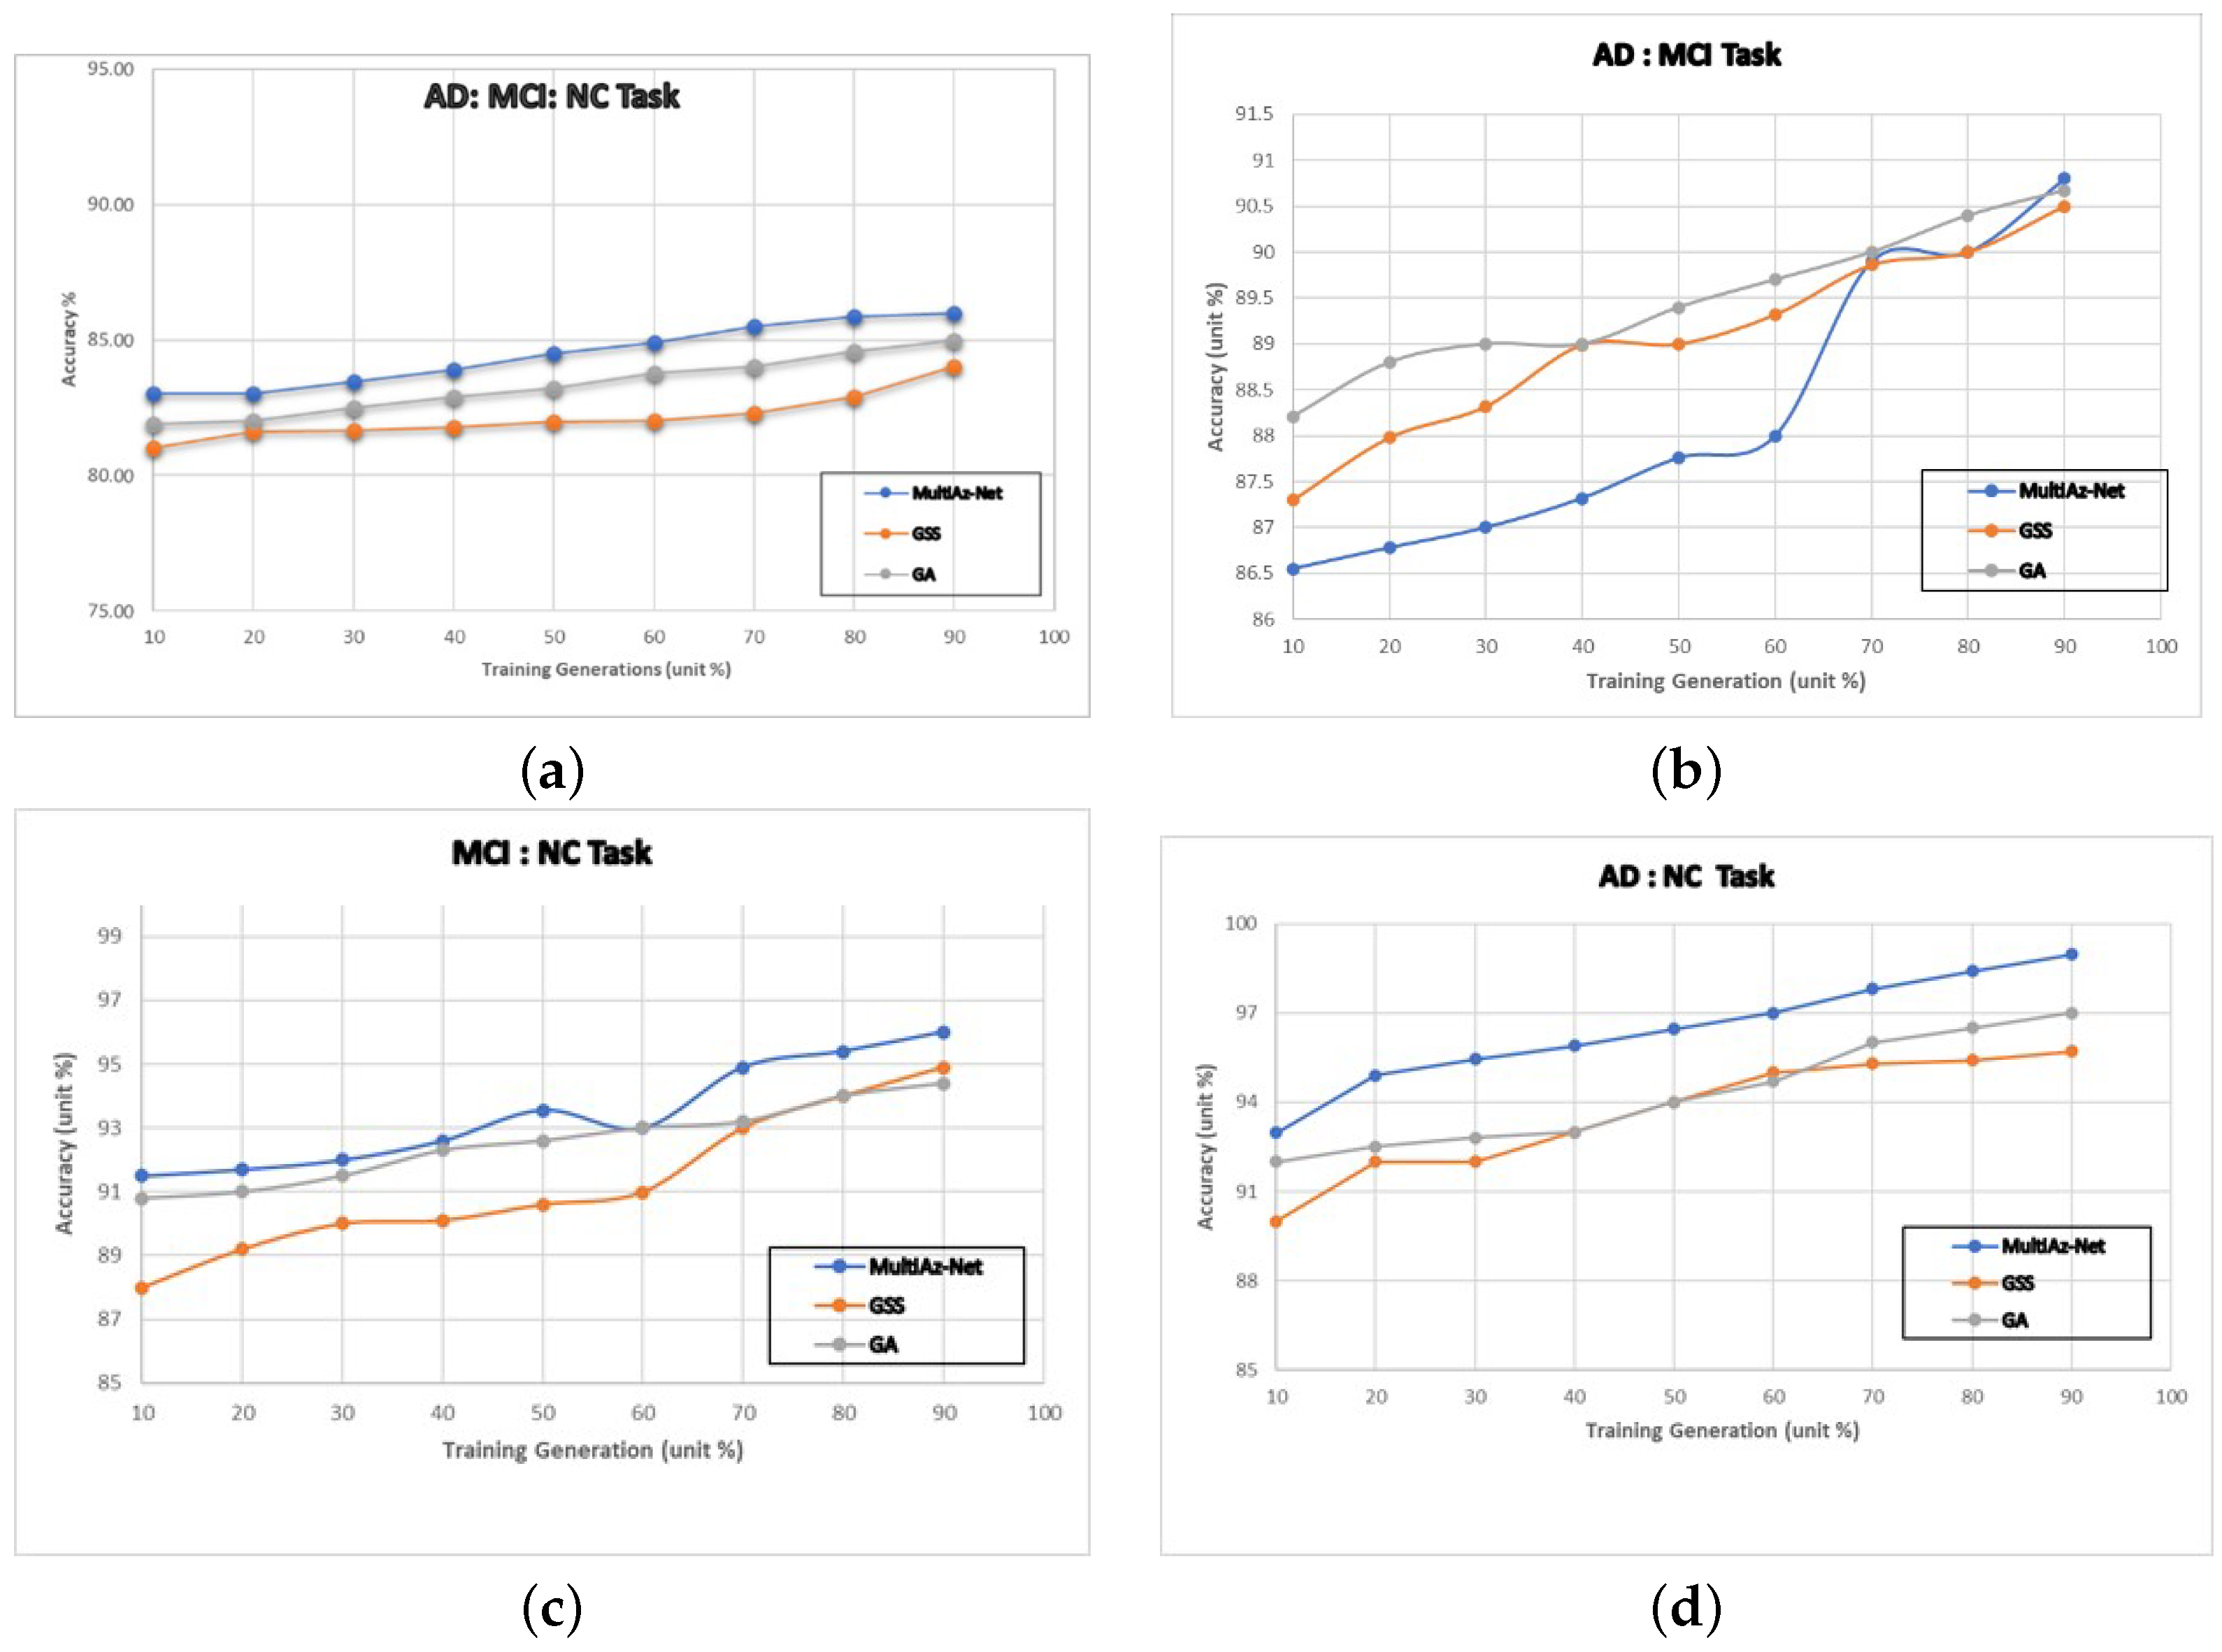
For uni-modal-based classification tasks (Figure 8 and Figure 9), it was clear that our method using a MOGOA-based optimized ensemble outperformed the GSS- and GA-based optimization models. There is a significant improvement in the accuracy of MultiAz-Net considering binary- and three-class classification problems. As compared with the remaining algorithms, the suggested approach performed better for the most challenging scenarios of the MCI: NC classification.
It is evident from Figure 7a that the GAs’ classification accuracy in the first three generations is 94.3%, which is due to the out-of-memory problem preventing the randomly initialized architecture from running. In the fourth generation, the individuals with the out-of-memory architectures will be eliminated from the population due to their non-competitive fitness, and the classification accuracy will steadily increase until the algorithm terminates. In general, MultiAz-Net outperforms two other multi-modal approaches for 3-class classification with an average increase of 2% and 3% in accuracy. The sensitivity was the lowest in the multi-modal fusion approach (88%).
4.3. MultiAz-Net Performance Compared to State-of-the Art
A comparison and evaluation of MultiAz-Net efficiency with state-of-the-art algorithms are presented in this section. Table 7 shows the results of a comparison of the proposed algorithm with peer competitors. A list of the different types of architectures is presented in the first column. In the second column, the details of the architectures are listed. A third column, a fourth column, and a fifth column correspond to the type of training data, the utilization of optimization algorithm, and objective function, respectively. The classification accuracy in the table are taken from published papers and compared with MultiAz-Net implementation. Table 7 shows that the proposed AD diagnosis model outperformed the available multi-modal neuroimaging algorithms with a classification rate of 97.75%. As a result of multiobjective optimization function and the composite single vector neuroimaging input rather than a set of different images, the performance levels of the network with three classifiers are consistent. The findings demonstrate that the deep ensemble model with multi-modal image fusion strategy provided extremely consistent and high levels of accuracy, with the same computational complexity and storage costs as the existing strategy.
5. Discussion
Unlike the multi-input network that is used in case of feature matching, the proposed methodology merges multi-modal images into one aggregate image instead of using multiple input networks. Additionally, it is proposed that pretrained networks can be used with simple modifications to achieve a maximum performance range with minimal effort. Using 1617 neuroimaging data, the developed MultiAz-Net achieved the highest performance levels using a picture fusion approach. This method of fusing multi-modal neuroimaging data can provide more comprehensive information regarding pathology than single-modal imaging. As the white matter is one of the primary areas of interest in AD diagnosis, the proposed fusion approach involves gathering and combining the white matter tissue of brain MRI and FDG-PET within the imaging area to produce a fusion modality shown in Figure 2. In addition, the deep ensemble is demonstrated to complete four Alzheimer’s disease classification tasks, three binary, and one multicategorization. The suggested AD diagnosis method employs a single network as opposed to the multiple-input networks used in feature matching approaches because it combines multimodal picture scanning into a single aggregate image. In addition, the MOGOA method is employed to conduct a multi-objective black-box optimization of network parameters. This led to a significant decrease in the numbers of optimization parameters.
To assess the efficacy of our proposed method, we conducted a number of tests and experiments. Using three different classifiers as shown in Table 2, Table 3, Table 4 and Table 5, this proposed method outperform uni-modal methods, since multi-modal methods included additional and complementary information. In Figure 6 and Figure 7, the average accuracy rates obtained by using the proposed MultiAz-Net are shown. Furthermore, the performance of the MultiAz-Net in all cases was the best. In terms of classification, (PET + MRI) data combined with SVM resulted in a better classification accuracy for (AD: NC) (p = 0.023), (AD: MCI: NC) (p = 0.021), and (AD: MCI ) (p = 0.011). Additionally, PET images demonstrate significant predictive power for (MCI:NC) classified by softmax (p = 0.025 ), as there is no significant difference in accuracy between it and the combined images classified by SVM. It is important to note, however, that the proposed optimized architecture would require high-performance computers to handle high-dimensional input data. In addition, the model’s sensitivity and specificity were not always optimal. In order to address this issue, we plan to utilize masks and ROI indicators such as GM and CSF tissues in conjunction with the existing pre-processing procedures.
As compared with previous research, our method has made great progress in the challenging binary- and multi-class-classification problems (Figure 7, Figure 8 and Figure 9). Furthermore, the optimization network generated satisfactory results that demonstrated that MultiAz-Net had the best overall performance and was extremely adaptable to a wide variety of classification networks. Additionally, our method outperforms grid search and genetic algorithm that use uni-modal and multi-modal learning-based method for the three-class classification problem in almost all cases.
The grid search strategy and genetic algorithm, as some of the most common optimization algorithms, are implemented in the current study. For absolute accuracy, their overall optimization performances for three-class classification assessment ranged between 95.0% and 95.7%, respectively. Despite the simplicity of the GSS strategy, its primary disadvantage is the exponential increase in the number of iterations. Additionally, GA demonstrated the “curse of dimensionality” (also known as “peaking phenomenon”), with an optimal number of generations around 50. Moreover, as shown in Table 6, a GA-based optimization process used a greedy search strategy to alter the order of the output dimensions of convolution layers in ascending order during the mutation operation. This increases the model complexity as the number of populations increases.
A considerable amount of research has been conducted on the classification of data into AD:MCI: NC problems. Different biomarker modalities have been applied to the development of many methods. The accuracy of some of these studies exceeded 85.0% [31]. From Table 7, it has proven more challenging to classify earlier stages of Alzheimer’s disease, with only a handful of studies achieving an accuracy level greater than 87.0%. In most of these studies, there is no optimization process considered, or a single objective optimization function (i.e., accuracy) for deep neural networks was used, which requires extensive training and testing with a great deal of input data. Using multi-modal (MRI only) neuroimaging, Baghdadi et al. [33] achieved 96.25% accuracy for AD: MCI: NC task classification. Kong et al. [31] reported an accuracy of 87.67% when applying 3D-convolution neural networks to 111 AD 129 MCI and 130 NC data. The accuracy of our method was (92.3 ± 5.5)%, considering multimodal MRI and PET images. According to our knowledge, this accuracy level represents the second highest accuracy level out of all the studies published to date, after Baghdadi et al. [33].
Due to its effectiveness in fusing MRI and PET data while optimizing the model hypermeters, the suggested MultiAz-Net is more effective than traditional techniques.
The ensemble network’s computational time complexity can be determined by the number of deep learning architectures used for classification. Therefore, an ensemble network’s complexity is calculated as , where N is the number of networks in the ensemble. Because 3-DNN networks are ensembled in the proposed algorithm, . MOGOA optimization has a computational complexity of , where M is the number of objectives and P is the number of solutions [36]. Consequently, the total computational complexity of the proposed network is . The authors [37] propose a multi-objective evolutionary algorithm (MOEA) based on nondominated sorting, called nondominated sorting genetic algorithm (NSGA-II). The computational complexity is . Therefore, we can conclude that multi-objective optimization is not significantly more complex than conventional multi-objective optimization when a suitable algorithm is applied. Additionally, it is important to note that this study has some limitations. Firstly, we require considerable time to do the pre-processing of our images; however, the parameters of our categorization networks are drastically reduced, since a composite picture is being provided to the networks, rather than a collection of pictures taken from multiple sources. Accordingly, the proposed picture fusion method is equally computationally challenging and storage-intensive as existing methods.
Furthermore, we vectorized the input brain features without considering their spatial information. Additionally, the current study was limited to an adolescent and young adult cohort, which limits its generalizability, since AD was diagnosed earlier. In a subsequent study, we intend to retrain the model using additional data from a larger age group of the population. In addition, our current model only includes PET and MRI data; the performance of our model could be further enhanced by the incorporation of additional neuroimaging data into the model. Finally, we implemented a pre-training ensemble for AZ independently. We intend to incorporate self-training with pre-trained into future studies in order to enhance model robustness and strengthen data augmentation. As an alternative to pre-trained networks based on ensembles, convolutional graph convolutional neural networks may also improve prognostic performance by learning graph-based connectome features more effectively. In addition, although our approach addressed a major challenge associated with medical image analysis, the unlabeled data may not have the same degree of precision as a complete labeled dataset.
6. Conclusions and Future Works
In the current study, a new optimized image fusion methodology that combines MRI and PET images is presented for the diagnosis of AD into three groups of patients (AD, NC, MCI). By combining anatomical and metabolic information about the brain, the fusion modality allows the viewer to focus on the most important aspects of the image. InceptionV3, AlexNet, and ResNet-18 are three DNN networks that are used for two types of classification problems (binary, multi-class). This was done in light of the fact that neuroimaging data of patients are difficult for experts to identify. Each network’s hyperparameters are optimized using a multi-objective optimization algorithm for the AD, NC, and MCI classes. In this way, the network is able to learn the characteristics of the samples that best express AD by reducing the dimensionality of the data within the network. A combination of the selected features is then classified using a softmax, support vector machine (SVM), and random forest (RF) classifiers. A series of experiments is conducted to demonstrate the effectiveness of the proposed method. The development of such methods may prove to be an effective tool for detecting Alzheimer’s disease at an early stage.
Author Contributions
Conceptualization, W.N.I., F.R.P.P. and M.A.S.A.; Formal analysis, W.N.I.; Funding acquisition, M.A.S.A.; Methodology, W.N.I.; Resources, M.A.S.A.; Supervision, M.A.S.A.; Validation, F.R.P.P.; Visualization, W.N.I.; Writing—original draft, W.N.I., F.R.P.P. and M.A.S.A.; Writing—review & editing, F.R.P.P. and M.A.S.A. All authors have read and agreed to the published version of the manuscript.
Funding
This work was supported by the Deanship of Scientific Research, Vice Presidency for Graduate Studies and Scientific Research, King Faisal University, Saudi Arabia [Project No GRANT2,738].
Acknowledgments
This work was supported by the Deanship of Scientific Research, Vice Presidency for Graduate Studies and Scientific Research, King Faisal University, Saudi Arabia [Project No GRANT2,738].
Conflicts of Interest
The authors declare no conflict of interest.
References
- Cunnane, S.; Nugent, S.; Roy, M.; Courchesne-Loyer, A.; Croteau, E.; Tremblay, S.; Castellano, A.; Pifferi, F.; Bocti, C.; Paquet, N.; et al. Brain fuel metabolism, aging, and Alzheimer’s disease. Nutrition 2011, 27, 3–20. [Google Scholar] [CrossRef]
- Schäfer, A.M.; Meyer zu Schwabedissen, H.E.; Grube, M. Expression and function of organic anion transporting polypeptides in the human brain: Physiological and pharmacological implications. Pharmaceutics 2021, 13, 834. [Google Scholar] [CrossRef] [PubMed]
- Valenza, M.; Scuderi, C. How useful are biomarkers for the diagnosis of Alzheimer’s disease and especially for its therapy? Neural Regen. Res. 2022, 17, 2205. [Google Scholar]
- Mansour, H.M.; Fawzy, H.M.; El-Khatib, A.S.; Khattab, M.M. Potential Repositioning of Anti-cancer EGFR Inhibitors in Alzheimer’s Disease: Current Perspectives and Challenging Prospects. Neuroscience 2021, 469, 191–196. [Google Scholar] [CrossRef]
- Hussain, M.; Bird, J.J.; Faria, D.R. A study on cnn transfer learning for image classification. In Proceedings of the UK Workshop on Computational Intelligence, Nottingham, UK, 5–7 September 2018; Springer: Berlin/Heidelberg, Germany, 2018; pp. 191–202. [Google Scholar]
- Ismail, W.N.; Rajeena PP, F.; Ali, M.A. MULTforAD: Multimodal MRI Neuroimaging for Alzheimer’s Disease Detection Based on a 3D Convolution Model. Electronics 2022, 11, 3893. [Google Scholar] [CrossRef]
- Ali, R.; Li, H.; Dillman, J.R.; Altaye, M.; Wang, H.; Parikh, N.A.; He, L. A self-training deep neural network for early prediction of cognitive deficits in very preterm infants using brain functional connectome data. Pediatr. Radiol. 2022, 52, 2227–2240. [Google Scholar] [CrossRef] [PubMed]
- Niu, K.; Guo, J.; Pan, Y.; Gao, X.; Peng, X.; Li, N.; Li, H. Multichannel deep attention neural networks for the classification of autism spectrum disorder using neuroimaging and personal characteristic data. Complexity 2020, 2020, 1357853. [Google Scholar] [CrossRef]
- Hinz, T.; Navarro-Guerrero, N.; Magg, S.; Wermter, S. Speeding up the hyperparameter optimization of deep convolutional neural networks. Int. J. Comput. Intell. Appl. 2018, 17, 1850008. [Google Scholar] [CrossRef]
- Goel, T.; Murugan, R.; Mirjalili, S.; Chakrabartty, D.K. Multi-COVID-Net: Multi-objective optimized network for COVID-19 diagnosis from chest X-ray images. Appl. Soft Comput. 2022, 115, 108250. [Google Scholar] [CrossRef] [PubMed]
- Cuingnet, R.; Gerardin, E.; Tessieras, J.; Auzias, G.; Lehéricy, S.; Habert, M.O.; Chupin, M.; Benali, H.; Colliot, O.; Initiative, A.D.N.; et al. Automatic classification of patients with Alzheimer’s disease from structural MRI: A comparison of ten methods using the ADNI database. Neuroimage 2011, 56, 766–781. [Google Scholar] [CrossRef] [PubMed]
- Agarwal, N.; Sondhi, A.; Chopra, K.; Singh, G. Transfer learning: Survey and classification. In Smart Innovations in Communication and Computational Sciences; Springer: Berlin/Heidelberg, Germany, 2021; pp. 145–155. [Google Scholar]
- Morid, M.A.; Borjali, A.; Del Fiol, G. A scoping review of transfer learning research on medical image analysis using ImageNet. Comput. Biol. Med. 2021, 128, 104115. [Google Scholar] [CrossRef]
- Yang, Y.; Lv, H.; Chen, N. A survey on ensemble learning under the era of deep learning. Artif. Intell. Rev. 2022, 1, 1–45. [Google Scholar] [CrossRef]
- Ali, M.A.; PP, F.R.; Abd Elminaam, D.S. An Efficient Heap Based Optimizer Algorithm for Feature Selection. Mathematics 2022, 10, 2396. [Google Scholar] [CrossRef]
- Ali, M.A.; PP, F.R.; Salama Abd Elminaam, D. A Feature Selection Based on Improved Artificial Hummingbird Algorithm Using Random Opposition-Based Learning for Solving Waste Classification Problem. Mathematics 2022, 10, 2675. [Google Scholar] [CrossRef]
- Mirzaei, G.; Adeli, H. Machine learning techniques for diagnosis of alzheimer disease, mild cognitive disorder, and other types of dementia. Biomed. Signal Process. Control 2022, 72, 103293. [Google Scholar] [CrossRef]
- Islam, J.; Zhang, Y. A novel deep learning based multi-class classification method for Alzheimer’s disease detection using brain MRI data. In Proceedings of the International Conference on Brain Informatics; Springer: Berlin/Heidelberg, Germany, 2017; pp. 213–222. [Google Scholar]
- Zhang, F.; Li, Z.; Zhang, B.; Du, H.; Wang, B.; Zhang, X. Multi-modal deep learning model for auxiliary diagnosis of Alzheimer’s disease. Neurocomputing 2019, 361, 185–195. [Google Scholar] [CrossRef]
- Shanmugam, J.V.; Duraisamy, B.; Simon, B.C.; Bhaskaran, P. Alzheimer’s disease classification using pre-trained deep networks. Biomed. Signal Process. Control 2022, 71, 103217. [Google Scholar] [CrossRef]
- Kong, Z.; Zhang, M.; Zhu, W.; Yi, Y.; Wang, T.; Zhang, B. Multi-modal data Alzheimer’s disease detection based on 3D convolution. Biomed. Signal Process. Control 2022, 75, 103565. [Google Scholar] [CrossRef]
- Orouskhani, M.; Rostamian, S.; Zadeh, F.S.; Shafiei, M.; Orouskhani, Y. Alzheimer’s Disease Detection from Structural MRI Using Conditional Deep Triplet Network. Neurosci. Inform. 2022, 100066. [Google Scholar] [CrossRef]
- Petersen, R.C.; Aisen, P.; Beckett, L.A.; Donohue, M.; Gamst, A.; Harvey, D.J.; Jack, C.; Jagust, W.; Shaw, L.; Toga, A.; et al. Alzheimer’s disease neuroimaging initiative (ADNI): Clinical characterization. Neurology 2010, 74, 201–209. [Google Scholar] [CrossRef] [PubMed]
- Simon, B.C.; Baskar, D.; Jayanthi, V. Alzheimer’s disease classification using deep convolutional neural network. In Proceedings of the IEEE 2019 9th International Conference on Advances in Computing and Communication (ICACC), Online, 6–8 November 2019; pp. 204–208. [Google Scholar]
- Murata, T.; Ishibuchi, H. MOGA: Multi-objective genetic algorithms. In Proceedings of the IEEE International Conference on Evolutionary Computation; IEEE: Piscataway, NJ, USA, 1995; Volume 1, pp. 289–294. [Google Scholar]
- Xia, X.; Xu, C.; Nan, B. Inception-v3 for flower classification. In Proceedings of the IEEE 2017 2nd International Conference on Image, Vision and Computing (ICIVC), Chengdu, China, 2–4 June 2017; pp. 783–787. [Google Scholar]
- Lu, Z.; Whalen, I.; Dhebar, Y.; Deb, K.; Goodman, E.D.; Banzhaf, W.; Boddeti, V.N. Multiobjective evolutionary design of deep convolutional neural networks for image classification. IEEE Trans. Evol. Comput. 2020, 25, 277–291. [Google Scholar] [CrossRef]
- Mirjalili, S.Z.; Mirjalili, S.; Saremi, S.; Faris, H.; Aljarah, I. Grasshopper optimization algorithm for multi-objective optimization problems. Appl. Intell. 2018, 48, 805–820. [Google Scholar] [CrossRef]
- Pontes, F.J.; Amorim, G.; Balestrassi, P.P.; Paiva, A.; Ferreira, J.R. Design of experiments and focused grid search for neural network parameter optimization. Neurocomputing 2016, 186, 22–34. [Google Scholar] [CrossRef]
- Holland, J.H. Genetic algorithms. Sci. Am. 1992, 267, 66–73. [Google Scholar] [CrossRef]
- Zamani, J.; Sadr, A.; Javadi, A.H. Classification of early-MCI patients from healthy controls using evolutionary optimization of graph measures of resting-state fMRI, for the Alzheimer’s disease neuroimaging initiative. PLoS ONE 2022, 17, e0267608. [Google Scholar] [CrossRef] [PubMed]
- Marwa, E.G.; Moustafa, H.E.D.; Khalifa, F.; Khater, H.; AbdElhalim, E. An MRI-based deep learning approach for accurate detection of Alzheimer’s disease. Alex. Eng. J. 2023, 63, 211–221. [Google Scholar]
- Baghdadi, N.A.; Malki, A.; Balaha, H.M.; Badawy, M.; Elhosseini, M. A3C-TL-GTO: Alzheimer Automatic Accurate Classification Using Transfer Learning and Artificial Gorilla Troops Optimizer. Sensors 2022, 22, 4250. [Google Scholar] [CrossRef]
- Tong, T.; Gray, K.; Gao, Q.; Chen, L.; Rueckert, D.; Initiative, A.D.N. Multi-modal classification of Alzheimer’s disease using nonlinear graph fusion. Pattern Recognit. 2017, 63, 171–181. [Google Scholar] [CrossRef]
- Liu, S.; Liu, S.; Cai, W.; Che, H.; Pujol, S.; Kikinis, R.; Feng, D.; Fulham, M.J. Multimodal neuroimaging feature learning for multiclass diagnosis of Alzheimer’s disease. IEEE Trans. Biomed. Eng. 2014, 62, 1132–1140. [Google Scholar] [CrossRef]
- Curry, D.M.; Dagli, C.H. Computational complexity measures for many-objective optimization problems. Procedia Comput. Sci. 2014, 36, 185–191. [Google Scholar] [CrossRef]
- Deb, K.; Pratap, A.; Agarwal, S.; Meyarivan, T. A fast and elitist multiobjective genetic algorithm: NSGA-II. IEEE Trans. Evol. Comput. 2002, 6, 182–197. [Google Scholar] [CrossRef] [Green Version]
Figure 1.
Pipeline Representation of the Proposed MultiAz-Net Architecture.

Figure 2.
Image fusion architecture.

Figure 3.
MRI processing method.

Figure 4.
Flowchart of MOGOA Algorithm Optimization Process.

Figure 5.
Theme statistics in our experiments.

Figure 6.
Confusion matrix for multi-class assessment using MultiAz-Net. (a) Uni-modal MRI; (b) Uni-modal PET; (c) Multi-Modal MRI + PET.
Figure 6.
Confusion matrix for multi-class assessment using MultiAz-Net. (a) Uni-modal MRI; (b) Uni-modal PET; (c) Multi-Modal MRI + PET.

Figure 7.
Performance comparison for classification tasks using multi-modal neuroimaging.

Figure 8.
Performance comparison for classification tasks using MRI neuroimaging.

Figure 9.
Performance comparison for classification tasks using PET neuroimaging.


Table 1.
Overview of the Experiment Parameters.
| Configuration Parameters | Specification | Configuration Parameters | Specification |
|---|---|---|---|
| Multi-modal images | [Yes, No] | Hyperparameters optimizer | MOGOA |
| Data shuffling | Yes (Random) | Dataset training/testing ratio | 70% training to 30% testing |
| Class imbalance | Apply data augmentation [Yes, No]: Rotation, zoom, shift, flip. | Objective function | 3 (i.e., accuracy, sensitivity, specificity) |
| Input image iize | PET: 160 × 160 × 121. MRI: 145 × 172 × 145. | Dimension | 8 |
| Skull-stripping | FLIRT Package | Population | 100 |
| Scaling techniques | Min-Max, normalize, ntandard | Iteration number | 10 |
| Brightness range | [0.5, 2.0] | Epochs number | 7 |
| L2 Regularization rate | [1.3042 ×10⁻⁴–0.9746 × 10⁻⁴] | Learning rate | [0.0923–0.0593] |
| Archive size | 28 | Classifier | SVM softmax, RF |
| Parameters’ lower bound range | [0.2, 0.01, 1.0000 × 10⁻⁴, 0.2, 0.01, 1.0000 ×10⁻⁴, 8] | Pretrained models | InceptionV3, Alexnet, ResNet18 |
| Parameters’ upper bound range | [0.9, 0.1, 2.0000 ×10⁻⁴, 0.9, 0.1, 2.0000 ×10⁻⁴, 64] | Pretrained initialization | Imagenet |
| Optimizer range | PoissonDistribution. Adagrad, AMSgrad, AdaMax, Adadelta, Adam, Delta-bar Delta, Nadam, and RMSprop. | Momentum | [0.5224–0.750] |
Table 2.
Results of different modalities for AD: NC Assessment (UNIT: %).
| Modalities | Task | Softmax | SVM | RF | ||||||
|---|---|---|---|---|---|---|---|---|---|---|
| ACC | SPE | SEN | ACC | SPE | SEN | ACC | SPE | SEN | ||
| MRI | AD: NC | 92.3 ± 0.3 | 89.4 ± 1.2 | 94.5 ± 0.7 | 91.1 ± 4.0 | 91.4 ± 6.1 | 93.0 ± 3.1 | 74.5 ± 9.4 | 69.2 ± 10.7 | 80.32 ± 7.1 |
| PET | 89.8 ± 4.7 | 86.3 ± 12.0 | 91.9 ± 5.5 | 93.6 ± 5.8 | 93.2 ± 4.7 | 94.1 ± 3.3 | 81.2 ± 4.8 | 83.7 ± 2.1 | 79.2 ± 6.1 | |
| MRI + PET | 87.7 ± 3.1 | 85.6 ± 7.8 | 90.0 ± 3 | 94.4 ± 5.5 | 94.0 ± 4.9 | 95.0 ± 4.5 | 92.8 ± 4.0 | 90.6 ± 0.5 | 94.2 ± 3.3 |
Table 3.
Results of different modalities for MCI: NC Assessment(UNIT: %).
| Modalities | Task | Softmax | SVM | RF | ||||||
|---|---|---|---|---|---|---|---|---|---|---|
| ACC | SPE | SEN | ACC | SPE | SEN | ACC | SPE | SEN | ||
| MRI | MCI: NC | 88.0 ± 2.7 | 89.0 | 85.4 ± 7.0 | 90.0 ± 2.7 | 85.0 ± 3.1 | 95.4 ± 2.0 | 89.9 ± 0.7 | 87.0 ± 3.0 | 92 ± 4.9 |
| PET | 93.5 ± 3.1 | 90.5 ± 2.7 | 98.5 ± 1.5 | 92.7 ± 2.2 | 86.6 ± 1.2 | 98.3 ± 1.0 | 92.5 ± 1.73 | 88.5 ± 2.3 | 94.3 ± 1.7 | |
| MRI+ PET | 91.5 ± 1.1 | 89.4 ± 1.0 | 93.6 ± 2.2 | 93.2 ± 0.9 | 89.2 ± 4.0 | 96.0 ± 2.0 | 89.0 ± 3.0 | 88.0 | 91.0 ± 4.5 |
Table 4.
Results of different modalities for AD: MCI Assessment (UNIT: %).
| Modalities | Task | Softmax | SVM | RF | ||||||
|---|---|---|---|---|---|---|---|---|---|---|
| ACC | SPE | SEN | ACC | SPE | SEN | ACC | SPE | SEN | ||
| MRI | AD: MCI | 88.0 ± 0.9 | 86.0 ± 2.1 | 92.3 ± 0.9 | 85.3 | 76.0 ± 3.2 | 90.0 ± 1.2 | 81.0 ± 5.1 | 79.5 ± 5.3 | 82.3 ± 3.2 |
| PET | 80.0 ± 0.1 | 79.0 ± 3.1 | 82.3 ± 6.9 | 84.7 ± 2.2 | 85.0 | 83.3 ± 2.0 | 83.8 ± 3.4 | 81.0 ± 0.8 | 85.5 ± 3.2 | |
| MRI + PET | 89.4 ± 3 | 88.0 | 91.0 ± 2.5 | 90.0 ± 3.9 | 93.3 ± 3.0 | 89.2 ± 6.5 | 83.0 ± 1.0 | 78.2 ± 3.0 | 85.0 ± 5.1 |
Table 5.
Results of different modalities for (AD: NC: MCI) Assessment (UNIT:%).
| Modalities | Task | Softmax | SVM | RF | ||||||
|---|---|---|---|---|---|---|---|---|---|---|
| ACC | SPE | SEN | ACC | SPE | SEN | ACC | SPE | SEN | ||
| MRI | AD: NC: MCI | 75.4 | - | - | 78.0 ± 4.5 | - | - | 71.0 | - | - |
| PET | 73.9 ± 3.2 | - | - | 76.0 | - | - | 75.0 | - | - | |
| MRI + PET | 90.1 ± 3.0 | - | - | 92.3 ± 5.5 | - | - | 89.0 ± 4.8 | - | - |
Table 6.
GA-Algorithm symbols and their descriptions for AD classification.
| Parameter | Purpose | Value |
|---|---|---|
| Block | An initial network topology. | Initial values for AlexNet, InceptionV3, and ResNet-18 network using Imagenet. |
| Gene | Specifies the objective function. | Models’accuracy. |
| Genome | Sequence CNN parameters that can be converted to a new individual following the “crossover” value. | An initial genome is set to (10:15). Standard deviation (0.02, 0.2). |
| Mutation | Redesigning a CNN parameters (gene) based on a new genome. | A greedy strategy to shift the order of convolution layer output dimensions in ascending order (mutation probability is set to 0.003) |
| Population | Collection of CNNs of genomes. | The maximum number of generations is POP <= 100. |
| Fitness | A partition of the population into sets PoP1, …, POPm, such that elements of later sets have higher fitness. | [32; 64; 128; 256], [3; 5; 7], [0:1; 0:2; 0:3; 0:5]. |
Table 7.
Performance comparison of MultiAz-Net and state-of-the art related work. Artificial neural network (ANN). Genetic algorithm (GA). Ant colony optimization algorithm (ACO). Stacked-autoencoder (SAE). Simulated annealing (SA) Particle swarm optimization (PSO). Gorilla troops optimizer (GTO). “√” means exist. “✕” means not exist.
| Ref | AD Detection Methodology | Training Data & Network Hypermeters Selection | Experimental Materials | Classification Accuracy | ||
|---|---|---|---|---|---|---|
| Multi-Modal | Optimized | Objective Function | ||||
| [21] | 3D-CNN | √ | ✕ | N/A | MRI + PET | 93.21% (AD: NC) 86.52% (MCI: NC) 85.63% (AD: MCI) 87.67%(AD: MCI: NC) |
| [31] | A multi-layer perceptron ANN with features learned using GA, ACO, SA, and PSO. | ✕ | √ | Accuracy | Resting-state MRI | GA: 94.3% NSGA2: 94.27% SA: 94.5% ACO: 94% PSO: 94.55 for (MCI: NC) |
| [32] | A shallow CNN architecture. | ✕ | ✕ | N/A | 2D T1-weighted MRI images. | 99.68 (AD: MCI) |
| [19] | Two independent convolutional neural networks. Then the consistency of the output of two convolutional neural networks is judged by the correlation analysis. | √ | ✕ | N/A | Multi-modal medical images | 88.58% (AD: NC: MCI) |
| [22] | A deep triplet network uses a conditional loss. The basic network of this model inspired by VGG16. | ✕ | ✕ | N/A | Multi-modal MRI images | 99.41%.(No Dementia, Very Mild Dementia, Mild-Dementia, and Moderate AD) |
| [33] | A framework comprises CNN, transfer learning (TL), and GTO. | √ | √ | Accuracy | Multi-modal MRI images | 96.65% and 96.25% (AD: NC: MCI) |
| [34] | A nonlinear graph fusion process. | √ | ✕ | N/A | MRI + FDG-PET + CSF and genetic information. | 98.1% (AD: NC) 82.4% (MCI: NC) 77.9%(AD: NC: MCI) |
| 91.4% (AD: MCI) | ||||||
| [35] | An SAE and a softmax logistic regressor. | √ | ✕ | N/A | MRI + PET | 91.4% (AD: NC) 82.1% (MCI: NC) 53.79%(AD: NC: MCI) |
| 75.44% (7.74) (AD: NC) | ||||||
| [6] | 3D-CNN. | √ | ✕ | N/A | Multi-model MRI images | 98.21% (AD: NC) |
| [20] | Ensemble of AlexNet, GoogLeNet, and ResNet-18 models. | ✕ | ✕ | N/A | Multi-modal MRI images | Class-wise (AD, CN, EMCI, LMCI, MCI) with 97.56% 96.19%, 98.63% |
| Proposed method | MultiAz-Net + softmax | √ | √ | Accuracy & Specificity & Sensitivity | MRI + PET | (90.13 ∓ 3.0)% (AD: NC: MCI) |
| MultiAz-Net + SVM | (92.3 ∓ 5.45)% (AD: NC: MCI) | |||||
| MultiAz-Net + RF | (89.0 ∓ 4.83)% (AD: NC: MCI) | |||||
Disclaimer/Publisher’s Note: The statements, opinions and data contained in all publications are solely those of the individual author(s) and contributor(s) and not of MDPI and/or the editor(s). MDPI and/or the editor(s) disclaim responsibility for any injury to people or property resulting from any ideas, methods, instructions or products referred to in the content. |
© 2023 by the authors. Licensee MDPI, Basel, Switzerland. This article is an open access article distributed under the terms and conditions of the Creative Commons Attribution (CC BY) license (https://creativecommons.org/licenses/by/4.0/).
Share and Cite
MDPI and ACS Style
Ismail, W.N.; P. P., F.R.; Ali, M.A.S. A Meta-Heuristic Multi-Objective Optimization Method for Alzheimer’s Disease Detection Based on Multi-Modal Data. Mathematics 2023, 11, 957. https://doi.org/10.3390/math11040957
AMA Style
Ismail WN, P. P. FR, Ali MAS. A Meta-Heuristic Multi-Objective Optimization Method for Alzheimer’s Disease Detection Based on Multi-Modal Data. Mathematics. 2023; 11(4):957. https://doi.org/10.3390/math11040957
Chicago/Turabian StyleIsmail, Walaa N., Fathimathul Rajeena P. P., and Mona A. S. Ali. 2023. "A Meta-Heuristic Multi-Objective Optimization Method for Alzheimer’s Disease Detection Based on Multi-Modal Data" Mathematics 11, no. 4: 957. https://doi.org/10.3390/math11040957
Note that from the first issue of 2016, this journal uses article numbers instead of page numbers. See further details here.