
Understanding the Parameter Influence on Lesion Growth for a Mechanobiology Model of Atherosclerosis

1
Applied Mechanics and Bioengineering, Aragón Institute of Engineering Research (I3A), University of Zaragoza, 50018 Zaragoza, Spain
2
CIBER de Bioingeniería, Biomateriales y Nanomedicina (CIBER-BBN), 50018 Zaragoza, Spain
*
Authors to whom correspondence should be addressed.
Mathematics 2023, 11(4), 829; https://doi.org/10.3390/math11040829
Submission received: 22 December 2022
/
Revised: 31 January 2023
/
Accepted: 2 February 2023
/
Published: 6 February 2023
(This article belongs to the Special Issue Numerical Simulation in Biomechanics and Biomedical Engineering-II)
Abstract
:In this work, we analyse the influence of the parameters of a mathematical model, previously proposed by the authors, for reproducing atheroma plaque in arteries. The model uses Navier–Stokes equations to calculate the blood flow along the lumen in a transient mode. It also uses Darcy’s law, Kedem–Katchalsky equations, and the three-pore model to simulate plasma and substance flows across the endothelium. The behaviours of all substances in the arterial wall are modelled with convection–diffusion–reaction equations, and finally, plaque growth is calculated. We consider a 2D geometry of a carotid artery, but the model can be extrapolated to other geometries or arteries, such as the coronaries or the aorta. A mono-variant sensitivity analysis of the model parameters was performed, with values of and , with respect to the values of the previous model. The results were analysed with respect to the volume in the plaque of foam cells (FC), synthetic smooth muscle cells (SSMC), and collagen fibre. It was observed that the volume in the plaque of the different substances (FC, SSMC, and collagen) has a strong influence on the results, so it could be used to analyse the vulnerability of plaque. The stenosis ratio of the plaque was also analysed, showing a strong influence on the results as well. Parameters that influence all the results considered when ranged are the rate of LDL degradation and the diffusion coefficients of LDL and monocytes in the arterial wall. Furthermore, it was observed that the change in the volume of foam cells in the plaque has a greater influence on the stenosis ratio than the change of synthetic smooth muscle cells or collagen fibre.
1. Introduction
Cardiovascular diseases, including atherosclerosis, are some of the main causes of mortality in developed countries [1]. They consist of the development of atheroma plaque in the arterial wall, which is caused by lipid deposition. This leads to an increase in the thickness of the arterial wall and, therefore, to a decrease in the area where blood flows, called the lumen. In addition, plaque can break and cause a blood clot that can travel through the circulatory system. For these reasons, it can lead to several consequences that are dependent on the artery affected, e.g., myocardial attacks, ischaemia, or ictus, among others.
The process of atheroma plaque formation begins with the deposition of low-density lipoproteins (LDLs) in the arterial wall and, once there, oxidise. Then, monocytes are deposited from the lumen into the arterial wall and differentiate into macrophages, which ingest oxidised LDL. Once they cannot ingest more oxidised LDL, they become foam cells. These foam cells compose the lipid core of the atheroma plaque. Concurrently, at the beginning of the inflammatory process, all muscular cells in the arterial wall are contractile, i.e., they cannot move or react with any other substance. However, due to the presence of cytokines in the arterial wall (segregated by macrophages), these muscle cells change their phenotype and become synthetic smooth muscle cells, which can move and interact with other substances in the arterial wall. Then synthetic smooth muscle cells surround foam cells, macrophages, and oxidised LDL, and segregate collagen fibre to isolate the lipid core, forming the fibrous layer of the plaque [2,3,4].
Therefore, atheroma plaques are developed as a consequence of an increase in endothelial permeability. This variation in permeability was accepted to be due to a change in the shape of endothelial cells, depending on some mechanical stimuli caused by blood flow [5]. These mechanical stimuli could be, among others, the wall shear stress of blood with the endothelium (), time-averaged wall shear stress (), and oscillatory shear index () in a cardiac cycle [6,7], or a combination of some of them [8].
There are some studies in the literature related to the influence of blood hemodynamics on the location of atheroma plaque for patient-specific geometries. Malvè et al. [9] modelled a carotid artery bifurcation and analysed the influence of and on the shape index () of endothelial cells. Sáez et al. [6] analysed on eight different geometries of coronary bifurcations. Alimohammadi et al. [7] analysed , , and a new index that they previously proposed [10], Highly Oscillatory Low Magnitude Shear (HOLMES), in the bifurcation of the abdominal aorta.
Some continuum mathematical models of the development of atherosclerosis have been developed. There is a huge quantity of these models developed as two-dimensional axisymmetric models. Olgac et al. [11] consider the LDL flow from the lumen to the arterial wall with the three-pore model, depending on the , while Tomaso et al. [12] considered the flow of monocytes as well as LDL flow. Calvez et al. [13] used a two-dimensional model which, in addition to LDL and monocytes, also considered macrophages, cytokines, and foam cells. Finally, they modelled the fluid–structure interaction between the mesh displacement due to plaque formation and blood flow. Cilla et al. [4] modelled a two-dimensional axisymmetric geometry with LDL and monocyte flows into the arterial wall depending on and the three-pore model, and the interactions between all the substances commented on before, as well as smooth muscle cells and collagen fibre. In addition, Shahzad et al. [14] studied the influence of hemodynamics in a two-dimensional geometry of an artery bifurcation with an obstacle plaque that disturbs blood flow. They used the fluid–structure interaction (FSI) with an elastic wall and computational fluid dynamics (CFD) considering a rigid wall.
There are also mechanobiological models with patient-specific geometries, such as by Siogkas et al. [15], who consider LDL that becomes oxidised, monocytes that differentiate into macrophages, and cytokines in the arterial wall. Filipovic et al. [16] modelled oxidised LDL, macrophages, and cytokines, depending on the on coronary arteries, and adjusted the parameters of their model in order to obtain results based on experimental data. Hernández-López et al. [8] included also foam cells, smooth muscle cells, and collagen fibre, and analysed the effect of mechanical stimuli on the growth of atheroma plaque in carotid arteries. Kenjereš and De Loor [17] developed a computational model to simulate the flow of LDL through the arterial wall in a realistic geometry of a carotid bifurcation with a multilayered wall.
On the other hand, there are some agent-based models that study plaque development in the arteries [18,19,20]. The main advantage of continuum models against agent-based models is that they allow the simulation of plaque development in real geometries, whereas the advantage of agent-based models is that they can take into account the random behaviour of cells, which is not possible with continuum models. Olivares et al. [18] developed a model for early-stage atherosclerosis, in which they considered substances such as LDL, oxidised LDL, macrophage, foam cells, smooth muscle cells, endothelial cells, and autoantibodies. Bhui and Hayenga [19] developed a three-dimensional model of transendothelial migration during atherogenesis, in which they modelled endothelial cells, monocyte, macrophage, lymphocyte, neutrophil, and foam cells. In addition, Corti et al. [20] modelled atheroma plaque growth depending on in three-dimensional geometry. They considered a multilayered wall, composed of the intima, media, and adventitia layers, modelling also the internal and external elastic laminae.
There is a large number of substances and parameters involved in the process of formation of atheroma plaque, so it is important to understand how each substance and parameter influences plaque growth.
There are also some studies focused on parameter influence in previous related models, such as Tomaso et al. [12], who analysed the influence of different LDL concentrations in blood to determine how it affects plaque growth. Olivares et al. [18] analysed, in 8 cases, the influence in the plaque of the oxidation rate of LDL, migration speed of agents, and auto-antibodies maximum concentration. Cilla et al. [21] analysed the effect of transmural transport properties on atheroma plaque formation, attending to LDL and oxidised LDL diffusion coefficient anisotropy. Finally, Corti et al. [20] made both, mono-parametric and multi-parametric sensitivity analyses to evaluate the changes in their results caused by changes in the parameters of an agent-based model of plaque growth.
The aim of this study is to analyse the influence of the parameters of a previous computational model on the formation of atheroma plaque in the arteries [8], to determine the effect of these parameters on the growth and composition of atheroma plaque.
The mathematical model used has a total of 52 parameters, which come from different studies and can be related to experimental or computational analysis. Among the experimental ones, there are some differences between the analysis conditions. For example, some of the parameters have been determined from in vitro tests, while others are from in vivo tests. Moreover, they come from studies of different species and arteries (coronary, carotid, or aorta). Finally, some of them have been estimated based on computational results. Therefore, the values of the parameters can have a large variation, so it is relevant to perform a sensitivity analysis of the parameters of the model.
Although the study of parameter variation was performed in a geometry of a carotid artery, the influence of the parameters in the model would be the same in the case of other arteries or geometries.
2. Geometry
Due to the high computational requirements of the model and because the objective of this study was to analyse the influences of the different parameters on plaque growth, a 2D axisymmetric approximation was considered enough for this study.
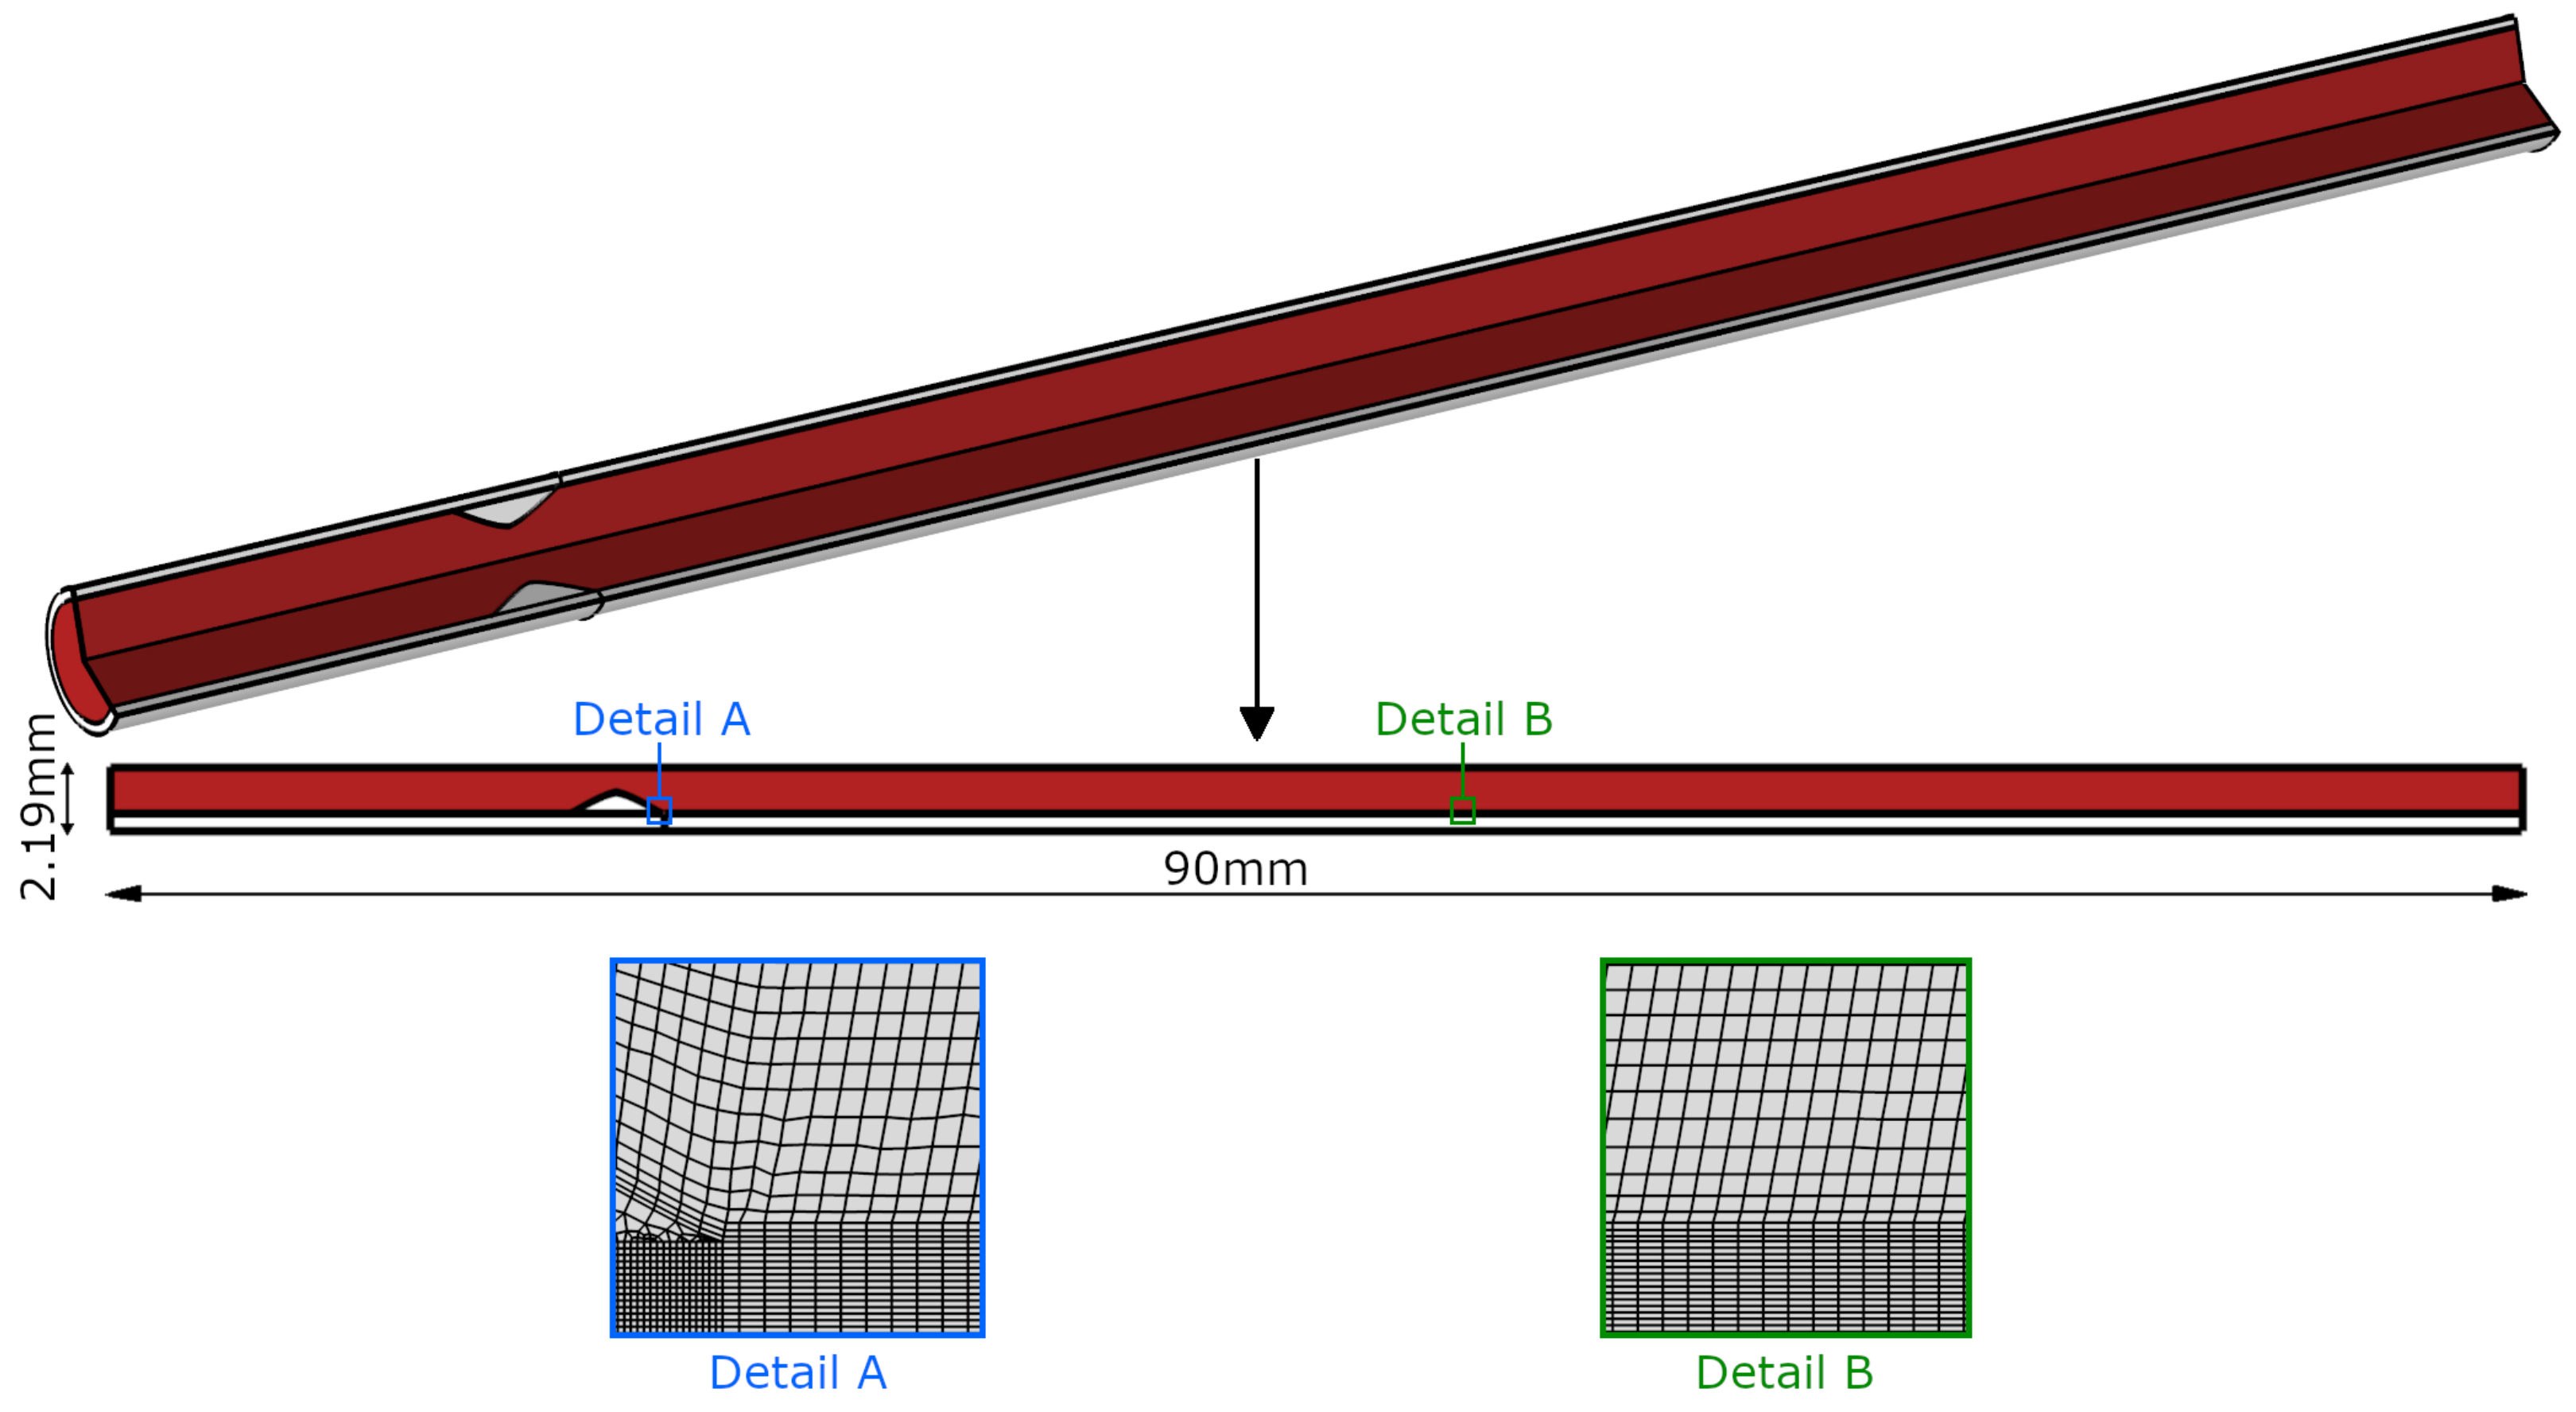
The geometry was developed based on that of Olgac et al. [11] as it reproduces the mechanical stimuli to which real patients are subjected, leading to the appearance of plaque ( and ). The geometry was adapted to carotid arteries by modifying the diameter and thickness of the vessel to the corresponding values for carotid arteries: 3.63 mm and 0.7 mm, respectively [22]. Figure 1 shows the geometry, which is composed of the lumen and the arterial wall, considered a monolayer. It also has an obstacle plaque that disturbs blood flow, causing low and high downstream and favouring the appearance of a new plaque in that area. It is a phenomenon that was observed in real patients [23,24]. This second plaque is the one that is going to be analysed.
The model was discretised using the finite element method. A sensitivity analysis of the length of the geometry and the mesh was developed, obtaining that the minimal length of the artery to ensure a fully developed blood flow is 90 mm. The domains of the model were meshed using quadrilateral elements, with three boundary layers in the lumen near the endothelium. A sensitivity analysis of the mesh was performed in both lumen and arterial wall meshes, in order to determine the most suitable mesh to solve the model with minimal computational costs, but without affecting the results. The total number of elements is equal to 36,731 for the lumen and 36,036 for the arterial wall, resulting in a total number of elements in the geometry of 72,767. A discretisation with P1-P1 elements was made for the calculation of blood flow. Therefore, linear interpolation was considered for both the velocity and pressure of blood flow in the lumen of the artery. To perform the sensitivity analysis of the mesh, a coarse mesh was selected in the first place and progressively refined, until the results obtained did not vary more than . The same procedure was done with the number of boundary layers of the lumen mesh. In addition, linear and quadratic serendipity elements were used for the inflammatory process in the arterial wall and for plasma flow through the endothelium and the growth of the plaque, respectively. Two details of the selected mesh are shown in Figure 1. The solution to the transient problems was obtained using the Backwards differentiation formula (BDF) method, which is implicit, following Newton’s method for nonlinear problems.
The total number of degrees of freedom of the lumen can be determined by multiplying the components of the velocity of blood and the number of elements in the lumen mesh. For the case of the arterial wall, the number of degrees of freedom would be equal to the multiplication of the components of the plasma flow velocity, the number of substance concentrations that we calculate and the number of elements of the arterial wall mesh.
3. Mathematical Model
In this section, the mathematical model is described, showing the equations in different subsections, referring to blood flow in the lumen, plasma flow across the endothelium, the inflammatory process in the arterial wall, and plaque growth.
3.1. Blood Flow in the Lumen
Blood flow along the arterial lumen is considered laminar due to the Reynolds number in the arteries under physiological conditions ( for the mean diameter of the considered artery) [25]. Furthermore, blood is modelled as a Newtonian incompressible fluid, since the diameter of the lumen in the arteries is greater than 0.5 mm [26,27]. Moreover, it is modelled as a homogeneous fluid due to the small size of the particles with respect to the lumen diameter of the arteries [25].
The Navier–Stokes and continuity equations govern blood flow along the lumen:
where subscripts b and l refer to blood and lumen, respectively. The parameters and are, respectively, the density and dynamic viscosity of blood, while and are the velocity and pressure of blood flow. is the internal force of blood, which is negligible compared to the friction of blood flow with the arterial wall. All parameters referring to blood flow along the lumen are in Table 1.
Blood flow is modelled in a transient step. An analysis of the number of cardiac cycles needed to model blood flow was performed, determining that three cardiac cycles are enough to develop blood flow in the lumen.
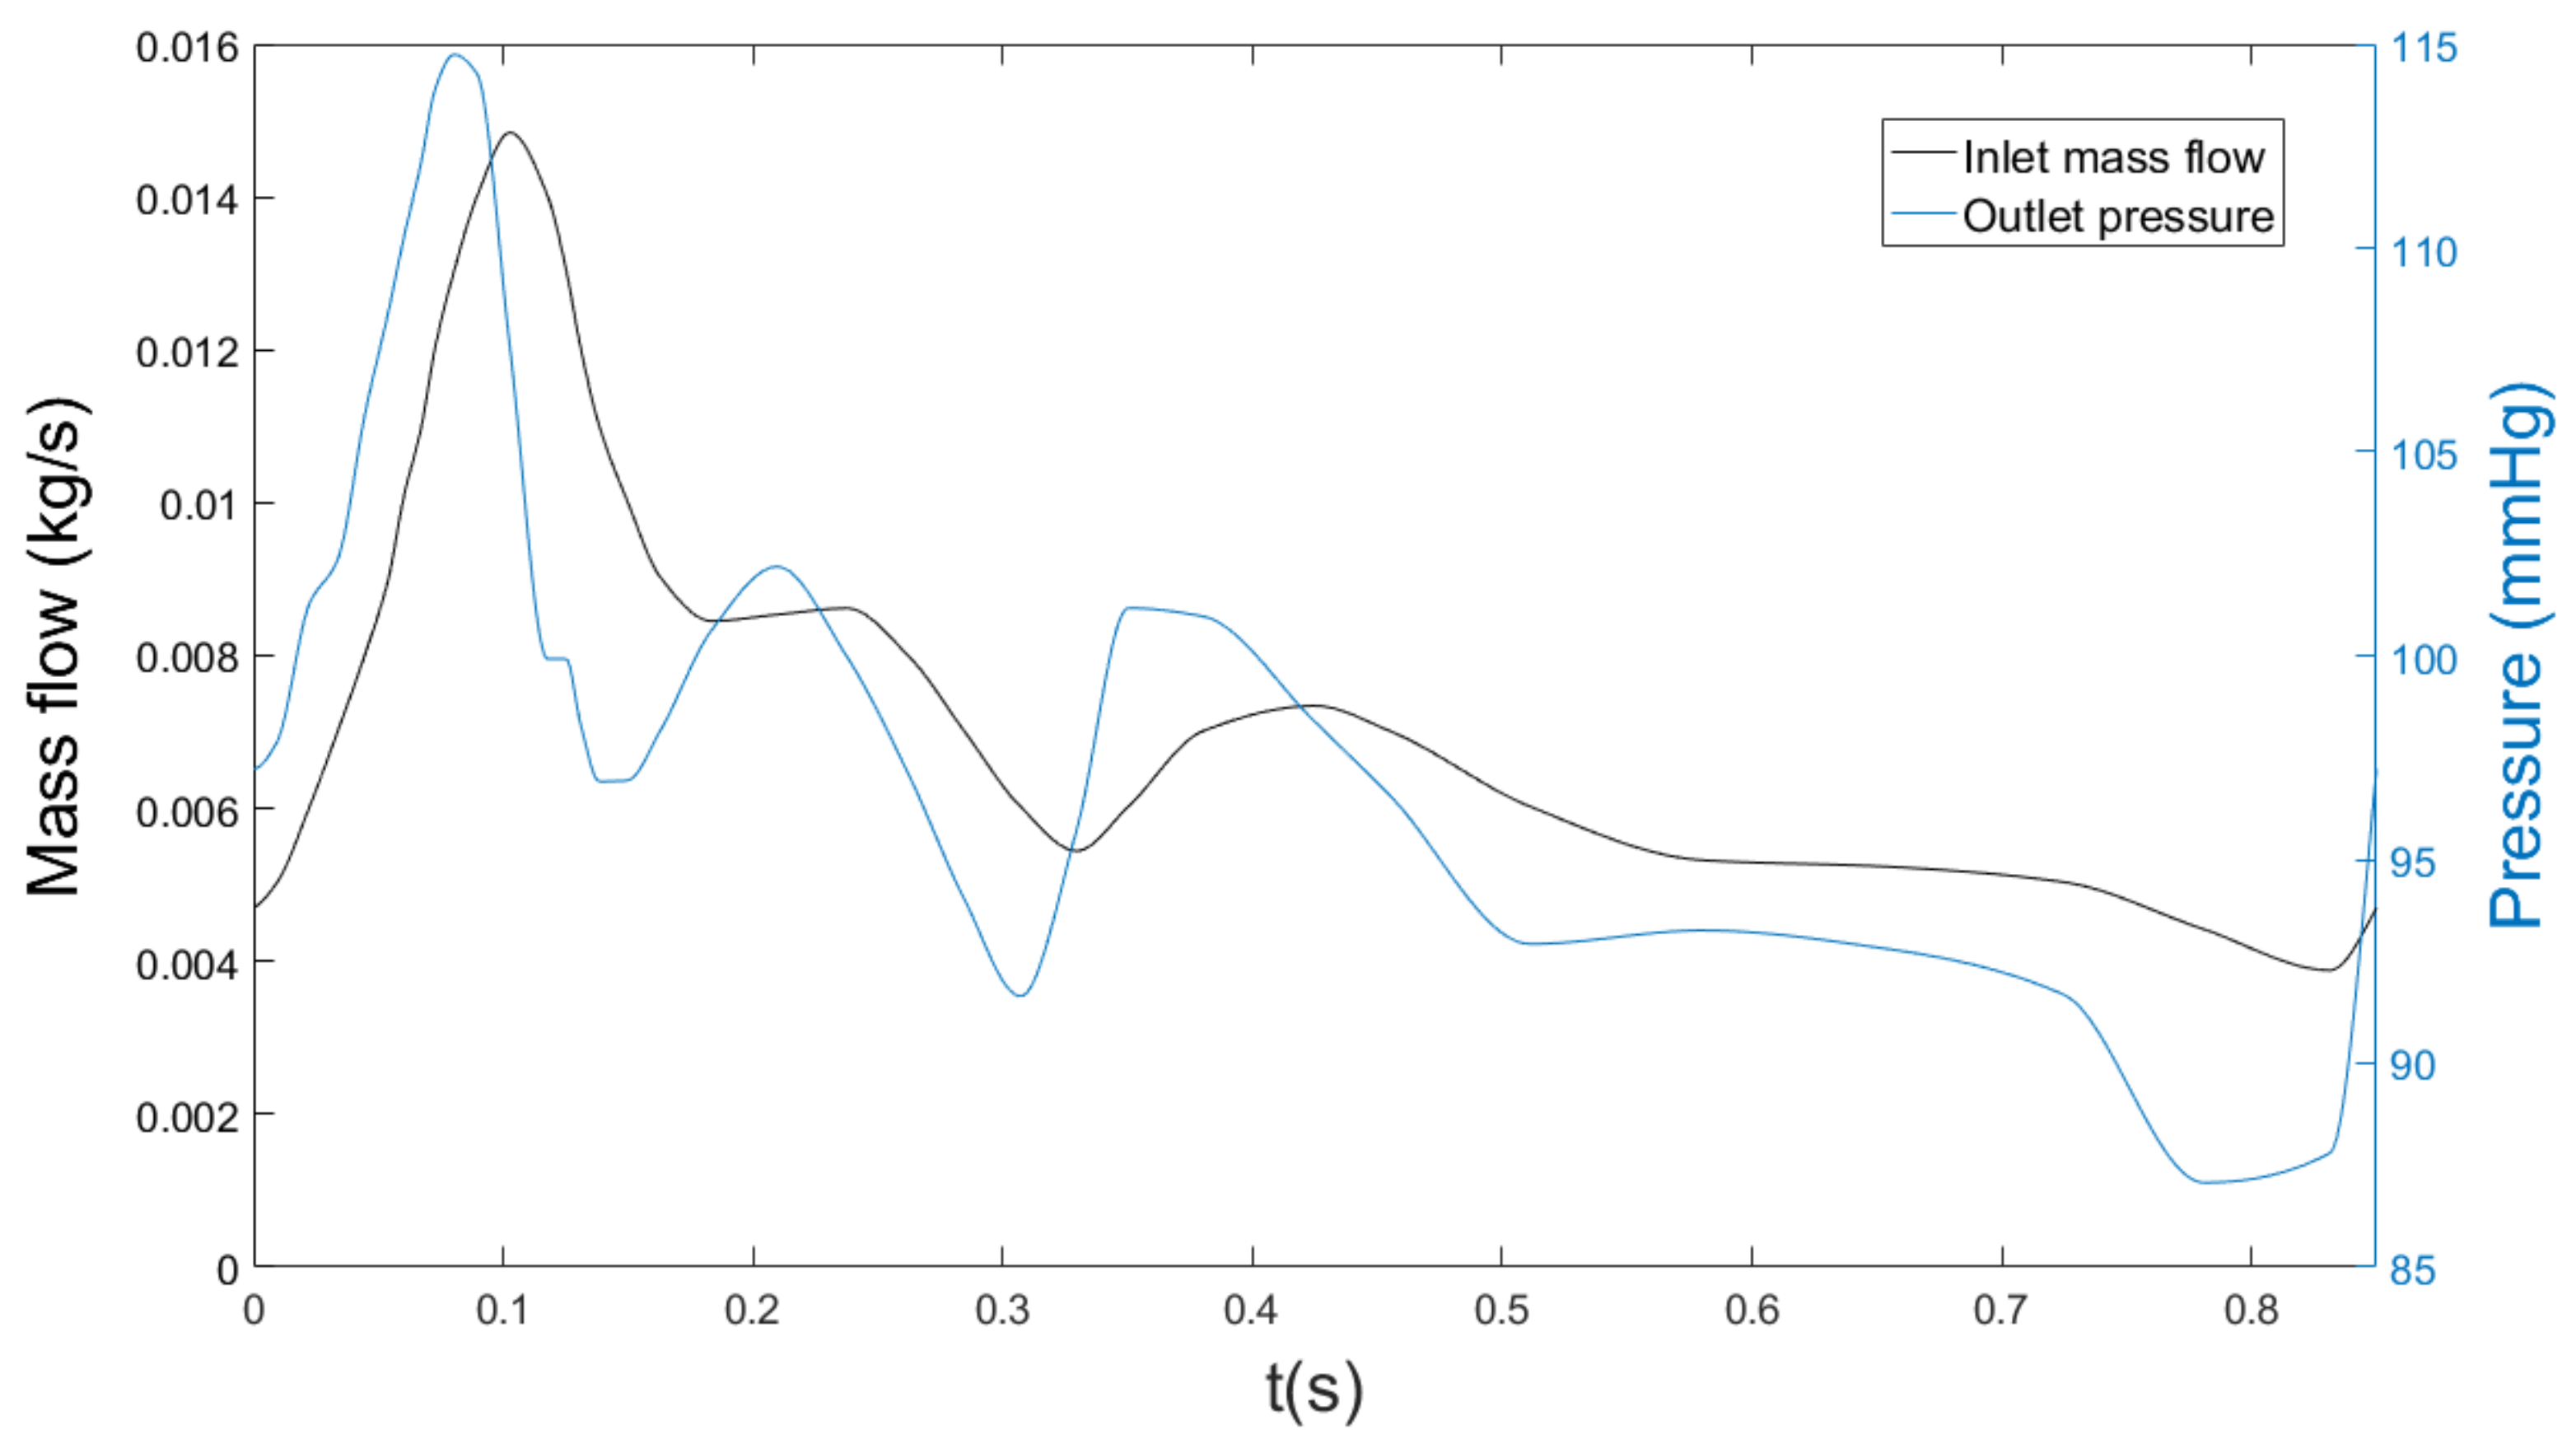
Transient mass flow and pressure are imposed, respectively, at the inlet and outlet of the geometry as boundary conditions [25], as can be seen in Figure 2. These boundary conditions influence the location and size of the generated plaque as they directly affect the recirculation that the obstacle plaque produces downstream. Therefore, they directly affect the mechanical stimuli that initiate plaque growth. For example, when increasing the inlet mass flow, the recirculation is bigger and, therefore, the areas with the mechanical stimuli that initiate plaque growth move to the end of the geometry. Finally, a no-slip condition is imposed at the endothelium.
3.2. Plasma Flow across the Endothelium
As a result of the porous nature of the arterial wall, plasma can enter the bloodstream, causing a plasma flow through the endothelium. Plasma flow across the arterial wall is modelled with Darcy’s law and continuity equations [11,29,30,31,32,33]. Darcy’s law relates the velocity of the plasma flow with the pressure drop in the arterial wall and considers some parameters related to the porous nature of the arterial wall (permeability and porosity).
Parameters related to the arterial wall are , , , and , and represent the velocity of the plasma flow, the permeability and porosity of the arterial wall, and the pressure gradient, respectively. and are the dynamic viscosity and density of the plasma. Finally, is the plasma flow across the endothelium, which is calculated with the Kedem–Katchalsky equations [34] and the three-pore model [11]:
As can be seen in Equation (5), the three-pore model considers three different types of plasma flow through the endothelium: plasma flow through normal junctions (), leaky junctions (), and vesicular pathways (). Nevertheless, vesicular transport is intended for molecular transport, so plasma flow is negligible, relative to that across normal and leaky junctions.
Plasma flow through normal and vesicular pathways can be defined as:
and depend on the considered artery and are the hydraulic conductivity of normal and leaky junctions [35], while is the pressure drop across the endothelium, which depends on the intraluminal pressure [35]. Finally, is the endothelial fraction occupied by leaky cells [36,37,38].
The hydraulic conductivity of leaky junctions can be calculated as [38,39]:
with being the fraction of the total area occupied by leaky junctions, and being the hydraulic conductivity of a single leaky junction. To determine these parameters, we considered that leaky cells are enclosed by leaky junctions, which have ring shapes and are randomly distributed with a distance equal to , being of the permeability of a leaky junction. Moreover, the spaces between endothelial cells are cylindrical [38,39]. Therefore, can be calculated as:
where is the total area occupied by leaky junctions, and is the area of a single leaky junction that can be calculated, assuming reduced thickness, as:
where is the radius of endothelial cells and is the half-width of a leaky junction [36,38,39].
Combining Equations (9)–(11), the fraction of area occupied by leaky junctions can be rewritten as (12):
The ratio is known to be a function of some mechanical stimuli, such as the wall shear stress (), the time-averaged wall shear stress (), and the oscillation shear index () [40]. As blood flow is modelled in transient mode, was not considered due to its changes according to the cardiac cycle. Instead of , was defined. This variable takes into account the tangential stresses that blood produces in the endothelium during a cardiac cycle and that causes changes in the shape index of the endothelial cells. Therefore, in areas with low , endothelial cells will be rounder, allowing plasma and substances to flow between their pores [16,40,41,42]:
where T is the period of a cardiac cycle and the magnitude of dependent on time. On the other hand, high values of imply that blood is highly oscillatory there. Thus, the tangential stresses of blood flow in the endothelium are also oscillatory and, due to their variation, they cause a change in the shape index of the endothelial cells, making them rounder and allowing the flow of plasma and substances through the endothelium, being areas of high considered as atheroprones [8,40]. is defined as:
Moreover, the ratio , , and are related by experimental correlations [6,7,8,11,40]. The first correlation is a parameter named shape index (), which can be calculated as:
where and correspond to a single endothelial cell.
To determine the behaviour of endothelial cells with and , we proposed in a previous work [8] a numerical correlation based on the experimental results of Levesque et al. [40].
The total number of mitotic cells () in the endothelium depends on the [43], so the next experimental correlation was developed, with a unit area of 0.64 mm:
Finally, the number of leaky cells () and mitotic cells () is correlated by the following empirical equation [11,44]:
On the other hand, can be defined as the ratio between the area of leaky cells and the total area of cells. It can be calculated as:
considering equal to the unit area in all the experimental correlations before (0.64 mm). By calculating blood flow in the model, it is now possible to determine and therefore .
Finally, the hydraulic conductivity of a single leaky junction, , is defined according to Olgac et al. [11]:
where and are, respectively, the width and the length of a leaky junction.
So, the plasma flow across the endothelium is completely defined, and the parameters needed to calculate it are shown in Table 2.
The boundary conditions of the plasma flow across the endothelium are the normal velocity of the plasma flow (), which has already been defined, and the pressure in the adventitia, which [11] must be defined. Both an increase in the normal velocity of the plasma flow and a decrease in pressure at the adventitia would produce an increase in plasma flow, which will also cause an increase in substances flow, with the consequent increase in plaque size [8].
3.3. Inflammatory Process in the Arterial Wall
There are many substances involved in the inflammatory process of the arterial wall. In the model, we consider molecules, such as low-density lipoproteins (LDL) and oxidised LDL (oxLDL). We also consider cells, such as monocytes (m), macrophages (M), foam cells (FC), and contractile and synthetic smooth muscle cells (CSMC and SSMC). We also model cytokines (C) and collagen fibre (Cg).
All of these substances can have convection and diffusion and interact with the others, so the inflammatory process of the arterial wall can be described with convection–diffusion–reaction equations.
In addition, the flow of substances across the arterial wall can be defined as:
where , , and are the diffusion coefficient of the considered substance, its concentration and its convection velocity in the arterial wall. Due to the structure of the arterial wall, the diffusion is anisotropic, as the longitudinal diffusion is 3 times higher than radial diffusion [39].
At the beginning of the process, in the healthy artery, all muscle cells in the arterial wall are contractile. Thus, the only substance that has an initial concentration in the arterial wall is CSMC.
A high level of LDL concentration in blood is considered, according to a pathological model ( [47], which corresponds to ). Moreover, we impose a physiological monocyte inlet concentration in the lumen of [48]. An increase in both inlet concentrations would cause an increase in the growth of the resultant plaque.
3.3.1. LDL
Once the LDL molecules cross the endothelial barrier, they can suffer both convection and diffusion, because of their small sizes. When an LDL molecule enters the arterial wall, it is oxidised. Therefore, the reactive term of LDL molecules represents their oxidation.
is the degradation ratio of LDL in the arterial wall and is its concentration at each time.
It is necessary to define as a boundary condition the LDL concentration in the adventitia () [49]. The Kedem–Katchalsky equation is used to determine the LDL flow across the endothelium [11]:
where is the LDL concentration in blood and is the amount of LDL molecules that are deposited from the lumen to the arterial wall. Finally, is the apparent permeability of the arterial wall. LDL can flow from the lumen to the arterial wall through normal and leaky junctions and vesicular pathways, so the apparent permeability of the arterial wall is composed of three types of permeabilities [50,51]:
with , , and being the permeabilities of normal and leaky junctions and vesicular pathways, respectively.
The transport of molecules through the endothelium is dependent on the size of the particles. For the case of LDL, which has a radius of 11 nm [50]), transport across normal junctions is not possible due to their small size. Therefore, LDL transport through the endothelium can only occur through leaky junctions and vesicular pathways [52].
In addition, LDL transport through vesicular pathways is of the flux through leaky junctions [11]:
The apparent permeability of leaky junctions can be defined as:
where , , and are the diffusive permeabilities of the leaky junctions, factors of reduction of the LDL concentration gradient at the inlet of the flow and the solvent-drag coefficient of leaky junctions. So, the LDL flux across the endothelium can be written as:
The diffusive permeability of leaky junctions is defined as:
where is the difference between the total area of endothelial cells and the area of cells separated by leaky junctions:
with being the ratio between the radius of an LDL molecule () and the half-width of a leaky junction ():
is the permeability of a single leaky junction, and can be determined by knowing the LDL diffusion coefficient in a leaky junction () and the length of a leaky junction ():
LDL diffusion coefficient in a leaky junction is related to the LDL diffusion coefficient by [11]:
On the other hand, depends on a modified Péclet number:
This modified Péclet number can be defined as:
Finally, the solvent-drag coefficient of leaky junctions is given by [11]:
3.3.2. Oxidised LDL
Once LDL is oxidised, it is considered to not experience convection [4]. However, due to its similar size to LDL, oxidised LDL shows diffusion in the arterial wall. Once LDL enters the arterial wall, it becomes oxidised, so one of its reactive terms refers to this oxidation. On the other hand, oxidised LDL is phagocytosed by macrophages, which corresponds to its second reactive term.
where and are the oxidised LDL and macrophage concentrations in the arterial wall. In addition, is a ratio of the quantity of oxidised LDL that a macrophage can ingest.
3.3.3. Monocytes
Due to their sizes, we hypothesise that monocytes do not have convection, but they experience diffusion in the arterial wall. Once monocytes are in the arterial wall, they differentiate into macrophages, and also, they suffer apoptosis. These two phenomena are represented by their reactive terms.
where is the monocyte concentration in the arterial wall. is the rate of monocytes that differentiate into macrophages and is the apoptosis rate of monocytes.
In addition, a physiological monocyte inlet concentration in the lumen of is imposed [48].
Monocyte flow through the endothelium is dependent on hemodynamics. Areas of low are known to be atheroprone; particularly for carotid arteries, areas of lower than 2 Pa can develop atheroma plaque [16,41,42]. For the case of , according to our previous work [8], it can be determined that areas of greater than 0.1910 are atheroprones. Monocyte flow across the endothelium can be defined as [8]:
with being the monocyte recruitments from the lumen.
3.3.4. Macrophages
Similar to monocytes, we hypothesise that macrophages experience diffusion but not convection. Once monocytes are in the arterial wall, they differentiate into macrophages. Furthermore, macrophage phagocytes oxidised LDL, and once they cannot ingest a greater amount of oxidised LDL, they suffer apoptosis and become foam cells. These two phenomena are represented in the macrophage reactive terms:
In Equation (39), is the constant rate of oxidised LDL uptaken by macrophages, and is the maximum amount of oxidised LDL that a single macrophage must ingest to transform into a foam cell.
3.3.5. Cytokines
Due to their sizes, cytokines do not have convection. In addition, they are enclosed by macrophages, so they do not have diffusion either. Cytokines in the arterial wall are segregated by macrophages and also experience degradation, phenomena that can be seen in their reactive terms:
where is cytokine concentration in the arterial wall. and are, respectively, the ratios of production and degradation of cytokines.
3.3.6. Contractile Smooth Muscle Cells
They have neither convection nor diffusion because of their large size. At the beginning of the process, all smooth muscle cells of the arterial wall have a contractile phenotype. Then, due to the presence of cytokines, they experience a change of phenotype into synthetic smooth muscle cells, which is represented in their reactive term:
is CSMC concentration in the arterial wall. is the CSMC differentiation rate into SSMC and is the maximum cytokine concentration allowed in the arterial wall. Finally, is a constant for the saturation equation.
3.3.7. Synthetic Smooth Muscle Cells
Equal to CSMC and because of their sizes, SSMCs neither have convection nor diffusion. CSMCs change their phenotypes into SSMCs due to the presence of cytokines in the arterial wall. They also experience proliferation and apoptosis. These three phenomena are represented in their reactive terms:
represents the SSMC concentration in the arterial wall. In addition, is the SSMC proliferation rate and is the SSMC apoptosis rate.
3.3.8. Foam Cells
Due to their large sizes, foam cells neither have convection nor diffusion. Once a macrophage cannot ingest a greater quantity of oxidised LDL, it becomes a foam cell, which is represented in the reactive term of foam cells:
3.3.9. Collagen Fibre
Collagen fibre do not experience convection or diffusion because they are composed of many molecules. Collagen fibre experience segregation by SSMC, which can be seen in its reactive term.
where is collagen concentration in the arterial wall, and is its secretion rate due to plaque formation. Natural segregation and degradation of collagen in the arterial wall were not considered, as they occur in healthy areas of the arterial wall, not related to plaque generation.
Table 3 contains all the parameters to calculate the inflammatory process in the arterial wall.
3.4. Plaque Growth
Finally, with Equation (45), it is possible to calculate the growth of plaque in the arterial wall. We consider plaque to be composed of a lipid nucleus of foam cells and a fibrous layer of synthetic smooth muscle cells and collagen fibre. Therefore, considering the isotropic growth of plaque, it is possible to determine the change in volume in the arterial wall due to plaque appearance:
where is the variation of concentration with respect to the initial concentration of the considered substance. and are the volumes of a foam cell and a synthetic smooth muscle cell, respectively. Finally, is the collagen density.
To calculate the volume of foam cells, they have been approximated as spherical geometries, while synthetic smooth muscle cells are modelled as ellipsoids, so their volumes can be calculated with Equations (46) and (47).
with and being foam cells and the synthetic smooth muscle cell radius, and being the lengths of synthetic smooth muscle cells. Parameters for calculating plaque growth in the arterial wall are given in Table 4.
4. Numerical Methods
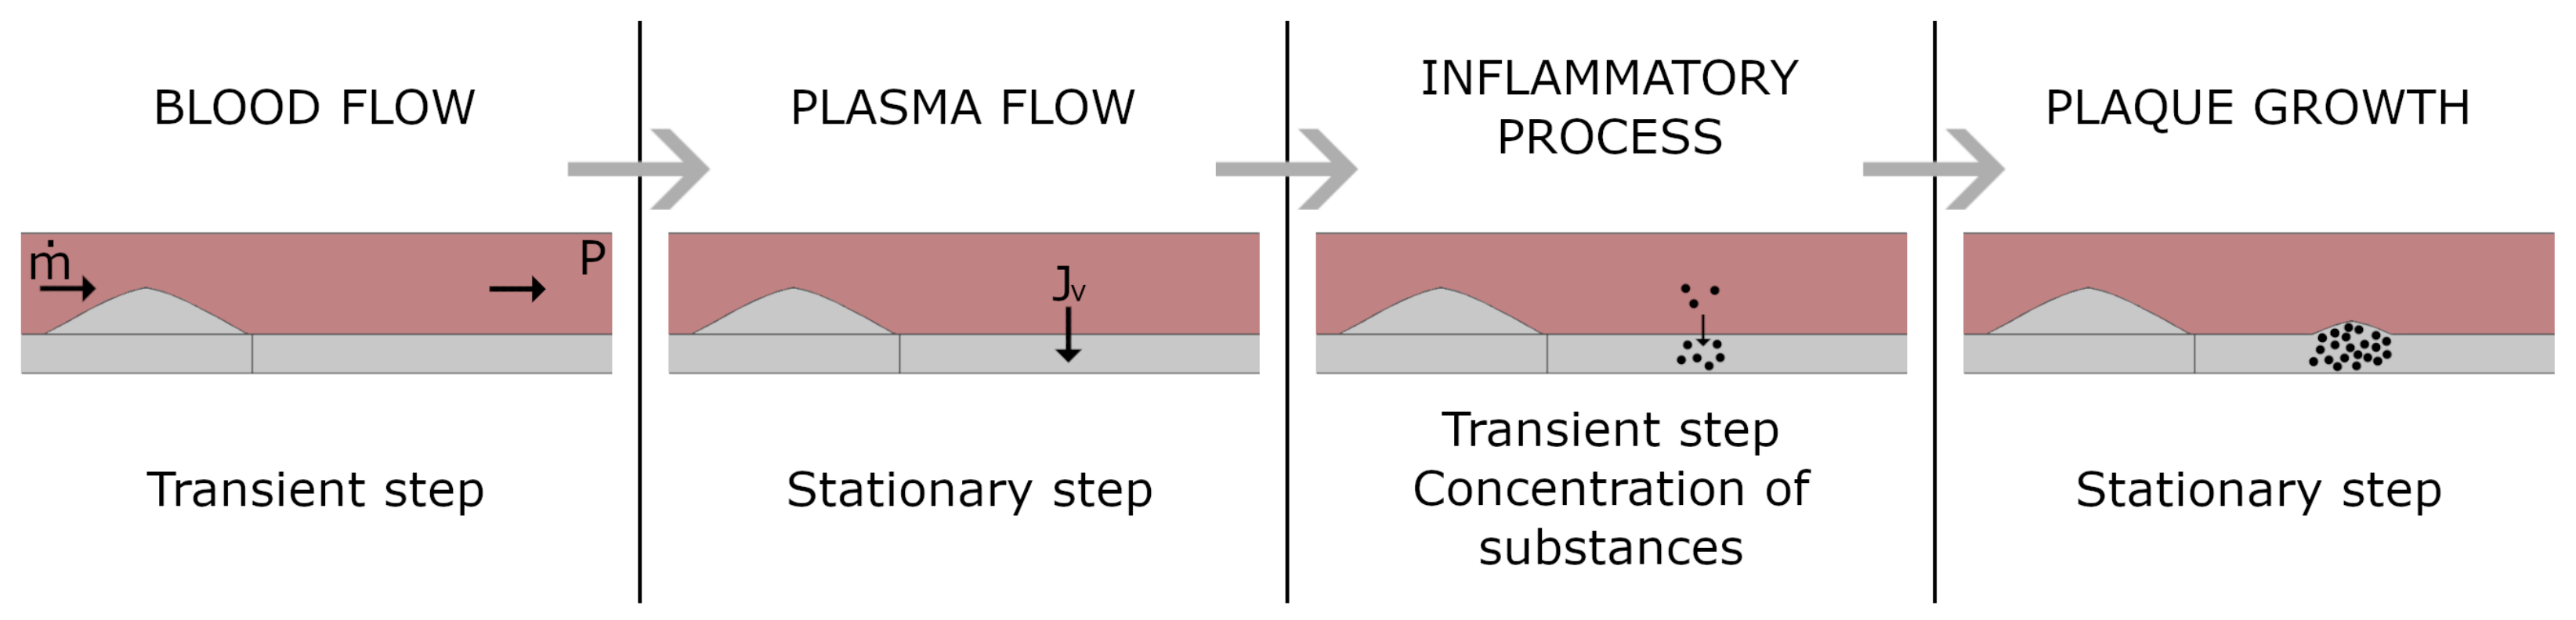
The software COMSOL Multiphysics (COMSOL AB, Burlington, MA, USA) was used to computationally solve the model. It was modelled using four consecutive steps, which can be seen in Figure 3. In the first step, three cardiac cycles and hemodynamic stimuli were calculated in a transient step, determining the values of and for the third cardiac cycle. Then, in the second step, which is stationary, the plasma flow through the endothelium is calculated. In the third step, the inflammatory process is calculated in a transient mode, determining the concentrations of all substances in the arterial wall for a total of 30 years. Finally, a last stationary step was developed to calculate the growth of the plaque, knowing the concentrations of all substances for a period of 30 years.
A direct solver (multi-frontal massively parallel sparse direct solver, MUMPS) was used to calculate transient blood flow along the lumen, as well as plasma flow across the endothelium, the inflammatory process in the arterial wall, and plaque growth. The inflammatory process was calculated iteratively, using groups of segregated steps for the different substances.
5. Sensitivity Analysis
As can be seen in Section 3, the computational model has a large number of parameters that can affect the composition and growth of the plaque. There is a wide range of values of these parameters in the literature that also come from studies under different conditions, such as in vivo or in vitro experiments, or different species or arteries. Therefore, a sensitivity analysis can help to understand the role of every parameter in the generated plaque.
The objective of this study is to analyse plaque growth and its composition. To do so, a previous selection of the parameters to analyse was made. Therefore, geometric parameters, initial concentrations, material properties, flow properties, and other factors that are well known have not been considered in the analysis because their influence on the model seems to be clear (for example, an increase in the radius of foam cells would result in an increase in the stenosis ratio due to an increase in the volume of the plaque). Thus, in this study, only the parameters related to the reactive terms of the convection–diffusion–reaction equations of the inflammatory process are analysed, as well as the diffusion coefficients of substances in the arterial wall.
Table 5 contains all the parameters whose variation was analysed and their descriptions. The analysed parameters have been increased and reduced by 25 % and 10 % in 61 different simulations in a mono-variant sensitivity analysis. The values of the parameters for the case of ± 10% variation are included in Table 5, as an example:
The percentage change in the volume of the plaque due to each of the substances involved in its growth (foam cells that compose the lipidic core of the plaque, and synthetic smooth muscle cells and collagen fibre, which correspond to the fibrous layer of the plaque) was analysed, as well as the variation in the stenosis ratio, which is defined as:
6. Results
Table 6 and Table 7 show the results obtained by increasing and decreasing the selected parameters by 25% and 10%, respectively.
The first column of Table 6 and Table 7 represents the parameter whose influence is being analysed. The second, third, and fourth double columns are, respectively, changes in the volume of foam cells, synthetic smooth muscle cells, and collagen fibre in the plaque, caused by the considered parameter variation. Finally, the last double column is the change in the stenosis ratio of the artery due to the change in the considered parameter.
As can be seen in Table 6 and Table 7, the trend of the results is the same in the cases of variation of 25% and 10% parameters variation. Therefore, the results will be discussed only with reference to the 10% variation table (Table 7), and can be extrapolated for the 25% variation table (Table 6).
As can be seen in Table 6 and Table 7, the variation of the substance was limited to a maximum of 100%. Therefore, in cases where the variation in the percentage of a substance was greater than 100%, the stenosis ratio was not calculated.
As can be seen in Table 7, an increase in the diffusion parameters, , , , , , and causes a decrease in the stenosis ratio produced by the plaque. In contrast, an increase in , , , , , , and induces an increase in it. In addition, there are some parameters of the model that have more influence on the results than others, and their variation causes a change greater than 100% in the volume of any of the substances in the plaque.
When considering the parameters that influence the change in the volume of foam cells in the plaque (Table 7), these are, in order of influence, , , and , which are related to foam cells, LDL, and the diffusion properties of substances in the arterial wall, respectively. As can be seen, none of the variations produces a change in the volume of foam cells greater than 100%.
The parameters that cause a higher change in the volume of synthetic smooth muscle cells are, in order of influence: , , , , , , , and , when increased (the first four produce a change greater than 100%). When their values decrease, the most influential are, in order: , , , , , , , , and , the first six of which cause changes greater than 100%. Therefore, for the change in the volume of synthetic smooth muscle cells volume in the plaque, the parameters , , , , , , and have huge influences, regardless if their values are increased or decreased.
For the case of the influence on volume change due to SSMC, , , , , , and have a great influence on the results obtained.
For the variation of collagen volume in the plaque, the most influential parameters are, when increased: , , , , , and , while when decreased: , , , , , and .
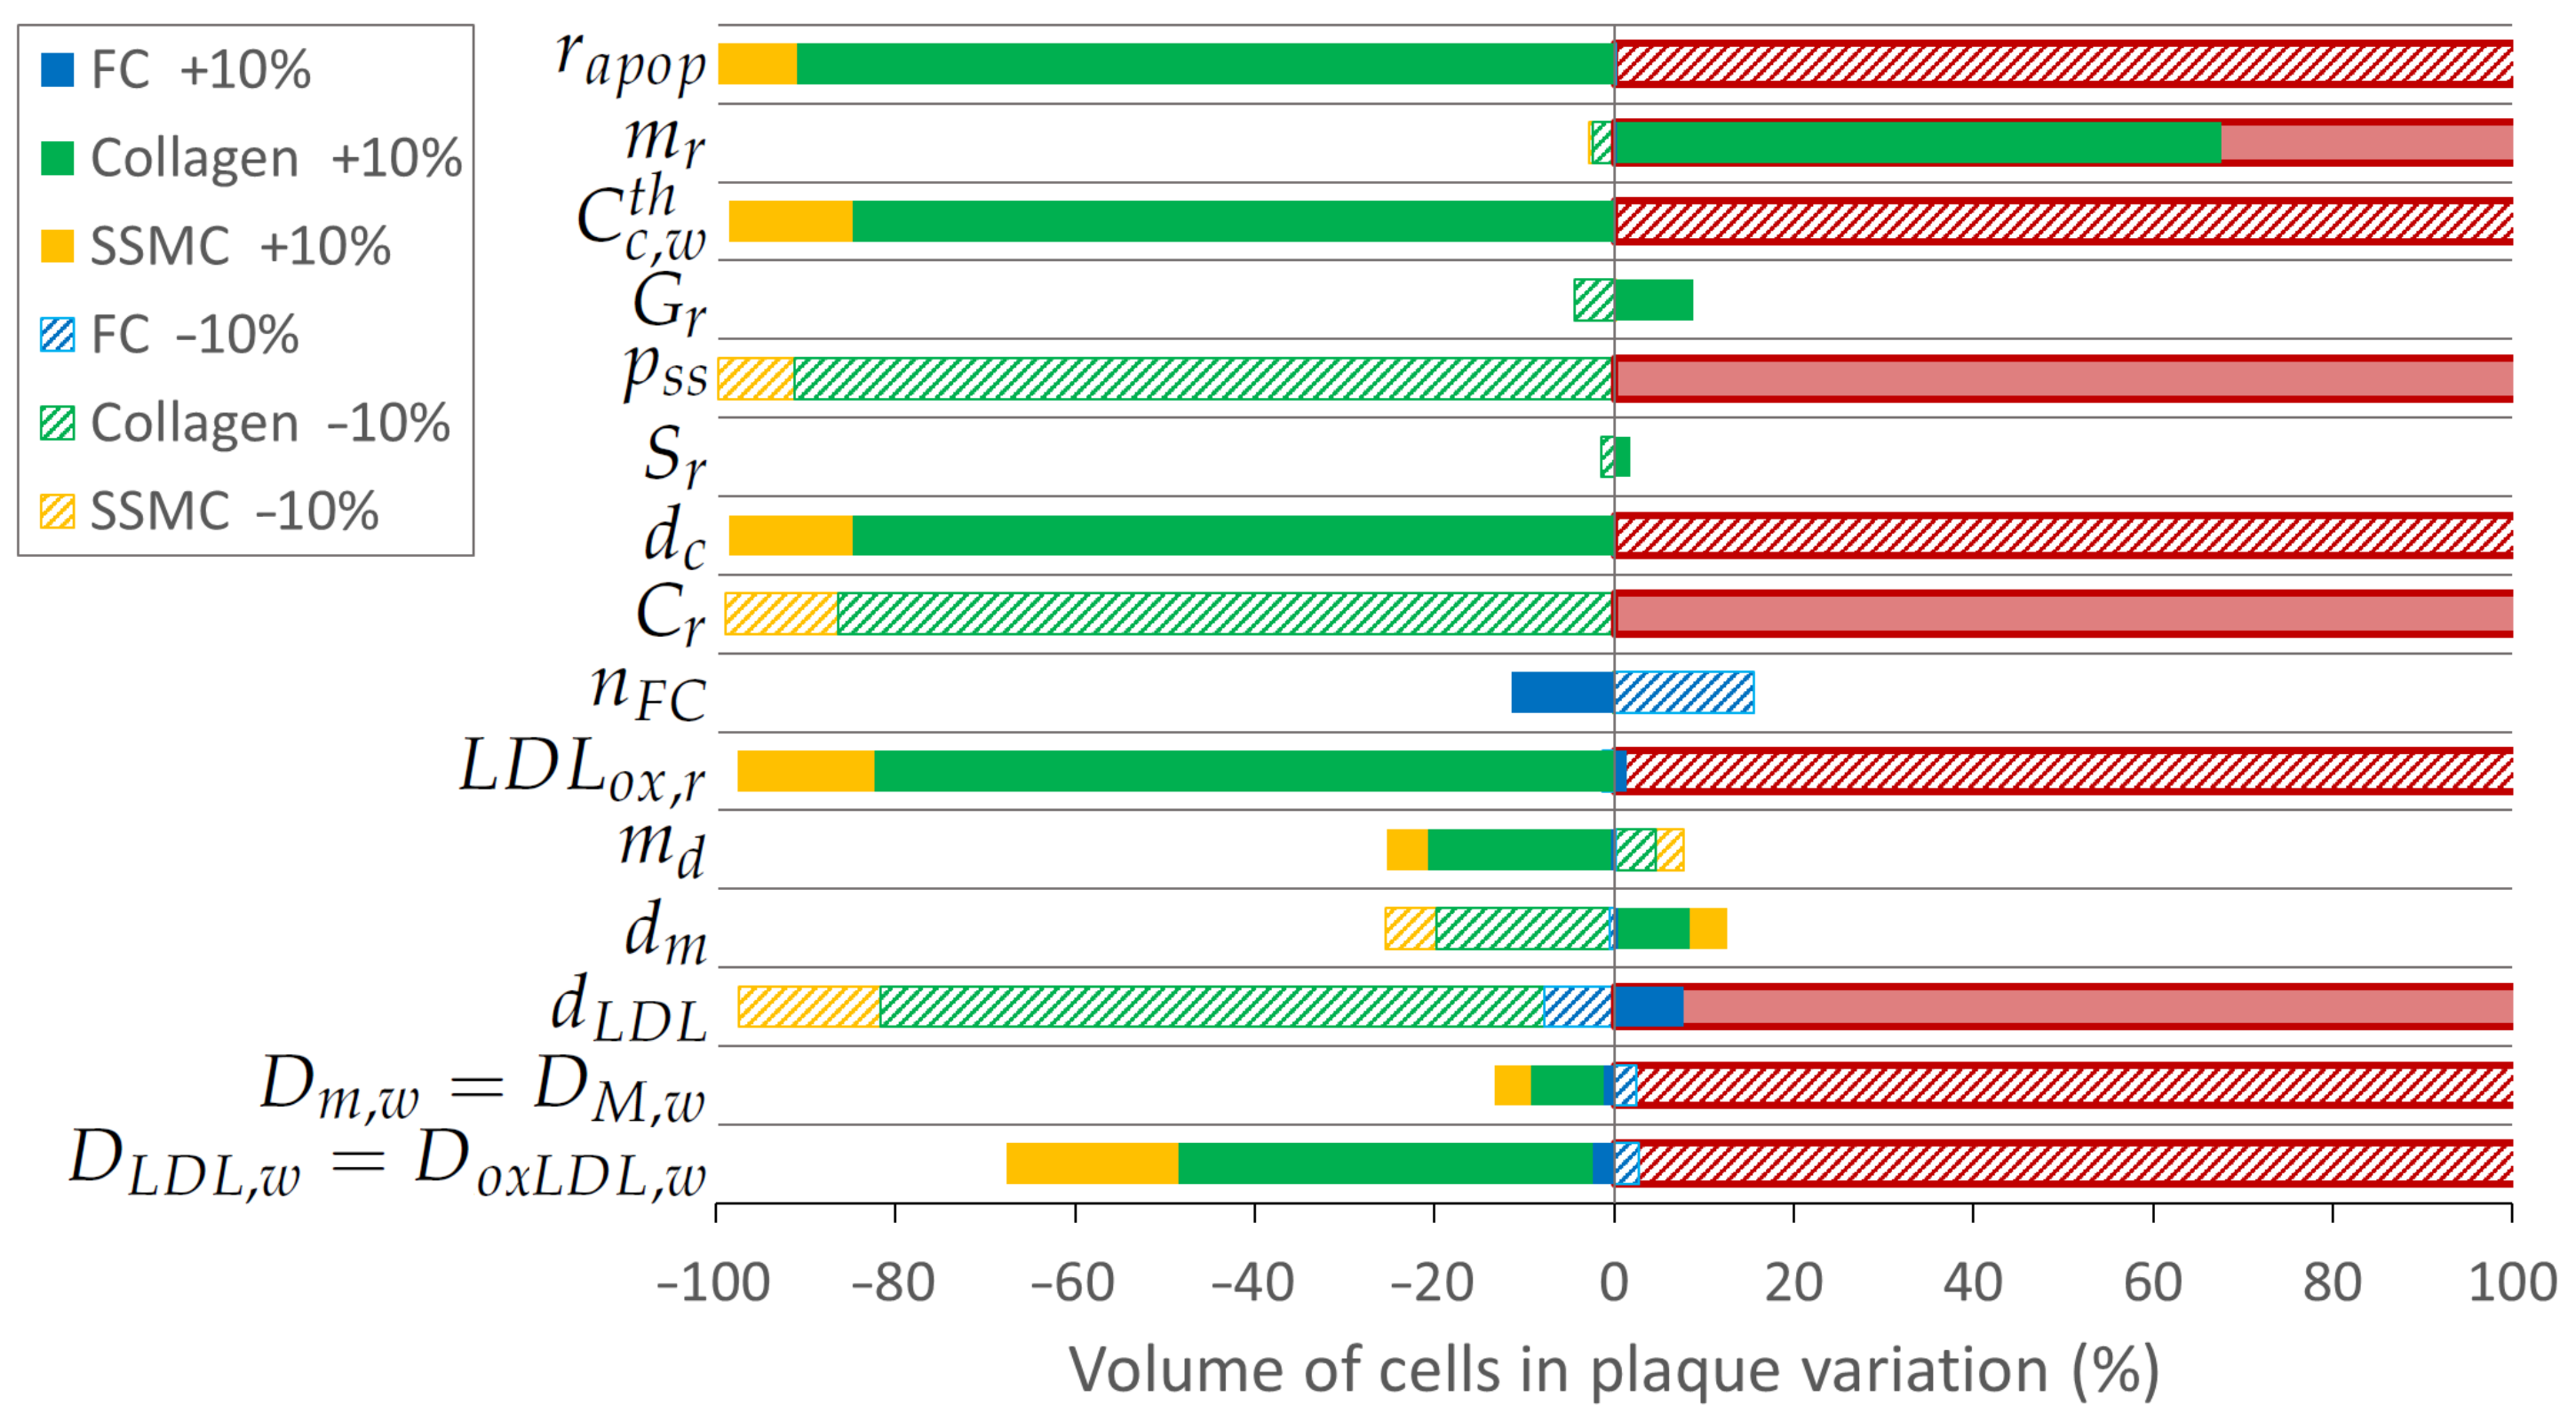
In Figure 4, the variation in the volume of foam cells, synthetic smooth muscle cells, and collagen fibre is represented in a graph of parallel bars for variations of . In cases of parameters that cause a volume variation higher than 100% in any of the considered substances, the bar of this substance is represented in red, i.e., the cases of the diffusion coefficients , , , , , , , and .
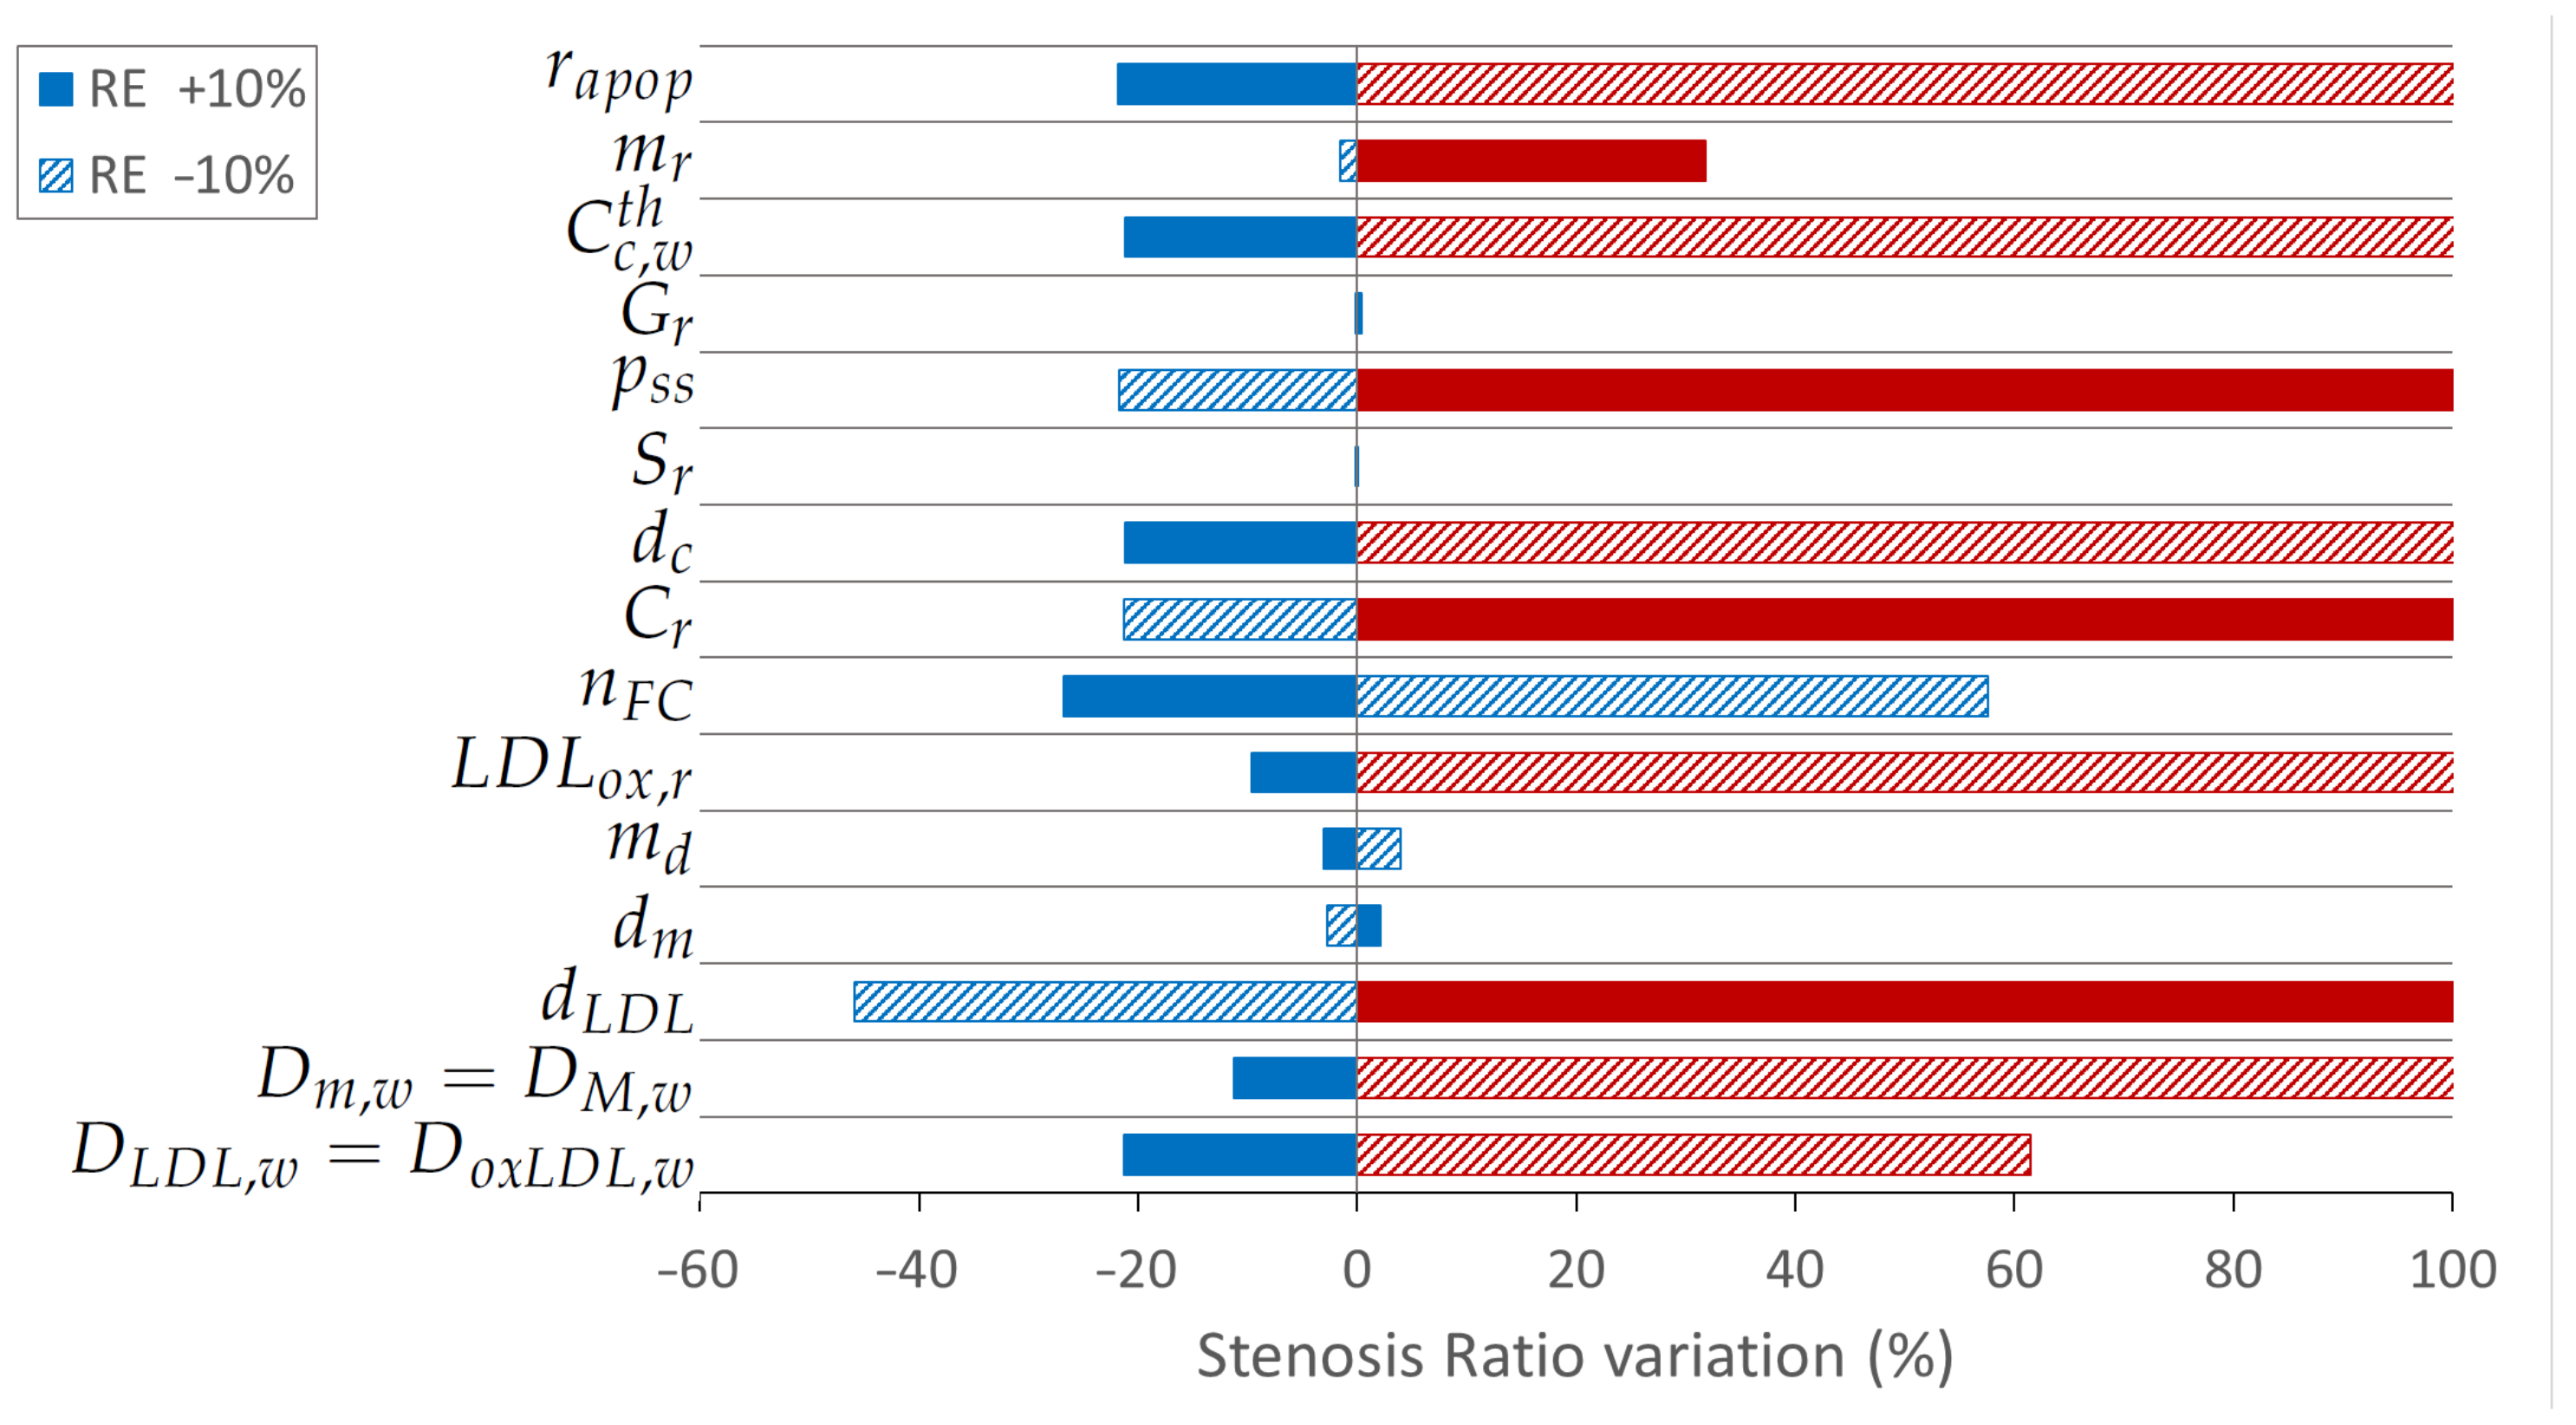
Figure 5 represents the change in the stenosis ratio due to the variation of the considered parameters when varied ±10%. The red bars refer to cases in which at least one of the substances that adds volume to the plaque has a volume variation greater than 100%.
7. Discussion
In this work, an analysis of the influence of some parameters of a previous mathematical model of atherosclerosis development in arteries was performed [8]. The mathematical model has a large number of parameters that can affect the growth of the plaque. However, some of them are considered well-known due to, for example, corresponding to geometrical properties of arteries or substances. Therefore, the parameters whose influence on plaque growth was analysed are related to the reactive terms of the equations referred to substances in the arterial wall. These parameters have been modified by increasing and decreasing their value in different cases by and, to determine how they affect plaque growth, variations in the volume of substances that add volume to the plaque have been analysed (foam cells, synthetic smooth muscle cells, and collagen fibre). In addition, the variation in the plaque stenosis ratio was analysed.
As can be seen in the results, on the one hand, the parameters whose variations are directly proportional to the stenosis ratio are the degradation rate of LDL (), the monocyte differentiation rate (), the parameters referring to the production and degradation of cytokines ( and ), the proliferation rate of synthetic smooth muscle cells (), the segregation rate of collagen () and the parameter related to the amount of monocyte recruited by the endothelium (). On the other hand, some of the analysed parameters are inversely proportional to the growth of the plaque, and an increase in their values will cause a decrease in the volume of the plaque and, therefore, in the stenosis ratio. It is the case of the diffusion parameters of substances on the arterial wall ( and ), the rate of death of monocytes (), the rate of oxidised LDL that is uptaken by macrophages, and the maximum amount of oxidised LDL that a macrophage can ingest ( and ), the cytokine degradation rate, its threshold in the arterial wall ( and ), and the rate of apoptosis of synthetic smooth muscle cells ().
As can be noticed, the parameters that influence the change in the volume of synthetic smooth muscle cells also influence the change in the volume of collagen. It is due to the segregation of collagen fibre by SSMC, so collagen depends directly on them.
The less influential parameters in the volume change of substances in the plaque are: , , , and . It should be noted that and are parameters referring to monocytes, which act at the beginning of the process. Therefore, a great influence on them could be expected. However, monocytes highly affect the results with the parameter , which is the monocytes recruitment from the lumen, and its variation has a huge influence on the volume of FC in the plaque and, therefore, in the stenosis ratio.
As can be seen in Figure 4, has a large influence on the variation of volume of synthetic smooth muscle cells and collagen for both cases, when increasing and decreasing its value by 10%. The smaller the value, the more plaque is generated, as it is an apoptosis factor of synthetic smooth muscle cells. However, its influence on the variation of the stenosis ratio is greater in the case of increasing its value than in the case of decreasing it. As it is a parameter related to the apoptosis ratio of synthetic smooth muscle cells, its change does not cause variation in the results of foam cells (Figure 5).
has more influence in both concentrations and stenosis ratio variation when increased (Figure 4 and Figure 5). This is because, when its value is decreased, the amount of monocytes deposited in the arterial wall is reduced.
has a large influence in the variations of the results, having more influence when increased (the change of volume and stenosis ratio are greater than 100% in this case, as can be seen in Figure 4 and Figure 5). It is a parameter involved in the differentiation of contractile smooth muscle cells into synthetic ones due to the presence of cytokines in the arterial wall. Thus, it does not influence the volume of foam cells.
As is a parameter of collagen fibre segregation, it only has influence on the change of the volume of collagen in the plaque (Figure 4). Therefore, its influence on the stenosis ratio is limited (Figure 5).
is related to the proliferation of synthetic smooth muscle cells, so it does not influence the results of foam cells. On the contrary, as can be seen in Figure 4, increasing it by 10% produces a change greater than 100% in the variation of synthetic smooth muscle cells and collagen fibre.
changes do not cause a large variation in the volume of any substance or the plaque stenosis ratio (Figure 5).
is a parameter that also has a large influence on the volume variations (Figure 4). This parameter represents the cytokine degradation; thus, the higher it is, the more cytokines are degraded and, thus, the volume and the ratio of stenosis are lower (Figure 5). The same occurs with , which represents the cytokine production.
represents the maximum amount of oxidised LDL that a macrophage can ingest before becoming a foam cell. Therefore, an increase in its value produces a reduction in the volume of foam cells and the stenosis ratio (Figure 4 and Figure 5). Its influence on the variation of the volume of the substances is not very large, but it produces an important variation in the stenosis ratio. When these results are contrasted with those of a substance that produces a large variation in synthetic smooth muscle cells and collagen volumes (for example, ), it can be observed that a smaller change in the volume of foam cells produces a larger change in the stenosis ratio. It can be explained by attending to Equation (45): The volume of a foam cell is equal to , while the volume of a synthetic smooth muscle cell is equal to . Therefore, due to their size difference, less change in foam cell volume is needed to produce a similar stenosis ratio variation.
is related to the oxidised LDL uptaken by macrophages, so it affects the volume of each of the considered substances. An increase in its value produces a reduction in the volume of substances (Figure 4) and therefore of the stenosis ratio (Figure 5).
and are both parameters referring to monocytes. The first one is related to their differentiation, while the second one refers to their apoptosis. Therefore, their influences are opposite. Their influence is more notable for synthetic smooth muscle cells and collagen volumes (Figure 4).
is the degradation rate of LDL, so it has an influence on foam cells, synthetic smooth muscle cells, and collagen fibre and, therefore, in the stenosis ratio of the plaque (Figure 4 and Figure 5). So, it is one of the most influential parameters of the model and the most influential in the stenosis ratio when it is reduced.
and are related to the diffusion of substances in the arterial wall, so they affect all the processes. Therefore, they influence the results of all the substances, and are some of the most important parameters in the model (Figure 4 and Figure 5).
With all of this information, knowing the influence of all the parameters, they could be adjusted to achieve more or less vulnerable atheroma plaque, according to the percentage volume of foam cells, synthetic smooth muscle cells, and collagen fibre [67,68]. The vulnerability of a plaque is dependent on multiple factors, such as its size or stresses caused by blood flow in it, but it is also dependent on its composition. There is a high risk of rupture of plaque with a large lipidic nucleus and a thin fibrous cap [67,69]. Therefore, a high quantity of foam cells and a small amount of synthetic smooth muscle cells and collagen fibre will be indicators of plaque with a high risk of rupture (and, therefore, less stable) than one with a large quantity of synthetic smooth muscle cells and collagen [67,68,69,70]. Therefore, reducing the maximum amount of oxidised LDL that a macrophage can ingest and the ratio of oxidation of LDL () will cause plaque with bigger lipid nuclei, which can develop into more unstable plaque. However, as can be seen, it has no influence on SSMC and collagen volumes in the plaque. Conversely, increasing the apoptosis ratio of SSMCs, the cytokine threshold in the arterial wall and its degradation rate, and the rate of oxidised LDL uptaken by macrophages (, , and , respectively), and reducing SSMC proliferation, cytokine production, and the oxidation LDL ratio (, , and , respectively) will produce plaque with less fibrotic layer and, thus, a high risk of rupture.
Some studies in the literature focus on determining the most influential parameters in the development of atheroma plaque in different mathematical models. It is the case of Cilla et al. [21], in which the effect of the anisotropy of the arterial wall on the diffusion coefficients of LDL was analysed. Their results have been considered to implement the anisotropy of the diffusion coefficients in the present model. There are also some studies on parameter influence in agent-based models. It is the case of Olivares et al. [18], who focus on determining how the migration of agents, the velocity of oxidation of LDL, and the maximum amount of autoantibodies can affect the plaque. In addition Corti et al. [20] have mono-parametric and multi-parametric studies to determine the influence of the parameters on their model. However, it is not possible to contrast their results with the ones obtained in this article, as each of the models considers different substances in the process of atheroma plaque formation and, therefore, their parameters are referred to other substance values.
The findings of this study should be interpreted in the context of its limitations. For example, the study of the influence of parameters was done only in the geometry of the carotid artery. However, the behaviour of the mathematical model would be the same for other geometrical configurations and arteries, for example, coronary or aorta arteries, adapting the values of the corresponding parameters if necessary. Another limitation of the study is that it was done with a 2D-axisymmetric model instead of a real geometry. This produces a higher plaque growth than in real cases as diffusion in the circumferential direction is not allowed and therefore causes a higher accumulation of substances in the area of the plaque. However, it should not influence the development of the plaque according to the variations in the parameters that were analysed here. In addition, blood flow and the inflammatory process are not coupled, which could influence the shape and stenosis ratio of the developed plaque. In this study, we also do not consider the influence of the mechanics of the arterial wall in the development of the plaque (such as tortuosity or changes in the permeability of the arterial wall due to the thickness variation of it with the cardiac cycle).
8. Conclusions
The mathematical model has a large number of parameters and their values influence the plaque obtained. They can affect the volume of the substances that provide volume to the plaque and also its stenosis ratio. Therefore, the dependence of the model on the variation of its parameters was analysed. For that, a previous selection of the parameters to analyse was done, and those referred to geometrical parameters, initial concentrations, and material properties were discarded.
As can be seen in Section 6, the variation of the selected parameters carries important variations on the results, and in some cases, this variation can be greater than 100%.
, , , , , , and are directly proportional to the change of substances volume (FC, SSMC, and collagen) and to the stenosis ratio, while , , , , , , , and are inversely proportional.
In addition, it was noticed that a variation in foam cell volume results in more of a change in the plaque stenosis ratio than in the volume of synthetic smooth muscle cells or collagen, due to the larger volume.
For all of this, it could be interesting to study the vulnerability of plaque by changing the analysed parameters, knowing how each one of them affects the volume of foam cells, synthetic smooth muscle cells, and collagen fibre in the plaque.
Author Contributions
M.C., M.A.M. and E.P. conceived and designed the study; P.H.-L., M.C., M.A.M. and E.P. developed the mathematical model; P.H.-L. and M.C. conducted the computational implementation of the model and post-processing of the results; P.H.-L., M.C., M.A.M. and E.P. wrote, reviewed, and edited the manuscript. All authors have read and agreed to the published version of the manuscript.
Funding
This research was funded by the Spanish Ministry of Science and Technology through research project PID2019-107517RB-I00; financial support was given to P. Hernández-López via grant BES-2017-080239 and the regional Government of Aragón via research project T24-20R.
Data Availability Statement
Not applicable.
Acknowledgments
The authors gratefully acknowledge the research support from CIBER– Bioengineering, Biomaterials & Nanomedicne (CIBER-BBN at the University of Zaragoza). CIBER Actions are financed by Instituto de Salud Carlos III with assistance from the European Regional Development Fund.
Conflicts of Interest
The authors declare no conflict of interest.
Abbreviations
The following abbreviations are used in this manuscript:
| LDL | Low-density lipoproteins |
| FC | Foam cells |
| CSMC | Contractile smooth muscle cells |
| SSMC | Synthetic smooth muscle cells |
| Wall shear stress | |
| time-averaged wall shear stress | |
| Oscillatory shear index | |
| Shape index | |
| FSI | Fluid–structure interaction |
| CFD | Computational fluid dynamics |
| BDF | Backwards differentiation formula |
| Subscripts: | |
| b | Blood |
| l | Lumen |
| p | Plasma |
| w | Arterial wall |
| Normal junctions | |
| Leaky junctions | |
| Vesicular pathways | |
| Nomenclature list: | |
| Density | |
| Dynamic viscosity | |
| Porosity | |
| k | Permeability |
| u | Velocity |
| P | Pressure |
| v | Volume |
| R | Radius |
| l | Length |
| Internal forces of blood | |
| T | Cardiac cycle period |
| Plasma flow across the endothelium | |
| Pressure drop in the endothelium | |
| Hydraulic conductivity | |
| Endothelial fraction of leaky cells | |
| Endothelial area occupied by leaky junctions | |
| Leaky junction permeability | |
| Area of a single leaky junction | |
| Endothelial cell radius | |
| Half width of a leaky junction | |
| Blood flow tangential stresses | |
| Unit area | |
| Hydraulic conductivity of a single leaky junction | |
| Length of a leaky junction | |
| N | Substances flow |
| Diffusion coefficient of the substance in the arterial wall | |
| i substance concentration | |
| Solute lag coefficient of LDL | |
| i substance flow across the endothelium | |
| LDL deposited into the arterial wall | |
| Apparent permeability | |
| Diffusive permeability of leaky junctions | |
| Diffusive permeability of a single leaky junction | |
| Reduction factor of leaky junctions | |
| Solvent-drag coefficient of leaky junctions | |
| Fraction of endothelial cells separated by leaky junctions | |
| Geometric ratio | |
| LDL molecule radius | |
| Modifies Péclet number | |
| Degradation rate of LDL | |
| LDL that a macrophage can ingest | |
| Monocyte differentiation rate | |
| Monocyte natural death | |
| Monocyte recruitment from lumen | |
| Quantity of oxLDL that a macrophage has to ingest to turn into a FC | |
| Cytokine production rate | |
| Cytokine degradation rate | |
| CSMC differentiation rate | |
| Saturation constant | |
| Cytokine threshold | |
| SSMC proliferation rate | |
| SSMC apoptosis rate | |
| Collagen secretion rate | |
| LDL | Low-density lipoproteins |
| oxLDL | Oxidised LDL |
| m | Monocyte |
| M | Macrophage |
| c | Cytokine |
| CSMC | Contractile Smooth Muscle Cells |
| SSMC | Synthetic Smooth Muscle Cells |
| FC | Foam Cells |
| Cg | Collagen |
References
- Gaziano, T.; Gaziano, J.M. Chapter 1: Global burden of cardiovascular disease. In Brunwald’s Heart Disease: A Textbook of Cardiovascular Medicine, 9th ed.; Bonow, R., Mann, D., Zupes, D.P.L., Eds.; Elsevier: Philadlephia, PA, USA, 2012. [Google Scholar]
- Libby, P.; Ridker, P.M.; Hansson, G.K. Progress and challenges in translating the biology of atherosclerosis. Nature 2011, 473, 317–325. [Google Scholar] [CrossRef] [PubMed]
- Libby, P. Inflammation during the life cycle of the atherosclerotic plaque. Cardiovasc. Res. 2021, 117, 2525–2536. [Google Scholar] [CrossRef] [PubMed]
- Cilla, M.; Peña, E.; Martínez, M.A. Mathematical modelling of atheroma plaque formation and development in coronary arteries. J. R. Soc. Interface 2014, 11, 20130866. [Google Scholar] [CrossRef] [PubMed]
- Dai, G.H.; Kaazempur-Mofrad, M.R.; Natarajan, S.; Zhang, Y.Z.; Vaughn, S.; Blackman, B.R.; Kamm, R.D.; Garcia-Gardena, G.; Gimbrone, M.A. Distinct endothelial phenotypes evoked by arterial waveforms derived from atherosclerosis-susceptible and -resistant regions of human vasculature. Proc. Natl. Acad. Sci. USA 2004, 101, 14871–14876. [Google Scholar] [CrossRef] [PubMed]
- Sáez, P.; Malvè, M.; Martínez, M.A. A theoretical model of the endothelial cell morphology due to different waveforms. J. Theor. Biol. 2015, 379, 16–23. [Google Scholar] [CrossRef]
- Alimohammadi, M.; Pichardo-Almarza, C.; Agu, O.; Díaz-Zuccarini, V. A multiscale modelling approach to understand atherosclerosis formation: A patient-specific case study in the aortic bifurcation. Proc. Inst. Mech. Eng. Part H J. Eng. Med. 2017, 231, 378–390. [Google Scholar] [CrossRef] [PubMed]
- Hernández-López, P.; Cilla, M.; Martínez, M.A.; Peña, E. Effects of the haemodynamic stimulus on the location of carotid plaque based on a patient-specific mechanobiological plaque atheroma formation model. Front. Bioeng. Biotechnol. 2021, 9, 690685. [Google Scholar] [CrossRef] [PubMed]
- Malvè, M.; Gharib, A.M.; Yazdani, S.K.; Finet, G.; Martínez, M.A.; Pettigrew, R.; Ohayon, J. Tortuosity of Coronary Bifurcation as a Potential Local Risk Factor for Atherosclerosis: CFD Steady State Study Based on In Vivo Dynamic CT Measurements. Ann. Biomed. Eng. 2014, 43, 82–93. [Google Scholar] [CrossRef] [PubMed]
- Alimohammadi, M.; Pichardo-Almarza, C.; Agu, O.; Díaz-Zuccarini, V. Development of a patient-specific multi-scale model to understand atherosclerosis and calcification locations: Comparison with in vivo data in an aortic dissection. Front. Physiol. 2016, 7, 238. [Google Scholar] [CrossRef]
- Olgac, U.; Kurtcuoglu, V.; Poulikakos, D. Computational modeling of coupled blood-wall mass transport of LDL: Effects of local wall shear stress. Am. J. Physiol. Heart Circ. Physiol. 2008, 294, 909–919. [Google Scholar] [CrossRef]
- Tomaso, G.D.; Díaz-Zuccarini, V.; Pichardo-Almarza, C. A multiscale model of atherosclerotic plaque formation at its early stage. IEEE Trans. Biomed. Eng. 2011, 58, 3460–3463. [Google Scholar] [CrossRef] [PubMed]
- Calvez, V.; Ebde, A.; Meunier, N.; Raoult, A. Mathematical modelling of the atherosclerotic plaque formation. ESAIM Proc. 2009, 28, 1–12. [Google Scholar] [CrossRef]
- Shahzad, O.; Wang, X.; Ghaffari, A.; Iqbal, K.; Hafeez, M.B.; Krawczuk, M.; Wojnicz, W. Fluid structure interaction study of non-Newtonian Casson fluid in a bifurcated channel having stenosis with elastic walls. Nat. Sci. Rep. 2022, 12, 12219. [Google Scholar] [CrossRef] [PubMed]
- Siogkas, P.; Sakellarios, A.; Exarchos, T.P.; Athanasiou, L.; Karvounis, E.; Stefanou, K.; Fotiou, E.; Fotiadis, D.I.; Naka, K.K.; Michalis, L.K.; et al. Multiscale—Patient-specific artery and atherogenesis models. IEEE Trans. Biomed. Eng. 2011, 58, 3464–3468. [Google Scholar] [CrossRef] [PubMed]
- Filipovic, N.; Teng, Z.; Radovic, M.; Saveljic, I.; Fotiadis, D.; Parodi, O. Computer simulation of three-dimensional plaque formation and progression in the carotid artery. Med. Biol. Eng. Comput. 2013, 51, 607–616. [Google Scholar] [CrossRef] [PubMed]
- Kenjereš, S.; De Loor, A. Modelling and simulation of low-density lipoprotein transport through multi-layered wall of an anatomically realistic carotid artery bifurcation. J. R. Soc. Interface 2014, 11, 20130941. [Google Scholar] [CrossRef]
- Olivares, A.L.; González Ballester, M.A.; Noailly, J. Virtual exploration of early stage atherosclerosis. Bioinformatics 2016, 32, 3798–3806. [Google Scholar] [CrossRef]
- Bhui, R.; Hayenga, H.N. An agent-based model of leukocyte transendothelial migration during atherogenesis. PLoS Comput. Biol. 2017, 13, e1005523. [Google Scholar] [CrossRef]
- Corti, A.; Chiastra, C.; Colombo, M.; Garbey, M.; Migliavaca, F.; Casarin, S. A fully coupled computational fluid dynamics—Agent based model of atherosclerotic plaque development: Multiscale modeling framework and parameter sensitivity analysis. Comput. Biol. Med. 2020, 118, 103623. [Google Scholar] [CrossRef]
- Cilla, M.; Martínez, M.A.; Peña, E. Effect of Transmural Transport Properties on Atheroma Plaque Formation and Development. Ann. Biomed. Eng. 2015, 43, 1516–1530. [Google Scholar] [CrossRef]
- Sommer, G.; Regitnig, P.; Költringer, L.; Holzapfel, G.A. Biaxial mechanical properties of intact and layer-dissected human carotid arteries at physiological and supraphysiological loadings. Am. J. Physiol. Heart Circ. Physiol. 2010, 298, 898–912. [Google Scholar] [CrossRef] [PubMed]
- De Bruyne, B.; Pijls, N.H.J.; Heyndrickx, G.R.; Hodeige, D.; Kirkeeide, R.L.; Gould, K.L. Pressure-derived fractional flow reserve to assess serial epicardial stenoses: Theoretical basis and animal validation. Circulation 2000, 101, 1840–1847. [Google Scholar] [CrossRef] [PubMed]
- Pijls, N.H.J.; De Bruyne, B.; Bech, G.J.W.; Liistro, F.; Heyndrickx, G.R.; Bonnier, J.J.R.M.; Koolen, J.J. Coronary pressure measurement to assess the hemodynamic significance of serial stenosis within one coronary-artery: Validation in humans. Circulation 2000, 102, 2371–2377. [Google Scholar] [CrossRef] [PubMed]
- Malvè, M.; Chandra, S.; García, A.; Mena, A.; Martínez, M.A.; Finol, E.A.; Doblaré, M. Impedance-based outflow boundary conditions for human carotid haemodynamics. Comput. Methods Biomech. Biomed. Eng. 2014, 17, 1248–1260. [Google Scholar] [CrossRef] [PubMed]
- Caro, C.G.; Pedley, T.J.; Schroter, R.C.; Seed, W.A.; Fung, Y.C. The Mechanics of the Circulation; Oxford University Press: Oxford, UK, 1978. [Google Scholar]
- Perktold, K.; Resch, M.; Florian, H. Pulsatile non-newtonian flow characteristics in a three-dimensional human carotid bifurcation model. J. Biomech. Eng. 1991, 113, 464–475. [Google Scholar] [CrossRef]
- Milnor, W.R. Hemodynamics, 2nd ed.; Lippincott Williams & Wilkins: Baltimore, MD, USA, 1989. [Google Scholar]
- Khaled, A.R.; Vafai, K. The role of porous media in modeling flow and heat transfer in biological tissues. Int. J. Heat Mass Transf. 2003, 46, 4989–5003. [Google Scholar] [CrossRef]
- Huang, Y.; Rumschitzki, D.; Chien, S.; Weinbaum, S. A fiber matrix model for the filtration through fenestral pores in a compressible arterial intima. Am. J. Physiol. 1997, 272, H2023–H2039. [Google Scholar] [CrossRef]
- Sun, N.; Wood, N.B.; Hughes, A.D.; Thom, S.A.; Xu, X.Y. Effects of transmural pressure and wall shear stress on LDL accumulation in the arterial wall: A numerical study using a multilayered model. Am. J. Physiol. Heart Circ. Physiol. 2007, 292, 3148–3157. [Google Scholar] [CrossRef]
- Sun, N.; Wood, N.B.; Hughes, A.D.; Thom, S.A.M.; Xu, X.Y. Fluid-wall modelling of mass transfer in an axisymmetric Stenosis: Effects of shear-dependent transport properties. Ann. Biomed. Eng. 2006, 34, 1119–1128. [Google Scholar] [CrossRef] [PubMed]
- Karner, G.; Perktold, K.; Zehentner, H.P. Computational modeling of macromolecule transport in the arterial wall. Comput. Methods Biomech. Biomed. Eng. 2001, 4, 491–504. [Google Scholar] [CrossRef]
- Kedem, O.; Katchalsky, A. Thermodynamic analysis of the permeability of biological membranes to non-electrolytes. Biochim. Biophys. Acta 1958, 27, 229–246. [Google Scholar] [CrossRef]
- Tedgui, A.; Lever, M.J. Filtration through damaged and undamaged rabbit thoracic aorta. Am. J. Physiol. Heart Circ. Physiol. 1984, 247, 784–791. [Google Scholar] [CrossRef] [PubMed]
- Huang, Y.; Rumschitzki, D.; Chien, S.; Weinbaum, S. A fiber matrix model for the growth of macromolecular leakage spots in the arterial intima. J. Biomech. Eng. 1994, 116, 430–445. [Google Scholar] [CrossRef] [PubMed]
- Huang, Z.J.; Tarbell, J.M. Numerical simulation of mass transfer in porous media of blood vessel walls. Am. J. Physiol. Heart Circ. Physiol. 1997, 273, H464–H477. [Google Scholar] [CrossRef] [PubMed]
- Weinbaum, S.; Tzeghai, G.; Ganatos, P.; Pfeffer, R.; Chien, S. Effect of cell turnover and leaky junctions on arterial macromolecular transport. Am. Physiol. Soc. 1985, 248, 945–960. [Google Scholar] [CrossRef] [PubMed]
- Yuan, F.; Chien, S.; Weinbaum, S. A new view of convective-diffusive transport processes in the arterial intima. J. Biomech. Eng. 1991, 113, 314–329. [Google Scholar] [CrossRef] [PubMed]
- Levesque, M.J.; Liepsch, D.; Moravec, S.; Nerem, R.M. Correlation of Endothelial Cell Shape and Wall Shear Stress in a Stenosed Dog Aorta. Am. Heart Assoc. J. 1986, 6, 220–229. [Google Scholar] [CrossRef] [PubMed]
- Zhao, S.Z.; Ariff, B.; Long, Q.; Hughes, A.D.; Thom, S.A.; Stanton, A.V.; Xu, X.Y. Inter-individual variations in wall shear stress and mechanical stress distributions at the carotid artery bifurcation of healthy humans. J. Biomech. 2002, 35, 1367–1377. [Google Scholar] [CrossRef]
- Younis, H.F.; Kaazempur-Mofrad, M.R.; Chan, R.C.; Isasi, A.G.; Hinton, D.P.; Chau, A.H.; Kim, L.A.; Kamm, R.D. Hemodynamics and wall mechanics in human carotid bifurcation and its consequences for atherogenesis: Investigation of inter-individual variation. Biomech. Model. Mechanobiol. 2004, 3, 17–32. [Google Scholar] [CrossRef]
- Chien, S. Molecular and mechanical bases of focal lipid accumulation in arterial wall. Prog. Biophys. Mol. Biol. 2003, 83, 131–151. [Google Scholar] [CrossRef]
- Lin, S.J.; Jan, K.M.; Weinbaum, S.; Chien, S. Transendothelial transport of low density lipoprotein in association with cell mitosis in rat aorta. Arteriosclerosis 1989, 9, 230–236. [Google Scholar] [CrossRef] [PubMed]
- Prosi, M.; Zunino, P.; Perktold, K.; Quarteroni, A. Mathematical and numerical models for transfer of low-density lipoproteins through the arterial walls: A new methodology for the model set up with applications to the study of disturbed lumenal flow. J. Biomech. 2005, 38, 903–917. [Google Scholar] [CrossRef] [PubMed]
- Ai, L.; Vafai, K. A coupling model for macromolecule transport in a stenosed arterial wall. Int. J. Heat Mass Transf. 2006, 49, 1568–1591. [Google Scholar] [CrossRef]
- Cilla, M. Mechanical Effects on the Atheroma Plaque Appearance, Growth and Vulnerability. Ph.D. Thesis, University of Zaragoza, Zaragoza, Spain, 2012. [Google Scholar]
- Khan, F.H. The Elements of Immunology; Pearson Education: Delhi, India, 2009. [Google Scholar]
- Meyer, G.; Merval, R.; Tedgui, A. Effects of pressure-induced stretch and convection on low-density lipoprotein and albumin uptake in the rabbit aortic wall. Circ. Res. 1996, 79, 532–540. [Google Scholar] [CrossRef] [PubMed]
- Tarbell, J.M. Mass Transport in Arteries and the Localization of Atherosclerosis. Annu. Rev. Biomed. Eng. 2003, 5, 79–118. [Google Scholar] [CrossRef]
- Hu, X.; Weinbaum, S. A new view of Starling’s hypothesis at the microstructural level. Microvasc. Res. 1999, 58, 281–304. [Google Scholar] [CrossRef]
- Ogunrinade, O.; Kameya, G.T.; Truskey, G.A. Effect of Fluid Shear Stress on the Permeability of the Arterial Entohelium. Ann. Biomed. Eng. 2002, 30, 430–446. [Google Scholar] [CrossRef]
- Bulelzai, M.A.K.; Dubbeldam, J.L.A. Long time evolution of atherosclerotic plaque. J. Theor. Biol. 2012, 297, 1–10. [Google Scholar] [CrossRef]
- Krstic, R.V. Human Microscopic Anatomy: An Atlas for Students of Medicine and Biology; Springer: Berlin/Heidelberg, Germany, 1997. [Google Scholar]
- Zhao, B.; Li, Y.; Buono, C.; Waldo, S.W.; Jones, N.L.; Mori, M.; Kruth, H.S. Constitutive receptor-independent low density lipoprotein uptake and cholesterol accumulation by macrophages differentiated from human monocytes with macrophage-colony-stimulating factor (M-CSF). J. Biol. Chem. 2006, 281, 15757–15762. [Google Scholar] [CrossRef]
- Zhao, W.; Oskeritzian, C.A.; Pozez, A.L.; Schwartz, L.B. Cytokine Production by Skin-Derived Mast Cells: Endogenous Proteases Are Responsible for Degradation of Cytokines. J. Immunol. 2005, 175, 2635–2642. [Google Scholar] [CrossRef] [Green Version]
- Budu-Grajdeanu, P.; Schugart, R.C.; Friedman, A.; Valentine, C.; Agarwal, A.K.; Rovin, B.H. A mathematical model of venous neointimal hyperplasia formation. Theor. Biol. Med. Model. 2008, 5, 1–9. [Google Scholar] [CrossRef] [PubMed]
- Zahedmanesh, H.; Van Oosterwyck, H.; Lally, C. A multi-scale mechanobiological model of in-stent restenosis: Deciphering the role of matrix metalloproteinase and extracellular matrix changes. Comput. Methods Biomech. Biomed. Eng. 2014, 17, 813–828. [Google Scholar] [CrossRef]
- Escuer, J.; Martínez, M.A.; McGinty, S.; Peña, E. Mathematical modelling of the restenosis process after stent implantation. J. R. Soc. Interface 2019, 16, 20190313. [Google Scholar] [CrossRef]
- Steinberg, D.; Khoo, J.C.; Glass, C.K.; Palinski, W.; Almazan, F. A new approach to determining the rates of recruitment of circulating leukocytes into tissues: Application to the measurement of leukocyte recruitment into atherosclerotic lesions. Proc. Natl. Acad. Sci. USA 1997, 94, 4040–4044. [Google Scholar] [CrossRef] [PubMed]
- Kockx, M.M.; Muhring, J.; Bortier, H.; De Meyer, G.R.Y.; Jacob, W. Biotin- or digoxigenin-conjugated nucleotides bind to matrix vesicles in atherosclerotic plaque. Am. J. Pathol. 1996, 148, 1771–1777. [Google Scholar] [PubMed]
- Ivanova, E.A.; Myasoedova, V.A.; Melnichenko, A.A.; Grechko, A.V.; Orekhov, A.N. Small Dense Low-Density Lipoprotein as Biomarker for Atherosclerotic Diseases. Oxidative Med. Cell. Longev. 2017, 2017, 1273042. [Google Scholar] [CrossRef]
- Dabagh, M.; Jalali, P.; Konttinen, Y.T. The study of wall deformation and flow distribution with transmural pressure by three-dimensional model of thoracic aorta wall. Med. Eng. Phys. 2009, 31, 816–824. [Google Scholar] [CrossRef]
- Krombach, F.; Münzing, S.; Allmeling, A.M.; Gerlach, J.T.; Behr, J.; Dörger, M. Cell size of alveolar macrophagues: an interspecies comparison. Environ. Health Perspect. 1997, 105, 1261–1263. [Google Scholar]
- Cannon, G.J.; Swanson, J.A. The macrophage capacity for phagocytosis. J. Cell Sci. 1992, 101, 907–913. [Google Scholar] [CrossRef]
- Sáez, P.; Peña, E.; Ángel Martínez, M.; Kuhl, E. Mathematical modeling of collagen turnover in biological tissue. J. Math. Biol. 2013, 67, 1765–1793. [Google Scholar] [CrossRef]
- Le Floc’h, S.; Ohayon, J.; Tracqui, P.; Finet, G.; Gharib, A.M.; Maurice, R.L.; Cloutier, G.; Pettigrew, R.I. Vulnerable Atherosclerotic Plaque Elasticity Reconstruction Based on a Segmentation-Driven Optimization Procedure Using Strain Measurements: Theoretical Framework. IEEE Trans. Med. Imaging 2009, 28, 1126–1137. [Google Scholar] [CrossRef] [PubMed] [Green Version]
- Pan, J.; Cai, Y.; Wang, L.; Maehara, A.; Mintz, G.; Tang, D.; Li, Z. A prediction tool for plaque progression based on patient-specific multi-physical modeling. PLoS Comput. Biol. 2021, 17, e1008344. [Google Scholar] [CrossRef]
- Fuster, V.; Moreno, P.R.; Fayad, Z.A.; Corti, R.; Badimon, J.J. Atherothrombosis and High-Risk Plaque: Part I: Evolving Concepts. J. Am. Coll. Cardiol. 2005, 46, 937–954. [Google Scholar] [CrossRef] [PubMed]
- Virmani, R.; Burke, A.P.; Farb, A.; Kolodgie, F.D. Pathology of the Vulnerable Plaque. J. Am. Coll. Cardiol. 2006, 47, C13–C18. [Google Scholar] [CrossRef] [PubMed] [Green Version]
Figure 1.
Two-dimensional axisymmetric geometry composed of lumen (in red), the arterial wall, and obstacle plaque (both in white color). Details (A,B) show the mesh near the endothelium at both sides (lumen and arterial wall) for the area near the obstacle plaque (A) and the area of development of the new plaque (B).

Figure 2.
Mass flow (black line) and pressure (blue line) imposed as boundary conditions at the inlet and outlet of the geometry, respectively [25].
Figure 2.
Mass flow (black line) and pressure (blue line) imposed as boundary conditions at the inlet and outlet of the geometry, respectively [25].

Figure 3.
Pathline of the computational model.

Figure 4.
Variation of the volume of FC (blue color), SSMC (yellow color), and collagen (green color) when increasing and decreasing the parameters by 10% (solid and striped colors, respectively). Bars in red represent a variation of one of the substances higher than 100%.
Figure 4.
Variation of the volume of FC (blue color), SSMC (yellow color), and collagen (green color) when increasing and decreasing the parameters by 10% (solid and striped colors, respectively). Bars in red represent a variation of one of the substances higher than 100%.

Figure 5.
Variation of the stenosis ratio (blue color) when increasing and decreasing the parameters by 10% (solid and striped colors, respectively). Bars in red represent a variation of one of the substances higher than 100%.
Figure 5.
Variation of the stenosis ratio (blue color) when increasing and decreasing the parameters by 10% (solid and striped colors, respectively). Bars in red represent a variation of one of the substances higher than 100%.


Table 1.
Parameters to calculate blood flow.
| Blood Flow Parameters | |||
|---|---|---|---|
| Parameter | Description | Value | Reference |
| Blood density | Milnor [28] | ||
| Blood viscosity | Milnor [28] | ||
| T | Cardiac cycle period | s | Malvè et al. [25] |
Table 2.
Parameters to model plasma flow across the endothelium.
| Plasma Flow Parameters | |||
|---|---|---|---|
| Param. | Description | Value | Reference |
| Endothelial cell radius | m | Weinbaum et al. [38] | |
| Half-width of a leaky junction | nm | Weinbaum et al. [38] | |
| Leaky junction length | m | Weinbaum et al. [38] | |
| Plasma density | Milnor [28] | ||
| Plasma viscosity | Milnor [28] | ||
| Darcian artery permeability | 1.2 m | Huang et al. [36], Prosi et al. [45] | |
| Intima porosity | 0.96 | Ai and Vafai [46] | |
| Normal junction conductivity | Tedgui and Lever [35] | ||
| Endothelial pressure difference | 20.727 mmHg | Tedgui and Lever [35] | |
| Unit area for the exp. correlations | mm | Chien [43] | |
| Pressure of the adventitia | mmHg | Olgac et al. [11] | |
Table 3.
Parameters to calculate the inflammatory process in the arterial wall.
| Inflammatory Process Parameters | |||
|---|---|---|---|
| Parameter | Description | Value | Reference |
| LDL radial diff. coeff. | Prosi et al. [45] | ||
| Monocyte radial diff. coeff. | Cilla et al. [4] | ||
| Ox. LDL radial diff. coeff. | Prosi et al. [45] | ||
| Macroph. radial diff. coeff. | Cilla et al. [4] | ||
| LDL oxidation | s | Ai and Vafai [46] | |
| Monocyte differentiation | s | Bulelzai and Dubbeldam [53] | |
| Monocyte natural death | d | Krstic [54] | |
| OxLDL uptake | Zhao et al. [55] | ||
| Max. oxLDL uptake | Hernández-López et al. [8] | ||
| Cytokine production | Cilla et al. [4] | ||
| Cytokine degradation | s | Zhao et al. [56] | |
| SMC’s differentiation | d | Cilla et al. [4] | |
| SSMC’s proliferation | d | Budu-Grajdeanu et al. [57] | |
| Collagen production | Zahedmanesh et al. [58] | ||
| Half-width of a leaky junct. | nm | Weinbaum et al. [38] | |
| Leaky junction length | m | Weinbaum et al. [38] | |
| LDL radius | nm | Tarbell [50] | |
| Cytokine threshold | Hernández-López et al. [8] | ||
| LDL initial conc. | Cilla [47] | ||
| Monocyte initial conc. | [48] | ||
| CSMC initial conc. | Escuer et al. [59] | ||
| LDL conc. at adventitia | ‰ | Meyer et al. [49] | |
| Cytokine threshold factor | Hernández-López et al. [8] | ||
| LDL at the endothelium | Meyer et al. [49] | ||
| Monocyte recruitment | Steinberg et al. [60] | ||
| SSMC apoptosis rate | s | Kockx et al. [61] | |
| LDL density | Ivanova et al. [62] | ||
| LDL molecular weight | Cilla [47] | ||
| Solute lag coefficient of LDL | Dabagh et al. [63] | ||
Table 4.
Parameters to calculate plaque growth in the arterial wall.
| Plaque Growth Parameters | |||
|---|---|---|---|
| Parameter | Description | Value | Reference |
| Foam cell radius | m | Krombach et al. [64], Cannon and Swanson [65] | |
| SMC radius | m | Cilla et al. [4] | |
| SMC length | m | Cilla et al. [4] | |
| Collagen density | Sáez et al. [66] | ||
Table 5.
Analysed parameters and values.
| Parameter | Description | Value −10% | Mean Value | Value +10% |
|---|---|---|---|---|
| LDL and oxLDL diff. coeff. | ||||
| ) | Monocyte and macrophage diff. coeff. | |||
| LDL oxidation | ||||
| Monocyte differentiation | ||||
| Monocyte death | ||||
| OxLDL uptake | ||||
| Max. oxLDL uptake | ||||
| Cytokine production | ||||
| Cytokine degradation | ||||
| SMC differentiation | ||||
| SSMC proliferation | ||||
| Collagen production | ||||
| Cytokine threshold | ||||
| Monocyte recruitment | ||||
| SSMC apoptosis rate |
Table 6.
Results of foam cells, synthetic smooth muscle cells, and collagen volume variations (second, third, and fourth columns, respectively), and stenosis ratio variation (fifth column), by reducing and increasing the values of the parameters of the first column by 25%.
Table 6.
Results of foam cells, synthetic smooth muscle cells, and collagen volume variations (second, third, and fourth columns, respectively), and stenosis ratio variation (fifth column), by reducing and increasing the values of the parameters of the first column by 25%.
| Parameter | FC Volume Variation (%) | SSMC Volume Variation (%) | Cg Volume Variation (%) | SR Variation (%) | ||||
|---|---|---|---|---|---|---|---|---|
| −25% | +25% | −25% | +25% | −25% | +25% | −25% | +25% | |
| 7.35 | −5.65 | >100 | −92.81 | >100 | −74.38 | - | −36.61 | |
| 4.82 | −4.07 | >100 | −43.43 | >100 | −39.57 | - | −19.71 | |
| −20.29 | 18.51 | −99.89 | >100 | −93.98 | >100 | −82.68 | - | |
| −0.98 | 0.63 | −42.43 | 21.00 | −31.32 | 15.33 | −7.28 | 4.69 | |
| 0.23 | −1.09 | 15.32 | −34.09 | 12.95 | −29.32 | 7.90 | −8.16 | |
| −3.73 | 2.90 | >100 | −99.89 | >100 | −93.27 | - | −12.99 | |
| 48.43 | −36.00 | −0.21 | 0.13 | −0.10 | 0.24 | >100 | −77.22 | |
| 0 | 0 | −99.89 | >100 | −95.52 | >100 | −22.05 | - | |
| 0 | 0 | >100 | −99.89 | >100 | −94.14 | - | −21.95 | |
| 0 | 0 | −5.50 | 6.46 | −7.48 | 7.71 | −0.64 | 0.032 | |
| 0 | 0 | −99.89 | >100 | −96.88 | >100 | −22.17 | - | |
| 0 | 0 | 0 | 0 | −24.54 | 48.32 | −1.08 | 2.09 | |
| 0 | 0 | >100 | −99.89 | >100 | −94.14 | - | −21.96 | |
| −3.77 | 3.75 | −41.23 | >100 | −35.02 | >100 | −20.83 | - | |
| 0 | 0 | >100 | −99.91 | >100 | −96.72 | - | −22.19 | |
Table 7.
Results of the foam cells, synthetic smooth muscle cells, and collagen volume variations (second, third, and fourth columns, respectively), and variation in the stenosis ratio (fifth column), reducing and increasing the values of the parameters of the first column by 10%.
Table 7.
Results of the foam cells, synthetic smooth muscle cells, and collagen volume variations (second, third, and fourth columns, respectively), and variation in the stenosis ratio (fifth column), reducing and increasing the values of the parameters of the first column by 10%.
| Parameter | FC Volume Variation (%) | SSMC Volume Variation (%) | Cg Volume Variation (%) | SR Variation (%) | ||||
|---|---|---|---|---|---|---|---|---|
| −10% | +10% | −10% | +10% | −10% | +10% | −10% | +10% | |
| 2.69 | −2.42 | >100 | −67.85 | >100 | −48.60 | - | −21.31 | |
| 2.32 | −1.32 | >100 | −13.45 | >100 | −9.32 | - | −11.23 | |
| −7.89 | 7.60 | −97.67 | >100 | −81.81 | >100 | −45.91 | - | |
| −0.54 | 0.32 | −25.54 | 12.55 | −19.89 | 8.35 | −2.67 | 2.10 | |
| 0.05 | −0.43 | 7.65 | −25.43 | 4.56 | −20.88 | 3.91 | −3.06 | |
| −1.36 | 1.23 | >100 | −97.85 | >100 | −82.55 | − | −9.61 | |
| 15.50 | −11.52 | −0.07 | 0.04 | −0.03 | 0.08 | 57.57 | −26.82 | |
| 0 | 0 | −99.13 | >100 | −86.56 | >100 | −21.31 | - | |
| 0 | 0 | >100 | −98.69 | >100 | −84.93 | - | −21.16 | |
| 0 | 0 | −1.17 | 1.38 | −1.59 | 1.64 | −0.13 | 0.007 | |
| 0 | 0 | −99.89 | >100 | −91.40 | >100 | −21.75 | - | |
| 0 | 0 | 0 | 0 | −4.50 | 8.77 | −0.19 | 0.36 | |
| 0 | 0 | >100 | −98.69 | >100 | −84.93 | - | −21.15 | |
| −0.26 | 0.26 | −2.89 | >100 | −2.45 | 67.59 | −1.49 | - | |
| 0 | 0 | >100 | −99.90 | >100 | −91.14 | - | −21.77 | |
Disclaimer/Publisher’s Note: The statements, opinions and data contained in all publications are solely those of the individual author(s) and contributor(s) and not of MDPI and/or the editor(s). MDPI and/or the editor(s) disclaim responsibility for any injury to people or property resulting from any ideas, methods, instructions or products referred to in the content. |
© 2023 by the authors. Licensee MDPI, Basel, Switzerland. This article is an open access article distributed under the terms and conditions of the Creative Commons Attribution (CC BY) license (https://creativecommons.org/licenses/by/4.0/).
Share and Cite
MDPI and ACS Style
Hernández-López, P.; Martínez, M.A.; Peña, E.; Cilla, M. Understanding the Parameter Influence on Lesion Growth for a Mechanobiology Model of Atherosclerosis. Mathematics 2023, 11, 829. https://doi.org/10.3390/math11040829
AMA Style
Hernández-López P, Martínez MA, Peña E, Cilla M. Understanding the Parameter Influence on Lesion Growth for a Mechanobiology Model of Atherosclerosis. Mathematics. 2023; 11(4):829. https://doi.org/10.3390/math11040829
Chicago/Turabian StyleHernández-López, Patricia, Miguel A. Martínez, Estefanía Peña, and Myriam Cilla. 2023. "Understanding the Parameter Influence on Lesion Growth for a Mechanobiology Model of Atherosclerosis" Mathematics 11, no. 4: 829. https://doi.org/10.3390/math11040829
Note that from the first issue of 2016, this journal uses article numbers instead of page numbers. See further details here.