
Coverage, Rate, and Last Hop Selection in Multi-Hop Communications in Highway Scenarios
by
 , , , and
Vitalii Beschastnyi
1,
Egor Machnev
1,
Darya Ostrikova
1,*,
Yuliya Gaidamaka
1,2 and
Konstantin Samouylov
1,2 1
Applied Probability and Informatics Department, Peoples’ Friendship University of Russia (RUDN University), 117198 Moscow, Russia
2
Federal Research Center “Computer Science and Control” of Russian Academy of Sciences, 119333 Moscow, Russia
*
Author to whom correspondence should be addressed.
Mathematics 2023, 11(1), 26; https://doi.org/10.3390/math11010026
Submission received: 31 October 2022
/
Revised: 14 December 2022
/
Accepted: 19 December 2022
/
Published: 21 December 2022
(This article belongs to the Section Computational and Applied Mathematics)
Abstract
:The recent 3GPP initiative to extend IAB technology to mobile nodes in recently stated Release 18 opens up new opportunities for services operators in highway scenarios, where the extreme density of base stations (BS) is required to deliver uninterrupted coverage. The latter problem is specifically important for millimeter wave (mmWave) and future sub-terahertz (sub-THz) deployments. However, in such systems, there are inherent trade-offs between the rate provided over the multi-hop chain, the so-called “bridge”, and the inter-site distance. One of the critical factors involved in this trade-off is the choice of the last hop. In this paper, we utilize realistic channel measurements at 300 GHz to develop a framework characterizing the above-mentioned trade-off. Then, we proceed proposing a simple technique to maximize the latter by addressing the “last-hop problem” and compare its performance to the set of alternative solutions. Our numerical results illustrate that bumper location is better in terms of relaying communication distance. Furthermore, the proposed last hop selection strategies allow for extreme performance gains in terms of data rate as compared to the traditional approaches reaching for large ISD and 400–500% for small ISDs. In absolute numbers, the proposed relying with the last hop selection strategy allows for reducing the required BS density along the highways by 15–30% depending on the vehicle density and required level of connectivity.
1. Introduction
The recently standardized 5G New Radio technology is facing principal challenges in terms of its millimeter wave (mmWave) deployment option. Specifically, the inherently large propagation losses and sensitivity to static [1] and dynamic [2] blockage phenomena require very dense deployments to provide continuous service to users [3,4,5] resulting in extreme capital expenditures (CAPEX) for network operators. At the same time, mmWave deployments are critical for achieving IMT-2020 requirements set forth by ITU-T in M.2410 specification [6]. On top of this, similar problems will be inherent in the next evolution of communications systems operating in the sub-terahertz (sub-THz) band [7,8].
The problem of costly deployments is expected to be alleviated with the recently proposed by 3GPP Integrated Access and Backhaul (IAB) technology. Specifically, by utilizing multi-hop communications, in 3GPP Releases 15–17, a fixed infrastructure based on IAB technology has been proposed [9] by utilizing cost-efficient relays, called IAB nodes. In the forthcoming Release 18, this concept is expected to be extended to mobile IAB nodes, forming 3GPP compliant multi-hop relaying on-the-fly [10,11].
Highway scenarios are expected to be one of the natural early adopters of this technology. In these deployments, providing full coverage is extremely costly, especially, on not-so-frequently utilized roads. Here, vehicles may serve as mobile relays creating the so-called “bridges” that will potentially allow for decreasing the required density of mmWave/sub-THz base stations (BSs) providing ubiquitous coverage. However, in such deployments, there are inherent trade-offs between bridge length in terms of relaying vehicles and the provided bridge rate as the latter is determined by the link in worst signal-to-noise ratio (SNR) conditions. Furthermore, in most cases, the worst link happens to the last one offloading the traffic to the mmWave/THz BS as the bridge is often interrupted once the vehicle with direct infrastructure connectivity is achieved.
1.1. Related Studies
Signal propagation in the Vehicle to Everything (V2X) environment has been well investigated in the context of LTE and mmWave systems. For example, in [12], the influence of the location of the antenna on the car on the fading during data transmission was characterized. Six types of antenna locations were analyzed. As a result, it is shown that the closer the receiver and transmitter are located, the more likely the signal is blocked by the car body, and the best location for the transceiver is on the side pillars. For our scenario, three locations turned out to be the most suitable: (i) bumper, (ii) engine, and (iii) windshield. In addition, we have considered various cases of distances between the receiver and transmitter, although only 10 m and 100 m are suggested.
The authors in [13] investigated the dependence of the coverage area on the signal attenuation. Multiple cases of data transmission in the line-of-sight (LoS) zone and in the blocked zones by other cars are considered. The result showed that it is necessary to forcibly limit the connection to the nearest car in order to maintain reliable connectivity. In our work, we consider three communication scenarios: LoS, non-LoS (NLoS), as well as reflection from cars in the adjacent lane. The study [14] investigated the effect of interference in the simultaneous transmission of data from several vehicles. A two-lane road with cars and a data transfer scenario from the BS to a car in the far lane are considered. The probability of packet loss was studied, as well as the average throughput when the signal is blocked by a neighboring car. The results show that the packet loss probability depends on the number of antenna clusters installed on the BS, as well as on the channel nonlinearity. In our study, we also take into account blockage by other vehicles. However, we explore the possibility of relaying through other vehicles using directional antennas to improve the reliability of communications.
An equally important problem in V2X communications in mmWave/sub-THz bands is beamforming and interference. In [15], the authors investigated the signal quality polling rate to recalculate beam direction and improve the quality of data transmission. The considered average speed of cars is set at 10.5 miles per hour, which is typical for suburban and dense urban conditions. The authors reported an optimal channel state polling time of 300 ms for the indicated initial data. The applied approach also allows us to study the polling frequency for other vehicle speeds. In our work, we studied the movement of a traffic flow at a speed of 25 m/s, which is a more complex scenario in terms of polling the channel state. Addressing the problem of interference the authors in [16] demonstrated that, for directions communications in the mmWave/sub-THz bands, its effect is negligible.
In addition to the main quality indicators and different ways to establish single-hop communications, an important issue is the position of cars in the lane. The scenario involving different offsets of vehicle locations with respect to the lane width is considered in [17]. The aim of the study was to propose an efficient beamforming method for predicting the directions to the communicating entity based on past information. In our work, this aspect is not taken into account as we assume that the vehicles are positioned in the middle of the lanes. An interesting study was performed in [18], where the authors considered an intersection scenario with multiple concurrent transmissions from two BS. Their results showed that the use of Non-Orthogonal Multiple Access (NOMA) access technology reduces the probability of blockage by approximately two times, depending on the channel parameters. At the same time, blockage of propagation paths by both external and other vehicles is provided. The authors of the study compared the NOMA and OMA methods using an analytical model, and also validated their studies using the Monte Carlo simulations.
The concept of relaying was thoroughly studied in a number of works on communication systems that exploit unmanned aerial vehicles (UAV). Accordingly, in [19], the end-to-end performance of such a system where a relay UAV connects mobile users was evaluated in terms of the ergodic sum rate. The authors analyzed the trade-offs affecting the optimum position of buffer-aided (BA) and non-BA relay UAVs. The achieved results revealed that the random variations of the free-space optical backhaul link caused by the UAV’s instability can be mitigated by BA relaying which results in a larger achievable ergodic sum rate compared to non-BA relaying at the expense of introducing an additional delay into the system. The authors of [20] investigated the possibility of using unmanned aerial vehicles (UAV) as mmWave mobile base stations. They considered the air-to-ground signal propagation model in line of sight, as well as in the presence of blockers. The authors analyzed signal propagation using direct and 3D beamforming. The results showed that 3D shaping improves the overall quality of the channel. In [21], the authors proposed a system design concept for multiple connected UAVs which form relaying bridges for offloading data traffic from an overloaded cell. By utilizing stochastic geometry and renewal theory, they obtained the offloading gain of the multi-hop UAV bridges. The obtained numerical results demonstrated that the use of buffering at the UAV side drastically improves the achievable offloading gains.
Summarizing the related work, we note that most of the studies on V2X communications performed so far concentrated on a single-hop characterization such as the choice of the propagation paths, the impact of blockage, etc. The system-level studies assessing the performance of multi-hop communications and providing insights on the BS deployment density along the roads are missing. In addition, there are no studies addressing the selection of the last hop in multi-hop communications scenarios.
1.2. Contributions
In this paper, to fill the above-mentioned gap, we first propose a mixed analytical-simulation framework to characterize the trade-off between multi-hop bridge length and achieved rate in highway deployment of mmWave/sub-THz BS. To this aim, we utilize empirical measurements of propagation at 300 GHz, realistic IEEE 802.15.3d modulation and coding schemes (MCS), and then apply the tools of stochastic geometry to form the bridge based on multiple propagation paths between communicating vehicles. We further proceed to propose the last hop selection strategy that allows for improving the capacity of the multi-hop bridges. We comprehensively compare its performance to alternative strategies.
The main contributions of our study are:
- In terms of optimal antenna locations: (i) bumper location is better in terms of bridge length; (ii) the bumper and engine locations coincide in terms of the data rate, and (iii) engine level location is characterized by the least number of hops thus requiring the least signaling overhead;
- Since the LoS propagation is dominant for all the considered last hop selection strategies contributing more than 90% of all the paths, for reasonable road traffic conditions, the lower the traffic density, the higher the bridge availability and linear increase in the number of hops leads to a linear increase in the bridge availability;
- The proposed last hop selection strategy leads to extreme performance gains in terms of data rate as compared to the “first opportunity” strategy reaching 100% for large inter-site distance (ISD) and 400–500% for small ISDs.
2. System Model
In this section, we formalize our system model. We start with the deployment and then proceed to introduce relaying, antenna locations, and propagation assumptions. Finally, we define our metrics of interest. The notation utilized in this paper is summarized in the abbreviations section.
2.1. Deployment Model
We consider highway deployment of sub-terahertz 6G BSs as shown in Figure 1. We assume that the BSs are deployed on both sides of the road at the constant height . To reduce CAPEX, it is possible to use existing road infrastructure, e.g., lamp-posts. We denote the road length between two adjacent BSs by d, the number of lanes in both directions by , and the lane width by w. Observe that BSs form isosceles triangles with the base of and height . We also assume that the speed of the vehicles is constant and equals v km/h, while their positions along the lanes follow the shifted Poisson process of intensity . The shift is introduced to reflect both the vehicle length and minimum separation distance required for safe driving of automated cars or dedicated control systems [13].
2.2. Relaying, Antenna Locations, and Propagation Paths
Relaying is one of the promising techniques that allow for reducing the costs of BSs deployment along the road. As in mmWave/sub-THz band communication, distances are considerably shorter than in microwave systems such as LTE or sub-6 GHz New Radio (NR), relaying may provide effective coverage even on “blind” segments of a road, where direct communication with BSs is not possible. However, due to the gradual penetration of new technologies, relaying highly depends on how many vehicles around are equipped with transmitters. To reflect this phenomenon, we introduce the technology penetration rate parameter , which is the probability of having corresponding equipment installed on a vehicle. We also assume that the equipment includes a couple of interconnected transceivers located on the front and rear sides of vehicles [22].
The vehicles are assumed to provide eMBB services to the passengers. When direct communication to the next BS is not feasible due to outage conditions, a vehicle employs relaying to organize a “bridge” to the BS. The length of the bridge and the achievable data rate strongly depends on the deployment, environment, and antenna locations. In this paper, we consider three viable antenna locations: (i) bumper-level (0.3–0.4 m), (ii) engine-level (0.4–1 m), and (iii) windshield level (1–1.5 m). Not only do the propagation characteristics depend on the antenna location, but also the propagation paths, since the vehicles that are not equipped with transceivers may potentially act as blockers and break off the bridges.
We assume that relaying is only organized by vehicles on the same lane which provides the most stable environmental conditions. We utilize the propagation paths measurements from [23,24] providing an exhaustive characterization of propagation paths between two vehicles in the road conditions at 300 GHz. If there are two or more blocker vehicles (hereafter referred to as blockers) on the same lane, bypassing relays is assumed not feasible. All the options may employ side reflections from the vehicles located on the adjacent lanes to bypass a blocker vehicle. However, only for windshield-level location, the vehicles may communicate through the rear and front glasses of a blocker, though with heavy propagation losses of about 20 dB. On the other hand, the bumper-level location may employ an under-vehicle propagation path which is constructed on reflection off the road surface with the losses of not more than 1–2 dB for typical distances. As the engine-level location may only utilize side reflection with typical losses of 5 dB, it seems rather disadvantageous which will be shown in Section 4.
2.3. Propagation Model
The value of signal-to-interference plus noise ratio (SINR) for the communicating vehicles located at the distance d in the mmWave/sub-THz bands can be generally written as [25]
where is the path loss exponent, I is the interference, is the thermal noise, is emitted power, and are the transmit and receive side gains, is the absorption losses, and represents impairments caused by bypassing conditions.
The presence of molecular absorption loss due to internally vibrating molecules is a unique feature of the sub-THz and THz bands. The molecular absorption of electromagnetic waves is the effect occurring when the frequency of the wave is close to the resonant frequency for internal vibrational modes of a molecule. By following [25,26], the absorption loss is characterized by
where f is the operating frequency, d is the separation distance between the transmitter and the receiver, while is the transmittance of the medium that can be well approximated by the Beer–Lambert law , where K is the overall absorption coefficient. The procedure to calculate is detailed in [26,27]. In this paper, we use the coefficient for the standard air having 78.1% of nitrogen and 20.9% oxygen, at the standard altitude with a water vapor fraction of 2%, which can be retrieved from the HITRAN database [28]. In our study, we adopt the bypassing path losses obtained in [23] through an extensive measurement campaign that provides the comprehensive and accurate results summarized in Table 1.
2.4. Last Hop Selection
To assess the impact of the last hop selection, in this paper, we consider three strategies: (i) first opportunity (FO), (ii) prescribed quality (PQ), and (iii) best quality (BQ). The first strategy implies that a bridge to the BS is established as soon as possible, i.e., if after a few relays there is a LoS path to the BS at the distance , the system attempts to initiate a connection. Though the FO strategy does not allow for any control over the quality of the channel, it provides the shortest latency, as the number of hops is always the fewest possible.
The most flexible strategy is the PQ, as it enables selecting the minimum required MCS for the connection among all the hops within a bridge. Considering the last hop, it allows for completion of the bridge if only the hop channel quality is good enough, i.e., it meets the prescribed data rate. By varying the required MCS, it is possible to improve the data rate at the cost of bridge availability. The last strategy is BQ which is aimed at improving the quality of the last hop as much as possible. This means that the system starts scanning the quality of the channel to the BS and attempts to find more relays until the degradation of quality is observed. This allows for further improvement of the data rate but requires more hops along with more sophisticated bridge signaling.
2.5. Metrics of Interest
We consider the following system-level performance characteristics of multi-hop relaying bridges: (i) bridge availability at the given distance, (ii) attained data rate, and (iii) path usage probability. Here, bridge availability is estimated with respect to a certain distance to the BS and characterizes the probability that the connection to the BS can be established. The data rate is defined by the modulation and coding scheme (MCS) that is utilized for the hop with the worst channel quality among those that construct a relaying communication path.
The final metric of interest is path usage. The path selection is always driven by the best channel conditions, i.e., we assumed that, when there are several feasible paths for a single hop, the path with the highest SINR is selected. This metric allows for a detailed analysis of antenna placement options revealing their advantages depending on traffic conditions.
3. System Performance Analysis
In this section, we present our mixed analytical-simulation framework. We start with characterizing single-hop communication distances, then proceed with the formalization of the relaying model and finally outline the details of the system-level simulations we utilize to obtain the metrics of interest.
In what follows, we utilize the set of modulation and coding schemes specified in IEEE 802.15.3d standard [29]; see Table 2 and propagation path measurements in the V2V environment reported in [23].
3.1. Communications Distances and Attained Rates
By following the propagation measurements in [23], the maximum communication distance with tolerable received signal power for path is given by
where is the transmit power, and are the transmit and receive side gains, is the carrier frequency, is the thermal noise, and is the propagation loss when utilizing path that refers to LoS (hereafter denoted as L), side reflection (R), and through-windshield scenarios (W).
The critical distance for under-vehicle propagation (U) can only be obtained numerically by utilizing the following expression:
where is the transmit power in watts, and and are the constants that characterize specifics of the antenna location [23]. Then, if we consider the critical sensitivity of transmitters , this enables us to derive the uttermost communication distance for single-hop communication as
for path , and similarly by setting in (4) for evaluating .
In our model, the data rate is defined by the MCS specified in IEEE 802.15.3d standard. That is, once the communication distance falls into a range limited by received signal power, the corresponding data rate is shown in Table 2.
3.2. Relaying Model Formalization
To model locations of vehicles along the lane, we utilize the shifted Poisson process. Recall that the probability density functions (pdf) of the distances [30] to the i-th neighbor in the Poisson process of vehicles follows Erlang distribution in the following form [31]:
The random distances to the nearest neighbors in the shifted Poisson process can be obtained by conditioning the minimum separation distance between vehicles. These separation distances between centers of the vehicles are given by leading to
where when .
When direct LoS communications are not feasible, it might still be possible to operate via a side reflection on an adjacent lane if both conditions are satisfied: (i) the vehicle–reflector is located in a proper position, and (ii) the blocker vehicle is not close enough to block the LoS towards the reflector. Denote the distance between the two communicating vehicles by r. Then, the first condition means that the projection distance from the transmitter to reflector vehicle should fall into the range
where and is the half-power beamwidth (HPBW) of the antenna radiation pattern. The second condition is defined by the following range for the distance to the blocker
For under-vehicle propagation, the reflection off the road is always possible, provided that the blocker does not bar the propagation path leading to the range
where .
3.3. System-Level Simulation Tool
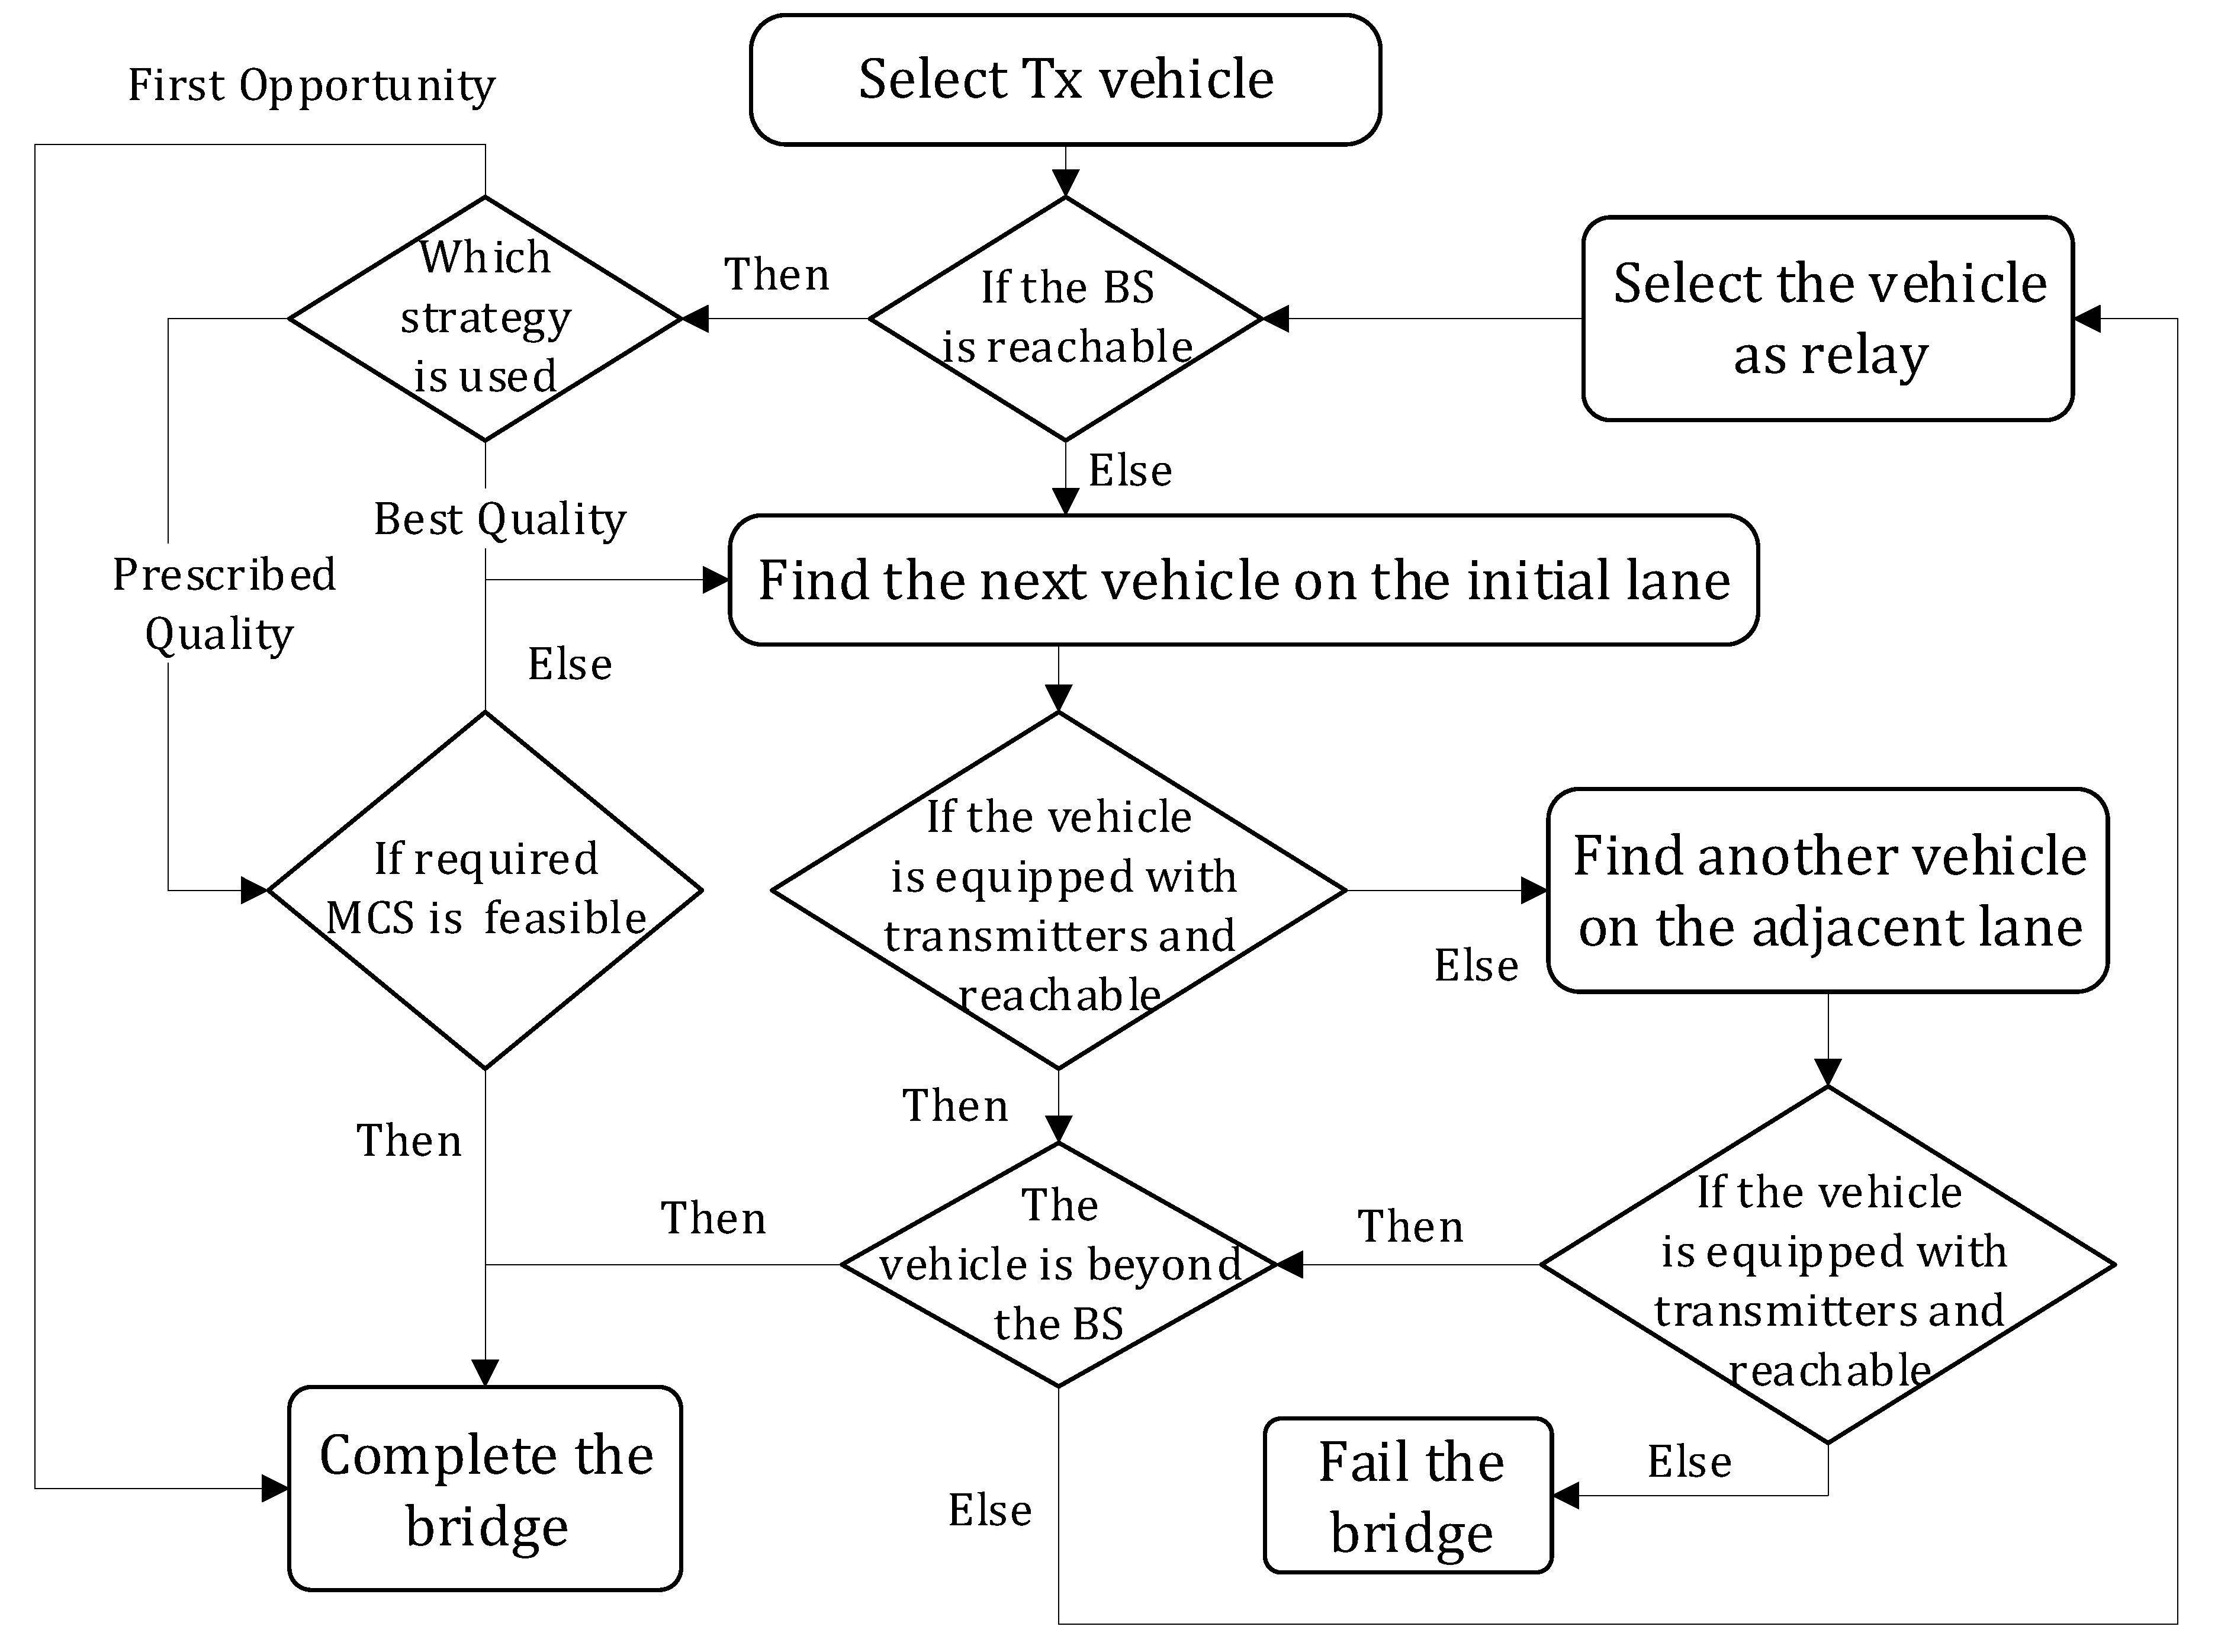
To study the system proposed above, we have developed a system-level mmWave/sub-THz signal propagation simulation tool. The pseudocode for calculating the main metrics for FO strategy and windshield-level antenna location is presented in Algorithm 1, while the details of relay selection with regard to the considered last hop selection strategies are schematically shown in Figure 2.
Algorithm 1 proceeds as follows. We start with the parametrization of our model and the definition of output parameters. At step 1, we introduce the critical distances of communication paths. Then, we allocate the vehicles on the road employing distance distribution (7) until the next vehicle gets over the segment of interest (steps 4–6). First, at steps 8–12, we check if there is an LoS path between the current vehicle and the BS, and if it is reachable, the bridge is established. Otherwise, the possibility of a relay is validated in steps 13–15, and if the bridge is blocked, it is considered unavailable. Within the next steps, we define the appropriate propagation paths of the hops. At steps 16–21, the vehicle attempts to find a LoS path toward a relay. If it is not feasible, the availability of a side reflection on the adjacent lanes is considered (steps 23–25). When neither LoS nor side reflections are available, the algorithm evaluates the channel quality through the front and rear glasses of the blocking vehicle (25–25). Having completed trials, at step 34, we finally calculate the metrics of interest. Alternatively, the algorithm is schematically presented in Figure 3.
| Algorithm 1 Simulation algorithm of establishing relaying communications |
|
In Figure 2, we present the algorithm of bridge construction in line with the considered last-hop selection strategies. We first start with evaluating the possibility of direct communication with the BS. If the communication is feasible, we attempt to apply the last hop selection strategies. In the case of FO strategy, the direct communication is set up immediately, while for PQ and BQ, the algorithm seeks for relays to improve the quality of the last hop channel till the required MCS is feasible or there are no more relays available, respectively. Alternatively, if the BS is not reachable from the current node of the bridge, the algorithm starts to search for another relay with the priority of the lane where the initial vehicle is located. Once neither the BS nor another relay is available for communication, the bridge is considered as failed. On the other hand, if the next relay vehicle is beyond the BS, the channel quality can not be further improved, which leads to the bridge completion.
To obtain the numerical results described, we have carried out a large-scale simulation campaign. Since all the processes in our model are stationary in nature, our system is in a stationary state. All data were collected by averaging the results of the experiments. In each scenario, at least 10,000 experiments were carried out to obtain the data for statistical processing. To obtain the statistical estimates, we utilized the batch means method [32]. In what follows, we demonstrate only point estimates of the metrics of interest. The reason is that, in each experiment, we collect a sufficient number of batches so that the confidence intervals do not deviate from the point estimates by more than at a significance level of .
4. Numerical Results
In this section, we elaborate on our numerical results. Specifically, we start characterizing the trade-offs between the data rate and ISD. Then, we proceed with the impact of the system, road traffic parameters, and the last hop selection scheme. Finally, we demonstrate the use of different propagation paths. The default system parameters are shown in Table 3.
4.1. Different Antenna Locations
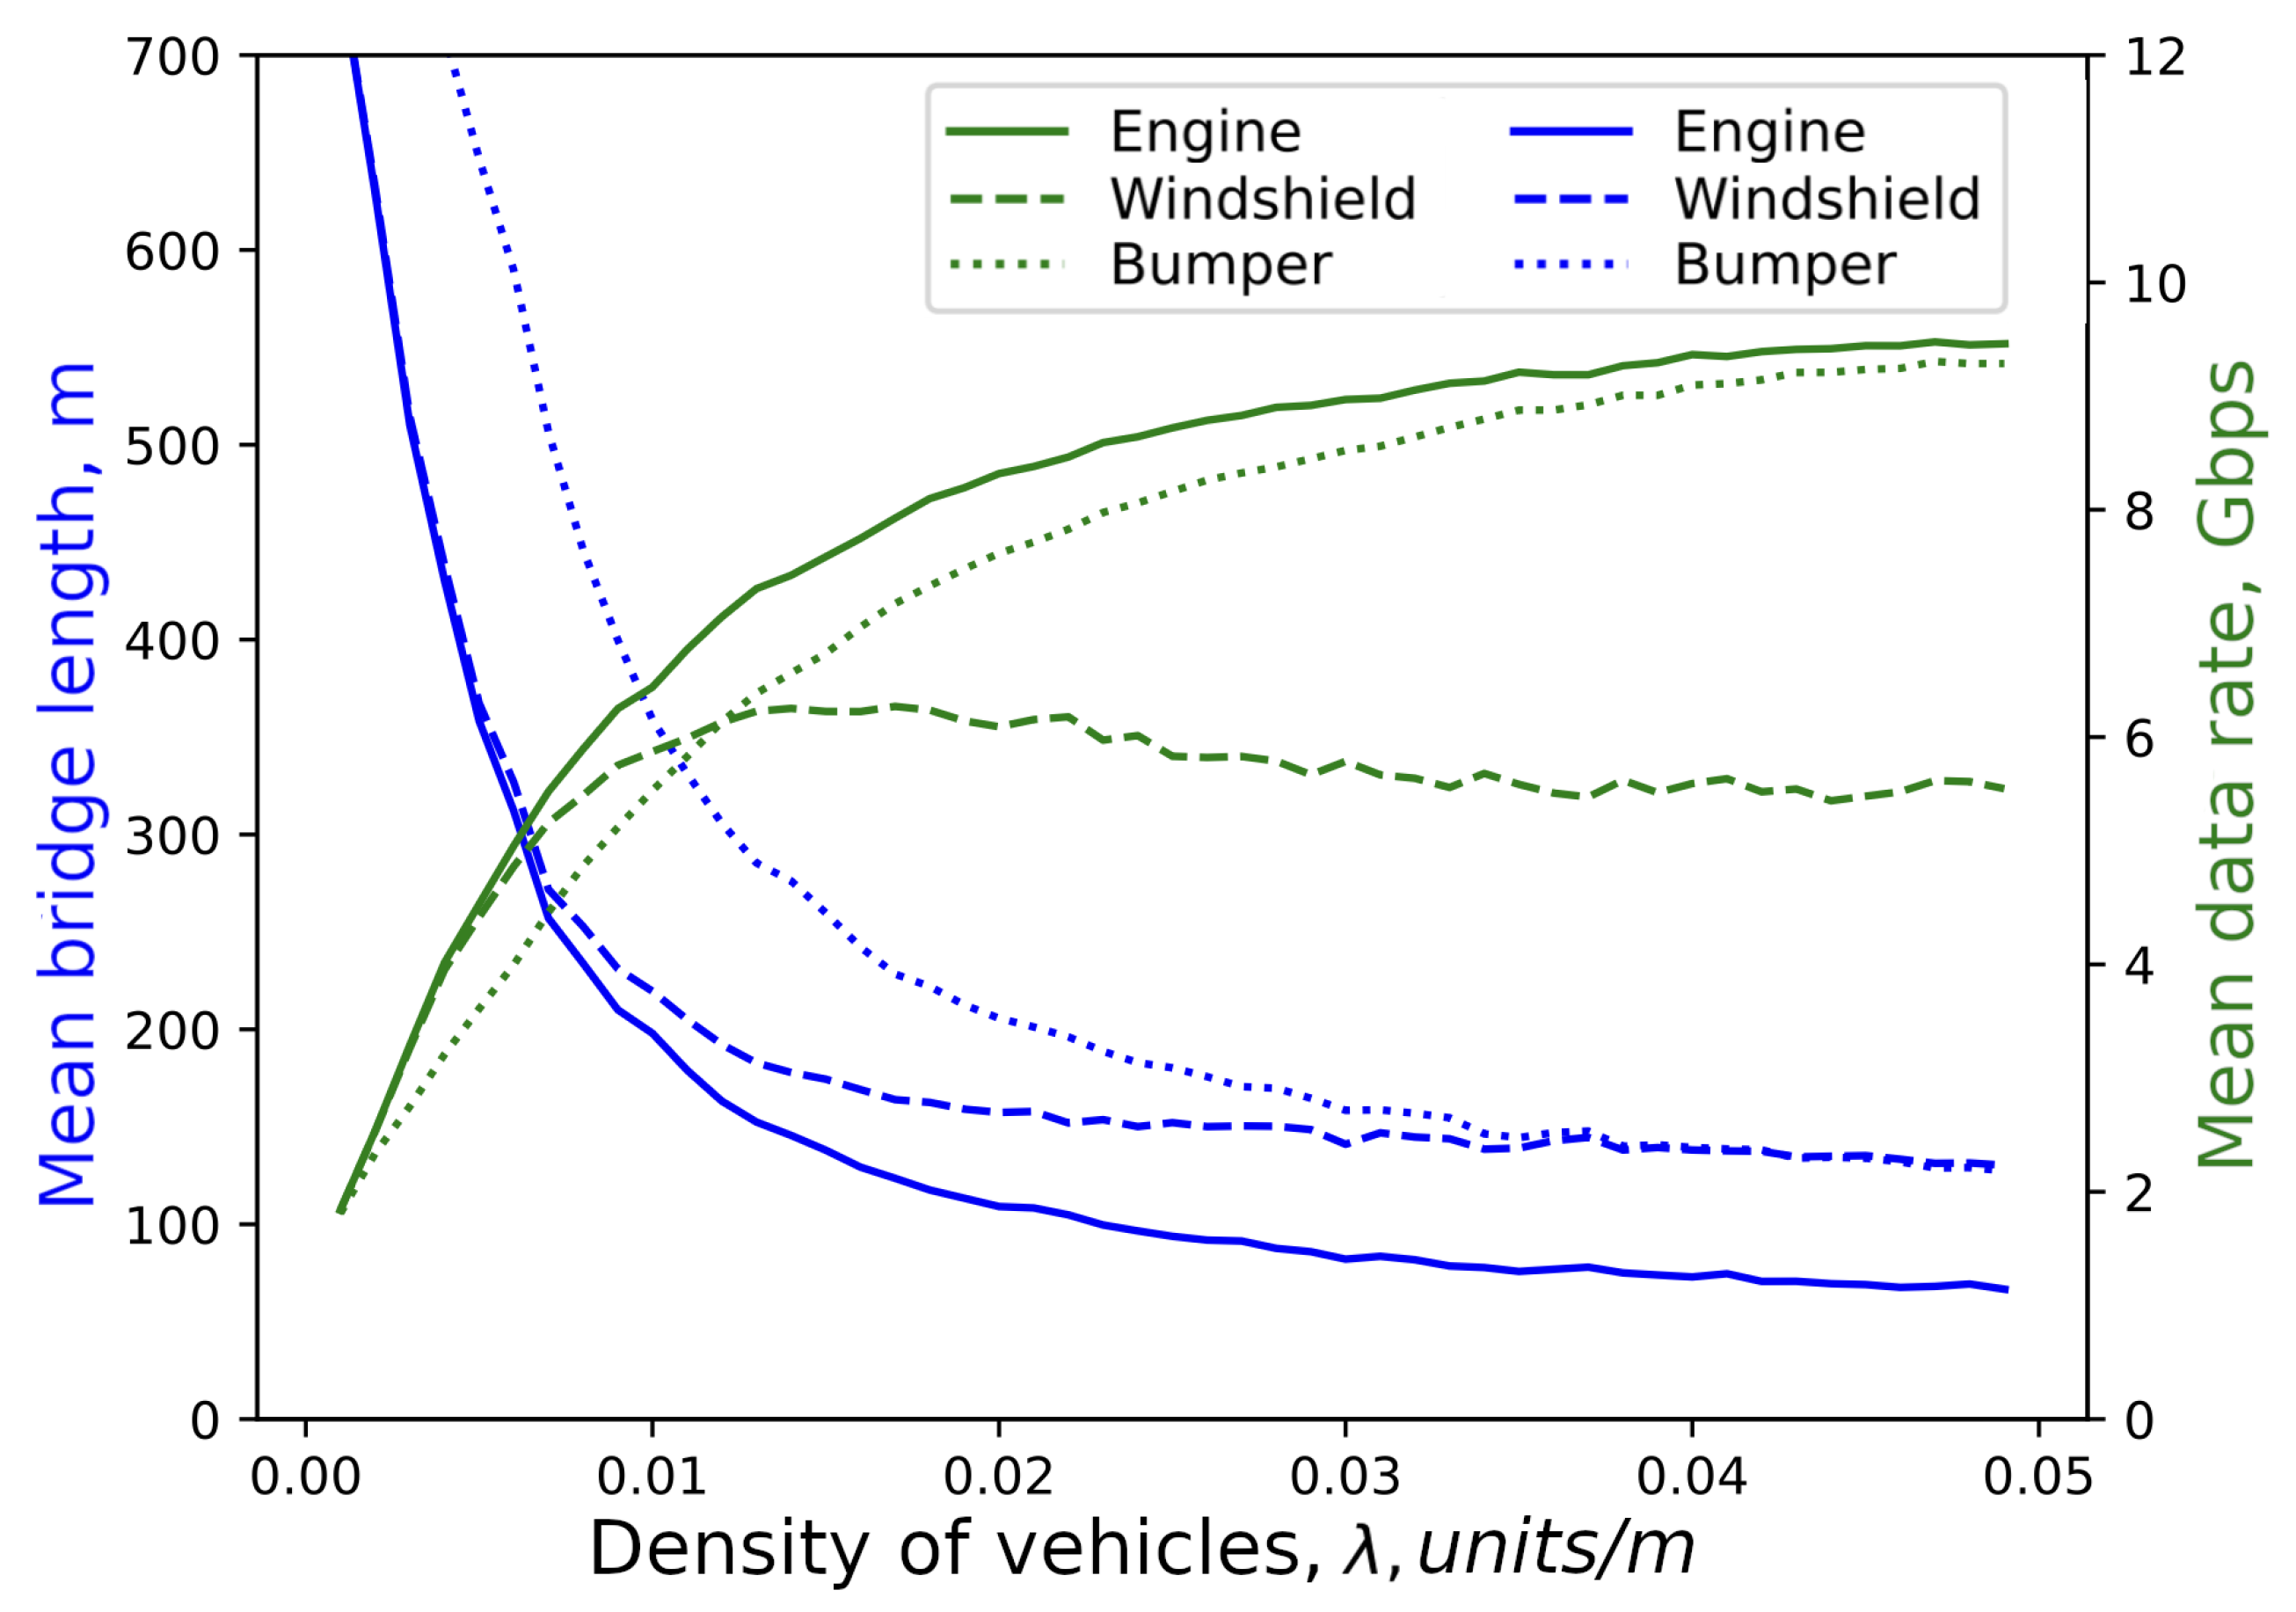
We start with Figure 4 illustrating the data rate and mean bridge length as a function of the density of vehicles for different antenna locations. The other parameters such as the number of unidirectional adjacent lanes M and the maximum allowed number of hops are set to and , while the applied last hop selection strategy is FO. Here, we see that there is an inherent trade-off between the considered metrics—as the data rate increases with , the mean bridge length decreases. This trend is observed for all the considered locations with the notable exception of windshield location, where the data rate plateaus. This behavior is explained by the fact that, at large inter-vehicle distances, the propagation through the windshield becomes impossible while the under-vehicle propagation path is not available for this location option. Furthermore, observe that the difference between bumper and engine locations in terms of the data rate is rather insignificant while there is a notable difference between these schemes from the bridge length point of view. Similar results are observed for other last hop strategies. Thus, considering both metrics altogether, we observe that the bumper antenna location is preferable.
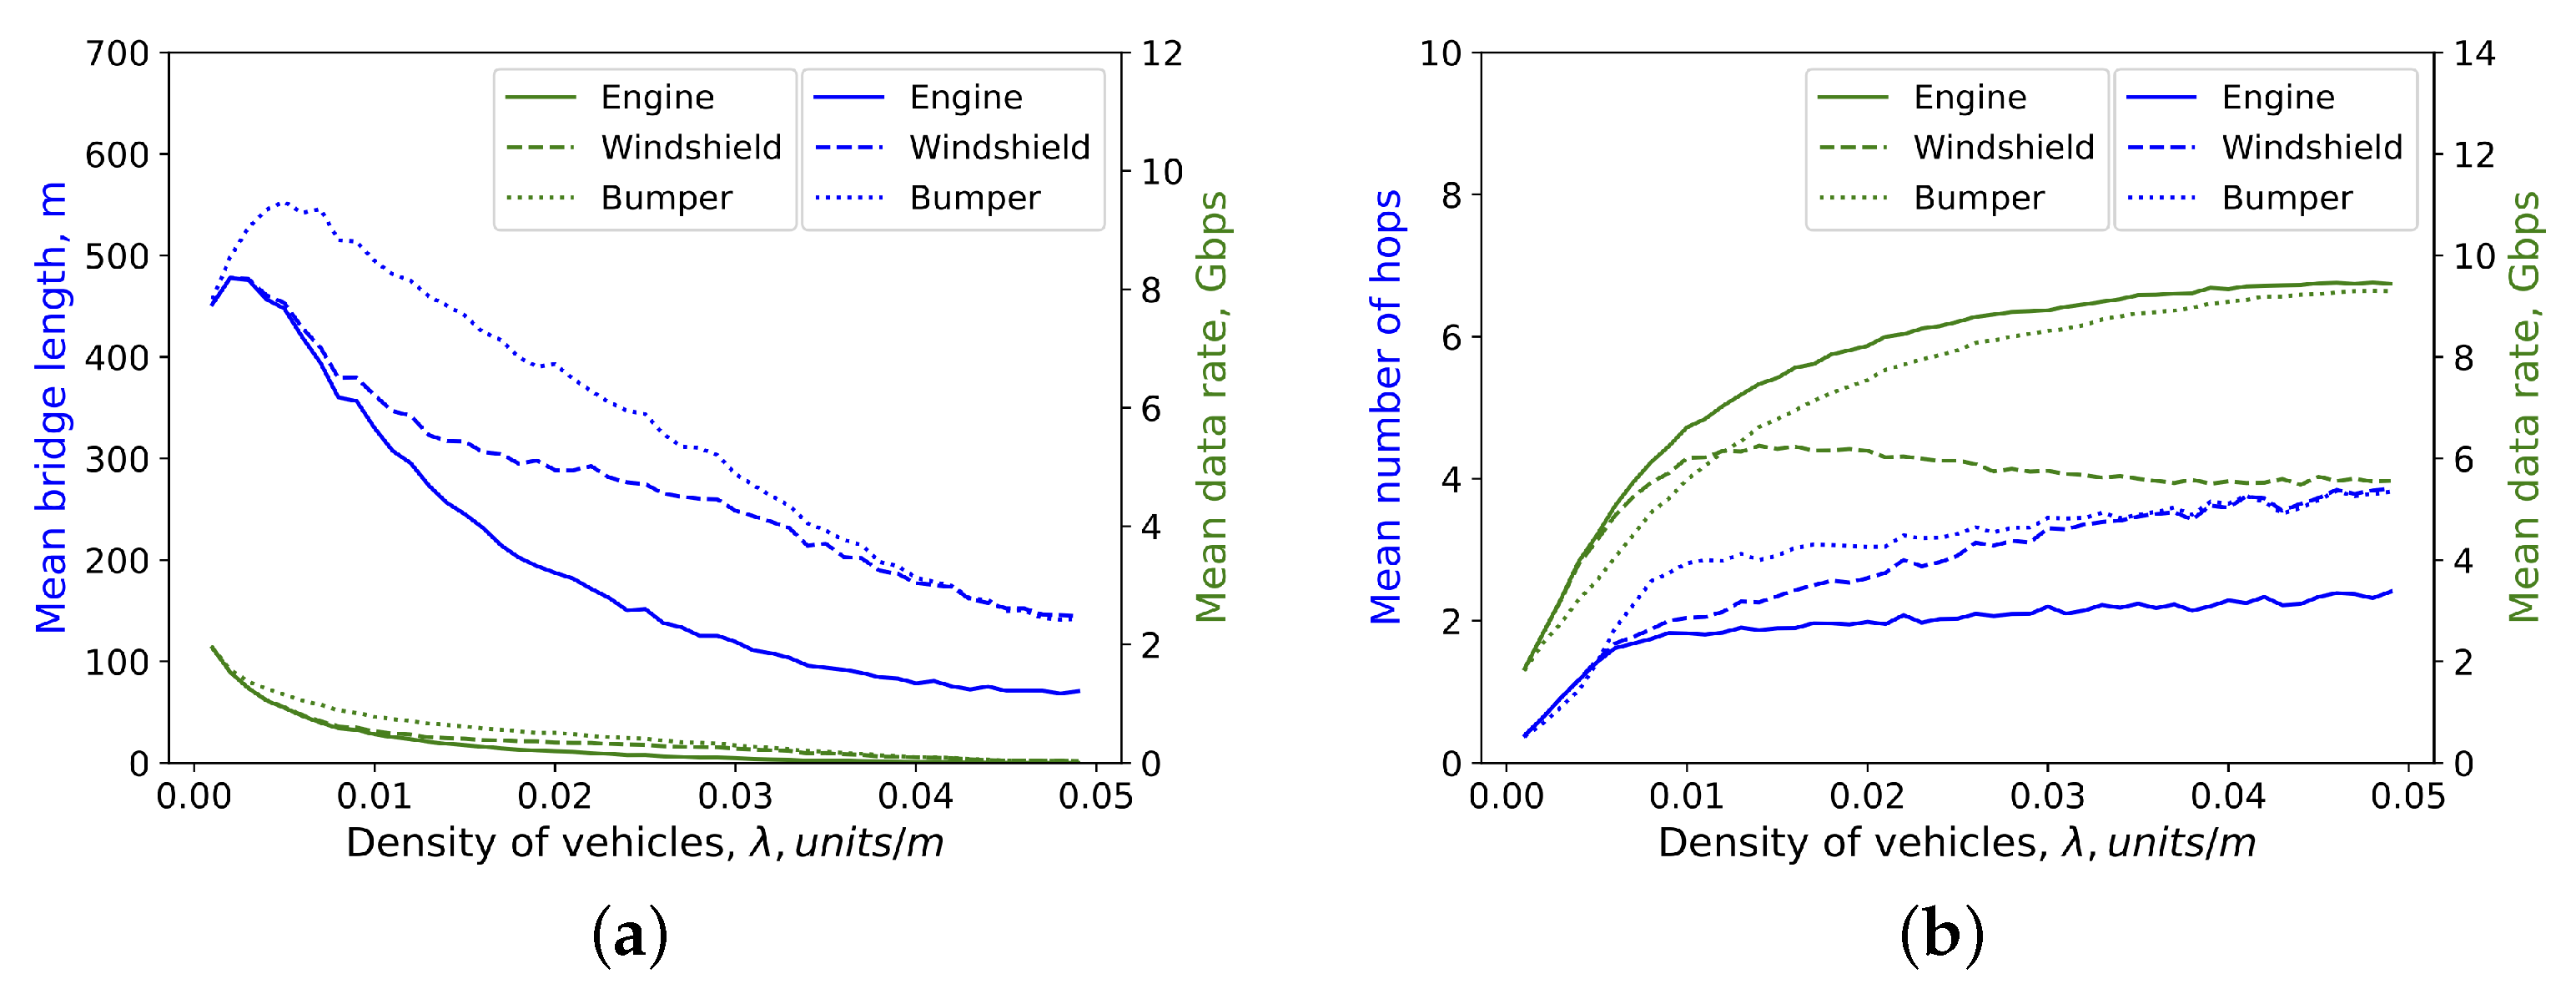
We continue our discussion with Figure 5a, where, contrary to Figure 4, we show conditional data rates and bridge length as a function of the vehicle density on the road for three considered antenna locations. The other parameters are set as , , while the applied last hop selection strategy is FO. Here, we see that logically the better bridge length and data rates are observed for bumper location. These effects are explained by the availability of propagation paths with better propagation conditions, specifically, the under-vehicle propagation path in case of bumper location. For example, for the windshield antenna location, the through-the-window propagation path that can be considered an alternative to the under-vehicle path for bumper location is characterized by much higher attenuation as shown in [23]. However, for larger values of the vehicle density and the windshield location, the bridge length approaches the values of the bumper location. The reason is that, for these densities, the propagation paths are dominated by direct LoS and side-reflections paths, and they have similar attenuations for windshield and bumper locations. However, as shown in Section 2, the engine location is characterized by much higher attenuation associated with the side-reflection propagation path, thus resulting in worse coverage and data rates.
The number of hops is one of the most important parameters for multi-hop communications. In fact, in practical implementation, the higher the number of hops, the more complex the control signaling. As a result, the number of hops might be limited. The behavior of the data rate is further explained in Figure 5b showing the data rate and the mean number of hops as a function of the vehicle density for all the considered antenna locations with the parameters set as , , and last hop selection strategy is FO. As one may observe, the engine location is characterized by the least number of hops, thus requiring the least signaling overhead. Although this also translates to a better data rate, the bumper antenna locations are not far behind while showing the smaller number of hops. These trends are again related to the availability and “quality” of the propagation paths for different antenna locations as we discussed above. The windshield location is a compromise between these two extremes, but the associated data rate is much smaller across the whole considered range of vehicle densities.
4.2. Impact of System Parameters
Having studied the main dependencies, we now proceed with investigating the impact of the system parameters including road traffic conditions and the last hop selection scheme on the probability of establishing a connection to the BS. This metric basically specifies the ISD between BSs corresponding to a certain bridge availability.
We start with Figure 6a showing the bridge availability as a function of the ISD for different vehicle densities. The variable parameters are set as , , while the applied last hop selection strategy is FO. By analyzing the presented data, we observe one important counter-intuitive takeaway—the higher the value of , the higher the bridge availability for a fixed value of ISD. The rationale is that the single-hop communications distance is rather large, especially when operating over the LoS path. However, eventually, there is the density of vehicles that is too small even for direct LoS communications. We also observe that lowering the vehicle density further would eventually result in lower bridge availability.
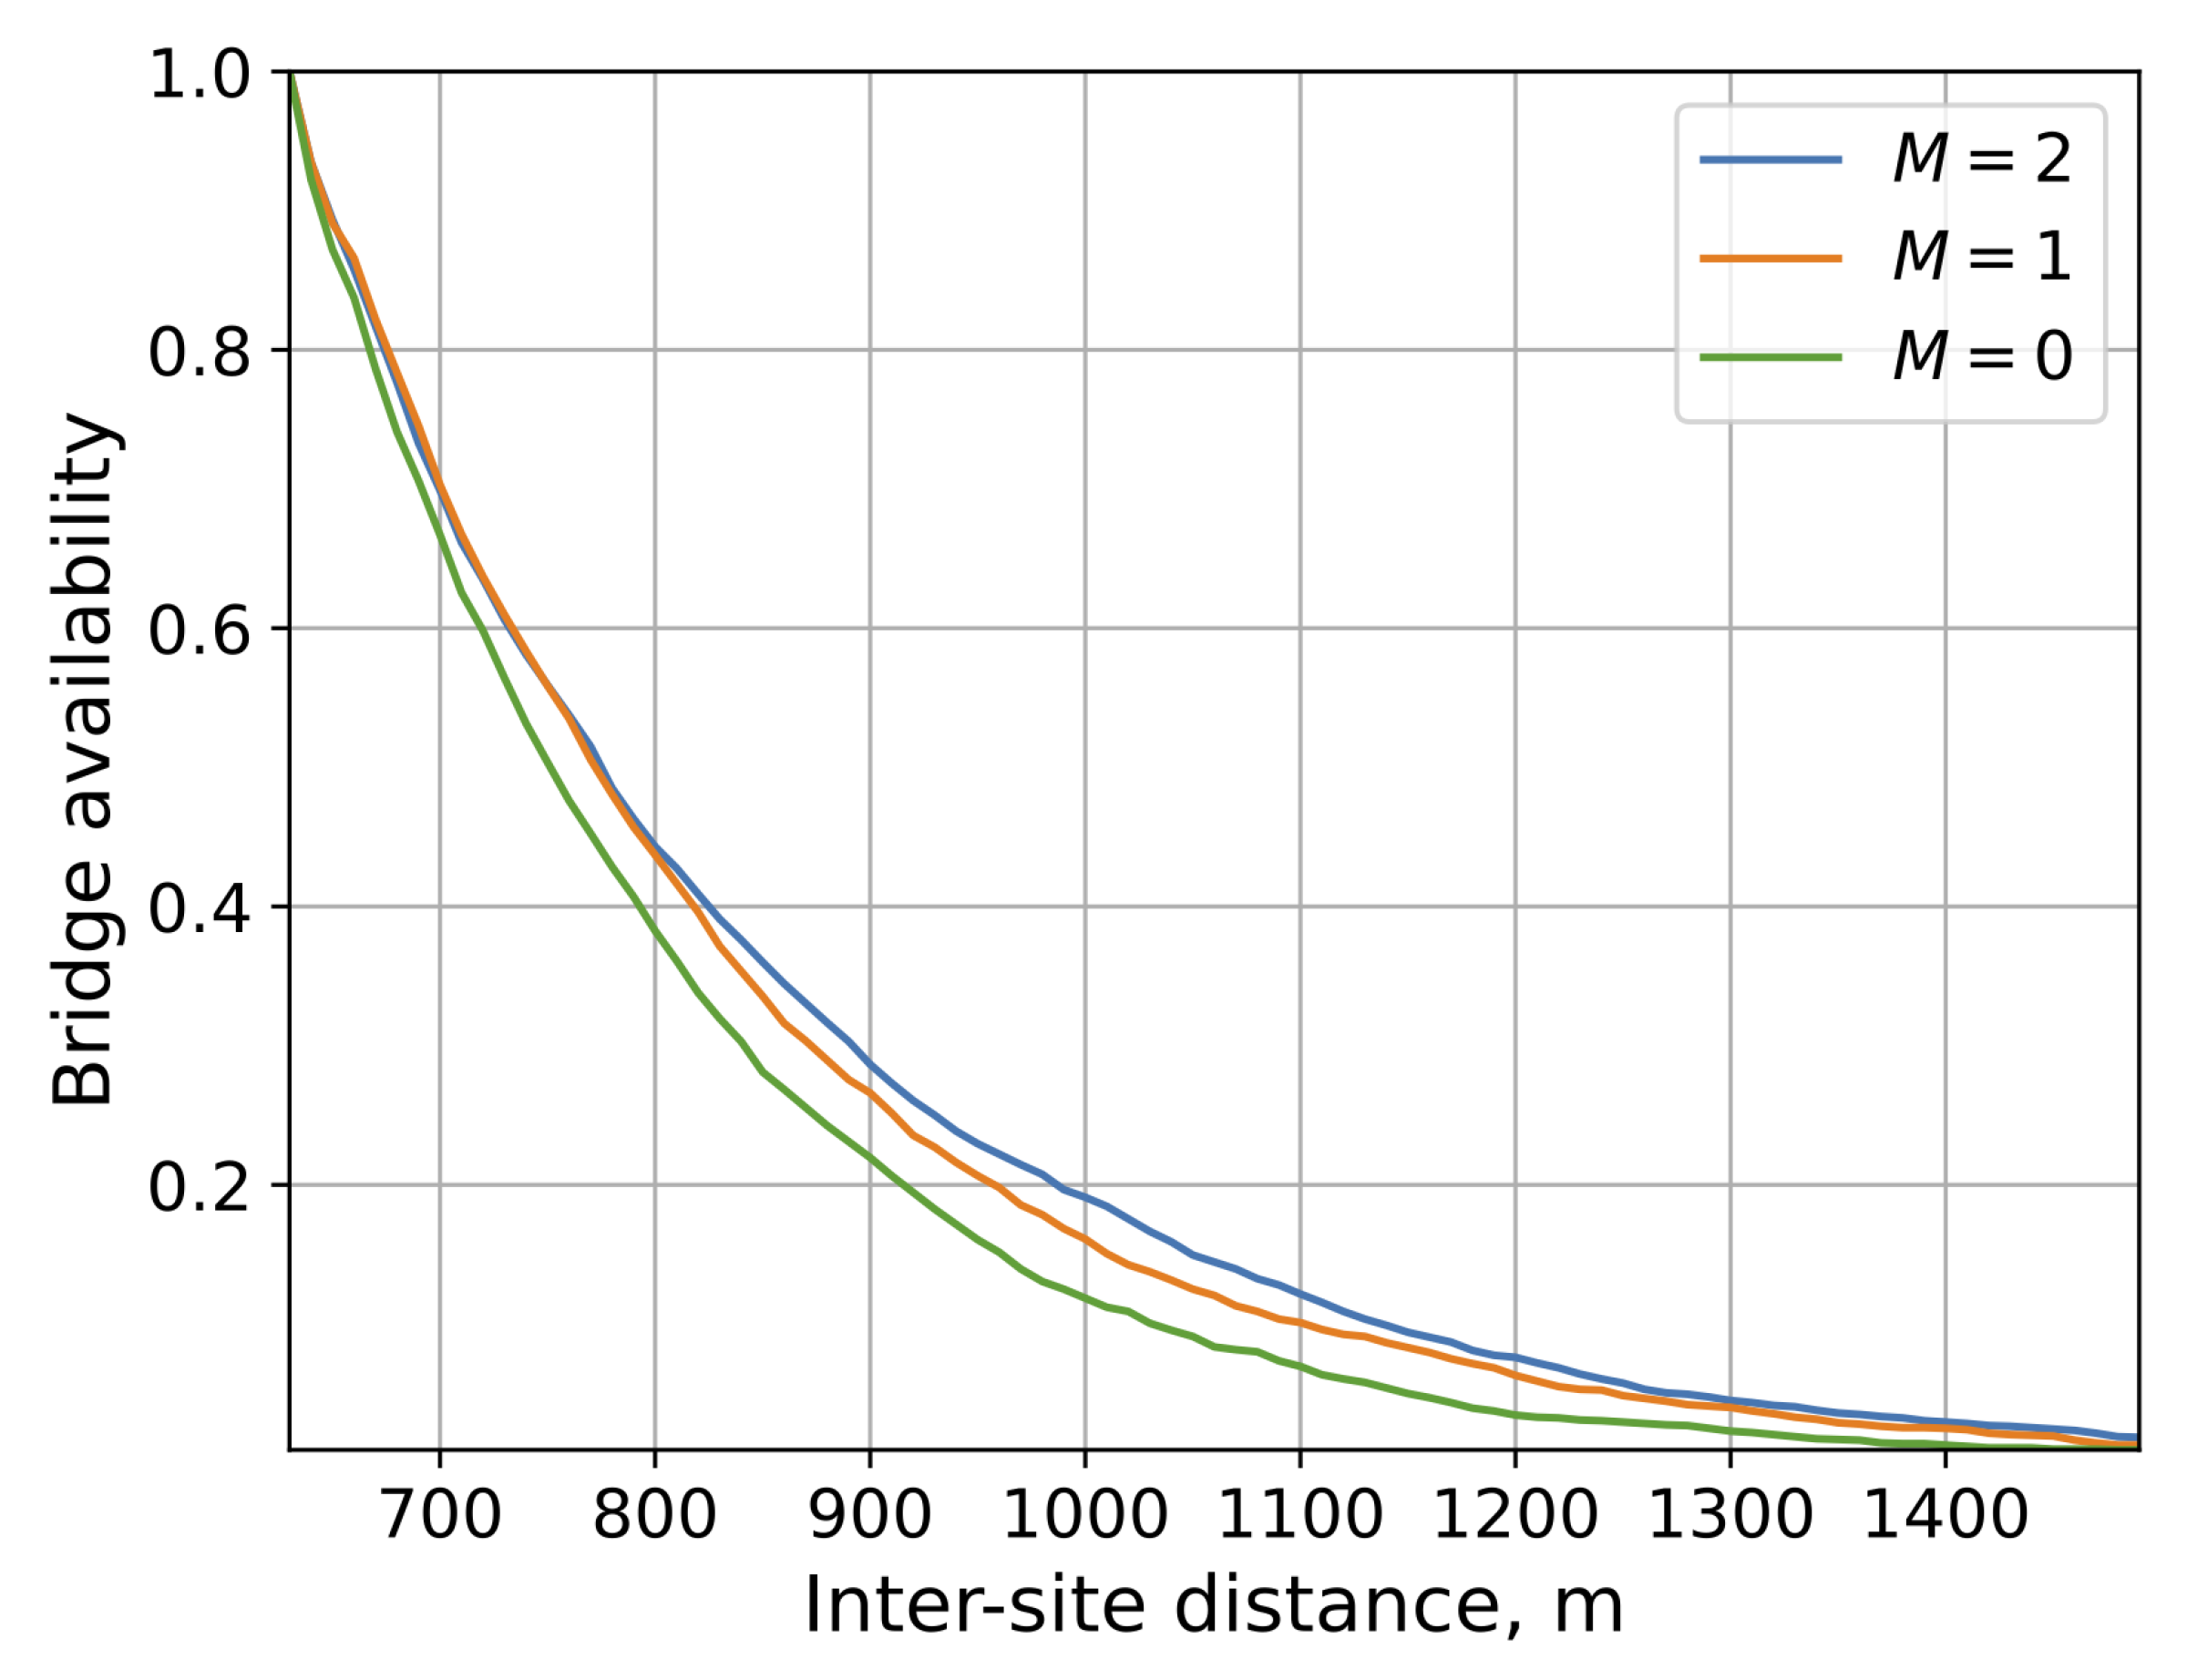
The maximum allowed number of hops is another system design metric. To this aim, Figure 6b shows the bridge availability as a function of the ISD for the different maximum number of hops in normal traffic conditions () for the FO strategy. By observing the data, we note that linearly increasing the maximum number of hops results in an almost linear increase of the bending point, where the bridge availability starts to sharply drop. Still, as one may notice, the impact of the maximum number of hops is of secondary importance compared to the vehicle density for large targeted values of bridge availability. This is because even allowing for just a few hops allows for reliable bridge extension for small distances. However, as the number of allowed hops becomes larger, the whole “ad hoc” construction becomes fragile, reducing the considered metric. The number of lanes is even of less importance as evident from Figure 7 illustrating the bridge availability as a function of ISD for different values of M. Recall that typically corresponds to the highway scenario with multiple lanes, to the rural road, while to the case on one-way roads. Here, the difference between the three considered cases is minimal barely reaching a few percent between and . The rationale is that side-reflections are not that heavily utilized as compared to other propagation paths resulting in a small impact of M.
4.3. The Impact of Link/Hop Selection Strategies
We now proceed to investigate the impact of link selection strategies and last hop selection strategies. The former can be utilized to establish a multi-hop connectivity with a given data rate while the latter ensures that the last link in the multi-hop bridge does not produce a bottleneck.
We start with the link selection strategies in Figure 8a, where the bridge availability is shown as a function of ISD for different target data rates, represented by MCSs. Here, we observe three adjacent lanes with normal traffic conditions. We see that trying to achieve the required data rate over the multi-hop bridge leads to miserable results decreasing the bridge availability drastically to unacceptable values. Thus, we may conclude that the multi-hop bridges even in relatively regular vehicular deployment are inherently opportunistic in terms of the data rate.
Figure 8b shows the impact of the last hop selection strategy as a function of ISD with the observed environment of three unidirectional lanes with normal traffic conditions. Here, we see that, contrarily to forcing all the links in a bridge to achieve a prescribed CQI, performing it for the last hop results in extreme gains in terms of the data rate as compared to the simplest “first opportunity” strategy. Furthermore, we observe that the difference between the advanced last hop strategies is rather mild lying within 5–10%, while the difference between them and the “first opportunity” strategies reaches 100% for large ISD and 400–500% for small ISDs. Furthermore, note that the “best quality” strategy selecting the last hop based on the best CQI shows the best results. However, quite comparable results are achieved by utilizing MCS 6. For practical implementation, however, lower values are recommended as they lead to better bridge availability.
We specifically note that the gains of utilizing comprehensive last hop selection strategies are highly sensitive to the system parameters as shown in Figure 9, where the mean data rate is illustrated as a function of the ISD for different vehicles densities and two last hop selection strategies, BQ and PQ with MCS 3. Here, we report an interesting behavior. First of all, for the BQ strategy, the data rates coincide for all three considered vehicle densities. Alternatively, when MCS 3 is enforced, we see the significant impact of on the data rate. Specifically, the data rate corresponding to maximized the data rate, while lower and higher values of vehicle densities lead to a lower data rate. This is principally different as compared to the increased data rates for lower values of reported for the FO strategy in Figure 6a.
4.4. Path Usage
Having multiple relatively strong propagation paths is a useful property of the vehicular environment. We now proceed to assess the usage of these paths. To this aim, Figure 10 shows the path usage probability as a function of the hop distance for two considered strategies, “best quality” and “MCS = 3”. Here, we see that, for MCS = 3, the LoS path is almost exclusively utilized at all distances. The contribution of the reflected path is insignificant and never reaches even . In the case of “best quality” strategies, shorter links on average are utilized, and they are also dominated by the LoS propagation. Thus, we may conclude that LoS propagation is still the dominant communications way even in vehicular environments.
4.5. The Required BS Density
We conclude our numerical exposure with the ultimate metric of interest—the required BS density for the relaying scheme with the proposed last hop selection. To this aim, Figure 11 shows the gains in the required BS density as compared to the baseline BS-only deployment as a function of the vehicles density, , for different technology penetration rate , the required bridge availability, , and the windshield antenna location. Note that the required BS-only density is 1.55 units/km. As one may observe, for all the considered values of and , the best gains are observed for rather small values of . The rationale is that, under these conditions, the LoS path is efficiently utilized to reach higher distances. Once the density increases, there is gradual reduction in the considered metric. In addition, logically, higher gains are observed for smaller values of the bridge availability and higher technology penetration rates. Speaking in absolute numbers, the maximal gains are in the range of 20–30% for the best identified parameters—loose bridge availability, , and high technology penetration rate, .
5. Conclusions
Motivated by the need to reduce the expenditures on 6G V2X deployments, in this paper, we have formalized a model of relaying communication between vehicles and BSs accounting for sub-THz propagation effects and gradual penetration of the new technology components to vehicle manufacturing. To analyze the proposed system model, we have developed a system-level simulation tool capable of delivering critical quality of service parameters for network operator metrics of interest.
The reported numerical results are based on IEEE 802.15.3d parameters and real measurements at 300 GHz. In this paper, we show that the bumper location is better in terms of bridge length, while the bumper and engine locations coincide in terms of the data rate. For reasonable road traffic conditions, the lower the traffic density, the higher the bridge availability, while a linear increase in the number of hops leads to a linear increase in the bridge availability. The multi-hop bridges even in relatively regular vehicular deployment are inherently opportunistic in terms of the data rate, i.e., forcing them to achieve a certain data rate leads to drastic performance degradation in terms of the bridge availability. Advanced last hop strategies are characterized by the different responses to the system parameters as compared to the “first opportunity” strategy. Specifically, there is an optimal value of vehicle density maximizing the data rate. Finally, LoS propagation is dominant for all the considered last hop selection strategies, contributing more than 90% of all the utilized paths.
Author Contributions
Conceptualization and methodology, Y.G. and K.S.; software, E.M. and V.B.; validation, V.B. and D.O.; formal analysis, D.O.; investigation, V.B., and D.O.; writing—original draft preparation, D.O.; writing—review and editing, K.S. and Y.G.; visualization, D.O. and E.M.; supervision, Y.G. and D.O.; funding acquisition, D.O. and K.S. All authors have read and agreed to the published version of the manuscript.
Funding
Section 2 and Section 3 were written by Darya Ostrikova under the support of the Russian Science Foundation, project no. 21-79-10139. This paper has been supported by the RUDN University Strategic Academic Leadership Program (recipients Konstantin Samouylov, Section 1, Vitalii Beschastnyi, Section 4 and Yuliya Gaidamaka, Section 5).
Data Availability Statement
The data presented in this study are available on request from the corresponding author.
Conflicts of Interest
The authors declare no conflict of interest.
Abbreviations
The following abbreviations are used in this manuscript:
| 3GPP | 3rd Generation Partnership Project |
| 5G | Fifth-Generation |
| 6G | Sixth-Generation |
| BS | Base Station |
| BQ | Best Quality |
| CQI | Channel Quality Indicator |
| EMBB | Enhanced Mobile Broadband |
| FO | First Opportunity |
| HPBW | Half-Power Bandwidth |
| IAB | Integrated Access and Backhaul |
| IEEE | Institute of Electrical and Electronics Engineers |
| ISD | Inter-Site Distance |
| IMG | Incremental Multicast Grouping |
| LoS | Line-of-Sight |
| MCS | Modulation and Coding Scheme |
| mmWave | Millimeter Wave |
| NLoS | Non Line-of-Sight |
| NOMA | Non-Orthogonal Multiple Access |
| NR | New Radio |
| OMA | Orthogonal Multiple Access |
| PPP | Poisson Point Process |
| PQ | Prescribed Quality |
| SINR | Signal-Interference + Noise Ratio |
| V2X | Vehicle to Everything |
| V2V | Vehicle to Vehicle |
| Vehicle density on a lane, unit/m | |
| Antenna deployment height, m | |
| mmW BS height, m | |
| Road clearance, m | |
| d | Distance between BSs, m |
| Minimum separation distance between vehicles, m | |
| v | Vehicle speed, m/s |
| Length of vehicle, m | |
| Number of lanes | |
| M | Number of lanes of the same direction |
| w | Lane width, m |
| Vehicle width, m | |
| Technology penetration rate | |
| Absorption loss, dB | |
| transmittance of the medium | |
| K | absorption coefficient |
| , | BS emitted power, dB/W |
| , | Antenna array gain, dBi |
| Path loss exponent | |
| Thermal noise, dBi | |
| Array HPBW, | |
| Received signal power, dB | |
| Minimum required Rx sensitivity, dB | |
| Operational frequency, GHz | |
| I | Interference, dB |
| limit of hops within a bridre | |
| Achievable distance for considered path (L, U, R, W), m | |
| Maximum distance for considered path (L, U, R, W), m | |
| Distance to the next vehicle, m | |
| r | Single hop distance, m |
| PDF of distances to the i-th neighbor in PPP | |
| PDF of distances to the i-th neighbor in shifted PPP | |
| Number of hops in a bridge | |
| Probability of non-blocked side reflection | |
| Minimum distance between a blocker and antenna, m | |
| bridge availability | |
| Mean bridge rate, bit/s |
References
- Gapeyenko, M.; Moltchanov, D.; Andreev, S.; Heath, R.W. Line-of-sight probability for mmwave-based UAV communications in 3D urban grid deployments. IEEE Trans. Wirel. Commun. 2021, 20, 6566–6579. [Google Scholar] [CrossRef]
- Gapeyenko, M.; Samuylov, A.; Gerasimenko, M.; Moltchanov, D.; Singh, S.; Aryafar, E.; Yeh, S.p.; Himayat, N.; Andreev, S.; Koucheryavy, Y. Analysis of human-body blockage in urban millimeter-wave cellular communications. In Proceedings of the Communications (ICC), 2016 IEEE International Conference, Kuala Lumpur, Malaysia, 22–27 May 2016; pp. 1–7. [Google Scholar]
- Moltchanov, D.; Ometov, A.; Andreev, S.; Koucheryavy, Y. Upper bound on capacity of 5G mmWave cellular with multi-connectivity capabilities. Electron. Lett. 2018, 54, 724–726. [Google Scholar] [CrossRef]
- Begishev, V.; Sopin, E.; Moltchanov, D.; Kovalchukov, R.; Samuylov, A.; Andreev, S.; Koucheryavy, Y.; Samouylov, K. Joint use of guard capacity and multiconnectivity for improved session continuity in millimeter-wave 5g nr systems. IEEE Trans. Veh. Technol. 2021, 70, 2657–2672. [Google Scholar] [CrossRef]
- Gapeyenko, M.; Petrov, V.; Moltchanov, D.; Akdeniz, M.R.; Andreev, S.; Himayat, N.; Koucheryavy, Y. On the degree of multi-connectivity in 5G millimeter-wave cellular urban deployments. IEEE Trans. Veh. Technol. 2018, 68, 1973–1978. [Google Scholar] [CrossRef]
- ITU-R. M.2410-0: Minimum Requirements Related to Technical Performance for IMT-2020 Radio Interface(s). Technical Recommendation. ITU-R. 2017. Available online: https://www.itu.int/pub/R-REP-M.2410-2017 (accessed on 15 September 2022).
- Polese, M.; Jornet, J.M.; Melodia, T.; Zorzi, M. Toward end-to-end, full-stack 6G terahertz networks. IEEE Commun. Mag. 2020, 58, 48–54. [Google Scholar] [CrossRef]
- Petrov, V.; Pyattaev, A.; Moltchanov, D.; Koucheryavy, Y. Terahertz band communications: Applications, research challenges, and standardization activities. In Proceedings of the 8th International Congress on Ultra Modern Telecommunications and Control Systems and Workshops (ICUMT), Lisbon, Portugal, 18–20 October 2016; pp. 183–190. [Google Scholar]
- 3GPP. Study on Integrated Access and Backhaul (Release 17). TR 38.874 V17.0.0, 3GPP. 2020. Available online: https://portal.3gpp.org/desktopmodules/Specifications/SpecificationDetails.aspx?specificationId=3232 (accessed on 15 September 2022).
- Monteiro, V.F.; Lima, F.; Rafael, M.; Moreira, D.C.; Sousa, D.A.; Maciel, T.F.; Makki, B.; Hannu, H. Paving the Way Towards Mobile IAB: Problems, Solutions and Challenges. arXiv 2022, arXiv:2206.14946. [Google Scholar] [CrossRef]
- Tafintsev, N.; Moltchanov, D.; Gerasimenko, M.; Gapeyenko, M.; Zhu, J.; Yeh, S.p.; Himayat, N.; Andreev, S.; Koucheryavy, Y.; Valkama, M. Aerial access and backhaul in mmWave B5G systems: Performance dynamics and optimization. IEEE Commun. Mag. 2020, 58, 93–99. [Google Scholar] [CrossRef] [Green Version]
- Park, J.J.; Lee, J.; Kim, K.W.; Lee, K.C.; Kim, M.D. Vehicle Antenna Position Dependent Path Loss for Millimeter-Wave V2V Communication. In Proceedings of the 11th Global Symposium on Millimeter Waves (GSMM), Boulder, CO, USA, 22–24 May 2018; pp. 1–3. [Google Scholar] [CrossRef]
- Ozpolat, M.; Bhargava, K.; Kampert, E.; Higgins, M.D. Multi-lane urban mmWave V2V networks: A path loss behaviour dependent coverage analysis. Veh. Commun. 2021, 30, 100348. [Google Scholar] [CrossRef]
- Saraereh, O.A.; Ali, A.; Khan, I.; Rabie, K. Interference Analysis for Vehicle-to-Vehicle Communications at 28 GHz. Electronics 2020, 9, 262. [Google Scholar] [CrossRef]
- Kanhere, O.; Chopra, A.; Thornburg, A.; Rappaport, T.S.; Ghassemzadeh, S.S. Performance Impact Analysis of Beam Switching in Millimeter Wave Vehicular Communications. In Proceedings of the IEEE 93rd Vehicular Technology Conference (VTC-Spring), Bengaluru, India, 4–8 January 2021; pp. 1–7. [Google Scholar]
- Petrov, V.; Kokkoniemi, J.; Moltchanov, D.; Lehtomäki, J.; Juntti, M.; Koucheryavy, Y. The impact of interference from the side lanes on mmWave/THz band V2V communication systems with directional antennas. IEEE Trans. Veh. Technol. 2018, 67, 5028–5041. [Google Scholar] [CrossRef] [Green Version]
- Feng, Y.; He, D.; Guan, Y.; Huang, Y.; Xu, Y.; Chen, Z. Beamwidth Optimization for Millimeter-Wave V2V Communication Between Neighbor Vehicles in Highway Scenarios. IEEE Access 2021, 9, 4335–4350. [Google Scholar] [CrossRef]
- Belmekki, B.E.Y.; Hamza, A.; Escrig, B. Outage Analysis of Cooperative NOMA for Millimeter Wave Vehicular Networks at Intersections. In Proceedings of the IEEE 91st Vehicular Technology Conference (VTC2020-Spring), Antwerp, Belgium, 25–28 May 2020; pp. 1–6. [Google Scholar] [CrossRef]
- Ajam, H.; Najafi, M.; Jamali, V.; Schober, R. Ergodic Sum Rate Analysis of UAV-Based Relay Networks With Mixed RF-FSO Channels. IEEE Open J. Commun. Soc. 2020, 1, 164–178. [Google Scholar] [CrossRef] [Green Version]
- Alkama, D.; Ouamri, M.A.; Alzaidi, M.S.; Shaw, R.N.; Azni, M.; Ghoneim, S.S.M. Downlink Performance Analysis in MIMO UAV-Cellular Communication With LOS/NLOS Propagation Under 3D Beamforming. IEEE Access 2022, 10, 6650–6659. [Google Scholar] [CrossRef]
- Tafintsev, N.; Moltchanov, D.; Andreev, S.; Yeh, S.p.; Himayat, N.; Koucheryavy, Y.; Valkama, M. Handling Spontaneous Traffic Variations in 5G+ via Offloading Onto mmWave-Capable UAV “Bridges”. IEEE Trans. Veh. Technol. 2020, 69, 10070–10084. [Google Scholar] [CrossRef]
- Wang, J.; Liu, J.; Kato, N. Networking and communications in autonomous driving: A survey. IEEE Commun. Surv. Tutorials 2018, 21, 1243–1274. [Google Scholar] [CrossRef]
- Eckhardt, J.M.; Petrov, V.; Moltchanov, D.; Koucheryavy, Y.; Kürner, T. Channel Measurements and Modeling for Low-Terahertz Band Vehicular Communications. IEEE J. Sel. Areas Commun. 2021, 39, 1590–1603. [Google Scholar] [CrossRef]
- Petrov, V.; Eckhardt, J.M.; Moltchanov, D.; Koucheryavy, Y.; Kurner, T. Measurements of reflection and penetration losses in low terahertz band vehicular communications. In Proceedings of the 14th European Conference on Antennas and Propagation (EuCAP), Copenhagen, Denmark, 15–20 March 2020; pp. 1–5. [Google Scholar]
- Boronin, P.; Petrov, V.; Moltchanov, D.; Koucheryavy, Y.; Jornet, J.M. Capacity and throughput analysis of nanoscale machine communication through transparency windows in the terahertz band. Nano Commun. Netw. 2014, 5, 72–82. [Google Scholar] [CrossRef]
- Jornet, J.M.; Akyildiz, I.F. Channel modeling and capacity analysis for electromagnetic wireless nanonetworks in the terahertz band. IEEE Trans. Wirel. Commun. 2011, 10, 3211–3221. [Google Scholar] [CrossRef]
- Jornet, J.M.; Akyildiz, I.F. Femtosecond-long pulse-based modulation for terahertz band communication in nanonetworks. IEEE Trans. Commun. 2014, 62, 1742–1754. [Google Scholar] [CrossRef] [Green Version]
- Rothman, L.S. High-Resolution Transmission Molecular Absorption Database. Harvard-Smithson Center for Astrophysics. HITRAN. 2014. Available online: www.cfa.harvard.edu (accessed on 15 September 2022).
- Petrov, V.; Kurner, T.; Hosako, I. IEEE 802.15. 3d: First Standardization Efforts for Sub-Terahertz Band Communications toward 6G. IEEE Commun. Mag. 2020, 58, 28–33. [Google Scholar] [CrossRef]
- Moltchanov, D. Distance distributions in random networks. Elsevier Ad. Hoc. Networks 2012, 10, 1146–1166. [Google Scholar] [CrossRef]
- Basharin, G.; Gaidamaka, Y.V.; Samouylov, K.E. Mathematical theory of teletraffic and its application to the analysis of multiservice communication of next generation networks. Autom. Control. Comput. Sci. 2013, 47, 62–69. [Google Scholar] [CrossRef]
- Fishman, G.S.; Yarberry, L.S. An implementation of the batch means method. INFORMS J. Comput. 1997, 9, 296–310. [Google Scholar] [CrossRef]
Figure 1.
The considered scenario and main components of the system model.

Figure 2.
Algorithm for bridge construction.

Figure 3.
Simulation algorithm of establishing relaying communication.

Figure 4.
Trade-off between the bridge length and data rate.

Figure 5.
Trade-off between the considered metrics. (a) bridge length vs. data rate; (b) number of hops vs. data rate.
Figure 5.
Trade-off between the considered metrics. (a) bridge length vs. data rate; (b) number of hops vs. data rate.

Figure 6.
Bridge availability as a function of the inter-site distance. (a) different traffic conditions; (b) different number of hops.
Figure 6.
Bridge availability as a function of the inter-site distance. (a) different traffic conditions; (b) different number of hops.

Figure 7.
Bridge availability as a function of the number of traffic lanes.

Figure 8.
Bridge availability and data rate. (a) different MCSs; (b) different last hop selection strategies.
Figure 8.
Bridge availability and data rate. (a) different MCSs; (b) different last hop selection strategies.

Figure 9.
Data rate as a function of vehicles density and last hop selection strategies.

Figure 10.
Histogram of the types of reflections used on different segments of the path.

Figure 11.
Gains in the required BS density as compared to the baseline BS-only deployment.


Table 1.
Propagation losses, .
| Scenario | Propagation Path | Model | Losses |
|---|---|---|---|
| Single-lane | LoS | FSPL | 0 dB |
| Vehicle–body block. | FSPL + height-dependent | 30–50 dB | |
| Under-vehicle prop. | FSPL + , where and | ||
| are as in Table I in [23] | |||
| Front/rear reflection | FSPL + reflection loss | ∼25 dB | |
| Multi-lane | Sym. side reflection | FSPL + reflection loss | ∼3 dB |
| Assym. side reflection | FSPL + angle-dependent loss | 16–20 dB | |
| Front reflection | FSPL + angle-dependent loss | 24–42 dB | |
| Rear reflection | FSPL + angle-dependent loss | 15–30 dB |
Table 2.
Utilized modulation and coding schemes.
| MCS ID | Modulation | Data Rate | Receiver |
|---|---|---|---|
| (Gb/s) | Sensitivity (dBm) | ||
| 0 | BPSK | 1.29 | −67 |
| 2 | QPSK | 2.58 | −64 |
| 3 | QPSK | 3.29 | −60 |
| 4 | 8-PSK | 3.87 | −59 |
| 8 | 16-QAM | 5.16 | −57 |
| 9 | 16-QAM | 6.57 | −53 |
| 10 | 64-QAM | 7.74 | −52 |
| 11 | 64-QAM | 9.86 | −47 |
Table 3.
The default system parameters.
| Notation | Value | Description |
|---|---|---|
| m | Vehicle length | |
| s | Minimal inter-vehicle distance | |
| un./m | Mean vehicle density | |
| m | Antenna heights | |
| m | Vehicle clearance | |
| v | 25 m/s | Default vehicle speed |
| GHz | Carrier frequency [23] | |
| W | BS/vehicle antenna emitted power [29] | |
| dBm | Emitted power in dBm [29] | |
| dBm | Noise power [29] | |
| −56 dBm | Minimal SINR [29] | |
| , | 17.58 dBi | Transmit and receive side gains [29] |
| 2.1 | Path loss exponent [23] | |
| 23,000 | Propagation coefficient at 0.4 m [23] | |
| 3.4 | Propagation coefficient at 0.4 m [23] |
Disclaimer/Publisher’s Note: The statements, opinions and data contained in all publications are solely those of the individual author(s) and contributor(s) and not of MDPI and/or the editor(s). MDPI and/or the editor(s) disclaim responsibility for any injury to people or property resulting from any ideas, methods, instructions or products referred to in the content. |
© 2022 by the authors. Licensee MDPI, Basel, Switzerland. This article is an open access article distributed under the terms and conditions of the Creative Commons Attribution (CC BY) license (https://creativecommons.org/licenses/by/4.0/).
Share and Cite
MDPI and ACS Style
Beschastnyi, V.; Machnev, E.; Ostrikova, D.; Gaidamaka, Y.; Samouylov, K. Coverage, Rate, and Last Hop Selection in Multi-Hop Communications in Highway Scenarios. Mathematics 2023, 11, 26. https://doi.org/10.3390/math11010026
AMA Style
Beschastnyi V, Machnev E, Ostrikova D, Gaidamaka Y, Samouylov K. Coverage, Rate, and Last Hop Selection in Multi-Hop Communications in Highway Scenarios. Mathematics. 2023; 11(1):26. https://doi.org/10.3390/math11010026
Chicago/Turabian StyleBeschastnyi, Vitalii, Egor Machnev, Darya Ostrikova, Yuliya Gaidamaka, and Konstantin Samouylov. 2023. "Coverage, Rate, and Last Hop Selection in Multi-Hop Communications in Highway Scenarios" Mathematics 11, no. 1: 26. https://doi.org/10.3390/math11010026
Note that from the first issue of 2016, this journal uses article numbers instead of page numbers. See further details here.