
Could Religiosity and Religion Influence the Tax Morale of Individuals? An Empirical Analysis Based on Variable Selection Methods
 ,
,
Abstract
:1. Introduction
2. Literature Review
2.1. An Overview of the Most Relevant Studies in the Field
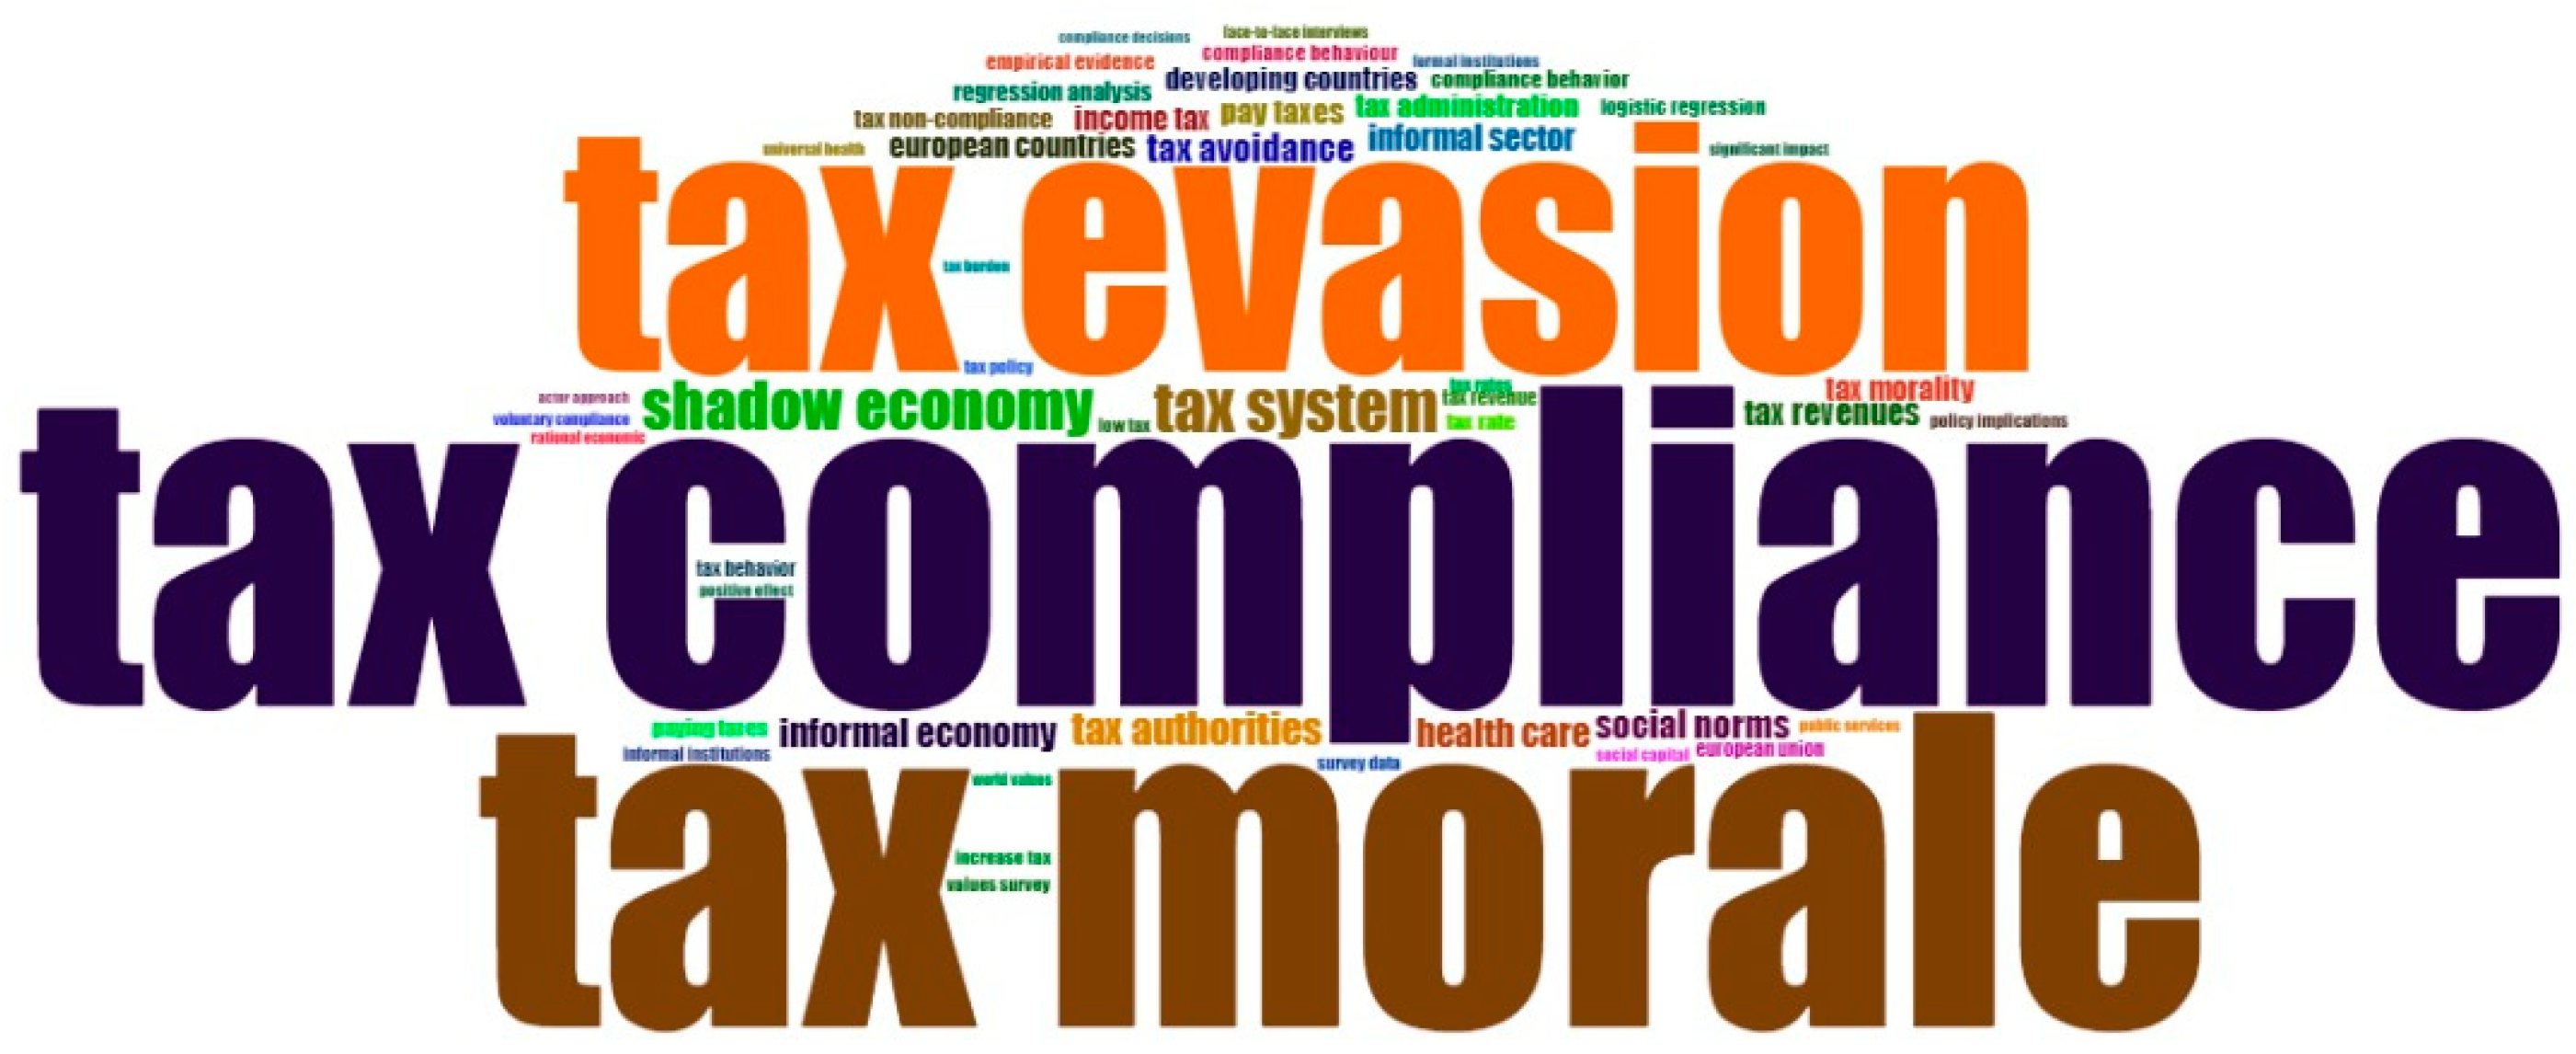
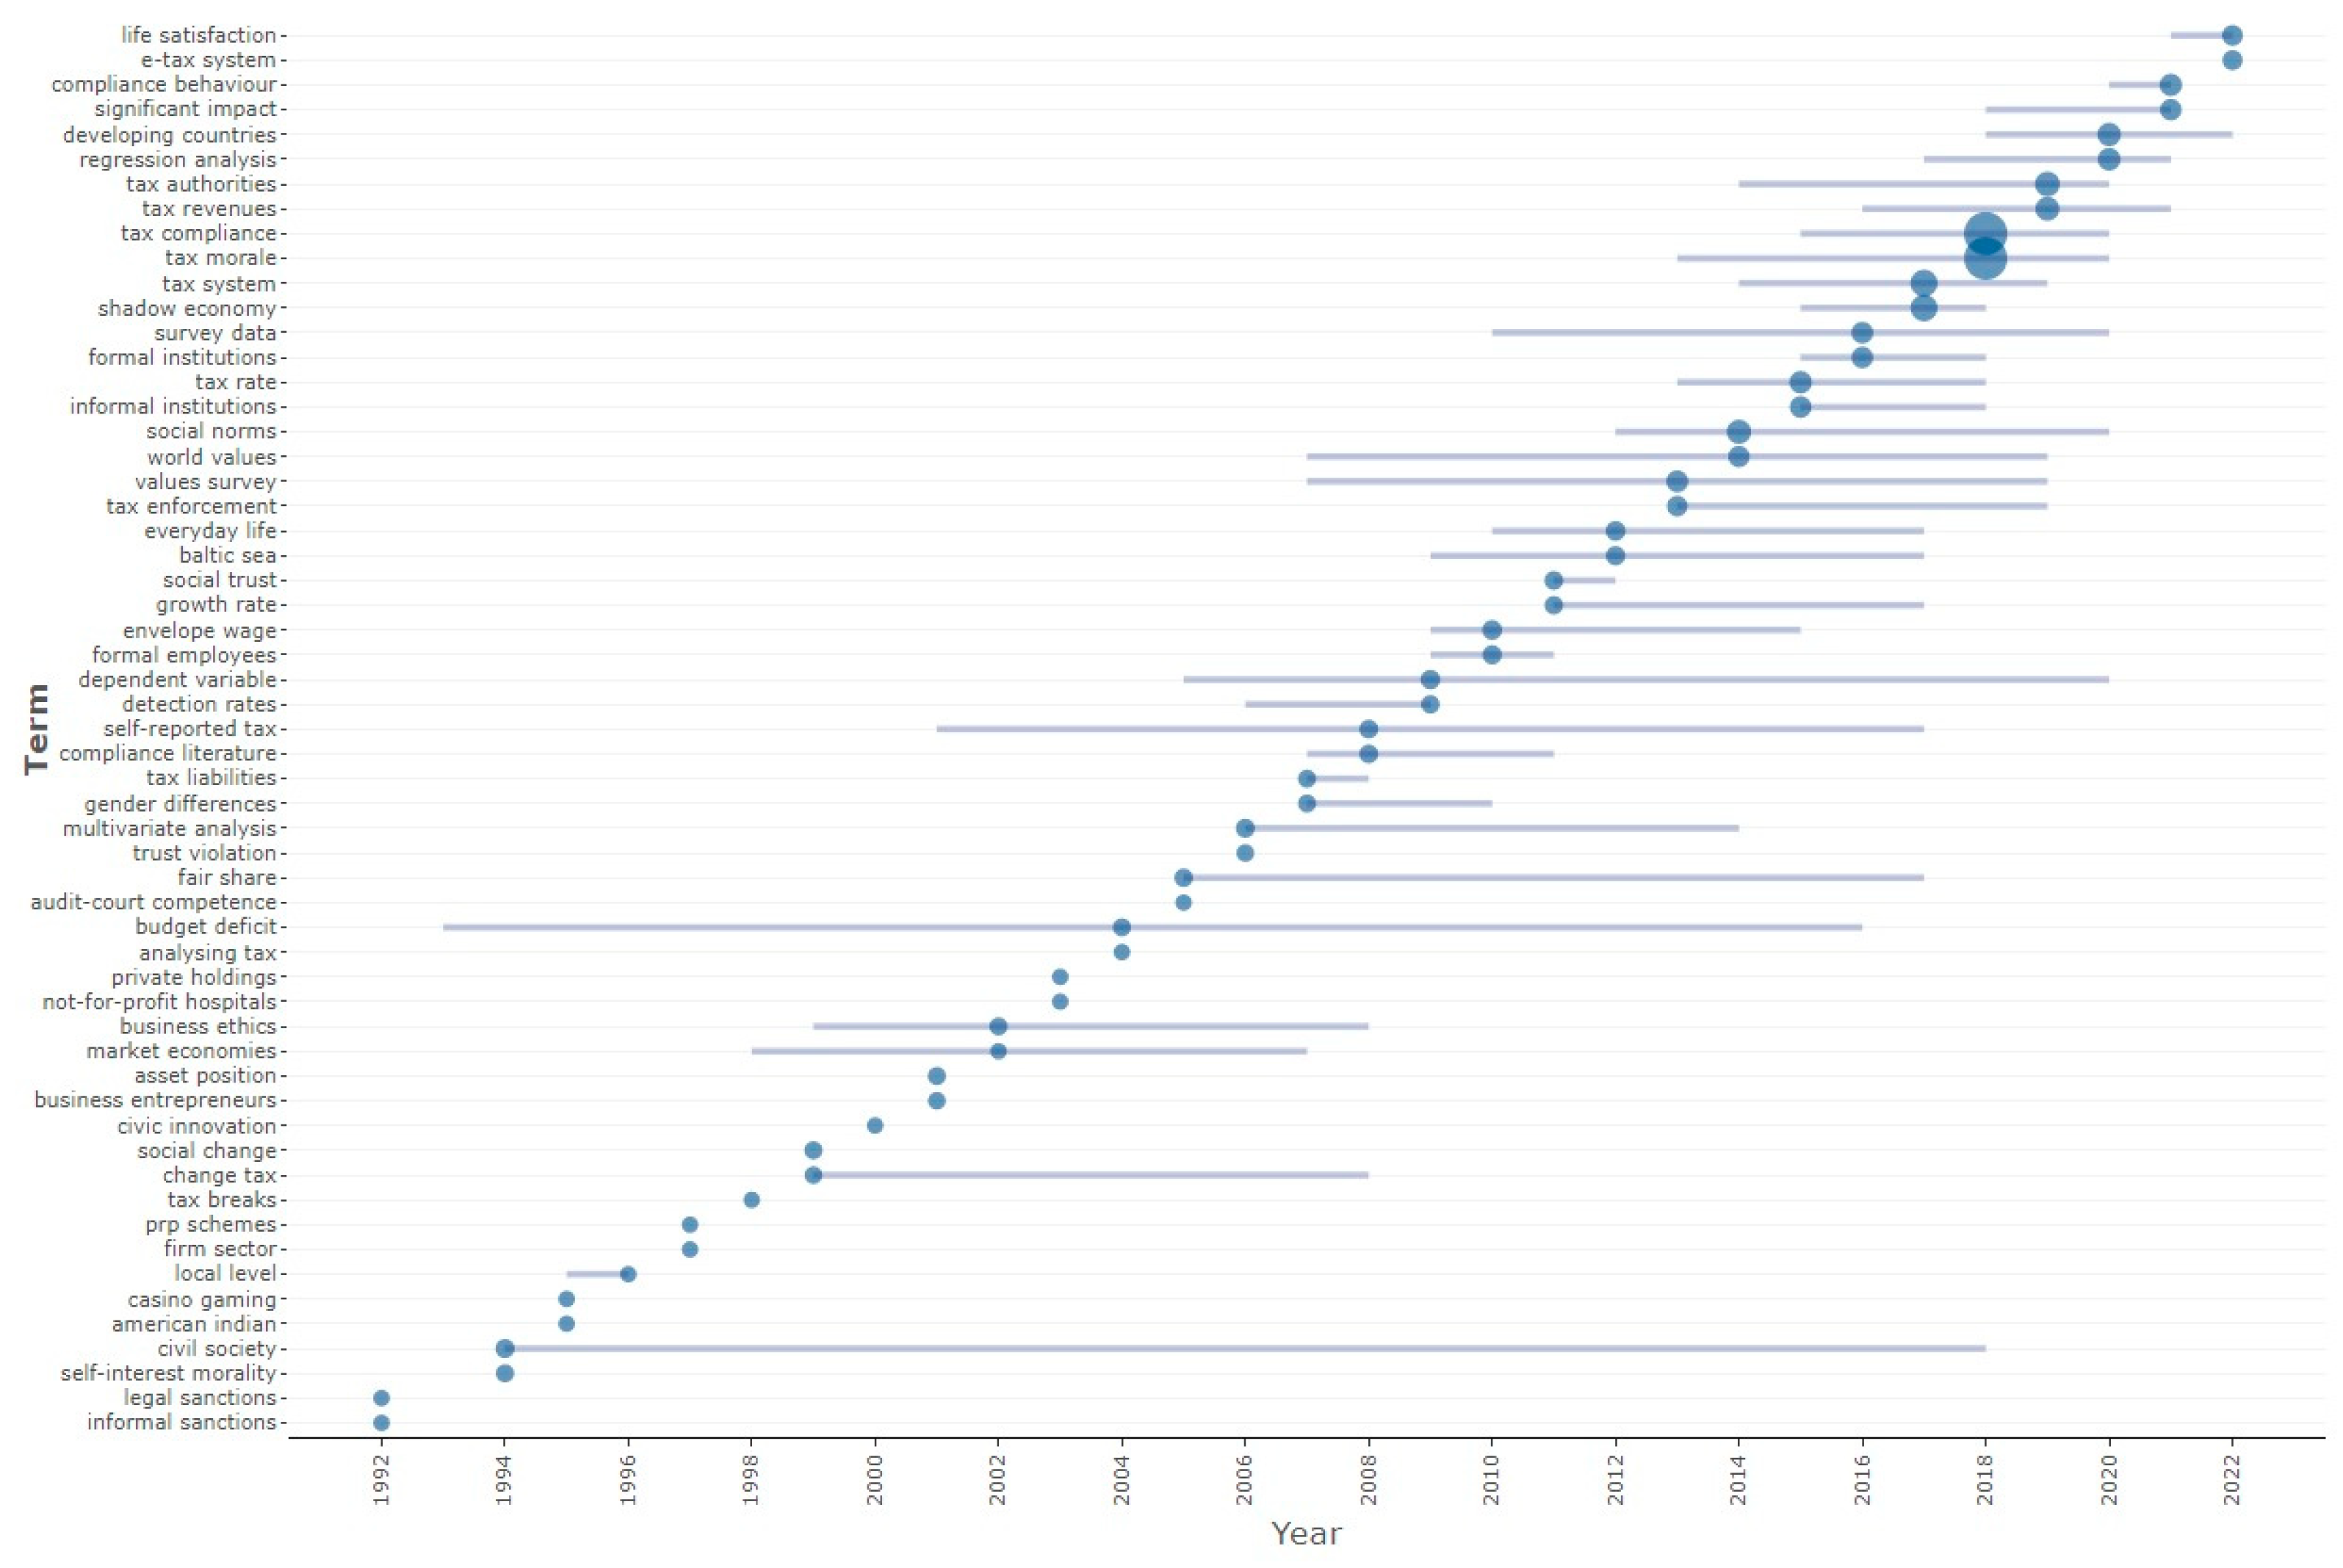
2.2. Highlighting the Dynamics of Tax Morale Research Field. An Empirical Approach Based on Bibliometric Analysis Results
3. Materials and Methods
- Religious denomination coded with a 10-point scale with 0=do not belong to a denomination to 9=other type.
- Current frequency of religious service attendance coded with a 7-point scale with 1=more than once a week to 7=never, practically never.
- Frequency of praying coded with an 8-point scale with 1=several times a day to 8=never, practically never.
- Praying to God outside of religious services coded with a 7-point scale with 1=every day to 7=never.
- Self-assessment of religiousness coded with a 3-point scale with 1=a religious person, 2=not a religious person, and 3=a convinced atheist.
- Beliefs in God, life after death, and hell and heaven have been codified using dummy variables with 1=yes and 0=no.
- Importance of God in one’s life has been codified based on a ten-point scale with 1=not at all important and 10=very important.
- Importance of religion was rated based on a 4-point scale with 1=very important and 4=not at all important.
- Membership in religious organisations has been rated on the report of binary nominal scale with 1=yes, 0=no.
- Membership in humanitarian or charitable organisations has been rated on the report of binary nominal scale with 1=yes, 0=no.
- Post-materialist index 4-item has been rated based on a 3-point scale with 1=materialist, 2=mixed, and 3=post-materialist.
- Political interest has been codified based on a 4-point scale with 1=very interested and 4=not at all interested.
- Self-positioning in political scale has been codified using a 10-point scale with 1=left to 10=right.
- Government responsibility has been codified using a 10-point scale with 1=people should take more responsibility and 10=the government should take more responsibility.
- Confidence in institutions (churches, government, political parties) has been codified based on a four-point scale variable with 1=a great deal, 2=quite a lot, 3=not very much, and 4=none.
- Satisfaction with the political system in the country has been codified using a 10-point scale with 1=not satisfied at all and 10=completely satisfied.
- Trust in people from various groups (people of another religion) has been codified based on a 4-point scale with 1=trust completely and 4=do not trust at all.
- The respondent feels belonging to their country has been codified using a 4-point scale with 1=very close to 4=not close at all.
- Gender: dummy variable with value 1 for men and 2 for women.
- Age: 6 category variables with 1-15–24 years and value 6 for 65 years and over.
- Immigrant status: dummy variable with 1=born in this country and 2=immigrant to this country.
- Highest educational level has been codified using a 3-point scale with 1=small level, 20=middle level, and 3=upper level.
- Employment status: coded with an 8-point scale with 1=full-time (30 h a week or more), 2=part-time (less than 30 h a week), 3=self-employed, 4=retired/pensioned, 5=housewife (not otherwise employed), 6=student, 7=unemployed, and 8=other.
- Institution of occupation: 3-point scale with 1=public institution, 2=private business, and 3=private non-profit organisation.
- Marital status has been codified using a categorical variable with 1=married to 6=single/never married.
- Number of people in the household (household size) has been codified using a categorical variable with 1=one person to 6=six persons or more.
- ➢
- Cox & Snell Pseudo-:
- ➢
- Nagelkerke Pseudo-:
- ➢
- Akaike’s Information Criterion (AIC):where k is the number of estimated parameters
- ➢
- Bayesian Information Criterion (BIC):where k is the number of estimated parameters and n represents the number of observations.
- ➢
- Log-likelihood χ2 (LR chi2):where k is the number of estimated parameters, and n represents the number of observations.
4. Empirical Results
4.1. The Profile of the Respondents
4.2. Summary Statistics
- Most respondents are Roman Catholic (22.4%) and Muslim (21.7%), while categories such as Jew, Hindu or Buddhist, and others are relatively poorly represented.
- The religious services attendance is rather moderated, the perception being that they attend only on special holidays/Christmas/Easter.
- Also, the frequency of praying is rather moderated, the average perception being that individuals pray when they attend religious services.
- The overall perception regarding the frequency of praying to God outside of religious services is that individuals pray on average several times per year outside the religious services.
- The common perception is that the majority are religious persons (61.9% of respondents believe that they are religious) and only 7.90% are convinced atheists.
- Regarding the central beliefs, most of the respondents believe in God (74.6%), followed by their beliefs in heaven (55.5%) and life after death (54.2%), and in last place, the belief in hell (46.1%).
- The overall perception is that God is very important in people’s lives, as well as the overall perception of the importance of religion.
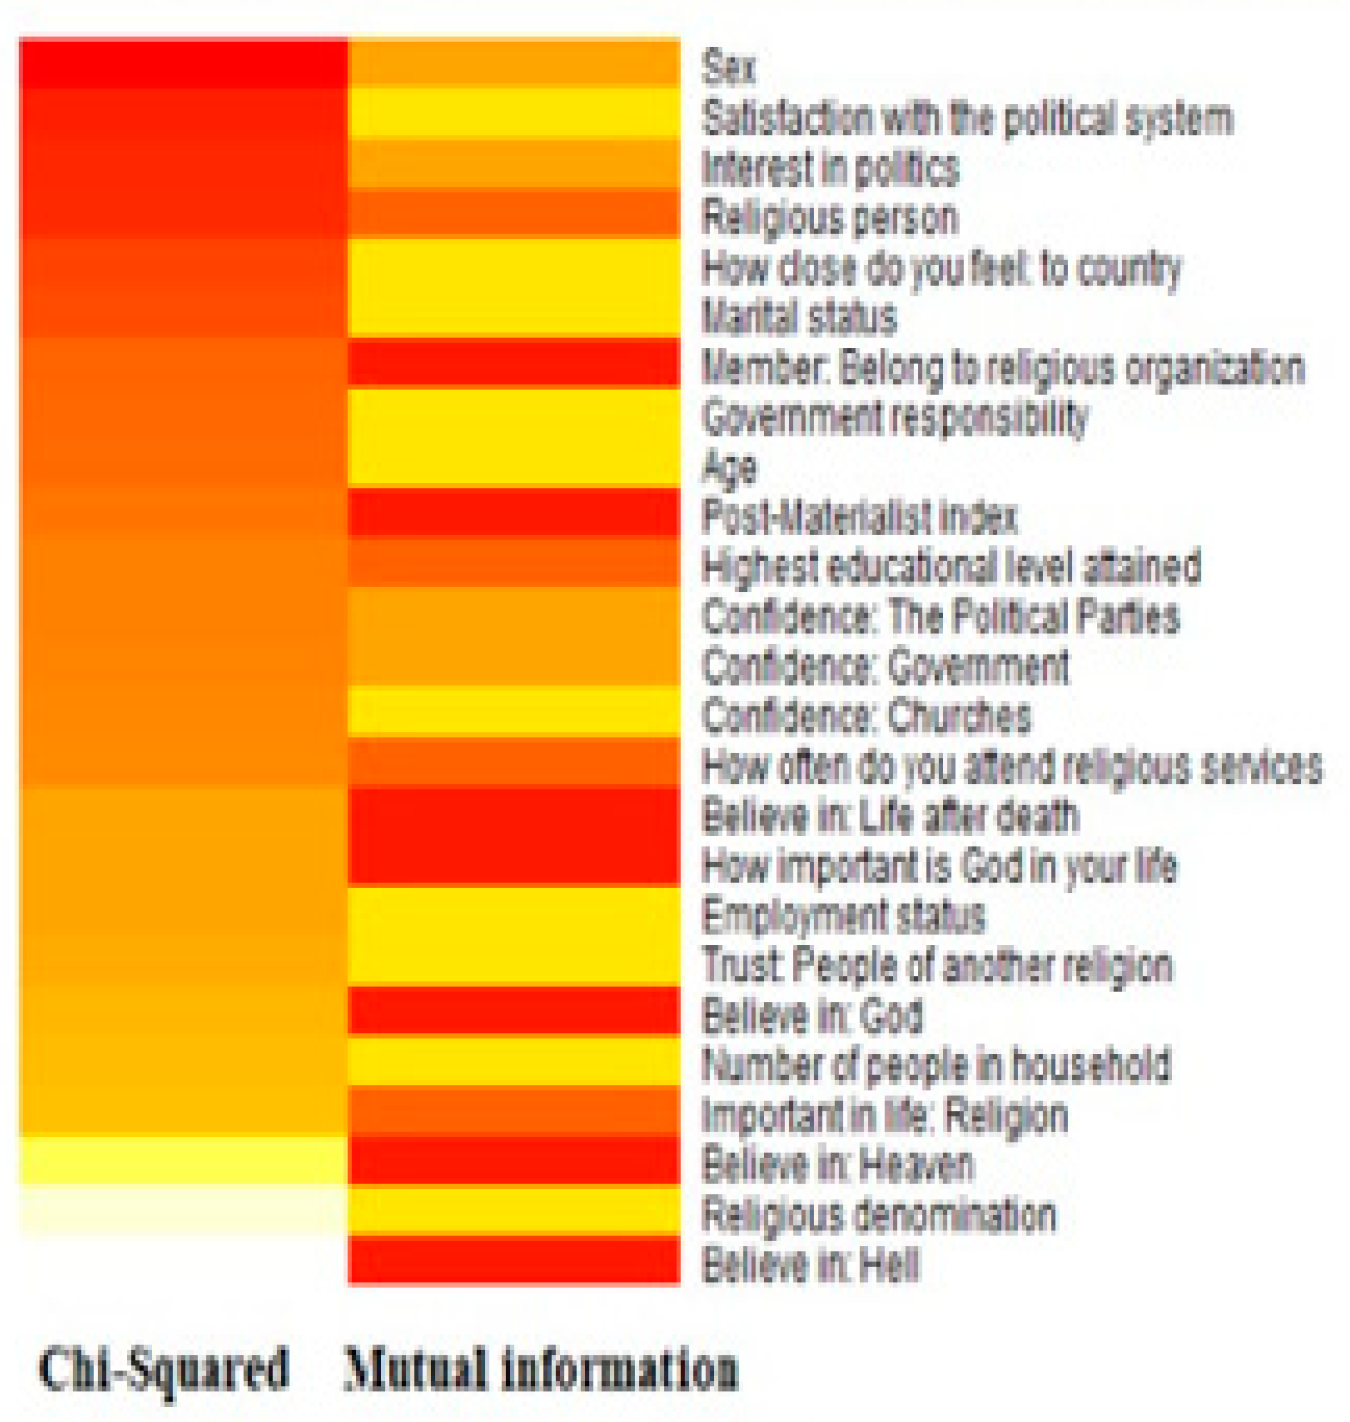
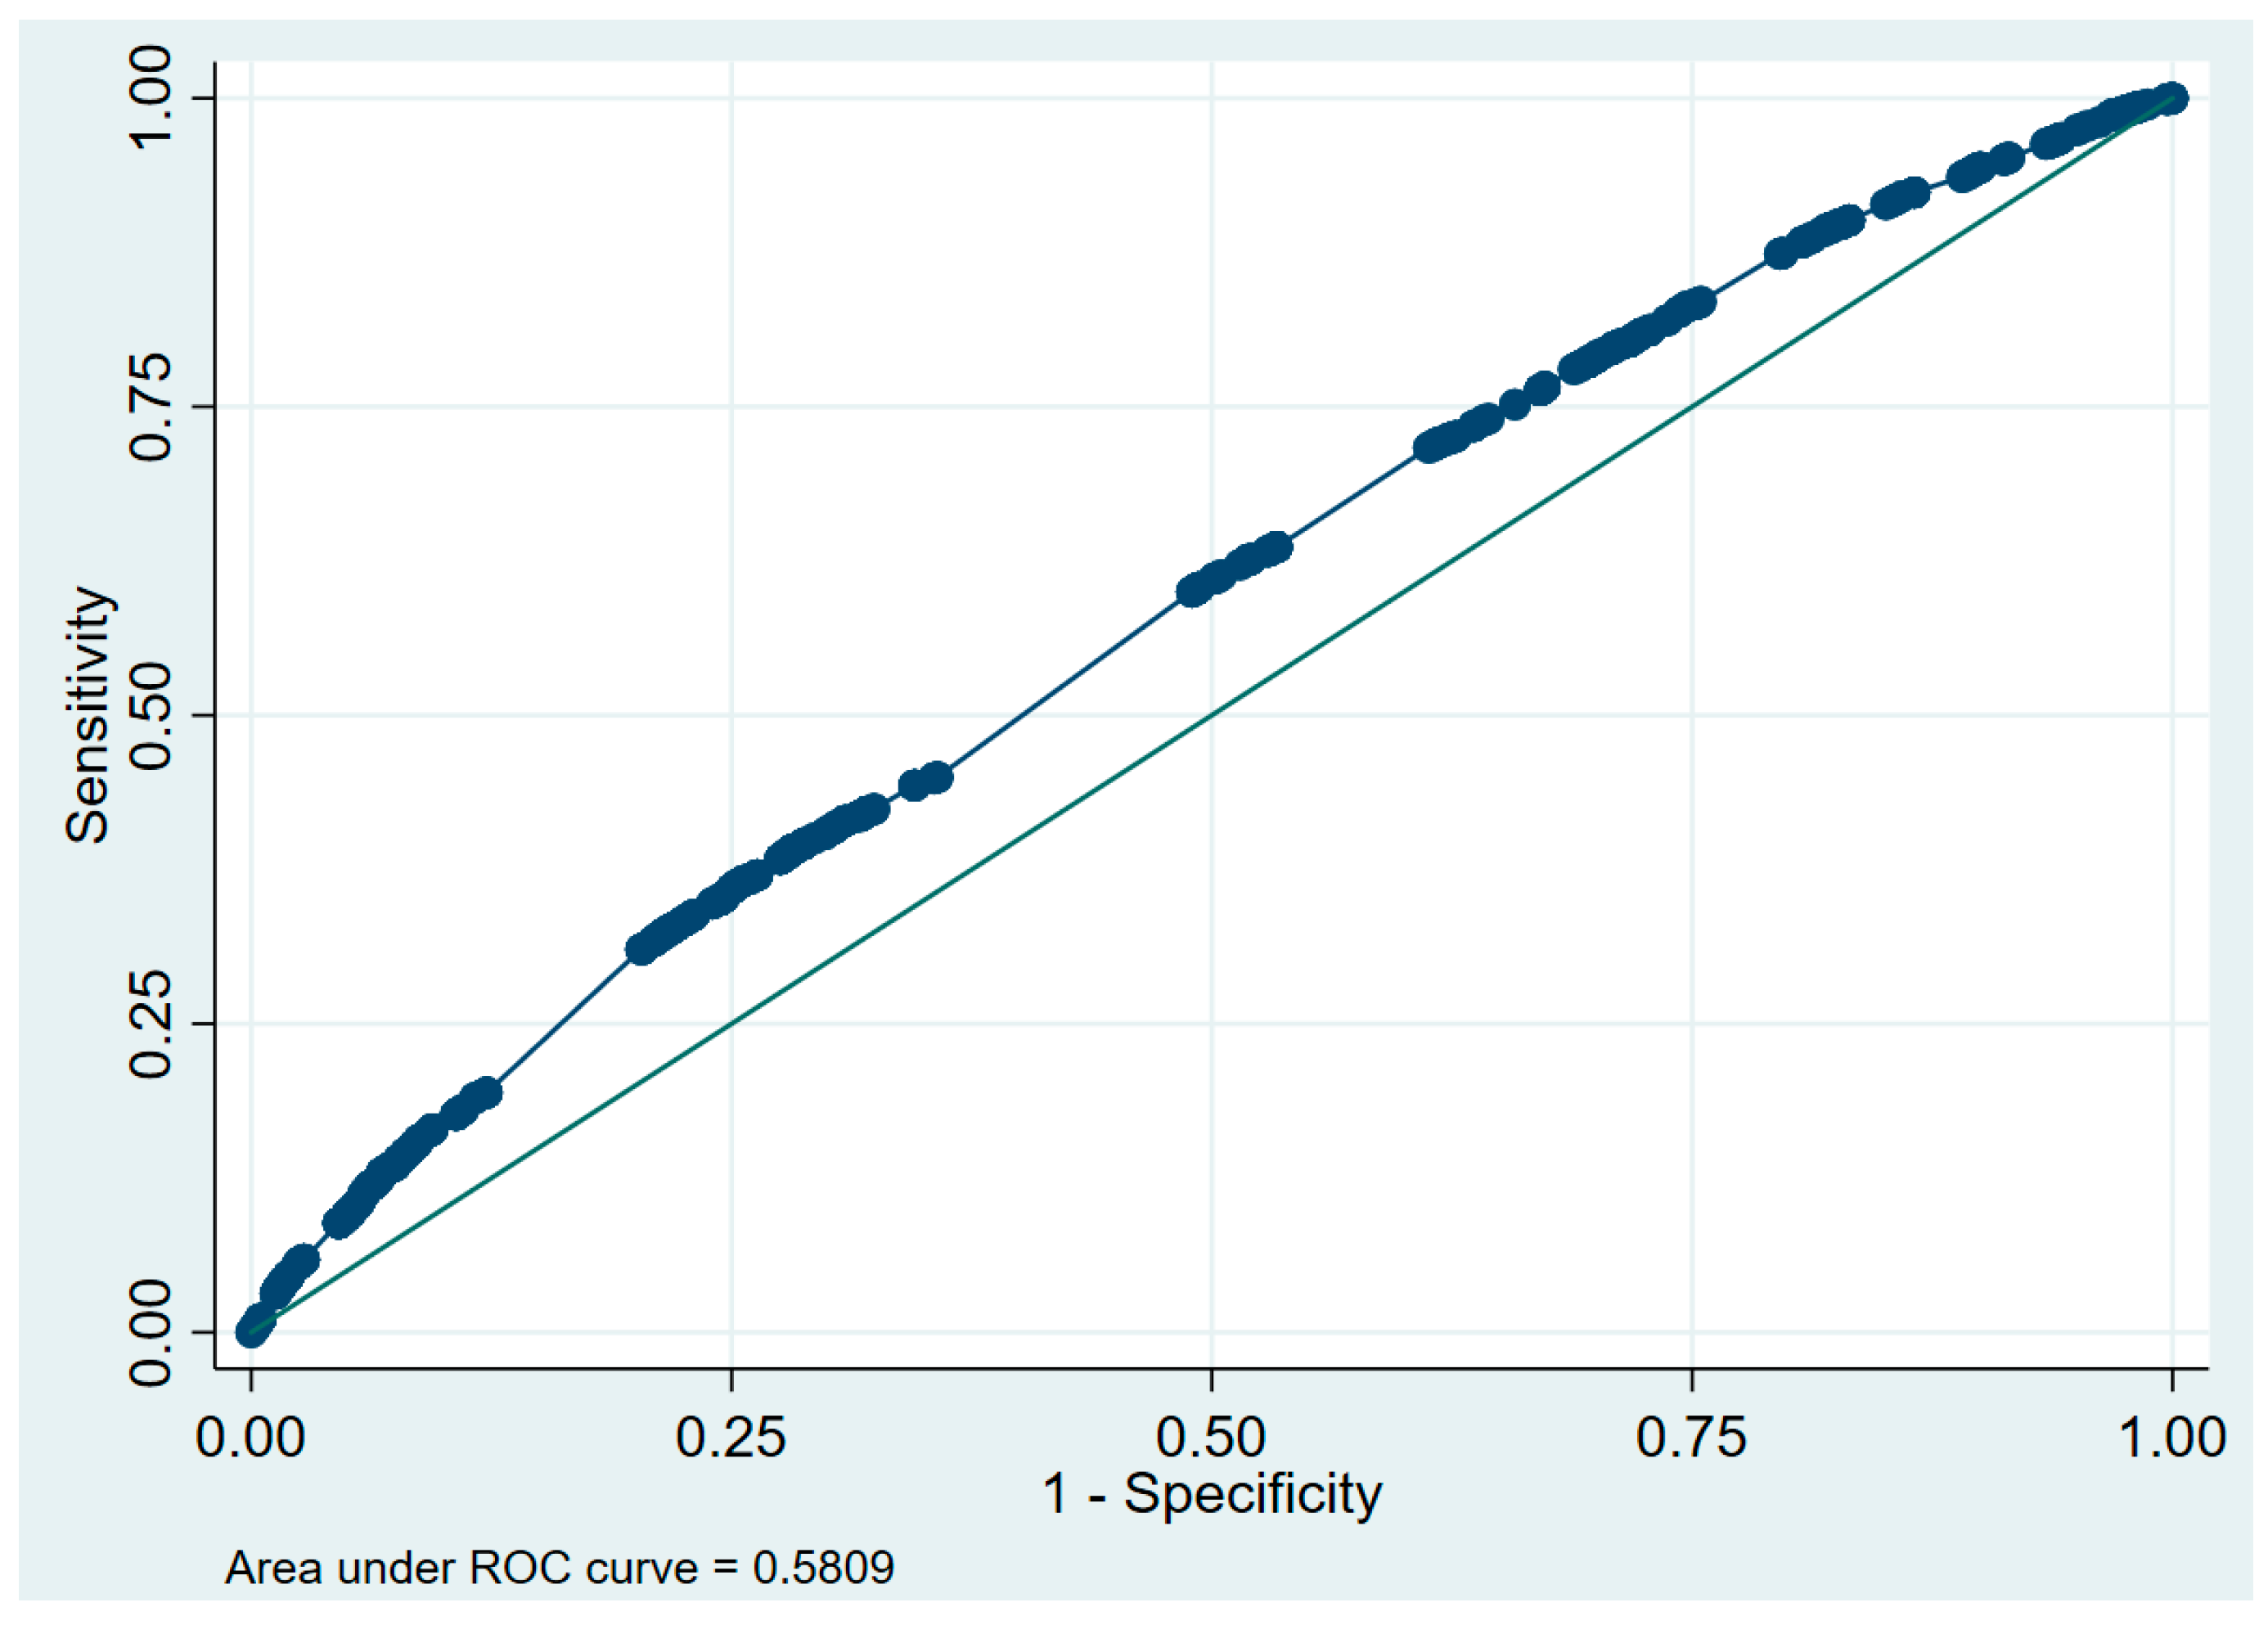
4.3. Identifying the Main Determinants of Tax Morality Based on Feature Selection Approach
5. Discussion
- Encourage programmes that educate taxpayers, especially those that incorporate research and analysis on tax morale. Encourage the growth of tax administrations, particularly regarding enhancing tax payment convenience.
- In the long run, work to improve the relationship between revenue and expenditure to create the social contract. This should be done before enacting hypothecated taxes.
6. Conclusions
Author Contributions
Funding
Institutional Review Board Statement
Informed Consent Statement
Data Availability Statement
Conflicts of Interest
Appendix A

| Variable | Obs | Mean | Std. Dev. | Min | Max |
|---|---|---|---|---|---|
| Justifiable: Cheating on taxes | 109,953 | 2.119 | 2.060 | 1 | 10 |
| How often do you attend religious services | 110,343 | 4.843 | 2.560 | 1 | 8 |
| Frequency of praying | 61,636 | 3.497 | 2.654 | 1 | 8 |
| How important is God in your life | 109,677 | 6.910 | 3.359 | 1 | 10 |
| Confidence: Churches | 108,732 | 2.295 | 0.998 | 1 | 4 |
| Trust: People of another religion | 105,232 | 2.595 | 0.847 | 1 | 4 |
| Interest in politics | 110,639 | 2.665 | 0.958 | 1 | 4 |
| Government responsibility | 109,784 | 5.641 | 2.956 | 1 | 10 |
| Confidence: The Government | 107,355 | 2.680 | 0.949 | 1 | 4 |
| Satisfaction with the political system | 107,383 | 5.270 | 2.717 | 1 | 10 |
| Self-positioning in political scale | 81,948 | 5.621 | 2.414 | 1 | 10 |
| Importance of democracy | 109,305 | 8.590 | 2.031 | 1 | 10 |
| Important in life: Religion | 110,166 | 1.372 | 0.483 | 1 | 2 |
| Post-Materialist index | 106,862 | 1.855 | 0.622 | 1 | 3 |
| Confidence: The Political Parties | 107,101 | 3.013 | 0.845 | 1 | 4 |
| How close do you feel: to country | 110,250 | 1.708 | 0.758 | 1 | 4 |
| Religious Denomination | Percentage |
|---|---|
| Roman Catholic | 22.40% |
| Protestant | 10.90% |
| Orthodox | 10.70% |
| Jew | 0.00% |
| Muslim | 21.70% |
| Hindu | 0.00% |
| Buddhist | 2.80% |
| Other Christian | 3.00% |
| Other | 2.60% |
| Do not belong to a denomination | 24.80% |
| Missing | 1.00% |
| Religious person | Percentage |
| A religious person | 61.90% |
| Not a religious person | 27.30% |
| A convinced atheist | 7.90% |
| Missing | 2.90% |
| Believe in: God | Percentage |
| Yes | 74.60% |
| No | 20.60% |
| Missing | 4.80% |
| Believe in: life after death | Percentage |
| Yes | 54.20% |
| No | 36.00% |
| Missing | 9.70% |
| Believe in: hell | Percentage |
| Yes | 46.10% |
| No | 45.00% |
| Missing | 8.90% |
| Believe in: heaven | Percentage |
| Yes | 55.50% |
| No | 35.70% |
| Missing | 8.80% |
| Member: Belong to religious organisation | Percentage |
| Mentioned | 68.20% |
| Not mentioned | 30.40% |
| Missing | 1.40% |
| Member: Humanitarian or charitable organisation | Percentage |
| Mentioned | 14.30% |
| Not mentioned | 84.10% |
| Missing | 1.60% |
| Socio-demographic variables | |
| Sex | Percentage |
| Male | 46.10% |
| Female | 53.80% |
| Missing | 0.10% |
| Age | Percentage |
| 15–24 | 12.40% |
| 25–34 | 18.60% |
| 35–44 | 18.50% |
| 45–54 | 17.20% |
| 55–64 | 15.90% |
| 65+ | 17.10% |
| Missing | 0.30% |
| Marital status | Percentage |
| Married | 55.60% |
| Living together as married | 5.00% |
| Divorced | 5.90% |
| Separated | 1.90% |
| Widowed | 7.40% |
| Single/Never married | 23.50% |
| Missing | 0.60% |
| Respondent immigrant/born in country | Percentage |
| I am born in this country | 94.50% |
| I am an immigrant to this country | 5.30% |
| Missing | 0.20% |
| Number of people in household | Percentage |
| 1 | 13.00% |
| 2 | 23.70% |
| 3 | 18.20% |
| 4 | 20.00% |
| 5 | 11.40% |
| 6+ | 12.70% |
| Missing | 1.00% |
| Institution of occupation | Percentage |
| Private business | 46.90% |
| Public institution | 21.50% |
| Private non-profit institution | 4.50% |
| Missing | 27.20% |
| Highest educational level attained | Percentage |
| Upper | 30.70% |
| Middle | 39.30% |
| Lower | 29.20% |
| Missing | 0.80% |
| Employment status | Percentage |
| Full-time (30 h a week or more) | 36.60% |
| Part-time (less than 30 h a week) | 7.30% |
| Self-employed | 11.60% |
| Retired/pensioned | 17.30% |
| Housewife (not otherwise employed) | 11.20% |
| Student | 5.30% |
| Unemployed | 8.00% |
| Other | 1.80% |
| Missing | 0.90% |
| Model I | Coef. | Std. Err. | z | p > z | 95% Conf. Interval | |
| Religious denomination (ref = do not belong to a denomination) | ||||||
| Roman Catholic | −0.091 *** | 0.027 | −3.420 | 0.001 | −0.143 | −0.039 |
| Protestant | 0.550 *** | 0.038 | 14.470 | 0.000 | 0.475 | 0.624 |
| Orthodox (Russian/Greek/etc.) | −0.243 *** | 0.033 | −7.420 | 0.000 | −0.308 | −0.179 |
| Muslim | 0.034 | 0.029 | 1.180 | 0.240 | −0.023 | 0.091 |
| Buddhist | 0.176 *** | 0.057 | 3.100 | 0.002 | 0.065 | 0.287 |
| Other Christian (Evangelical/Pentecostal/Free church/etc.) | −0.120 *** | 0.051 | −2.350 | 0.019 | −0.220 | −0.020 |
| Other | 0.211 *** | 0.059 | 3.540 | 0.000 | 0.094 | 0.327 |
| 2. How close to do you feel to your country (ref = not close) close | 0.389 *** | 0.024 | 16.510 | 0.000 | 0.435 | 0.343 |
| Employment status (ref = full time) | ||||||
| Part time (less than 30 h a week) | −0.046 | 0.035 | −1.320 | 0.186 | −0.114 | 0.022 |
| Self employed | −0.085 *** | 0.029 | −2.980 | 0.003 | −0.142 | −0.029 |
| Retired/pensioned | 0.286 *** | 0.041 | 7.070 | 0.000 | 0.207 | 0.366 |
| Housewife (not otherwise employed) | 0.015 | 0.031 | 0.490 | 0.621 | −0.045 | 0.075 |
| Student | 0.210 *** | 0.046 | 4.580 | 0.000 | 0.120 | 0.300 |
| Unemployed | −0.072 ** | 0.033 | −2.220 | 0.026 | −0.136 | −0.009 |
| Other | 0.137 * | 0.071 | 1.930 | 0.054 | −0.002 | 0.276 |
| 2. Trust in people of other religion (ref = not trust) Trust | 0.173 *** | 0.018 | 9.540 | 0.000 | 0.208 | 0.137 |
| Government responsivity (ref = small) | ||||||
| medium | −0.234 *** | 0.022 | −10.790 | 0.000 | −0.276 | −0.191 |
| high | 0.030 | 0.024 | 1.240 | 0.214 | −0.017 | 0.077 |
| Number of people in household (ref = 1) | ||||||
| 2 | −0.008 | 0.035 | −0.220 | 0.825 | −0.077 | 0.062 |
| 3 | −0.077 *** | 0.037 | −2.090 | 0.036 | −0.149 | −0.005 |
| 4 | −0.086 *** | 0.037 | −2.300 | 0.022 | −0.159 | −0.013 |
| 5 | −0.161 *** | 0.041 | −3.980 | 0.000 | −0.241 | −0.082 |
| 6 and more | −0.140 *** | 0.040 | −3.490 | 0.000 | −0.219 | −0.061 |
| Satisfaction with the political system (ref = small) | ||||||
| medium | −0.082 *** | 0.021 | −3.900 | 0.000 | −0.123 | −0.041 |
| high | 0.060 ** | 0.026 | 2.320 | 0.020 | 0.009 | 0.110 |
| Marital status (ref = married) | ||||||
| Living together as married | −0.175 *** | 0.039 | −4.470 | 0.000 | −0.252 | −0.098 |
| Divorced | −0.214 *** | 0.041 | −5.190 | 0.000 | −0.295 | −0.133 |
| Separated | −0.182 *** | 0.062 | −2.920 | 0.003 | −0.304 | −0.060 |
| Widowed | −0.202 *** | 0.042 | −4.800 | 0.000 | −0.285 | −0.120 |
| Single/Never married | −0.134 *** | 0.028 | −4.840 | 0.000 | −0.189 | −0.080 |
| Age (ref = 18–25) | ||||||
| 25–34 | 0.037 | 0.041 | 0.900 | 0.366 | −0.044 | 0.119 |
| 35–44 | 0.146 *** | 0.044 | 3.310 | 0.001 | 0.059 | 0.232 |
| 45–54 | 0.185 *** | 0.046 | 4.040 | 0.000 | 0.095 | 0.275 |
| 55–64 | 0.216 *** | 0.049 | 4.430 | 0.000 | 0.120 | 0.311 |
| 65 and more years | 0.346 *** | 0.058 | 5.960 | 0.000 | 0.233 | 0.460 |
| Confidence in churches (ref = small) high | 0.054 | 0.047 | 1.140 | 0.256 | 0.146 | 0.039 |
| Age #Confidence in churches | ||||||
| 25–34#high | 0.128 ** | 0.061 | 2.120 | 0.034 | 0.010 | 0.247 |
| 35–44#high | 0.166 *** | 0.062 | 2.690 | 0.007 | 0.045 | 0.288 |
| 45–54#high | 0.165 *** | 0.063 | 2.610 | 0.009 | 0.041 | 0.289 |
| 55–64#high | 0.208 *** | 0.066 | 3.150 | 0.002 | 0.078 | 0.337 |
| 65 and more years#high | 0.076 | 0.069 | 1.110 | 0.269 | −0.059 | 0.212 |
| Constant | 1.787 *** | 0.063 | 28.470 | 0.000 | 1.664 | 1.910 |
| Model II | Coefficient | Sd. error | z | Probability | 95% Conf. Interval | |
| Do you belong to a religion or religious denomination? (ref = do not belong to a denomination) | ||||||
| Roman Catholic | −0.092 *** | 0.027 | −3.470 | 0.001 | −0.144 | −0.040 |
| Protestant | 0.545 *** | 0.038 | 14.340 | 0.000 | 0.470 | 0.619 |
| Orthodox (Russian/Greek/etc.) | −0.243 *** | 0.033 | −7.390 | 0.000 | −0.307 | −0.178 |
| Muslim | 0.034 | 0.029 | 1.180 | 0.237 | −0.023 | 0.091 |
| Buddhist | 0.176 *** | 0.057 | 3.110 | 0.002 | 0.065 | 0.287 |
| Other Christian (Evangelical/Pentecostal/Free church/etc.) | −0.119 ** | 0.051 | −2.330 | 0.020 | −0.219 | −0.019 |
| Other | 0.210 *** | 0.059 | 3.530 | 0.000 | 0.093 | 0.327 |
| Age (ref = 18–25) | ||||||
| 25–34 | 0.086 *** | 0.034 | 2.530 | 0.012 | 0.019 | 0.152 |
| 35–44 | 0.209 *** | 0.037 | 5.670 | 0.000 | 0.137 | 0.282 |
| 45–54 | 0.250 *** | 0.039 | 6.480 | 0.000 | 0.174 | 0.325 |
| 55–64 | 0.299 *** | 0.041 | 7.230 | 0.000 | 0.218 | 0.380 |
| 65 and more years | 0.372 *** | 0.052 | 7.190 | 0.000 | 0.271 | 0.473 |
| How close do you feel to your country (ref =not close) | ||||||
| Close | 0.389 *** | 0.024 | 16.510 | 0.000 | 0.435 | 0.343 |
| Trust in people of another religion (ref = not trust) | ||||||
| Trust | 0.171 *** | 0.018 | 9.440 | 0.000 | 0.207 | 0.136 |
| Number of people in household (ref = 1) | ||||||
| 2 | −0.008 | 0.035 | −0.210 | 0.831 | −0.077 | 0.062 |
| 3 | −0.075 ** | 0.037 | −2.030 | 0.042 | −0.147 | −0.003 |
| 4 | −0.084 ** | 0.037 | −2.250 | 0.025 | −0.157 | −0.011 |
| 5 | −0.159 *** | 0.041 | −3.910 | 0.000 | −0.238 | −0.079 |
| 6 and more | −0.138 *** | 0.040 | −3.440 | 0.001 | −0.217 | −0.060 |
| Satisfaction with the political system (ref = small) | ||||||
| Medium | −0.081 *** | 0.021 | −3.880 | 0.000 | −0.123 | −0.040 |
| High | 0.060 *** | 0.026 | 2.320 | 0.020 | 0.009 | 0.110 |
| Marital status (ref = married) | ||||||
| Living together as married | −0.173 *** | 0.039 | −4.400 | 0.000 | −0.249 | −0.096 |
| Divorced | −0.210 *** | 0.041 | −5.110 | 0.000 | −0.291 | −0.130 |
| Separated | −0.182 *** | 0.062 | −2.920 | 0.003 | −0.304 | −0.060 |
| Widowed | −0.199 *** | 0.042 | −4.720 | 0.000 | −0.281 | −0.116 |
| Single/Never married | −0.132 *** | 0.028 | −4.780 | 0.000 | −0.187 | −0.078 |
| Confidence in churches (ref = small) | ||||||
| High | 0.074 *** | 0.020 | 3.720 | 0.000 | 0.035 | 0.113 |
| Employment status (ref = full-time) | ||||||
| Part-time (less than 30 h a week) | −0.062 | 0.069 | −0.910 | 0.365 | −0.197 | 0.072 |
| Self-employed | −0.182 *** | 0.052 | −3.470 | 0.001 | −0.285 | −0.079 |
| Retired/pensioned | 0.387 *** | 0.063 | 6.130 | 0.000 | 0.264 | 0.511 |
| Housewife (not otherwise employed) | 0.050 | 0.061 | 0.820 | 0.414 | −0.070 | 0.170 |
| Student | 0.146 * | 0.081 | 1.800 | 0.071 | −0.013 | 0.305 |
| Unemployed | −0.087 | 0.066 | −1.320 | 0.187 | −0.217 | 0.042 |
| Other | −0.028 | 0.140 | −0.200 | 0.844 | −0.303 | 0.247 |
| Government responsibility (ref = small) | ||||||
| Medium | −0.245 *** | 0.034 | −7.180 | 0.000 | −0.312 | −0.178 |
| High | 0.032 | 0.040 | 0.810 | 0.420 | −0.046 | 0.110 |
| Employment status (ref = full time) #Government responsibility (ref = small) | ||||||
| Part-time (less than 30 h a week)#Medium | 0.074 | 0.086 | 0.870 | 0.386 | −0.093 | 0.242 |
| Part-time (less than 30 h a week)#High | −0.069 | 0.094 | −0.730 | 0.463 | −0.254 | 0.115 |
| Self-employed#Medium | 0.112 * | 0.068 | 1.660 | 0.097 | −0.020 | 0.245 |
| Self-employed#High | 0.158 ** | 0.074 | 2.130 | 0.033 | 0.013 | 0.303 |
| Retired/pensioned#Medium | 0.078 | 0.070 | −1.120 | 0.263 | −0.216 | 0.059 |
| Retired/pensioned#High | −0.244 *** | 0.079 | −3.080 | 0.002 | −0.398 | −0.089 |
| Housewife (not otherwise employed)#Medium | −0.085 | 0.075 | −1.140 | 0.253 | −0.232 | 0.061 |
| Housewife (not otherwise employed)#High | −0.002 | 0.080 | −0.020 | 0.980 | −0.160 | 0.156 |
| Student#Medium | 0.083 | 0.096 | 0.870 | 0.385 | −0.104 | 0.270 |
| Student#High | 0.057 | 0.109 | 0.520 | 0.605 | −0.158 | 0.271 |
| Unemployed#Medium | −0.037 | 0.082 | −0.450 | 0.655 | −0.197 | 0.124 |
| Unemployed#High | 0.075 | 0.086 | 0.870 | 0.384 | −0.093 | 0.243 |
| Other#Medium | 0.482 *** | 0.180 | 2.690 | 0.007 | 0.130 | 0.834 |
| Other#High | −0.153 | 0.185 | −0.830 | 0.408 | −0.515 | 0.209 |
| Constant | 1.741 *** | 0.063 | 27.540 | 0.000 | 1.617 | 1.865 |
| Model III | Coefficient | Standard error | z | Probability | 95% Conf. Interval | |
| Do you belong to a religion or religious denomination? (ref = do not belong to a denomination) | ||||||
| Roman Catholic | −0.091 *** | 0.027 | −3.460 | 0.001 | −0.144 | −0.040 |
| Protestant | 0.546 *** | 0.038 | 14.390 | 0.000 | 0.472 | 0.621 |
| Orthodox (Russian/Greek/etc.) | −0.245 *** | 0.033 | −7.480 | 0.000 | −0.310 | −0.181 |
| Muslim | 0.0322138 | 0.029 | 1.110 | 0.267 | −0.025 | 0.089 |
| Buddhist | 0.175 *** | 0.057 | 3.100 | 0.002 | 0.065 | 0.287 |
| Other Christian (Evangelical/Pentecostal/Free church/etc.) | −0.119 ** | 0.051 | −2.340 | 0.019 | −0.220 | −0.019 |
| Other | 0.209 *** | 0.060 | 3.520 | 0.000 | 0.093 | 0.326 |
| Age (ref = 18–25) | ||||||
| 25–34 | 0.083 ** | 0.034 | 2.440 | 0.015 | 0.016 | 0.151 |
| 35–44 | 0.206 *** | 0.038 | 5.470 | 0.000 | 0.132 | 0.280 |
| 45–54 | 0.247 *** | 0.039 | 6.340 | 0.000 | 0.171 | 0.324 |
| 55–64 | 0.295 *** | 0.042 | 7.090 | 0.000 | 0.214 | 0.377 |
| 65 and more years | 0.370 *** | 0.052 | 7.130 | 0.000 | 0.269 | 0.472 |
| How close do you feel to your country (ref =not close) | ||||||
| Close | 0.388 *** | 0.024 | 16.500 | 0.000 | 0.435 | 0.343 |
| Employment status (ref = full-time) | ||||||
| Part-time (less than 30 h a week) | −0.049 | 0.035 | −1.420 | 0.155 | −0.118 | 0.019 |
| Self-employed | −0.086 *** | 0.029 | −3.040 | 0.002 | −0.143 | −0.031 |
| Retired/pensioned | 0.276 *** | 0.041 | 6.830 | 0.000 | 0.197 | 0.356 |
| Housewife (not otherwise employed) | 0.013 | 0.031 | 0.440 | 0.657 | −0.047 | 0.074 |
| Student | 0.204 *** | 0.046 | 4.450 | 0.000 | 0.114 | 0.294 |
| Unemployed | −0.071 ** | 0.033 | −2.180 | 0.029 | −0.135 | −0.007 |
| Other | 0.136 * | 0.071 | 1.920 | 0.055 | −0.003 | 0.276 |
| Trust in people of another religion (ref = not trust) | ||||||
| Trust | 0.171 *** | 0.018 | 9.440 | 0.000 | 0.207 | 0.136 |
| Government responsibility (ref = small) | ||||||
| Medium | −0.234 *** | 0.022 | −10.830 | 0.000 | −0.277 | −0.192 |
| High | 0.030 | 0.024 | 1.250 | 0.212 | −0.017 | 0.077 |
| Satisfaction with the political system (ref = small) | ||||||
| Medium | −0.082 *** | 0.021 | −3.940 | 0.000 | −0.124 | −0.041 |
| High | 0.060 ** | 0.026 | 2.340 | 0.019 | 0.010 | 0.111 |
| Confidence in churches (ref = small) | ||||||
| High | 0.074 *** | 0.020 | 3.750 | 0.000 | 0.036 | 0.113 |
| Marital status (ref = married) | ||||||
| Living together as married | −0.179 | 0.300 | −0.600 | 0.548 | −0.768 | 0.408 |
| Divorced | 0.176 | 0.122 | 1.450 | 0.146 | −0.061 | 0.415 |
| Separated | 0.261 | 0.164 | 1.590 | 0.111 | −0.060 | 0.582 |
| Widowed | 0.273 ** | 0.120 | 2.290 | 0.022 | 0.039 | 0.509 |
| Single/Never married | 0.283 ** | 0.115 | 2.460 | 0.014 | 0.058 | 0.509 |
| Number of people in household (ref = 1) | ||||||
| 2 | 0.407 *** | 0.110 | 3.690 | 0.000 | 0.191 | 0.624 |
| 3 | 0.322 *** | 0.111 | 2.910 | 0.004 | 0.106 | 0.540 |
| 4 | 0.309 *** | 0.110 | 2.800 | 0.005 | 0.093 | 0.525 |
| 5 | 0.255 ** | 0.112 | 2.280 | 0.023 | 0.036 | 0.476 |
| 6 and more | 0.270 *** | 0.112 | 2.410 | 0.016 | 0.051 | 0.490 |
| Marital status (ref = married) # Number of people in household (ref = 1) | ||||||
| Living together as married#2 | 0.074 | 0.312 | 0.240 | 0.811 | −0.537 | 0.686 |
| Living together as married#3 | 0.030 | 0.311 | 0.100 | 0.923 | −0.580 | 0.640 |
| Living together as married#4 | −0.001 | 0.310 | 0.000 | 0.999 | −0.607 | 0.606 |
| Living together as married#5 | 0.001 | 0.315 | 0.000 | 0.996 | −0.616 | 0.620 |
| Living together as married#6 and more | −0.077 | 0.311 | −0.250 | 0.803 | −0.688 | 0.533 |
| Divorced#2 | −0.404 *** | 0.145 | −2.790 | 0.005 | −0.688 | −0.121 |
| Divorced#3 | −0.325 ** | 0.155 | −2.090 | 0.036 | −0.629 | −0.021 |
| Divorced#4 | −0.424 ** | 0.175 | −2.420 | 0.015 | −0.768 | −0.081 |
| Divorced#5 | −0.452 ** | 0.215 | −2.110 | 0.035 | −0.874 | −0.032 |
| Divorced#6 and more | −0.295 | 0.224 | −1.320 | 0.186 | −0.734 | 0.143 |
| Separated#2 | −0.672 *** | 0.207 | −3.240 | 0.001 | −1.079 | −0.266 |
| Separated#3 | −0.378 * | 0.213 | −1.770 | 0.076 | −0.796 | 0.040 |
| Separated#4 | −0.284 | 0.243 | −1.170 | 0.241 | −0.761 | 0.191 |
| Separated#5 | −0.447 * | 0.263 | −1.700 | 0.089 | −0.964 | 0.069 |
| Separated#6 and more | −0.403 * | 0.237 | −1.700 | 0.089 | −0.869 | 0.061 |
| Widowed#2 | −0.568 *** | 0.148 | −3.850 | 0.000 | −0.858 | −0.279 |
| Widowed#3 | −0.554 *** | 0.160 | −3.470 | 0.001 | −0.868 | −0.241 |
| Widowed#4 | −0.384 ** | 0.175 | −2.200 | 0.028 | −0.728 | −0.041 |
| Widowed#5 | −0.552 *** | 0.176 | −3.140 | 0.002 | −0.897 | −0.207 |
| Widowed#6 and more | −0.643 *** | 0.174 | −3.690 | 0.000 | −0.985 | −0.302 |
| Single/Never married#2 | −0.438 *** | 0.125 | −3.490 | 0.000 | −0.684 | −0.192 |
| Single/Never married#3 | −0.423 *** | 0.124 | −3.420 | 0.001 | −0.667 | −0.181 |
| Single/Never married#4 | −0.408 *** | 0.124 | −3.300 | 0.001 | −0.652 | −0.166 |
| Single/Never married#5 | −0.464 *** | 0.129 | −3.600 | 0.000 | −0.718 | −0.212 |
| Single/Never married#6 and more | −0.415 *** | 0.128 | −3.250 | 0.001 | −0.665 | −0.165 |
| Constant | 1.341 *** | 0.117 | 11.420 | 0.000 | 1.111 | 1.571 |
References
- Torgler, B. The importance of faith: Tax morale and religiosity. J. Econ. Behav. Organ. 2006, 61, 81–109. [Google Scholar] [CrossRef] [Green Version]
- Graetz, M.J.; Wilde, L.L. The economics of tax compliance: Fact and fantasy. Natl. Tax J. 1985, 38, 355–363. [Google Scholar] [CrossRef]
- Torgler, B. To evade taxes or not to evade: That is the question. J. Socio-Econ. 2003, 32, 283–302. [Google Scholar] [CrossRef]
- Torgler, B. Tax morale in transition countries. Post-Communist Econ. 2003, 15, 357–381. [Google Scholar] [CrossRef]
- Allingham, M.G.; Sandmo, A. Income tax evasion: A theoretical analysis. Tax. Crit. Perspect. World Econ. 1972, 3, 323–338. [Google Scholar] [CrossRef] [Green Version]
- Yitzhaklt, S. A note on income tax evasion: A theoretical analysis. J. Public Econ. 1974, 3, 201–202. [Google Scholar] [CrossRef]
- Alm, J.; McClelland, G.H.; Schulze, W.D. Why do people pay taxes? J. Public Econ. 1992, 48, 21–38. [Google Scholar] [CrossRef]
- Wenzel, M. Tax compliance and the psychology of justice: Mapping the field. Tax. Democr. 2002, 1, 41–70. [Google Scholar]
- Alm, J.; Torgler, B. Do ethics matter? Tax compliance and morality. J. Bus. Ethics 2011, 101, 635–651. [Google Scholar] [CrossRef] [Green Version]
- Feld, L.P.; Frey, B.S. Trust breeds trust: How taxpayers are treated. Econ. Gov. 2002, 3, 87–99. [Google Scholar] [CrossRef] [Green Version]
- Frey, B.S. A constitution for knaves crowds out civic virtues. Econ. J. 1997, 107, 1043–1053. [Google Scholar] [CrossRef]
- Rechberger, S.; Hartner, M.; Kirchler, E.; Hämmerle, F.K. Tax amnesties, justice perceptions, and filing behavior: A simulation study. Law Policy 2010, 32, 214–225. [Google Scholar] [CrossRef] [Green Version]
- Kirchler, E.; Hoelzl, E.; Wahl, I. Enforced versus voluntary tax compliance: The “slippery slope” framework. J. Econ. Psychol. 2008, 29, 210–225. [Google Scholar] [CrossRef]
- Anderson, G.M.; Tollison, R.D. Morality and monopoly: The constitutional political economy of religious rules. Cato J. 1992, 12, 373. [Google Scholar]
- Hull, B.B.; Bold, F. Hell, religion, and cultural change. J. Inst. Theor. Econ. (JITE)/Z. Für Die Gesamte Staatswiss. 1994, 150, 447–464. [Google Scholar]
- Margolis, H. Religion as paradigm. J. Inst. Theor. Econ. (JITE)/Z. Für Die Gesamte Staatswiss. 1997, 153, 242–252. [Google Scholar]
- Hirschi, T.; Stark, R. Hellfire and delinquency. Soc. Probl. 1969, 17, 202–213. [Google Scholar] [CrossRef]
- Hull, B.B.; Bold, F. Towards an economic theory of the church. Int. J. Soc. Econ. 1989, 16, 5–15. [Google Scholar] [CrossRef]
- Lipford, J.; McCormick, R.E.; Tollison, R.D. Preaching matters. J. Econ. Behav. Organ. 1993, 21, 235–250. [Google Scholar] [CrossRef]
- Hull, B.B. Religion Still Matters. J. Econ. 2000, 26, 35–48. [Google Scholar]
- Grasmick, H.G.; Bursik, R.J., Jr.; Cochran, J.K. “Render unto Caesar what is Caesar’s”: Religiosity and taxpayers’ inclinations to cheat. Sociol. Q. 1991, 32, 251–266. [Google Scholar] [CrossRef]
- Lewis, H.B. Shame and Guilt in Neurosis. Psychoanal. Rev. 1971, 58, 419–438. [Google Scholar] [PubMed]
- Mohdali, R.; Pope, J. The influence of religiosity on taxpayers’ compliance attitudes: Empirical evidence from a mixed-methods study in Malaysia. Account. Res. J. 2014, 27, 71–91. [Google Scholar] [CrossRef]
- Benk, S.; Budak, T.; Yüzbaşı, B.; Mohdali, R. The impact of religiosity on tax compliance among Turkish self-employed taxpayers. Religions 2016, 7, 37. [Google Scholar] [CrossRef] [Green Version]
- McGee, R.W. The ethics of tax evasion in Islam. In Ethics Tax Evasion; Springer: New York, NY, USA, 1998; pp. 214–219. [Google Scholar] [CrossRef]
- McGee, R.; Gupta, R. Study on tax evasion perceptions in Australasia. In Australian Tax Forum; The Tax Institute: Sydney, Australia, 2010; Volume 25, pp. 507–534. Available online: https://search.informit.org/doi/10.3316/ielapa.201103789 (accessed on 20 August 2022).
- Torgler, B.; Schneider, F. What shapes attitudes toward paying taxes? Evidence from multicultural European countries. Soc. Sci. Q. 2007, 88, 443–470. [Google Scholar] [CrossRef] [Green Version]
- Hanousek, J.; Palda, F. Problems measuring the underground economy in transition 1. Econ. Transit. 2006, 14, 707–718. [Google Scholar] [CrossRef]
- Tyran, J.R.; Feld, L.P. Achieving compliance when legal sanctions are non-deterrent. Scand. J. Econ. 2006, 108, 135–156. [Google Scholar] [CrossRef] [Green Version]
- Strielkowski, W.; Čábelková, I. Religion, culture, and tax evasion: Evidence from the Czech Republic. Religions 2015, 6, 657–669. [Google Scholar] [CrossRef] [Green Version]
- Balasoiu, N. Due to the Gloomy Economic Outlook EU Fight against Tax Havens Enters a New Phase. Rev. De Manag. Comp. Internațional 2021, 22. [Google Scholar]
- Balasoiu, N. Struggle with Tax Havens and Profit Drain. In Proceedings of the Scientia Moralitas Conferences, Washington, DC, USA, 18 April 2021; SCIENTIA: Washington, DC, USA, 2021; pp. 78–83. [Google Scholar]
- Balasoiu, N. Tax Havens-An Insidious Mechanism for Evading Tax Obligations. In Proceedings of the 22nd International RAIS Conference on Social Sciences and Humanities (1–2 March), Research Association for Interdisciplinary Studies, Princeton, NJ, SUA, 20–21 June 2021; pp. 18–22. [Google Scholar]
- Tittle, C.R. Sanctions and Social Deviance: The Question of Deterrence; Praeger Publishers: Westport, CT, USA, 1980. Available online: https://www.ojp.gov/ncjrs/virtual-library/abstracts/sanctions-and-social-deviance-question-deterrence (accessed on 18 August 2022).
- Aitken, S.S.; Bonneville, L. A General Taxpayer Opinion Survey; CSR Incorporated: Washington, DC, USA, 1980. [Google Scholar]
- Groenland, E.A.; Van Veldhoven, G.M. Tax evasion behavior: A psychological framework. J. Econ. Psychol. 1983, 3, 129–144. [Google Scholar] [CrossRef]
- Grasmick, H.G.; Finley, N.J.; Glaser, D.L. Labor force participation, sex-role attitudes, and female crime. Soc. Sci. Q. 1984, 65, 703. [Google Scholar]
- Song, Y.D.; Yarbrough, T.E. Tax ethics and taxpayer attitudes: A survey. Public Adm. Rev. 1978, 38, 442–452. [Google Scholar] [CrossRef]
- Yankelovich, S.; White Inc. Taxpayer Attitudes Survey: Final Report. In Public Opinion Survey Prepared for the Public Affairs Division; Internal Revenue Service: New York, NY, USA, 1984. [Google Scholar]
- Cristea, M.S.; Pirtea, M.G.; Suciu, M.C.; Noja, G.G. Workforce Participation, Ageing, and Economic Welfare: New Empirical Evidence on Complex Patterns across the European Union. Complexity 2022, 2022, 7313452. [Google Scholar] [CrossRef]
- Mason, R.; Calvin, L.D. Public confidence and admitted tax evasion. Natl. Tax J. 1984, 37, 489–496. [Google Scholar] [CrossRef]
- Hays, S.W. An Empirical Analysis of Taxpayers’ Attitudes and Behavioral Intentions Regarding Compliance with Federal Income Tax Laws; Louisiana Tech University: Ruston, LA, USA, 2000. [Google Scholar]
- Clotfelter, C.T. Tax evasion and tax rates: An analysis of individual returns. Rev. Econ. Stat. 1983, 65, 363–373. [Google Scholar] [CrossRef]
- Witte, A.D.; Woodbury, D.F. The effect of tax laws and tax administration on tax compliance: The case of the US individual income tax. Natl. Tax J. 1985, 38, 1–13. [Google Scholar] [CrossRef]
- Westat Inc. Individual Income Tax Compliance Factors Study Qualitative Research; Prepared for the Internal Revenue Service; Westat: San Antonio, TX, USA, 1980. [Google Scholar]
- Vogel, J. Taxation and public opinion in Sweden: An interpretation of recent survey data. Natl. Tax J. 1974, 27, 499–513. [Google Scholar] [CrossRef]
- Lewis, A. The Psychology of Taxation. Br. J. Soc. Psychol. 1982, 21, 151–158. [Google Scholar] [CrossRef]
- Lago-Peñas, I.; Lago-Peñas, S. The determinants of tax morale in comparative perspective: Evidence from a multilevel analysis. Inst. De Estud. Fisc. Work. Pap. 2008. [Google Scholar] [CrossRef]
- María-Dolores, R.; Alarcón, G.; Garre, M.E. Tax morale in Spain: A study into some of its principal determinants. J. Econ. Issues 2010, 44, 855–876. [Google Scholar] [CrossRef]
- Tekeli, R. The Determinants of Tax Morale: The Effects of Cultural Differences and Politics; PRI Discussion Paper Series; Policy Research Institute, Ministry of Finance of Japan: Tokyo, Japan, 2011; p. 11A-1.
- Daude, C.; Gutiérrez, H.; Melguizo, Á. What Drives Tax Morale? 2012. Available online: https://www.oecd-ilibrary.org/development/what-drives-tax-morale_5k8zk8m61kzq-en (accessed on 1 September 2022).
- McKerchar, M.; Bloomquist, K.; Pope, J. Indicators of tax morale: An exploratory study. eJTR 2013, 11, 5. [Google Scholar]
- Bilgin, C. Determinants of tax morale in Spain and Turkey: An empirical analysis. Eur. J. Gov. Econ. 2014, 3, 60–74. [Google Scholar] [CrossRef] [Green Version]
- Sipos, A. Determining factors of tax-morale with special emphasis on the tax revenues of local self-governments. Procedia Econ. Financ. 2015, 30, 758–767. [Google Scholar] [CrossRef] [Green Version]
- Sá, C.; Martins, A.; Gomes, C. Tax morale determinants in Portugal. Eur. Sci. J. 2015, 11, 236–254. [Google Scholar]
- Hosseini Kondelaji, M.; Sameti, M.; Amiri, H.; Moayedfar, R. Analyzing determinants of tax morale based on social psychology theory: Case study of Iran. Iran. Econ. Rev. 2016, 20, 581–598. [Google Scholar] [CrossRef]
- Cyan, M.R.; Koumpias, A.M.; Martinez-Vazquez, J. The determinants of tax morale in Pakistan. J. Asian Econ. 2016, 47, 23–34. [Google Scholar] [CrossRef] [Green Version]
- Jun, B.W.; Yoon, S.M. Taxpayer’s religiosity, religion, and the perceptions of tax equity: Case of South Korea. Religions 2018, 9, 333. [Google Scholar] [CrossRef] [Green Version]
- Bejaković, P.; Bezeredi, S. Determinants of Tax Morale in Croatia: An Ordered Logit Model. Bus. Syst. Res. Int. J. Soc. Adv. Innov. Res. Econ. 2019, 10, 37–48. [Google Scholar] [CrossRef]
- Pacaldo, R.S.; Ferrer, R.C. Determinants of Tax Morale using Structural Equation Model (SEM). DLSU Bus. Econ. Rev. 2020, 29, 40–57. [Google Scholar]
- Aria, M.; Cuccurullo, C. Bibliometrix: An R-tool for comprehensive science mapping analysis. J. Informetr. 2017, 11, 959–975. [Google Scholar] [CrossRef]
- EVS/WVS. European Values Study and World Values Survey: Joint EVS/WVS 2017-2022 Dataset (Joint EVS/WVS). GESIS Data Archive, Cologne. ZA7505, Dataset Version 3.0.0. 2022. [CrossRef]
- Kuhn, M.; Johnson, K. Feature Engineering and Selection: A Practical Approach for Predictive Models; CRC Press: Boca Raton, FL, USA, 2019. [Google Scholar]
- Stan, L.; Turcescu, L. The Romanian Orthodox Church and post-communist democratisation. Eur. Asia Stud. 2000, 52, 1467–1488. [Google Scholar] [CrossRef]
- Pirtea, M.G.; Sipos, G.L.; Ionescu, A. Does corruption affect business innovation? Insights from emerging countries. J. Bus. Econ. Manag. 2019, 20, 715–733. [Google Scholar] [CrossRef]


| Authors | Results | Data Source |
|---|---|---|
| Alm and Torgler (2004) [9] | Strengthening direct democratic elements can be considered an essential factor that has led to high fiscal morale in the Switzerland and the United States. | WVS |
| Torgler (2006) [4] | Tax morale is positively impacted by religiosity, considering being in control over variables such as corruption, trustworthiness, economic situation, education, age, gender, marital status, and employment status. | WVS (1995–1997) |
| Torgler (2006) [3] | Gender statistically impacts tax morale, mentioning that even if females are more compliant than men, the last generations are more independent tend to be less compliant. | WVS (1995–1997) |
| Lago-Peñas, I., & Lago-Peñas, S. (2008) [48] | Income and profit taxes were considered harmful for tax morale compared to consumption tax or social security payments. | 2nd wave (2004–2005) of the European Social Survey |
| Mohdali & Pope (2010) [23] | Regarding each religious belief and practice, religion impacts people’s personalities. Depending on how religious values, beliefs, and practices are applied daily, religion affects tax compliance. | WVS |
| María-Dolores, R., Alarcón, G., & Garre, M. E. (2010) [49] | Socioeconomic variables like age, gender, employment status, and educational attainment significantly impact on tax morale. Other variables also have positive impact, such as tax income return, the belief that immigrants must pay contributions, and considering fraud unjustifiable. Women have a greater level of tax morale. On the other hand, regions with higher GDP per capita, lower employment rate, or more robust construction industries have a lower degree of tax morale. | Survey into the Tax Morale of the Citizenry |
| Tekeli (2011) [50] | In Turkey, tax morale is positively influenced by pride, religiosity, and trust in government and the legal system. In contrast, negative influence is indicated by pro-democracy, unemployment, reading newspapers, and being a housewife. In Japan, education, gender, and age positively influence tax morale, while self-employment and income negatively impact tax morale. | WVS (2005) |
| Daude, Gutiérrez and Melguizo (2012) [51] | Tax morale is influenced by socio-economic factors: age, religion, gender, employment status and educational attainment, and instructional variables: trust in government, satisfaction with public services provided, and democracy. | WVS |
| McKerchar, Bloomquist and Jeff Pope (2013) [52] | Determinants of tax morality: personal integrity, regardless of religious affiliation. | Internal Revenue Service’s National Research Program study of individual taxpayers for tax year 2001 (Bennett 2005), U.S. Social Security Administration. |
| Bilgin (2014) [53] | Spain: age, level of income, and level of education variables have a substantial impact on tax morale. Variables with no effect on fiscal morale are social capital and confidence variables. Turkey: Tax morale is significantly impacted by social capital variables and demographic factors. People are more willing to pay taxes if they trust political entities, with tax morale being positively affected by religion and national pride. | WVS |
| Strielkowski and Čábelková (2015) [30] | A negative impact on the beliefs of citizens about the state does not encourage the improvement of tax morale. It can be said that taxpayers in the Czech Republic are more motivated by public awareness and beliefs than their politicians. Religiosity is another issue that is often considered concerning tax morale. It was concluded that church attendance strongly affects tax morale positively. | WVS (conducted in 2008) |
| Sipos (2015) [54] | Men are more supportive of local self-governments’ financial challenges than women because they are not only eager to pay a higher tax burden to increase local revenues, but they also presume self-governments receive higher vehicle tax rates. | Electronic questionnaire (Two categories of respondents: students and officials from the national tax offices, including 120 Hungarian and 60 Romanian individuals.) |
| Sá, Martins and Gomes (2015) [55] | Portuguese individuals’ motivation to pay taxes is influenced by their trust in government, parliament, the judicial system, and by the belief that Portugal’s best form of government is democracy. Also, tax morale is significantly impacted by satisfaction in their life, trust in society and individuals, and religiosity. | EVS (2008–2010) |
| Hosseini Kondelaji, Sameti, Amiri and Moayedfar (2016) [56] | Economic situation and conditional cooperation significantly impact tax morale in Iran, while variables like the importance of politics, religion, sex, and marital status do not have a substantial impact. | WVS |
| Cyan, Koumpias and Martinez-Vazquez (2016) [57] | It was concluded that the level of education plays an essential role in tax morale. Higher tax morale was observed among educated individuals than those who are illiterate. Moreover, it was concluded that a higher tax morale could be observed in metropolitan areas which are industrialized and accessed by a large number of people. Tax morale on elderly females is lower than on elderly males. | Survey of individual taxpayers for the Federal Board of Revenue of Pakistan (2014) |
| Benk, Budak; Yüzbası and Mohdali (2016) [24] | Voluntary tax compliance is significantly impacted by intrapersonal religiosity. On the other hand, enforced and voluntary tax compliance is not impacted by interpersonal religiosity. | Data collected from self-employed |
| Jun & Yoon (2018) [58] | Every religion affects vertical equity, while religion and religiosity do not affect the exchange and horizontal equity. Therefore, considering tax evasion and tax morale, religion and religiosity are considered less effective than economic and social incentives. | Financial panel survey conducted by the Korea Institute of Public Finance in 2017 |
| Bejaković & Bezeredi (2019) [59] | In Croatia, a significant impact on tax morale is determined by gender, age, financial situation, region, expected sanctions, and participation in the unofficial economy. | WVS |
| Pacaldo & Ferrer (2020) [60] | Tax morale can be strongly impacted by trust in the government. | BEEPS |
| Variable | Attribute Importance |
|---|---|
| Believe in Hell | 0.255 |
| Believe in Heaven | 0.230 |
| Religious denomination | 0.219 |
| Importance of Religion | 0.164 |
| Believe in God | 0.162 |
| Believe in life after death | 0.153 |
| Number of people in household | 0.143 |
| Employment status | 0.136 |
| Membership to religious organisations | 0.122 |
| Trust in people of another religion | 0.119 |
| Frequency of religious service attendance | 0.117 |
| Confidence in Churches | 0.110 |
| Closeness to the country | 0.103 |
| Educational level | 0.101 |
| Government responsibility | 0.101 |
| Age | 0.100 |
| Confidence in Government | 0.087 |
| Confidence in Political Parties | 0.082 |
| Post-Materialist index | 0.075 |
| Marital status | 0.075 |
| Satisfaction with the political system | 0.073 |
| Interest in politics | 0.068 |
| Religious person | 0.059 |
| Sex | 0.046 |
| Variables | Coefficient | Standard Error | z | Probability | 95% Conf. Interval | |
|---|---|---|---|---|---|---|
| Believe in God (ref = no) Yes | 0.062 * | 0.036 | 1.730 | 0.083 | −0.008 | 0.132 |
| Believe in life after death (ref = no) Yes | 0.029 | 0.025 | 1.130 | 0.257 | −0.021 | 0.078 |
| Believe in hell (ref = no) yes | −0.069 ** | 0.030 | −2.290 | 0.022 | −0.127 | −0.010 |
| believe in heaven (ref = no) yes | −0.130 *** | 0.034 | −3.880 | 0.000 | −0.196 | −0.065 |
| Religious denomination (ref = do not belong to a denomination) | ||||||
| Roman Catholic | 0.044 | 0.031 | 1.450 | 0.147 | −0.016 | 0.104 |
| Protestant | 0.714 *** | 0.039 | 18.390 | 0.000 | 0.638 | 0.790 |
| Orthodox | −0.171 *** | 0.037 | −4.680 | 0.000 | −0.243 | −0.099 |
| Muslim | 0.102 *** | 0.033 | 3.070 | 0.002 | 0.037 | 0.167 |
| Buddhist | 0.289 *** | 0.057 | 5.100 | 0.000 | 0.178 | 0.400 |
| Other Christian | −0.021 | 0.053 | −0.390 | 0.696 | −0.126 | 0.084 |
| Other | 0.347 *** | 0.061 | 5.700 | 0.000 | 0.228 | 0.467 |
| Importance of religion (ref = not important) | ||||||
| Important | 0.007 | 0.026 | 0.280 | 0.783 | 0.043 | 0.057 |
| Importance of God (ref = low importance) | ||||||
| Medium importance | 0.593 *** | 0.034 | 17.300 | 0.000 | 0.660 | 0.526 |
| Very important | 0.224 *** | 0.038 | 5.880 | 0.000 | 0.298 | 0.149 |
| Constant | 1.823 *** | 0.022 | 81.110 | 0.000 | 1.750 | 1.882 |
| Number of obs. | 92,496 | |||||
| Log likelihood | −41,279.182 | |||||
| LR chi2(25) | 1157.80 *** | |||||
| Pseudo R2 | 20.56% | |||||
| AIC | 82,588.36 | |||||
| BIC | 82,729.89 | |||||
| Variables | Coefficient | Standard Error | z | Probability | 95% Conf. Interval | |
|---|---|---|---|---|---|---|
| Believe in God (ref = no) Yes | 0.085 ** | 0.039 | 2.200 | 0.028 | 0.009 | 0.161 |
| Believe in life after death (ref = no) Yes | 0.030 | 0.025 | 1.190 | 0.232 | −0.019 | 0.080 |
| Believe in hell (ref = no) yes | −0.065 ** | 0.030 | −2.160 | 0.031 | −0.124 | −0.006 |
| believe in heaven (ref = no) yes | −0.036 | 0.069 | −0.520 | 0.602 | −0.171 | 0.099 |
| Belief in God#belief in heaven | ||||||
| Yes#yes | −0.112 * | 0.071 | −1.580 | 0.10 | −0.250 | 0.027 |
| Religious denomination (ref = do not belong to a denomination) | ||||||
| Roman Catholic | 0.042 | 0.031 | 1.380 | 0.166 | −0.018 | 0.103 |
| Protestant | 0.712 *** | 0.039 | 18.340 | 0.000 | 0.636 | 0.788 |
| Orthodox | −0.174 *** | 0.037 | −4.760 | 0.000 | −0.246 | −0.103 |
| Muslim | 0.100 *** | 0.033 | 3.020 | 0.003 | 0.035 | 0.165 |
| Buddhist | 0.272 *** | 0.057 | 4.740 | 0.000 | 0.160 | 0.385 |
| Other Christian | −0.023 | 0.053 | −0.430 | 0.665 | −0.128 | 0.082 |
| Other | 0.345 *** | 0.061 | 5.660 | 0.000 | 0.225 | 0.464 |
| Importance of religion (ref = not important) | ||||||
| Important | 0.008 | 0.026 | 0.290 | 0.770 | −0.043 | 0.058 |
| Importance of God (ref = low importance) | ||||||
| Medium importance | 0.598 *** | 0.034 | 17.360 | 0.000 | 0.665 | 0.530 |
| Very important | 0.226 *** | 0.038 | 5.930 | 0.000 | 0.301 | 0.151 |
| Constant | 1.808 *** | 0.034 | 53.200 | 0.000 | 1.741 | 1.875 |
| Number of obs. | 92,496 | |||||
| Log likelihood | −41,277.924 | |||||
| LR chi2(25) | 1160.31 *** | |||||
| Pseudo R2 | 22.54% | |||||
| AIC | 82,587.85 | |||||
| BIC | 82,738.81 | |||||
| Variables | Coefficient | Standard Error | z | Probability | 95% Confidence Interval | |
|---|---|---|---|---|---|---|
| Do you belong to a religion or religious denomination? (ref = do not belong to a denomination) | ||||||
| Roman Catholic | −0.091 *** | 0.026 | −3.420 | 0.001 | −0.142 | −0.039 |
| Protestant | 0.549 *** | 0.038 | 14.460 | 0.000 | 0.475 | 0.623 |
| Orthodox | −0.244 *** | 0.033 | −7.450 | 0.000 | −0.309 | −0.180 |
| Muslim | 0.034 | 0.029 | 1.180 | 0.237 | −0.023 | 0.091 |
| Buddhist | 0.174 *** | 0.057 | 3.070 | 0.002 | 0.063 | 0.285 |
| Other Christian (Evangelical/Pentecostal/Free church/etc.) | −0.119 ** | 0.051 | −2.330 | 0.020 | −0.219 | −0.019 |
| Others | 0.208 *** | 0.059 | 3.500 | 0.000 | 0.091 | 0.325 |
| How close do you feel to your country (ref =not close) | ||||||
| Close | 0.389 *** | 0.024 | 16.540 | 0.000 | 0.142 | 0.039 |
| Age (ref = 18–25) | ||||||
| 25–34 | 0.085 *** | 0.034 | 2.510 | 0.012 | 0.019 | 0.152 |
| 35–44 | 0.208 *** | 0.037 | 5.640 | 0.000 | 0.136 | 0.281 |
| 45–54 | 0.248 *** | 0.039 | 6.430 | 0.000 | 0.172 | 0.323 |
| 55–64 | 0.296 *** | 0.041 | 7.170 | 0.000 | 0.215 | 0.377 |
| 65 and more years | 0.374 *** | 0.052 | 7.240 | 0.000 | 0.273 | 0.476 |
| Employment status (ref = full time) | ||||||
| Part-time | −0.048 | 0.035 | −1.380 | 0.168 | −0.116 | 0.020 |
| Self-employed | −0.086 *** | 0.029 | −3.020 | 0.003 | −0.143 | −0.030 |
| Retired/pensioned | 0.284 *** | 0.040 | 7.020 | 0.000 | 0.205 | 0.363 |
| Housewife | 0.014 | 0.031 | 0.450 | 0.654 | −0.046 | 0.074 |
| Student | 0.202 *** | 0.046 | 4.410 | 0.000 | 0.112 | 0.291 |
| Unemployed | −0.073 ** | 0.033 | −2.220 | 0.026 | −0.136 | −0.009 |
| Other | 0.137 ** | 0.071 | 1.930 | 0.054 | −0.002 | 0.276 |
| Trust in people of another religion (ref = not trust) | ||||||
| Trust | 0.173 *** | 0.018 | 9.540 | 0.000 | 0.208 | 0.137 |
| Government responsivity (ref = small) | ||||||
| Medium | −0.234 *** | 0.022 | −10.800 | 0.000 | −0.276 | −0.191 |
| High | 0.030 | 0.024 | 1.260 | 0.206 | −0.017 | 0.078 |
| Number of people in household (ref = 1) | ||||||
| 2 | −0.008 | 0.035 | −0.220 | 0.828 | −0.077 | 0.062 |
| 3 | −0.077 ** | 0.037 | −2.090 | 0.036 | −0.149 | −0.005 |
| 4 | −0.087 ** | 0.037 | −2.330 | 0.020 | −0.160 | −0.014 |
| 5 | −0.162 *** | 0.041 | −3.990 | 0.000 | −0.241 | −0.082 |
| 6 or more | −0.140 *** | 0.040 | −3.490 | 0.000 | −0.219 | −0.061 |
| Satisfaction with the political system (ref = small) | ||||||
| Medium | −0.082 *** | 0.021 | −3.900 | 0.000 | −0.123 | −0.041 |
| High | 0.060 ** | 0.026 | 2.330 | 0.020 | 0.010 | 0.111 |
| Marital status (ref = married) | ||||||
| Living together as married | −0.175 *** | 0.039 | −4.470 | 0.000 | −0.252 | −0.098 |
| Divorced | −0.210 *** | 0.041 | −5.110 | 0.000 | −0.291 | −0.130 |
| Separated | −0.181 *** | 0.062 | −2.910 | 0.004 | −0.303 | −0.059 |
| Widowed | −0.202 *** | 0.042 | −4.800 | 0.000 | −0.284 | −0.120 |
| Single | −0.134 *** | 0.028 | −4.850 | 0.000 | −0.189 | −0.080 |
| Confidence in churches (ref = small) | ||||||
| High | 0.075 *** | 0.020 | 3.750 | 0.000 | 0.036 | 0.113 |
| Constant | 1.665 | 0.068 | 24.370 | 0.000 | 1.531 | 1.799 |
| Number of obs | 92,496 | |||||
| Log likelihood | −41,276.102 | |||||
| LR chi2(25) | 1179.80 *** | |||||
| Pseudo R2 | 29.66% | |||||
| AIC | 82,344.16 | |||||
| BIC | 82,213.19 | |||||
Publisher’s Note: MDPI stays neutral with regard to jurisdictional claims in published maps and institutional affiliations. |
© 2022 by the authors. Licensee MDPI, Basel, Switzerland. This article is an open access article distributed under the terms and conditions of the Creative Commons Attribution (CC BY) license (https://creativecommons.org/licenses/by/4.0/).
Share and Cite
Davidescu, A.A.; Manta, E.M.; Stoica-Ungureanu, A.T.; Anton, M. Could Religiosity and Religion Influence the Tax Morale of Individuals? An Empirical Analysis Based on Variable Selection Methods. Mathematics 2022, 10, 4497. https://doi.org/10.3390/math10234497
Davidescu AA, Manta EM, Stoica-Ungureanu AT, Anton M. Could Religiosity and Religion Influence the Tax Morale of Individuals? An Empirical Analysis Based on Variable Selection Methods. Mathematics. 2022; 10(23):4497. https://doi.org/10.3390/math10234497
Chicago/Turabian StyleDavidescu, Adriana AnaMaria, Eduard Mihai Manta, Adina Teodora Stoica-Ungureanu, and Magdalena Anton (Musat). 2022. "Could Religiosity and Religion Influence the Tax Morale of Individuals? An Empirical Analysis Based on Variable Selection Methods" Mathematics 10, no. 23: 4497. https://doi.org/10.3390/math10234497