
Logit Model for Estimating Non-Profit Organizations’ Financial Status as a Part of Non-Profit Financial Management


1
Department of Quantitative Methods and Economic Informatics, The Faculty of Operation and Economics of Transport and Communications, University of Zilina, Univerzitna 1, 010 01 Zilina, Slovakia
2
Department of Economics, The Faculty of Operation and Economics of Transport and Communications, University of Zilina, Univerzitna 1, 010 01 Zilina, Slovakia
*
Author to whom correspondence should be addressed.
Mathematics 2022, 10(13), 2162; https://doi.org/10.3390/math10132162
Submission received: 24 May 2022
/
Revised: 15 June 2022
/
Accepted: 19 June 2022
/
Published: 21 June 2022
(This article belongs to the Special Issue Mathematical Modeling in Economics, Ecology, and the Environment)
Abstract
:The non-profit sector plays an important role in the American and European continents, as non-profit organizations support the development of civil society and help people in need. However, most non-profit organizations (NPO) are financially dependent on various donors from the private sector. Nowadays, non-profit organizations focus on improving their non-profit financial management. This research aims to assess the financial status of Slovak non-profit organizations, using binary logistic regression. The initial sample includes 351 Slovak NPOs, which are divided into a training and test sub-sample. The data were obtained from Amadeus, FinStat, the Ministry of Finance of the Slovak Republic, and the Ministry of Interior of the Slovak Republic. The logit model shows that the significant variables are equity ratio, debt ratio, operating margin, and type of NPO using the statistical–analytical program IBM SPSS 25. The model also implies that non-profit organizations should focus on the revenue structure and revenues from the sale of products. The prediction model correctly classifies 97.03% of NPOs in the training sub-sample and 96.61% of NPOs in the test sub-sample. Moreover, more than 70% of vulnerable NPOs are correctly classified.
Keywords:
financial status; financial vulnerability; non-profit financial management; non-profit organization; prediction modelMSC:
62J12; 62M20; 62P20; 91B30; 91B821. Introduction
In general, non-profit organizations are established for providing services that private or public institutions are not willing or able to provide. Many statistical indicators suggest that NPOs currently play an important role in the American, European, and Australian continents.
In 2013, approximately 1.41 million U.S. NPOs were registered with the Internal Revenue Code (IRC), an increase of 2.8% compared to 2003, although the total number of NPOs is unknown because religious organizations and other NPOs with incomes below $50,000 are not obliged to sign up with IRC. In 2014, the American non-profit sector contributed more than $900 billion to the U.S. economy, representing 5.4% of GDP [1]. In Germany, the European Union’s most economically developed country, the number of foundations has been growing steadily since 2001. There are currently more than 21,000 foundations, 95% of which are based on a non-profit principle [2]. As in Germany or the United States, the number of NPOs is growing in the Czech Republic and the Slovak Republic. At present, there are 135,394 NPOs in the Czech Republic, the majority include associations (99,784) and branch associations (25,330) [3]. Similarly, there were 57,635 NPOs in the Slovak Republic in 2020, with 52,945 civic associations (91.86%), 3357 NPOs providing community service (5.82%), 749 foundations (1.30%), and 584 non-investment funds (1.01%) [4].
The research aims to design a reliable prediction model for estimating the financial status of Slovak non-profit organizations using binary logistic regression. This research presents a new perspective on the prediction of financial status in the Central European region. This area is unknown because nonprofit financial management is typically shown in U.S. nonprofits. Our model reflects some of the regional disparities compared to the foreign models. The paper is divided into several sections, such as a literature review, methodology, the results, discussion, and conclusions. First, we summarize the current knowledge of failure prediction in the nonprofit sector as part of the nonprofit financial sector. Second, we describe the sample, independent indicators, and methods as part of the methodology. We use 14 independent indicators, broken down into quantitative and qualitative variables. The qualitative variables include the legal form of the non-profit organization and the type of nonprofit organization. Other indicators are financial indicators. These indicators were selected based on a wide range of studies from previous research. The methodology consists of several steps, such as outliers’ removal, multicollinearity analysis, and the design and verification of the proposed model. We remove the outliers from the initial sample using the Mahalanobis distance. The initial sample was divided into training and test sub-samples. In addition, we identify multicollinearity using VIF, to propose a reliable prediction model for nonprofits. After these preparatory steps, we propose a prediction model using logistic regression. This model was verified using a test sample. Third, the results show that the logit model consists of four statistically significant indicators. The other indicators are not statistically significant. These indicators include the debt ratio, operating margin, equity ratio, and type of non-profit organization. The research demonstrates that high debt levels increase the likelihood of a non-profit organization’s financial vulnerability. On the other hand, other indicators reduce the likelihood of potential financial vulnerability in the non-profit sector. The commercial non-profits are less vulnerable than the others. In conclusion, we find that the model correctly classifies approximately 97% of all non-profit organizations, based on a training sample and a test sample. Fourth, the discussion compares our results with knowledge from previous research from regions other than Central Europe. In addition, we explain the limitations of the research and potential research in the future. Finally, we summarize the key findings. This research provides relevant comprehensive knowledge of the financial status of non-profit organizations for making prompt and responsible decisions in the decision-making sphere.
2. Literature Review
Non-profit organizations are the subject of scientific research from various perspectives, the most important topics are the effectiveness assessment and the prediction of financial vulnerability of the non-profit sector. For the increasing number of NPOs and the significant cases of their bad financial management (management failure) in the non-profit sector, the number of studies comparing the effectiveness of commercial and non-profit organizations also increased [5]. Many NPOs need to implement their new programs efficiently, as the public demand the efficient use of resources to meet their goals. In addition, Kliestik et al. [6] argued that bankruptcy prevention is extremely important, because of the legal and social changes in society. Another area of research focuses on the creation of models assessing the financial vulnerability of NPOs. In the commercial sphere, the prediction of financial health is commonplace [7], but the financial vulnerability of NPOs is still a new area of research [8]. The financial health of NPOs is the least developed among public, private, and non-profit organizations [9]. As the budget is the recommended tool for cash management in the long-term horizon, Emerling and Wojcik-Jurkiewicz [10] focused on performance budgeting in the public sector. In the Slovak Republic, many authors focus on the prediction of financial health in the for-profit sector, such as Kovacova and Kliestik [11], Valaskova, Kliestik, and Kovacova [12], and Svabova, Kramarova, and Durica [13], on other hands Ren and Ren [14] proposed the original, combined moving average trading rule in Max-Min strategy. Although most of the scientific literature deals with the evaluation of financial problems in the commercial sector, this issue is also attractive in the non-profit sector for highly unstable and short-term cash flows [15].
The methodology for measuring the financial vulnerability in the non-profit sector is analyzed by Tuckman and Chang [16]. Gilbert, Menon, and Schwartz [17], Zavgren [18], and Jones and Mucha [19] also focus on estimating financial vulnerability. Their prediction models are related to the commercial sector, but they were also adapted to the financial data from a large database of social care providers [20]. Keating et al. [8] compare bankruptcy models developed by Altman [21], Ohlson [22], and Tuckman and Chang [16]. These authors have found that these models were not effective and reliable to predict financial problems. They argue that the effective management of a NPO depends primarily on the understanding of financial vulnerability. Most authors apply discrimination and regression analysis to identify the financial problems of NPOs, but artificial neural networks are also used. Blanton [23] applied neural networks in the health care area.
The financial vulnerability of NPOs is important for their management, current, and potential contributors, and the communities in which the NPOs provide their services. Sontag-Padilla, Staplefoote, and Morganti [24] summarized the literature review on financial sustainability in the non-profit sector in a broader sense of financial sustainability. On the other hand, Tevel, Katz, and Brock [25] used the term financial vulnerability, which is defined as the organization’s vulnerability to financial problems. Table 1 shows various definitions of financial vulnerability used by other relevant authors.
Zhai et al. [32] summarized the key reasons for the financial vulnerability in the nonprofit sector. They concluded that the main reasons are not only weak management and inadequate accounting information systems, but also external constraints, personnel issues, funding problems, and organization size.
3. Research Methodology
In this section, we characterize the methodological procedure based on the analysis of the current situation in Slovakia and abroad. We conclude that only a few authors deal with the issue of NPOs in the Slovak Republic, focusing on the prediction of the financial status of Slovak NPOs in non-profit financial management. Their research explains the role of the non-profit sector in the national economy; in other words, they present a macroeconomic perspective. For proposing the prediction model, we followed Cipra’s general algorithm [33]. However, we use a modified algorithm that showed the distribution of the initial sample to the training and test sample. Figure 1 shows the overall process of designing the prediction model.
The methodology consists of several steps, such as the identification of independent variables, removal of outliers from the initial sample, division of the sample into training and test samples, analysis of multicollinearity, design of the prediction model, and evaluation of the model. We identify the outliers using the Mahalanobis distance. The final sample consisted of 295 non-profit organizations divided into a training (80%) and a test sample (20%). The training sample was used to model and identify statistically significant variables to estimate the probability of financial vulnerability in the non-profit sector. On the other hand, the test sample served to verify the proposed model. We analyze the multicollinearity between the independent variables using VIF to reliably propose a prediction model in the nonprofit sector. This analysis identifies the appropriate combination of the independent indicators. Finally, we determine the overall accuracy of the classification of non-profit organizations.
We use financial and extra data on Slovak NPOs obtained from Amadeus [34], FinStat [35], the Ministry of Finance of the Slovak Republic [36], and the Ministry of Interior of the Slovak Republic [4]. The financial data from the statements were written into MS Excel to perform the financial analysis that included various variables, such as liquidity ratios, activity ratios, debt ratios, profitability ratios, etc. These variables were used to create a prediction model in IBM SPSS Statistics 28—Faculty Pack.
The initial sample consists of 310 foundations and 41 non-investment funds (a total of 351). We exclude the 10 NPOs identified as outliers based on the Mahalanobis distance. Subsequently, 46 NPOs were excluded because at least one of the independent variables was not available. These organizations were most often excluded for a lack of operating margin and equity. The sample of NPOs was divided into the training and test samples. The training sample was used to create a prediction model and the test sample verified the ability of the prediction model to estimate the financial status of Slovak NPOs. These organizations were randomly divided into training and test samples. Moreover, a stratification of both samples was performed, so that the vulnerable and invulnerable NPOs were proportionally divided into both groups. The training sample consists of 236 organizations (80%), and the test sample includes 59 organizations (20%).
We emphasize that Tuckman and Chang [16], Greenlee and Trussel [26], Trussel [27], Trussel, Greenlee, and Brady [28], Trussel and Greenlee [29], Burde, Rosenfeld, and Sheaffer [37], and Burde [38] identified relationships between the financial status and independent variables, based on the theoretical background of non-profit financial management. Current researchers focus not only on the identifying factors that affect financial vulnerability but also on a comprehensive analysis of selected variables; revenue diversification is most often applied.
Based on the specific Slovak conditions, extra quantitative variables were also selected to predict the financial status of NPOs, namely the ratio of contributions from paid tax to total revenues, the ratio of subsidies to total revenues, the liquidity ratio, the ratio of non-current assets to total assets, and the ratio of commercial revenues to total revenues. In addition, we use two pieces of non-financial information as categorical variables, namely, the type of organization (divided into a commercial and non-commercial NPO), and the legal form of the NPO (divided into a foundation and a non-investment fund). Table 2 shows the number of NPOs in terms of the relevant qualitative variables with coding in the logit model.
Table 3 shows all the independent variables that were tested in the logit model, as well as the method of their calculation. Most of the indicators were chosen based on previous research on the prediction of the financial vulnerability in the non-profit sector. These indicators were used for potential comparison with other models. In addition, independent indicators that were also included the contribution from tax paid to total revenues (CPTREV), the donation to total revenues (DOTREV), but also the qualitative variables, such as the legal form of the non-profit organization and the type of non-profit organization. These variables were used because the contribution from tax paid to total revenues and donation to total revenues are the major funding sources for non-profit organizations in Slovakia. We apply not only the financial indicators but also the dichotomous variables, such as the legal form of the non-profit organization and the type of non-profit organization. We assume that these variables are significant in estimating the likelihood of the non-profit organization’s vulnerability. First, commercial non-profit organizations have a stable income from a key donor, although revenue diversification is low. Second, foundations are better known than non-investment funds for various potential contributors and donors; their budgets consist of multiple sources.
We formulate hypotheses based on the scientific question: “Which quantitative and qualitative variables are statistically significant in the estimation of the financial status of non-profit organizations using binary logistic regression?”
- H0AGEORG. AGEORG does not have a statistically significant effect on the financial status of NPOs.
- H0CONREV. CONREV does not have a statistically significant effect on the financial status of NPOs.
- H0CPTREV. CPTREV does not have a statistically significant effect on the financial status of NPOs.
- H0DEBRAT. DEBRAT does not have a statistically significant effect on the financial status of NPOs.
- H0DOTREV. DOTREV does not have a statistically significant effect on the financial status of NPOs.
- H0EQUREV. EQUREV does not have a statistically significant effect on the financial status of NPOs.
- H0LIQRAT. LIQRAT does not have a statistically significant effect on the financial status of NPOs.
- H0LOGASS. LOGASS does not have a statistically significant effect on the financial status of NPOs.
- H0NCUASS. NCUASS does not have a statistically significant effect on the financial status of NPOs.
- H0NWCASS. NWCASS does not have a statistically significant effect on the financial status of NPOs.
- H0OPEMAR. OPENER does not have a statistically significant effect on the financial status of NPOs.
- H0PRAFO. PRAFO does not have a statistically significant effect on the financial status of NPOs.
- H0SALREV. SALREV does not have a statistically significant effect on the financial status of NPOs.
- H0TYPKOD. TYPKOD does not have a statistically significant effect on the financial status of NPOs.
Logistic regression or discriminatory analysis are commonly used to create a prediction model. These methods apply if the dependent variable is not a continuous variable but a binary variable, in other words, a dichotomous or an alternative variable. In our case, we model the financial status of the Slovak non-profit organizations. The financial status represented a dependent variable broken down into an invulnerable and vulnerable organization. This variable is a binary variable, the invulnerable organization is coded as 0 and the vulnerable organization is coded as 1. Logistic regression is a relevant screening tool for determining the failure probability of nonprofit organizations because the model provides prompt knowledge on the comprehensive nonprofit financial management for current and potential business partners. The advantage of logistic regression is in identifying the coefficient size of the relevant predictor with its direction. This approach is easier to implement and interpret. On the other hand, logistic regression can only be used to predict discrete functions. Moreover, this tool requires that each data point be independent of all the other data points. In our research, the logit model was based on studies by Chan [39], Stankovicova and Vojtekova [40], Zhou and Elhag [41], Soo-Seon [42], and Kasgari, Salehnezhad, and Ebadi [43].
or
where:
- Prob—default probability,
- x1, x2, …, xk—independent variables,
- —coefficients estimated by the model [44].
The alternative methods include discriminant analysis, decision trees, or advanced tools such as neural networks, machine learning, ensemble models, and more. These advanced methods are used to achieve better performance metrics and the classification of invulnerable and vulnerable organizations. Nevertheless, these approaches are difficult to interpret for making prompt decisions. Some of the studies use survival analysis as an alternative tool to determine the critical period before potential corporate distress, especially in the private sphere as opposed to the non-profit sector.
4. Results
First, we identify the outliers based on the Mahalanobis distance. For each NPO, the Mahalanobis distance was compared to the Chi-square distribution with the given degrees of freedom, which are given by the number of independent variables. The significance level was set to 0.001. If the calculated p-value was less than the significance level, the observation represented the outlier, and it was necessary to remove it from the initial sample. The p-value for each observation was calculated as:
where:
- MD—Mahalanobis distance,
- p—number of independent variables.
If
then this observation is a multi-dimensional outlier. The results show that 10 observations (NPOs) must be excluded from the initial sample. Tabaschnick and Fidell [45] claim that the outliers are removed at this level of significance.
We emphasize that the total sample was divided into the training and test samples; each sample contained the same percentage of invulnerable and vulnerable NPOs. The training sample contained 219 invulnerable and 17 vulnerable NPOs, the test sample included 55 invulnerable and 4 vulnerable NPOs.
Subsequently, we analyze multicollinearity for a suitable selection of independent variables. Rimarcik [46] recommends that the multicollinearity verified using Variance Inflation Factor (VIF) be less than 10. As can be seen from Table 4, there was no multicollinearity among the independent variables. These variables can be used to estimate the financial status of NPOs. The multicollinearity is calculated based on the training sample.
Model creation. Table 5 shows the difference between the so-called null model with the constant and the model with the independent variables. Before assessing the statistical significance of the independent variables, we assess the significance of the prediction model. Table 5 shows the significance of the prediction model in the first and last steps. Although all the steps are not statistically significant, removing an independent variable does not significantly reduce the Chi-square statistics. The model for a comprehensive assessment of the financial status of NPOs is statistically significant at the significance level of α = 0.05. The resulting model consists of four independent variables based on the degree of freedom (df).
The model should explain the highest degree of pseudo-variability. Depending on the method used, not only the above-mentioned backward stepwise method but also the forward stepwise method, this pseudo-variability can be explained using statistical metrics such as −2 Log-likelihood, Cox and Snell R Square, and Nagelkerke R Square. Forward stepwise and backward stepwise methods are based on different principles of assigning and excluding independent variables. The forward stepwise means the gradual inclusion of independent variables on the back-exclusion principle, while the backward stepwise means the gradual removal of independent variables based on the back-exclusion principle. Since the coefficient of determination cannot be used for logit regression models, the pseudo-R-Squared measures should be used. The Cox and Snell R Square reaches a theoretical maximum value of less than 1, but the Nagelkerke R Square statistic covers the full range from 0. This metric is the preferred statistic for assessing pseudo-variability. If the Nagelkerke R Square statistics reach 1, then the model is perfect. In the case of −2 log-likelihood, the lower value is preferred [47].
The results show that 73.4% of the pseudo-variability is explained by the proposed logit model. Various combinations of independent variables, methods for assigning independent variables to the model, and different pattern distributions for training and test samples were tested. Table 6 also reveals the model based on the forward stepwise principle. This model explains only 53.4% of the pseudo-variability; we conclude that the backward stepwise model better explains the pseudo-variability.
Table 7 shows all the statistically significant independent variables at the significance level of α = 0.05. The logit model consists of the operating margin (OPEMAR), the debt ratio (DEBRAT), the equity ratio (EQUREV), as well as the type of NPO (TYPKOD). All the independent variables, except DEBRAT, have a positive effect on reducing financial vulnerability.
We find that the most significant independent variable was DEBRAT (p-value = 0.002), while the least significant variable was TYPKOD (p-value = 0.049). This dichotomous variable divides the NPOs into two groups, commercial and non-commercial organizations. Non-profit organizations are divided according to the Forum dárcu [48], where a NPO founded by one or more legal entities is a commercial NPO. All the variables are statistically significant in the logit model. In addition to DEBRAT and TYPKOD, OPEMAR (p-value = 0.007) and EQUREV (p-value = 0.006) are also included in the prediction model. The constant is statistically significant with p-value less than 0.001, as well.
DEBRAT is the only variable that has a positive effect on increasing financial vulnerability, as the β-coefficient is 3.543. The other three variables, OPEMAR, EQUREV, and TYPKOD, have a positive impact on the reduction of financial vulnerability, with TYPKOD having the greatest weight in reducing financial vulnerability, as the β-coefficient is −5.344. This result can be interpreted as meaning that a corporate NPO is less likely to be financially vulnerable compared to a reference group (a non-commercial NPO). EQUREV and TYPKOD reduce financial vulnerability because the β-coefficient is −3.371. On the other hand, OPEMAR has the smallest impact on the reduction of financial vulnerability in the prediction model because the β-coefficient is only −2.479.
In our case, all the Exp (B) values are less than 1, except DEBRAT, which means that these variables reduced the probability of financial vulnerability. The most prominent variable is TYPKOD. Moreover, we emphasize that the commercial NPO achieves a lower risk of financial vulnerability than the non-commercial NPO (reference variables). The results show that, if the NPO is corporate, then the probability of financial vulnerability decreases by 99.5%, assuming ceteris paribus. In other words, if a NPO is not a commercial NPO, the organization has a high precondition for achieving financial vulnerability. EQUREV provides a similarly positive impact on decreasing the likelihood of an NPO’s financial vulnerability, by almost 97%. On the other hand, the lowest decrease in the probability of financial vulnerability is caused by OPEMAR. We identify a decrease of more than 90% because Exp(B) reached 0.084 with a confidence interval of 0.014 to 0.505. The proposed logit model consists of four variables, including an intercept. Chan [39] recommends an intercept in a logit model, in the same way as other authors, because the intercept represents a “basket”. All the unexplained effects in the model are collected in this basket.
We conclude that for Slovak NPOs, the operating margin (OPEMAR), debt ratio (DEBRAT), equity ratio (EQUREV), and type of NPO (TYPKOD) variables are relevant for estimating their financial status. The prediction model for estimating the probability of financial status of Slovak NPOs is:
or
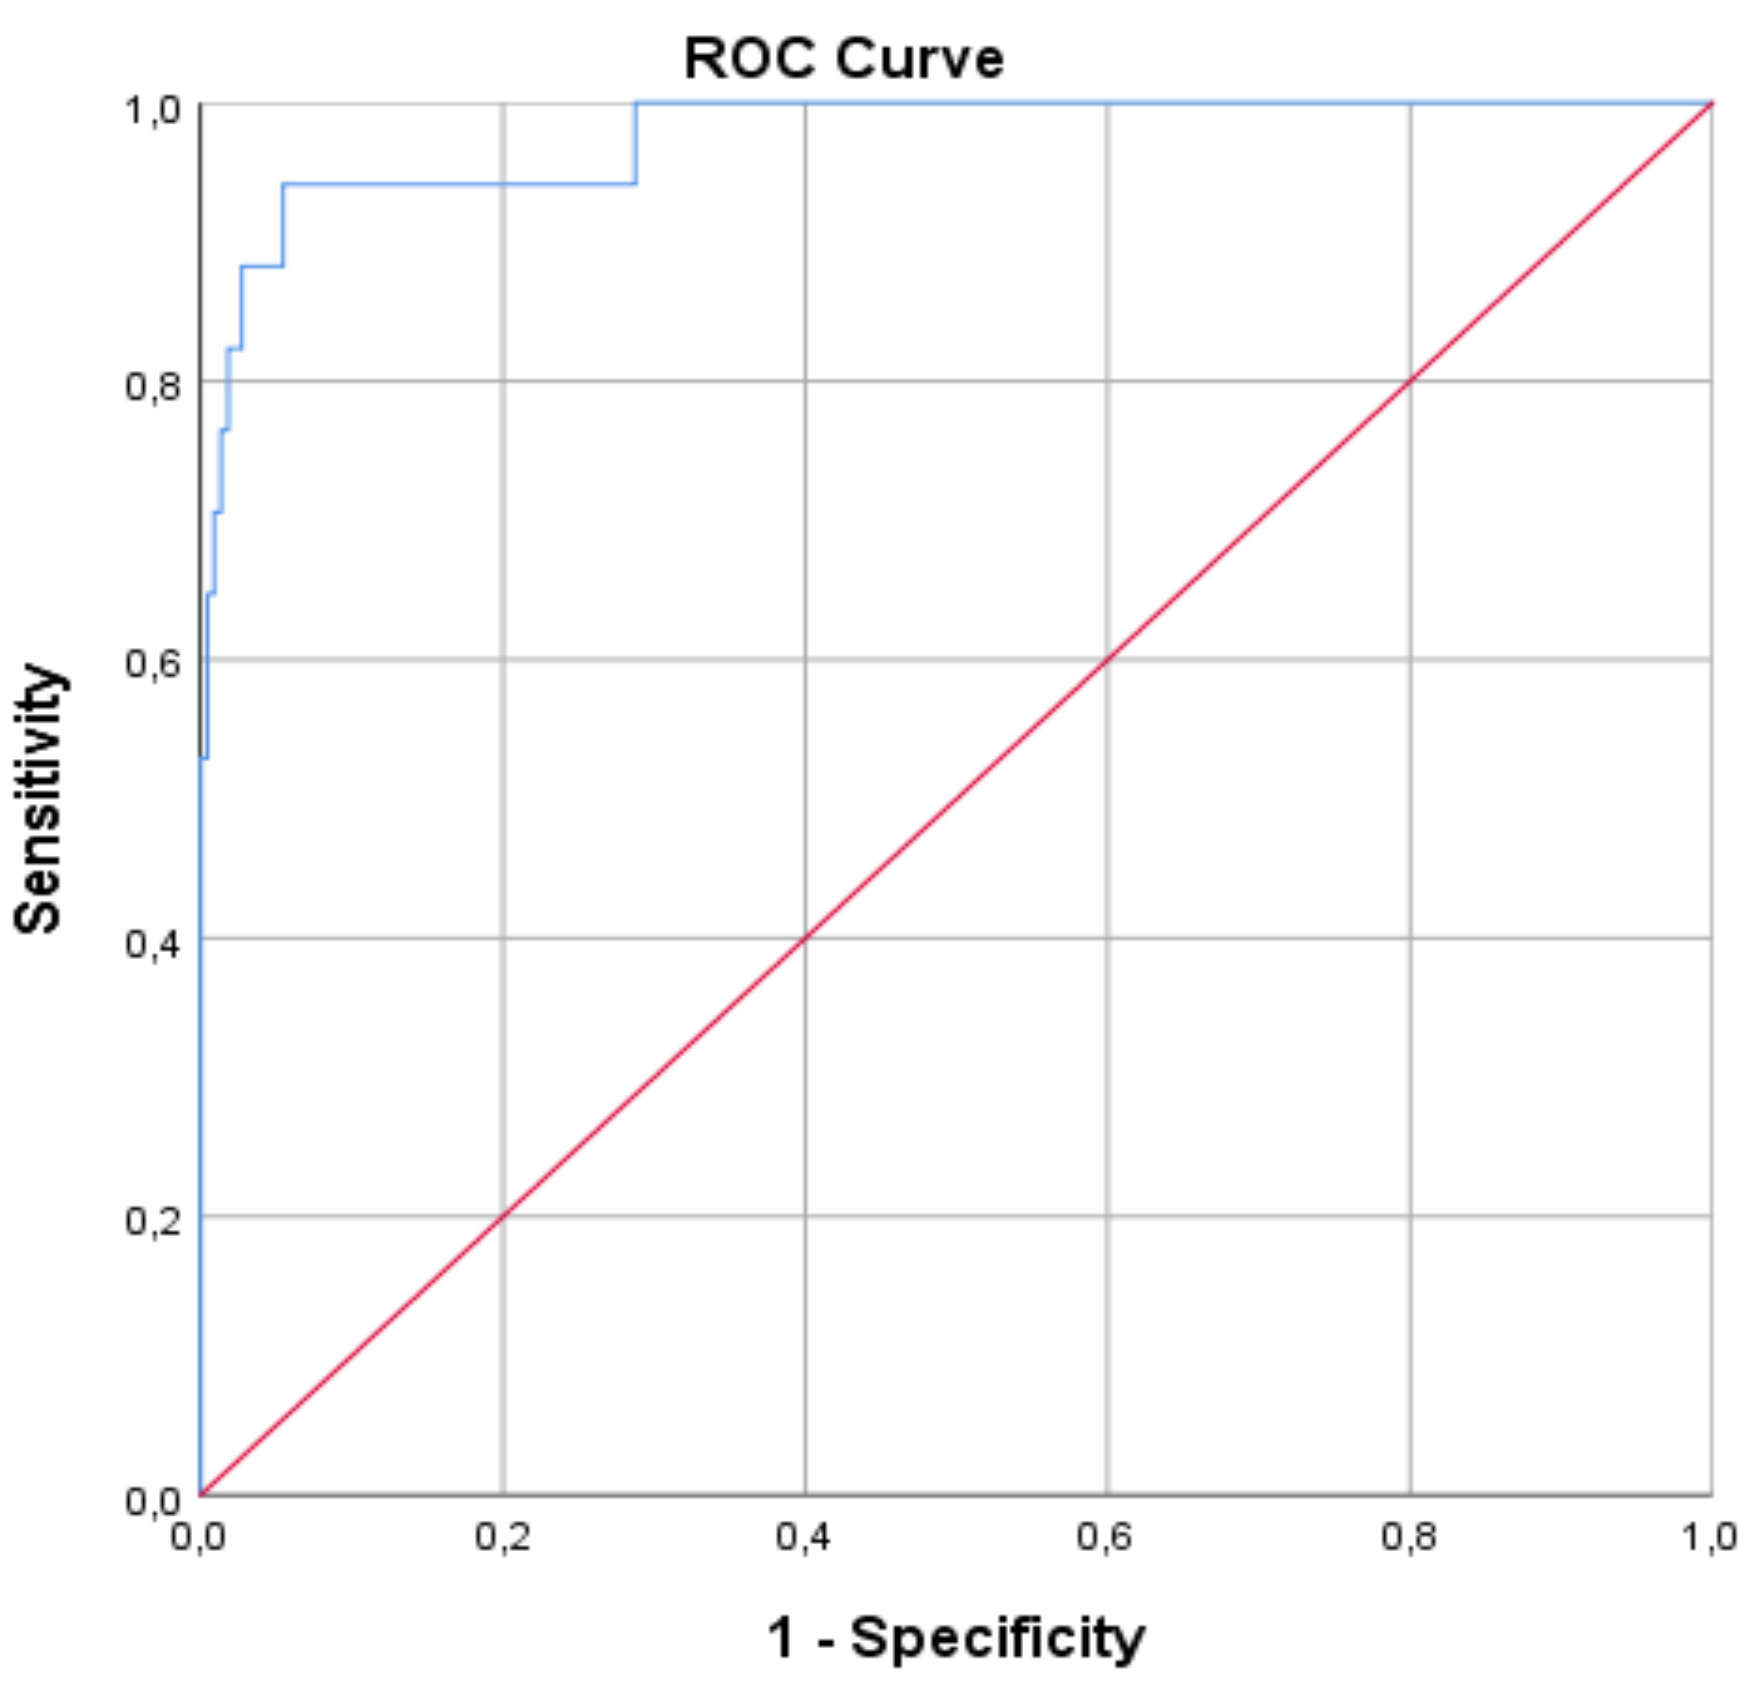
To assess the accuracy of the logit model, we apply the ROC curve, which is a relevant diagnostic tool for measuring the accuracy of the prediction model. Table 8 shows the number of observations (NPOs), divided into vulnerable and invulnerable NPOs.
Table 9 consists of four sections showing “true positive”, “false negative”, “true negative”, and “false positive”. The NPOs with financial vulnerability should be correctly classified as positive, but some of them are classified as negative. On the other hand, NPOs without financial vulnerability should be classified as negative, but some of them are classified as positive. Table 9 shows the overall accuracy of the logit model, which predicts the financial status at the threshold value of 0.5.
Table 9 shows that the model correctly classifies 12 vulnerable NPOs out of 17, representing a 70.59% success rate. In addition, the model correctly classifies 217 invulnerable NPOs from 219 organizations, representing a 99.09% success rate. The overall success rate of the prediction model is calculated as the portion of correctly classified organizations, which is 229 out of 236 NPOs, representing 97.03%. In addition, we focus on the error rate in the classification.
Table 9 also shows the calculation of Type I errors and Type II errors. According to Umer [49], Type I error, also called an alpha error, occurs if a vulnerable organization is predicted to be invulnerable. It is calculated as:
On the other hand, Umer [49] explains that a Type II error, also called a beta error, occurs if an invulnerable organization is predicted to be vulnerable. It is calculated as:
The total error is calculated as the quotient of the sum of Type I errors and Type II errors and the total number of observations in the sample.
We find out that the level of Type I errors is 2.25%, which is the ratio of 5 to 222 organizations, the level of Type II errors is 14.29%, which is the ratio of 2 to 14 organizations. We further emphasize that a lower level of Type I error is positive for the public because it eliminates costs. The costs represent the loss of truth and interest for the banks. The total error is 2.97%.
Each point on the ROC curve represents a pair of sensitivity and specificity that corresponds to a decision threshold.
Figure 2 shows the ROC curve (blue line) and the threshold line (red line) distinguishing organizations into two diagnostic groups: the vulnerable and invulnerable NPOs. In addition, Figure 2 shows that the area under the curve is statistically significantly different at the threshold value of 0.5 at the p-value less than 0.000, which is less than the significance level of α = 0.05. In other words, the logit model statistically significantly classifies financially vulnerable and invulnerable NPOs.
Table 10 shows that the ROC results achieve almost 97.5% of all the possible pairs of NPOs with financial vulnerability or invulnerability with a confidence interval of 94.2 to 100%, which are correctly classified. The optimum sensitivity (specificity) and specificity are obtained from a point located at the top left corner.
Model validation. We believe that a prediction model should be created based on a comprehensive approach. This idea also includes the validation of the prediction model on a test (random) sample that consists of 59 NPOs. Table 11 shows that the model correctly classifies 54 out of 55 invulnerable organizations (98.18%), and three out of four vulnerable organizations (75%). The results show that the prediction model correctly estimated 57 out of 59 NPOs, representing 96.61%. In addition, we find that the Type I error is 1.82%, which is the ratio of 1 to 55 organizations, and that the Type II error is 25%, which is the ratio of 1 to 4 NPOs. The total error is 3.39%.
This result is achieved by a 13-fold higher number of invulnerable NPOs compared to vulnerable NPOs. The model correctly estimates 75% of the vulnerable organizations as the test sample contains only 4 organizations out of 21 NPOs.
5. Discussion
We extend the current knowledge about non-profit financial management based on research results, then confront our results with results from foreign studies, mostly from American authors. In addition, we point to the topicality and relevance of the research and describe its limitations in the research. We also propose possibilities for further research, especially in predicting the financial status of Slovak NPOs.
The topic of prediction of NPOs is an unexplored area in the Slovak Republic, but also in Central Europe. In this paper, we draw from various studies by Tuckman and Chang [16], Greenlee and Trussel [26], Trussel [27], Trussel, Greenlee, and Brady [28], Trussel and Greenlee [29], Omar, Arshad, and Razali [50], and Tevel, Katz, and Brock [25] looking for significant variables in determining the financial vulnerability from a statistical perspective. From our point of view, we consider the most important study to be the study by Tuckman and Chang [16], from which most of the subsequent authors proceed.
Table 12 shows the independent indicators which are statistically significant in estimating the financial status of Slovak non-profit organizations, using the logit model. The results show that DEBRAT, EQUREV, OPEMAR, and TYPKOD are statistically significant indicators in contrast to others. The research identifies that high debt levels increase the likelihood of a non-profit organization going bankrupt. Other statistically significant indicators have a positive impact on the financial status. In addition, we find that commercial non-profit organizations are less vulnerable non-profit organizations.
We conclude that many authors have a different view of financial vulnerability. Financial vulnerability is explained by net assets, the ratio of expenditure to income, and other significant variables over a period. In our case, the financial status means invulnerable and vulnerable NPOs, and the vulnerable NPO is in liquidation. Moreover, we find that many variables from foreign authors also have a significant impact on the Slovak non-profit sector, but not all the models are applicable to Slovak NPOs, namely Greenlee and Trussel [26], and Trussel, Greenlee, and Brady [28], because of the inability to calculate administrative costs. On other hand, the other two models can be quantified by Trussel [27] and Trussel and Greenlee [29] if we adjust the calculation of revenue concentration for Slovak NPOs. As mentioned above, this modification can be completed by calculating the revenue concentration using the HHI of the individual aggregate revenue items from the income statement.
Table 13 reveals that an increase in equity to total income has a positive impact on reducing the likelihood of a non-profit’s vulnerability, in contrast to Greenlee and Trussel [26]. This indicator is not statistically significant in other prediction models. On the other hand, the logit model for the Slovak non-profit organizations does not include income concentration, unlike all the other indicators. In other words, revenue concentration has no impact on the potential problems in decision-making, such as the non-profit’s size. The administrative costs are not included in our research for specific financial statements. The debt ratio is like the other models, except for Greenlee and Trussel [26]; this variable increases the likelihood of non-profit organizations’ vulnerability. Our research shows that a significant variable is also a qualitative variable describing the type of non-profit organization divided into commercial and non-commercial organizations. The results show that commercial non-profit organizations are less vulnerable than other organizations. The companies that establish non-profit organizations are “angels with protective wings” above a non-profit organization. We find that several indicators from previous research also have a significant impact on the Slovak non-profit sector. However, EQUREV is the only indicator that has a different impact on financial status than Greenlee and Trussel [26].
Greenlee and Trussel [26] argue that the relevant variables are equity, revenue concentration, administrative costs, and operating margin. In our case, we do not use administrative costs, on the other hand, the revenue concentration is calculated differently from the original studies by foreign authors. This variable is calculated as the HHI of each aggregate revenue item from the income statement. This difference is related to a different number of revenue items in the Slovak income statements. If Slovak legislation would require detailed donor information, then HHI could be calculated with high accuracy. The administrative costs are excluded because this accounting item is not explicitly mentioned in the Slovak financial statements compared to the US financial statements. Other variables, operating margin, and equity are included in our research. In this model, equity has a positive β-coefficient, which means that the variable increases the risk of financial vulnerability. However, we find that this variable has a different effect on the financial vulnerability of Slovak NPOs. We find that the β-coefficient is −3.371; this variable also has a greater impact on the reduction of financial vulnerability because this coefficient is several times higher than in the Greenlee and Trussel model [26]. Thus, this result demonstrates that the risk of financial vulnerability decreases with the increase in equity (inverse relationship). In our logit model, the operating margin reaches the second smallest β-coefficient among all the models, with the Greenlee and Trussel model [26] reaching its highest value of −3.4289. In both cases, we realize that the equity and operating margin have a positive impact on reducing financial vulnerability, but with different intensities. The operating margin in the Greenlee and Trussel model [26] has the greatest impact on reducing financial vulnerability, while in our model the β-coefficient is at its lowest level compared to the other variables in the proposed logit model. The operating margin has a similar impact as in the Greenlee and Trussel model [26]. In our model, these variables have a different impact on financial status, demonstrating that βEQUREV is −3.371, on other hand Greenlee and Trussel [26] present a prediction model with a β-coefficient at 0.1153.
We include the revenue concentration in our research, but this variable is not statistically significant. On other hand, the debt ratio has a significant impact on increasing the vulnerability of NPOs because the β-coefficient is 3.543 in our model compared to the β-coefficients from foreign authors. In the compared models, this variable has a much lower impact, as the values are about 1 ± 0.1. In our case, the increase in the debt ratio harms the financial status, as in the other models presented. In other words, the increase in the debt ratio has negative effects. This result is not surprising compared to our general expectations. We remind that we do not include the variable, size (assets), but the logarithm of assets for giant differences in total assets. In this case, we prefer the logarithm of assets compared to the absolute variable (assets), based on the recommendations by Szymanski, Puyvelde, and Jegers [51], but this variable is not statistically significant in the logit model.
Trussel [27] applies the same variables as in previous models, but the model is extended by a qualitative variable, according to the classification of economic activities. We do not include this variable in the initial group of independent variables. The reason is that the original sample consists of 351 NPOs operating in similar areas, according to SK NACE. In the case of the non-profit sector, there is no significant difference compared to the commercial sector. In addition, a substantial proportion of the NPOs operate in 88.990—other social care without accommodation, according to SK NACE. In this model, we consider a significant variable—operating margin—as in previous models based on the β-coefficient. In another model by Trussel, Greenlee, and Brady [28] only the β-coefficients are changed, while the operating margin and asset size have a greater impact on the reduction of financial vulnerability, on the contrary, the revenue concentration and debt ratio have a lower impact on the increase of vulnerability, compared to the previous model.
In addition to these variables, we apply a specific variable for Slovak NPOs, namely TYPKOD (the type of NPO divided into commercial and non-commercial NPO). If an organization is a non-commercial NPO (reference variable) then the probability of financial vulnerability is not reduced. On the other hand, we emphasize that the commercial (corporate) NPOs are more resistant to financial vulnerability.
The logit model differs in the specific variable type of the NPO compared to other variables. This model contains variables with other β-coefficients that reflect the current Slovak non-profit sector. This approach is applied to modern science in complex applications, such as robotics, industrial systems, and support systems for decision making.
6. Conclusions
The main aim of the paper was to propose a tool for assessing the financial status of Slovak NPOs using a logit model based on data on Slovak NPOs published in their financial statements. We design models based on a comprehensive analysis of the Slovak non-profit sector. This analysis helps to estimate the probability of the financial status of NPOs. Moreover, this research identifies key reasons for the financial vulnerability of NPOs. We believe that this paper extends the current knowledge on predicting the financial vulnerability of NPOs based on research results from Central Europe. In general, forecasting is an important planning and decision-making tool in all areas, as the estimates of financial variables and relationships are important to make the relevant model.
The model serves as a decision-making tool for potential contributors and donors. These donors choose stable non-profit organizations with a wide range of projects focusing primarily on social and health care, human rights advocacy, and other areas that are less interesting to the commercial sector. The results show that the commercial non-profit organizations are less financially at risk for stable incomes supporting regional and community projects. In addition, this model provides a comprehensive overview of the financial status of non-profit organizations for potential business partners, such as banks, suppliers, and others. The importance of the model lies in screening and monitoring, as they often reveal latent problems and provide feedback to managers and the public. Prediction models are preferred by governmental and other grant decision agencies. Another group includes creditors, who evaluate the creditworthiness of the NPO. The forecast complements the ex-ante financial analysis of the NPO. We expect the proposed model to contribute to improving the prediction of financial vulnerability in the non-profit sector because nonprofits are typical of incompetent management. Top managers are not interested in nonprofits for the low pay and benefits.
Limitations. We are fully aware of facing the objective and subjective constraints. These constraints have naturally affected the research results. The research has several limitations. First, the significant limitation was the lack of data on NPOs, in the form of financial statements and other accounting information. Second, there was a relatively low number of vulnerable NPOs, so there is some risk of impact on the results achieved. Third, we considered the selection of relevant variables based on the current knowledge, however, some of the financial variables could not be used for Slovak non-profit sector. The reason is that the application of the relevant statistical methods does not allow the use of organizations with incomplete variables. In other words, we have to consider selecting variables to avoid reducing the number of NPOs in our sample. Fourth, the paper was limited by the lack of scientific and professional publications by Slovak authors.
Future research. We believe that potential research on the prediction of NPOs can focus on verifying proposed models for European NPOs based on the Amadeus data. If the proposed model does not achieve good predictive power, then a new predictive model can be created based on the quantitative and qualitative data of a wider range of European NPOs. This tool will be positively perceived by the wider scientific and professional public. Another possibility is to expand the number of independent variables to estimate the financial vulnerability of NPOs. Furthermore, the impact of qualitative indicators can also be considered, as most of the variables tested have a quantitative character in our research.
This paper provides stimulus to another option, which is to compare the results of a static method (binary logistic regression) with the results based on a dynamic method (survival analysis, namely, Cox regression) in designing a significant model for NPOs to predict financial vulnerability in terms of probability estimation (binary logistic regression) and survival time (survival analysis, according to Cox regression). Cox regression is a tool of nonparametric survival analysis, but parametric survival analysis methods can also be applied. In addition to these methods, parametric and other non-parametric methods are known, such as life tables and Kaplan–Meier estimates, which could be used in future research. Future research can focus on the usage of existing predictive models in evaluating the Slovak or European NPOs to compare their predictive power, but not all the prediction models are applicable, for instance, models by Greenlee and Trussel [26] and Trussel, Greenlee, and Brady [28] cannot be calculated for the inability to calculate administrative costs.
Author Contributions
Conceptualization, J.M. and V.B.; methodology, J.M.; software, J.M. and P.B.; validation, J.M. and V.B.; formal analysis, V.B.; investigation, J.M.; resources, J.M.; data curation, J.M.; writing—original draft preparation, J.M., V.B. and P.B.; writing—review and editing, J.M.; visualization, J.M.; supervision, V.B.; project administration, V.B. and P.B.; funding acquisition, V.B. and P.B. All authors have read and agreed to the published version of the manuscript.
Funding
This paper is an output of the project of FPEDAS, University of Zilina [1/KKMHI/2021].
Institutional Review Board Statement
Not applicable.
Informed Consent Statement
Not applicable.
Data Availability Statement
Not applicable.
Conflicts of Interest
The authors declare no conflict of interest.
References
- McKeever, B. The Nonprofit Sector in Brief. 2015: Public Charities, Giving and Volunteering. Available online: http://www.urban.org/research/publication/nonprofit-sector-brief-2015-public-charities-giving-and-volunteering (accessed on 27 July 2020).
- Bundesveband Deutscher Stiftungen. What Motivates Founders? Available online: https://www.stiftungen.org/en/home/german-foundations/typology-of-foundations.html (accessed on 3 September 2020).
- Czech Statistical Office. Statistika Počtu Nestatnich Neziskovych Organizaci. Available online: https://www.czso.cz/ (accessed on 16 October 2020).
- Ministry of Interior of the Slovak Republic. Register and Evidence. Available online: http://www.ives.sk/registre/start.do (accessed on 16 October 2020).
- Rojas, R.R. A Review of Models for Measuring Organizational Effectiveness Among For-Profit and Nonprofit Organizations. Nonprofit Manag. Leadersh. 2000, 11, 97–104. [Google Scholar] [CrossRef]
- Kliestik, T.; Misankova, M.; Valaskova, K.; Svabova, L. Bankruptcy prevention: New effort to reflect on legal and social changes. Sci. Eng. Ethics 2018, 24, 791–803. [Google Scholar] [CrossRef] [PubMed]
- Greiff, D.; Ghaffari, H. Financial Management for Nonprofits. Available online: http://www.state.in.us/ihcda/files/Financial_Mgmt_for_Nonprofits_Guide(1).pdf (accessed on 3 September 2020).
- Keating, E.K.; Fischer, M.; Gordon, T.P.; Greenlee, J.S. Assessing Financial Vulnerability in the Nonprofit Sector. KSG Work. Pap. 2005, 27, 1–39. [Google Scholar] [CrossRef] [Green Version]
- Myser, S. Financial Health of Nonprofit Organizations. Ph.D. Thesis, University of Kansas, Lawrence, KS, USA, 29 July 2016. [Google Scholar]
- Emerling, I.; Wojcik-Jurkiewicz, M. The risk associated with the replacement of traditional budget with performance budgeting in the public finance sector management. Ekon. Manaz. Spektrum 2018, 12, 55–63. [Google Scholar] [CrossRef]
- Kovacova, M.; Kliestik, T. Logit and Probit application for the prediction of bankruptcy in Slovak companies. Equilib. Q. J. Econ. Econ. Policy 2017, 12, 775–791. [Google Scholar] [CrossRef]
- Valaskova, K.; Kliestik, T.; Kovacova, M. Management of financial risks in Slovak enterprises using regression analysis. Oeconomia Copernic. 2018, 9, 105–121. [Google Scholar] [CrossRef] [Green Version]
- Svabova, L.; Kramarova, K.; Durica, M. Prediction model of firm’s financial distress. Ekon. Manaz. Spektrum 2018, 12, 16–29. [Google Scholar] [CrossRef]
- Ren, L.; Ren, P. Applying a Combined Max-Min Simple Moving Average Trading Strategy to Market Indexes. Econ. Manag. Financ. Mark. 2018, 13, 11–23. [Google Scholar]
- Berta, S.; Burger, R. The Impact of Financial Vulnerability on the Functioning of NGOs: An Empirical Study of Ugandan NGOs. Uganda. Available online: http://www.ciriec.uliege.be/repec/WP15-15.pdf (accessed on 3 September 2020).
- Tuckman, H.P.; Chang, C.F. A Methodology for Measuring the Financial Vulnerability of Charitable Nonprofit Organizations. Nonprofit Volunt. Sect. Q. 1991, 20, 445–460. [Google Scholar] [CrossRef]
- Gilbert, L.R.; Menon, K.; Schwartz, K.B. Predicting bankruptcy for firms in financial distress. J. Bus. Financ. Account. 1990, 17, 161–171. [Google Scholar] [CrossRef]
- Zavgren, C.V. Assessing the vulnerability to failure of American industrial firms: A Logistic analysis. J. Bus. Financ. Account. 1985, 12, 19–45. [Google Scholar] [CrossRef]
- Jones, K.R.; Mucha, L. Sustainability assessment and reporting for nonprofit organizations: Accountability for the public good. Voluntas 2014, 25, 1465–1482. [Google Scholar] [CrossRef]
- Hager, M.A. Financial Vulnerability among Arts Organizations: A Test of the Tuckman-Chang Measures. Nonprofit Volunt. Sect. Q. 2001, 30, 376–392. [Google Scholar] [CrossRef] [Green Version]
- Altman, E.I. Financial ratios, discriminant analysis, and the prediction of corporate bankruptcy. J. Financ. 1968, 23, 589–609. [Google Scholar] [CrossRef]
- Ohlson, J.A. Financial Ratios and the Probabilistic Prediction of Bankruptcy. J. Account. Res. 1980, 18, 109–131. [Google Scholar] [CrossRef] [Green Version]
- Blanton, T. Convolutional Neural Networks, Analytical Algorithms, and Personalized Health Care: Embracing the Massive Data Analysis Capabilities of Deep Learning Artificial Intelligence Systems to Complement and Improve Medical Services. Am. J. Med. Res. 2018, 5, 52–57. [Google Scholar]
- Sontag-Padilla, L.M.; Staplefoote, L.; Morganti, K.G. Financial Sustainability for Nonprofit Organizations: A Review of the Literature; RAND Corporation: Santa Monica, CA, USA, 2012; pp. 1–34. [Google Scholar]
- Tevel, E.; Katz, H.; Brock, D.M. Nonprofit Financial Vulnerability: Testing Competing Models, Recommended Improvements, and Implications. Int. J. Volunt. Nonprofit Organ. 2015, 26, 2500–2516. [Google Scholar] [CrossRef]
- Greenlee, J.S.; Trussel, J.M. Predicting the Financial Vulnerability of Charitable Organizations. Nonprofit Manag. Leadersh. 2000, 11, 199–210. [Google Scholar] [CrossRef]
- Trussel, J.M. Revisiting the Prediction of Financial Vulnerability. Nonprofit Manag. Leadersh. 2002, 13, 17–31. [Google Scholar] [CrossRef]
- Trussel, J.; Greenlee, J.S.; Brady, T. Predicting Financial Vulnerability in Charitable Organizations. CPA J. 2002, 72, 66–69. [Google Scholar]
- Trussel, J.; Greenlee, J. A financial rating system for charitable nonprofit organizations. Res. Gov. Nonprofit Account. 2001, 11, 93–116. [Google Scholar]
- Cordery, C.J.; Sim, D.; Baskerville, R.F. Three models, one goal: Assessing financial vulnerability in New Zealand amateur sports clubs. Sport Manag. Rev. 2013, 16, 186–199. [Google Scholar] [CrossRef]
- De Andres-Alonso, P.; Garcia-Rodriguez, I.; Romero-Merino, M.E. Disentangling the Financial Vulnerability of Nonprofits. Voluntas 2016, 27, 2539–2560. [Google Scholar] [CrossRef]
- Zhai, R.L.; Watson, J.; Gilchrist, D.; Newby, R. Non-profit vulnerability: An exploratory study. Financ. Account. Manag. 2017, 33, 373–390. [Google Scholar] [CrossRef]
- Cipra, T. Financni Ekonometrie; Ekopress: Praha, Czech Republic, 2008; pp. 1–538. [Google Scholar]
- Amadeus. Available online: https://amadeus.bvdinfo.com/ (accessed on 30 March 2019).
- Finstat. Available online: https://www.finstat.sk/ (accessed on 17 October 2018).
- Ministry of Finance of the Slovak Republic. Register of Financial Statements. Available online: http://www.registeruz.sk/ (accessed on 30 May 2019).
- Burde, G.; Rosenfeld, A.; Sheaffer, Z. Prediction of Financial Vulnerability to Funding Instability. Nonprofit Volunt. Sect. Q. 2016, 46, 280–304. [Google Scholar] [CrossRef]
- Burde, G. Improved Methods for Predicting the Financial Vulnerability of Nonprofit Organizations. Adm. Sci. 2018, 8, 3. [Google Scholar] [CrossRef] [Green Version]
- Chan, Y.H. Biostatistics 202: Logistic regression analysis. Singap. Med. J. 2004, 45, 149–153. [Google Scholar]
- Stankovicova, I.; Vojtekova, M. Viacrozmerne Statisticke Metody s Aplikaciami; Iura Edition: Bratislava, Slovakia, 2007; pp. 1–261. [Google Scholar]
- Zhou, Y.; Elhag, T. Apply Logit analysis in Bankruptcy Prediction. Electr. Comput. Eng. Ser. 2007, 301–308. [Google Scholar]
- Soo-Seon, P. A comparative study of logit and artificial neural networks in predicting bankruptcy in the hospitality industry. Tour. Econ. 2012, 18, 311–338. [Google Scholar]
- Kasgari, A.A.; Salehnezhad, S.S.; Ebadi, F. The bankruptcy prediction by neural networks and logistic regression. Int. J. Acad. Res. Account. Financ. Manag. Sci. 2013, 3, 146–152. [Google Scholar]
- NCSS Statistical Software. Logistic Regression. Available online: https://ncss-wpengine.netdna-ssl.com/wp-content/themes/ncss/pdf/Procedures/NCSS/Logistic_Regression.pdf (accessed on 16 October 2020).
- Tabaschnick, B.G.; Fidell, L.S. Using Multivariate Statistics; Pearson: Boston, MA, USA, 2006; pp. 1–815. [Google Scholar]
- Rimarcik, M. Statistika Pre Prax; Univerzita Pavla Jozefa Šafárika: Kosice, Slovakia, 2007; pp. 1–200. [Google Scholar]
- IBM SPSS. IBM SPSS Regression 25. Available online: ftp://public.dhe.ibm.com/software/analytics/spss/documentation/statistics/25.0/en/client/Manuals/IBM_SPSS_Regression.pdf (accessed on 16 October 2020).
- Forum Darcu. Zebricky Nadaci a Fondu. Available online: http://www.darcovskasms.cz/ (accessed on 17 October 2018).
- Umer, S. Bankruptcy Prediction Using Data Mining Classification Techniques. Master’s Thesis, University of Salford Manchester, Salford, UK, 2018. [Google Scholar]
- Omar, N.; Arshad, R.; Razali, W.A. Assessment of Risk Using Financial Ratios in Non-Profit Organizations. J. Energy Technol. Policy 2013, 3, 382–389. [Google Scholar]
- Szymanska, A.; Puyvelde, S.V.; Jegers, M. Bankruptcy in Belgian Social Purpose Companies: An Analysis of Financial, Environmental and Institutional Factors. Available online: http://socialimpactstrategy.org/wp-content/uploads/2016/04/Szymanska.pdf (accessed on 25 October 2018).
Figure 1.
Algorithm for Prediction Model Design.

Figure 2.
ROC curve.


Table 1.
Definitions of financial vulnerability according to renowned authors.
| Authors | Definition of Financial Vulnerability in the Non-Profit Sector |
|---|---|
| Tuckman and Chang [16] | Financial vulnerability represents the quintile of four variables, such as equity, administrative costs, revenue concentrations, and operating margin. If a non-profit organization has some variable at the lowest quintile, then the non-profit organization has a financial problem. |
| Greenlee and Trussel [26] | Financial vulnerability represents the decline in the proportion of expenditure to revenue by more than 20% over three years. |
| Hager [20] | Financial vulnerability represents the non-disclosure of financial statements over four years. |
| Trussel [27] | Financial vulnerability represents the decline in net assets by more than 20% over three years. |
| Trussel, Greenlee, and Brady [28] | Financial vulnerability represents the decline in net assets over three years. |
| Trussel and Greenlee [29] | Financial vulnerability represents the decline in net assets by more than 20% or 50% over three years, depending on prediction models. |
| Cordery, Sim, and Baskerville [30] | Financial vulnerability represents the decline in the proportion of program expenditure to revenue over three years. |
| Financial vulnerability represents the decline in net assets over three years. | |
| Financial vulnerability represents the difference between revenue and expenditure over three years. | |
| Andres-Alonso, Garcia-Rodriguez, and Romero-Merino [31] | Financial vulnerability represents the decline in net assets by more than 20% over three years. |
| Financial vulnerability represents the decline in program expenditure by more than 20% over three years. |
Table 2.
Dichotomous (independent) variable.
| Total | Coding | ||
|---|---|---|---|
| TYPKOD | Commercial NPO | 71 | 1.000 |
| Non-commercial NPO | 165 | 0.000 | |
| PRAFOKOD | Foundation | 206 | 1.000 |
| Non-investment fund | 30 | 0.000 | |
Table 3.
Independent variables.
| Variables | Acronym | Formula/Factor |
|---|---|---|
| age of organization | AGEORG | age of non-profit organization (in years) |
| revenue concentration | CONREV | revenue concentration calculated by Herfindahl–Hirschman Index (HHI) |
| contribution from tax paid to total revenues | CPTREV | contribution from tax paid/total revenues |
| debt ratio | DEBRAT | debt/total assets |
| dotation to total revenues | DOTREV | dotation/total revenues |
| equity ratio | EQUREV | equity/total revenues |
| liquidity ratio | LIQRAT | (current assets—current liabilities)/current assets |
| logarithm of assets | LOGASS | logarithm (assets) |
| non-current assets | NCUASS | non-current assets/total assets |
| net working capital to total assets | NWCASS | (current assets—short-term liabilities)/total assets |
| operating margin | OPEMAR | (revenue—costs)/total revenues |
| legal form of the non-profit organization | PRAFO | the legal form of the non-profit organization |
| commercial revenue to total assets | SALREV | (sales of products + revenues from services + revenues from sold goods)/total revenues |
| type of non-profit organization | TYPKOD | non-commercial or commercial non-profit organizations |
Table 4.
Multicollinearity.
| Model | Collinearity Statistics | |
|---|---|---|
| Tolerance | VIF | |
| CONREV | 0.822 | 1.216 |
| OPEMAR | 0.729 | 1.372 |
| DEBRAT | 0.243 | 4.122 |
| EQUREV | 0.704 | 1.420 |
| NWCASS | 0.159 | 6.280 |
| CPTREV | 0.709 | 1.411 |
| SALREV | 0.887 | 1.128 |
| LOGASS | 0.717 | 1.394 |
| DOTREV | 0.913 | 1.095 |
| NCUASS | 0.330 | 3.028 |
| LIQRAT | 0.778 | 1.286 |
| AGEORG | 0.933 | 1.072 |
Table 5.
Omnibus Tests of Model Coefficients.
| Chi-Square | df | Sig. | ||
|---|---|---|---|---|
| 1 | Step | 89.134 | 14 | 0.000 |
| Block | 89.134 | 14 | 0.000 | |
| Model | 89.134 | 14 | 0.000 | |
| 11 | Step | −2.216 | 1 | 0.098 |
| Block | 83.032 | 4 | 0.000 | |
| Model | 83.032 | 4 | 0.000 | |
Table 6.
Model Summary.
| Backward Stepwise | Forward Stepwise | |||||
|---|---|---|---|---|---|---|
| Step | −2 Log Likelihood | Cox and Snell R Square | Nagelkerke R Square | −2 Log Likelihood | Cox and Snell R Square | Nagelkerke R Square |
| 1 | 33.051 | 0.315 | 0.778 | 73.735 | 0.186 | 0.459 |
| 2 | 33.098 | 0.314 | 0.778 | 64.860 | 0.216 | 0.534 |
| 3 | 33.172 | 0.314 | 0.777 | |||
| 4 | 33.232 | 0.314 | 0.777 | |||
| 5 | 33.332 | 0.314 | 0.776 | |||
| 6 | 33.475 | 0.313 | 0.775 | |||
| 7 | 33.852 | 0.312 | 0.773 | |||
| 8 | 34.180 | 0.311 | 0.770 | |||
| 9 | 35.272 | 0.308 | 0.762 | |||
| 10 | 36.938 | 0.303 | 0.750 | |||
| 11 | 39.154 | 0.297 | 0.734 | |||
Table 7.
Variables in the Equation.
| B | S.E. | Wald | df | Sig. | Exp (B) | 95% C. I. for Exp (B) | ||
|---|---|---|---|---|---|---|---|---|
| Lower | Upper | |||||||
| OPEMAR | −2.479 | 0.916 | 7.318 | 1 | 0.007 | 0.084 | 0.014 | 0.505 |
| DEBRAT | 3.543 | 1.119 | 10.025 | 1 | 0.002 | 34.564 | 3.857 | 309.772 |
| EQUREV | −3.371 | 1.237 | 7.423 | 1 | 0.006 | 0.034 | 0.003 | 0.388 |
| TYPKOD | −5.344 | 2.728 | 3.838 | 1 | 0.049 | 0.005 | ||
| Constant | −2.750 | 0.643 | 18.271 | 1 | 0.000 | 0.064 | ||
Table 8.
Case Processing Summary.
| Financial Status | Valid (N) |
|---|---|
| Vulnerable NPO | 17 |
| Invulnerable NPO | 219 |
Table 9.
Classification table a.
| Observed | Predicted Financial Status | Percentage Correct (%) | ||
|---|---|---|---|---|
| Invulnerable NPO | Vulnerable NPO | |||
| Financial status | Invulnerable NPO | 217 | 2 | 99.09 |
| Vulnerable NPO | 5 | 12 | 70.59 | |
| Overall Percentage | 97.03 | |||
a The cut value is 0.500.
Table 10.
Area Under the Curve.
| Area | Std. Error a | Asymptotic Sig. b | Asymptotic 95% Confidence Interval | |
|---|---|---|---|---|
| Lower Bound | Upper Bound | |||
| 0.975 | 0.017 | 0.000 | 0.942 | 1.000 |
a Under the nonparametric assumption; b Null hypothesis: true area = 0.5.
Table 11.
Classification table based on the test sample a.
| Observed | Predicted Financial Status | Percentage Correct (%) | ||
|---|---|---|---|---|
| Invulnerable NPO | Vulnerable NPO | |||
| Financial status | Invulnerable NPO | 54 | 1 | 98.18 |
| Vulnerable NPO | 1 | 3 | 75.0 | |
| Overall Percentage | 96.61 | |||
a The cut value is 0.500.
Table 12.
Hypothesis summary.
| Acronym | H0 | H1 |
|---|---|---|
| AGEORG | ✓ | |
| CONREV | ✓ | |
| CPTREV | ✓ | |
| DEBRAT | ✓ | |
| DOTREV | ✓ | |
| EQUREV | ✓ | |
| LIQRAT | ✓ | |
| LOGASS | ✓ | |
| NCUASS | ✓ | |
| NWCASS | ✓ | |
| OPEMAR | ✓ | |
| PRAFO | ✓ | |
| SALREV | ✓ | |
| TYPKOD | ✓ | ✓ |
Table 13.
Comparison of the proposed model with foreign models.
| Greenlee and Trussel [26] | Trussel [27] | Trussel, Greenlee, and Brady [28] | Trussel and Greenlee [29] | Our Model | |
|---|---|---|---|---|---|
| Intercept | −3.0610 | 0.2475 | 0.7754 | 1.4398 | −2.750 |
| EQUREV | 0.1153 | −3.371 | |||
| CONREV | 1.2528 | 0.8402 | 0.1496 | 0.07654 | |
| ADMCOS | −2.2639 | 0.1256 | |||
| OPEMAR | −3.4289 | −1.3527 | −2.8419 | −5.2450 | −2.479 |
| SIZE | −0.1396 | −0.1665 | −0.1594 | ||
| DEBRAT | 1.1088 | 0.9722 | 0.9754 | 3.543 | |
| TYPKOD | −5.344 |
Publisher’s Note: MDPI stays neutral with regard to jurisdictional claims in published maps and institutional affiliations. |
© 2022 by the authors. Licensee MDPI, Basel, Switzerland. This article is an open access article distributed under the terms and conditions of the Creative Commons Attribution (CC BY) license (https://creativecommons.org/licenses/by/4.0/).
Share and Cite
MDPI and ACS Style
Mazanec, J.; Bartosova, V.; Bohm, P. Logit Model for Estimating Non-Profit Organizations’ Financial Status as a Part of Non-Profit Financial Management. Mathematics 2022, 10, 2162. https://doi.org/10.3390/math10132162
AMA Style
Mazanec J, Bartosova V, Bohm P. Logit Model for Estimating Non-Profit Organizations’ Financial Status as a Part of Non-Profit Financial Management. Mathematics. 2022; 10(13):2162. https://doi.org/10.3390/math10132162
Chicago/Turabian StyleMazanec, Jaroslav, Viera Bartosova, and Patrik Bohm. 2022. "Logit Model for Estimating Non-Profit Organizations’ Financial Status as a Part of Non-Profit Financial Management" Mathematics 10, no. 13: 2162. https://doi.org/10.3390/math10132162
Note that from the first issue of 2016, this journal uses article numbers instead of page numbers. See further details here.