
COVID-19 Detection Systems Using Deep-Learning Algorithms Based on Speech and Image Data


1
Centre for Data Analytics and Cybersecurity, Department of Computer Engineering, University of Sharjah, Sharjah 27272, United Arab Emirates
2
Centre for Data Analytics and Cybersecurity, Department of Electrical Engineering, University of Sharjah, Sharjah 27272, United Arab Emirates
3
Center for Cyber-Physical Systems, Department of Electrical Engineering and Computer Science, Khalifa University, Abu Dhabi 127788, United Arab Emirates
*
Author to whom correspondence should be addressed.
Mathematics 2022, 10(4), 564; https://doi.org/10.3390/math10040564
Submission received: 27 November 2021
/
Revised: 27 January 2022
/
Accepted: 1 February 2022
/
Published: 11 February 2022
(This article belongs to the Special Issue Classification, Diagnosis and Prognosis of Diseases Using Machine Learning Algorithms)
Abstract
:The global epidemic caused by COVID-19 has had a severe impact on the health of human beings. The virus has wreaked havoc throughout the world since its declaration as a worldwide pandemic and has affected an expanding number of nations in numerous countries around the world. Recently, a substantial amount of work has been done by doctors, scientists, and many others working on the frontlines to battle the effects of the spreading virus. The integration of artificial intelligence, specifically deep- and machine-learning applications, in the health sector has contributed substantially to the fight against COVID-19 by providing a modern innovative approach for detecting, diagnosing, treating, and preventing the virus. In this proposed work, we focus mainly on the role of the speech signal and/or image processing in detecting the presence of COVID-19. Three types of experiments have been conducted, utilizing speech-based, image-based, and speech and image-based models. Long short-term memory (LSTM) has been utilized for the speech classification of the patient’s cough, voice, and breathing, obtaining an accuracy that exceeds 98%. Moreover, CNN models VGG16, VGG19, Densnet201, ResNet50, Inceptionv3, InceptionResNetV2, and Xception have been benchmarked for the classification of chest X-ray images. The VGG16 model outperforms all other CNN models, achieving an accuracy of 85.25% without fine-tuning and 89.64% after performing fine-tuning techniques. Furthermore, the speech–image-based model has been evaluated using the same seven models, attaining an accuracy of 82.22% by the InceptionResNetV2 model. Accordingly, it is inessential for the combined speech–image-based model to be employed for diagnosis purposes since the speech-based and image-based models have each shown higher terms of accuracy than the combined model.
1. Introduction and Literature Review
Since the outbreak of COVID-19 in December 2019 and its declaration as a global worldwide epidemic, in March 2020, by the World Health Organization (WHO), almost every human being’s life has been threatened by this virus. At present, there have been more than 216 million confirmed cases of COVID-19 infections in more than 200 countries across the world. In addition, more than 4 million people have died, based on the statistics from WHO [1]. COVID-19 has attracted an extraordinary amount of interest due to the potentially fatal damage it has caused to the respiratory system in some patients, in addition to its high transmissibility rates among humans [2]. Over time, it has been revealed that the most common symptoms in most of the positive COVID-19 cases are fever, cold, fatigue, sore throat, headache, and loss of smell. Due to the high rate of COVID-19 casualties, the health industry is keenly interested in finding a more cost-efficient and faster approach, than the classical approaches, such as polymerase chain reaction (PCR), reverse transcriptase polymerase chain reaction (RT-PCR), and diffractive phase interferometry (DPI), for COVID-19 detection [3]. COVID-19’s critical challenges are identification and categorization. This is because of how it interacts with other lung infections. COVID-19 is highly transmittable compared to other lung diseases. Subsequently, the COVID-19 incubation period lasts between 3 to 10 days. Additionally, its high mortality rate alongside its preposterously wide dissemination and its ramifications have made it extremely threatening [4]. The current gold standard for COVID-19 identification is reverse transcriptase quantitative polymerase chain reaction (RT-qPCR). Small portions of viral RNA are extracted from the nasal swab and amplified before being identified using virus detection techniques. Unfortunately, the standard method of RT-qPCR testing is time-consuming and necessitates the participation of medical professionals, which may not be attainable. In addition, many studies have shown high false-positive rates for RT-qPCR testing [5,6]. The numbers of cases, and death rates, are increasing rapidly. Therefore, the early diagnosis of infected individuals is crucial to controlling this pandemic. However, advanced intelligent prediction systems and accurate modeling of techniques have made a valuable contribution to managing and planning health resources to work against the virus [7].
The significant contributions of this work are as follows:
- We used a two-level classification system that is capable of automatically detecting the acoustic sounds of coughing, breathing, and speaking, along with the presence of COVID-19.
- The grid-search algorithm has been utilized to optimize the hypermeters of the different CNN models for the image-based model.
- We conducted a deep investigation on the effect of the number of MFCC coefficients on the system’s overall performance.
- We created a novel multimodal system utilizing audio and X-ray chest modalities.
- We assembled a new multimodal dataset encompassing both healthy and COVID-19 patients.
Recently, AI has been extensively implemented in the digital health sector and specifically in the COVID-19 health crisis, due to the variety of information it provides, such as COVID-19 growth-rate detection, risk, and infection severity identification, in addition to death prediction. AI is a broad umbrella that consists of many subdivisions, including machine learning (ML) and deep learning (DL), which both imitate the functionality of the human brain and behaviors based on the data that is fed to cluster tasks [8]. AI has numerous applications in both speech-signal processing and digital-image processing. Both facilitate the process of controlling, monitoring, and overcoming the COVID-19 epidemic through their four-step procedure: detection, prevention, recovery, and response [9]. Scientists believe that it is possible to determine the presence of a COVID-19 infection by analyzing the generated sounds from the respiratory system, whether cough, breathing, or regular speech. Furthermore, medical imaging data such as chest X-ray and lung computed tomography (CT) scans can be beneficial in COVID-19 detection [10].
The utilization of respiratory data could help to detect COVID-19 through three main approaches: (1) using cough sounds for the classification process of COVID-19-positive and -negative cases; (2) COVID-19 patient screening using breathing sounds and breathing rates; and (3) using patient sounds to detect COVID-19 symptoms, due to the fact that patients have experienced dysphonia symptoms with a severity rate ranging from moderate to acute, which resulted in voice alterations—these symptoms are not usually observed with these levels of severity in the usual lung infections. In [2], Bader et al. have proposed a cost-efficient model that combines both Mel-frequency cepstral coefficients (MFCCs) and speech signal processing for a sample extraction from non-COVID and COVID patients, and obtained the personal correlation from their relationship coefficients. The dataset we utilized is comprised of healthy and infected sound divisions where each division is split into three subdivisions; namely, cough, breath, and voice. That dataset has been collected from a group of 14 patients, divided into 7 healthy patients and 7 infected patients. The dataset has been acquired from a hospital in Sharjah in the United Arab Emirates. All the recordings have been captured via smartphones, which could impact the quality of the sound. Hassan et al. [8] have employed long short-term memory (LSTM) to construct a COVID-19 detection system for the analysis of the acoustic features of the cough, breathing, and voice of the patients from the audio dataset, which also consist of COVID-19 and non-COVID-19 sound samples. The results have shown a low accuracy in the voice test (88.2%) compared to both coughing and breathing sound samples, which achieved 98.2% and 97% accuracy, respectively. COVID-19 epidemic forecasting has attracted intensive attention from researchers, doctors, and scientists from all over the world. In addition to that, it has been a vital task to keep tracking and monitoring the ongoing pandemic. Several papers have proposed a COVID-19 gray forecasting-based model. In [11], authors have developed a new gray prediction model using a quadratic polynomial term. The proposed forecasting model has been applied to the confirmed COVID-19 cases, the fatal cases, and the recovered cases from COVID-19 of China at the early stage. By utilizing the gray method and mathematical derivations, based on the attained computational results, it can be observed that the proposed model has attained higher precision compared to other proposed models. Furthermore, Saxena [12], has proposed two internally optimized gray prediction models; namely, GM(1,1) and NGM(1,1,k). The presented work is a proposal of two internally optimized gray prediction models (IOGMs). These models are based on modifying the conventional gray forecasting model (GM(1,1)). The IOGMs have been formed by stacking infected case data with diverse overlap periods for forecasting pandemic spread at different locations in India. Multiple tests have been conducted for the performance evaluation of proposed gray models and conventional gray models GM(1,1) and NGM(1,1,k). It is observed that the prediction accuracies of the proposed models are satisfactory, and the forecasted results align with the mean infected cases. Investigations based on the evaluation of error indices indicate that the model with a higher overlap period provides better results.
Madhurananda et al. [13] proposed a contactless and easily applied COVID-19 classifier. This screening method used coughs recorded with a smartphone and applied several deep-learning techniques to discriminate between positive and negative coughs. They have utilized two datasets, collected across the six continents, which are comprised of both natural and forced coughs. The first, which is the publicly available coswara dataset, has 1079 healthy recordings and 92 COVID-19-positive recordings. The second dataset was collected in South Africa and has a total of 21 recordings, which are split into 8 COVID-19-positive subjects and 13 COVID-19-negative subjects. A variety of classifiers, including multilayer perceptron (MLP), logistic regression (LR), long short-term memory (LSTM), support vector machine (SVM), convolutional neural networks (CNN), and residual-based neural networks (RNN), have been evaluated in that work. The Resnet50 classifier has shown the best results among the classifiers, where it has achieved an accuracy of 95.3%. Deshpande et al. [14] have presented an automatic recognition system for COVID-19 coughs that demonstrates the use of the audio breathing patterns of coughs in identifying the presence of COVID-19. Authors have utilized an encoder–decoder architecture, where the encoder works on encoding the audio signal into breathing patterns, and the decoder decodes the status of COVID-19 for the corresponding breathing patterns using an attention mechanism. The encoder utilizes a stacked bi-directional long short-term memory (BI-LSTM) architecture, obtaining an area under curve (AUC) of 64.42%.
Kumar et al. [15] proposed an approach for COVID-19 detection based on cough sounds. Authors have employed a novel auditory acoustic cue based on the long-term transform, an equivalent rectangular bandwidth (ERB) spectrum, and a gammatone filter bank. The spectrum derived from constant-Q transform (CQT), the gammatone cepstral coefficients (GTCC) features, and the spectrum derived from the ERB constitute. In addition, the MFCCs have been evaluated using the LR, random forest (RF), and MLP. The combination of ERBspec–RF has achieved the highest term of AUC, obtaining an AUC of 81.89%. Jord et al. [16] projected an AI model based on the sounds of cough recordings collected via cell phones to detect COVID-19 symptoms. This model permits a costless solution for prescreening COVID-19 sound samples globally. In this method, cough recordings have been transformed with MFCCs and inputted into a CNN-based architecture comprised of one Poisson biomarker layer and three ResNet50s in parallel, providing an output of a binary prescreening diagnostic. The model has achieved an accuracy of 97.1% for predicting COVID-19-positive symptoms based on cough sounds and 100% accuracy in detecting asymptomatic COVID-19, based on the cough sounds of 5320 selected samples. Gunavant et al. [17] have utilized the crowdsourced cough audio samples, which were globally collected using mobile phone devices; numerous groups have collected enough COVID-19 cough-recording datasets to utilize them for machine-learning training to detect the presence of COVID-19. Nevertheless, these models have been trained on data from a variety of formats and recording settings. The dataset collection was taken from several sources, such as public media interview extraction, crowdsourcing, and clinical environments. The MFCCs have been evaluated to obtain the provided results; the proposed algorithm has achieved a 77.1% ROC-AUC.
On the medical imaging side, several studies have developed deep-learning models for COVID-19 identification and diagnosis, which are mainly based on CT scans and X-ray images. Maghdid et al. [18] have proposed an AI tool that can be utilized by radiologists or healthcare professionals to quickly and precisely detect COVID-19. They have established a wide-ranging dataset of X-rays and CT scan images from a variety of sources. In addition, they have utilized deep-learning and transfer-learning techniques; in this vein, a simple CNN and modified AlexNet model have been applied on preprocessed X-rays and CT-scan images datasets. The models showed an accuracy of up to 98% via a pretrained network and 94.1% accuracy by using the modified CNN. Wang et al. [19] introduced COVIDNet-CT, a deep CNN architecture dedicated to the detection of COVID-19 cases from chest CT images through a machine-driven design exploration technique. Moreover, they have also introduced COVIDx-CT, a benchmark CT image dataset comprised of CT imaging data gathered by the China National Center for bio information, encompassing 104,009 images collected from 1489 patient cases. Their method was evaluated with the models ResNet-50, NASNet-A-Mobile, EfficientNet-B0, and COVIDNet-CT, achieving an accuracy of 98.7%, 98.6%, 98.3%, and 99.1%, respectively.
Due to limited access to COVID-19 datasets, several studies addressed pretrained model and transfer-learning paradigms [20,21]. For example, Jaiswal et al. [22] employed the deep-transfer-learning approach to establish a classification algorithm for chest CT scans by utilizing the DenseNet201 model. The proposed model was utilized to extract features by using its own learned weights on the ImageNet dataset along with a convolutional neural structure. A total of 1260 CT images for COVID-19 patients and 1232 CT chest images for healthy patients were used for the training and testing phases for the DenseNet201 model. The proposed system has achieved remarkable results on several metrics, including precision, recall, F-measure, and accuracy, at 96.20%, 96.20%, 96.20%, and 96.21%, respectively. Moreover, Weng et al. [23] utilized the Inception model as a feature extractor. They collected 1065 CT images of pathogen-confirmed COVID-19 cases and other cases diagnosed with typical viral pneumonia. An internal and external validation was then done. The internal validation achieved a total accuracy of 89.5% with a specificity of 88% and a sensitivity of 87%. The external testing dataset showed a total accuracy of 79.3%, with a specificity of 83% and a sensitivity of 67%. In [24], five convolutional neural network-based models (ResNet50, ResNet101, ResNet152, InceptionV3, and Inception-ResNetV2) have been benchmarked for the detection of infected COVID-19 patients by the analysis of the chest X-ray images. Three different classifications with four classes (COVID-19, healthy, viral pneumonia, and bacterial pneumonia) have been implemented and tested with a fivefold cross. The ResNet50 model outperformed all the other models, achieving an accuracy of 99.7%.
In this research, we propose and experiment with three frameworks for detecting COVID-19; namely, a speech-based model, an image-based model, and a multimodal model encompassing both speech and image. We have utilized the MFCC as the extracted features with the LSTM as a classifier for the speech-based model. We investigated different CNN models to design both the image-based and multimodal speech-image-based models.
2. Speech-Based Model Methodology
2.1. Data Acquisition
Deep-learning models are data-driven, and training them requires a relatively large amount of data. In this work, data collection is the initial step in the proposed work. The gathered dataset is comprised of both speech and image datasets.
2.2. Speech Corpus
The speech corpus consists of 1159 sound samples of coughing, breathing, and speaking obtained from 592 participants, divided into 379 healthy and 213 COVID-19 infected patients. All dataset samples were captured using a mobile microphone. From the speech corpus, 42 sound samples were collected from a hospital in Sharjah, United Arab Emirates, where 14 healthy and COVID-19 infected patients participated. The participants were asked to cough four times, take a deep breath, and count from one to ten. Moreover, the patients were obliged to sit with their heads upright in a relaxed manner while recording their speech signals. Accordingly, three recordings per speaker were obtained during the session of data, using a mobile phone device, which can affect the sound quality. The remaining 1117 sound recordings were collected from the Coswara dataset [25], which is an open-source library. The sound samples were recorded using the same criteria mentioned earlier. Unfortunately, due to the inconvenience caused by the pandemic, we could not obtain an exact number of 3 recordings each for all the remaining 1117 participants per speaker. Some participants have only provided cough, breathing, or voice recordings, or a combination of two of these.
2.3. Speech Preprocessing
Speech signal preprocessing is an essential step that took place after the database was captured [26] It has a recognizable effect on the performance of the analysis. As a result, it must be performed on the recordings. This procedure is done by isolating the silent portions of sounds [27]. The preprocessing for this study was done using PRAAT software, which was implemented to eliminate the silence portions. In addition, it has a filtering option that can eliminate all other noises. Nevertheless, the silent portions of the captured recordings at the beginning and the end have been cut. Furthermore, in its discrete form, the speech signal is represented by the following expression [28],
where s(n) is the source signal, and d(n) is a noise signal. Moreover, speech data augmentation is extensively utilized in deep learning, specifically in speech signal processing, to inflate and provide increments and effectiveness for the dataset. In speech recognition, data augmentation includes: audio waveform deformation (AWD), which is done by increasing or decreasing the speed of audio; time stretching (TS), which can slow down or speed up the audio samples while keeping the pitch unchanged; and background noise (BG), where the sample is mixed with another recording containing background sounds from different acoustic scenes [29]. All these speech augmentation approaches were used in this proposed work.
x(n) = s(n) + d(n)
2.4. Feature Extraction
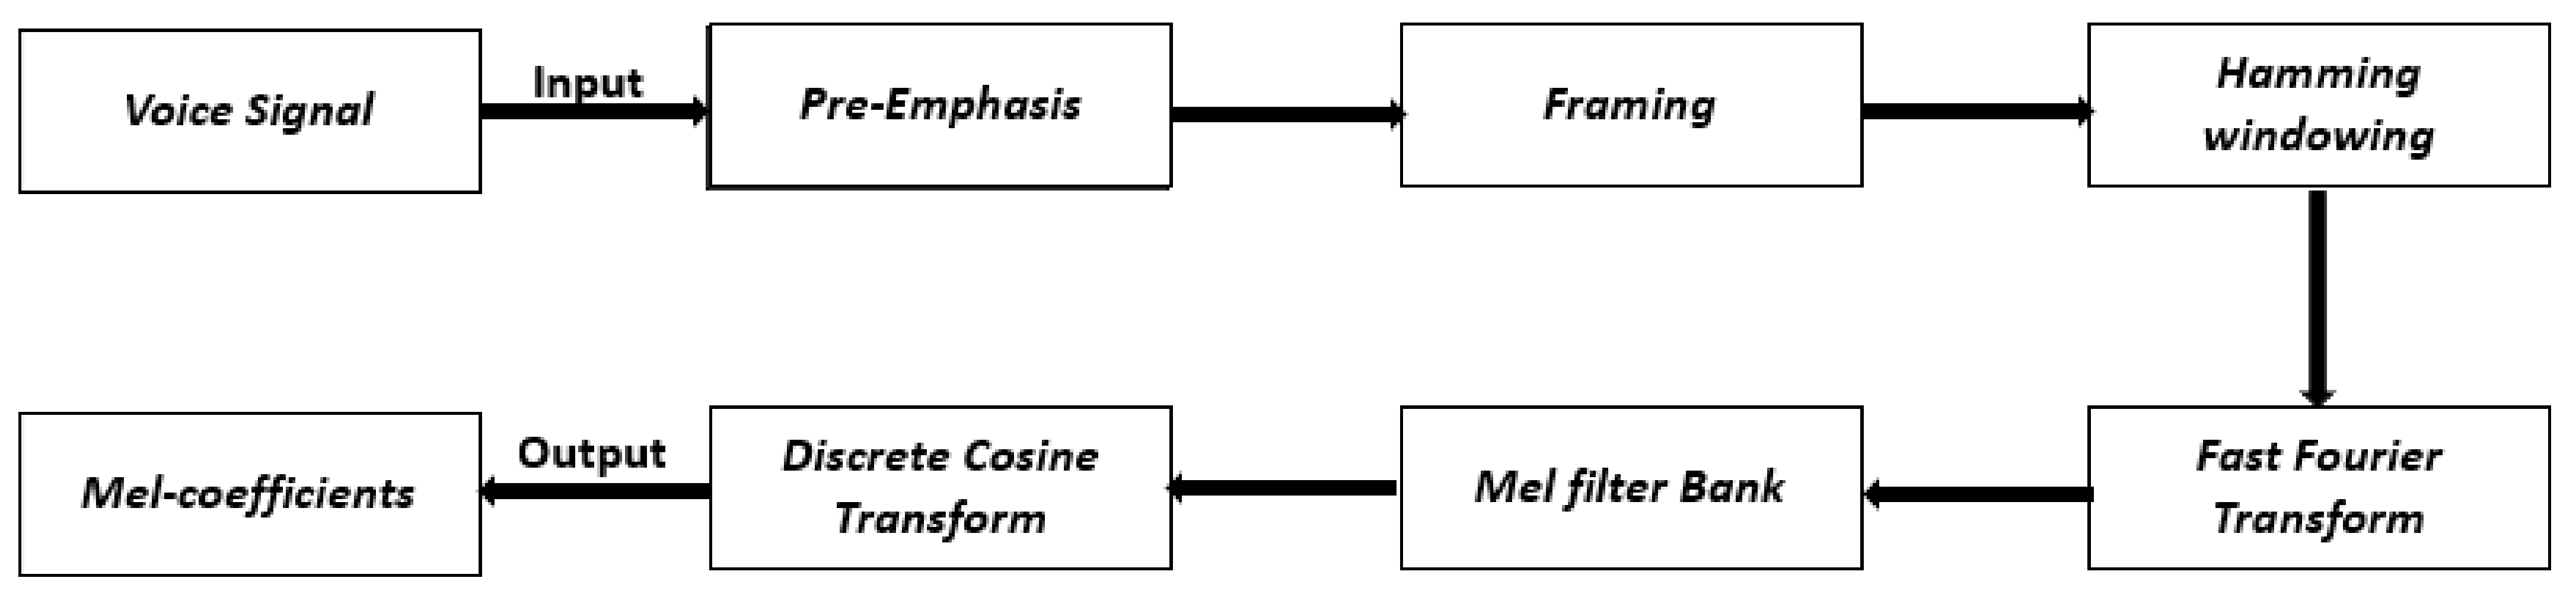
Speech signals and sound waves carry numerous parameters, which are called speech features. The determination of these features is a crucial step in the speech signal-processing algorithm impacting the accuracy of the system [30]. In the proposed work, the extracted features for the speech signal optimum representation are the Mel-frequency cepstral coefficients (MFCC) [2]. MFCC is a fundamental feature that is utilized in speaker and emotion recognition by virtue of the advanced representation of human auditory perception it provides [31,32,33]. MFCC is based on human hearing perceptions, which means that it relies on human listening features that cannot perceive frequencies over 1000 Hz. Specifically, MFCC is based on the known variations of the human ear’s critical bandwidth frequency. The MFCC has two types of filters which are set linearly at a frequency below 1000 kHz and a logarithmic spacing that exceeds 1000 Hz [34]. The computation of MFCC is depicted in Figure 1.
- Step 1: Pre-emphasis. In this step, the speech signal is passed to a high-pass filter. This process aims to increase the energy of the signal at higher frequencies and is represented by [36],where x(n) denotes the audio signal, y(n) refers to the output signal, and the value of a is roughly between 0.9 and 1.0.y(n) = x(n) − a × x (n − 1)
- Step 2: Framing. In this step, the speech signals that have N samples are divided into segments, where each segment is evaluated and described as a vector; the division of signals is made with a fixed N interval in a range between 20 and 40 ms. The framing is carried out with a 50% overlap of the frame size, and the overlapping is used for frames continuity [37]. The contiguous frames are separated by M, where M is less than N. The typical utilized values are N = 256 and M = 100.
- Step 3: Windowing. In windowing, each frame will be passed through a Hamming window; the main purpose of this phase is to provide an incrementation for both frame continuity and spectrum accuracy. In addition, the Hamming window can be denoted as w(n) where 0 ≤ n ≤ N − 1. Then, the output signal Y(n) after applying the Hamming windowing becomes,Y (n) = X (n) × W (n)where N refers to the number of samples in each frame and X(n) is the input signal.
- Step 4: Fast Fourier Transform (FFT). In this phase, all the frames obtained from the previous windowing phase are represented in the frequency domain by applying the Fast Fourier Transform (FFT). This process aims to achieve better representations of the speech signal characteristics. To perform FFT on a signal, the framed signal should be periodic and continuous. Nevertheless, FFT could still be applied on a discontinuous signal, but the result is undesirable. Consequently, Hamming windowing is applied to each frame to guarantee continuity between the first and the last frame. The FFT can be performed by using the following formula:where X(n) refers to the input signal, Y(n) refers to the output signal, h(n) is the vocal tract impulse response in the time domain, and X(w), H (w), and Y (w) are the FFT representations of X(n), h(n) and Y(n), respectively.Y(w) = FFT [h(n) × X(n)] = H(w) × X(w)
- Step 5: Mel Filter Bank. The obtained spectrum from the FFT will be exposed to a Mel Filter Bank, which contains a set of triangular bandpass filters. Moreover, the Mel frequency is computed using the following formula,
- Step 6: Discrete Cosine Transform (DCT). This phase represents the Mel spectrum in the time domain to obtain the MFCCs. The collection of coefficients is denoted as the acoustic vectors. Consequently, the input signals are represented as acoustic vector sequences. DCT can be expressed in the following formula,where n = 0, 1, … to N, and a number of triangular bandpass filters is referred to N, represents the obtained energy from the filter bank, and L is equal to that number of Mel-scale cepstral coefficients.
2.5. Long Short-Term Memory (LSTM)
Classification is a type of mapping where input vectors are mapped into one of a given number of classes. In this proposed work, neural networks have been employed. The neural networks represent the output classes by N output neurons or units, of which the one corresponding to the input vector’s class has an activation value of 1, whereas all other outputs have a 0 activation. This is commonly utilized in speech recognition in order to match speech frames to phoneme classes. Moreover, RNN is a class of neural networks, which is mainly utilized for the prediction of the future data sequence by means of the previous data samples. The RNN is frequently employed to model sequence data such as speech or text. Nevertheless, these networks have not been extensively utilized, due to difficulties with training them, such that they capture the long-term dependencies [8,38]. RNN output is obtained by calculating and iterating the following equations from time t = 1 to t = T [39],
where is the input, the output sequence is denoted by , and the hidden vector sequence is referred to as . Furthermore, W is the weight matrix, b refers to the bias vector, and the hidden layer function is denoted by [40]. The idea behind utilizing RNN instead of conventional neural networks is that traditional neural networks presume that all inputs and outputs are independent of one another. As a result, using conventional neural networks in speech recognition is not a good idea. Besides this, prediction of every term in a sentence necessitates information about the word which was already used.
An advanced variant of RNN is the long short-term memory (LSTM) model. LSTM stores data information for a sustained period, and it is easier to retrieve past data in the memory. Furthermore, considering the LSTM version used in our system, the standard formulation of a single LSTM cell unit can be given by the following equations [40],
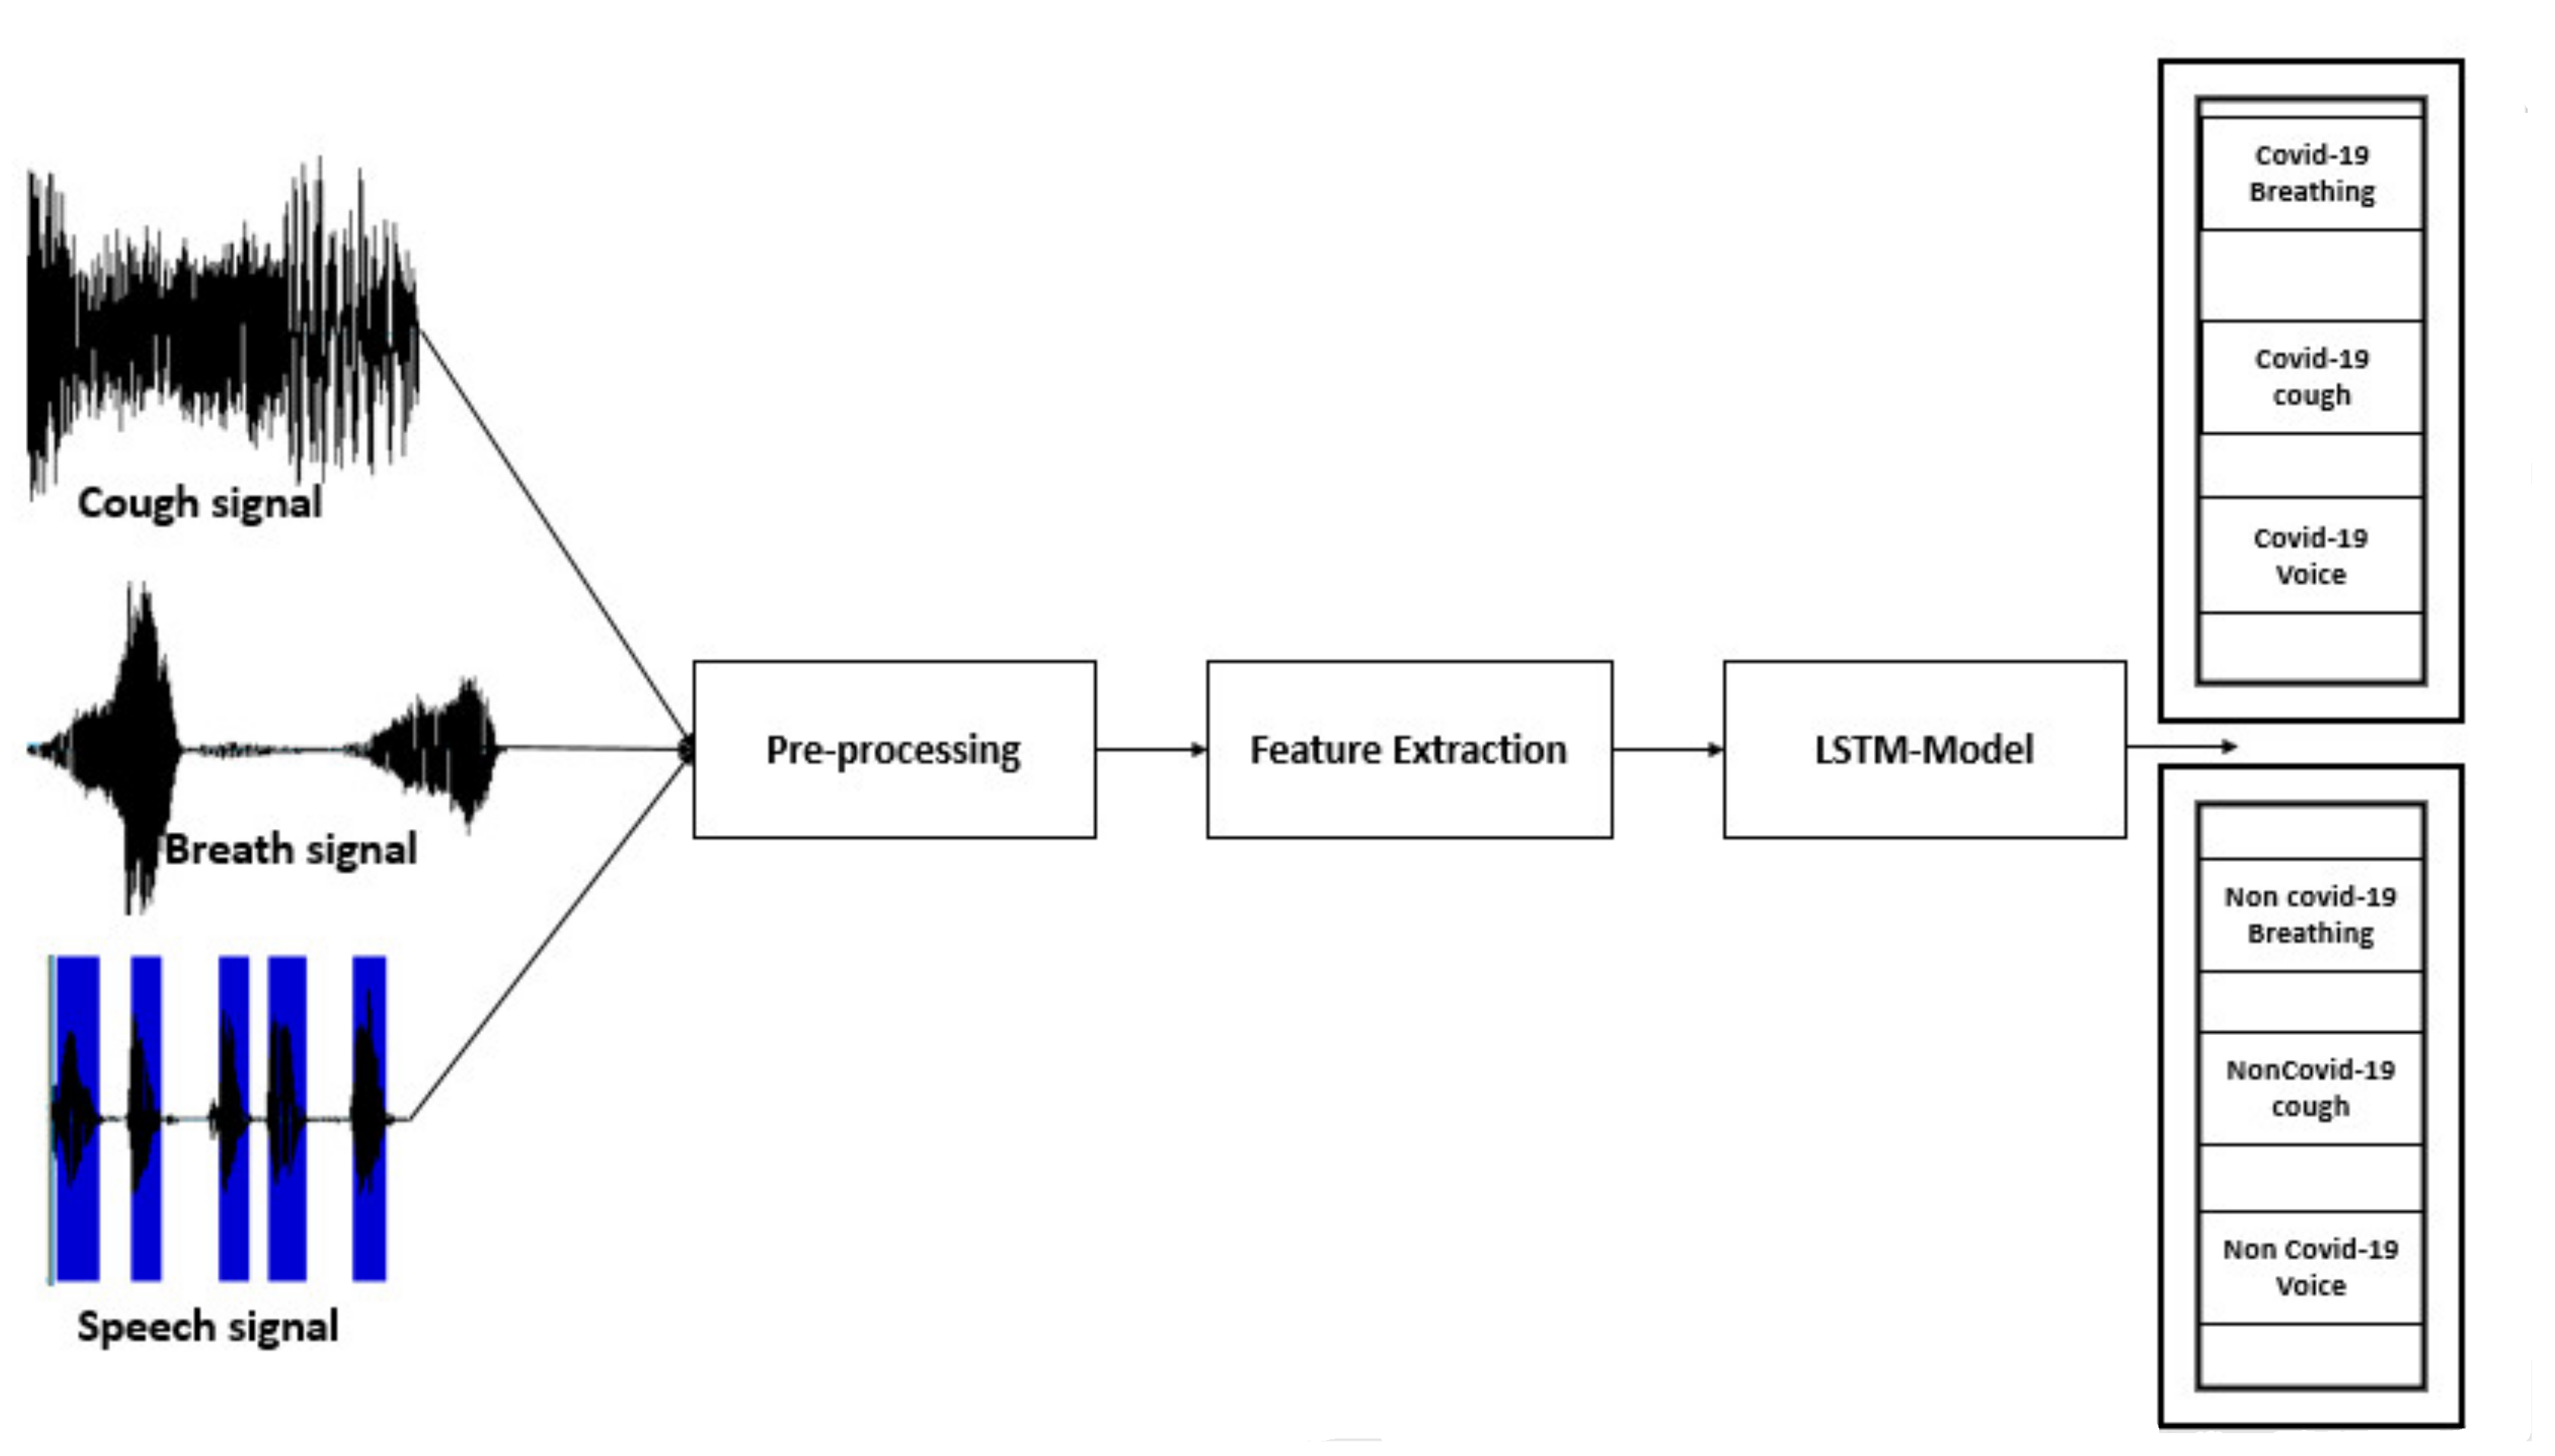
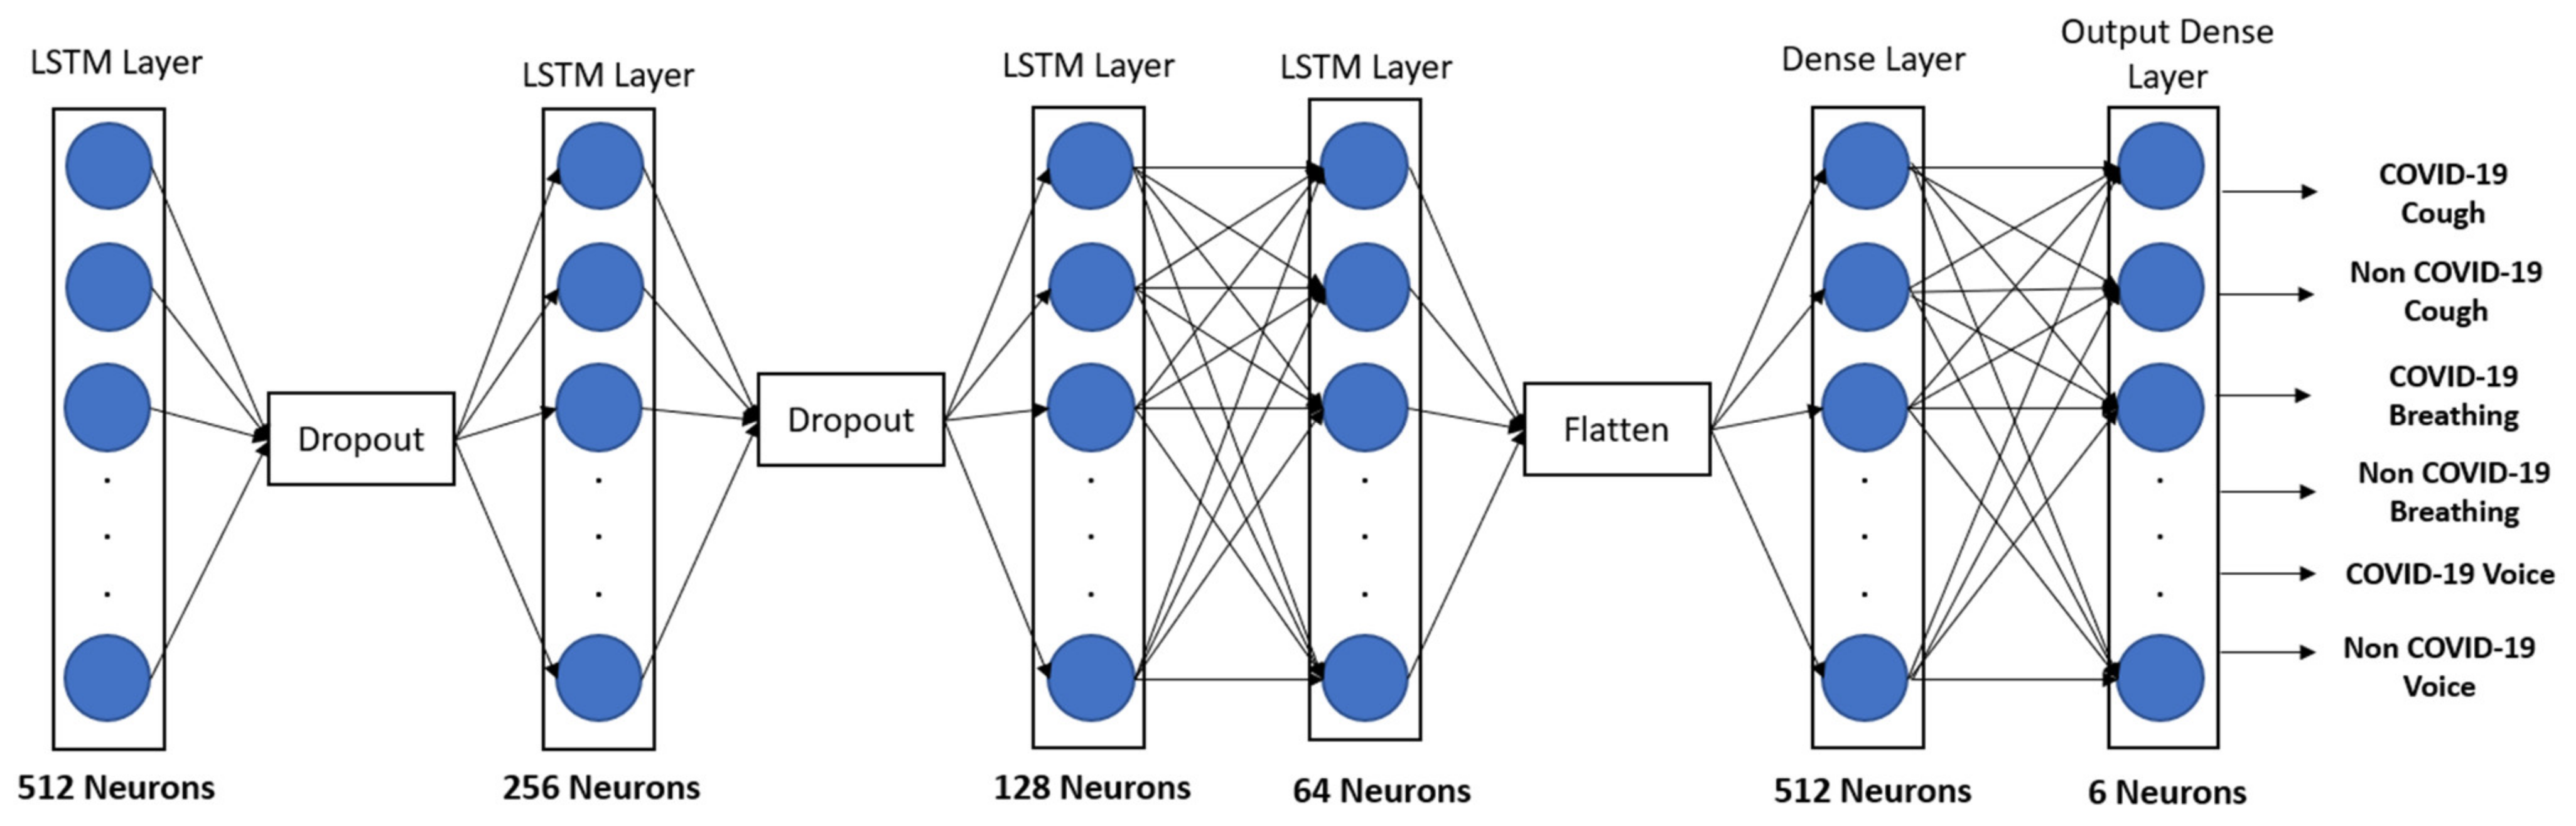
where, f, i, o, , C, σ is the forget gate, input gate, output gate, new memory cell content, memory cell content, and sigmoid function, respectively. The sigmoid function is used to form three gates in the memory cell, whilst the tanh function is utilized to enlarge the memory cell output [40]. In LSTM, each memory block contains a memory cell and three gate units, namely, input gate, output gate, and forget gate. The behavior of the memory block is controlled by these gates. The forget gate resets the cell variable, which leads the stored input to be forgotten; furthermore, the input is read from the feature vector and the output is written to , by the aid of input and output gates respectively. As a result, the network can store input over a longer period and thus exploit a self-learned amount of long-range temporal context [41]. An illustration of the proposed speech model is shown in Figure 2. The input consists of the patient’s cough, breathing, and voice, which is subjected to preprocessing to eliminate noise and distortions. Then, the MFCC features are extracted, and the output is passed through the LSTM model for classification. Figure 3 displays the structure of the LSTM. Finally, a multiclass classification model is established, which classifies the presence of COVID-19.
3. Image-Based Model Methodology
3.1. Image Dataset
The image dataset consists of 13,808 chest X-ray (CXR) images that are comprised of 10,192 X-ray images categorized as “healthy” that are collected from RSNA [42] and Kaggle [43]. Furthermore, the remainder of the images (3615), collected from padchest dataset are categorized as COVID-19-positive. [44], German medical school [45], SIRM [46], Github [47], Kaggle [48], and Twitter [49].
3.2. Image Preprocessing
Image preprocessing has been conducted for the elimination of the undesired distortions and to enhance the image features for further processing. In image preprocessing, resizing and scaling of the images was carried out to yield the same size of images as the models. The original size of the images was 299 × 299 pixels. For the experimental setup, the size of the images has been scaled to 150 × 150 pixels. Moreover, data augmentation for images is an approach heavily employed in deep learning to overcome the issue of small training datasets. Its main aim is to artificially inflate the training dataset with label-preserving transformations. In other words, data augmentation increases the diversity of the training dataset by applying several transformations and distortions to the original images, such as brightness modifications, zooming, scaling, rotating, and horizontal and vertical flipping. Typically, many kinds of transformations and distortions are applied in the training phase, none of which alters the semantics of the images [50,51].
3.3. Convolution Neural Network (CNN)
CNN is one of the most popular deep neural networks [47]. It has been utilized extensively in machine learning, where it has performed remarkably well, specifically in applications related to image recognition, such as natural language processing (NLP), and the most extensive image classification data set (ImageNet), in addition to computer vision. Additionally, CNN has achieved significant results in the pattern recognition field in both image and speech processing. CNN has a variety of well-known, recognized architectures such as VGG, LENET, and AlexNet [52]. CNNs are composed of three layers: convolutional layers, pooling layers, and fully connected layers. Whenever these layers are stacked, the CNN architecture is instantly formed. The fundamental mechanism of CNN can be divided into these main areas [53,54]:
- The input layer is responsible for holding the pixel value for the images.
- The convolutional layer is responsible for the determination and computation of the neurons output, which are connected to local regions of the input, by calculating the scalar product between their weights and the region which is connected to the input volume. Convolutional layers are able to reduce the model complexity by optimizing its output. They are optimized through the following hyperparameters: the depth, the zero-padding, and the stride.
- The non-linearity layer, which is the next layer after the convolutional layer. This layer can be utilized to adjust the generated output. The reason for using this layer is to saturate or limit the generated output. In this layer, the rectified linear unit (RELU) applies an activation function that converts all negative pixels to 0, which is similar to tanh and sigmoid for the same reasons.
- The pooling layers, which are responsible for performing the downsampling along with the given input’s spatial dimensionality, in addition to the reduction of the number of the parameters.
- The fully connected layers are responsible for computing the class scores.
3.4. CNN Hyperparameters
Defining the architectures of the model is a challenging step due to the vast number of design choices available. The model architecture can be manually configured by manual autotuning, or automatically by asking the machine to perform it. The configuration variables in the proposed architecture are called hyperparameters. Hyperparameters are classified into two tiers. The first is made up of hyperparameters that determine the network structure, such as [53,54]:
- Hidden layers: located between input and output layers.
- Padding: added layers composed of 0s to ensure the flow of the kernel over the image edge.
- Depth: used for visual recognition and refers to the third dimension of the image.
- Stride: represents the rate at which the kernel passes over the input image.
- Kernel type: the actual filter values such as sharpening, edge detection, etc.
- Kernel size: the size of the actual filter.
- Number of epochs: representing the number of iterations of the whole training dataset to the network during the training phase.
- Batch size: representing the number of patterns that are visible to the network before the weights are updated.
- Learning rate: regulating the update of the weight at the end of each patch.
Models can have numerous parameters; obtaining a suitable combination of hyperparameters is challenging and choosing the wrong hyperparameters could affect the system’s performance.
3.5. CNN Models
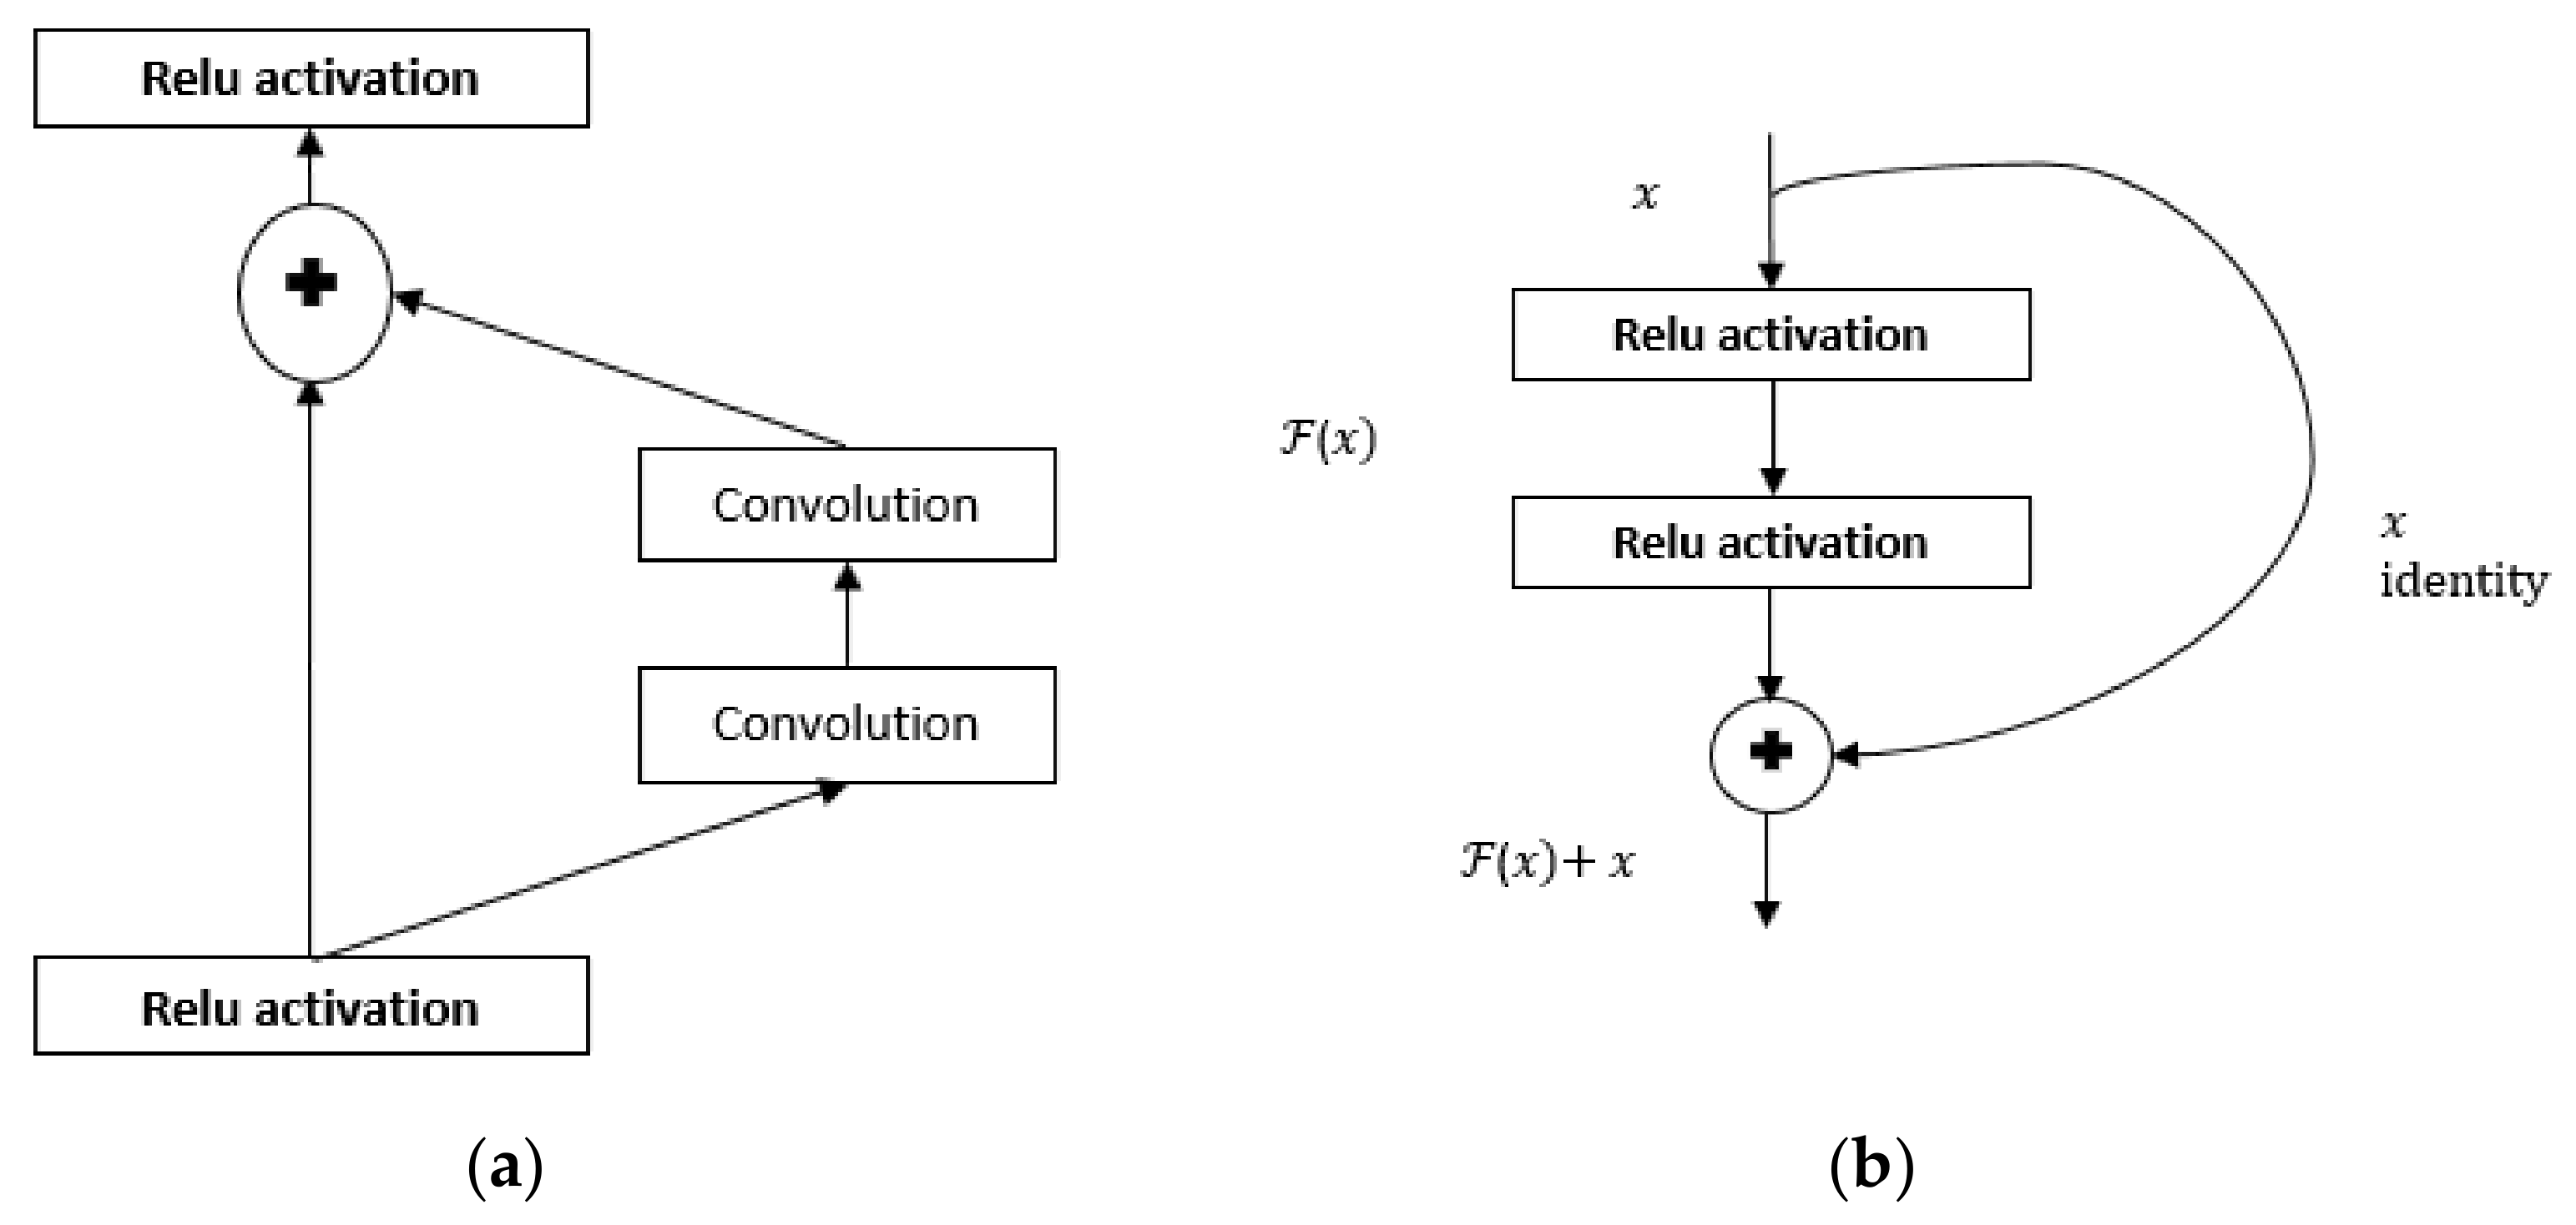
In this work, seven different CNN models were utilized; namely, VGG16, VGG19, DenseNet201, ResNet50, InceptionV3, Xception, and InceptionResNetV2. VGGnet is considered one of the most notable and popular CNN architectures. The unique model of the VGGnet is comprised of parameters varying from 138 to 144 million, including an approximation of 16 to 19 convolutional layers, with 3 × 3 convolutional filters, 5 max-pooling layers, 3 fully connected layers, and a classifier layer as an output layer [55]. Moreover, ResNet is a typical feed-forward network that has a residual connection. The residual layer output can be well-defined based on the (l − 1) th outputs, which come from the previous layer, which are referred to it as xl − 1. (xl − 1) refers to the output after a variety of operations are performed (e.g., convolution with different sizes of filters, batch normalization (BN) followed by an activation function such as a ReLU on xl − 1. The final output of the residual unit is xl, which can be defined with the following equation [55]:
xl = (xl − 1) + xl − 1
The residual network are comprised of several basic residual blocks. Nonetheless, the operations in the residual block vary based on the different architectures of residual networks. The fundamental block diagram of the ResNet architecture [55] is illustrated in Figure 4a. The ResNet50 is a short form of residual network that has 50 layers. The ResNet reduces the dilemma of vanishing gradient by allowing this alternate shortcut path for the gradient to flow through. The identity mapping used in ResNet allows the model to bypass a CNN weight layer if the current layer is not necessary. This helps us to avoid the overfitting problem in training. The architecture of Resnet50 is shown in Figure 4b [56].
Xception is a convolutional neural network architecture that stands for “extreme inception”. The Xception architecture is a linear stack of depth-wise separable convolution layers with residual connections. It has 36 convolutional layers, which form the feature extraction base of the network [57]. A densely connected network (DenseNet) is comprised of densely connected layers, where the outputs of the layers are connected to all the successors in what is called the dense block [58]. Consequently, it is structured according to the dense connectivity between layers from which it takes its name. DenseNet also has an approximation of this, referred to as an efficient feature reuse approach, which aims for the network parameters reduction. Densnet201 has 201 layers loaded with weights from the image dataset. Moreover, Inceptionv3 is utilized to enhance the computing resources by the incremental of the network’s depth and width [59]. The model consists of 48 layers. The proposed model is repeated with max-pooling to reduce the dimensionality. The InceptionResNetV2 is a combination of inception structures with a residual connection that includes 164 layers. The model has multiple-sized convolutional filters that are trained on numerous images to prevent any related degradation problem [55].
3.6. K-Fold Cross-Validation
Cross-validation is a widely employed technique for estimating the true prediction errors of models and tuning the model parameters [60] to prevent generalization errors. This remarkable technique is frequently used to handle the overfitting dilemma that many systems regularly face due to irregularity (small size) in the dataset [61,62]. In order to initiate the K-fold cross-validation procedure, the training data must be partitioned into K portions; each part has an n/k sample, where n defines the training sample number. Consequently, k − 1 parts are used in the training phase, while the remaining parts are utilized in the validation phase [63]. This important approach has been implemented in our proposed system as a part of the grid-search algorithm. The holdout method, which is the process of splitting the data into different splits and using one split for training the model and other splits for validating and testing the models, was also used in this study; specifically, a three-split hold out. Furthermore, the K-fold cross-validation is applied for three different CNN models; the paper will discuss the results in more detail below.
3.7. Grid Search
In a machine-learning model, hyperparameters are set before training. These hyperparameters have to be optimized in order to adapt a model to a dataset. Nevertheless, it is implausible that the optimal hyperparameter settings on one dataset are optimal on another, which makes the feasibility of hyperparameter optimization unattainable. Grid search is considered to be a traditional hyperparameter optimization, which ensures that the search over a given subset of the hyperparameters space of the training algorithm. The range of the possible parameters is manually set. Afterward, the algorithm initiates the complete search over these parameters. All possible hyperparameter combinations are brute-forced, then the models are evaluated using the cross-validation technique [64].
3.8. Fine-Tuning
Fine-tuning has been immensely utilized in deep learning for the performance increment of the system, which is intended to fine-tune the weights of the top layers of the model, in addition to the Classifier training. The training process obliges the weights to be tuned from generic feature maps to features explicitly associated with the dataset, and aims to adapt these specialized features to work with the new dataset instead of overwriting the generic learning.
4. Experiments and Results
4.1. Evaluation Criteria
To evaluate the deep learning models, a large number of performance metrics, including precision, F1-score, recall, and accuracy, have been established. In addition, a confusion matrix is utilized for the LSTM performance based on the four classes: true positive, false positive, true negative, and false negative; the performance metric is obtained upon the calculation of these four classification classes. The four confusion matrix classes can be defined as follows:
- TP (true positive)
- FP (false positive)
- TN (true negative)
- FN (false negative)
Additionally, in this proposed system, accuracy measures the degree to which the model correctly predicts the presence of COVID-19 and how the result conforms to the desired value. The following equation describes how accuracy is calculated [48,65]:
Precision represents the proportion of correctly predicted (positive) predictions to all (positive) predictions. The precision is obtained as given in the following formula [48,65]:
4.2. Speech-Based Model Experimental Results
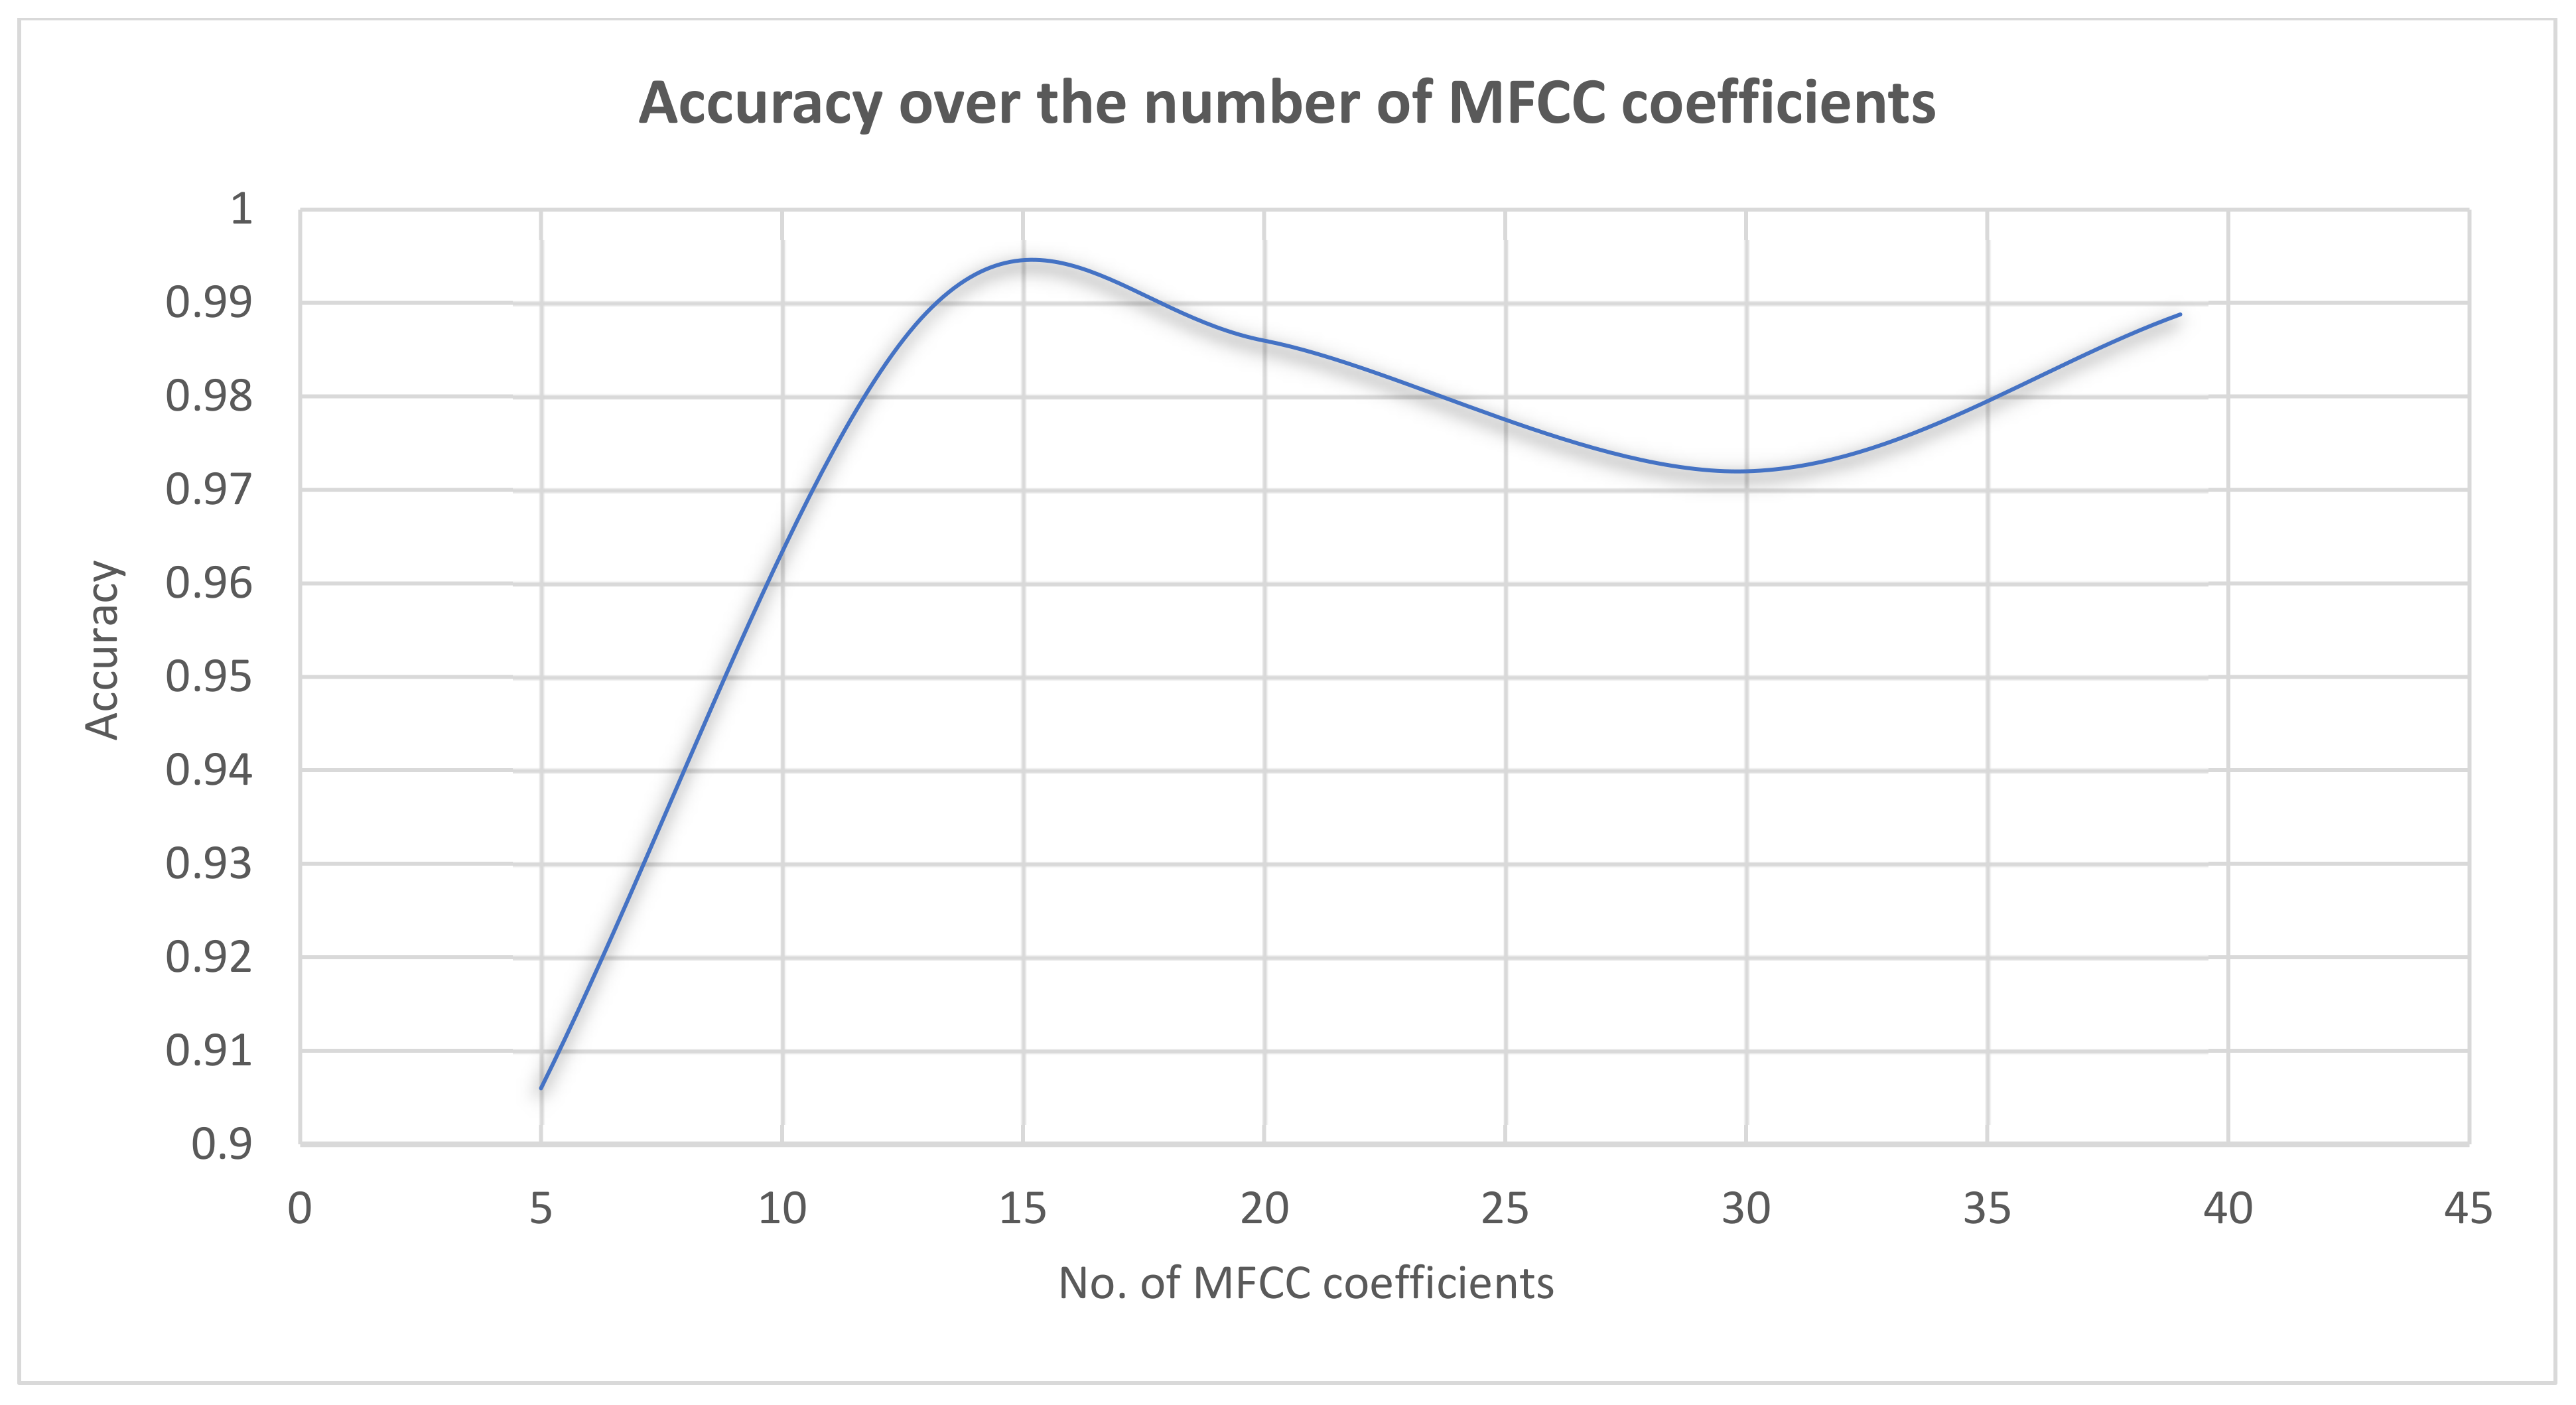
As previously mentioned, two principal, but very different, approaches have been introduced for COVID-19 classification: the speech-based model and the medical imaging-based model. In the proposed speech model, the unique architecture of the RNN, the long short-term memory (LSTM), has been utilized. The split of the dataset has been done as follows: 70% of the speech dataset has been used for training, 20% for the testing, and 10% for the validation. The training tests are represented in a vector that is passed through the LSTM network. Then, the measurements are compared with the desired classes. In addition, the weights during the preparation process are modified. Afterward, the test signals are sent to the network, their aim values are calculated depending on the trained weights. Both training and testing code has been made on Python, and TensorFlow has been utilized as the deep-learning library. Additionally, speech data augmentation has been used to inflate the data to enhance the accuracy of the system. Furthermore, the hyperparameters optimization has been done using manual tuning to obtain the most suitable hyperparameter, as illustrated in Table 1. The system has attained the highest accuracy, precision, recall, and F1-score of 98.9%, when the parameters’ values of epochs, batch size, dropout rate, and learning rate are set to 100, 32, 0.1, and 0.001, respectively. Also, it has been observed that manipulating the number of MFCCs affects the system’s accuracy due to the large number of speech features that MFCCs possess. Figure 5 provides an illustration of the effect of MFCC numbers on the system’s accuracy. It can be observed that 13 or 39 MFCCs are considered to be the optimum choice for the extracted utilized features in the network.
4.3. Image-Based Model Experimental Results
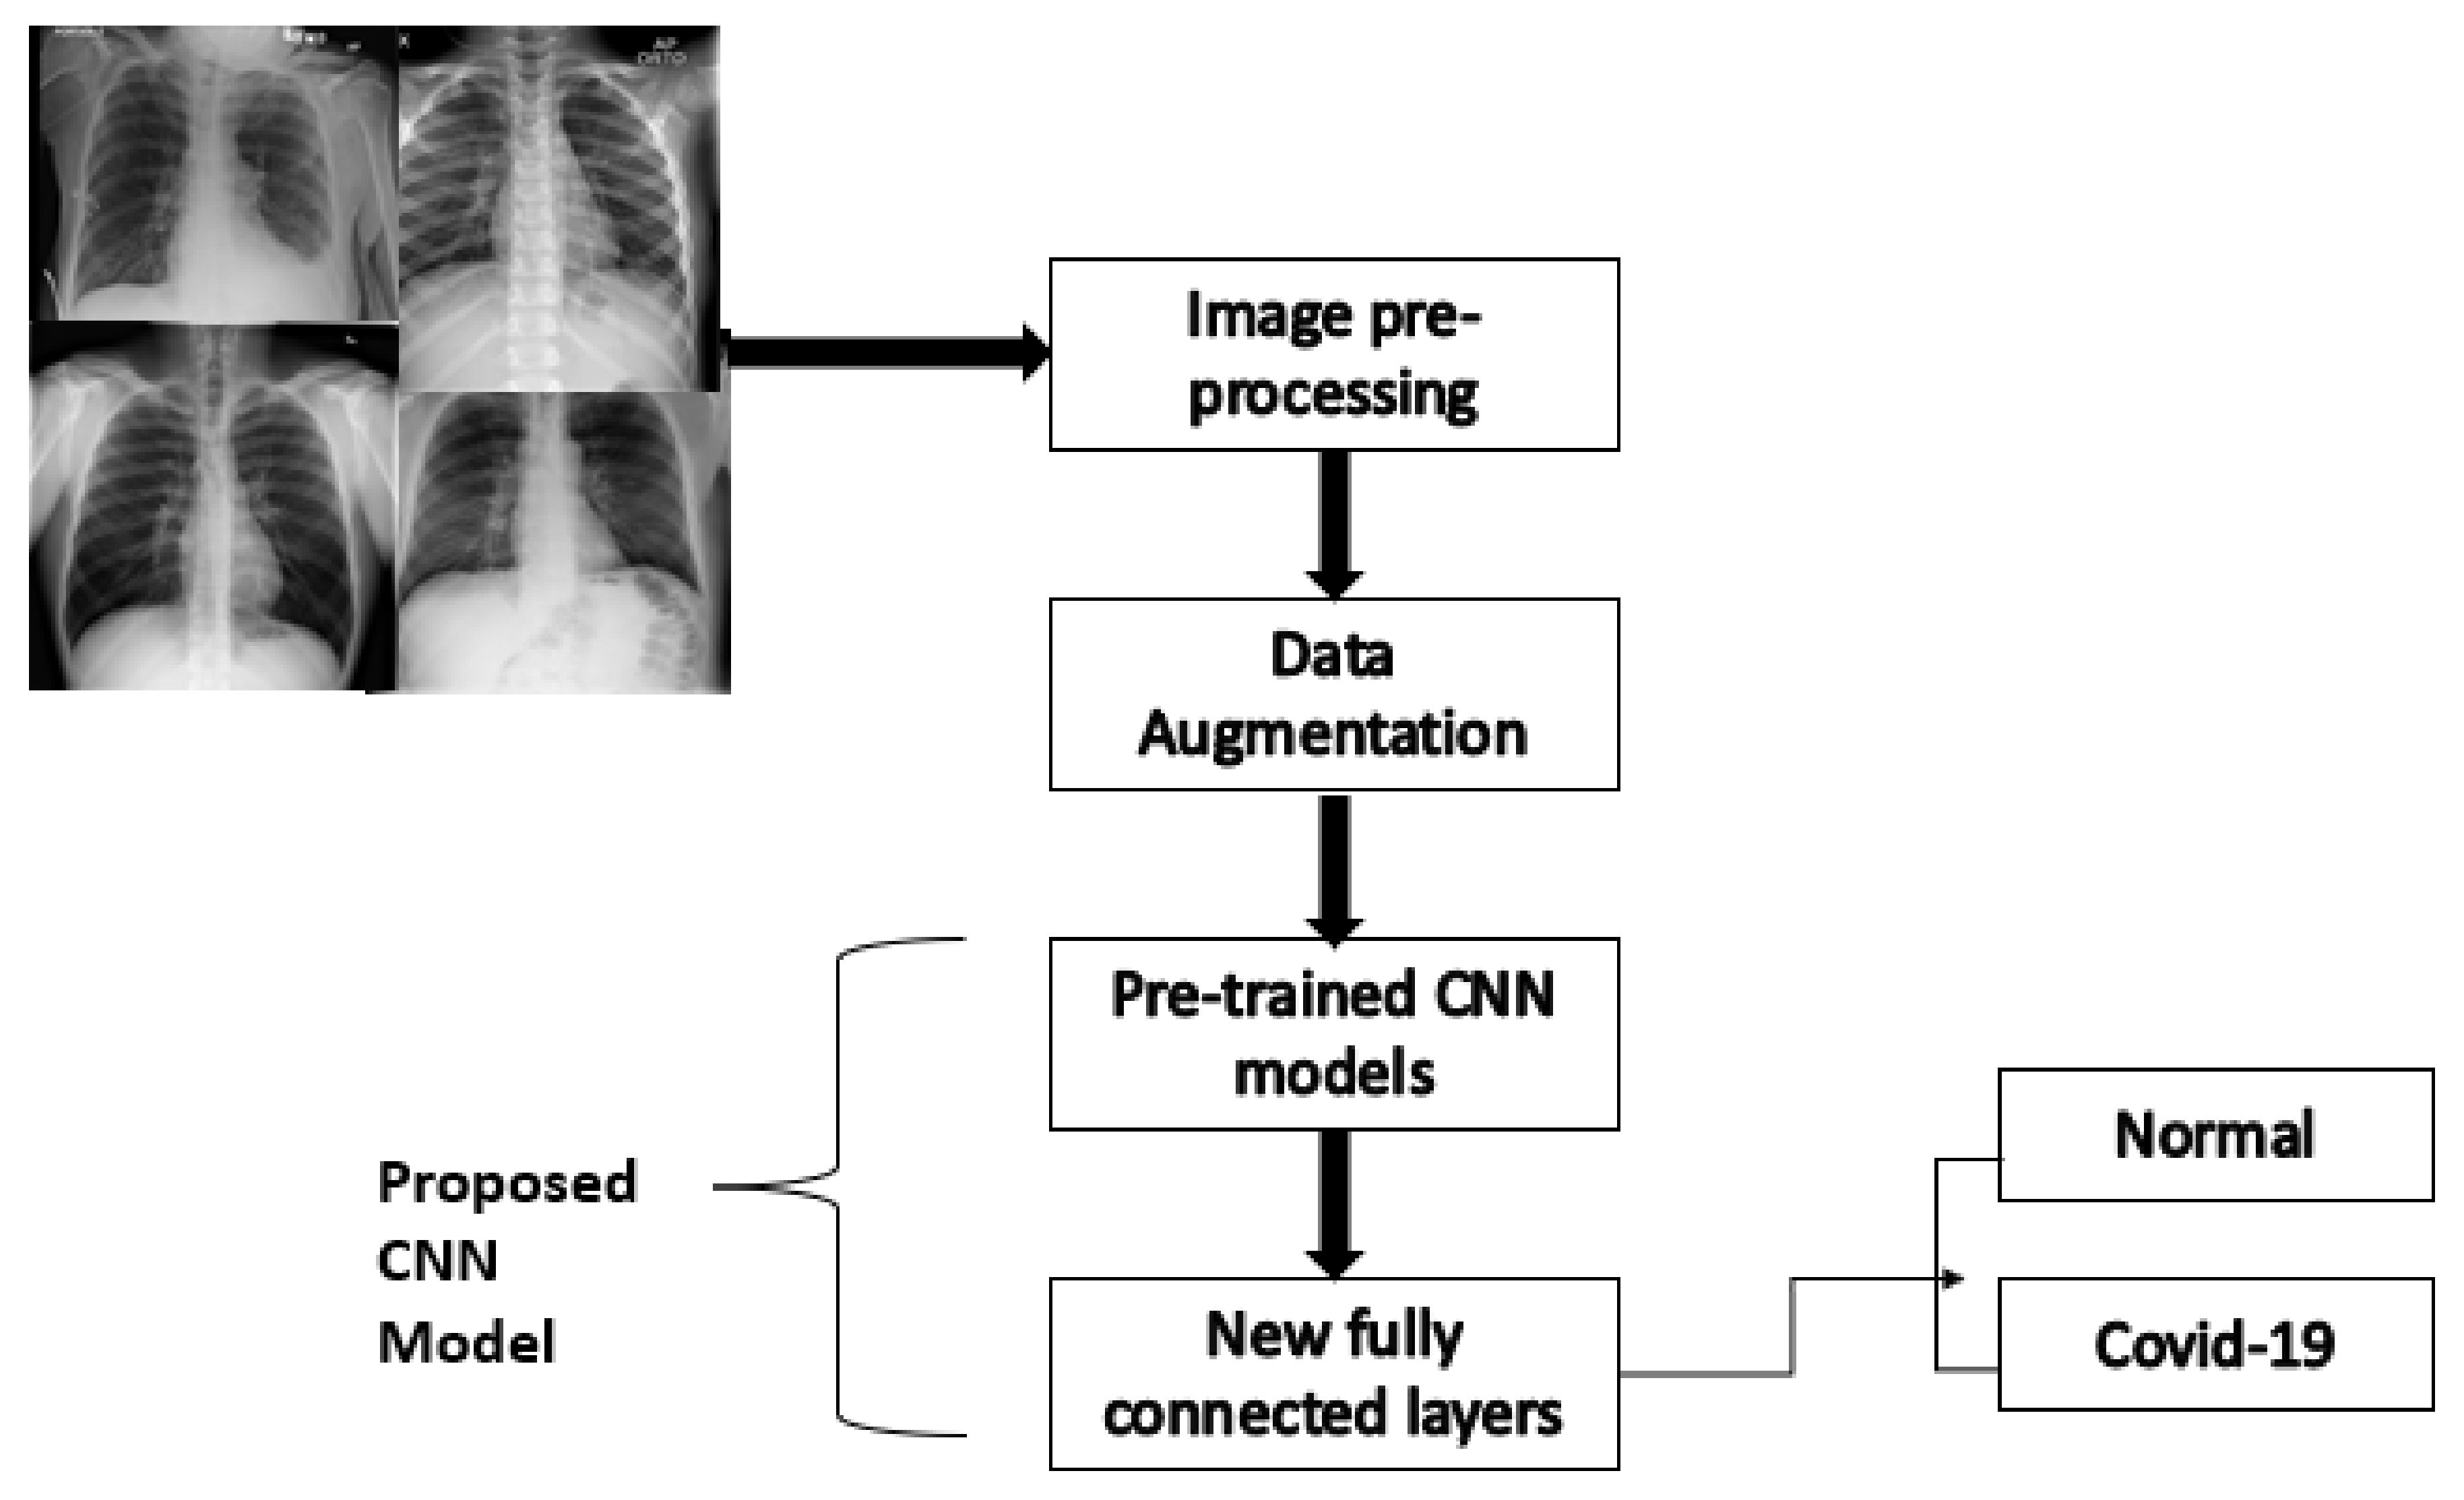
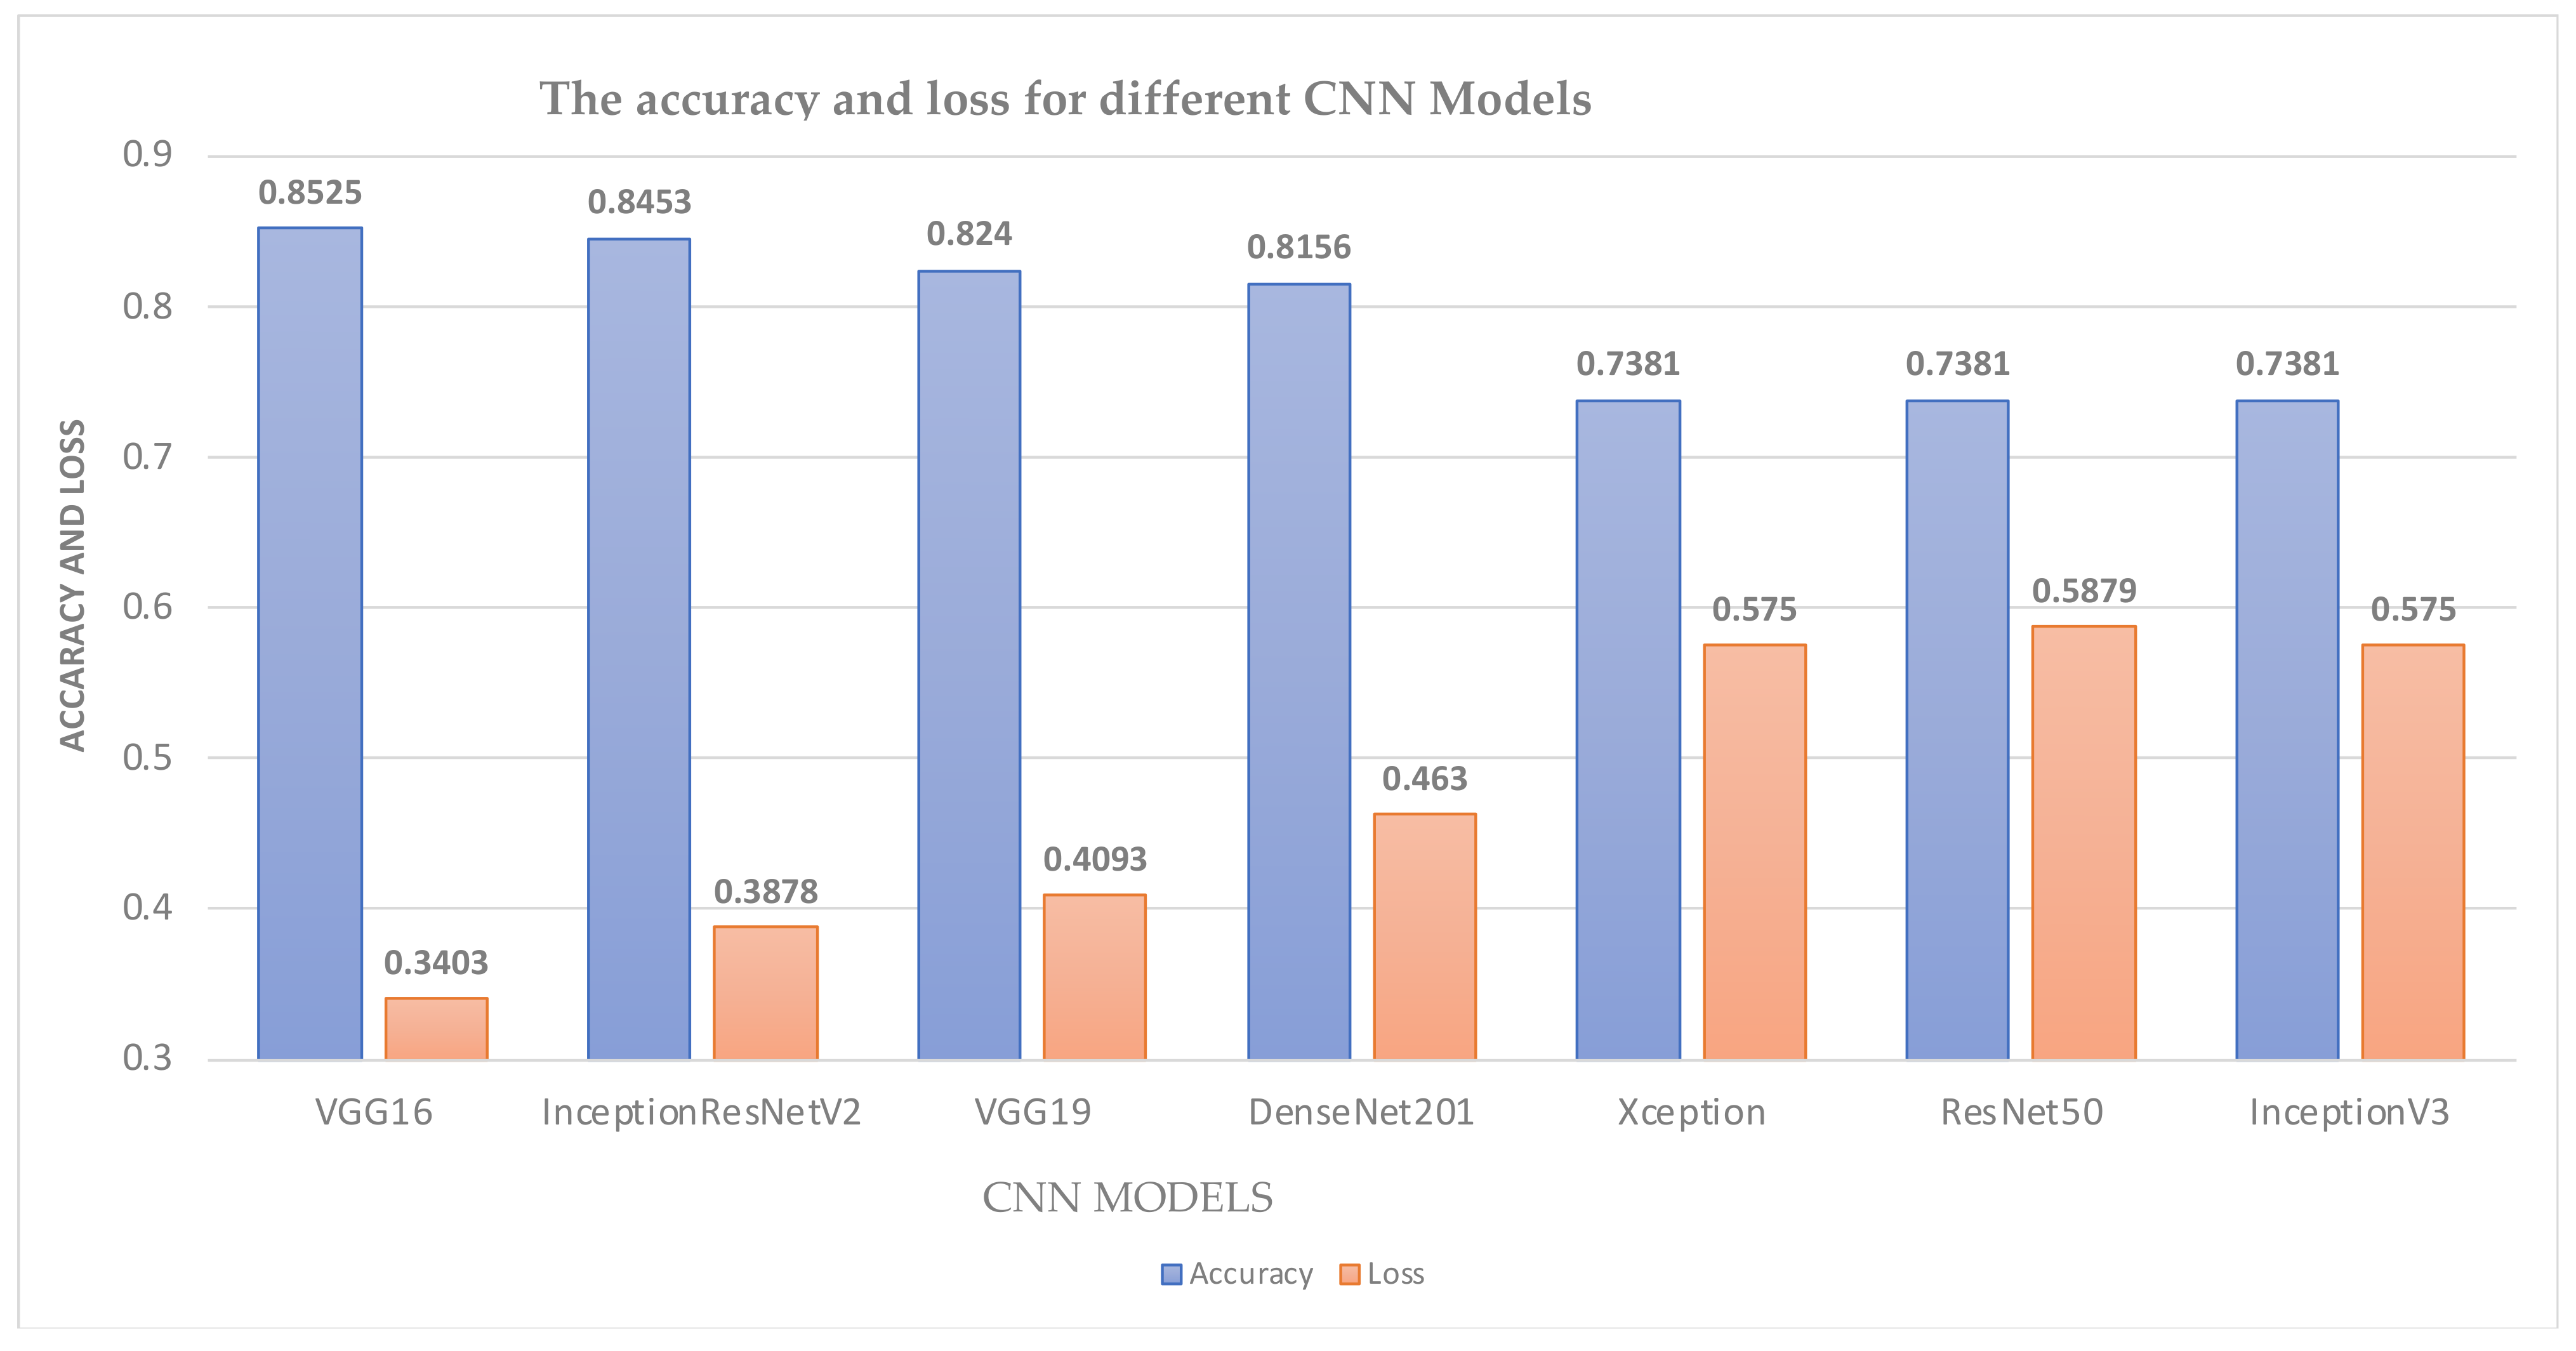
In the proposed CNN model, the grid search optimization technique was used to obtain the optimum hyperparameters of batch size, dropout, epochs, and learning rate, which are 32, 0.1, 20, and 0.01, respectively. Furthermore, data augmentation has been utilized to enhance the accuracy of the system by inflating the dataset. In addition, the K-fold cross-validation technique has been employed to overcome generalization problems. Figure 6 shows the methodology that was followed in implementing the COVID-19 detection system based on X-ray images. For this system, a binary classification has been done to detect the presence of COVID-19. For the image-based model, two tests were conducted to assess the performance of the system. In the first test, seven different CNN models were utilized; namely, VGG16, VGG19, ResNet50, DenseNet201, InceptionV2, Xception, and InceptionResNetV2. The models were employed as feature extractors in the system without any fine-tuning. As shown in Figure 7, the VGG16 model outperformed all other models, obtaining the highest accuracy, 85.25%.
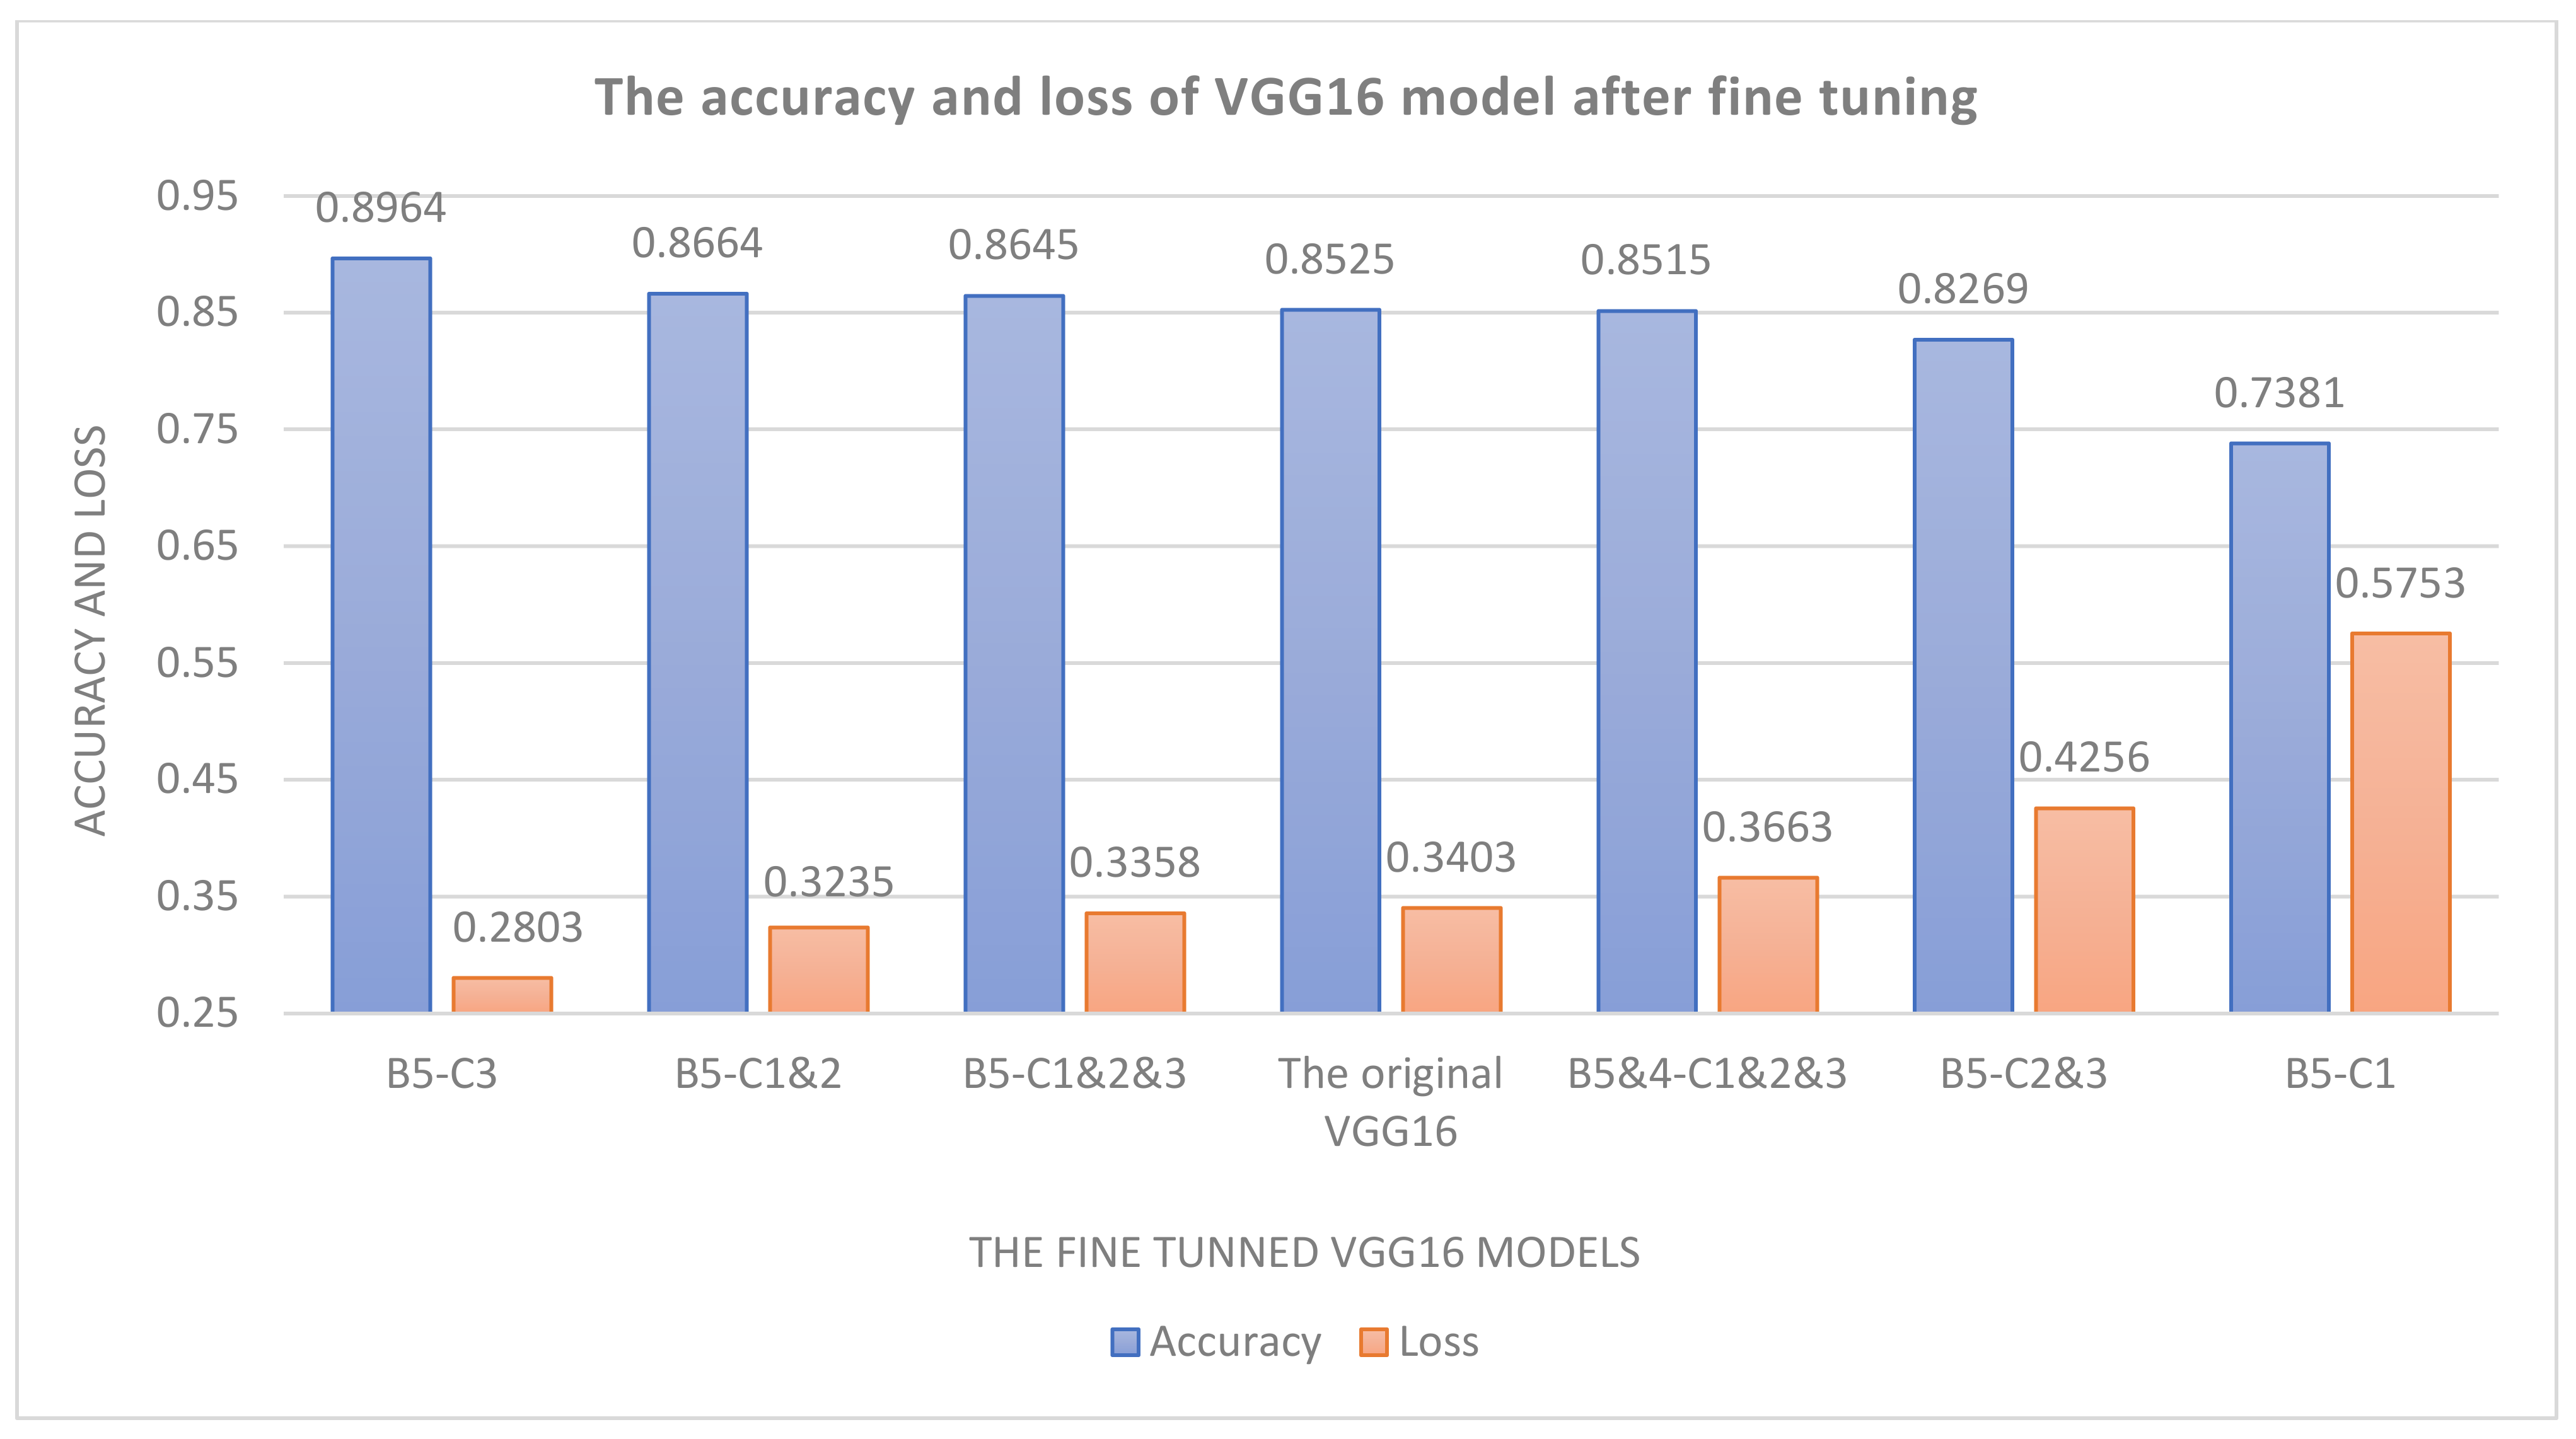
Furthermore, to improve the system’s accuracy, the VGG16 model was fine-tuned in the second test. Thus, it has achieved the highest performance. The results of the second test are illustrated in Figure 8. In this figure, the letter B refers to the word block, and the convolution layer is denoted by the letter C. For instance, B5-C1&C2 indicates that we have unfrozen the first and second convolution layers of the fifth block of the VGG16 model. As a result of the fine-tuning, the system has obtained an accuracy of 89.64%; also, losses in the system have been decreased.
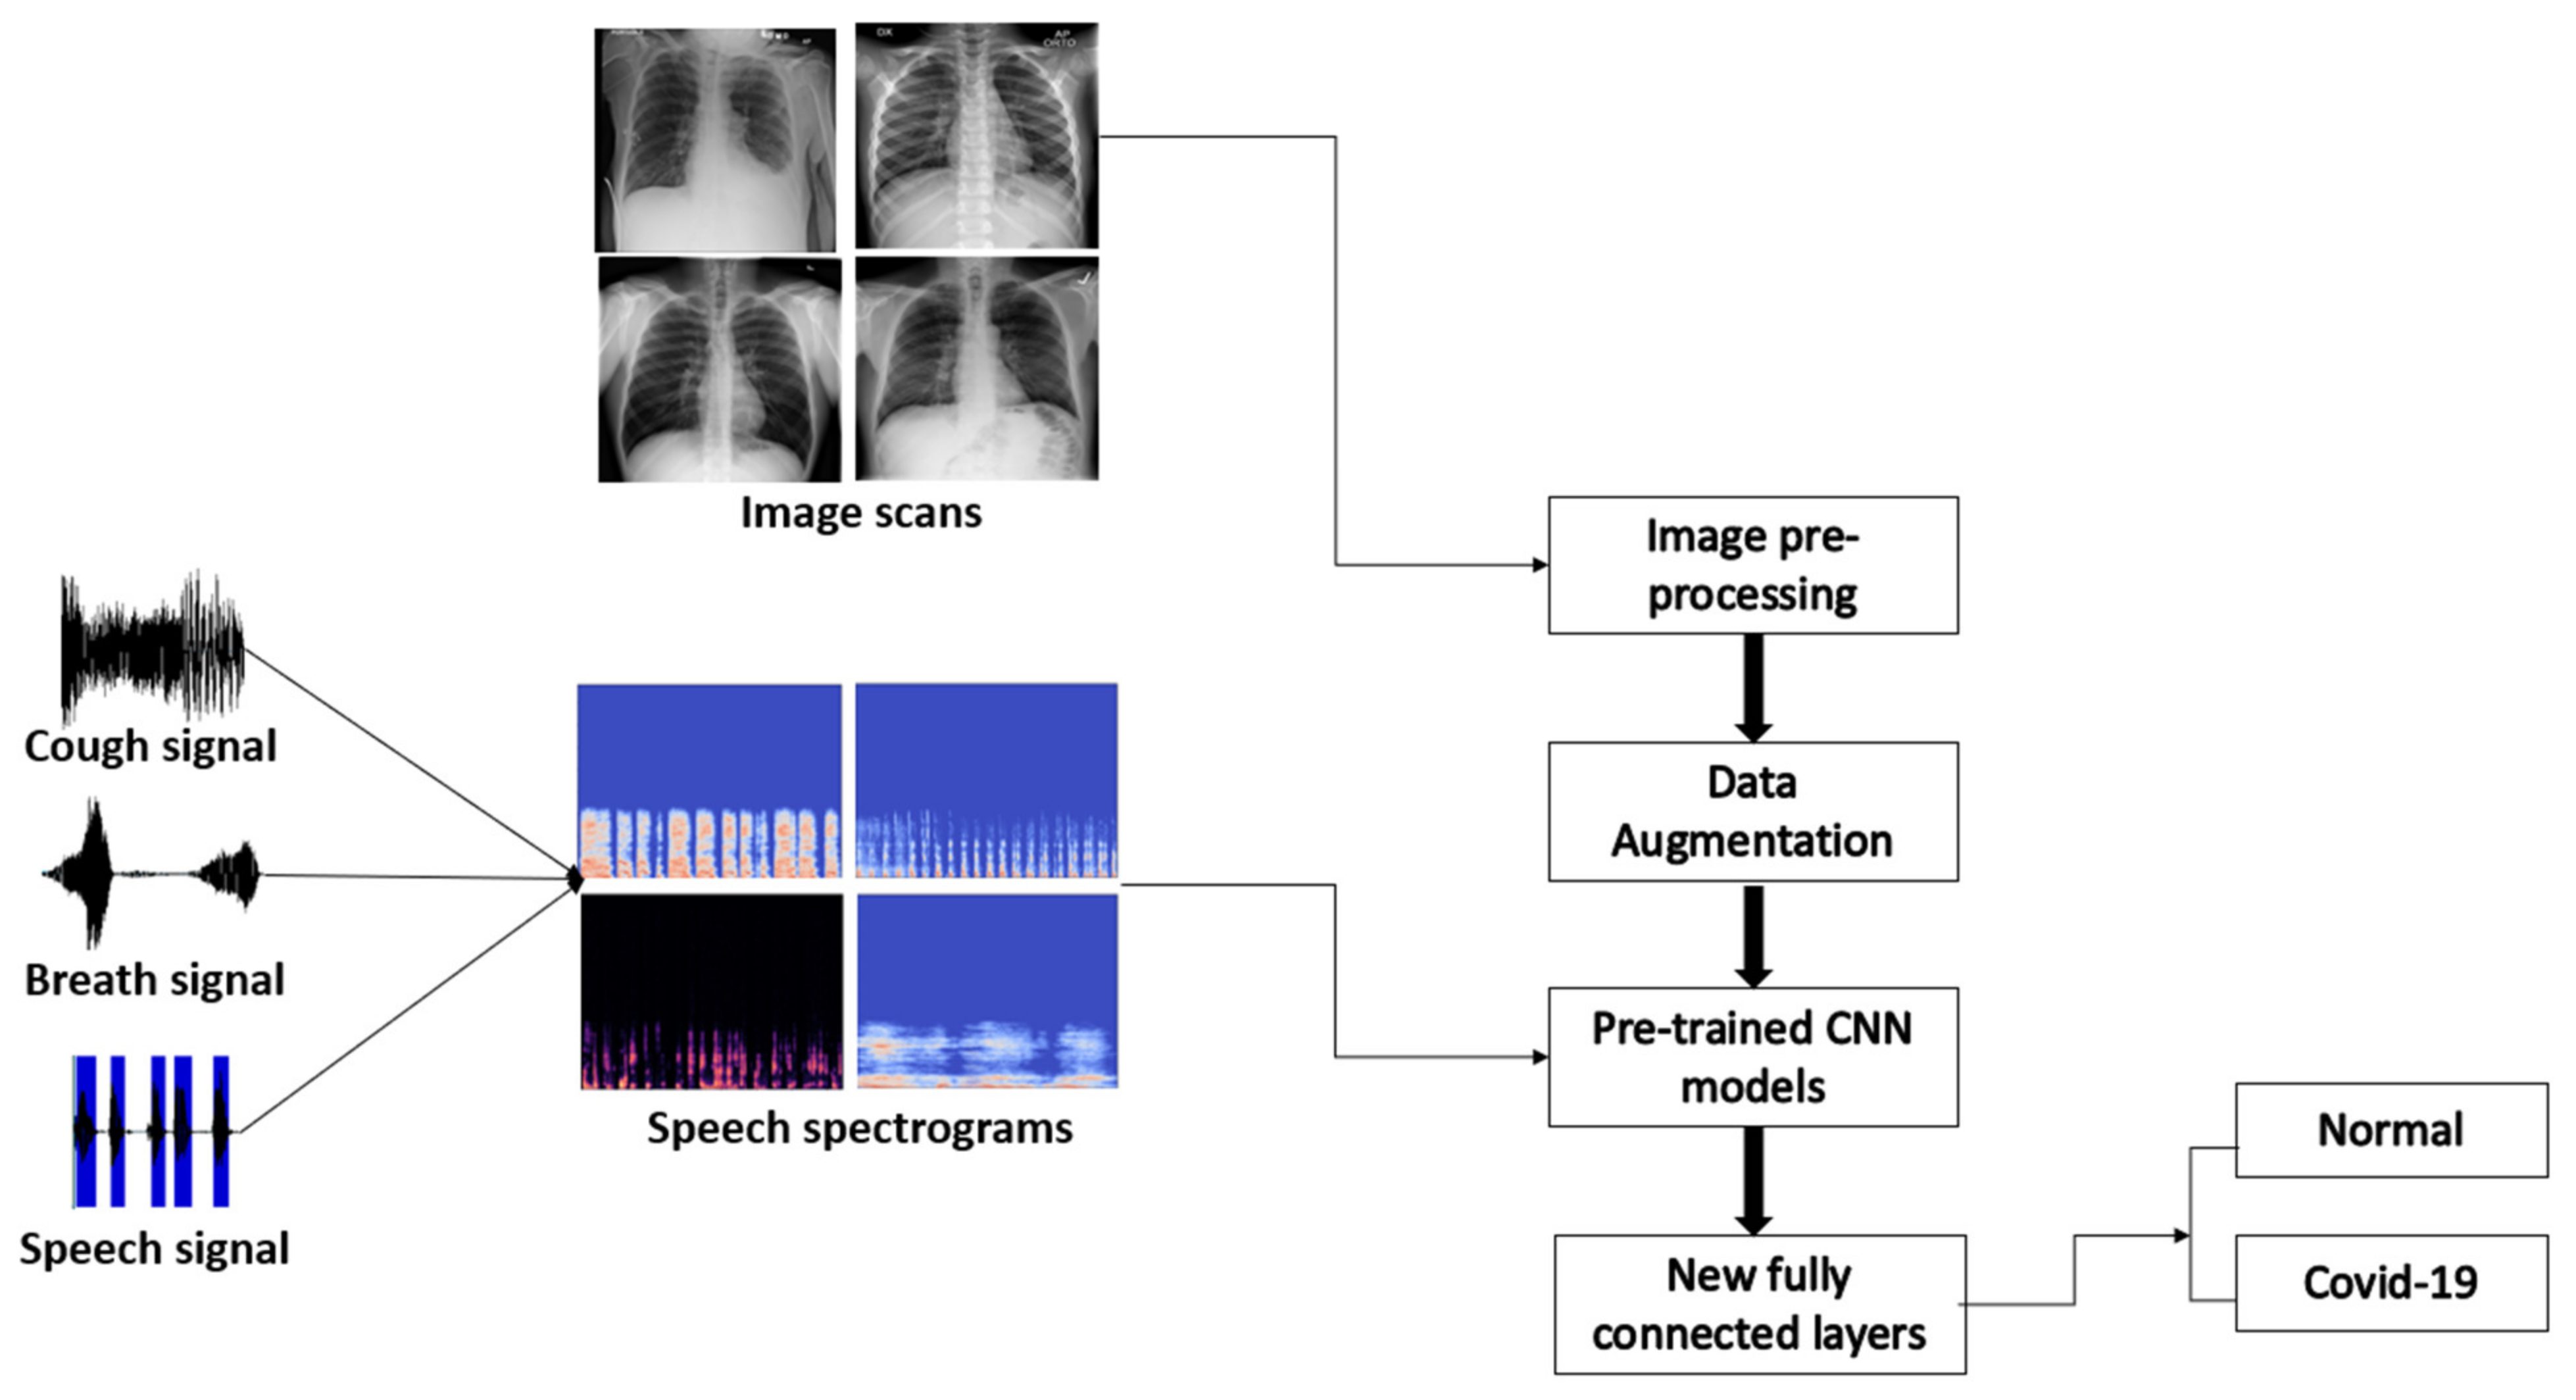
4.4. Speech-Image-Based Model Experimental Results
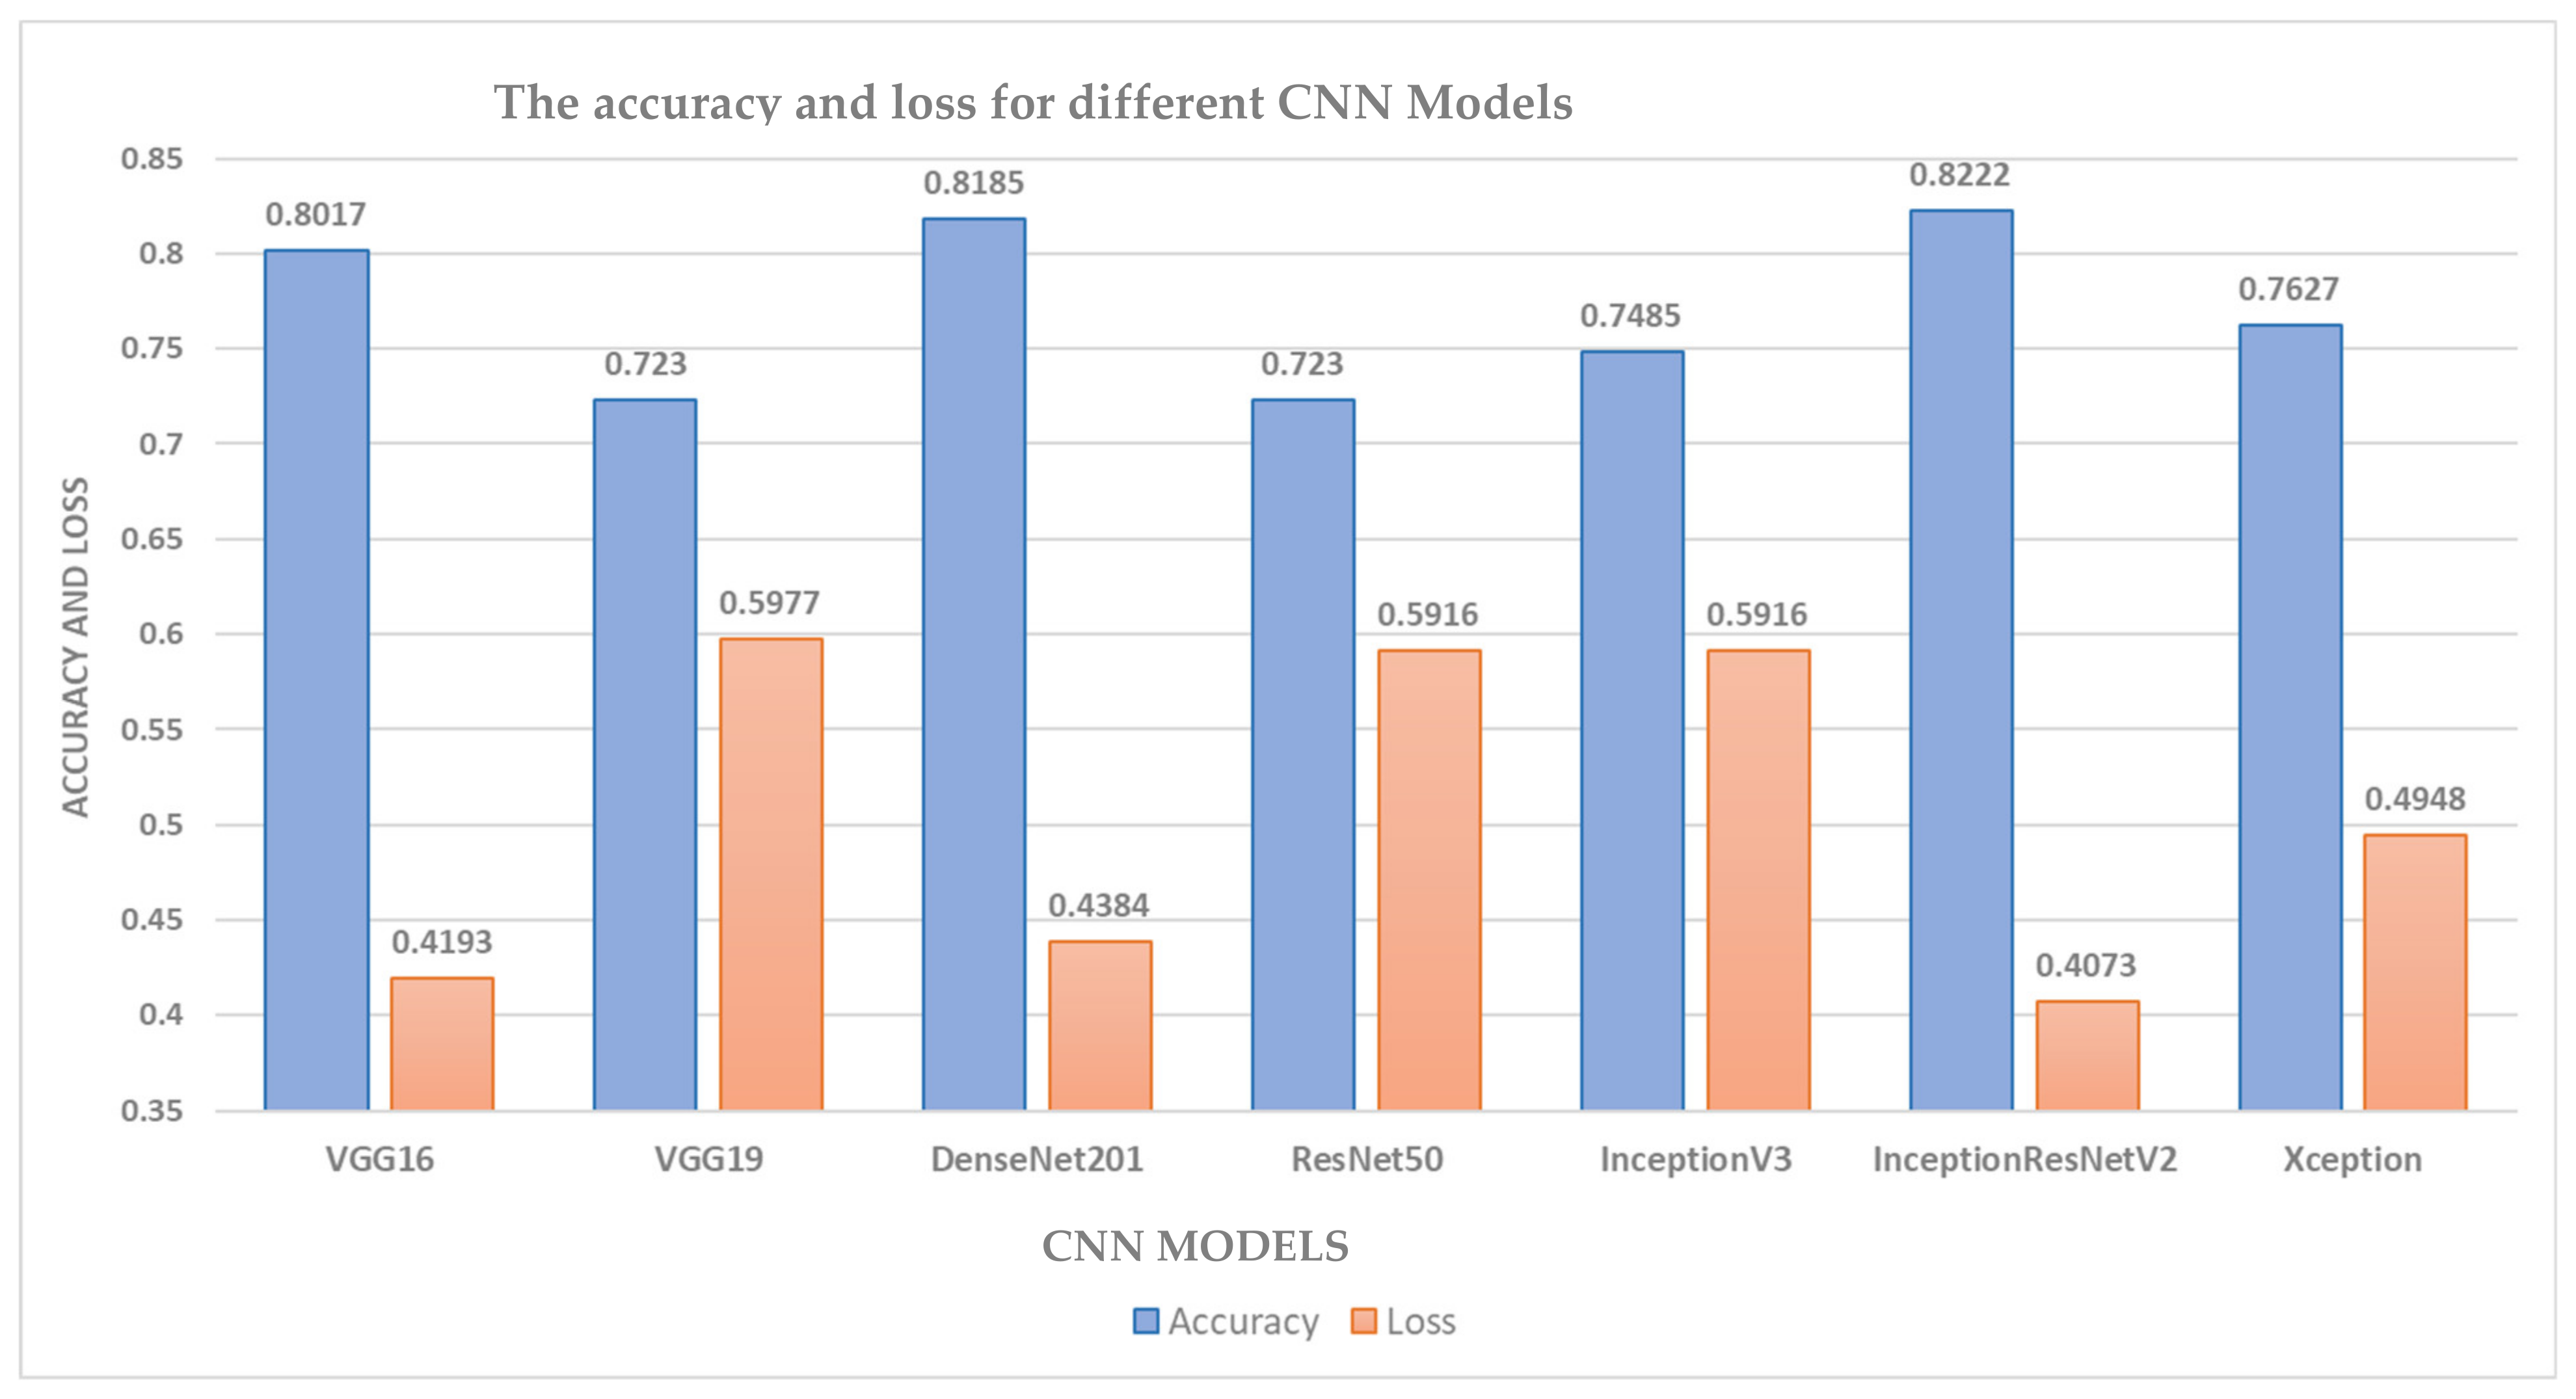
In this model, a combination of speech spectrograms and chest X-ray images was utilized to produce a robust speech–image-based model, which can leverage both speech and image inputs. Figure 9 illustrates the methodology that was employed to implement the COVID-19 recognition system. For this system, a binary classification has been conducted to detect the presence of the COVID-19 infection from the binary input consisting of both spectrograms and chest X-ray scans. The model has been evaluated by the CNN models, namely, VGG16, VGG19, ResNet50, DenseNet201, InceptionV2, Xception, and InceptionResNetV2. The models have been employed as feature extractors in the system without any fine-tuning. The grid search has also been utilized in this model. As a result, the same image-based model’s hyperparameters were obtained and used in this test. Moreover, as shown in Figure 10, the InceptionResNetV2 network outperforms all the models, obtaining the highest accuracy, at 82.22%. The accuracy of the speech-based model alone was much lower than the accuracy of the image-based model alone, as well as the hybrid speech-image model. This is due to the variations in the inputs, since the speech samples in this combined model have been utilized and inputted as spectrograms, which gives an accuracy of 98.9%, and the image-based model alone yields an accuracy of 89.64%. However, the system in this experiment achieves a relatively reasonable accuracy despite the utilization of two kinds of inputs.
4.5. Statistical Significance Analysis
Another evaluation of the proposed models has been carried out by the utilization of the statistical significance analysis, which is commonly performed to ensure that the models are statistically different by utilizing the P-value value test technique. The P-value signifies the probability under which the statistical result occurs, which should be less than the significance level for the results to be deemed statistically significant. In our proposed research, we conducted experiments using 95% confidence interval (CI). The evaluation of the proposed models has been carried out using the Wilcoxon test, which is a non-parametric statistical test that compares two paired groups. The results of the Wilcoxon test are presented in Table 2.
The results demonstrate that the LSTM is statistically different from VGG16, as well as InceptionResnetV2, based on the 95% confidence level.
4.6. Comparison of the Proposed Designs with Previous Techniques
To assess the effectiveness of our proposed designs, we have compared their performance with previous approaches, as presented in Table 3. It can be observed that conjugating the MFCC with LSTM has had a remarkable impact on enhancing the classification system. Our speech-based system has achieved an accuracy, F1-score, recall, and precision of 98.9%, 98.9%, 98.9%, 98.9%, respectively, outperforming the nearest second-highest speech COVID-19 detection system, which has achieved an accuracy of 98.2%. Moreover, the image-based system has achieved an accuracy of 89.64%. The majority of speech-based models have utilized the LSTM in addition to the MFCCs, while the majority of image-based approaches have used novel CNN architectures, alongside different CNN models, including DensNet, AlexNet, VGGNet, and ResNet. The combined speech-image-based model has achieved an accuracy of 82.22%, which is relatively low, due to the presence of the spectrograms, when compared to either speech-based or image-based models alone.
The apparent superiority of our speech-based system is due to the remarkable properties exhibited by the LSTM, which is the predictor of possible future scenarios. This superiority is also due to the capability of MFCCs to reduce errors. These accumulations of special features have led to achieving high rates of accuracy compared to other proposed approaches.
5. Concluding Remarks
The COVID-19 outbreak had a significant effect on the well-being of people globally, with a steep increase in casualties. Deep- and machine-learning techniques have provided significant help since the beginning of the global epidemic. In this paper, multiple COVID-19 classification approaches have been proposed. The first approach is a speech-based system to detect the presence of COVID-19 from the patient’s cough, breath, and voice. The second method is a medical image-based system that can detect the presence of COVID-19 from patients’ chest X-ray images. The final approach is a combined speech–image-based model that detects the presence of COVID-19 from both audio spectrograms and chest X-ray images. The system’s fundamental mechanism is to detect, diagnose, and classify any presence of COVID-19 infection. In addition, the hyperparameters tuning has been done manually for the speech-based model using grid searches for both image-based and speech–image-based models. Furthermore, it has been observed that the manipulation of the MFCCs enhances the model’s accuracy. The proposed speech model has conjugated the MFCC alongside the LSTM model, exhibiting remarkable proficiency in detecting COVID-19, as evidenced by its accuracy, precision, F1-score, and recall accuracy rates of 98.9% each, outperforming a variety of previous systems and approaches. Moreover, the chest X-rays dataset has been characterized by an imbalance towards normal labels. Due to that, it has a negative impact on the system’s accuracy.
Additionally, the grid search technique has been used to determine the optimum CNN model hyperparameters. Therefore, the CNN VGG16 model has attained an accuracy of 85.25%. When fine-tuning techniques have been applied to VGG16, the accuracy of the system has been enhanced to 89.64%, outperforming all of the other proposed models. Finally, it can be observed that the implementation of the speech-based model alone or the image-based model alone provides better accuracy than the combination of both models. Consequently, it is unnecessary to combine the two models into a new model for diagnostic purposes.
In this work, the overall performance of the proposed systems is nonideal due to the small size of both speech and image datasets. This is due to the strict restrictions, which have limited the process of acquiring a sufficient amount of audio files. Thus, data augmentation techniques have been used to inflate the dataset and enhance the model’s performance.
The proposed systems can be improved using many approaches. For instance, a hybrid cascaded CNN–LSTM classifier can be implemented to enhance the speech-based system’s functionality. Moreover, the speech-image-based model can be improved by overcoming the dilemma of imbalanced classes, which has negatively affected the model’s performance.
Furthermore, a dataset expansion option could be feasible in the near future, which would significantly enhance the accuracy of the system. Also, imbalanced remedies can be utilized to overcome the dilemma of imbalanced classes. Finally, the proposed image-based model can be utilized for drug and vaccination development by analyzing the changes that occur in the respiratory system after the utilization of the current vaccines.
Author Contributions
A.B.N.: Conceptualization, Methodology, Formal Analysis, Investigation, Writing—Original Draft, Writing—Review & Editing, Supervision. I.S.: Conceptualization, Methodology, Writing—Review & Editing, Project administration. M.B.: Conceptualization, Methodology, Software, Writing—Original Draft. A.H.: Conceptualization, Methodology, Writing—Original Draft. N.W.: Writing—Review & Editing. All authors have read and agreed to the published version of the manuscript.
Funding
This project was funding through the competitive research project entitled “Emirati-Accented Speaker and Emotion Recognition” Based on Deep Neural Network, No. 19020403139.
Institutional Review Board Statement
A consent form was prepared by the authors and signed by the Electrical Engineering Department at University of Sharjah before conducting this study.
Informed Consent Statement
All patients voluntarily agreed to participate in this research. The collected dataset is kept confidential.
Data Availability Statement
Speech dataset is described in Section 2.2 and image dataset is described in Section 3.1.
Acknowledgments
The authors would like to thank the University of Sharjah in the United Arab Emirates for funding this work.
Conflicts of Interest
The authors declare no conflict of interest.
References
- Available online: https://covid19.who.int/ (accessed on 31 August 2021).
- Alsabek, M.B.; Shahin, I.; Hassan, A. Studying the Similarity of COVID-19 Sounds based on Correlation Analysis of MFCC. In Proceedings of the 2020 International Conference on Communications, Computing, Cybersecurity, and Informatics, Sharjah, United Arab Emirates, 3–5 November 2020. [Google Scholar] [CrossRef]
- Aggarwal, S.; Gupta, S.; Alhudhaif, A.; Koundal, D.; Gupta, R.; Polat, K. Automated COVID-19 detection in chest X-ray images using fine-tuned deep learning architectures. Expert Syst. 2021, e12749. [Google Scholar] [CrossRef]
- Chan, J.F.-W.; Yuan, S.; Kok, K.-H.; To, K.K.-W.; Chu, H.; Yang, J.; Xing, F.; Liu, J.; Yip, C.C.-Y.; Poon, R.W.-S.; et al. A familial cluster of pneumonia associated with the 2019 novel coronavirus indicating person-to-person transmission: A study of a family cluster. Lancet 2020, 395, 514–523. [Google Scholar] [CrossRef] [Green Version]
- Armstrong, S. Covid-19: Tests on students are highly inaccurate, early findings show. BMJ 2020, 371, m4941. [Google Scholar] [CrossRef]
- Roy, S. Physicians’ Dilemma of False-Positive RT-PCR for COVID-19: A Case Report. SN Compr. Clin. Med. 2021, 3, 255–258. [Google Scholar] [CrossRef]
- Hijazi, H.; Abu Talib, M.; Hasasneh, A.; Nassif, A.B.; Ahmed, N.; Nasir, Q. Wearable Devices, Smartphones, and Interpretable Artificial Intelligence in Combating COVID-19. Sensors 2021, 21, 8424. [Google Scholar] [CrossRef]
- Hassan, A.; Shahin, I.; Alsabek, M.B. COVID-19 Detection System using Recurrent Neural Networks. In Proceedings of the 2020 International Conference on Communications, Computing, Cybersecurity, and Informatics, Sharjah, United Arab Emirates, 3–5 November 2020. [Google Scholar] [CrossRef]
- Rajkarnikar, L.; Shrestha, S.; Shrestha, S. AI Applications to Combat COVID-19 Pandemic. Int. J. Adv. Eng. 2021, 4, 337–339. [Google Scholar]
- Alafif, T.; Tehame, A.; Bajaba, S.; Barnawi, A.; Zia, S. Machine and Deep Learning towards COVID-19 Diagnosis and Treatment: Survey, Challenges, and Future Directions. Int. J. Environ. Res. Public Health 2021, 18, 1117. [Google Scholar] [CrossRef]
- Saxena, A. Grey forecasting models based on internal optimization for Novel Corona virus (COVID-19). Appl. Soft Comput. 2021, 111, 107735. [Google Scholar] [CrossRef]
- Zhang, J.; Jiang, Z. A new grey quadratic polynomial model and its application in the COVID-19 in China. Sci. Rep. 2021, 11, 12588. [Google Scholar] [CrossRef]
- Pahar, M.; Klopper, M.; Warren, R.; Niesler, T. COVID-19 cough classification using machine learning and global smartphone recordings. Comput. Biol. Med. 2021, 135, 104572. [Google Scholar] [CrossRef]
- Deshpande, G.; Schuller, W. The DiCOVA 2021 Challenge–An Encoder-Decoder Approach for COVID-19 Recognition from Coughing Audio. In Proceedings of the Proceedings of Interspeech 2021, Brno, Czechia, 30 August–3 September 2021; pp. 931–935. [Google Scholar]
- Das, R.K.; Madhavi, M.; Li, H. Diagnosis of COVID-19 Using Auditory Acoustic Cues. Interspeech 2021, 2021, 921–925. [Google Scholar]
- Laguarta, J.; Hueto, F.; Subirana, B. COVID-19 Artificial Intelligence Diagnosis Using Only Cough Recordings. IEEE Open J. Eng. Med. Biol. 2020, 1, 275–281. [Google Scholar] [CrossRef]
- Chaudhari, G.; Jiang, X.; Fakhry, A.; Han, A.; Xiao, J.; Shen, S.; Khanzada, A. Virufy: Global applicability of crowdsourced and clinical datasets for AI detection of COVID-19 from cough audio samples. arXiv 2020, arXiv:2011.13320. [Google Scholar]
- Maghdid, H.S.; Asaad, A.T.; Ghafoor, K.Z.; Sadiq, A.S.; Mirjalili, S.; Khan, M.K. Diagnosing COVID-19 pneumonia from x-ray and CT images using deep learning and transfer learning algorithms. Int. Soc. Opt. Photonics 2021, 11734, 117340E. [Google Scholar] [CrossRef]
- Gunraj, H.; Wang, L.; Wong, A. COVIDNet-CT: A Tailored Deep Convolutional Neural Network Design for Detection of COVID-19 Cases From Chest CT Images. Front. Med. 2020, 7, 608525. [Google Scholar] [CrossRef]
- Zhao, J.; Zhang, Y.; He, X.; Xie, P. COVID-CT-Dataset: A CT Scan Dataset about COVID-19. arXiv 2020, arXiv:2003.13865. [Google Scholar]
- Ardakani, A.A.; Kanafi, A.R.; Acharya, U.R.; Khadem, N.; Mohammadi, A. Application of deep learning technique to manage COVID-19 in routine clinical practice using CT images: Results of 10 convolutional neural networks. Comput. Biol. Med. 2020, 121, 103795. [Google Scholar] [CrossRef]
- Jaiswal, A.; Gianchandani, N.; Singh, D.; Kumar, V.; Kaur, M. Classification of the COVID-19 infected patients using DenseNet201 based deep transfer learning. J. Biomol. Struct. Dyn. 2021, 39, 5682–5689. [Google Scholar] [CrossRef]
- Wang, S.; Kang, B.; Ma, J.; Zeng, X.; Xiao, M.; Guo, J.; Cai, M.; Yang, J.; Li, Y.; Meng, X.; et al. A deep learning algorithm using CT images to screen for Corona Virus Disease (COVID-19). medRxiv 2020, 31, 6096–6104. [Google Scholar] [CrossRef]
- Narin, A.; Kaya, C.; Pamuk, Z. Automatic detection of coronavirus disease (COVID-19) using X-ray images and deep convolutional neural networks. Pattern Anal. Appl. 2021, 24, 1207–1220. [Google Scholar] [CrossRef]
- Sharma, N.; Krishnan, P.; Kumar, R.; Ramoji, S.; Chetupalli, S.R.; Ghosh, P.K.; Ganapathy, S. Coswara–A Database of Breathing, Cough, and Voice Sounds for COVID-19 Diagnosis. arXiv 2020, arXiv:2005.10548. [Google Scholar]
- Akçay, M.B.; Oğuz, K. Speech emotion recognition: Emotional models, databases, features, preprocessing methods, supporting modalities, and classifiers. Speech Commun. 2020, 116, 56–76. [Google Scholar] [CrossRef]
- Keerio, A.; Mitra, B.K.; Birch, P.; Young, R.; Chatwin, C. On preprocessing of speech signals. World Acad. Sci. Eng. Technol. 2009, 35, 818–824. [Google Scholar] [CrossRef]
- Ibrahim, Y.A.; Odiketa, J.C.; Ibiyemi, T.S. Preprocessing technique in automatic speech recognition for human computer interaction: An overview. Ann. Comput. Sci. Ser. 2017, 15, 186–191. [Google Scholar]
- Available online: https://ai.googleblog.com/2019/04/?hl=es_CL (accessed on 14 July 2021).
- Kurzekar, P.K.; Deshmukh, R.R.; Waghmare, V.B.; Shrishrimal, P. A Comparative Study of Feature Extraction Techniques for Speech Recognition System. Int. J. Innov. Res. Sci. Eng. Technol. 2014, 3, 18006–18016. [Google Scholar] [CrossRef]
- Shahin, I.; Hindawi, N.; Nassif, A.B.; Alhudhaif, A.; Polat, K. Novel dual-channel long short-term memory compressed capsule networks for emotion recognition. Expert Syst. Appl. 2021, 188, 116080. [Google Scholar] [CrossRef]
- Nassif, A.B.; Shahin, I.; Hamsa, S.; Nemmour, N.; Hirose, K. CASA-based speaker identification using cascaded GMM-CNN classifier in noisy and emotional talking conditions. Appl. Soft Comput. 2021, 103, 107141. [Google Scholar] [CrossRef]
- Nassif, A.B.; Shahin, I.; Elnagar, A.; Velayudhan, D.; Alhudhaif, A.; Polat, K. Emotional speaker identification using a novel capsule nets model. Expert Syst. Appl. 2022, 193, 116469. [Google Scholar] [CrossRef]
- Muda, L.; Begam, M.; Elamvazuthi, I. Voice Recognition Algorithms using Mel Frequency Cepstral Coefficient (MFCC) and Dynamic Time Warping (DTW) Techniques. arXiv 2010, arXiv:1003.4083. [Google Scholar]
- Molau, S.; Pitz, M.; Schlüter, R.; Ney, H. Computing mel-frequency cepstral coefficients on the power spectrum. In Proceedings of the International Conference on Acoustics, Speech, and Signal Processing, Salt Lake City, UT, USA, 7–11 May 2001; Volume 1, pp. 73–76. [Google Scholar] [CrossRef] [Green Version]
- Shahin, I.; Nassif, A.B.; Hamsa, S. Emotion Recognition Using Hybrid Gaussian Mixture Model and Deep Neural Network. IEEE Access 2019, 7, 26777–26787. [Google Scholar] [CrossRef]
- Asmita, C.; Savitha, T.; Upadhya, K. Voice Recognition Using MFCC Algorithm. Int. J. Innov. Res. Adv. Eng. 2014, 1, 158–161. Available online: www.ijirae.com (accessed on 14 July 2021).
- Tawfik, K. Towards The Development of Computer Aided Speech Therapy Tool in Arabic Language Using Artificial Intelligence. Ph.D. Thesis, Cardiff Metropolitan University, Wales, UK, 2016. [Google Scholar]
- Nassif, A.B.; Shahin, I.; Attili, I.; Azzeh, M.; Shaalan, K. Speech Recognition Using Deep Neural Networks: A Systematic Review. IEEE Access 2019, 7, 19143–19165. [Google Scholar] [CrossRef]
- Shewalkar, A.; Nyavanandi, D.; Ludwig, S.A. Performance Evaluation of Deep Neural Networks Applied to Speech Recognition: RNN, LSTM and GRU. J. Artif. Intell. Soft Comput. Res. 2019, 9, 235–245. [Google Scholar] [CrossRef] [Green Version]
- Geiger, J.T.; Zhang, Z.; Weninger, F.; Schuller, B.; Rigoll, G. Robust speech recognition using long short-term memory recurrent neural networks for hybrid acoustic modelling. In Proceedings of the Interspeech 2014: 15th Annual Conference of the International Speech Communication Association, Singapore, 14–18 September 2014; pp. 631–635. [Google Scholar]
- Available online: https://www.kaggle.com/c/rsna-pneumonia-detection-challenge/data (accessed on 14 July 2021).
- Available online: https://www.kaggle.com/paultimothymooney/chest-xray-pneumonia (accessed on 14 July 2021).
- Available online: https://bimcv.cipf.es/bimcv-projects/bimcv-covid19/#1590858128006-9e640421-6711 (accessed on 14 July 2021).
- Available online: https://github.com/ml-workgroup/covid-19-image-repository/tree/master/png (accessed on 14 July 2021).
- Available online: https://sirm.org/category/senza-categoria/covid-19/ (accessed on 14 July 2021).
- Available online: https://eurorad.org (accessed on 14 July 2021).
- Available online: https://github.com/ieee8023/covid-chestxray-dataset (accessed on 14 July 2021).
- Available online: https://figshare.com/articles/COVID-19_Chest_X-Ray_Image_Repository/12580328 (accessed on 14 July 2021).
- Taylor, L.; Nitschke, G. Improving Deep Learning with Generic Data Augmentation Luke. In Proceedings of the 2018 IEEE Symposium Series on Computational Intelligence, SSCI 2018, Bengaluru, India, 18–21 November 2018; pp. 1542–1547. [Google Scholar] [CrossRef]
- Gómez-Ríos, A.; Tabik, S.; Luengo, J.; Shihavuddin, A.; Krawczyk, B.; Herrera, F. Towards highly accurate coral texture images classification using deep convolutional neural networks and data augmentation. Expert Syst. Appl. 2019, 118, 315–328. [Google Scholar] [CrossRef] [Green Version]
- Albawi, S.; Mohammed, T.A.; Al-Zawi, S. Understanding of a convolutional neural network. In Proceedings of the ICET 2017: The International Conference on Engineering & Technology 2017, Antalya, Turkey, 21–24 August 2017; pp. 1–6. [Google Scholar] [CrossRef]
- O’Shea, K.; Nash, R. An Introduction to Convolutional Neural Networks. arXiv 2015, arXiv:1511.08458. [Google Scholar]
- Aszemi, N.M.; Dominic, P.D.D. Hyperparameter optimization in convolutional neural network using genetic algorithms. Int. J. Adv. Comput. Sci. Appl. 2019, 10, 269–278. [Google Scholar] [CrossRef]
- Theckedath, D.; Sedamkar, R.R. Detecting Affect States Using VGG16, ResNet50 and SE-ResNet50 Networks. SN Comput. Sci. 2020, 1, 79. [Google Scholar] [CrossRef] [Green Version]
- Alom, M.Z.; Taha, T.M.; Yakopcic, C.; Westberg, S.; Sidike, P.; Nasrin, M.S.; Esesn, B.C.V.; Awwal, A.A.S.; Asari, V.K. The History Began from AlexNet: A Comprehensive Survey on Deep Learning Approaches. arXiv 2018, arXiv:1803.01164. [Google Scholar]
- Chollet, F. Xception: Deep learning with depthwise separable convolutions. In Proceedings of the IEEE Conference on Computer Vision and Pattern Recognition, Honolulu, HI, USA, 21–26 July 2017; Volume 2017, pp. 1800–1807. [Google Scholar] [CrossRef] [Green Version]
- Huang, G.; Liu, Z.; Van Der Maaten, L.; Weinberger, K.Q. Densely connected convolutional networks. In Proceedings of the IEEE Conference on Computer Vision and Pattern Recognition, Honolulu, HI, USA, 21–26 July 2017; Volume 2017, pp. 2261–2269. [Google Scholar] [CrossRef] [Green Version]
- Szegedy, C.; Vanhoucke, V.; Ioffe, S.; Shlens, J.; Wojna, Z. Rethinking the Inception Architecture for Computer Vision. In Proceedings of the IEEE Conference on Computer Vision and Pattern Recognition (CVPR), Las Vegas, NV, USA, 27–30 June 2016; Volume 2016, pp. 2818–2826. [Google Scholar] [CrossRef] [Green Version]
- Berrar, D. Cross-validation. Encycl. Bioinform. Comput. Biol. 2018, 1, 542–545. [Google Scholar] [CrossRef]
- Peña Yañez, A. El anillo esofágico inferior. Rev. Esp. Enferm. Apar. Dig. 1967, 26, 505–516. [Google Scholar]
- Kääriäinen, M. Semi-supervised model selection based on cross-validation. In Proceedings of the 2006 IEEE International Joint Conference on Neural Network Proceedings, Montreal, QC, Canada, 16–21 July 2006; pp. 1894–1899. [Google Scholar] [CrossRef]
- Anguita, D.; Ghio, A.; Ridella, S.; Sterpi, D. K-Fold Cross Validation for Error Rate Estimate in Support Vector Machines. In Proceedings of the 2014 IEEE International Conference on Data Mining, Shenzhen, China, 14 December 2014; pp. 291–297. [Google Scholar]
- Liashchynskyi, P.; Liashchynskyi, P. Grid Search, Random Search, Genetic Algorithm: A Big Comparison for NAS. arXiv 2017, arXiv:1912.06059. [Google Scholar]
- Sokolova, M.; Japkowicz, N.; Szpakowicz, S. AI 2006: Advances in Artificial Intelligence. In Proceedings of the 19th Australian Joint Conference on Artificial Intelligence, Hobart, Australia, 4–8 December 2006; pp. 1015–1021. [Google Scholar] [CrossRef] [Green Version]
Figure 1.
Block diagram of the MFCC algorithm.

Figure 2.
The methodology of the speech-based model.

Figure 3.
LSTM network architecture.

Figure 4.
(a) ResNet architecture; (b) ResNet50 architecture.

Figure 5.
The accuracy of the system based on different MFCC numbers.

Figure 6.
Methodology for detecting COVID-19 in X-ray images.

Figure 7.
Image-based model performance for different CNN models.

Figure 8.
Image-based model performance during fine-tuning for VGG16.

Figure 9.
Methodology for detecting COVID-19 from X-ray scans and speech signals.

Figure 10.
Speech- and image-based model performance for different CNN models.


Table 1.
Speech-based model performance for different values of hyperparameters.
| Epoch | Batch Size | Dropout | Learning Rate | Accuracy | F1 Score | Precision | Recall |
|---|---|---|---|---|---|---|---|
| 50 | 16 | 0.1 | 0.01 | 73.8% | 76.4% | 79.2% | 73.8% |
| 0.001 | 94.3% | 94.4% | 94.6% | 94.3% | |||
| 0.0001 | 86.6% | 87.5% | 88.4% | 86.6% | |||
| 0.3 | 0.01 | 72.1% | 75.2% | 78.6% | 72.1% | ||
| 0.001 | 93.2% | 93.6% | 94.0% | 93.2% | |||
| 0.0001 | 83.2% | 84.1% | 85.1% | 83.2% | |||
| 0.5 | 0.01 | 60.1% | 65.3% | 71.5% | 60.1% | ||
| 0.001 | 92.6% | 92.6% | 92.6% | 92.6% | |||
| 0.0001 | 75.2% | 77.0% | 78.8% | 75.2% | |||
| 32 | 0.1 | 0.01 | 86.9% | 87.4% | 87.9% | 86.9% | |
| 0.001 | 97.4% | 97.4% | 97.4% | 97.4% | |||
| 0.0001 | 84.3% | 85.4% | 86.5% | 84.3% | |||
| 0.3 | 0.01 | 71.5% | 74.2% | 77.0% | 71.5% | ||
| 0.001 | 97.2% | 97.2% | 97.2% | 97.2% | |||
| 0.0001 | 78.6% | 80.7% | 82.9% | 78.6% | |||
| 0.5 | 0.01 | 69.5% | 72.9% | 76.7% | 69.5% | ||
| 0.001 | 92.9% | 93.4% | 93.9% | 92.9% | |||
| 0.0001 | 67.0% | 69.4% | 72.1% | 67.0% | |||
| 64 | 0.1 | 0.01 | 91.7% | 92.4% | 93.1% | 91.7% | |
| 0.001 | 93.4% | 93.7% | 94.0% | 93.4% | |||
| 0.0001 | 73.2% | 75.8% | 78.6% | 73.2% | |||
| 0.3 | 0.01 | 79.2% | 80.6% | 82% | 79.2% | ||
| 0.001 | 96.3% | 96.6% | 96.8% | 96.3% | |||
| 0.0001 | 66.4% | 69.9% | 73.7% | 66.4% | |||
| 0.5 | 0.01 | 68.7% | 71.9% | 75.5% | 68.7% | ||
| 0.001 | 94.0% | 94.2% | 94.3% | 94.0% | |||
| 0.0001 | 61.8% | 66.6% | 72.1% | 61.8% | |||
| 100 | 16 | 0.1 | 0.01 | 84.3% | 86.4% | 88.6% | 84.3% |
| 0.001 | 98.6% | 98.6% | 98.6% | 98.6% | |||
| 0.0001 | 92.6% | 92.7% | 92.9% | 92.6% | |||
| 0.3 | 0.01 | 76.9% | 79.5% | 82.3% | 76.9% | ||
| 0.001 | 95.4% | 95.7% | 96.0% | 95.4% | |||
| 0.0001 | 93.2% | 93.3% | 93.4% | 93.2% | |||
| 0.5 | 0.01 | 77.2% | 80.1% | 83.1% | 77.2% | ||
| 0.001 | 94.3% | 94.3% | 94.3% | 94.3% | |||
| 0.0001 | 88.3% | 88.6% | 88.3% | 88.3% | |||
| 32 | 0.1 | 0.01 | 91.5% | 92.4% | 93.3% | 91.5% | |
| 0.001 | 98.9% | 98.9% | 98.9% | 98.9% | |||
| 0.0001 | 84.9% | 85.4% | 85.9% | 84.9% | |||
| 0.3 | 0.01 | 76.1% | 78.0% | 79.9% | 76.1% | ||
| 0.001 | 98.0% | 98.0% | 98.0% | 98.0% | |||
| 0.0001 | 94.3% | 94.4% | 94.6% | 94.3% | |||
| 0.5 | 0.01 | 87.5% | 88.2% | 89.0% | 87.5% | ||
| 0.001 | 93.4% | 93.7% | 94.0% | 93.4% | |||
| 0.0001 | 89.2% | 89.6% | 89.9% | 89.2% | |||
| 64 | 0.1 | 0.01 | 90.3% | 90.7% | 91.1% | 90.3% | |
| 0.001 | 96.0% | 96.0% | 96.0% | 96.0% | |||
| 0.0001 | 90.9% | 91.3% | 91.7% | 90.9% | |||
| 0.3 | 0.01 | 87.5% | 88.3% | 89.2% | 87.5% | ||
| 0.001 | 97.4% | 97.4% | 97.4% | 97.4% | |||
| 0.0001 | 90.3% | 90.7% | 91.1% | 90.3% | |||
| 0.5 | 0.01 | 59.8% | 65.1% | 71.4% | 59.8% | ||
| 0.001 | 96.9% | 97.1% | 97.1% | 96.9% | |||
| 0.0001 | 86.9% | 87.6% | 88.4% | 86.9% |
Table 2.
Nonparametric Wilcoxon test results.
| Classifier | LSTM | VGG16 | InceptionResnetV2 |
|---|---|---|---|
| LSTM | NA | 0.00018 | 0.0008 |
| VGG16 | 0.0018 | NA | 0.03318 |
| InceptionResnetV2 | 0.0008 | 0.03318 | NA |
Table 3.
Previous work techniques and performance.
| Work | Techniques | Description | Performance Metrics |
|---|---|---|---|
| Mohamed Bader et al. [2] | MFCC features | Performs early diagnosis of COVID-19 by evaluating the MFCC acoustic features and providing analysis for the correlation coefficients | 0.42 average correlation coefficient (low positive correlation) |
| Hassan Abdelfatah et al. [8] | Long short-term memory (LSTM) | Performs early diagnosis of COVID-19 and evaluates different acoustic features | Accuracy: 98.2% Precision: 100% Recall: 97.7% F1-score: 98.8% AUC: 98.8% |
| Pahar Madhurananda et al. [13] | Multilayer perceptron (MLP), logistic regression (LR), long short-term memory (LSTM), support vector machine (SVM), convolutional neural network (CNN), and residual-based neural network (RSNET) | Discriminating COVID-19-positive coughs from COVID-19-negative coughs | Accuracy: 95.33% AUC: 97.6% Specificity: 98% Sensitivity: 93% |
| Deshpande et al. [14] | Bi-directional long short-term | Providing a COVID-19 recognition system based on cough analysis | AUC: 64.42% |
| Kumar et al. [15] | Logistic regression (LR), random forest (RF) multilayer perceptron (MLP). | Providing an early screening for COVID-19 based on cough analysis | AUC: 81.89 |
| Laguarta Jord et al. [16] | MFCC, CNN, Rsnet50 | Providing an early screening for COVID-19 based on cough analysis | Accuracy: 97.3% |
| Gunavant et al. [17] | MFCC | Providing an early screening for COVID-19 based on cough analysis | ROC: 77.1% AUC: 77.1% Accuracy: 78.3% |
| Maghdid et al. [18] | CNN and Alex-Net | COVID-19 detection based on the X-rays and CT scans of patients | Accuracy: 98% |
| Wang et al. [19] | Densenet Resnet-50 Nasnet-Amobile | Detecting the presence of COVID-19 from chest CT scans | Accuracy: 99.1% |
| Jaiswal et al. [22] | Densenet-201 pretrained CNN model | Detecting the presence of COVID -19 from chest CT scans | Accuracy: 97% F1-score: 96.29% Recall: 96.29% Precision: 96.29% |
| Weng et al. [23] | Inception pretrained CNN model | Detecting the presence of COVID-19 from chest CT-scans | Accuracy: 89.5% Specificity: 88% sensitivity: 87% |
| Narin, Ali et al. [24] | ResNet50, ResNet101, ResNet152, InceptionV3 and Inception-ResNetV2 | Detection of coronavirus or pneumonia-infected patients by the chest X-ray radiographs | Accuracy: 99.7% |
| Proposed System | Long short-term memory (LSTM) | COVID-19 detection system based on cough, voice, and breathing sounds | Accuracy: 98.9% Precision: 98.9% Recall: 98.9% F1-score: 98.9% |
| Proposed System | VGG16, VGG19, ResNet50, DenseNet201, Xception, InceptionV3 and Inception-ResNetV2 | COVID-19 detection system based on cough, voice, and breathing spectrograms, and chest X-ray images | Accuracy: 82.22% |
| Proposed System | VGG16, VGG19, ResNet50, DenseNet201, Xception, InceptionV3 and Inception-ResNetV2 | COVID-19 detection system based on chest X-ray images | Accuracy: 89.64% |
Publisher’s Note: MDPI stays neutral with regard to jurisdictional claims in published maps and institutional affiliations. |
© 2022 by the authors. Licensee MDPI, Basel, Switzerland. This article is an open access article distributed under the terms and conditions of the Creative Commons Attribution (CC BY) license (https://creativecommons.org/licenses/by/4.0/).
Share and Cite
MDPI and ACS Style
Nassif, A.B.; Shahin, I.; Bader, M.; Hassan, A.; Werghi, N. COVID-19 Detection Systems Using Deep-Learning Algorithms Based on Speech and Image Data. Mathematics 2022, 10, 564. https://doi.org/10.3390/math10040564
AMA Style
Nassif AB, Shahin I, Bader M, Hassan A, Werghi N. COVID-19 Detection Systems Using Deep-Learning Algorithms Based on Speech and Image Data. Mathematics. 2022; 10(4):564. https://doi.org/10.3390/math10040564
Chicago/Turabian StyleNassif, Ali Bou, Ismail Shahin, Mohamed Bader, Abdelfatah Hassan, and Naoufel Werghi. 2022. "COVID-19 Detection Systems Using Deep-Learning Algorithms Based on Speech and Image Data" Mathematics 10, no. 4: 564. https://doi.org/10.3390/math10040564
Note that from the first issue of 2016, this journal uses article numbers instead of page numbers. See further details here.