
Investigations on the Control of COVID-19 and Suggestions for Re-Open Based on Model Study


College of Computer and Information Sciences, Fujian Agriculture and Forestry University, Fuzhou 350002, China
*
Author to whom correspondence should be addressed.
Mathematics 2022, 10(1), 22; https://doi.org/10.3390/math10010022
Submission received: 10 November 2021
/
Revised: 4 December 2021
/
Accepted: 17 December 2021
/
Published: 21 December 2021
(This article belongs to the Topic Dynamical Systems: Theory and Applications)
Abstract
:Data-based analysis gives out an estimation of the incubation period. A dynamic model is established and discussed. Disease reproduction number reveals the high probability of COVID-19 pandemic, but strengthening the exposure of asymptomatic people will help to curb the transmission, and measures of contact-tracking and stay-at-home play a replaceable role. Discussions point out that social disruption can be avoided if the contact tracking rate can be more than 0.5. Investigations for re-opening show that a city of the same size as Wuhan can be reopened if new cases are continuously below 1000 for a few days and when they are less than 500, with the assurance of contact tracking associated with extensive testing. In short, tracking and testing are the prioritized strategies, while maintaining awareness can shorten the epidemic period and mobility restrictions can be avoided.
1. Introduction
COVID-19, a global pandemic of human infections with the novel virus called SARS-CoV-2, is erupting all over the world and has caused huge deaths and economic losses. In December 2019, some unexplained pneumonia cases were diagnosed in Wuhan in China, which were identified as infections with a new coronavirus. International Committee on Taxonomy of Viruses (ICTV) announced “severe acute respiratory syndrome coronavirus 2 (SARS-CoV-2)” as the name of the new virus on 11 February 2020. Its easy transmission, concealment, and complex diversity of symptoms have caused catastrophic transmission, with over 254 million confirmed cases and over 5 million deaths as of 18 November 2021 [1].
Nearly two years have passed and there is still no targeted medicine. The greatest challenge is for us to contain the spread of COVID-19. However, Wuhan used to be the most severely affected city and had successfully controlled COVID-19 in March 2020. There were 50,333 cumulative cases, 3869 deaths, and no current case as of 27 April 2020. Wuhan began to control COVID-19 on 23 January, contained it at the end of February, and ended up in the middle of March. We will do some investigations for the purpose of illustrating important characteristics and control strategies.
After the person-to-person transmission was confirmed, Wuhan began to take measures to control the spread of COVID-19. The city was locked down on 23 January 2020. After 5 February, more and more designated hospitals and temporary hospitals were put into service. The strict staying at home community management began on 11 February, where only one person in a family can be allowed to go out to buy necessities every three days, and no one could leave their house except the required staff after 15 February. On 21 February, the needed nucleic acid testing was completely accomplished. The spread of COVID-19 in Wuhan slowed down after 20 February 2020. Data and information come from websites of Wuhan Municipal Health Commission [2] and National Health Commission of the People’s Republic of China [3]. It seems lock-down, massive recruitment of designated hospitals and temporary hospitals, and strict mobility restriction are the impressive measures to control COVID-19 in Wuhan.
However, South Korea basically avoided the mobility restriction and successfully contained the spread of COVID-19 at the end of March. In South Korea, the first case was confirmed on 20 January 2020. The major characteristic response in South Korea is that they completed a large number of virus tests. Based on the identification, mild patients were concentrated in the World Cup Stadium and the severe were transferred to hospitals [4]. After reopening, an epidemic related to the Xinfadi market broke out in Beijing in June 2020. The first case was diagnosed on 11 June and this outbreak was ended up on 7 July. A total of 335 cases were confirmed and more than 11 million tests were completed from 11 June to 7 July [5]. It seems testing enabled South Korea to curb the transmission of COVID-19 without mobility restrictions and the same as in Beijing. Effects of different measures will be investigated, and thresholds and suggestions for re-open will also be discussed in this paper.
There is more research on COVID-19, mainly about genomic mechanism research [6,7], clinical information [8,9], patient treatment [10], and prevalent forecast [11,12], and some mathematical models which mainly focused on prediction and comparison [13,14,15,16]. In view of the current severe pandemic and the recurrent risk of COVID-19 in the world, more research in all aspects is required. Taking Wuhan as an example, but not limited to Wuhan, the organization of this paper is as follows. In Section 2, we revise abnormal reported number of cases for further investigation and explore the relationship between close contacts and confirmed cases to determinate the incubation period. The proportion of the asymptomatic and the potential infections at the beginning of control are also discussed. In Section 3, a mathematical model of the outbreak is established. Disease reproduction numbers are discussed. The incidence rate and the effect of awareness protection are investigated with data and model. Effects of some control measures are presented by theoretical analyses and simulations. Finally, thresholds and conditions of re-opening are suggested. In Section 4, we end this paper with conclusions. Symbols and their descriptions used in this paper are presented in Table 1.
2. Data-Based Analysis
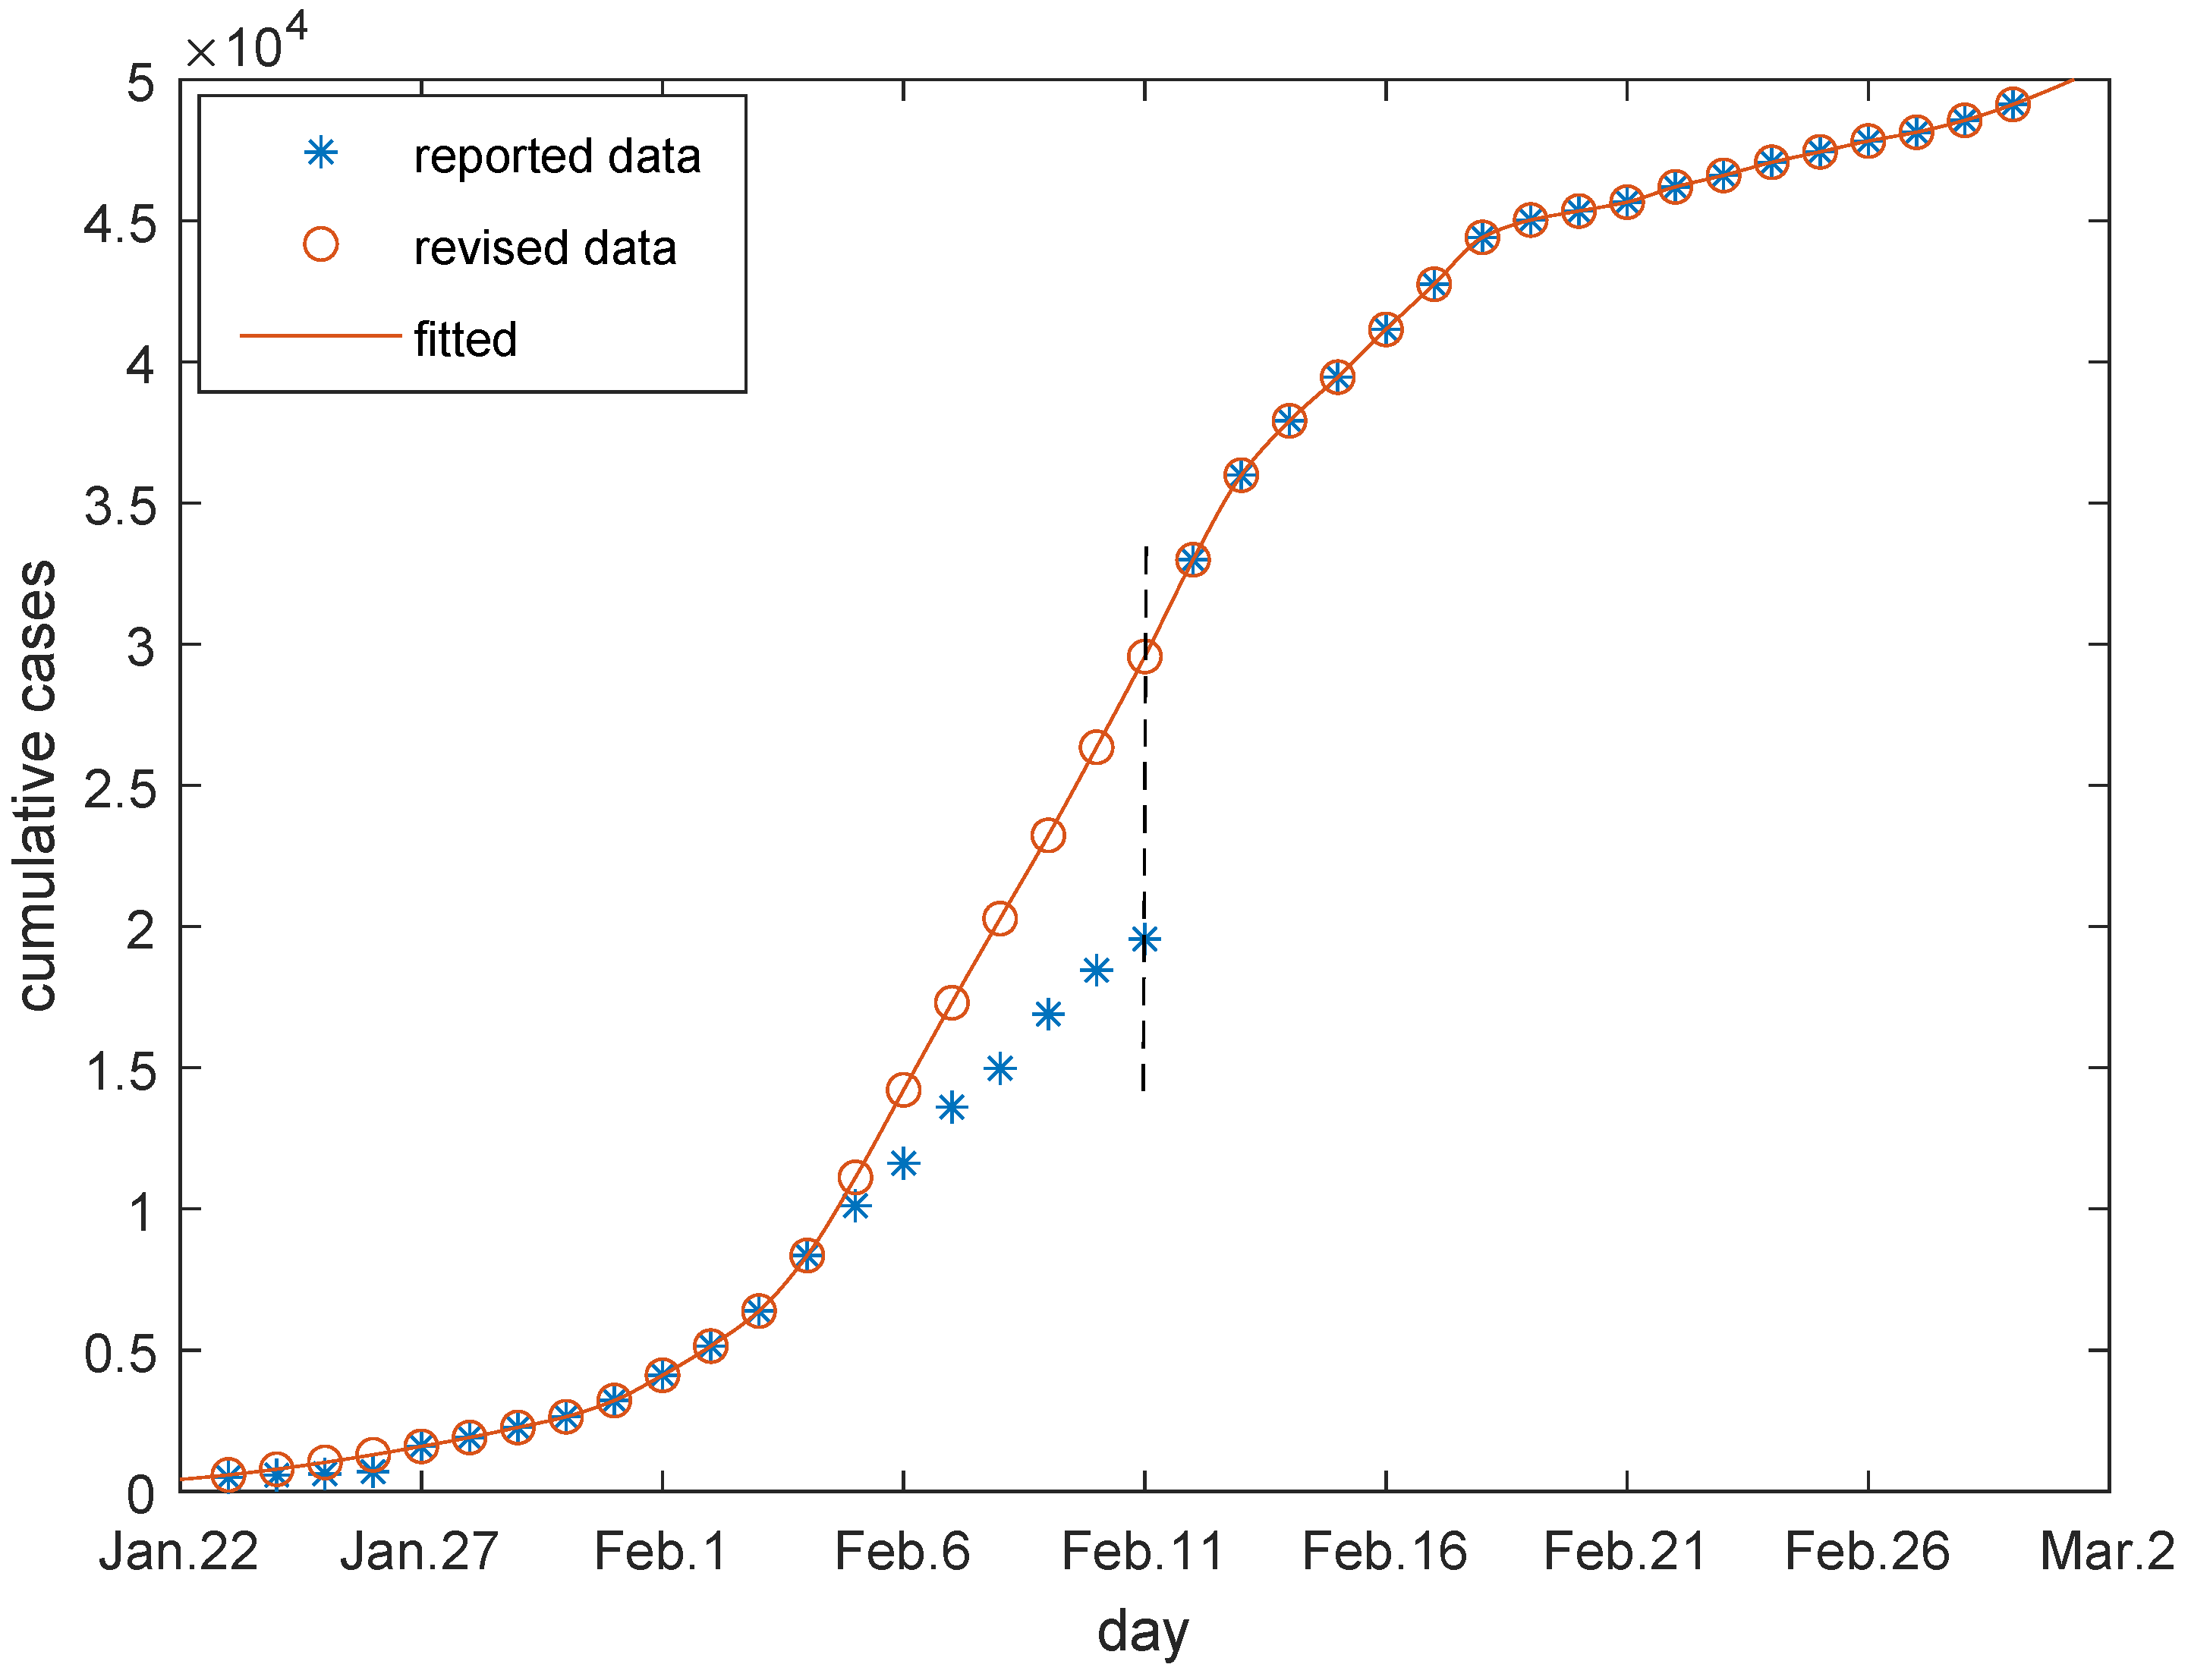
Due to the confusion at the beginning of the outbreak, some data was missing and some was abnormal. It was noticed that there were abnormal reports in the new confirmed cases on 27 January and 12 February because the clinically diagnosed cases were incorporated into the confirmed cases on 12 February, and pending cases were cleaned up on 27 January [17]. Since the cases already existed and they were just not reported, the abnormally increased cases need to be portioned out rationally, which are presented in Figure 1. Both of the reported and revised data of cumulative confirmed cases are provided in Table A1 in Appendix A.1. We will use these revised data for further discussions.
It is generally accepted that the incubation period is 1–14 days, mostly 3–7 days. In this paper, we will use data of traced close contacts and confirmed cases to explore the average incubation period m. Close contacts are produced by current infectious individuals and determine the number of infections after an incubation period. The relationship is
In early 2020 in Wuhan, once the patient was confirmed, the staff immediately conducted an epidemiological investigation on him, and collected his activity tracks, including where he had been and who he had contacted, so as to determine his close contacts. Data of new confirmed cases and the cumulative tracked contacts of Hubei province are presented in Wuhan Municipal Health Commission [18], and we used these data to ascertain the incubation period of COVID-19.
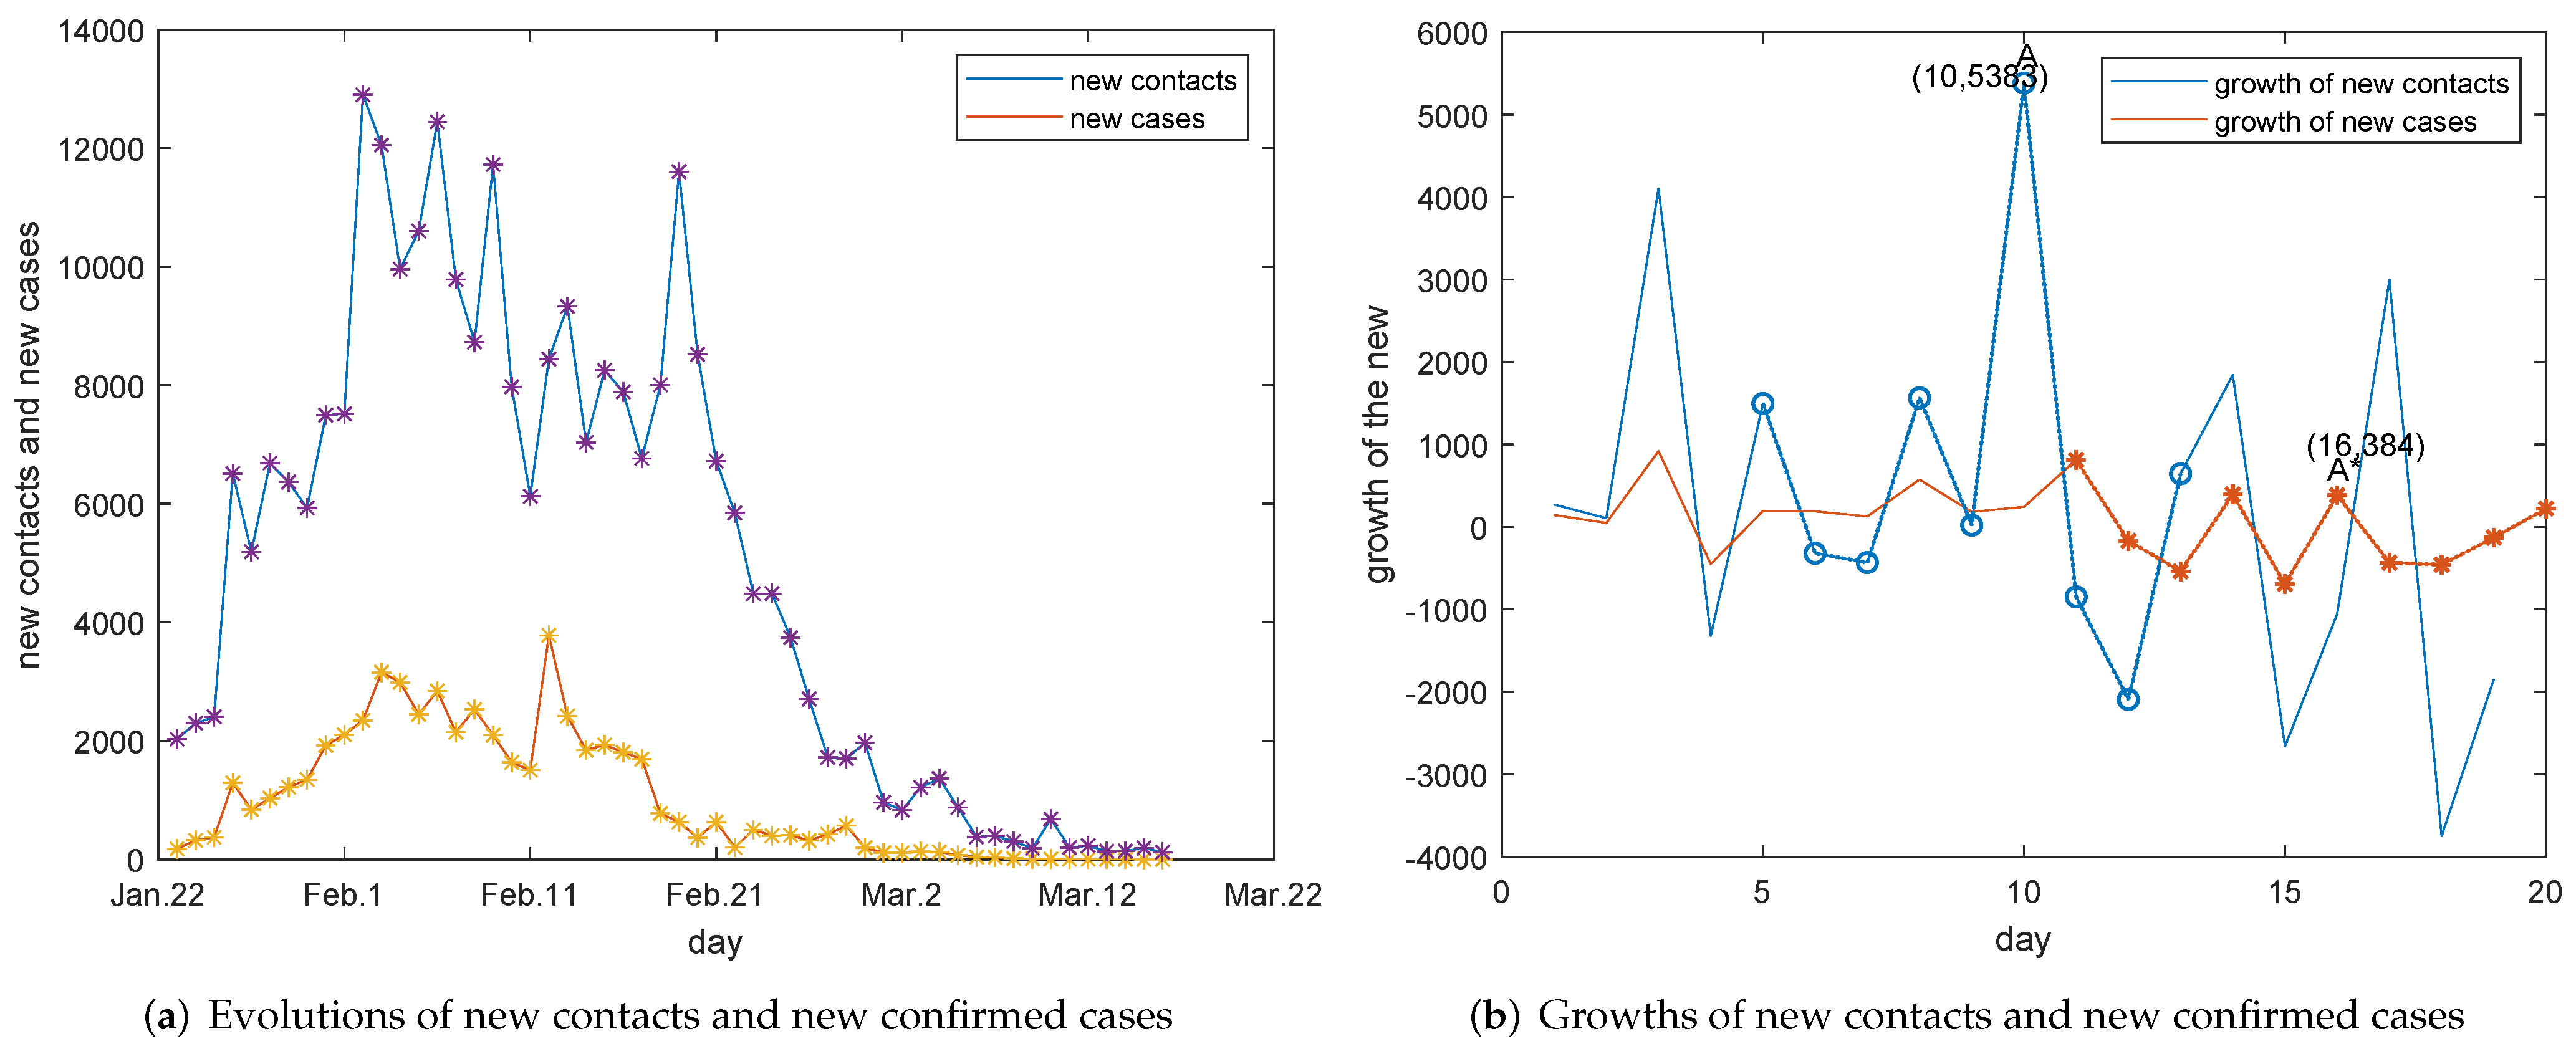
The evolution of traced new contacts and that of new confirmed cases are presented in Figure 2. It can be observed from Figure 2a that trends of traced new contacts and new confirmed cases are greatly related. The synchronous correlation especially can be found before early February and after 21 February, because of the lower number of confirmed cases. With the great increase in the number of confirmed cases, the tracked contacts today may not correspond to the new confirmed cases today, so the direct synchronization correlation is weakened in the middle of February. On the other hand, the more close contacts are traced, the more infections may have happened and the more cases will be confirmed after an incubation period. Therefore, the day when the number of close contacts increases fastest would correspond to the day when the number of confirmed cases increases fastest, subsequently. The growth of new close contacts and the growth of new cases are investigated. It can be observed from Figure 2b that the highest point of the growth curve of the new close contact is A and and the highest point of the growth curve of new confirmed cases after that is , moreover their growth trends are completely consistent in the corresponding interval by comparing the blue and the red dot lines. Therefore, we infer that this lag interval is 6 days. There are 6 days between the two fastest growing points A and . The new tracked contacts today were infected at least one day ago. Thus, the incubation period can be estimated as .
Remark 1.
Cities of Hubei province had the capabilities to carry out RT-PCR testing for close contacts after 21 February [19], the relationship between trends of new close contacts and new confirmed cases can not be linked to the incubation period. Clinically diagnosed cases are incorporated into the confirmed cases after 12 February, data before and after 12 February are no longer comparable. However, the numbers of additional clinically diagnosed cases from 12 February to 14 February are also available officially. Therefore, we use data before 15 February to explore the incubation period in Figure 2b.
Although the proportion of the asymptomatic is not clear, an inference can be made based on some known facts and some studies. Polln et al. suggested that at least one third of infections were asymptomatic [11]. Lavezzo et al. claimed that 42.5 percent confirmed SARS-CoV-2 infections were asymptomatic [12]. In China, the asymptomatic infected persons were mainly found in the detection of immigrants after March 2020. As for the found cases by the entry detection, Academician Zhong Nanshan claimed that 50 percent imported cases detected by RT-PCR testing when they entered the country only have symptoms such as cough and cold [20]. Therefore, we take for reference. According to the definition given by WHO, the asymptomatic individual refers to a person who has no clinical symptoms but has a positive pathogenic test for SARS-CoV-2 virus in his respiratory specimens [21]. Actually, most of the asymptomatic are not absolutely asymptomatic, but would have mild symptoms. Therefore, the asymptomatic should be those who have not been exposed because of mild symptoms.
3. Model-Based Analysis
3.1. Modelling
A deterministic compartmental model is designed for the purpose of investigating effective control strategies by the dynamic properties. The following assumptions are made to establish the model:
Hypothesis 1 (H1).
As COVID-19 is susceptible to everyone, including newborn babies, let be the constant recruitment rate in an outbreak region even if it is locked down. is the natural death rate.
Hypothesis 2 (H2).
Obviously, the asymptomatic that have not been traced are the definitely source of infections. Patients who are not admitted to hospitals also will cause the continuous transmission. Because the infected persons would be infectious two days before onset [22], it is supposed that a certain percentage of the latency is infectious. is the percentage. Therefore, , and are the source of infections.
Hypothesis 3 (H3).
The susceptible S may or may not be infected when contacting with , and . is the coefficient of the contact infection rate and is the coefficient of the contact but not infected rate. expresses the decline rate of incidence due to some kind of awareness protection behaviors.
Hypothesis 4 (H4).
denotes the average incubation period of this disease. As mentioned above, proportion of the latency will become the infectious asymptomatic and proportion of them will be onset after an incubation period. The onset patients will go to see doctors and some of them will be admitted to hospitals. is the admission rate.
Hypothesis 5 (H5).
The asymptomatic and some of not admitted patients will be self-healing, self-healing rates of the asymptomatic and the not admitted patients are denoted as and , respectively. and are the curative rate and the death rate of patients in hospitals, respectively.
Hypothesis 6 (H6).
In the case of COVID-19, authorities concerned will track the close contacts when a case is confirmed. q is the tracking rate of the close contacts. Because some contacts are infected and others are not. Therefore, some of the traced close contacts are infected and others are still susceptible. The traced infected individuals are isolated and observed, also p proportion of them will be released after the quarantine period because there are no symptoms, proportion of them will be confirmed because of the onset and be admitted to hospitals. The traced uninfected close contacts are also isolated and temporarily protected from infections, they will be released and susceptible after the quarantine period. is the quarantine period.
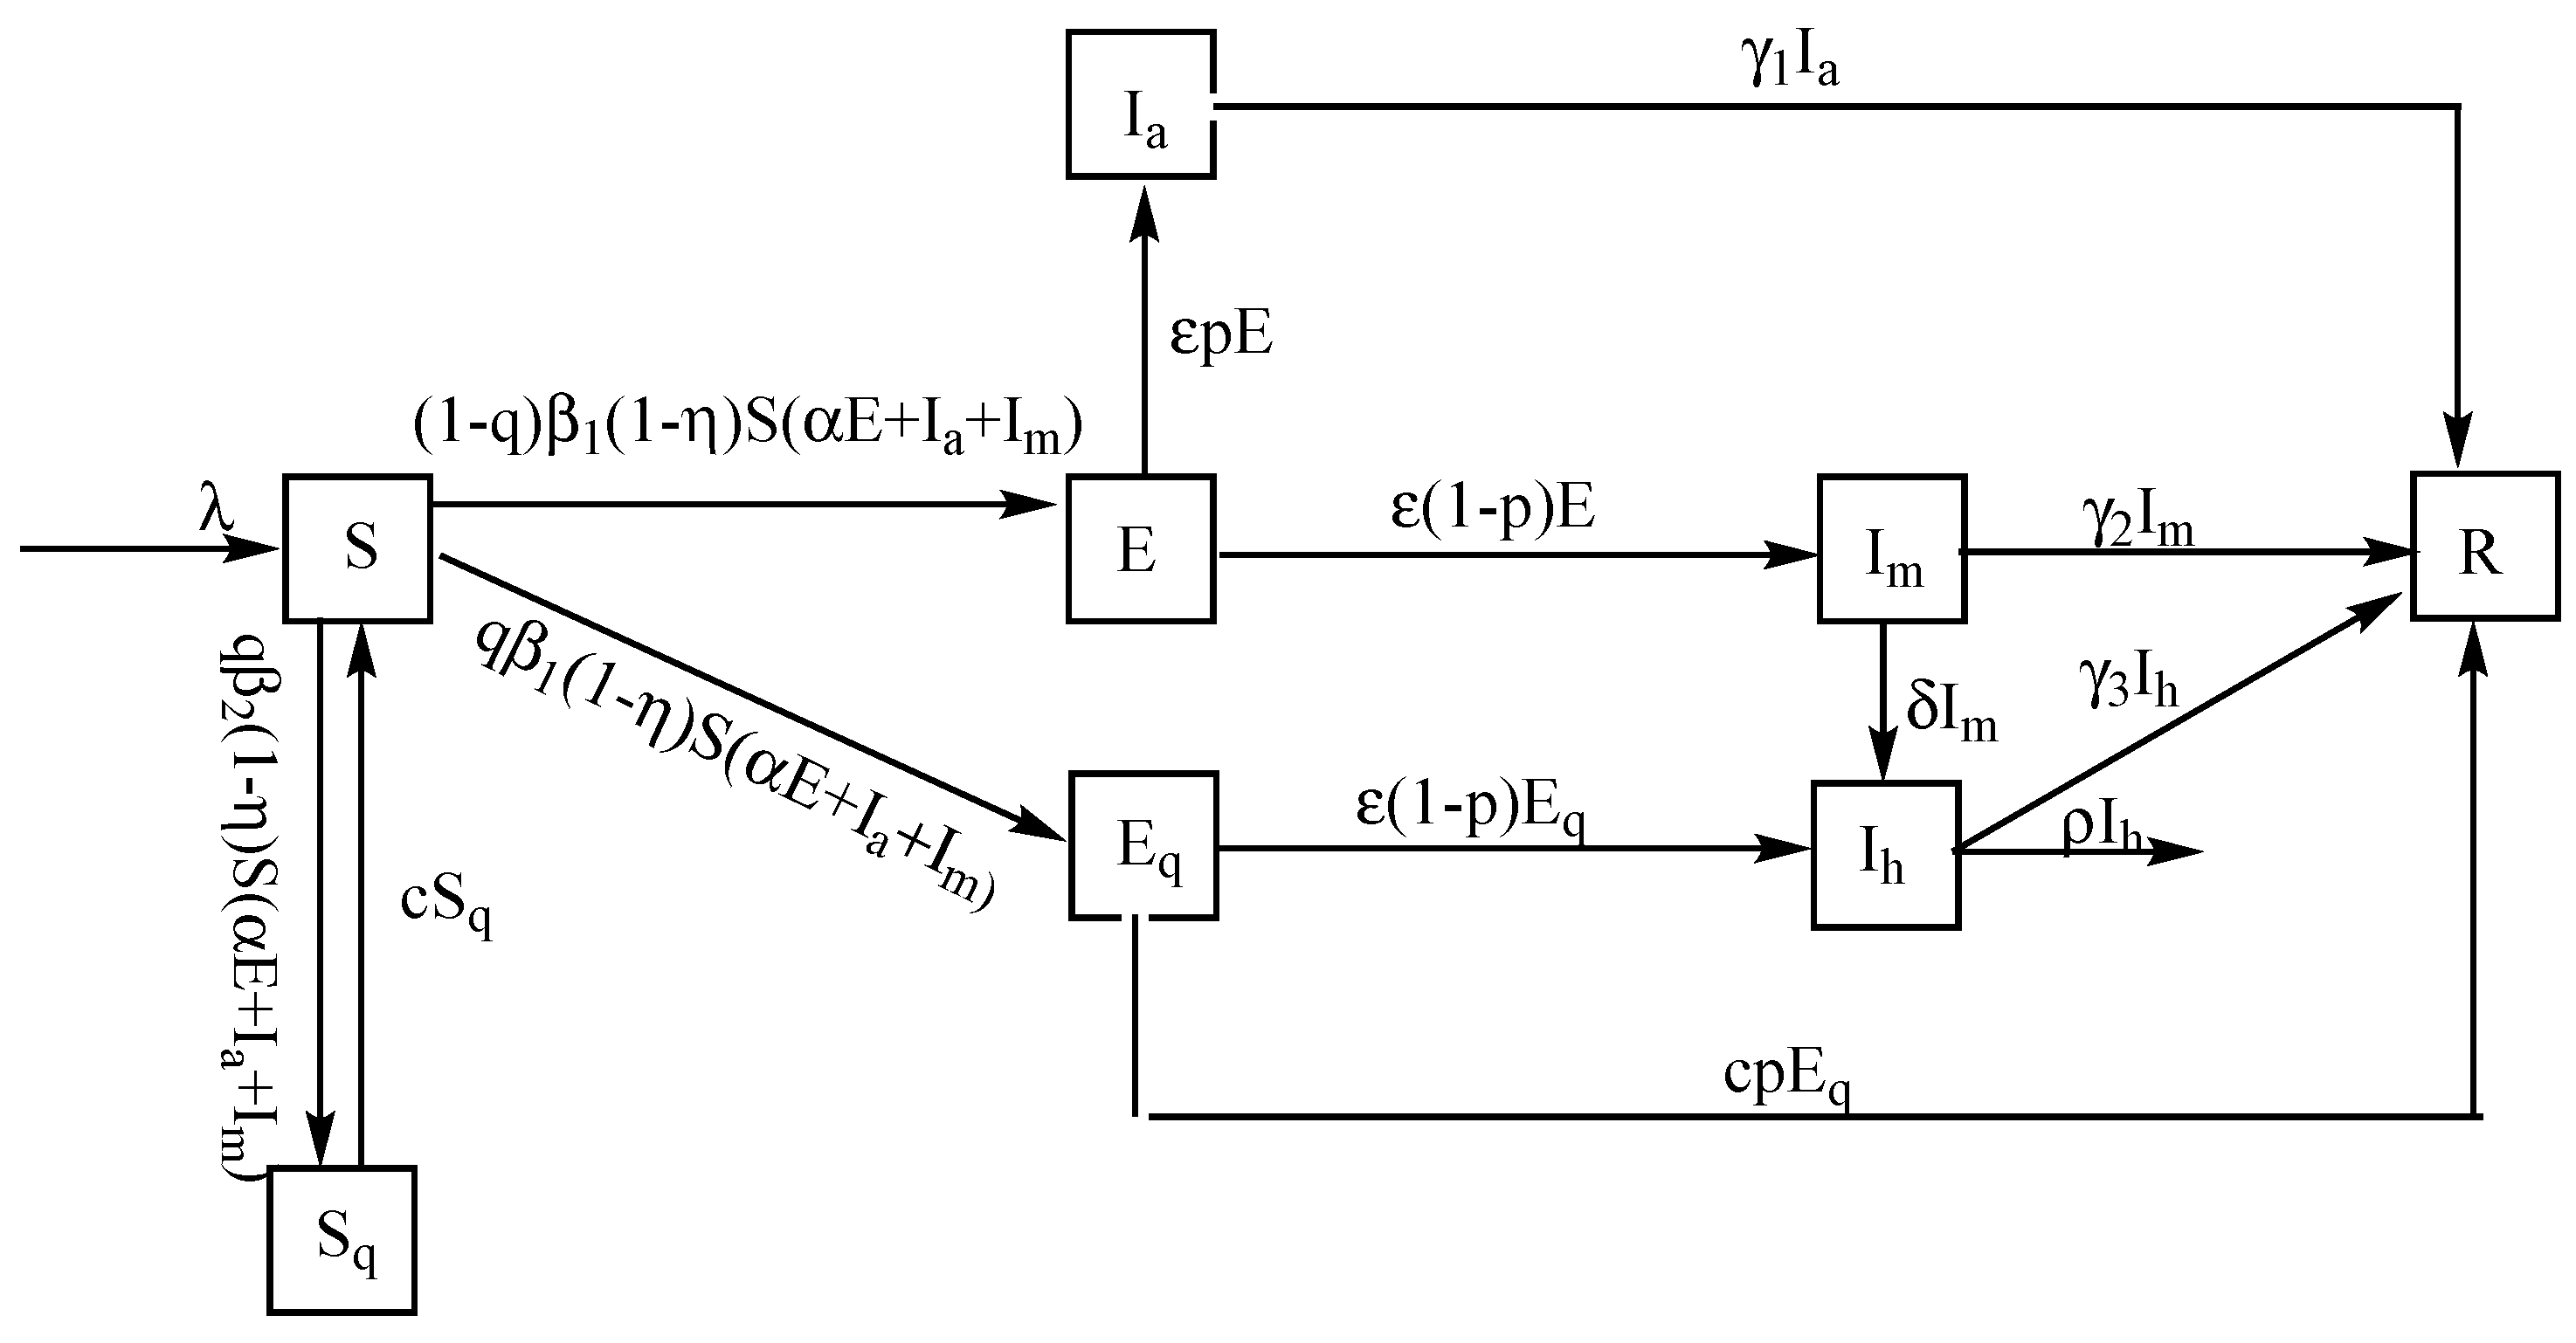
Based on these assumptions, COVID-19 transmission mechanism is presented in Figure 3, the corresponding model is as follows.
with the initial conditions S(0) > 0, E(0) > 0, Ia(0) > 0, Im(0) > 0, Ih(0) > 0, Eq(0) ≥ 0, Sq(0) ≥ 0, R(0) > 0. It is obvious that all the solutions initiating in exist continuously for all t ≥ 0 and are unique. Where = {(x, y, z, u, v, w, s, t) : x ≥ 0, y ≥ 0, z ≥ 0, u ≥ 0, v ≥ 0, w ≥ 0, s ≥ 0, t ≥ 0}. Symbols and their representations are listed in Table 1.
Remark 2.
By the definition of WHO, the temporarily asymptomatic may include some latency. In this paper, the asymptomatic refers to the infectious individuals who will not go to see doctors because there are no symptoms or symptoms are very very mild, not including latency. p also can be explained as the unexposed rate of the not being tracked infections.
3.2. Discussion of and
It is straightforward to get the disease-free equilibrium (DFE) point of model (1), we will compute the effective reproduction number by the method of van den Driessche and Watmough [23]. Since the reproduction number is defined as the average number of newly infected cases produced by an infectious individual during his infection period in a population where all individuals are susceptible, we focus on the infectious compartments. According to the modeling assumptions, classes of , and are infectious actually, therefore, a subsystem consisted of the infectious compartments , and of model (1) is presented as
where is the rate of new infections in compartment i, is the rate of transfer in compartment i (the rate of transfer of individuals out of compartment i minus that into it). Then
The corresponding Jacobian matrices evaluated at the DFE are
It is obvious that F is non-negative and V is non-singular, then
is called the associated next generation matrix. The effective reproduction number is defined as the spectral radius of the next generation matrix , which is the maximum modulus of eigenvalues of matrix , then we can get
Dynamically, means all trajectories of the system will converge to . The needed mathematical analysis is as follows.
Choosing the Liapunov function
where . Thus there is
then as . And . By the LaSalle Invariance Principle, all the solutions of system (1) would have and as . Now, the limit system of (1) is as follows.
It is easy that and as . Furthermore, and as . Then, by the theory of limit system, is globally asymptotically stable if . Therefore, the disease will be eradicated if . That is, effective control measures should be contribute to bring about . Let us turn to the expression of . In general, the conversion rate , the self-healing rate of the asymptomatic is because there are a few people who carried the SARS-CoV-2 virus for more than 14 days [24]. Let because the infected persons have been contagious two days before onset [22]. Hence, we have
As the natural death rate , it is sufficient to discuss
Equation (3) indicates parameters , and m will have impacts on , corresponding to the tracking rate, the awareness protection rate (including mask-wearing, hand-washing, social distance, mobility restriction, and staying at home), the admission rate, the proportion of the asymptomatic and the incubation period. It is obvious that increased , and will contribute to decrease .
In the case of introducing Ark hospitals, the inventory would be cleared and all patients can be admitted, then only E and are infectious, model (1) is transformed to model (A1) which is presented in Appendix A.2. Therefore, follows
That is, will be reduced for the sufficient medical capacities.
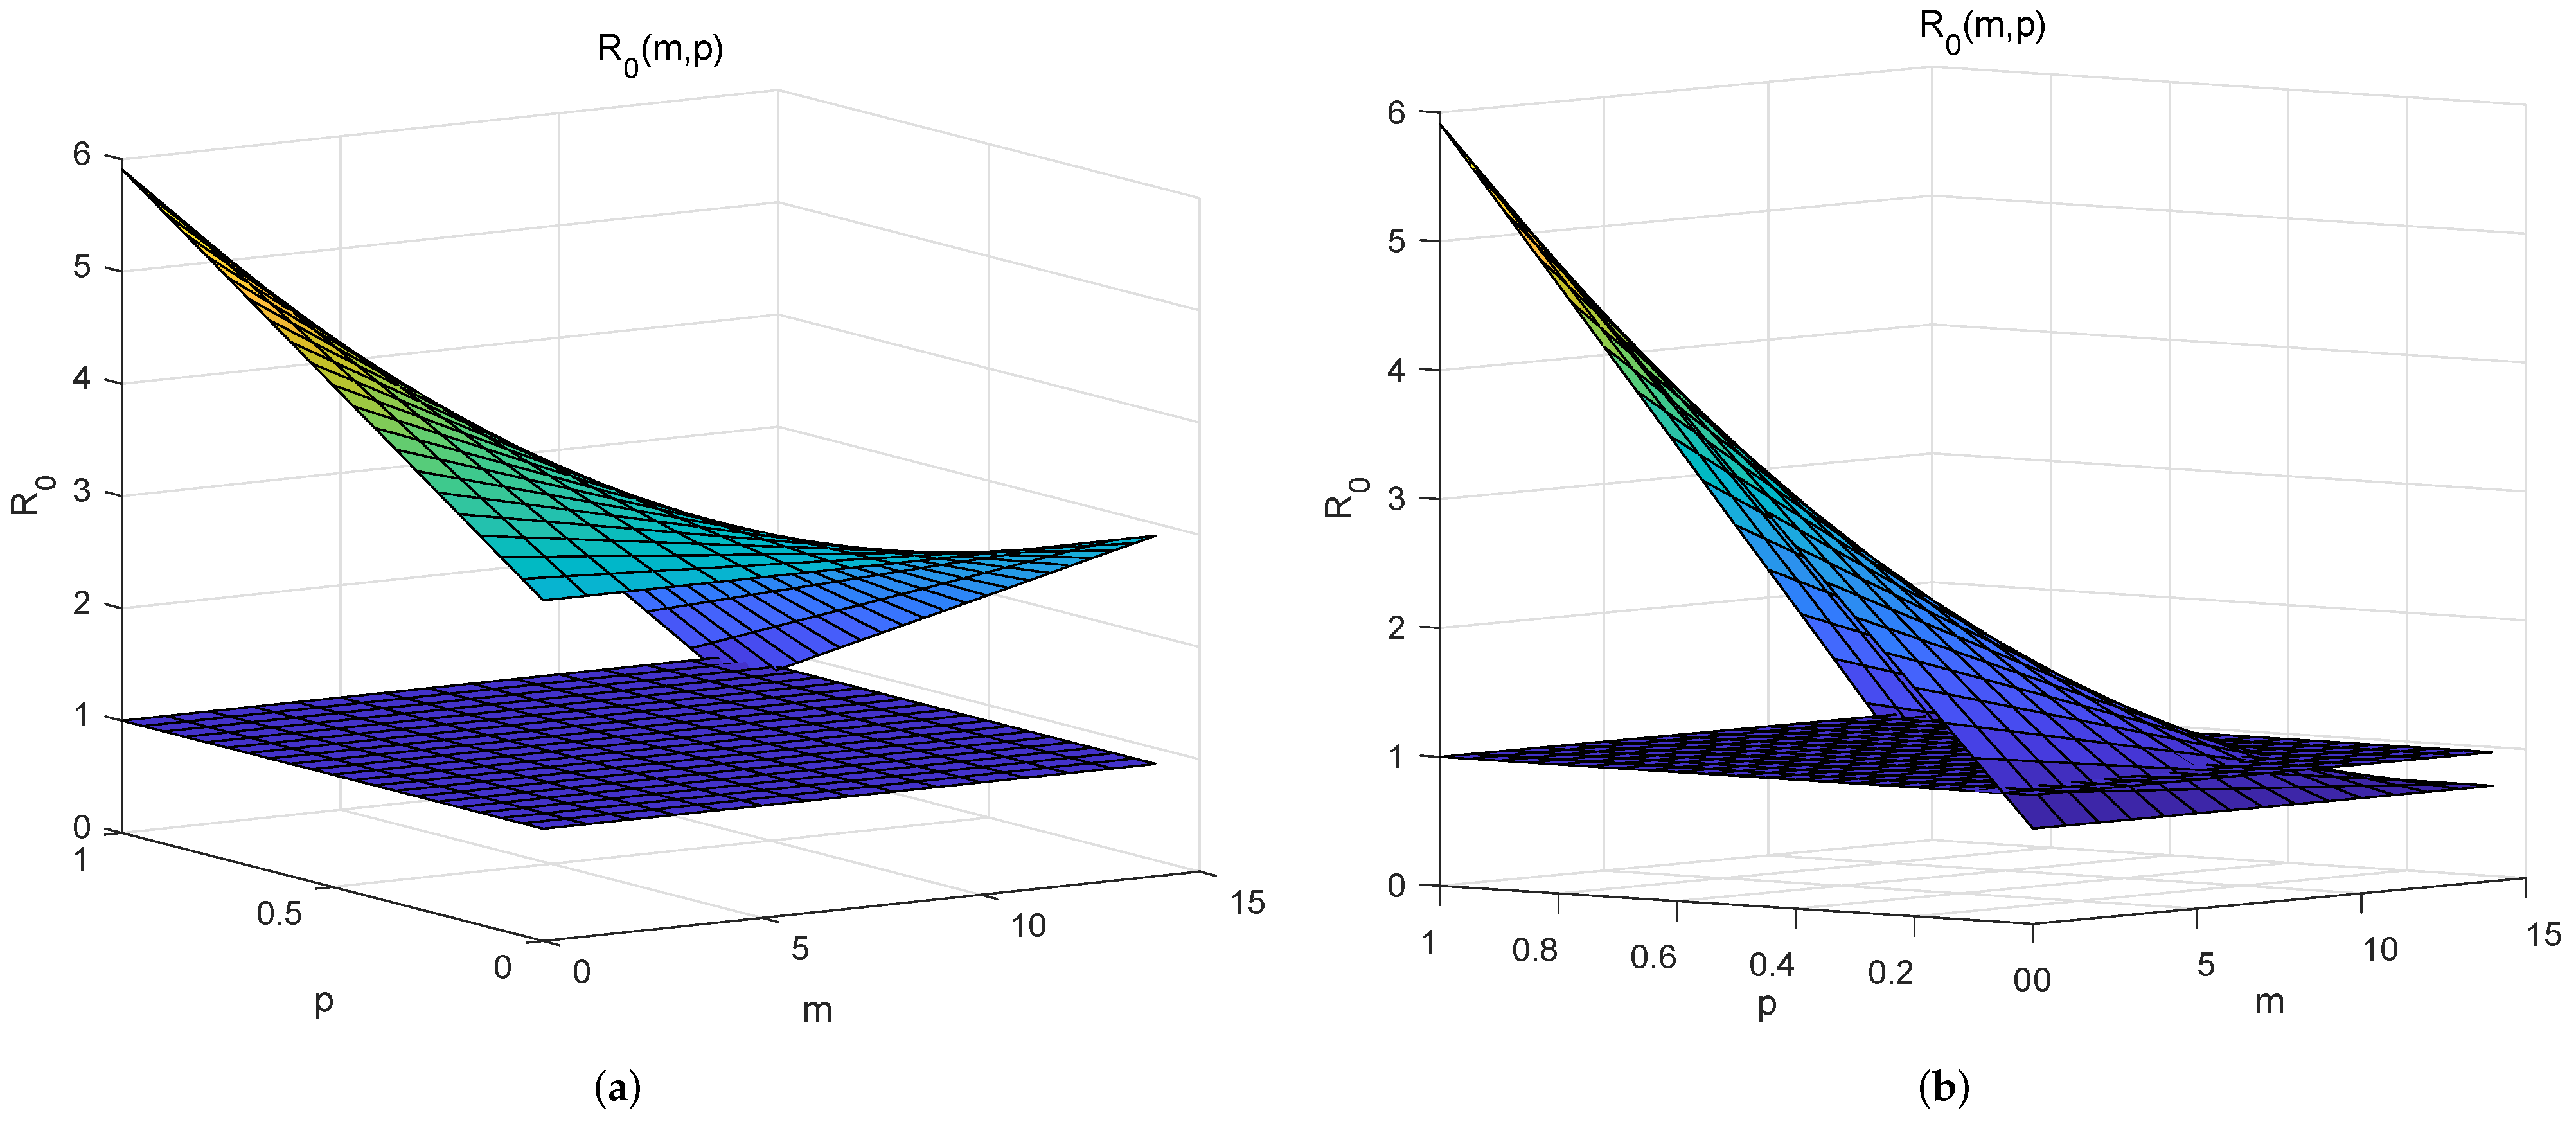
The basic reproduction number corresponds to the case at the beginning of the outbreak and without interventions [25], refers to the spread ability of an infectious disease. Therefore, can be estimated as
where is generally taken as the total number of population. It can be detected from Figure 4a that COVID-19 spreads easily for almost all values of p and m. Comparing with Figure 4a, Figure 4b affirms that the complete admission of patients is conducive to disease control and it is not the key measure. Figure 4b also indicates p should be small in view of containing the spread of COVID-19. As p also is the unexposed rate of the not being tracked infected individuals and RT-PCR testing will expose the asymptomatic, then RT-PCR testing will play an important role in controlling of COVID-19. In short, discussions of give results: (i) A pandemic is inevitable without interventions; (ii) It is possible to curb the spread with an adequate medical capacity and extensive testing.
It is certain that awareness protective measures can reduce the contact infection rate so that the coefficient of incidence rate will be decreased to , here is the decline rate due to awareness protection. It corresponds to the situation before 5 February in Wuhan. With the improvement of medical capacities and the strict staying at home managements, the incidence rate was reduced greatly. Thus, mainly expresses the declined incidence rate due to the improved medical capacities and the removal of the susceptible after 5 February.
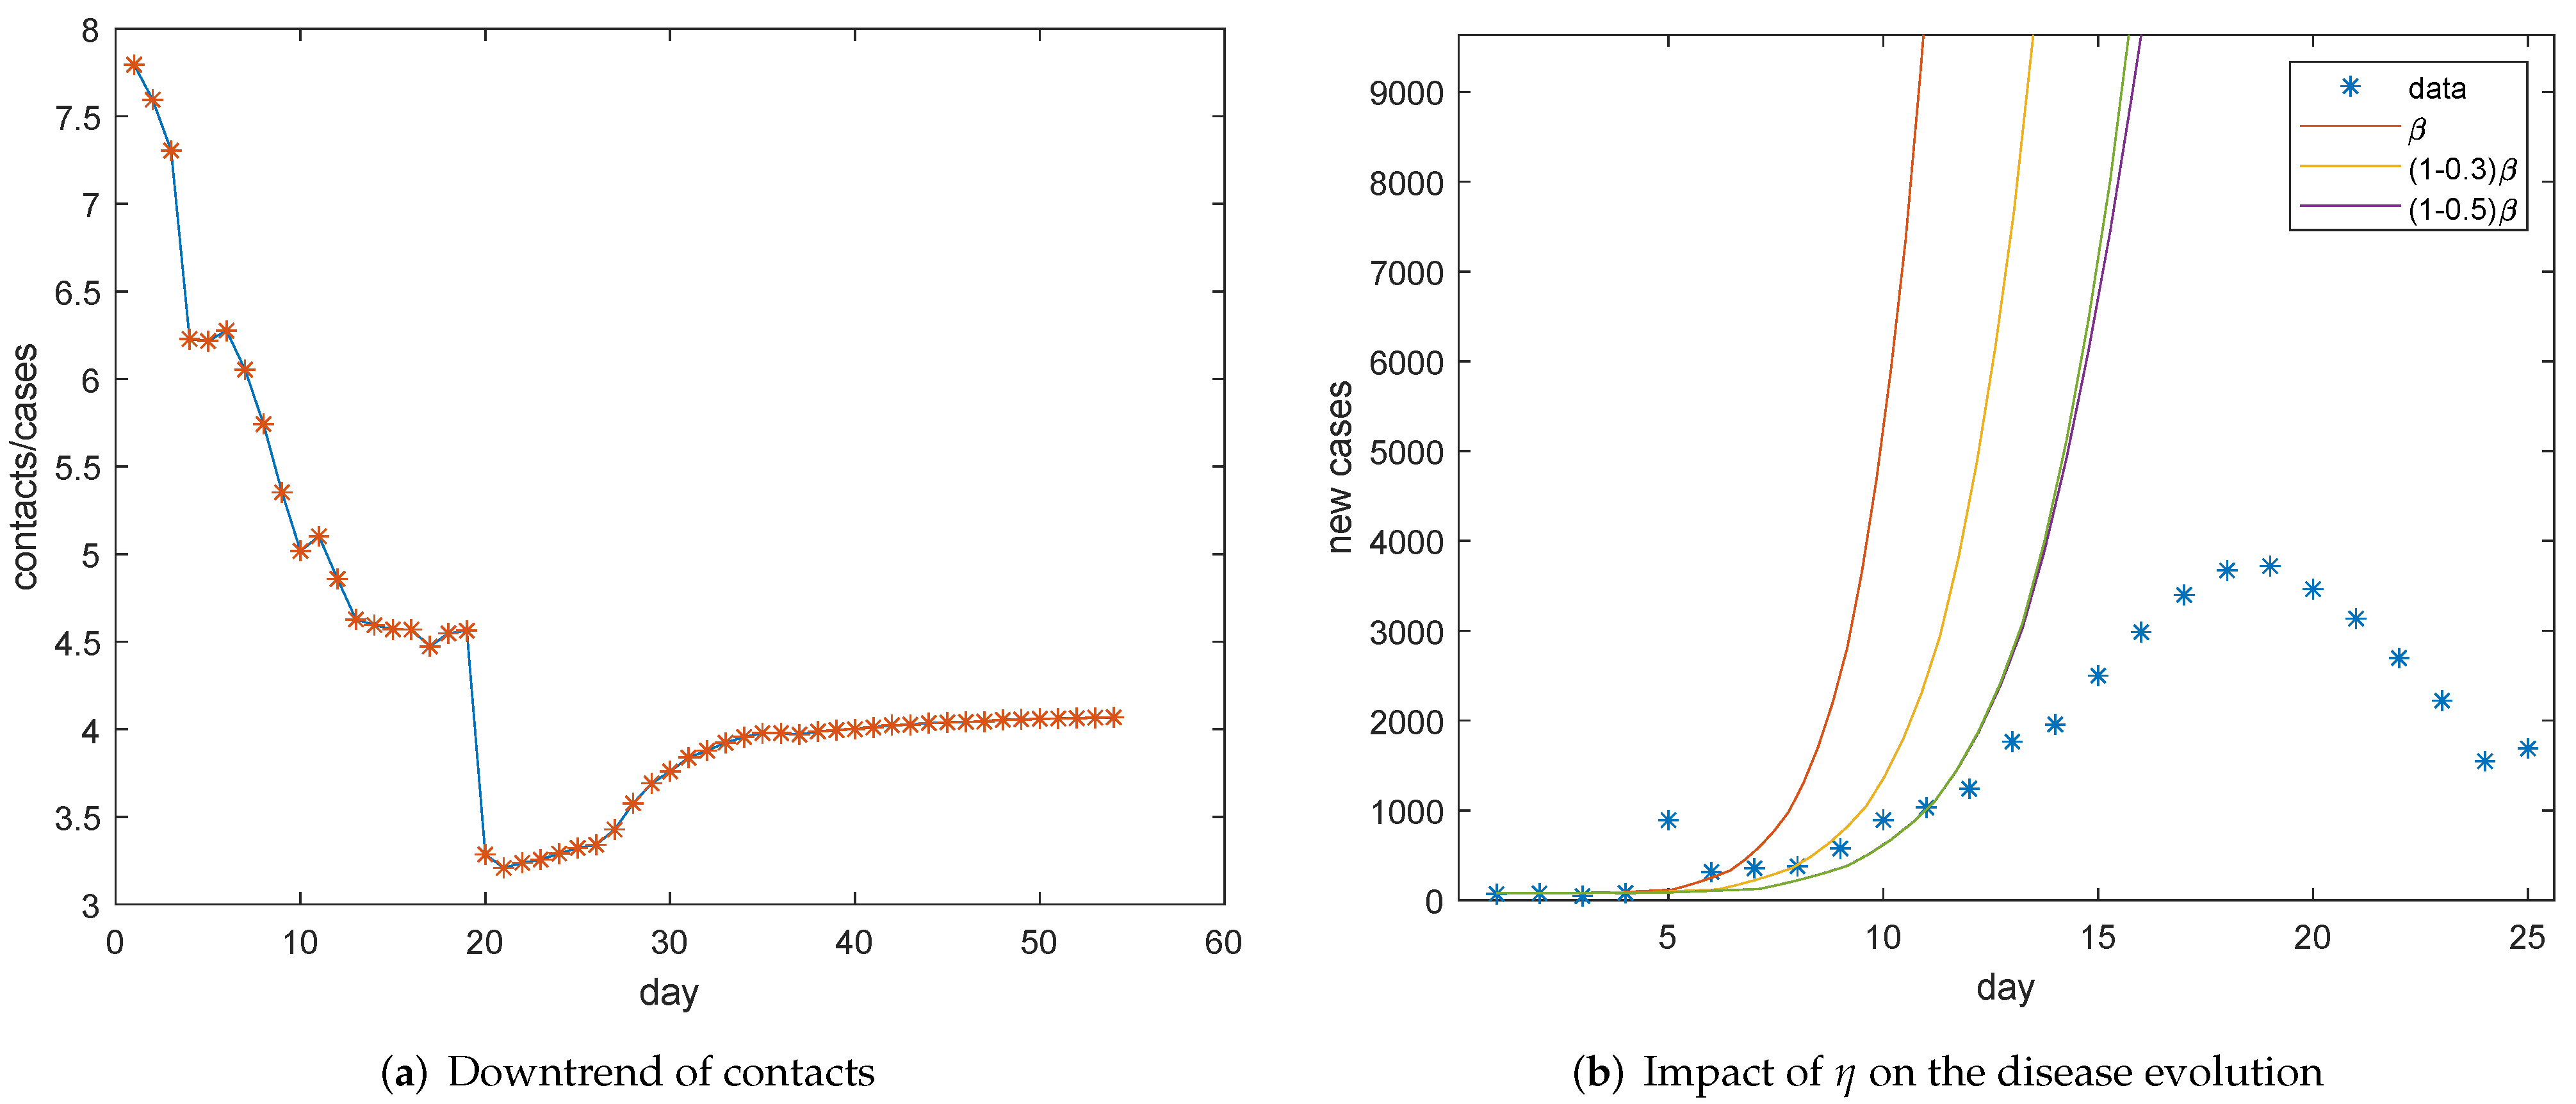
Now, we will estimate the coefficient of incidence rate. Firstly, we investigate the contact rate. The ratio of tracked close contacts to confirmed cases is depicted in Figure 5a. The downward trend can be seen before 5 February, which indicates the contact rate was reduced before 5 February, and the corresponding linear fitting function is . There are two sudden drops on 27 January and 12 February due to the abnormal increased number of confirmed cases. We can see that the average contact number is stable after 5 February if we ignore the cliff-like decline caused by the surge in the number of new confirmed cases on 12 February. Therefore, we take the main downward rate as the decline rate of contacts, which is mainly realized in the first control stage. Then, it seems . It also can be observed from Figure 5b, which simulates the evolution of new cases by model (1), that the simulation is almost consistent with data for in the same period (The subsequent discrepancy needs to be compensated by the control parameters of the next stage). Then, it can be assumed that the contact rate can be reduced by 30 percent with awareness protection.
Considering the abnormal increase in the number of confirmed cases on 12 February, we abandoned the values after 12 February in Figure 5a. Noticing that the ratio of new tracked contacts to new confirmed cases after 21 February can represent the declined contact rate since they had cleared the inventory as of 20 February and can admit, track, and confirm cases on the same day after 21 February [19]. It can be calculated directly that the ratio is 10.11 after 21 February. Then, the normal contact rate may be . Tang et al. also estimated the contact rate is 14.781 [26]. Therefore, we take 14.44 as the average contact rate of an infected individual. It is supposed that 2.5 percent close contacts were confirmed with COVID-19 on average in Wuhan [27]. That is, the contact infection rate can be referred to . Therefore, the coefficient of incidence rate can be taken as
Thus, with values of , and determined above, is obtained by Equation (5). By the way, the contact but uninfected rate is , then
Next, we turn to the effective reproduction number again with the above-determined value of . With different values of q and the fixed , curves of are drawn in Figure 6a based on Equation (3), where also can be interpreted as the removal rate of the susceptible generally. It seems there is an 80 percent probability to keep COVID-19 under control if the effective tracking rate q can reach 55 percent, referring to the purple curve in Figure 6a. Further, 15 percent admission rate and 18 percent removal rate with 55 percent tracking rate can gain . That is, mobility restrictions can be relaxed if we have sufficient contact-tracking capability to find more than half of the infected individuals, so that the social disruption can be avoided. Taking China as an example, there are 18.1 percent elderly non-working population as of the end of 2019 [28], and a certain proportion of infants who do not go out, then we only need to request these high-risk population to follow the mobility restrictions. Noticing that the extensive testing will expose more infected persons who have not visited doctors, then the actual value of parameter p will be reduced. With different paired values of , curves of are drawn in Figure 6b. Figure 6b also shows the spread of COVID-19 can be contained with 15 percent admission rate and the mobility restrictions on high-risk population under the extensive testing. In a word, effective contact-tracking and extensive PCR-testing are the priorities for controlling COVID-19.
Extensive testing and successful contact tracking were exactly the control strategies taken by South Korea in the February–March epidemic of COVID-19. In Daegu, South Korea, the super testing ability facilitated the rapid identification and isolation of cases, so that South Korea did not implement the so-called “closed city” or community quarantine. The same was observed in Beijing. A market-related epidemic of COVID-19 broke out in Beijing in June 2020 and was ended within one month. There were 335 cases confirmed from 11 June to 7 July, where 88 cases were diagnosed by visiting doctors and the rest were obtained through testing and tracking.
Remark 3.
The effective tracking rate in Wuhan would not exceed 22 percent. It can be calculated that the average ratio of tracked close contacts to confirmed cases is about 4.465 in the control process, which also can be detected from Figure 5a, and there is 1%∼5% traced close contacts were confirmed [27]. Thus, ). Therefore, we begin with the simulation of .
3.3. Sensitivity Analysis and Investigations for Control Strategies
Firstly, we will estimate the potential infections at the beginning of control. The infected people may get sick after the incubation period, some will visit doctors and will be confirmed. Specifically, there are potential infections on day and infected people would get sick on day t. In view of the asymptomatic, there will be symptomatic patients who will go to hospitals, among which patients are admitted and reported as new confirmed cases. That is, the reported new patients on day t will be
at the beginning of control in Wuhan. Where, is the potential infected persons, is the reported new confirmed cases. p is the proportion of the asymptomatic. is the admission rate of visiting patients. According to a report from Wuhan Municipal Health Commission, about 5 percent of visitors were admitted to hospitals from 22 January to 27 [29]. We suppose in late January. Therefore, the potential infected persons on 22 January can be estimated as 19,600 and it is 21,560 on 23 January. Then, we take 21,560 and on 23 January.
As , then . The quarantine period is 14 days because few people carried the SARS-CoV-2 virus for more than 14 days [24], then the release rate of the uninfected close contacts also is . Because the average hospital stay of discharged patients is 20 days in Wuhan and 9 days in other provinces outside Hubei [30], we suppose the self-healing rate for mild patiebts is and the curative rate of hospitalized patients is . Because the median time from onset of symptoms to death was 18.5 days [9] and the average time for patients from onset to seeing doctors is 5 days [31], then the median hospitalized days of the deaths would be 14. The case fatality in Wuhan is about percent [32], and the death rate of patients in hospitals is .
There were 11.081 million people in Wuhan as of 2018 and there were 119,400 births in 2018 [33], then million and . The average life expectancy is 81 years old in Wuhan, so . We take and because there were 495 cumulative confirmed cases, 31 discharged and 24 deaths as of 23 January in Wuhan. The contacts in Wuhan is because there are 2776 close contacts on 23 January and 549 cumulative confirmed cases as of 23 January in Hubei. Suppose and for the reason that there were 1 to 5 percent of isolated close contacts were confirmed [27].
To sum up, the values of parameters are listed in Table 2.
In this section, we will carry out sensitivity analysis in view of the uncertainty on some parameter values and investigate the effects of some important control measures. Scales of visiting and hospitalized patients represent the epidemic pressure which can be sensed by the public, and number of the latency reflects the infections. Therefore, we mainly simulate evolutions of or in this section. Based on the Runge–Kutta algorithm for numerical solution of differential equations, model (1) is numerically integrated with the help of mathematical software Matlab.
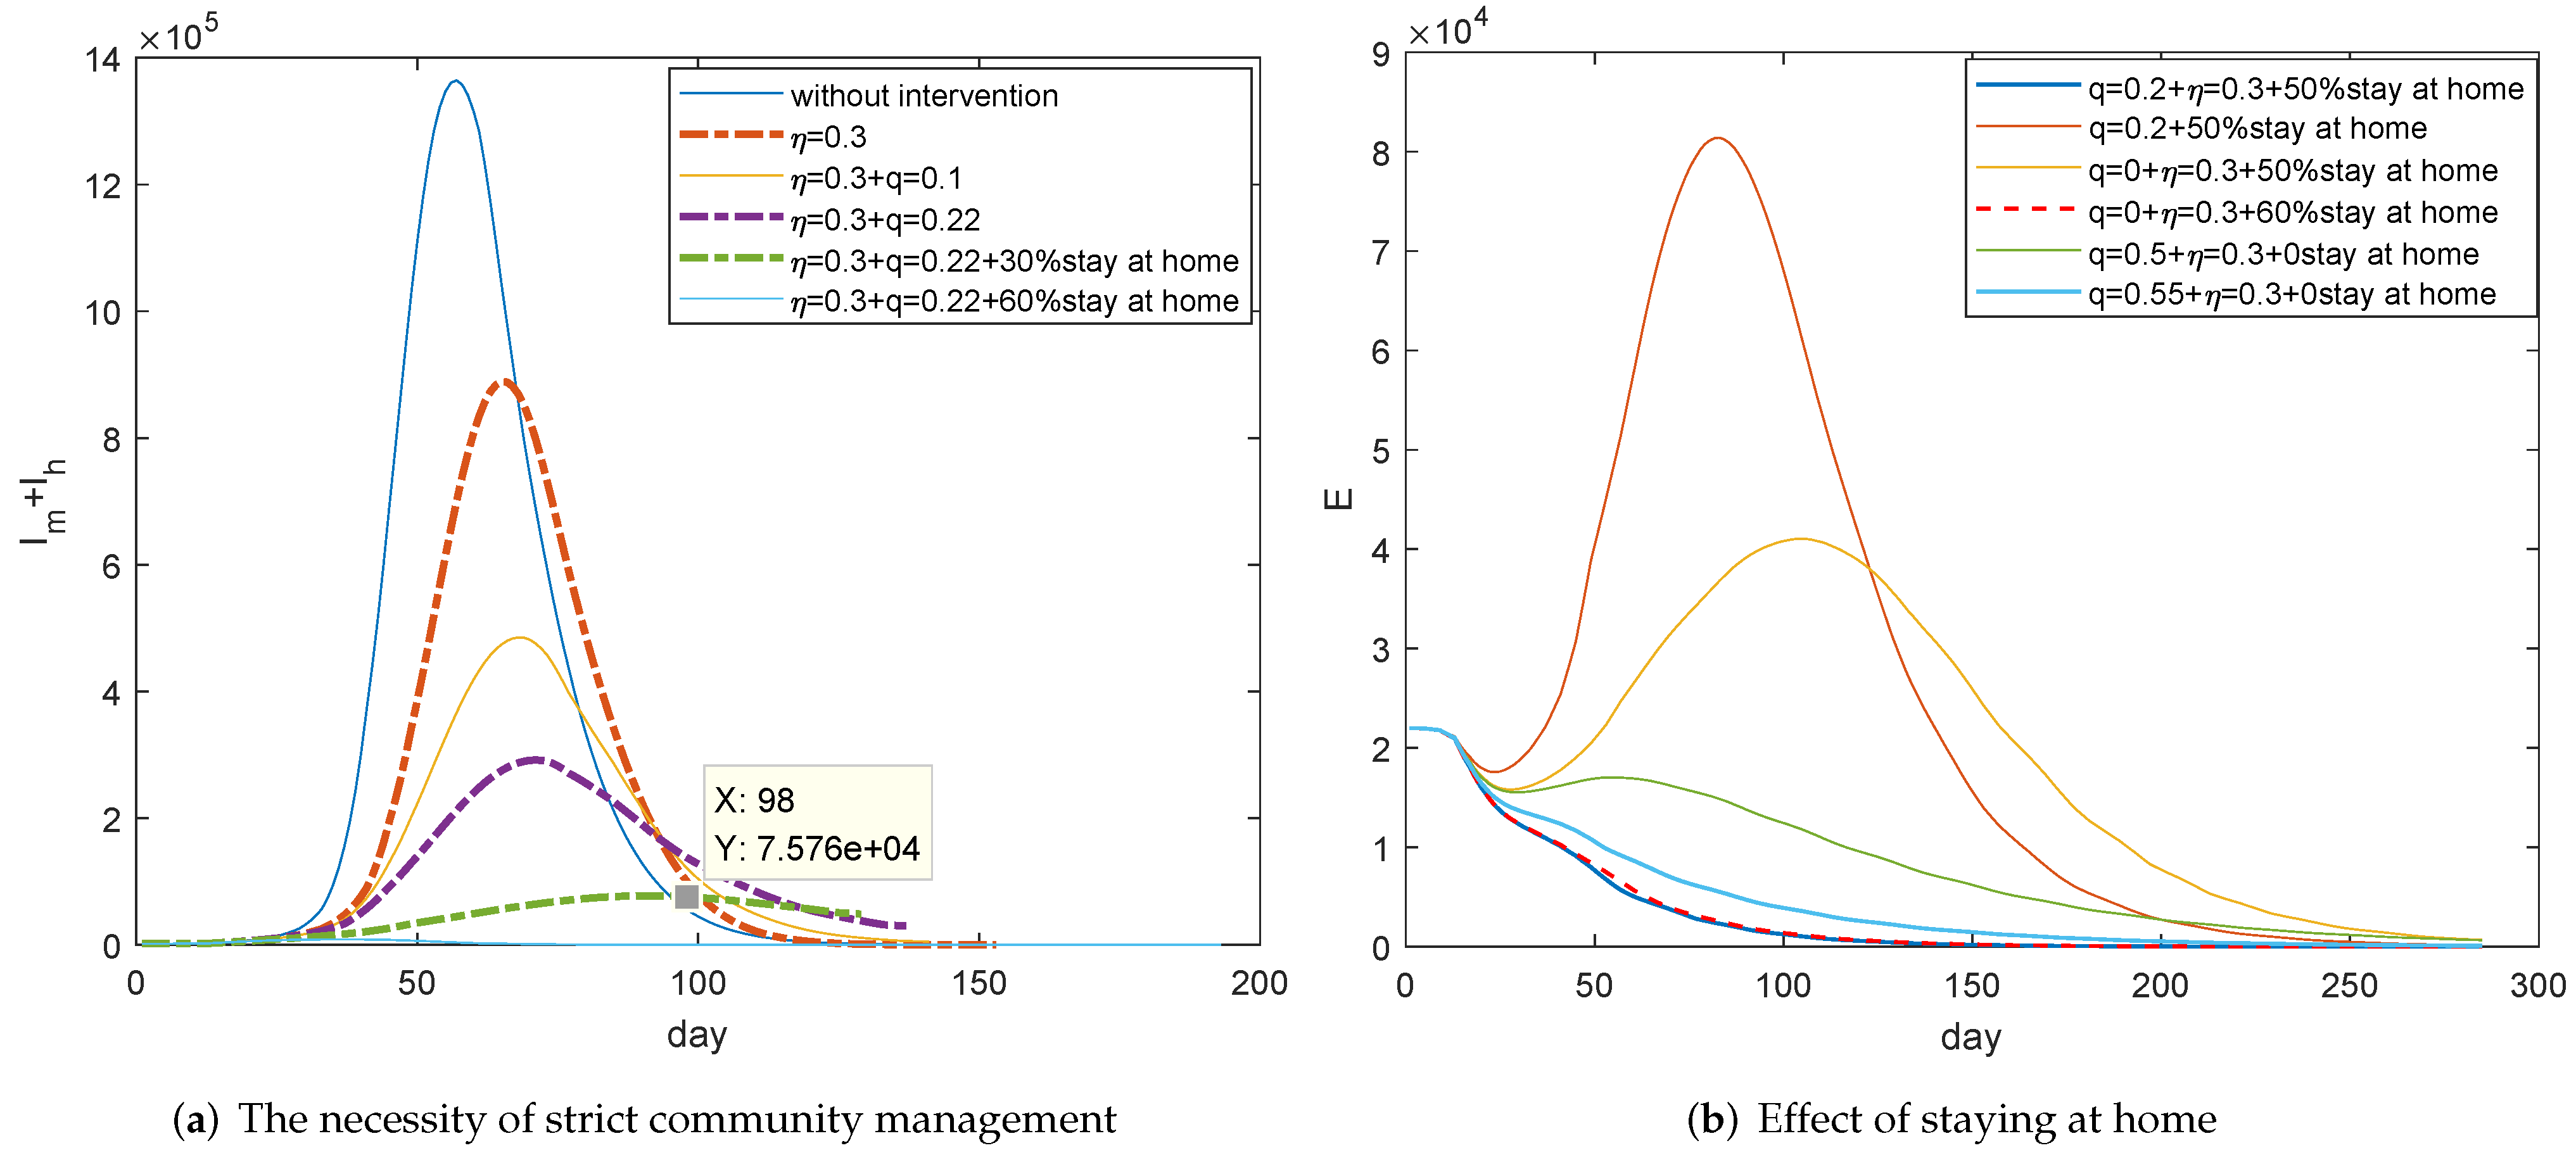
Evolutions of for different control strategies are figured out in Figure 7a. As mentioned above, the decline of contact rate, which is mainly reflected in the half month after the control began, can reduce the incidence rate by 30 percent. At that time, the improvement of awareness which was motivated by information disclosure, risk warning, and prevention guidance played the main role. We can see from Figure 7a that the improved awareness really would decrease about 30 percent of cases (comparing the blue curve with the thick orange dotted curve), but the number of patients is so huge that we can not afford it. With improved awareness and the 22 percent quarantine rate, which is the average tracking ability in Wuhan, it can be seen that the maximum number of cases would be nearly 300,000 (see the thick purple dotted curve) and it is a huge number. If also at least 30 percent people can stay at home, which means the susceptible is reduced, the maximum number would be 70,000 and it should take 7 months to eliminate disease (referring to the thick green dotted curve). Therefore, Wuhan further enforced the strict staying at home managements after 11 February.
Simulations of in Figure 7b further verify that COVID-19 can be controlled quickly with improved awareness and at least 50 percent of people staying at home, in terms of Wuhan’s average effective tracking rate (Blue curve). This is the actual community management measures and the control effect in Wuhan after 11 February. The effect of ultra-strict home management like Wuhan is equivalent to the removal of susceptible people due to vaccination. Let us investigate the spread of COVID-19 if vaccines are available and there is vaccination rate. We can see that the infections would increase dramatically without awareness protection (Orange curve) and it also will be out of control if there is no contact tracking (Yellow curve), even with such vaccination rates. However, more effective tracking and consciousness protection can really work (Green curve) if there is no vaccine or insufficient vaccine.
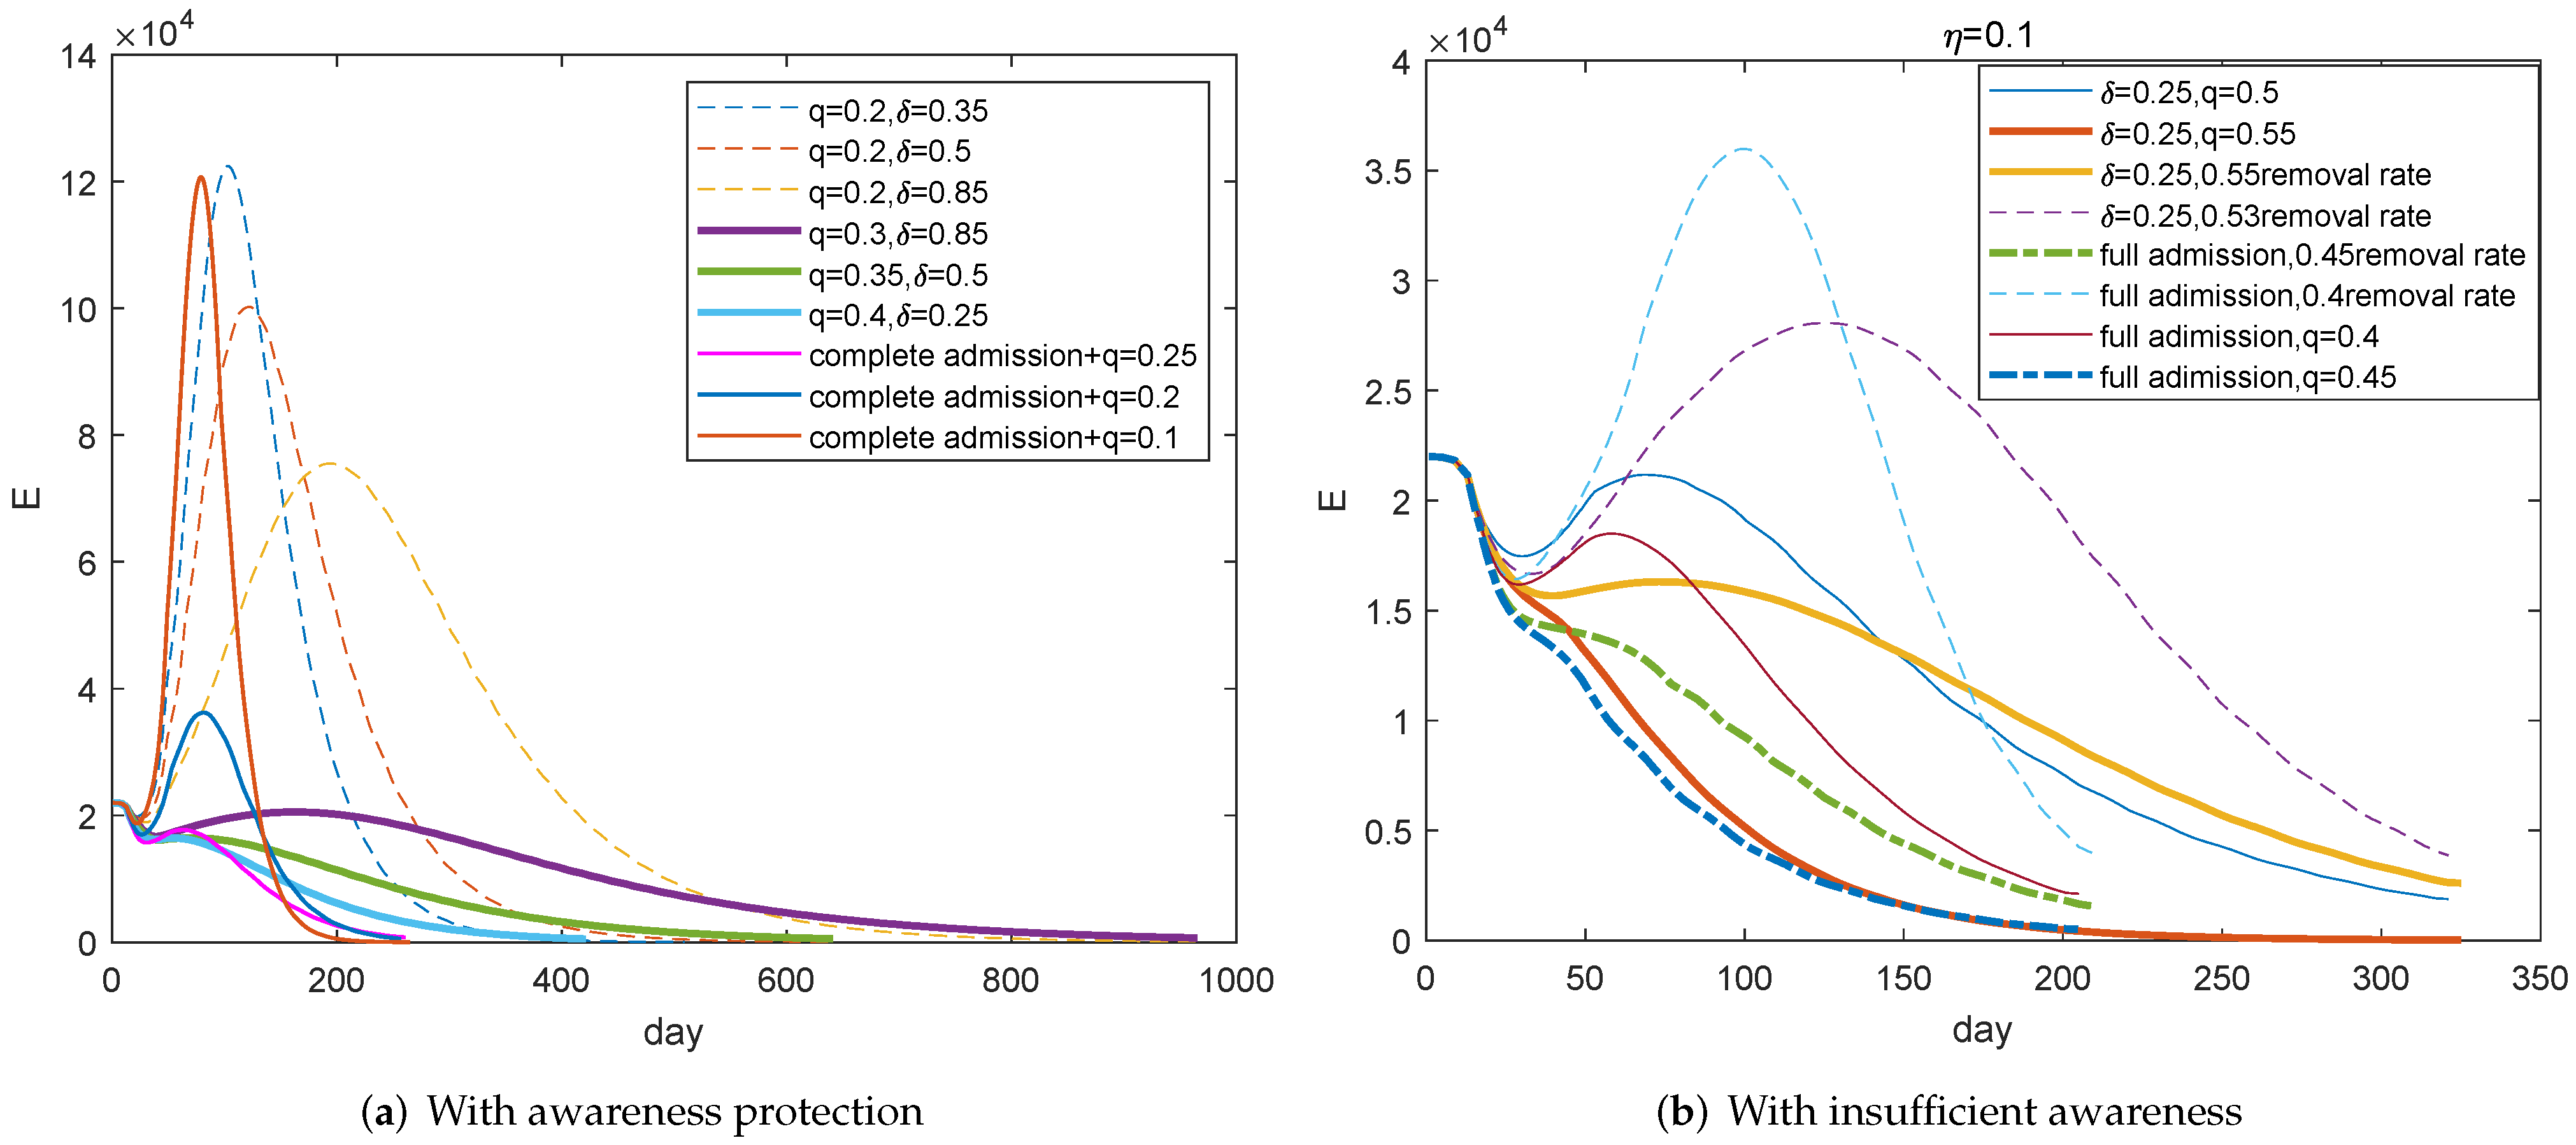
Figure 8 focuses on the possibility of maintaining social and economic activities. Figure 8a simulates the evolution of under the condition of awareness protection and no staying at home. It shows that at least 30 percent contact tracking rate and the improved admission rate can contribute to the control of COVID-19 (Purple, green, and light blue curves) and improved tracking rate can alleviate the burden of admission. However, even if all visiting patients can be admitted to hospitals, less than 20 percent contact tracking rate cannot effectively contain the spread of COVID-19 (The thin orange and blue curves). That is, contact tracking takes priority over admission.
Figure 8b emphasises that there should be a great increase on the tracking rate with an insufficient awareness protection. At least 55 percent tracking rate can play the control role if there is a quarter admission rate (The thick orange curve). The full admission of patients can only slightly relieve the pressure of tracking, and we can see that the required rate should be at least 45 percent. That is, personal awareness protection is the most important by comparing Figure 8a with Figure 8b.
However, compared Figure 8 with Figure 7, we can see that it takes much longer to control the epidemic, which takes 7 months. That is, mobility restriction or vaccination will greatly accelerate the control process, and it is possible to proceed social and economic activities with the enhanced tracking and admission.
According to the above analysis, the epidemic can be controlled under the conditions of 50 percent vaccination with personal awareness protection and certain tracking (), or full admission with personal awareness protection and certain tracking (). Personal protection is necessary, and strengthening tracking can relieve the pressure of hospital admission.
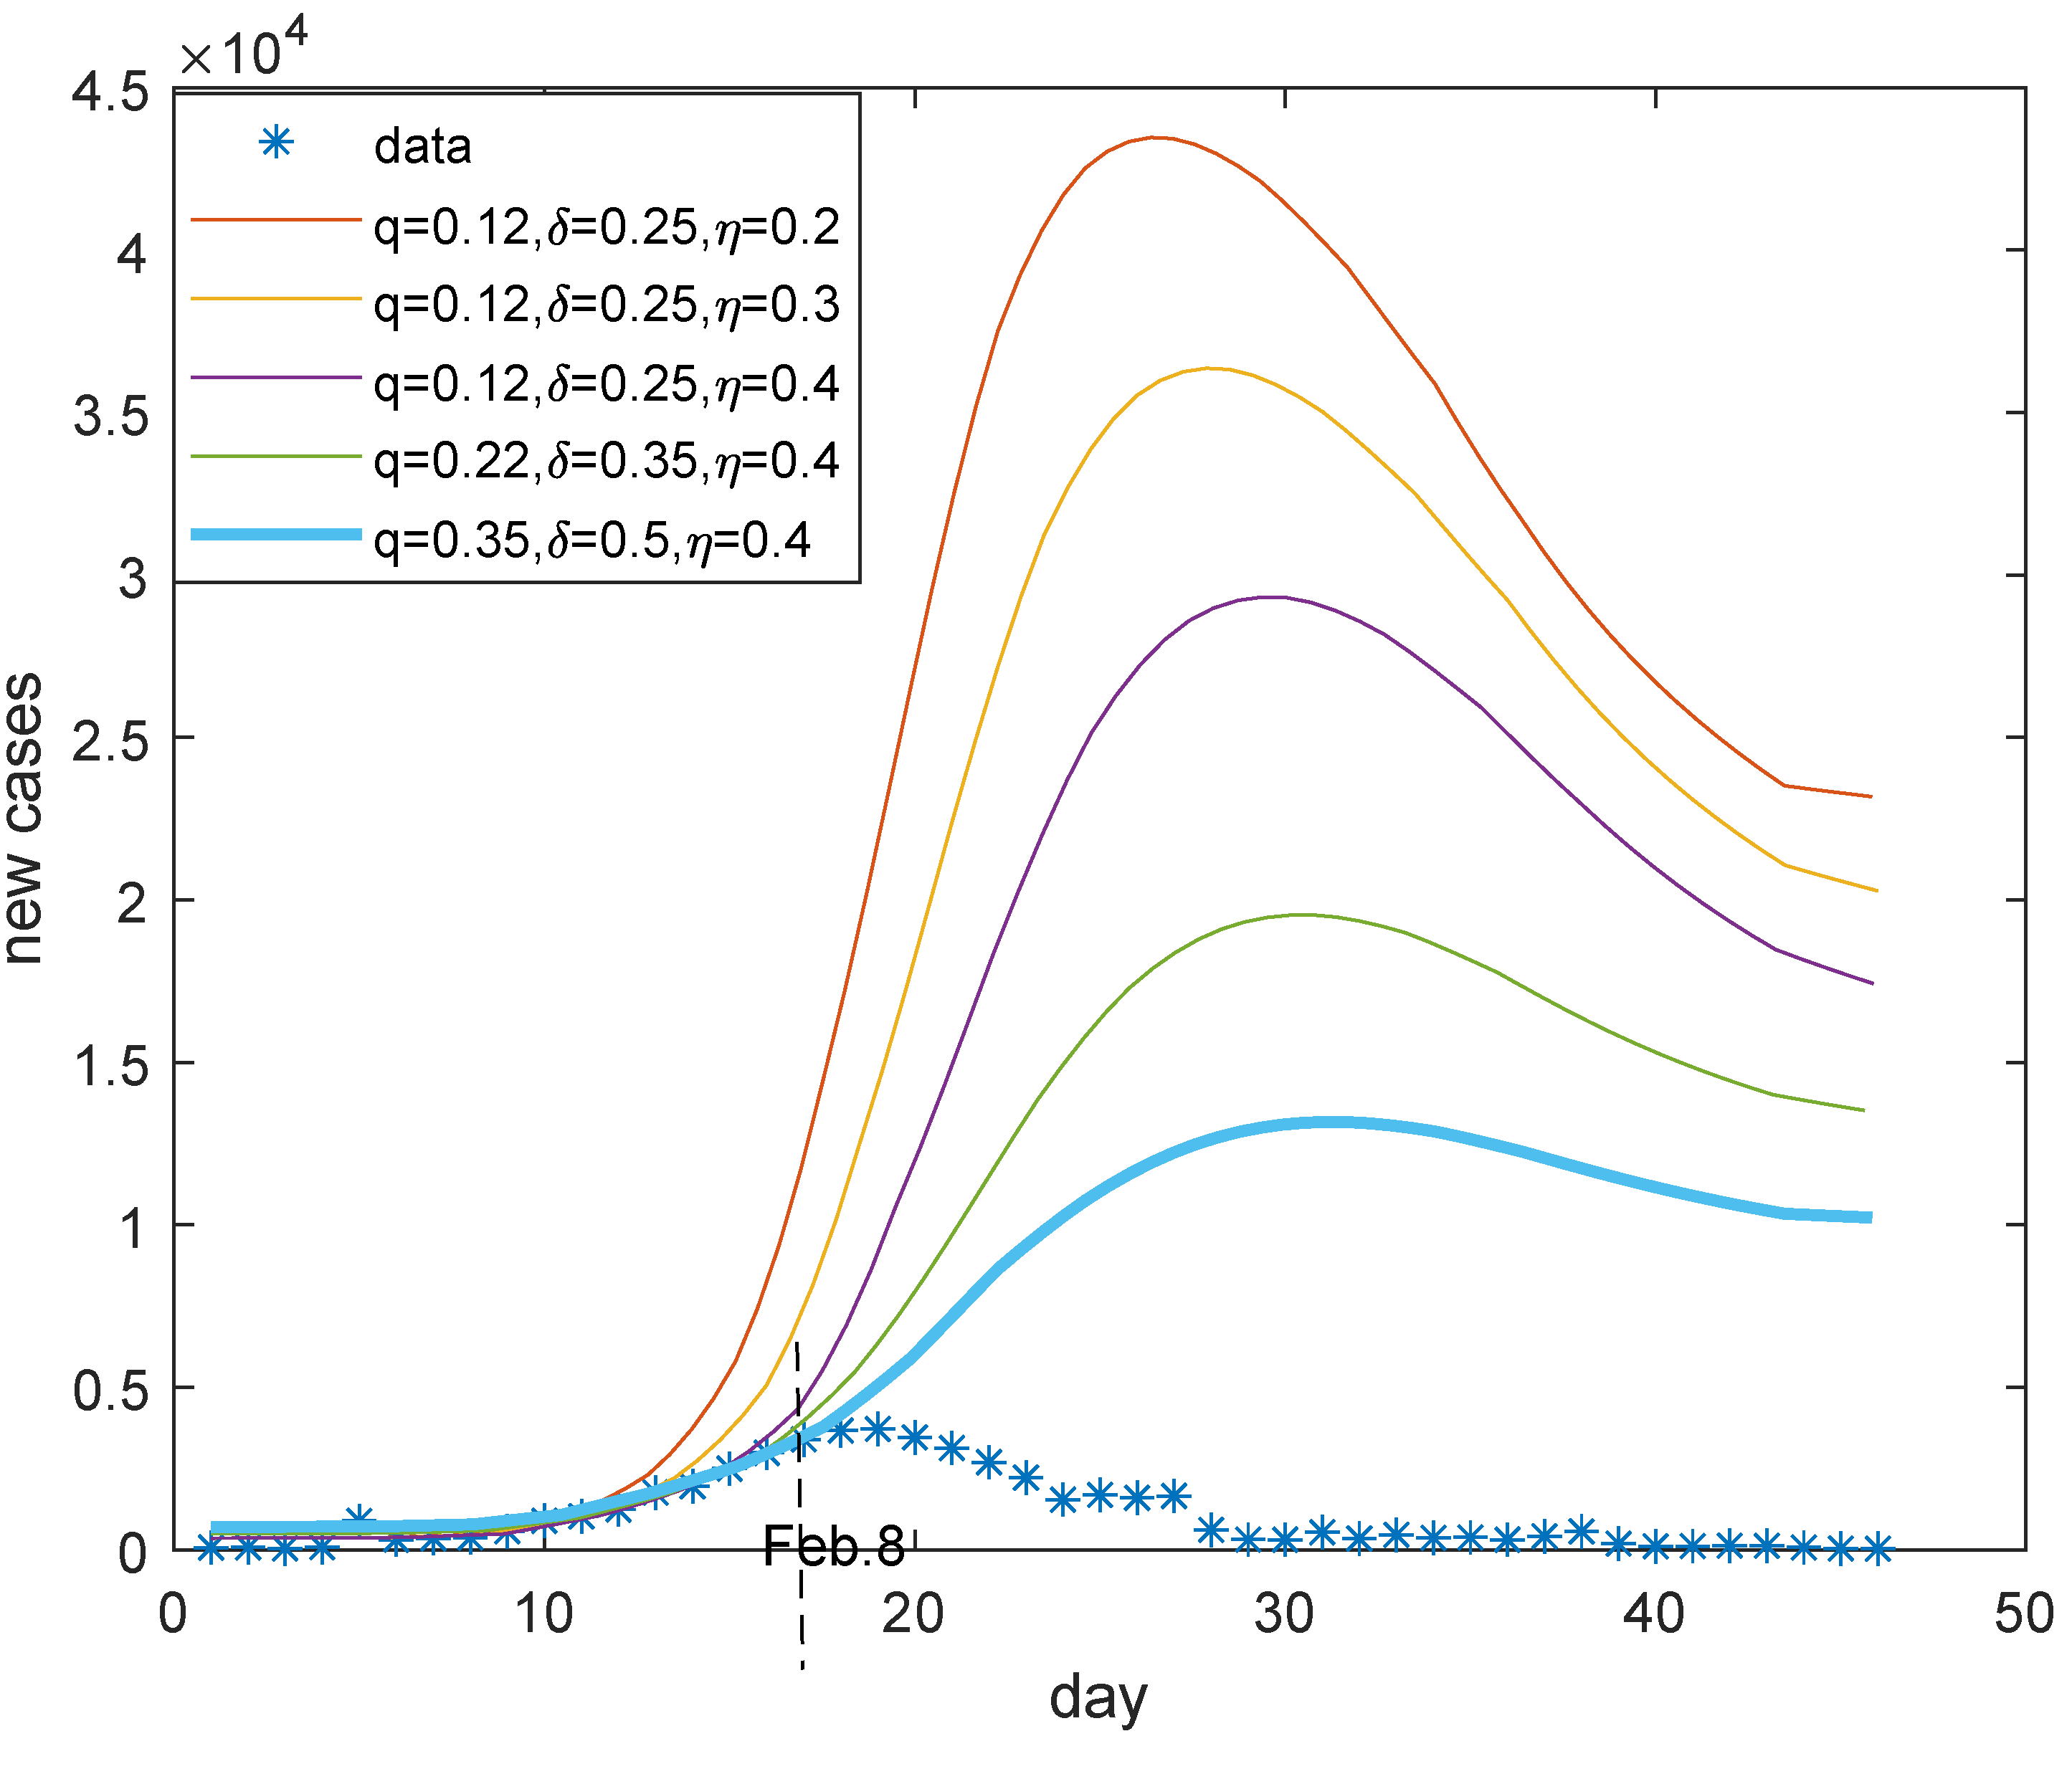
Figure 9 presents the reported new confirmed cases in Wuhan and the possible control measures. Referring to the blue curve in Figure 9, it seems Wuhan may have achieved 35 percent tracking rate, 40 percent incidence decline rate, and 50 percent admission rate in February. In fact, the specially designed Vulcan Mountain Hospital was built and in operation since 4 February [34], the first Ark hospital started operation on 5 February [35], and there were 31 designated hospitals with nearly 10,000 open beds as of 9 February [36]. Then, the further strict staying at home community managements, which began on 11 February [37], enabled the spread of COVID-19 in Wuhan to be contained fundamentally within one month.
3.4. Re-Open
Social and economic activities will restart when the epidemic is under control. In this section, we will discuss the risk and threshold of re-opening. Re-opening means the order of staying at home is cancelled and it is difficult to maintain social distance, so that . It is no problem for the complete admission of new patients since COVID-19 is under control. Thus, also is , we still refer to because of focusing on visiting patients.
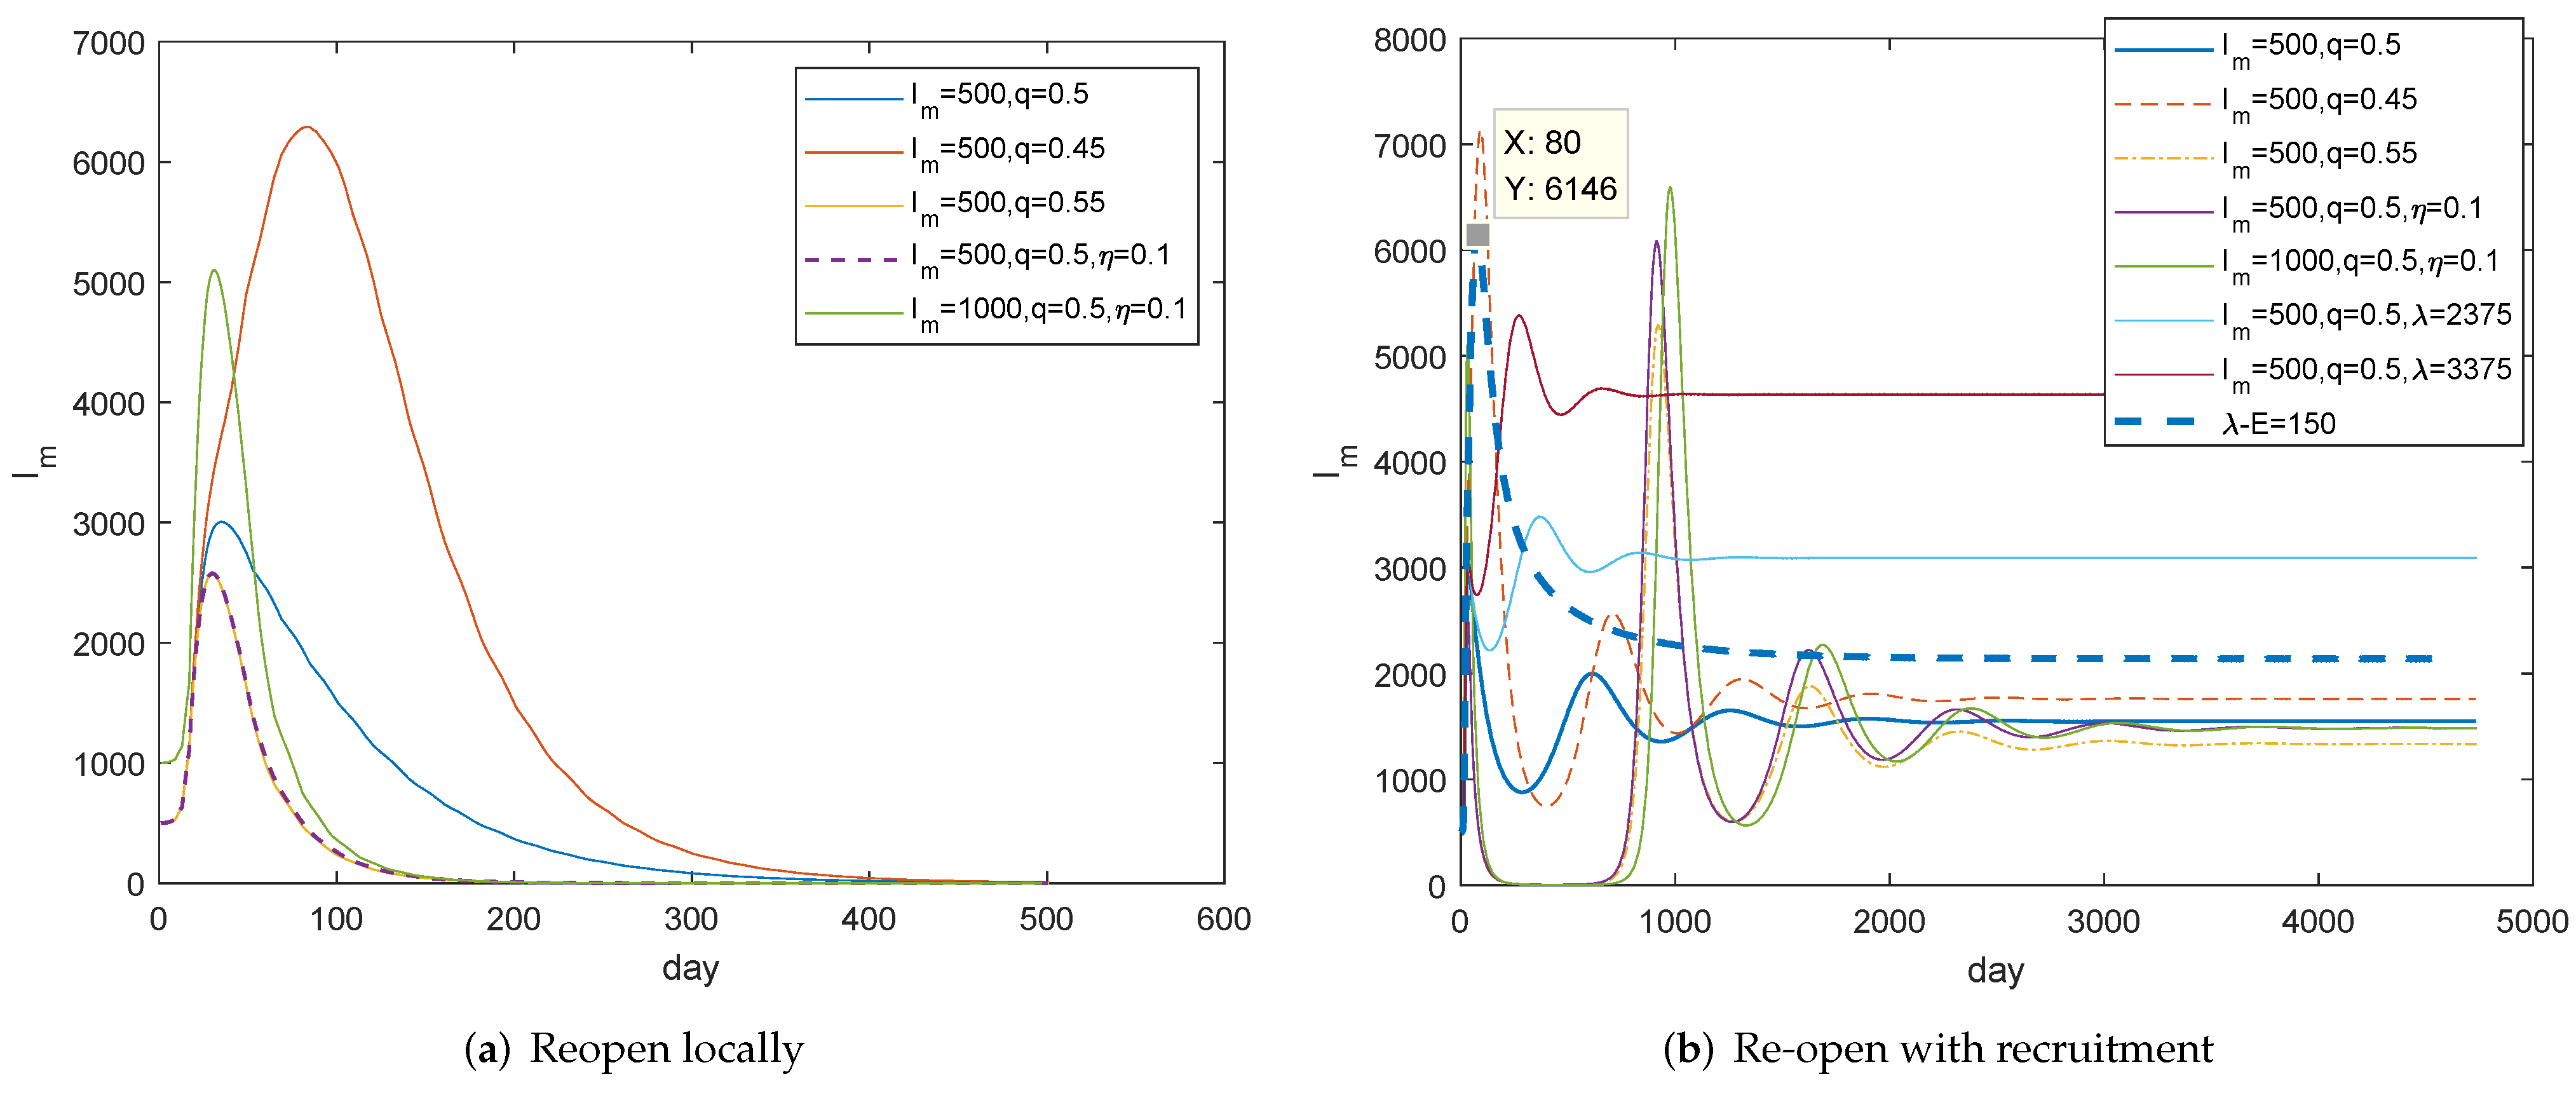
Firstly, we investigate the conditions of locally reopening and model (1) is simulated in the case of . Figure 10a tells us that it is safe to reopen after the daily visiting patients is not more than 500 and we should maintain the contact tracking rate at least 50 percent, comparing the blue curve with the orange curve. In other words, it can be opened if new cases are continuously below 1000 for a few days and when they are less than 500. COVID-19 completely changed people’s lives, we believe the changed concepts and behaviors about social distance and personal hygiene will continue to function to a certain extent, so we still suppose . It can be observed from the purple curve that infections can actually be mitigated, especially in the contribution of shortening the prevalent period compared with the blue curve. That is, the high contact tracking rate is the guarantee of re-opening, and people should be encouraged to adhere to good, safe, and hygienic behaviors.
For the full re-open, there is a recruitment . The long-term dynamic behaviors after reopening are illustrated in Figure 10b. It can be seen that the evolution of is similar to that of in Figure 10a within a year. Figure 10b also shows that small oscillations will occur and trajectories will stabilize eventually, which hints that model (1) has a globally stable positive equilibrium point and the endemic disease will be formed. Notice that the maximum number of visiting patients may be doubled due to the recruitment of latency (The thick blue dotted curve). Therefore, in addition to at least 50 percent tracking rate, the inspection for the recruitment should be enforced for a long time. We believe the health code can largely avoid the recruitment of latency. Health code is already a travel requirement in some countries and regions. This is a constructive measure that should be promoted.
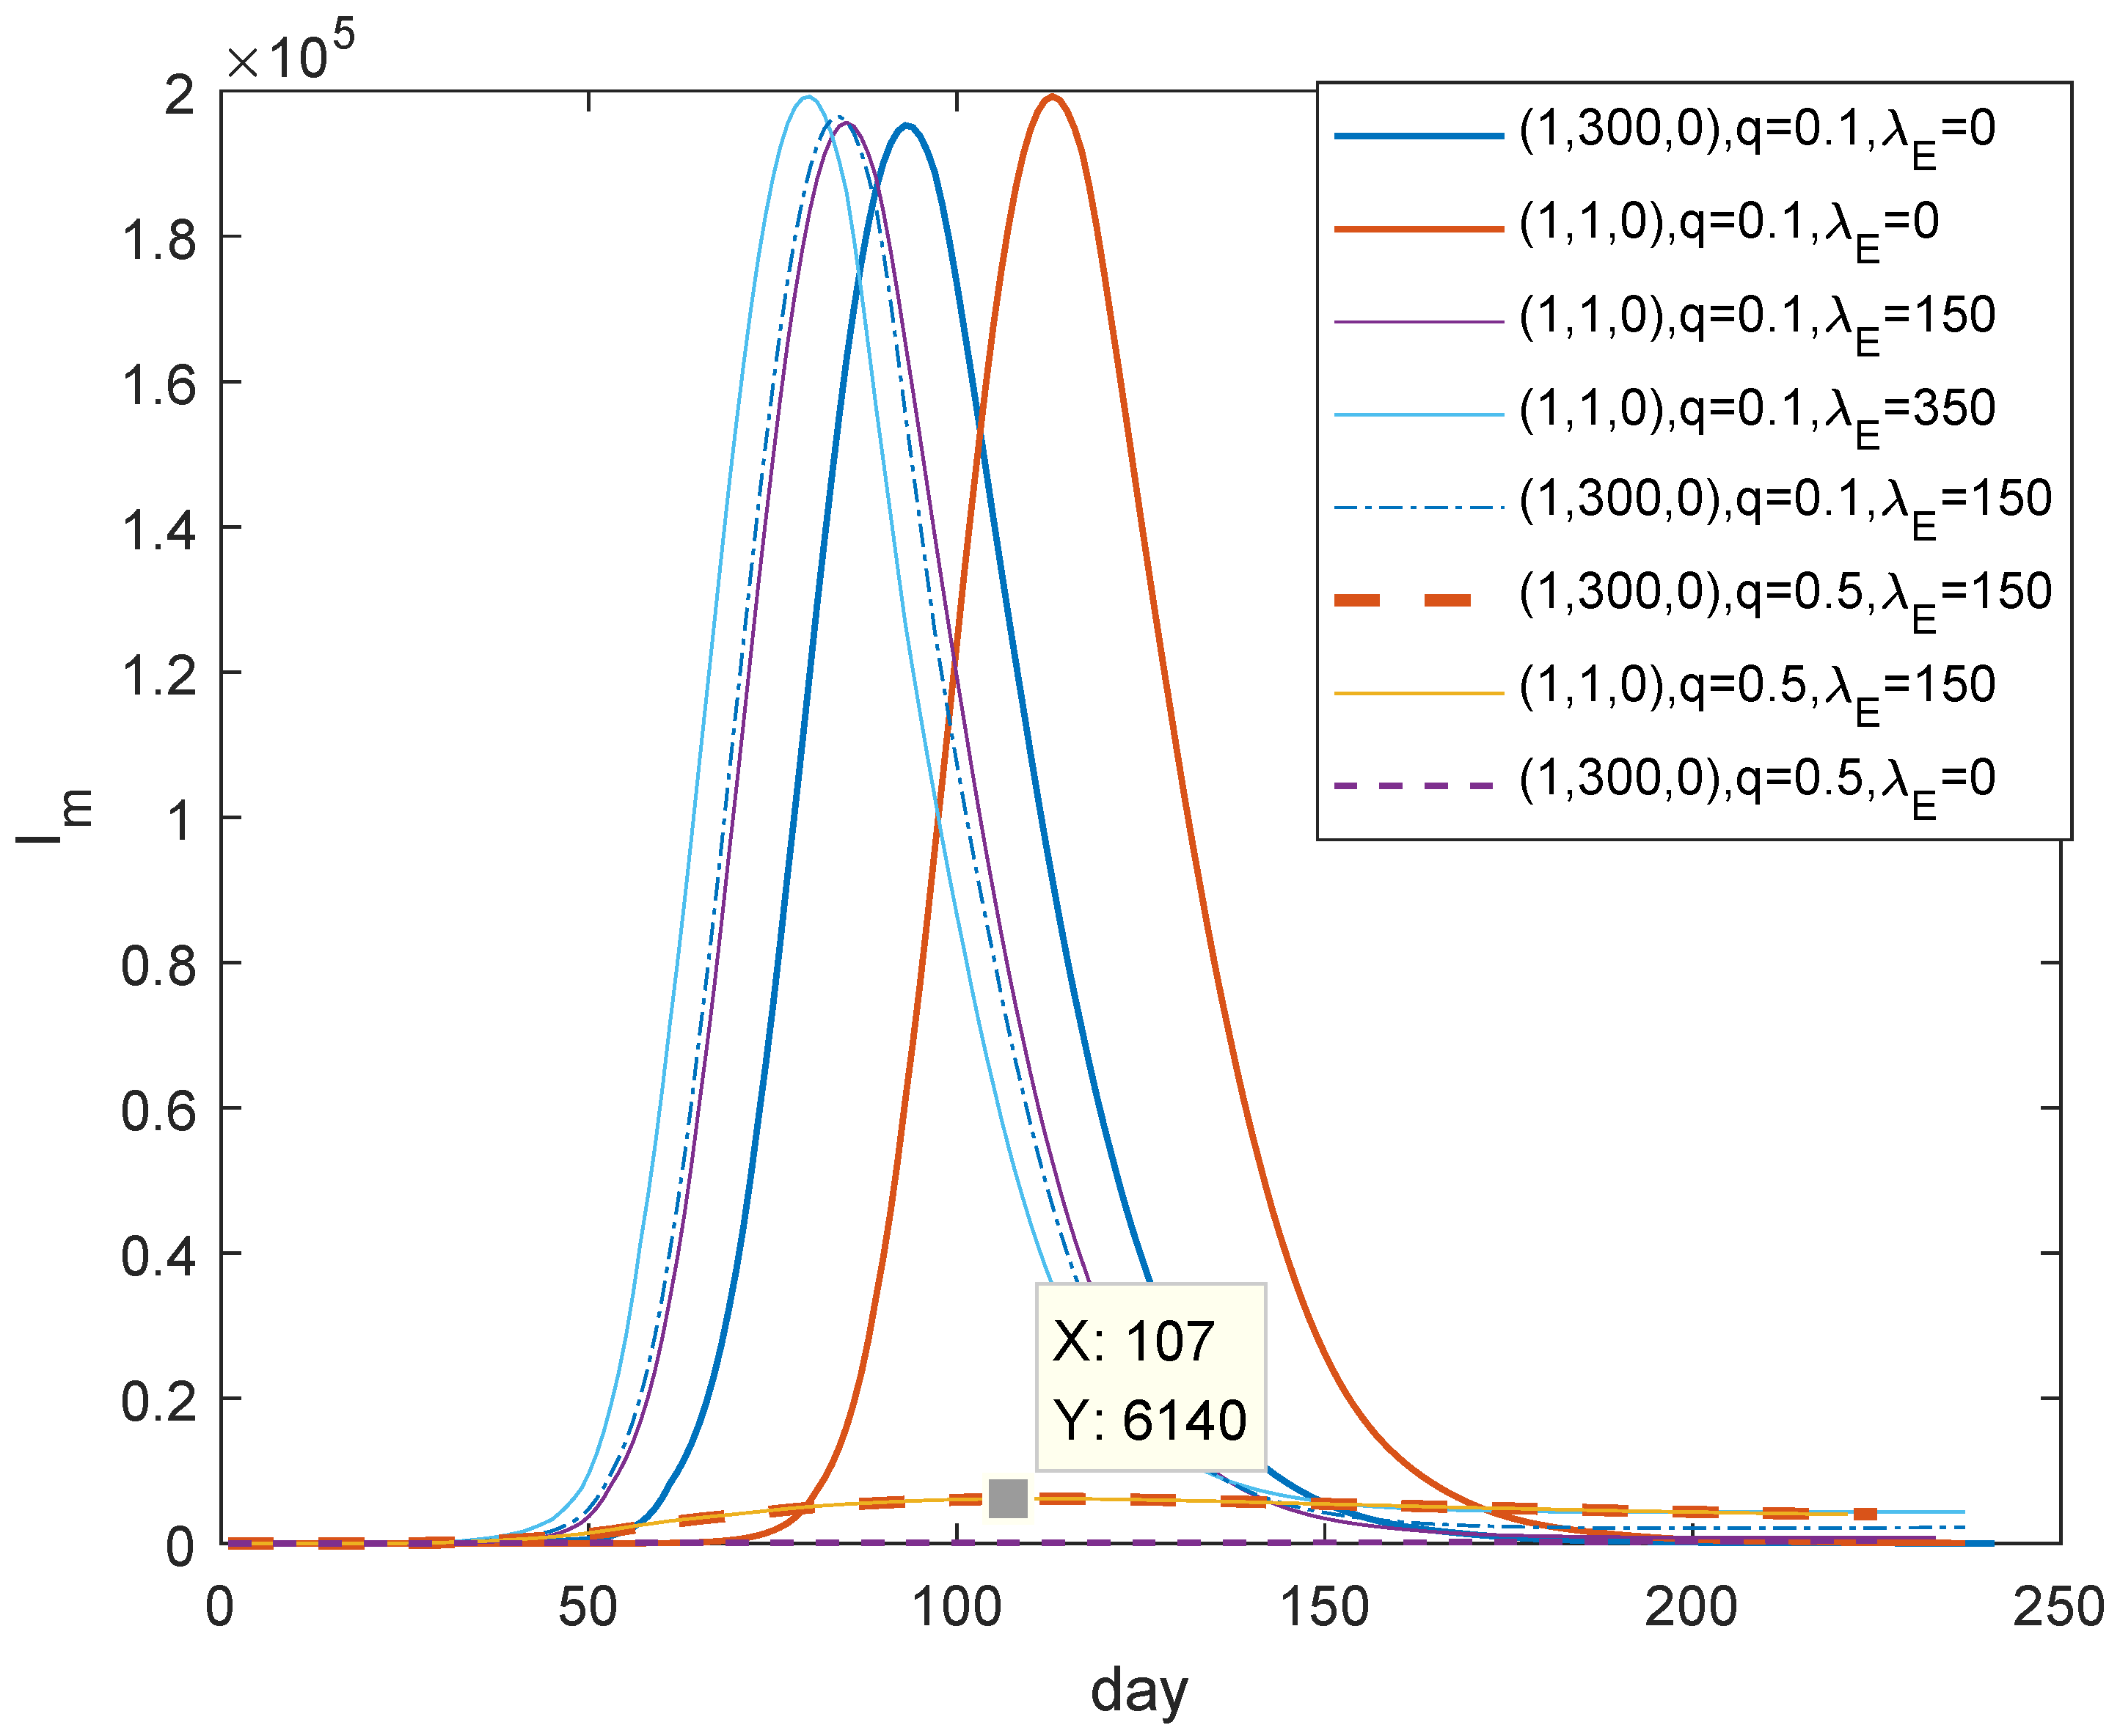
Next, we will illustrate whether the unknown infections will cause the recurrence of COVID-19 after reopening. We can see from Figure 11 that it may develop into a wave of epidemic in three months, even if there is only one latent person (seeing the orange curve for reference). It seems there is almost no difference between one or more asymptomatic people in view of the epidemic. That is, another wave of outbreak is bound to happen and entire testing is very important. However, the recurrence of COVID-19 could be effectively contained with the effective contact tracking, referring to the last three curves. In a word, we should do our best to improve tracking rate so that we can contain the next outbreak.
Theoretically, the disease reproduction number follows
Therefore, the contact tracking rate q is the main regulatory factor after reopening. Of course, contact tracking associated with extensive testing will be more effective because tests will expose more asymptomatic infections, so that there is the lower value of p in Equation (6).
4. Conclusions
COVID-19, caused by a novel SARS-CoV-2 virus, is still spreading around the world. In view of the huge losses and disasters caused by COVID-19, investigations on its spread and control are of great significance. Data-based analysis for the close contacts and the confirmed cases determined the value of incubation period. A mathematical model is established, the disease reproduction number is given out and discussed. Due to the existence of asymptomatic infections, the high probability of COVID-19 pandemic is illustrated by the expression of .
It is obvious that all control measures are aimed at reducing . Thanks to the introduction of Ark hospitals, the inventory is cleared and all patients can be admitted, then follows the Formula (4) instead of (3) and decreases greatly. Therefore, the introduction of Ark hospitals is very important in the control of COVID-19 in Wuhan. We claim the decline of incidence rate is due to awareness protection before 5 February and the spread was eventually contained in late February mainly because of the removal of the susceptible, caused by the strict staying at home managements. Staying at home is necessary for controlling COVID-19 in Wuhan in view of Wuhan’s inadequate contact tracking ability. However, the formula of clearly shows the importance of contact tracking. Parameter’s sensitivity analysis also emphasizes it again.
In the case of re-opening, the main control strategy is also the contact tracking. Discussions for re-opening demonstrate that it is time for a city like Wuhan to reopen after new cases are continuously below 1000 for some days, and when the number is less than 500 with the premise of ensuring the high tracking rate. It will cause another outbreak of COVID-19 even if there is one latent individual, but a high tracking rate associated with the extensive testing can contain the spread quickly.
In short, in view of the high spread of COVID-19, human intervention is very necessary. Vaccines can be expected, but testing, tracking, and awareness protection are essential. Therefore, whether it is the ongoing epidemic or the subsequent re-outbreak, the parallel tracking and testing are the basics to curb the spread. Strengthening information disclosure and health education so that people can protect themselves and reduce exposure will speed up the containment of the epidemic.
It is undeniable that the analytic results have great limitations. The first is the data-based parameter identification. For example, the proportion of the asymptomatic has still been inconclusive until now. In fact, in our hypothesis, the asymptomatic is more inclined to those who will not take the initiative to seek medical treatment because the symptoms are extremely mild, so we think we can take . Secondly, our model is only applicable to the case where extensive testing cannot be implemented. The expanded test will find the asymptomatic part of the latency. Moreover, the tracked close contacts can be detected immediately and will be identified soon. Then, the model structure will be changed and the key of transmission is the undiscovered infected persons. It is very important that the determined parameters are only applicable at the beginning of the epidemic. The real evolution of epidemic in Wuhan is the result of those gradually intensified interventions. Under these interventions, many parameters, such as the admission rate of visiting patients and the removal rate of quarantined persons, are changing, which cannot be expressed by a deterministic system. Therefore, we did not make predictions (in fact, this is a retrospective study after the epidemic was ended in Wuhan) and just analyzed the effectiveness of each intervention and the threshold and conditions for reopening based on the dissemination mechanism and the control measures in Wuhan. As far as the effects of these interventions are concerned, some main results are presented in Table 3 below.
Author Contributions
Formal analysis, Y.C.; Funding acquisition, Y.W. and Y.C.; Data processing, J.S. and S.L.; Writing, Y.C. All authors have read and agreed to the published version of the manuscript.
Funding
The National Natural Science Foundations of China (project no.: 32071892); The Science and Technology Innovation Project of Fujian Agriculture and Forestry University (project no.: CXZX2020135B).
Institutional Review Board Statement
Not applicable.
Informed Consent Statement
Not applicable.
Data Availability Statement
All data utilized in this paper are publicly available. Data and information of COVID-19 are collected from Wuhan Municipal Health Commission, National Health Commission of the People’s Republic of China and World Health Organization.
Acknowledgments
Authors are thankful to the learned reviewers for their useful suggestions and comments. Thanks for Song-Ying Li of University of California, Irvine, for his valuable comments. This work was supported by the National Natural Science Foundations of China (project no.: 32071892) and the Science and Technology Innovation Project of Fujian Agriculture and Forestry University (project no.: CXZX2020135B). And, as a visiting scholar of University of California, Irvine, first author thanks to the Department of Mathematics in the School of Physical Sciences at the University of California, Irvine, for space and hospitality.
Conflicts of Interest
Authors declare that they have no conflicts of interest.
Appendix A
Appendix A.1

Table A1.
The revised cumulative and the corresponding new confirmed cases.
| Date | January 23 | 24 | 25 | 26 | 27 | February 5 | 6 | 7 | 8 | 9 | 10 | 11 | 12 |
|---|---|---|---|---|---|---|---|---|---|---|---|---|---|
| Reported sum | 495 | 572 | 618 | 698 | 1590 | 10,117 | 11,618 | 13,603 | 14,982 | 16,902 | 18,454 | 19,558 | 32,994 |
| Revised sum | 580 | 782 | 1023 | 1294 | 1590 | 11,117 | 14,218 | 17,303 | 20,282 | 23,232 | 26,354 | 29,568 | 33,218 |
| Revised New | 155 | 202 | 241 | 271 | 296 | 2766 | 3101 | 3085 | 2979 | 2950 | 3122 | 3214 | 3650 |
| Reported New | 70 | 77 | 46 | 80 | 892 | 1766 | 1501 | 1985 | 1379 | 1921 | 1552 | 1104 | 13,436 |
Appendix A.2
As mentioned in Introduction, Wuhan had the capability to admit all the visiting patients after 15 February. Therefore, the spread of COVID-19 in Wuhan had changed and model (1) is transformed to model (A1):
References
- World Health Organization (WHO). Home. Diseases. COVID-19. Available online: https://www.who.int/emergencies/diseases/novel-coronavirus-2019 (accessed on 23 November 2021).
- Wuhan Municipal Health Commission. Home. Columns and Topics/Thematic section. Prevention and Control of New Coronavirus Pneumonia. Outbreak Notification. Available online: http://wjw.wuhan.gov.cn/front/web/list3rd/yes/802 (accessed on 23 March 2020).
- Wuhan Municipal Health Commission. Home. Prevention and Control of New Coronavirus Pneumonia. Outbreak Notification. Available online: http://www.nhc.gov.cn/xcs/yqtb/list_gzbd.shtml (accessed on 10 September 2021).
- UN News. Available online: https://news.un.org/zh/story/2020/05/1056402 (accessed on 23 July 2020).
- Beijing Municipal Health Commission. Information of Prevention and Control for COVID-19 in Beijing. Available online: http://wjw.beijing.gov.cn/wjwh/ztzl/xxgzbd/ (accessed on 15 July 2020).
- Ceraolo, C.; Giorgi, F.M. Genomic variance of the 2019-nCoV coronavirus. J. Med Virol. 2020, 92, 522–528. [Google Scholar] [CrossRef] [PubMed] [Green Version]
- Cao, Y.; Li, L.; Feng, Z.; Wan, S.; Huang, P.; Sun, X.; Wen, F.; Huang, X.; Ning, G.; Wang, W. Comparative genetic analysis of the novel coronavirus (2019-nCoV/SARS-CoV-2) receptor ACE2 in different populations. Cell Discov. 2020, 6, 11. [Google Scholar] [CrossRef] [PubMed] [Green Version]
- Zheng, M.; Gao, Y.; Wang, G.; Song, G.; Liu, S.; Sun, D.; Tian, Z. Functional exhaustion of antiviral lymphocytes in COVID-19 patients. Cell. Mol. Immunol. 2020, 17, 533–535. [Google Scholar] [CrossRef] [PubMed] [Green Version]
- Zhou, F.; Yu, T.; Du, R.; Fan, G.; Liu, Y.; Liu, Z.; Xiang, J.; Wang, Y.; Song, B.; Cao, B.; et al. Clinical course and risk factors for mortality of adult inpatients with COVID-19 in Wuhan, China: A retrospective cohort study. Lancet 2020, 395, 1054–1062. [Google Scholar] [CrossRef]
- De Luca, G.; Cavalli, G.; Campochiaro, C.; Della-Torre, E.; Angelillo, P.; Tomelleri, A.; Dagna, L. GM-CSF blockade with mavrilimumab in severe COVID-19 pneumonia and systemic hyperinflammation: A single-centre, prospective cohort study. Lancet 2020, in press. [Google Scholar] [CrossRef]
- Pollán, M.; Pérez-Gómez, B.; Pastor-Barriuso, R.; Oteo, J.; Hernán, M.A.; Pérez-Olmeda, M.; de la Villa, A.V. Prevalence of SARS-CoV-2 in Spain (ENE-COVID): A nationwide, population-based seroepidemiological study. Lancet 2020, in press. [Google Scholar] [CrossRef]
- Lavezzo, E.; Franchin, E.; Ciavarella, C.; Cuomo-Dannenburg, G.; Barzon, L.; Del Vecchio, C.; Rossi, L.; Manganelli, R.; Loregian, A.; Navarin, N.; et al. Suppression of a SARS-CoV-2 outbreak in the Italian municipality of Vo’. Nature 2020, 584, 425–429. [Google Scholar] [CrossRef] [PubMed]
- Kucharski, A.J.; Klepac, P.; Conlan, A.J.; Kissler, S.M.; Tang, M.L.; Fry, H.; Gog, J.R.; Edmunds, J. Effectiveness of isolation, testing, contact tracing, and physical distancing on reducing transmission of SARS-CoV-2 in different settings: A mathematical modelling study. Lancet Infect. Dis. 2020, 20, 1151–1160. [Google Scholar] [CrossRef]
- Davies, N.G.; Kucharski, A.J.; Eggo, R.M.; Gimma, A.; Edmunds, W.J.; Jombart, T.; Liu, Y. Effects of non-pharmaceutical interventions on COVID-19 cases, deaths, and demand for hospital services in the UK: A modelling study. Lancet Public Health 2020, 5, e375–e385. [Google Scholar] [CrossRef]
- Li, R.; Pei, S.; Chen, B.; Song, Y.; Zhang, T.; Yang, W.; Shaman, J. Substantial undocumented infection facilitates the rapid dissemination of novel coronavirus (SARS-CoV-2). Science 2020, 368, 489–493. [Google Scholar] [CrossRef] [PubMed] [Green Version]
- Aboelkassem, Y. COVID-19 pandemic: A Hill type mathematical model predicts the US death number and the reopening date. medRxiv 2020. [Google Scholar] [CrossRef]
- Wuhan Municipal Health Commission. Home. Columns and Topics. Thematic Section. Prevention and Control of New Coronavirus Pneumonia/Notice. Available online: http://wjw.wuhan.gov.cn/front/web/showDetail/2020021309543 (accessed on 25 April 2020).
- Wuhan Municipal Health Commission. Home. Columns and Topics. Thematic Section. Prevention and Control of New Coronavirus Pneumonia/Notice. Available online: http://wjw.wuhan.gov.cn/ztzl_28/fk/yqtb (accessed on 25 April 2020).
- Xiaogan: Nucleic acid Detection of All Left-Observing and Close Contacts. Available online: http://hb.sina.cn/news/2020-02-23/detail-iimxyqvz5082800.d.html (accessed on 23 May 2020).
- BBC News. Chinese, Pneumonia Outbreak. Does Asymptomatic Infection Cause a Second Major Outbreak? Available online: https://www.bbc.com/zhongwen/simp/chinese-news-52016649 (accessed on 29 March 2020).
- World Health Organization (WHO). Available online: https://www.who.int/dg/speeches/detail/who-director-general-s-opening-remarks-at-the-media-briefing-on-covid-19—20-march-2020 (accessed on 22 March 2020).
- Chinese Disease Control Expert: New Coronary Pneumonia Patients have been Contagious Two Days before Onset. Available online: https://m.chinanews.com/wap/detail/zw/gn/2020/02-22/9100652.shtml (accessed on 22 February 2020).
- van den Driessche, P.; Watmough, J. Reproduction numbers and sub-threshold endemic equilibria for compartmental models of disease transmission. Math. Biosci. 2002, 180, 29–48. [Google Scholar] [CrossRef]
- Biological Exploration-Observation. How Contagious Are Asymptomatic People? The Latest Judgment of Academician Zhong Nanshan. Available online: http://m.biodiscover.com/news/celebrity/736251.html (accessed on 8 April 2020).
- Diekmann, O.; Heesterbeek, J.A.P.; Metz, J.A. On the definition and the computation of the basic reproduction ratio R0 in models for infectious diseases in heterogeneous populations. J. Math. Biol. 1990, 28, 365–382. [Google Scholar] [CrossRef] [PubMed] [Green Version]
- Tang, B.; Wang, X.; Li, Q.; Bragazzi, N.L.; Tang, S.; Xiao, Y.; Wu, J. Estimation of the Transmission Risk of the 2019-nCoV and Its Implication for Public Health Interventions. J. Clin. Med. 2020, 9, 462. [Google Scholar] [CrossRef] [Green Version]
- www.news.cn.Text. Where Do the Hundreds of Newly Diagnosed Cases in Wuhan Come From? Available online: http://www.xinhuanet.com/2020-03/01/c_1125648220.htm (accessed on 15 April 2020).
- National Bureau of Statistics of China. Available online: http://www.stats.gov.cn/tjsj/zxfb/202001/t20200119_1723767.html (accessed on 6 June 2020).
- Sina. SinaNews. Demostic. The Main Battlefield of the Epidemic: 48 Days of Designated Hospitals in Wuhan. Available online: https://news.sina.cn/gn/2020-03-09/detail-iimxxstf7625588.d.html?pos=108vt=4 (accessed on 15 April 2020).
- www.news.cn:Politics/Text, The Average Hospitalized Patients in China Was more than 9 Days, and the Average in Hubei Province Was 20 Days. Available online: http://www.xinhuanet.com/politics/2020-02/04/c_1125530818.htm (accessed on 29 March 2020).
- Expert Group on Prevention and Control of New Coronavirus Pneumonia of Chinese Preventive Medicine Association; Chinese Preventive Medicine Association. New understanding of epidemiological characteristics of new coronavirus pneumonia. Chin. J. Epidemiol. 2020, 41, 139–144. [Google Scholar]
- Wuhan Municipal Health Commission. Home. Columns and Topics. Thematic Section. Prevention and Control of New Coronavirus Pneumonia. Outbreak Notification. Available online: http://wjw.wuhan.gov.cn/front/web/showDetail/2020020909483 (accessed on 29 March 2020).
- TJJ.WUHAN.GOV.CN. Home. Statistical Services. Statistical Products. Statistical Bulletins. Available online: http://tjj.wuhan.gov.cn/details.aspx?id=4368 (accessed on 26 March 2020).
- Wuhan Municipal Health Commission. Home. Columns and Topics. Thematic Section. Prevention and Control of New Coronavirus Pneumonia. Prevention and Control Dynamics. Available online: http://wjw.wuhan.gov.cn/front/web/showDetail/2020020509410 (accessed on 23 March 2020).
- Wuhan Municipal Health Commission. Home. Columns and Topics. Thematic Section. Prevention and Control of New Coronavirus Pneumonia. Prevention and Control Dynamics. Available online: http://wjw.wuhan.gov.cn/front/web/showDetail/2020031110051 (accessed on 15 April 2020).
- Wuhan Municipal Health Commission. Home. Columns and Topics. Thematic Section. Prevention and Control of New Coronavirus Pneumonia. Notice. Available online: http://wjw.wuhan.gov.cn/ztzl_28/fk/tzgg/202004/t20200430_1197153.shtml (accessed on 26 March 2020).
- Wuhan Municipal Health Commission. Home. Columns and Topics. Thematic section. Prevention and Control of New Coronavirus Pneumonia. Notice. Available online: http://wjw.wuhan.gov.cn/ztzl_28/fk/tzgg/202004/t20200430_1197130.shtml (accessed on 26 March 2020).
Figure 1.
Data revision. Data from 23 January to 27 January and from 5 February to 11 February are revised for the reason of the abnormal increased data on 27 January and 12 February.
Figure 1.
Data revision. Data from 23 January to 27 January and from 5 February to 11 February are revised for the reason of the abnormal increased data on 27 January and 12 February.

Figure 2.
Investigations on close contacts and confirmed cases. (a) There is a similar evolution trend in the number of new confirmed cases and that of new tracked close contacts. (b) There is a maximum growth in the number of new confirmed cases at which is 6 days behind A. A corresponds to the maximum growth in the number of new tracked close contacts.

Figure 3.
Transmission mechanism.

Figure 4.
Investigations on the basic reproduction number. It is almost certain that with the insufficient medical capacity, which means COVID-19 will definitely be popular. It will still be popular with a high probability even if all patients can be admitted to hospitals, although the probability is reduced. (a) With insufficient medical capacity. (b) With complete admission.

Figure 5.
Contact infections decreased with interventions. (a) It can be seen that the ratio of cumulative tracked contacts to confirmed cases significantly decreased within half a month. (b) The incidence rate would be reduced by 30 percent in January.
Figure 5.
Contact infections decreased with interventions. (a) It can be seen that the ratio of cumulative tracked contacts to confirmed cases significantly decreased within half a month. (b) The incidence rate would be reduced by 30 percent in January.

Figure 6.
Investigations on curves of with interventions. (a) It is possible to keep COVID-19 under control with the ordinary mobility restrictions and medical capacity if the effective tracking rate can reach . (b) In the case of , with the increased and the decreased can gain .
Figure 6.
Investigations on curves of with interventions. (a) It is possible to keep COVID-19 under control with the ordinary mobility restrictions and medical capacity if the effective tracking rate can reach . (b) In the case of , with the increased and the decreased can gain .

Figure 7.
Investigations on the effect of staying at home management in Wuhan. (a) It needs at least 30 percent removal rate and 22 percent tracking rate with improved awareness to contain the spread. (b) 50 percent removal rate and 22 percent tracking rate with improved awareness can eradicate the epidemic soon. COVID-19 also can be controlled with awareness protection and at least 50 percent tracking rate.

Figure 8.
The possibility of maintaining normal social activities. (a) With awareness protection, at least 30 percent tracking rate and improved admission rate can play the role of controlling COVID-19 in purpose of maintaining social activities. (b) With insufficient awareness protection, a quarter admission rate and at least 55 percent tracking rate can play the the effective control role.

Figure 9.
Effect of control measures in Wuhan. The increased contact tracking rate q, the strengthened incidence decline rate , and the improved admission rate obviously reduce infections and enable people to control COVID-19 in Wuhan.
Figure 9.
Effect of control measures in Wuhan. The increased contact tracking rate q, the strengthened incidence decline rate , and the improved admission rate obviously reduce infections and enable people to control COVID-19 in Wuhan.

Figure 10.
Investigations for re-open. (a) With at least 50 percent contact tracking rate, it is the time to reopen if the daily visiting patients are around 500 continuously. (b) Compared with (a), and are still the conditions for re-open. However, an endemic disease will form due to the recruitment. The first five curves correspond to .

Figure 11.
Recurrence for the existence of undiscovered infected persons. After reopening, the recurrence is inevitable if there is an unexposed infected individual. The improved tracking rate can contribute to contain the next outbreak. Upper mark of denotes the initial value of .
Figure 11.
Recurrence for the existence of undiscovered infected persons. After reopening, the recurrence is inevitable if there is an unexposed infected individual. The improved tracking rate can contribute to contain the next outbreak. Upper mark of denotes the initial value of .

Table 1.
Symbol Description.
| Symbol | Description | Symbols | Description |
|---|---|---|---|
| The susceptible | Coefficient of the contact infection rate | ||
| Not tracked latency | Coefficient of the contact but not infected rate | ||
| The asymptomatic | c | Release rate of quarantined close contacts | |
| Not admitted patients | Decline rate of incidence | ||
| Hospitalized patients | Conversion rate of latency | ||
| Quarantined infected contacts | p | Proportion of the asymptomatic | |
| Quarantined uninfected contacts | Admission rate of visiting patients | ||
| The recovered | Self-healing rate of the asymptomatic | ||
| Proportion of the infectious latency | Self-healing rate of mildly infected individuals | ||
| The recruitment rate | Curative rate of patients in hospitals | ||
| q | The effective tracking rate | Death rate of patients | |
| m | Disease incubation period | d | Natural death rate |
Table 2.
Parameters and values.
| Parameter | Description | Value | Source |
|---|---|---|---|
| Coefficient of the contact infection rate | Calculated | ||
| Coefficient of the contact but not infected rate | Calculated | ||
| c | Release rate of quarantined close contacts | 1/14 | [24] |
| Conversion rate of latency | 1/7 | Definition | |
| p | Proportion of the asymptomatic | 0.5 | [20] |
| Admission rate of visiting patients | 0.05 | [29] | |
| Self-healing rate of the asymptomatic | 1/7 | [24] | |
| Proportion of the infectious latency | 2/7 | [22] | |
| Self-healing rate of mildly infected individuals | 1/9 | [30] | |
| The recruitment rate | 375 | [33] | |
| Curative rate of patients in hospitals | 1/20 | [30] | |
| q | The effective tracking rate | 0.22 | Calculated |
| d | Natural death rate | 0.0000338 | Calculated |
| Death rate of patients | 0.00289 | [9,32] |
Table 3.
Conditions and control results.
| Conditions | Results | Reference | in Equation (3) |
|---|---|---|---|
| vaccination+no awareness protection | out of control | Figure 7b | 1.267 |
| vaccination + no tracking | out of control | Figure 7b | 1.585 |
| vaccination + awareness protection + certain tracking (q = 20%) | under control | Figure 7b | 0.887 |
| awareness protection + full admission + certain tracking (q = 20%) | under control | Figure 8a | 0.98 |
| awareness protection + more admission + increasing tracking | under control | Figure 8a | <1 |
| awareness protection + full admission + no tracking | out of control | Figure 8a | 1.4 |
Publisher’s Note: MDPI stays neutral with regard to jurisdictional claims in published maps and institutional affiliations. |
© 2021 by the authors. Licensee MDPI, Basel, Switzerland. This article is an open access article distributed under the terms and conditions of the Creative Commons Attribution (CC BY) license (https://creativecommons.org/licenses/by/4.0/).
Share and Cite
MDPI and ACS Style
Chen, Y.; Shen, J.; Li, S.; Wen, Y. Investigations on the Control of COVID-19 and Suggestions for Re-Open Based on Model Study. Mathematics 2022, 10, 22. https://doi.org/10.3390/math10010022
AMA Style
Chen Y, Shen J, Li S, Wen Y. Investigations on the Control of COVID-19 and Suggestions for Re-Open Based on Model Study. Mathematics. 2022; 10(1):22. https://doi.org/10.3390/math10010022
Chicago/Turabian StyleChen, Yongxue, Jiayu Shen, Shijing Li, and Yongxian Wen. 2022. "Investigations on the Control of COVID-19 and Suggestions for Re-Open Based on Model Study" Mathematics 10, no. 1: 22. https://doi.org/10.3390/math10010022
Note that from the first issue of 2016, this journal uses article numbers instead of page numbers. See further details here.