
Cluster Observation of Ion Outflow in Middle Altitude LLBL/Cusp from Different Origins

 , , , ,
Abstract
:1. Introduction
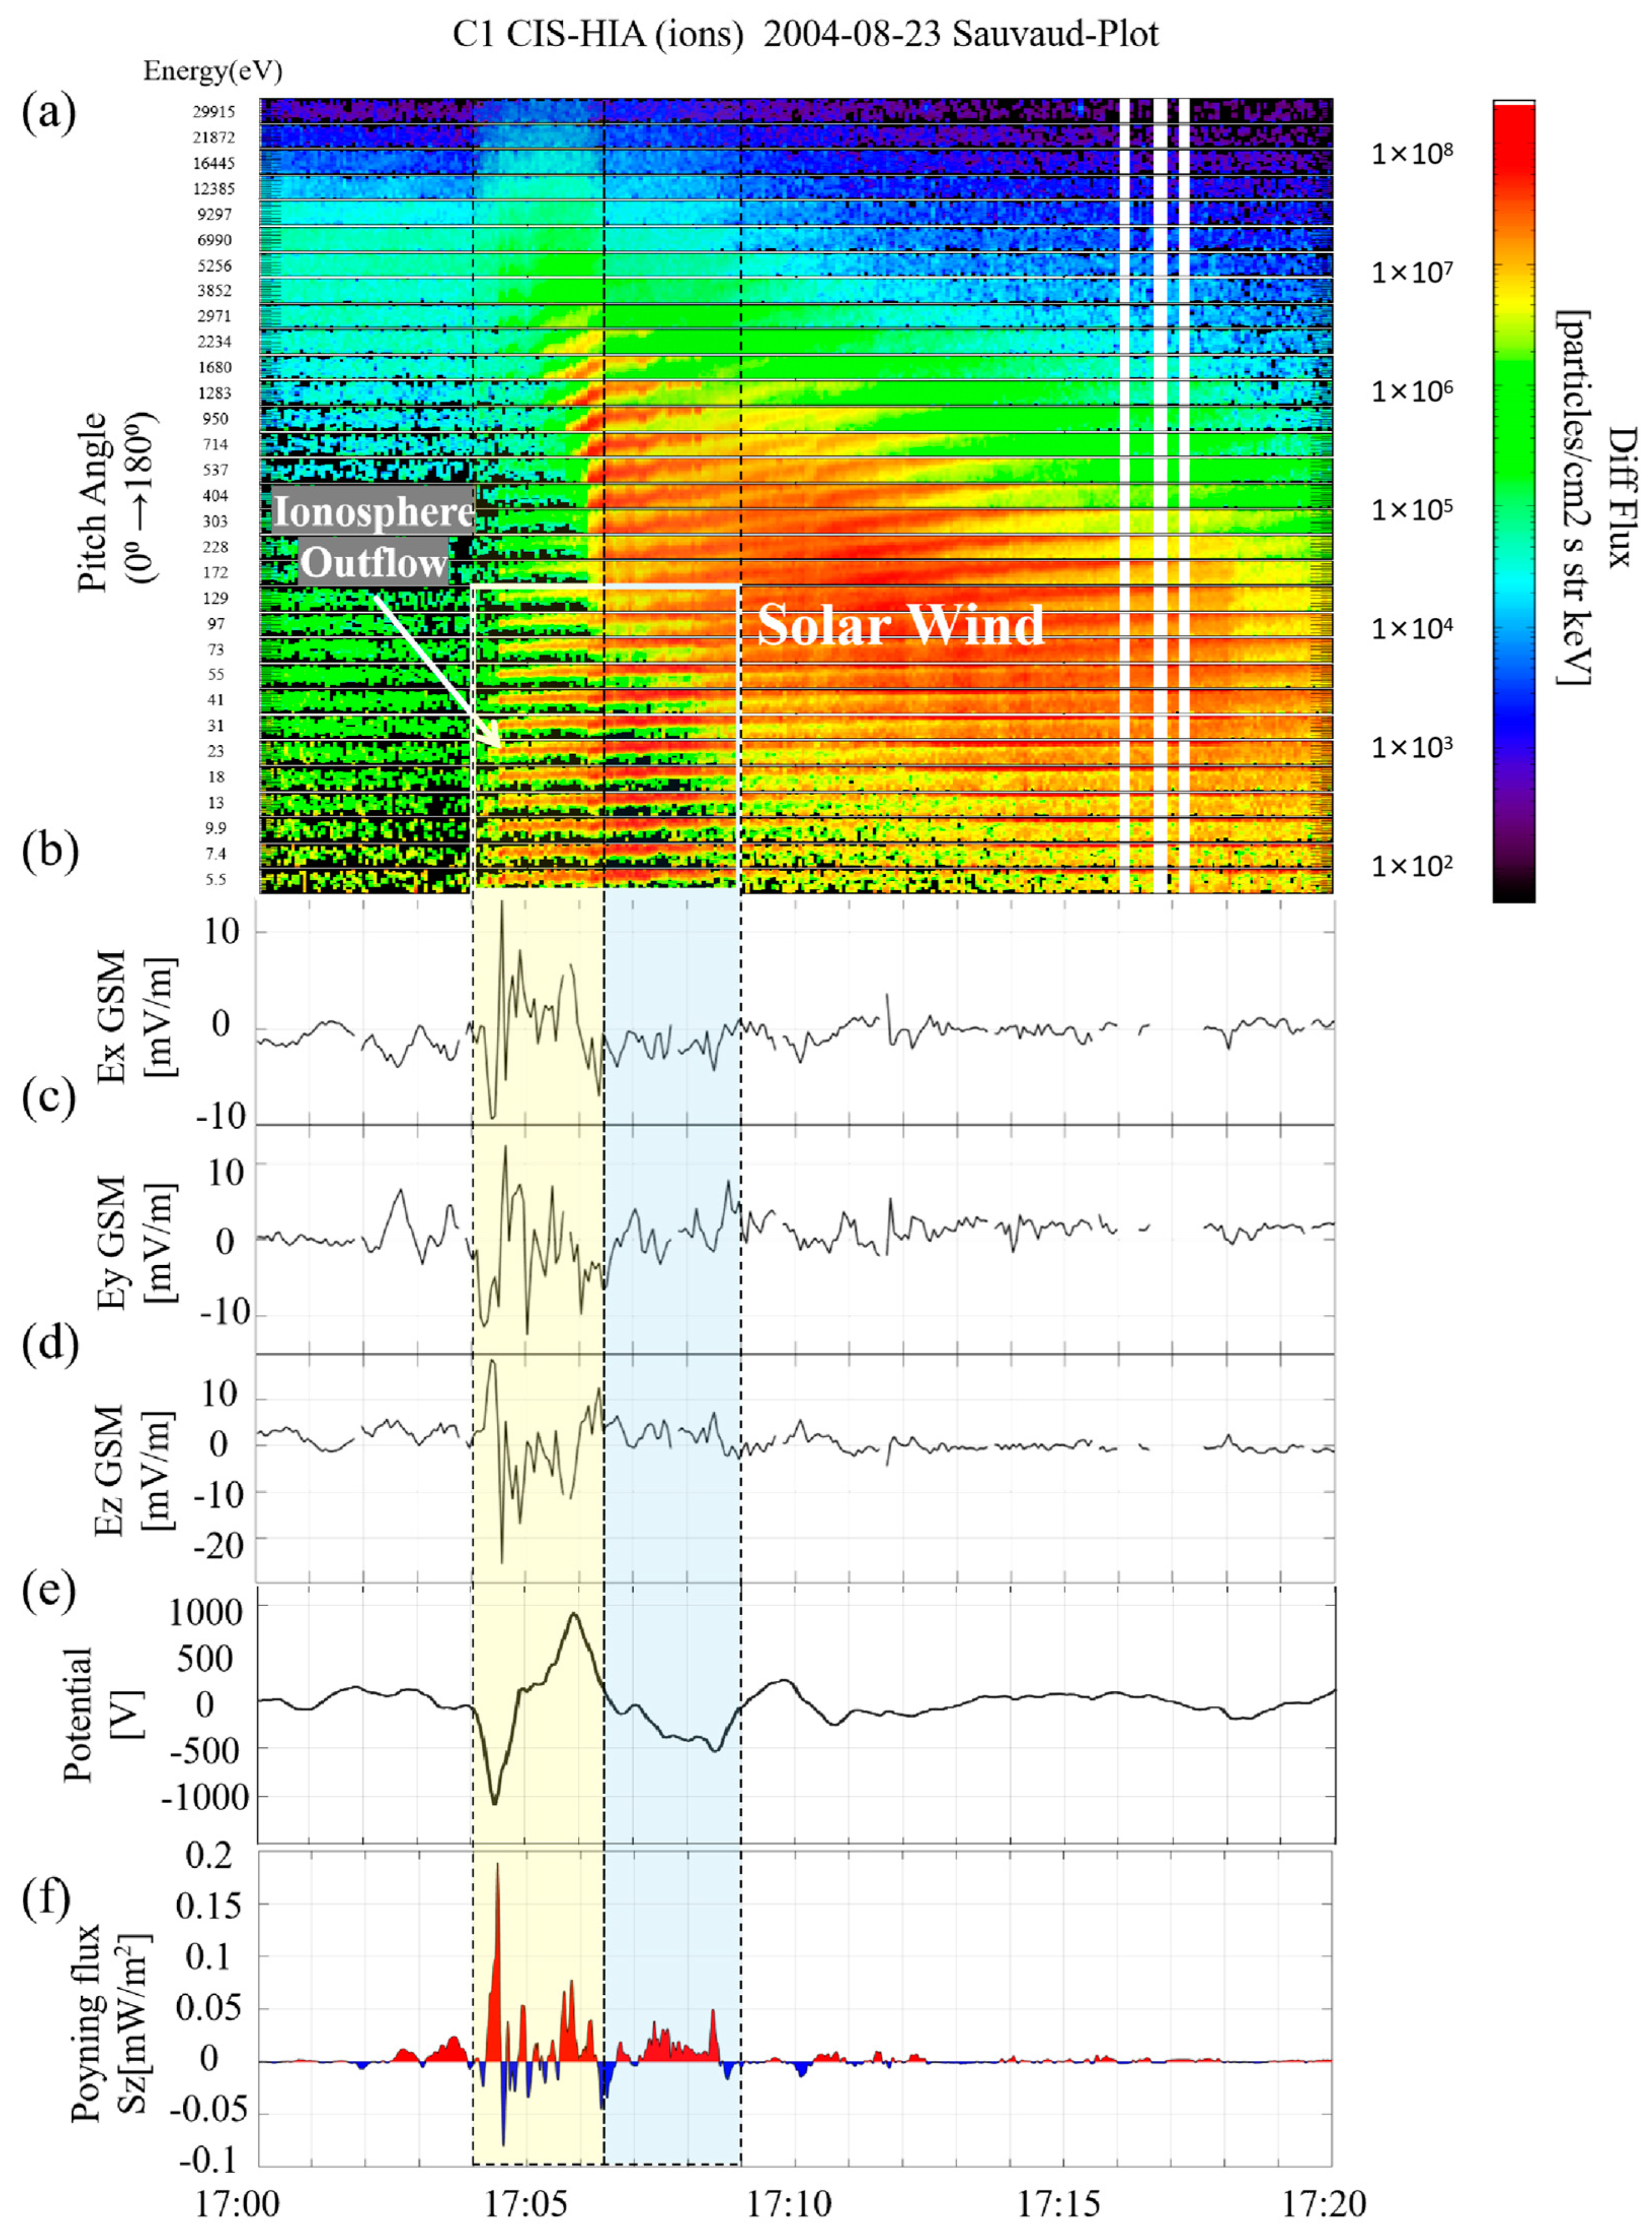
2. Observations
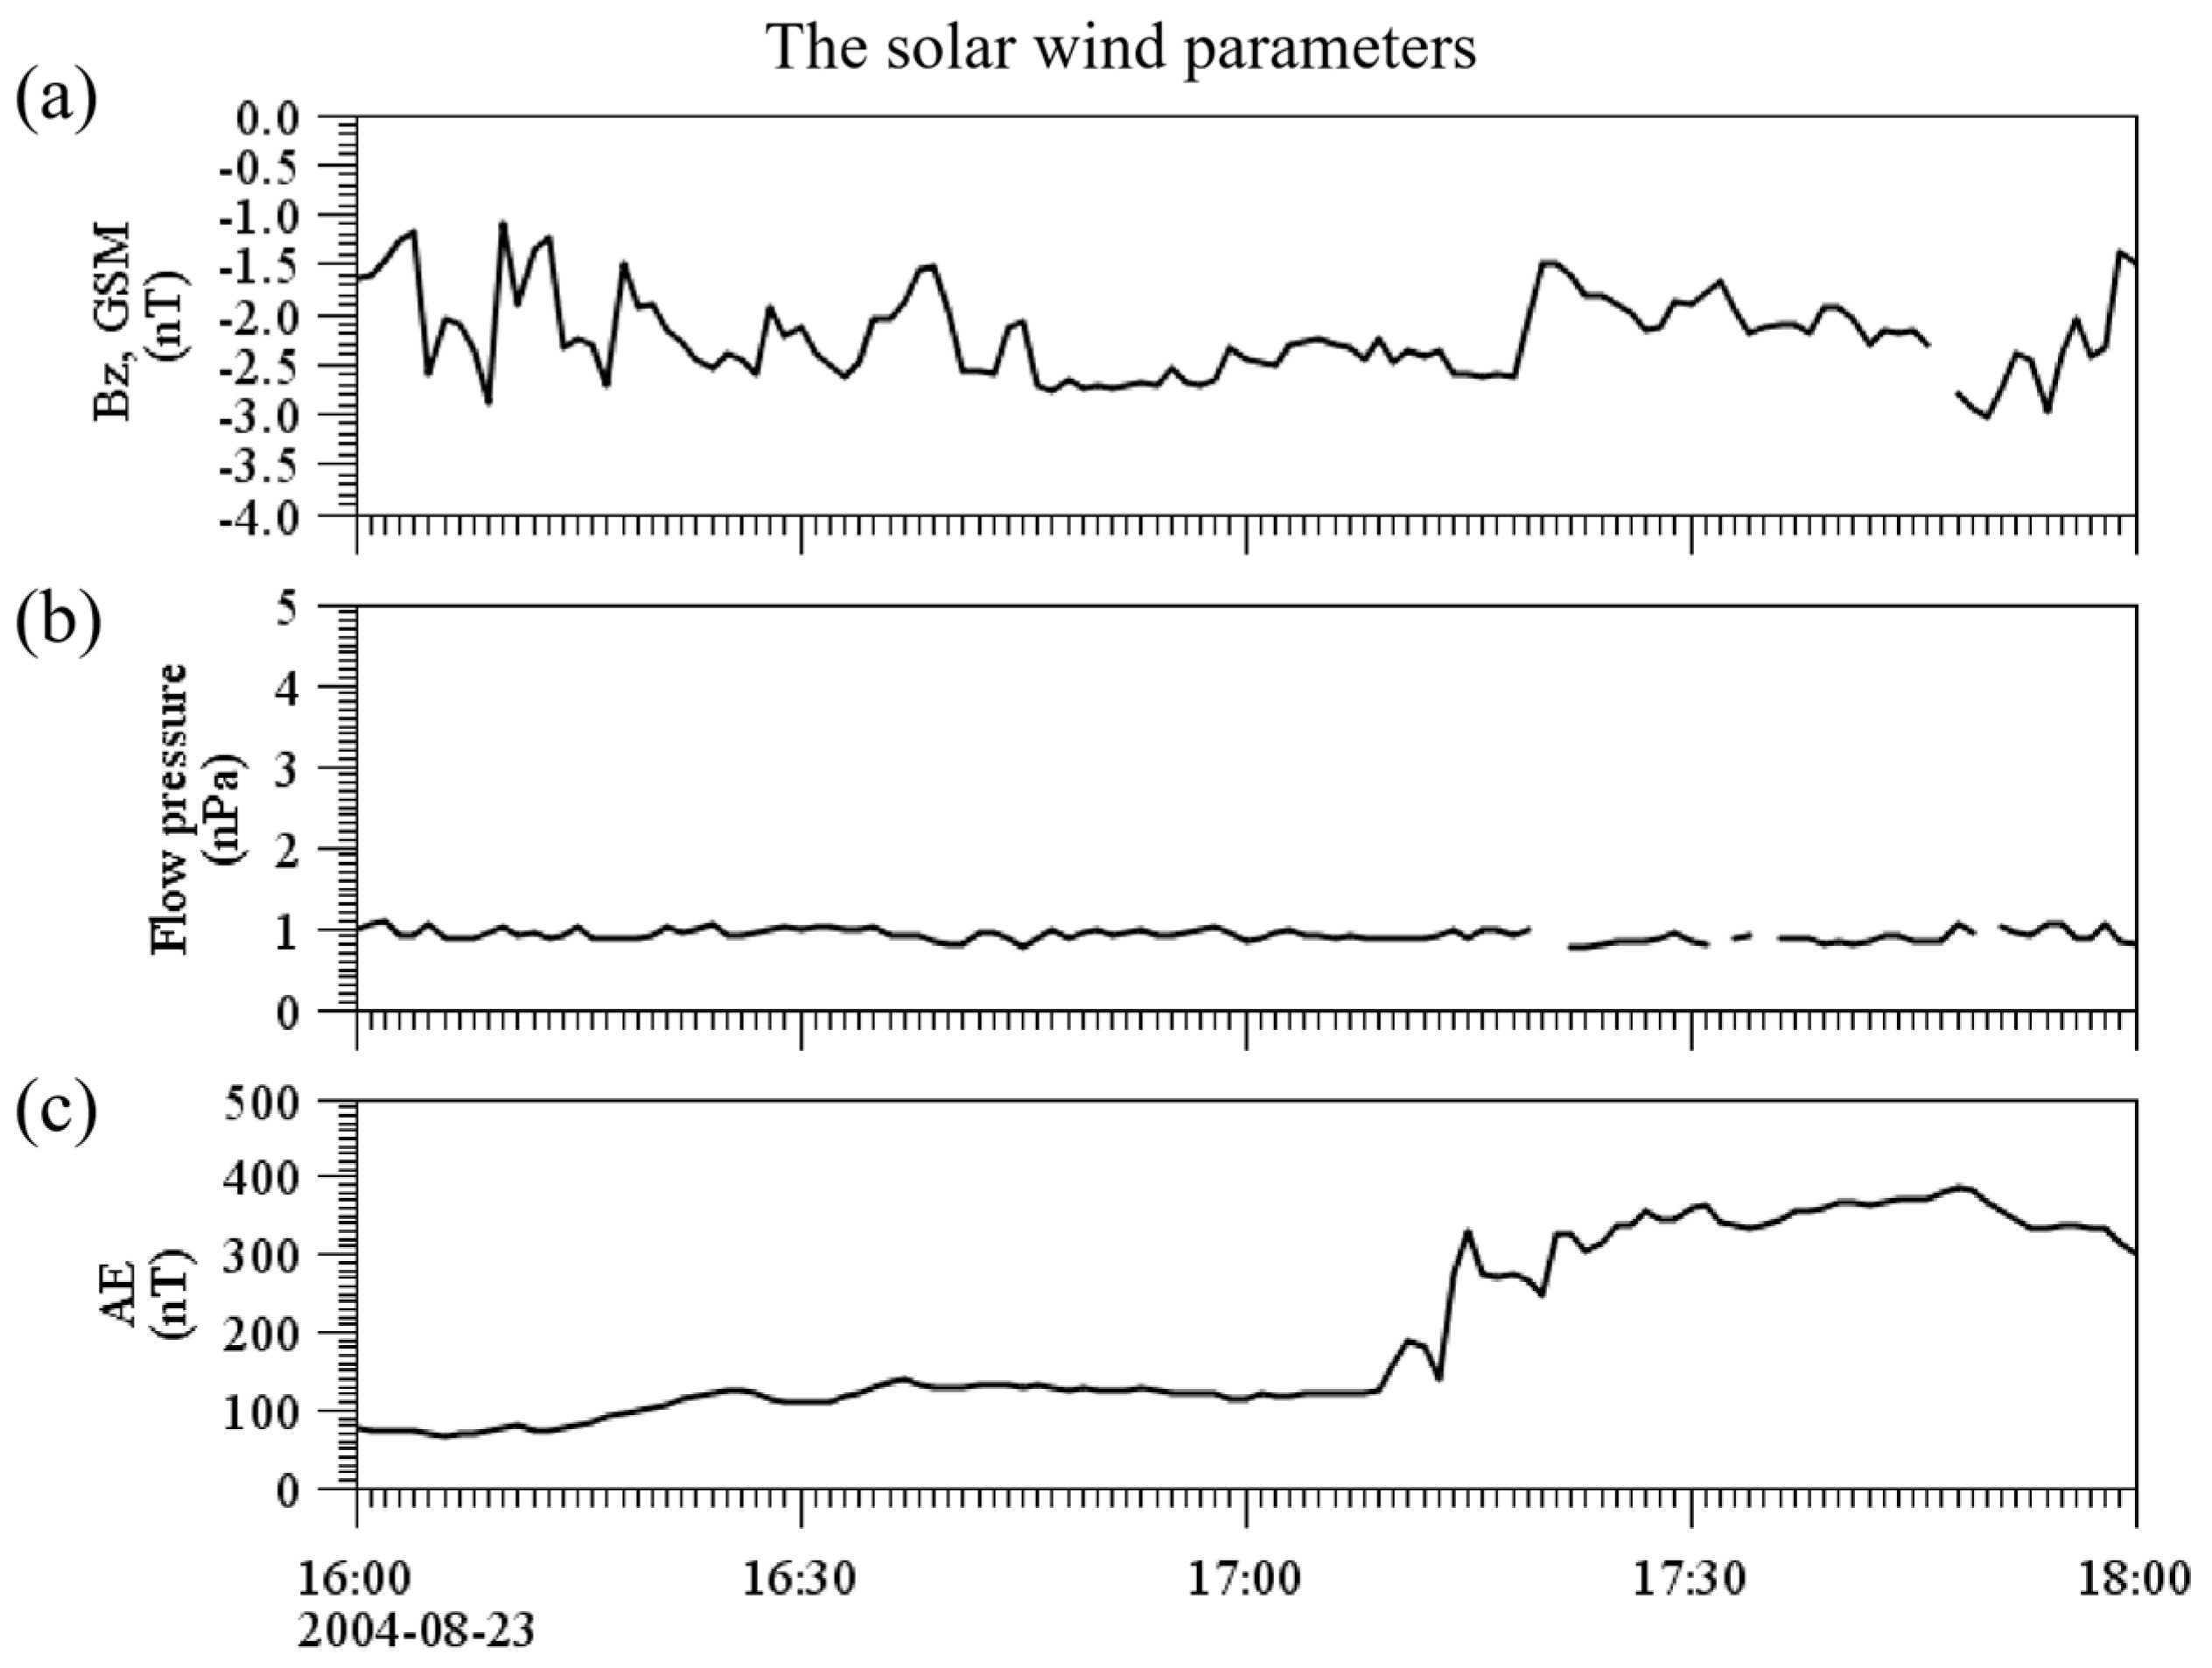
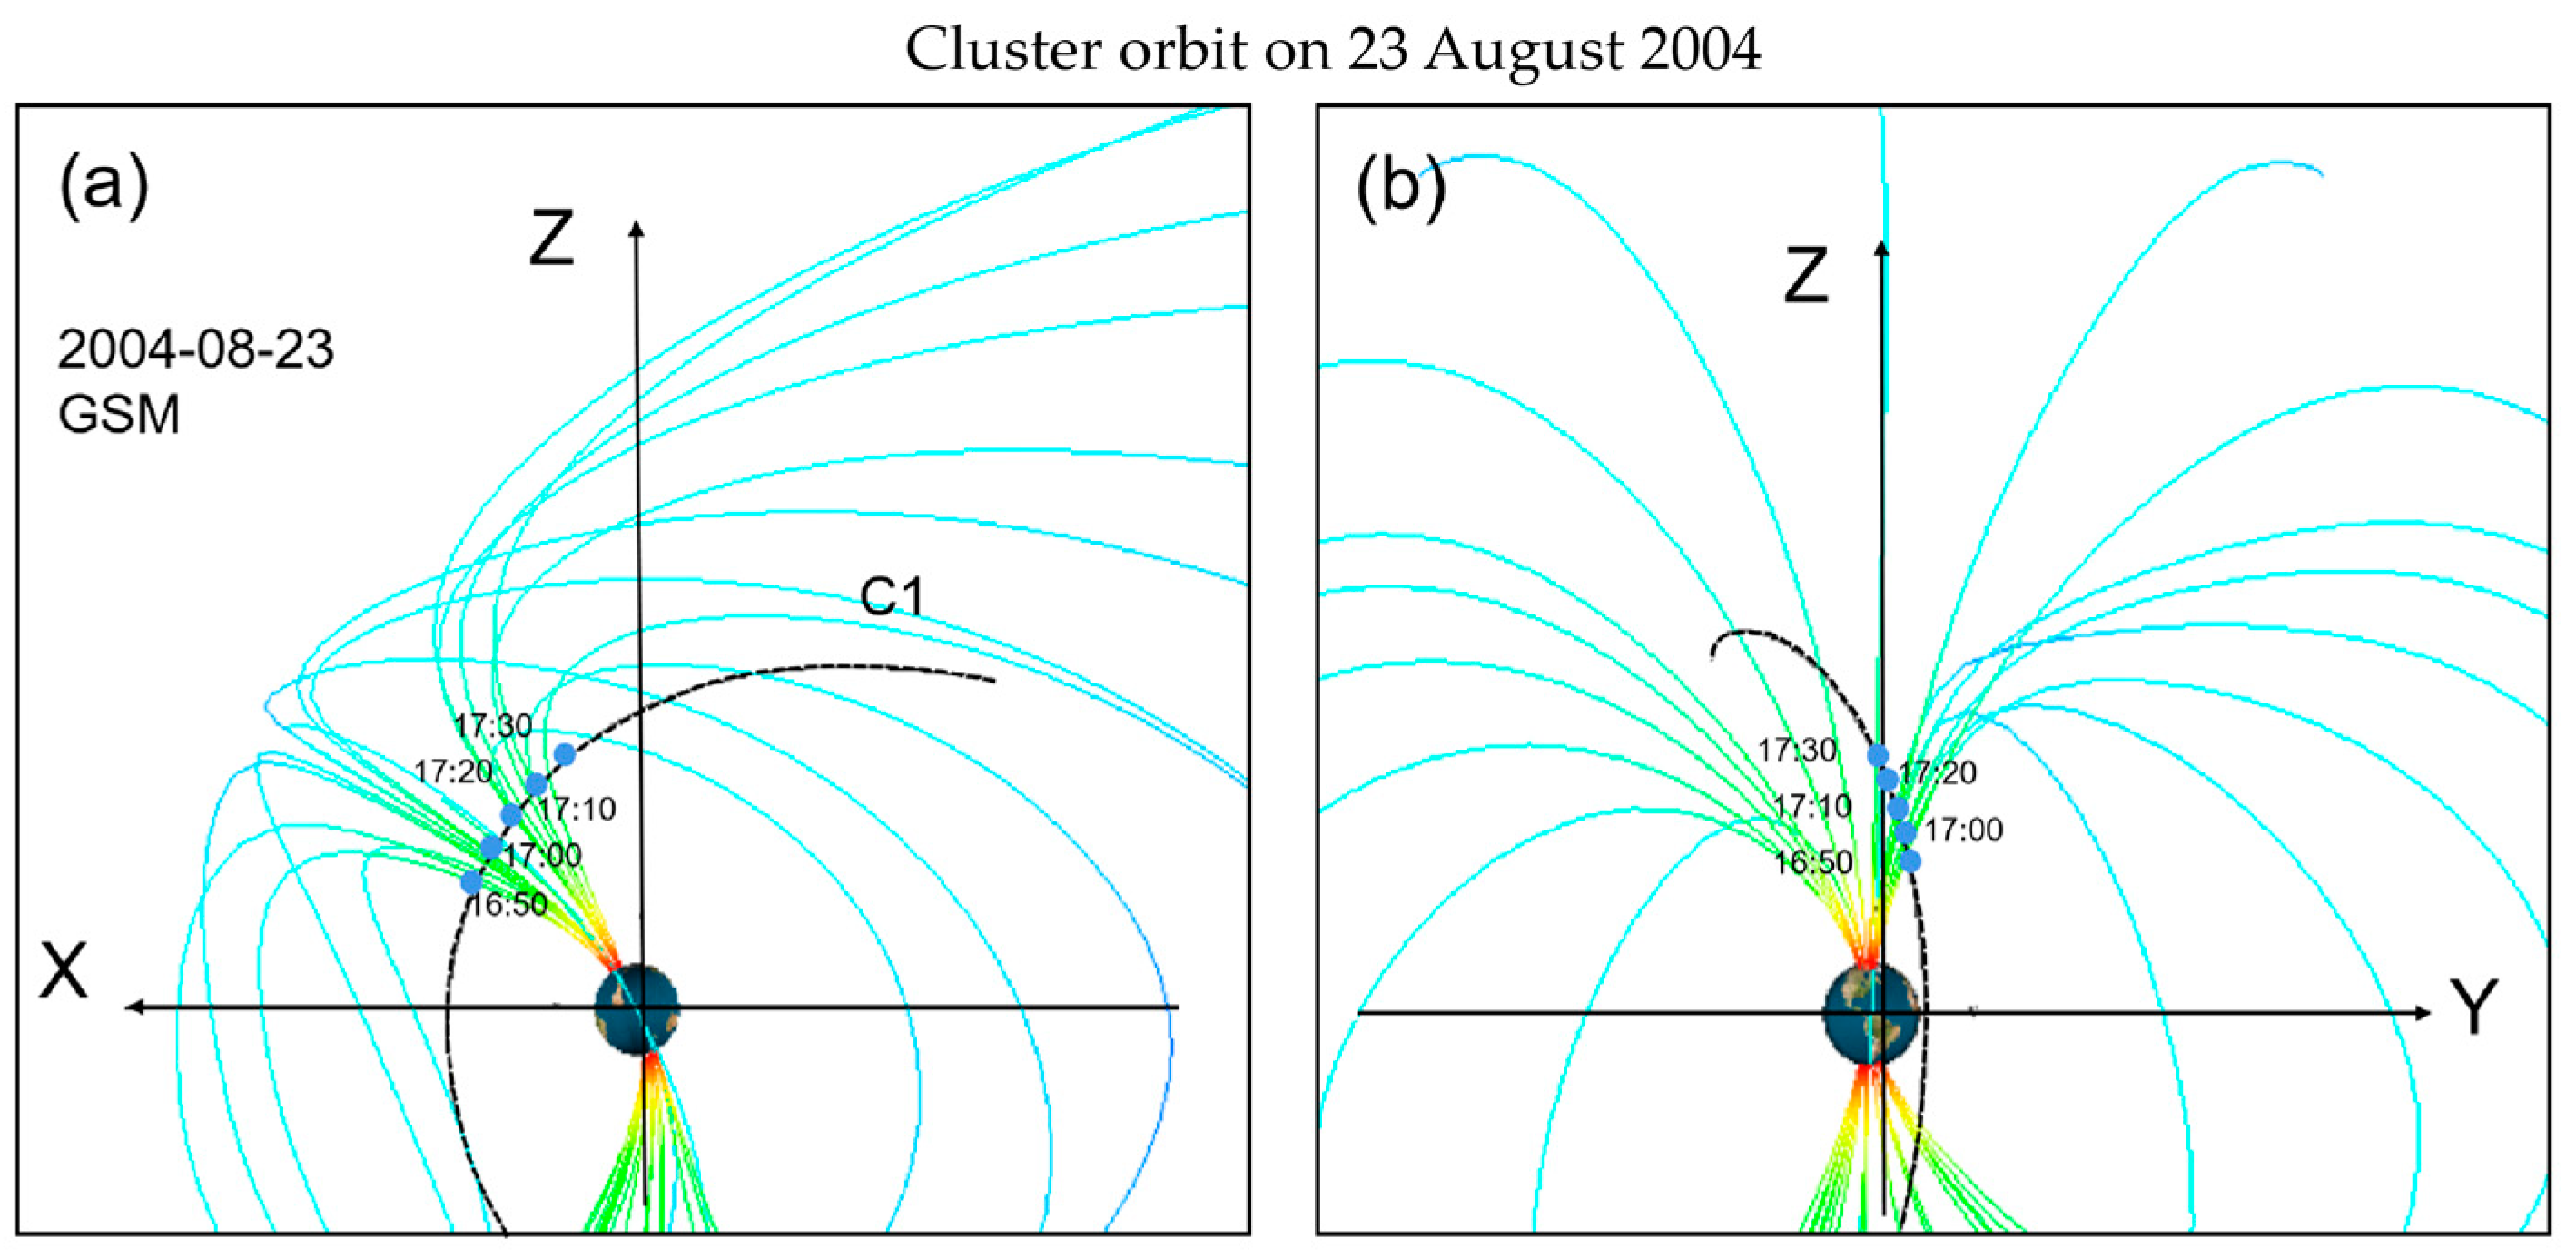
2.1. Solar Wind Parameters and Spacecraft Orbit
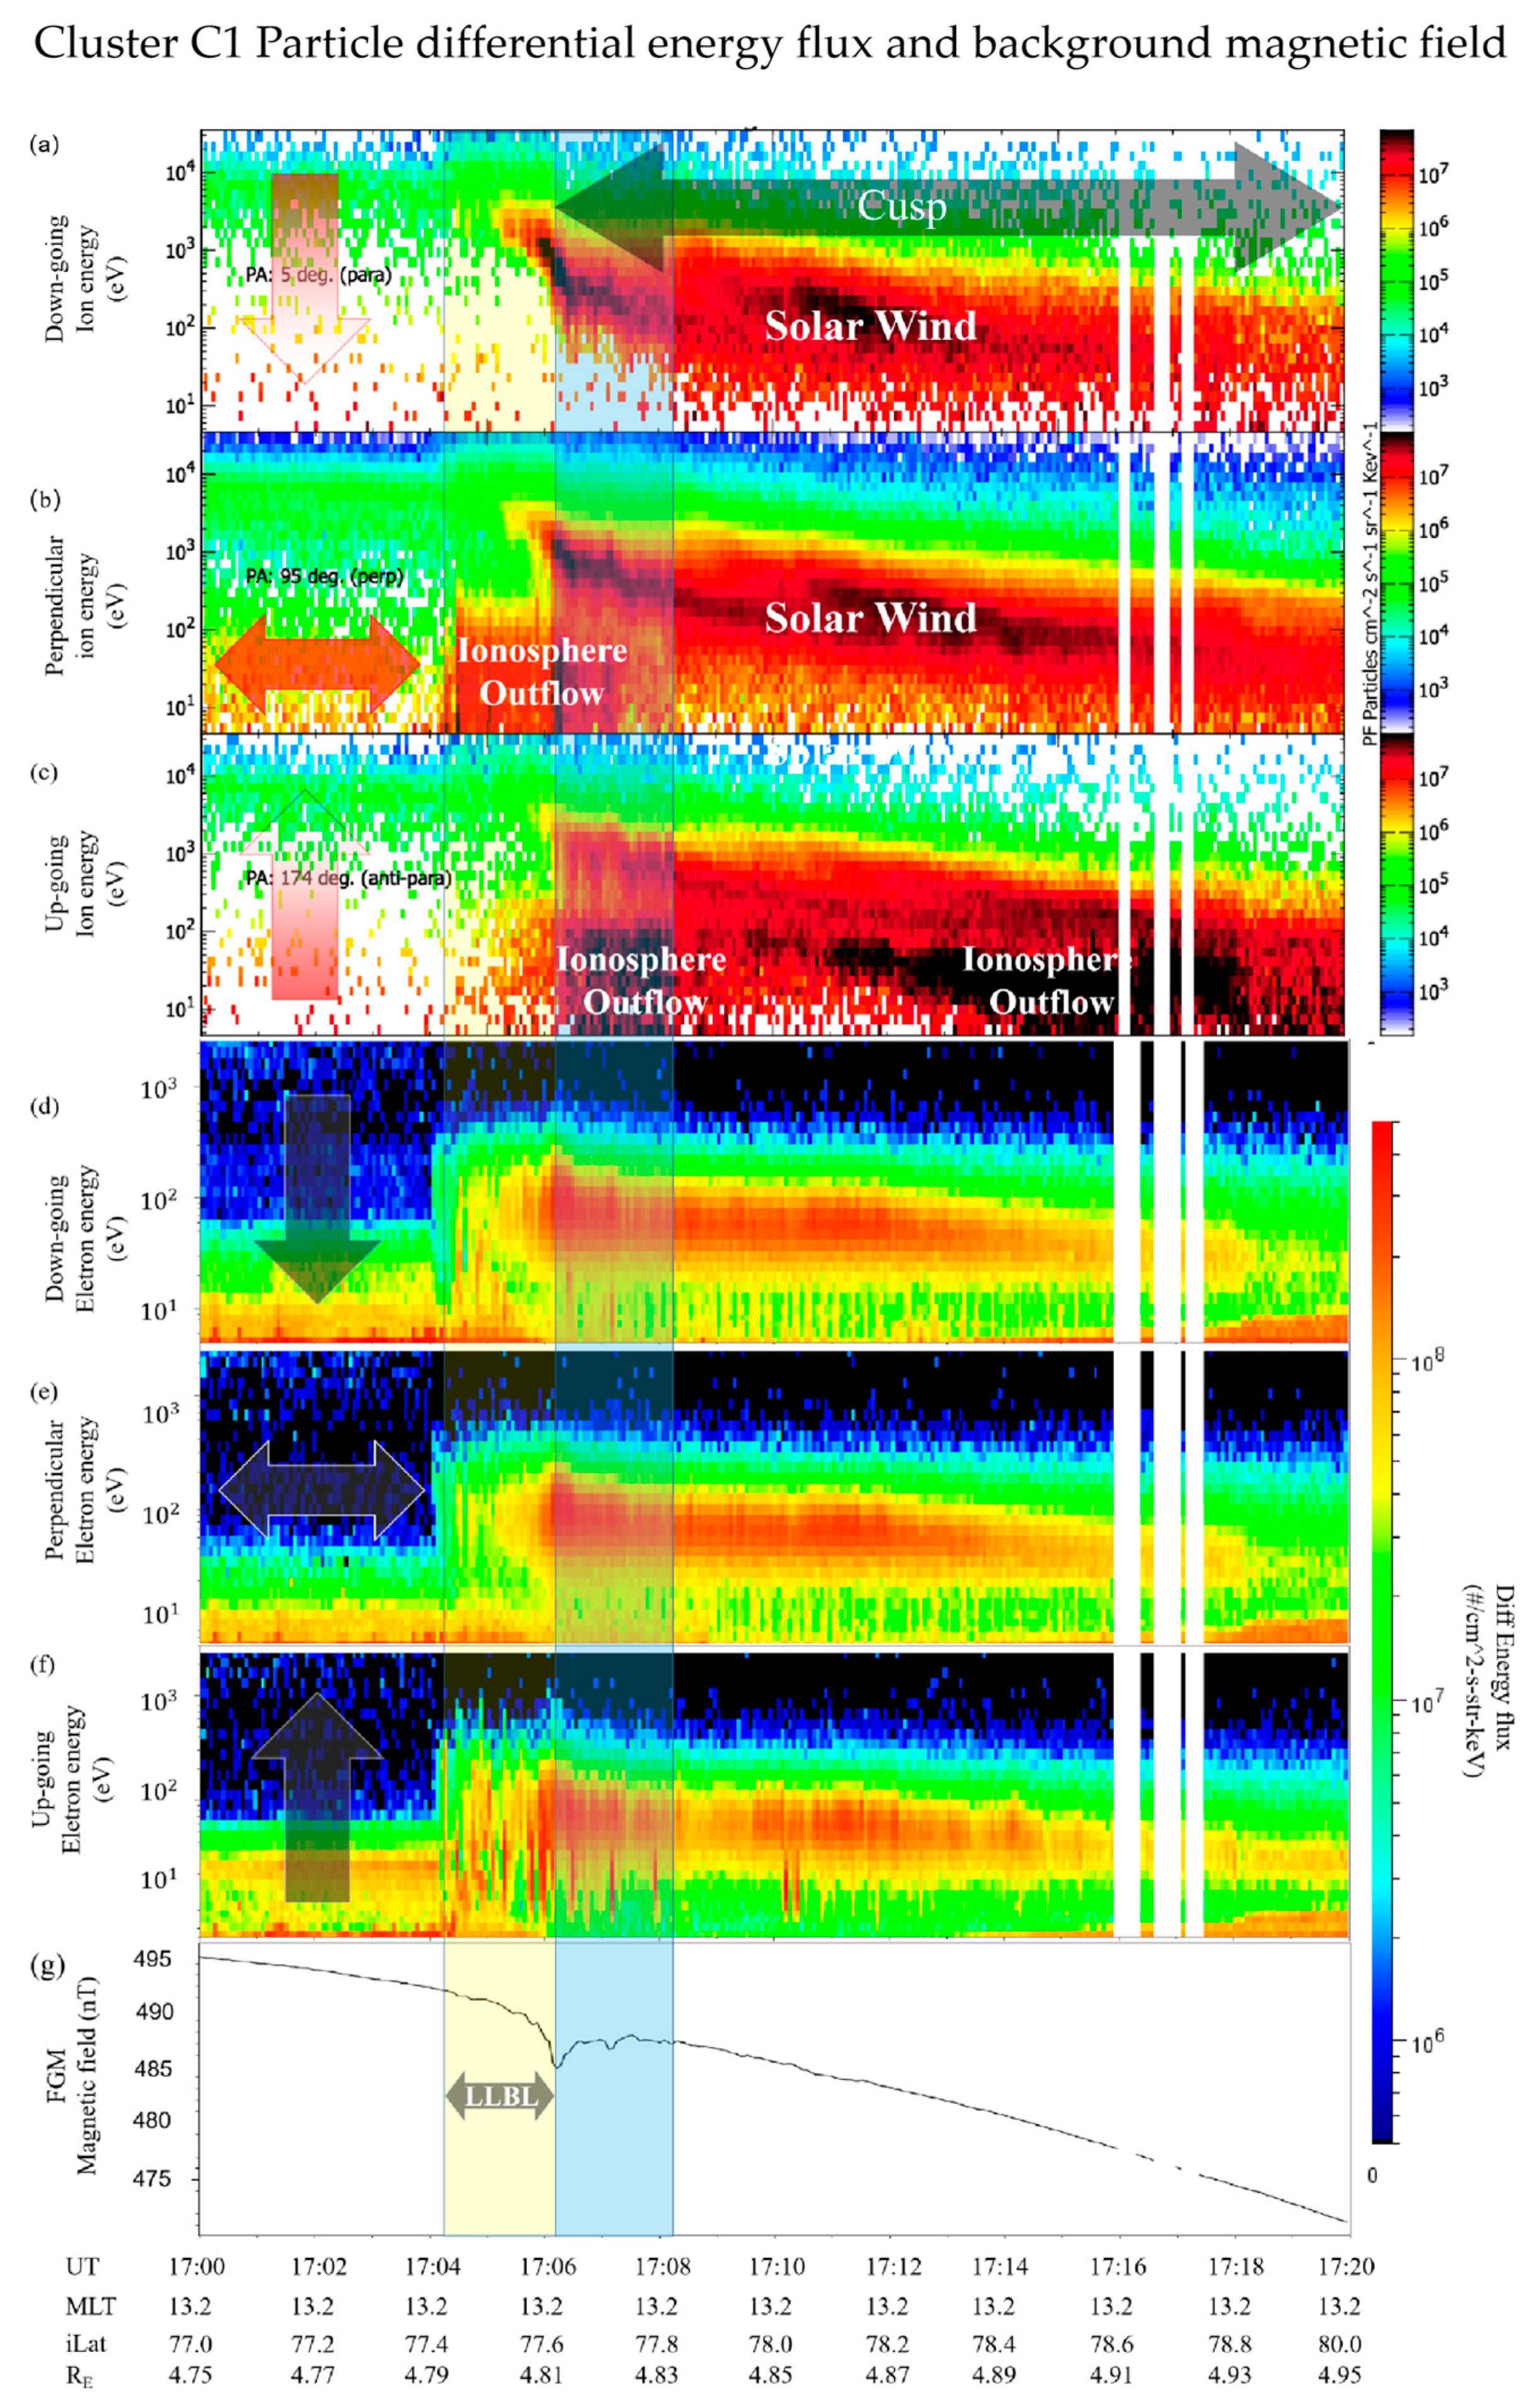
2.2. Particle Differential Energy Flux
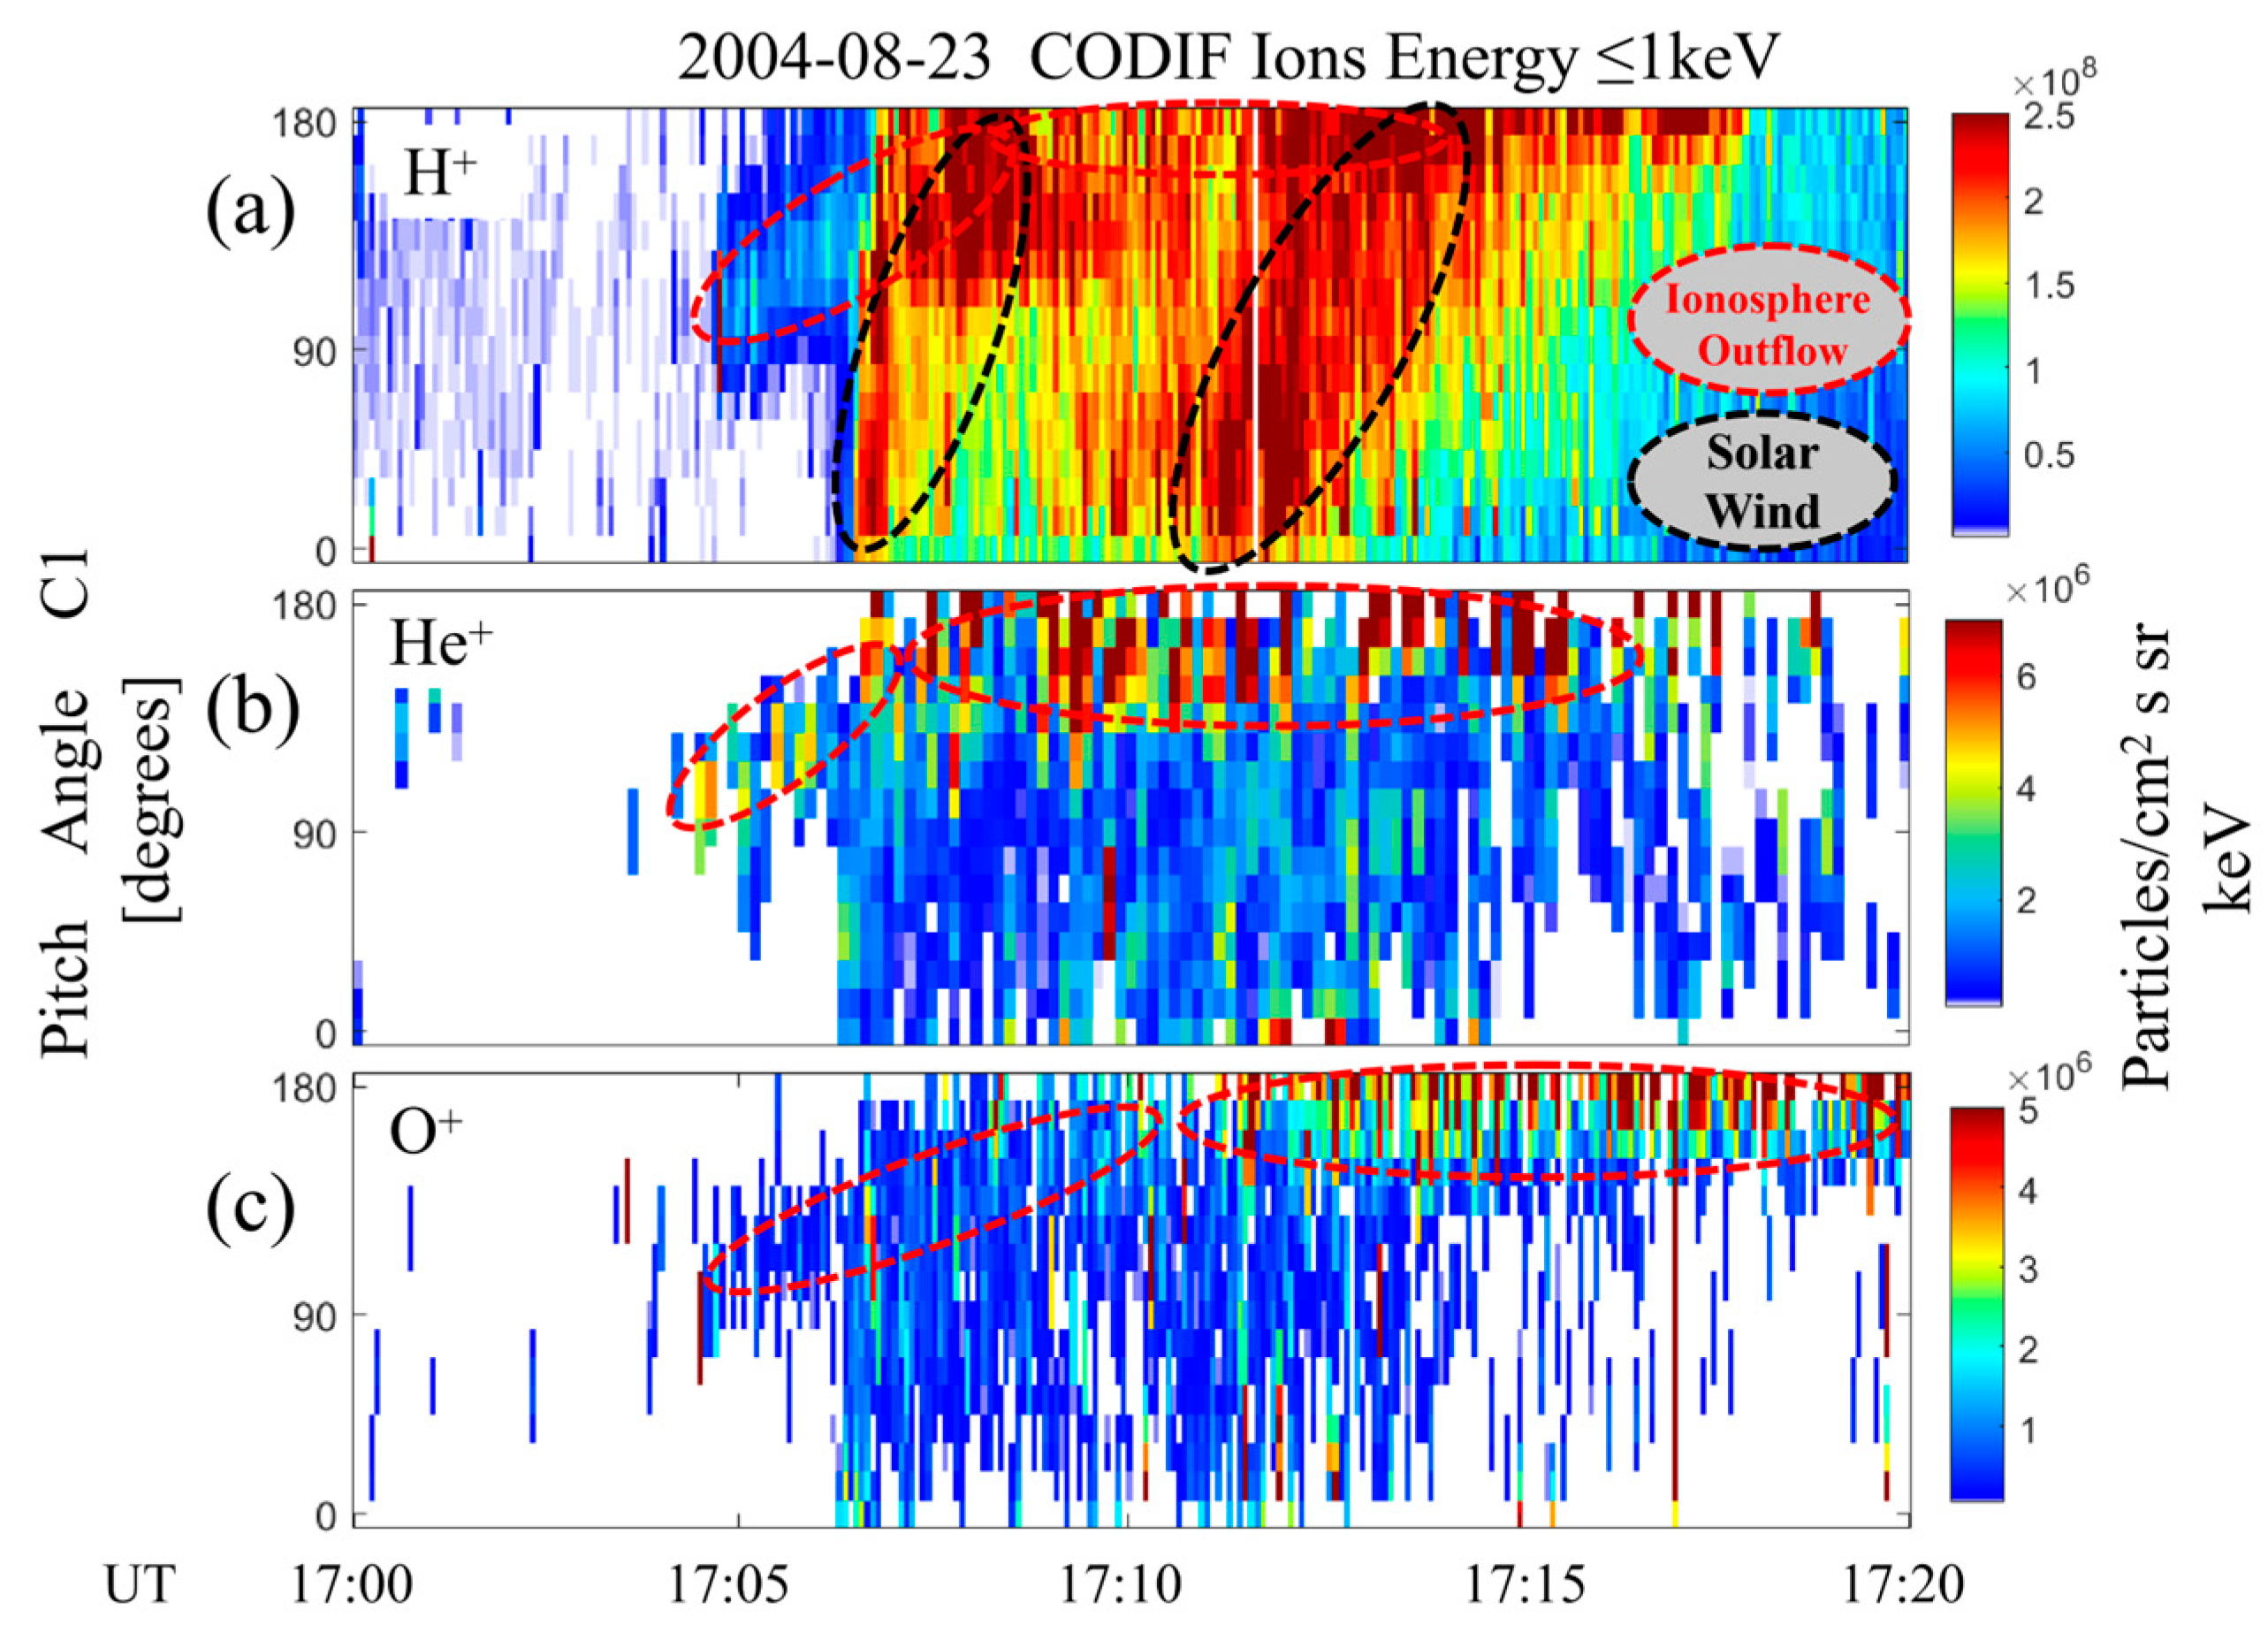
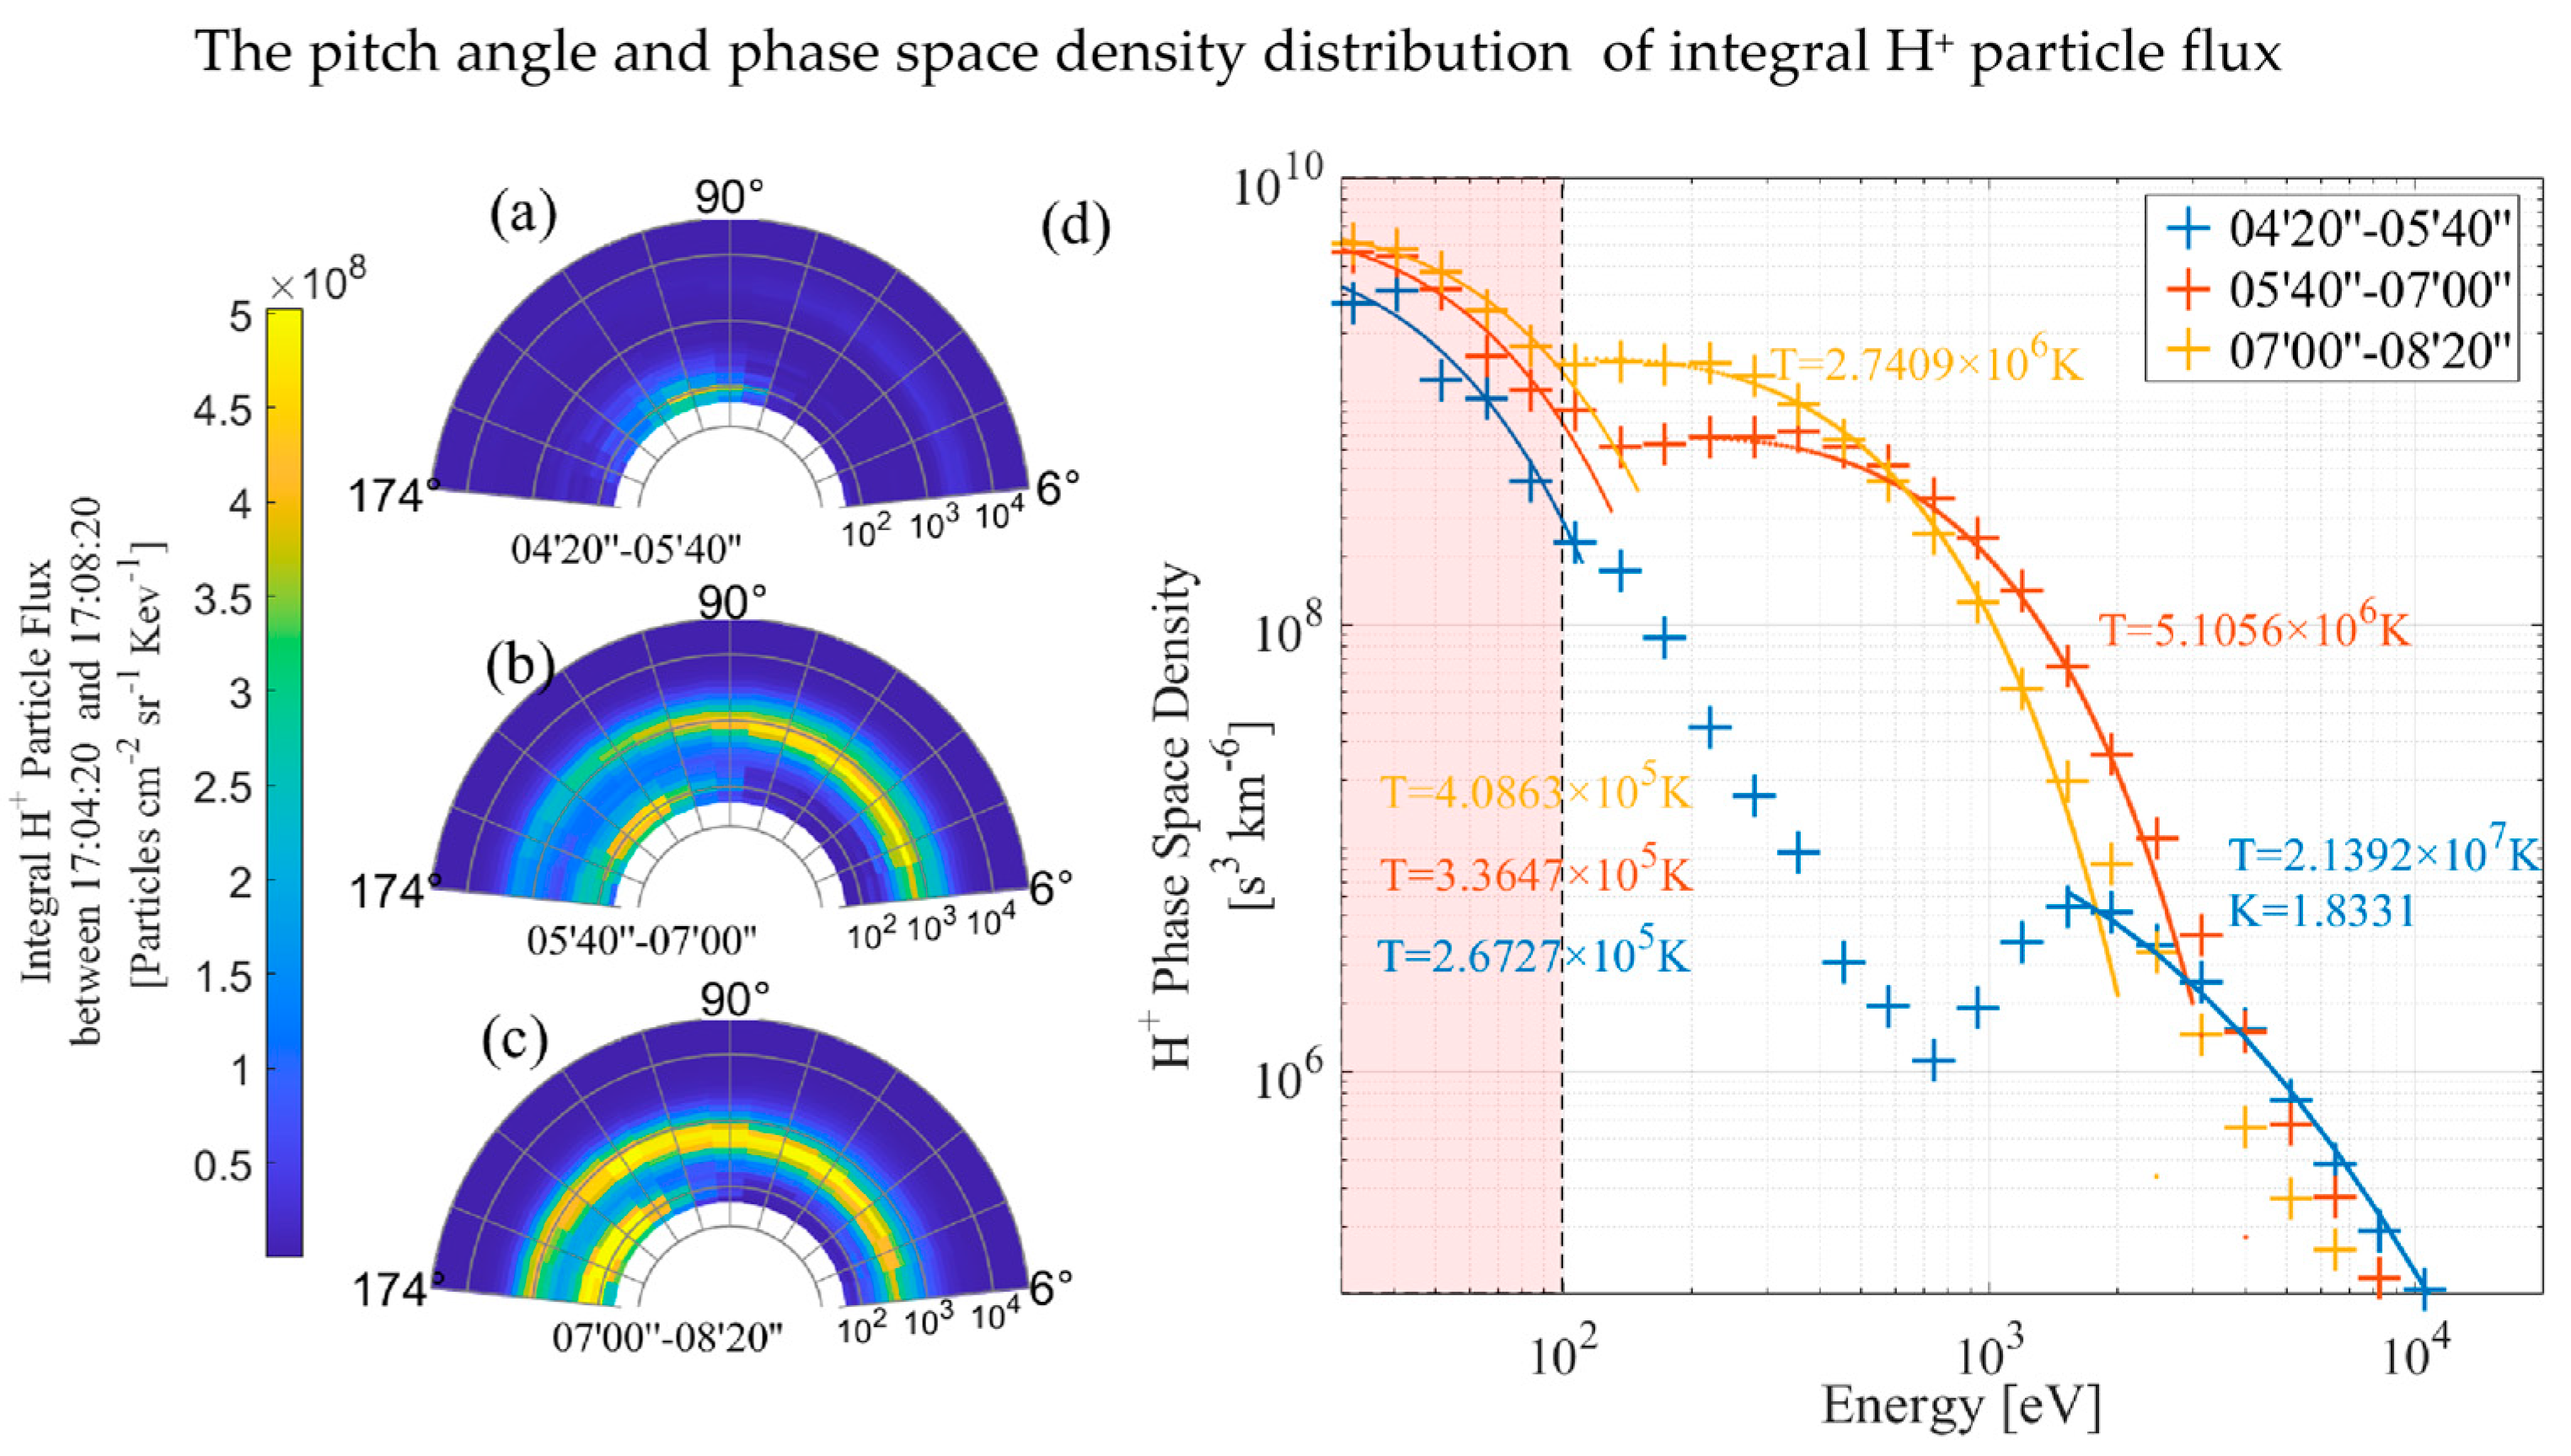
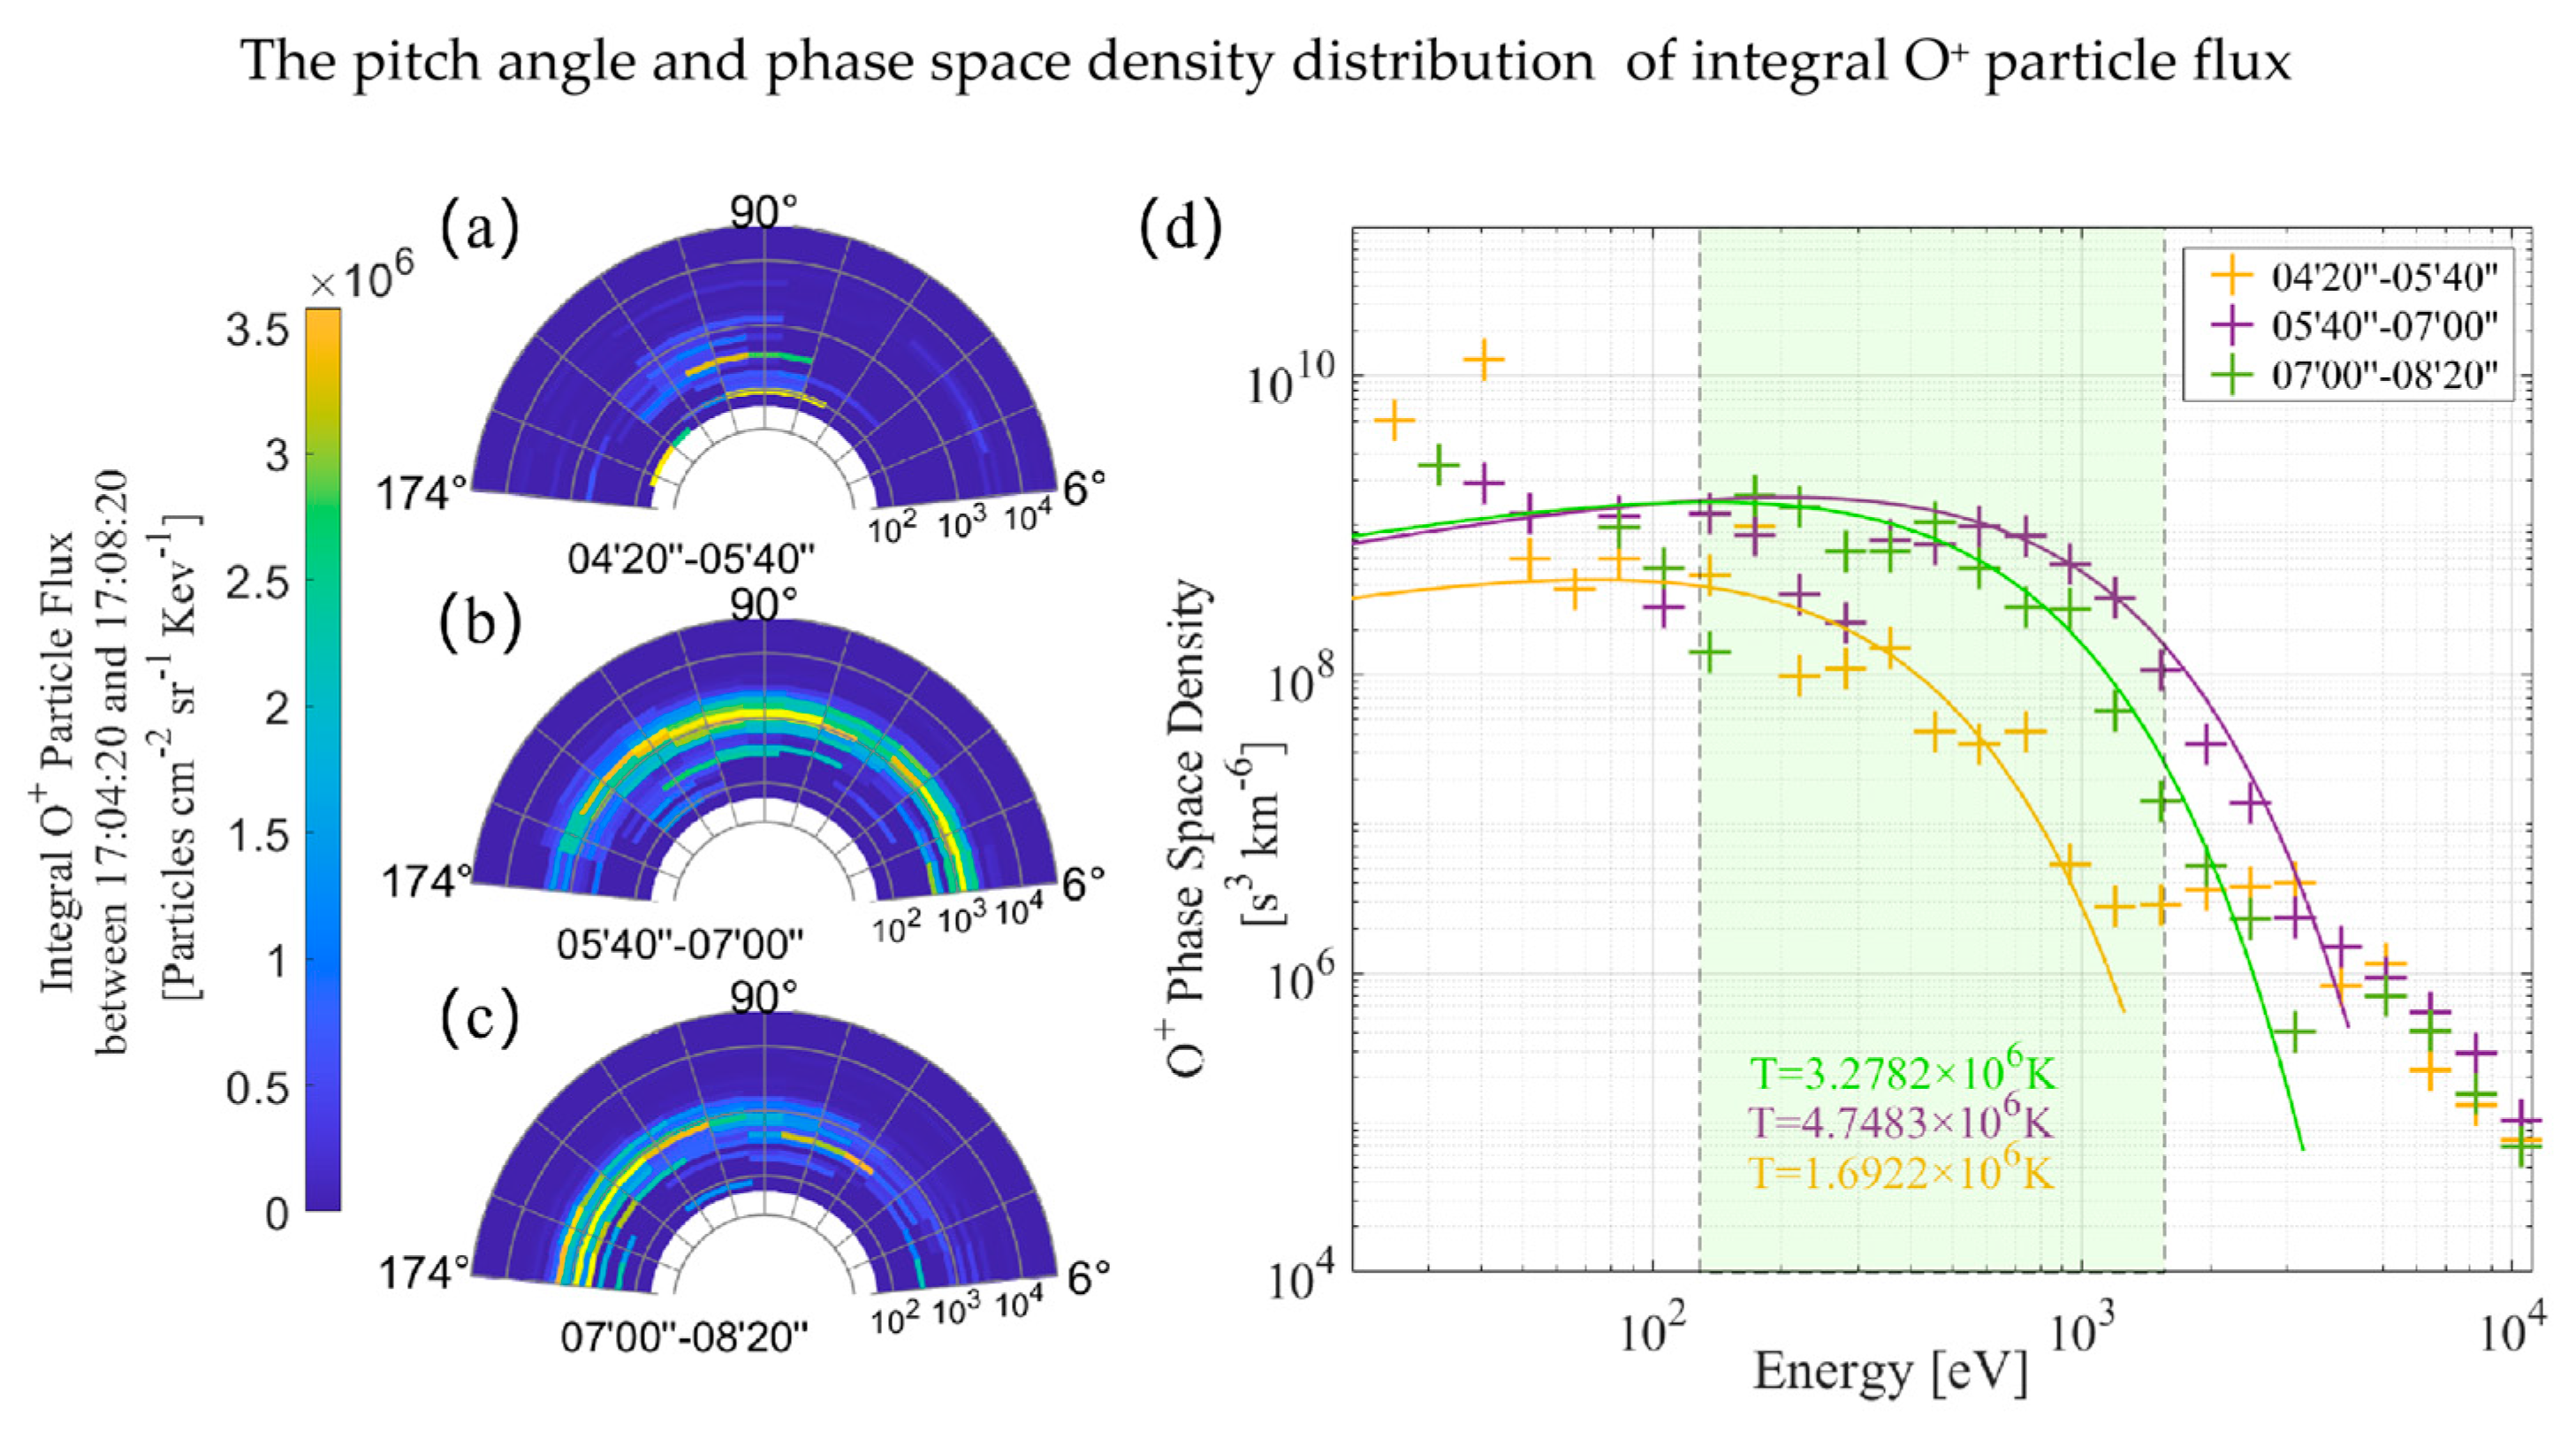
2.3. The Composition of Outflowing Ions
2.4. Potential Drop and Poynting Flux in Cold Ion Out Flow Region
2.5. LLBL/Cusp Ions Energy Distribution
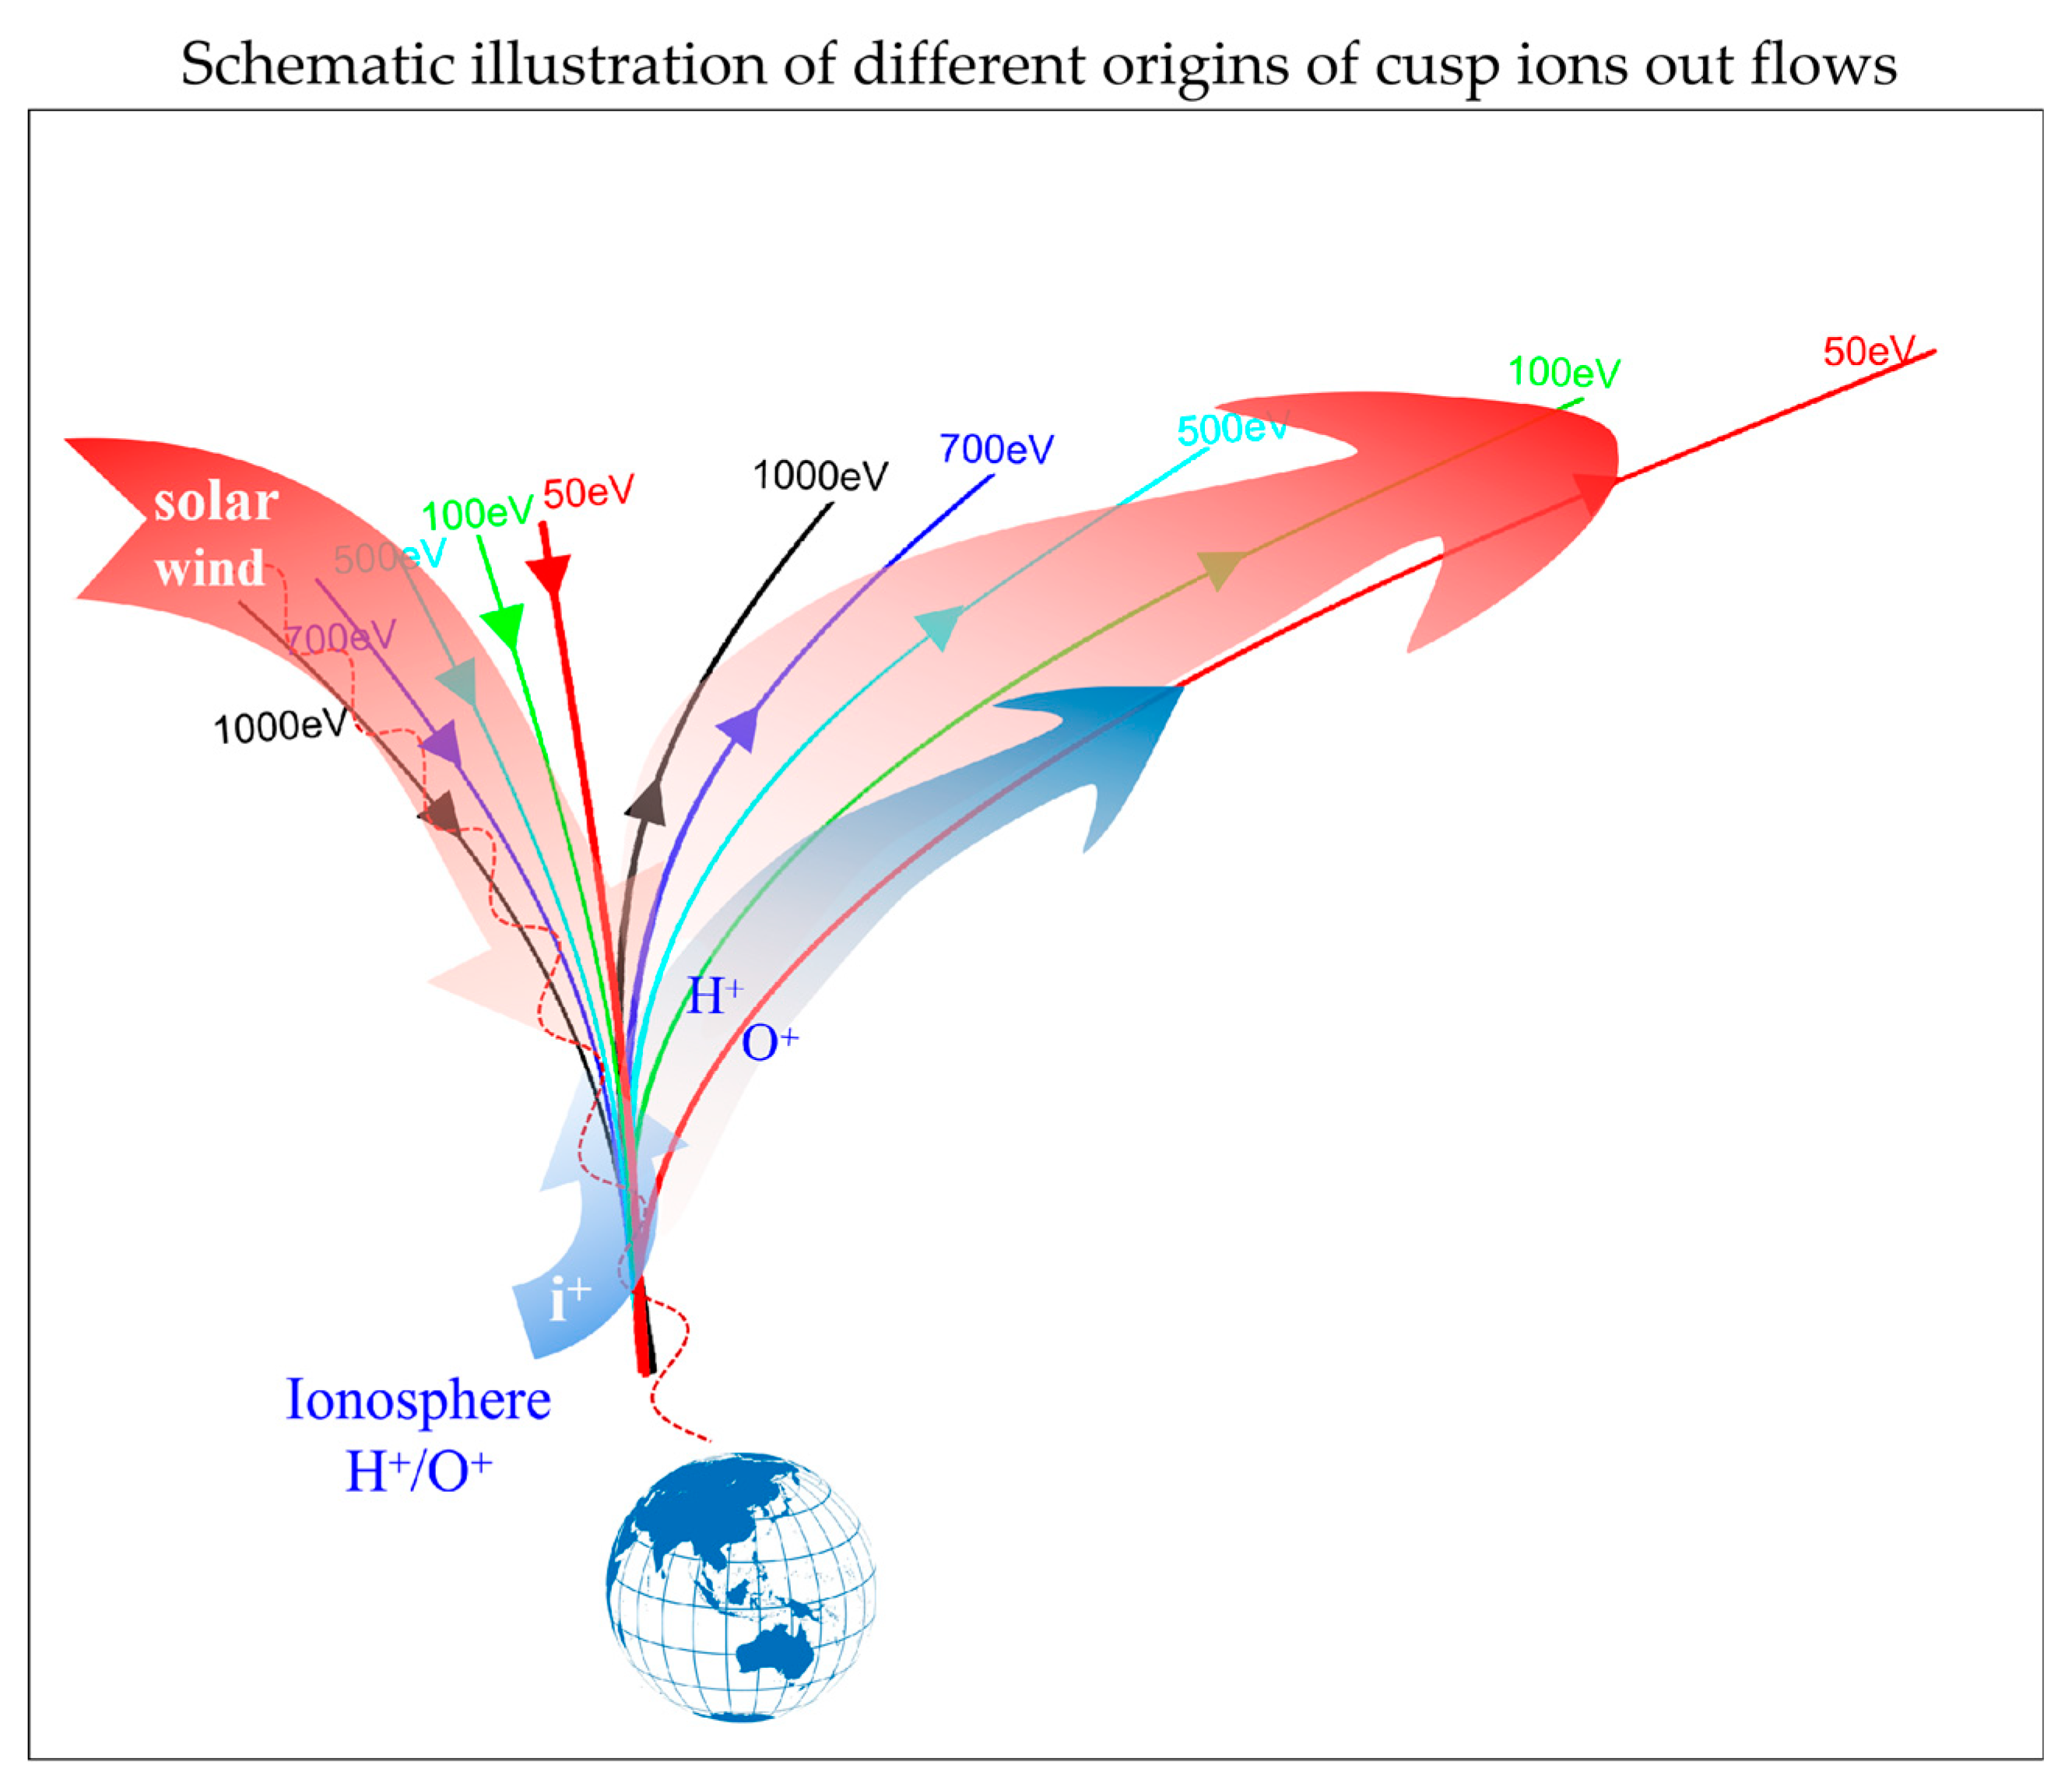
3. Discussion
4. Conclusions
- Cusp ion outflow is composed of the reflected solar wind ions and the ionospheric outflow ions. The ionospheric outflow was energized by the Poynting flux, and the Poynting flux is purely downward in the cusp but bi-directional in LLBL.
- Cold ion groups on the LLBL/cusp were mainly composed of H+ and O+, and all the cold ion flows were turning upward gradually when they drifted to the higher latitude side of the cusp, which may caused by the potential drop in the LLBL/cusp.
- The cold ion outflow in the LLBL/cusp may benefit from additional nonadiabatic acceleration in the same region.
Author Contributions
Funding
Institutional Review Board Statement
Informed Consent Statement
Data Availability Statement
Acknowledgments
Conflicts of Interest
References
- Milan, S.E.; Lester, M.; Cowley, S.W.H.; Oksavik, K.; Brittnacher, M.; Greenwald, R.A.; Sofko, G.; Villain, J.-P. Variations in the polar cap area during two substorm cycles. Ann. Geophys. 2003, 21, 1121–1140. [Google Scholar] [CrossRef] [Green Version]
- Lu, J.Y.; Zhang, H.X.; Wang, M.; Gu, C.L.; Guan, H.Y. Magnetosphere response to the IMF turning from north to south. Earth Planet. Phys. 2019, 3, 8–16. [Google Scholar] [CrossRef]
- Haerendel, G.; Paschmann, G. Entry of solar wind plasma into the magnetosphere. In Physics of the Hot Plasma in the Magnetosphere; Hultqvist, B., Stenflo, L., Eds.; Springer: Boston, MA, USA, 1975. [Google Scholar] [CrossRef]
- Hill, T.W.; Reiff, P.H. Evidence of magnetospheric cusp proton acceleration by magnetic merging at the dayside magnetopause. J. Geophys. Res. 1977, 82, 3623–3628. [Google Scholar] [CrossRef]
- Axford, W.I. The polar wind and the terrestrial helium budget. J. Geophys. Res. 1968, 73, 6855–6859. [Google Scholar] [CrossRef]
- Nishida, A. Formation of plasmapause, or magnetospheric plasma knee, by the combined action of magnetospheric convection and plasma escape from the tail. J. Geophys. Res. 1966, 71, 5669–5679. [Google Scholar] [CrossRef]
- Ganguli, S.B.; Mitchell, H.G.; Palmadesso, P.J. Behavior of ionized plasma in the high latitude topside ionosphere-the polar wind. Planet. Space Sci. 1987, 35, 703–714. [Google Scholar] [CrossRef]
- Sheeley, N.R. Polar faculae during the interval 1906–1975. J. Geophys. Res. 1976, 81, 3462–3464. [Google Scholar] [CrossRef]
- Sharp, R.D.; Johnson, R.G.; Shelley, E.G. Observation of an ionospheric acceleration mechanism producing energetic (keV) ions primarily normal to the geomagnetic field direction. J. Geophys. Res. 1977, 82, 3324–3328. [Google Scholar] [CrossRef]
- Gorney, D.J.; Clarke, A.; Croley, D.; Fennell, J.; Luhmann, J.; Mizera, P. The distribution of ion beams and conics below 8000 km. J. Geophys. Res. 1981, 86, 83–89. [Google Scholar] [CrossRef]
- Yau, A.; André, M. Sources of ion outflow in the high latitude ionosphere. Space Sci. Rev. 1997, 80, 1–25. [Google Scholar] [CrossRef]
- Bouhram, M.; Dubouloz, N.; Malingre, M.; Jasperse, J.R.; Pottelette, R.; Senior, C.; Delcourt, D.; Carlson, C.W.; Roth, I.; Berthomier, M.; et al. Ion outflow and associated perpendicular heating in the cusp observed by Interball Auroral Probe and Fast Auroral Snapshot. J. Geophys. Res. 2002, 107, SMP 4-1–SMP 4-13. [Google Scholar] [CrossRef] [Green Version]
- Bouhram, M.; Malingre, M.; Jasperse, J.R.; Dubouloz, N. Modeling transverse heating and outflow of ionospheric ions from the dayside cusp/cleft. 1 A parametric study. Ann. Geophys. 2003, 21, 1753–1771. [Google Scholar] [CrossRef] [Green Version]
- Bouhram, M.; Malingre, M.; Jasperse, J.R.; Dubouloz, N.; Sauvaud, J.-A. Modeling transverse heating and outflow of ionospheric ions from the dayside cusp/cleft. 2 Applications. Ann. Geophys. 2003, 21, 1773–1791. [Google Scholar] [CrossRef] [Green Version]
- Bouhram, M.; Klecker, B.; Miyake, W.; Rème, H.; Sauvaud, J.-A.; Malingre, M.; Kistler, L.; Blăgău, A. On the altitude dependence of transversely heated O+ distributions in the cusp/cleft. Ann. Geophys. 2004, 22, 1787–1798. [Google Scholar] [CrossRef] [Green Version]
- Lindstedt, T.; Khotyaintsev, Y.V.; Vaivads, A.; André, M.; Nilsson, H.; Waara, M. Oxygen energization by localized perpendicular electric fields at the cusp boundary. Geophys. Res. Lett. 2010, 37, L09103. [Google Scholar] [CrossRef]
- Nilsson, H.; Barghouthi, I.A.; Slapak, R.; Eriksson, A.I.; André, M. Hot and cold ion outflow: Spatial distribution of ion heating. J. Geophys. Res. 2012, 117, A11201. [Google Scholar] [CrossRef] [Green Version]
- Liao, J.; Kistler, L.M.; Mouikis, C.G.; Klecker, B.; Dandouras, I. Acceleration of O+ from the cusp to the plasma sheet. J. Geophys. Res. 2015, 120, 1022–1034. [Google Scholar] [CrossRef]
- Li, B.; Marklund, G.; Karlsson, T.; Sadeghi, S.; Lindqvist, P.A.; Vaivads, A.; Fazakerley, A.; Zhang, Y.; Lucek, E.; Sergienko, T.; et al. Inverted-V and low-energy broadband electron acceleration features of multiple auroras within a large-scale surge. J. Geophys. Res. Space Phys. 2013, 118, 5543–5552. [Google Scholar] [CrossRef]
- Marklund, G.T.; Ivchenko, N.; Karlsson, T.; Fazakerley, A.; Dunlop, M.; Lindqvist, P.A.; Buchert, S.; Owen, C.; Taylor, M.; Vaivalds, A.; et al. Temporal evolution of the electric field accelerating electrons away from the auroral ionosphere. Nature 2001, 414, 724–727. [Google Scholar] [CrossRef]
- Marklund, G.; Lindqvist, P.-A. Cluster multi-probing of the aurora during two decades. J. Geophys. Res. Space Phys. 2021, 126, e2021JA029497. [Google Scholar] [CrossRef]
- Norqvist, P.; André, M.; Tyrland, M. A statistical study of ion energization mechanisms in the auroral region. J. Geophys. Res. 1998, 103, 23459–23473. [Google Scholar] [CrossRef]
- André, M.; Norqvist, P.; Andersson, L.; Eliasson, L.; Eriksson, A.I.; Blomberg, L.; Erlandson, R.E.; Waldemark, J. Ion energization mechanisms at 1700 km in the auroral region. J. Geophys. Res. 1998, 103, 4199–4222. [Google Scholar] [CrossRef]
- Sun, J.; Wang, G.; Zhang, T.; Hu, H.; Yang, H. Evidence of Alfvén waves generated by mode coupling in the magnetotail lobe. Geophys. Res. Lett. 2022, 49, e2021GL096359. [Google Scholar] [CrossRef]
- André, M.; Crew, G.B.; Peterson, W.K.; Persoon, A.M.; Pollock, C.J.; Engebretson, M.J. Ion heating by broadband low-frequency waves in the cusp/cleft. J. Geophys. Res. 1990, 95, 20809–20823. [Google Scholar] [CrossRef]
- Jacobsen, K.S.; Moen, J.I. On the correlation between Broad-Band ELF wave power and ion fluxes in the cusp. Ann. Geophys. 2010, 28, 1249–1261. [Google Scholar] [CrossRef] [Green Version]
- Slapak, R.; Nilsson, H.; Waara, M.; André, M.; Stenberg, G.; Barghouthi, I.A. O+ heating associated with strong wave activity in the high altitude cusp and mantle. Ann. Geophys. 2011, 29, 931–944. [Google Scholar] [CrossRef] [Green Version]
- Waara, M.; Nilsson, H.; Slapak, R.; Andre, M.; Stenberg, G. Oxygen ion energization by waves in the high altitude cusp and mantle. Ann. Geophys. 2012, 30, 1309–1314. [Google Scholar] [CrossRef] [Green Version]
- Pitout, F.; Bogdanova, Y.V. The polar cusp seen by Cluster. J. Geophys. Res. Space Phys. 2021, 126, e2021JA029582. [Google Scholar] [CrossRef]
- Dandouras, I. Ion outflow and escape in the terrestrial magnetosphere: Cluster advances. J. Geophys. Res. Space Phys. 2021, 126, e2021JA029753. [Google Scholar] [CrossRef]
- Newell, P.T.; Meng, C.I. Mapping the dayside ionosphere to the magnetosphere according to particle precipitation characteristics. Geophys. Res. Lett. 1992, 19, 609–612. [Google Scholar] [CrossRef]
- Smith, M.F.; Lockwood, M. Earth’s magnetospheric cusps. Rev. Geophys. 1996, 34, 233–260. [Google Scholar] [CrossRef]
- Lockwood, M. Relationship of dayside auroral precipitations to the open-closed separatrix and the pattern of convective flow. J. Geophys. Res. 1997, 102, 17475–17487. [Google Scholar] [CrossRef]
- Escoubet, C.P.; Berchem, J.; Trattner, K.J.; Pitout, F.; Richard, R.; Taylor, M.G.G.T.; Soucek, J.; Grison, B.; Laakso, H.; Masson, A.; et al. Double cusp encounter by Cluster: Double cusp or motion of the cusp? Ann. Geophys. 2013, 31, 713–723. [Google Scholar] [CrossRef] [Green Version]
- Gustafsson, G.; Boström, R.; Holback, B.; Holmgren, G.; Lundgren, A.; Stasiewicz, K.; Åhlén, L.; Mozer, F.S.; Pankow, D.; Harvey, P.; et al. The electric field and wave experiment for the Cluster mission. Space Sci. Rev. 1997, 79, 137–156. [Google Scholar] [CrossRef]
- Balogh, A.; Dunlop, M.W.; Cowley, S.W.H.; Southwood, D.J.; Thomlinson, J.G.; Glassmeier, K.H.; Musmann, G.; Lühr, H.; Buchert, S.; Acuna, M.H.; et al. The Cluster magnetic investigation. Space Sci. Rev. 1997, 79, 65–91. [Google Scholar] [CrossRef]
- Fuselier, S.A.; Lockwood, M.; Onsager, T.G.; Peterson, W.K. The source population for the cusp and cleft/LLBL for southward IMF. Geophys. Res. Lett. 1999, 26, 1665–1669. [Google Scholar] [CrossRef] [Green Version]
- Bogdanova, Y.V.; Owen, C.J.; Fazakerley, A.N.; Klecker, B.; Rème, H. Statistical study of the location and size of the electron edge of the Low-Latitude Boundary Layer as observed by Cluster at mid-altitudes. Ann. Geophys. 2006, 24, 2645–2665. [Google Scholar] [CrossRef] [Green Version]
- Escoubet, C.P.; Bosqued, J.M. The influence of IMF-Bz and/or AE on the polar cusp: An overview of observations from the Aureol-3 satellite. Planet. Space Sci. 1989, 37, 609–626. [Google Scholar] [CrossRef]
- Wing, S.; Newell, P.T.; Ruohoniemi, J.M. Double cusp: Model prediction and observational verification. J. Geophys. Res. 2001, 106, 25571–25593. [Google Scholar] [CrossRef]
- Kronberg, E.A.; Ashour-Abdalla, M.; Dandouras, I. Circulation of Heavy Ions and Their Dynamical Effects in the Magnetosphere: Recent Observations and Models. Space Sci. Rev. 2014, 184, 173–235. [Google Scholar] [CrossRef]
- Stenuit, H.; Sauvaud, J.-A. Evidence for storm-time ionospheric ion precipitation in the cusp with magnetosheath energy. Ann. Geophys. 2004, 22, 1765–1771. [Google Scholar] [CrossRef] [Green Version]
- Lee, S.H.; Zhang, H.; Zong, Q.-G.; Otto, A.; Sibeck, D.G.; Wang, Y.; Glassmeier, K.-H.; Daly, P.W.; Rème, H. Plasma and energetic particle behaviors during asymmetric magnetic reconnection at the magnetopause. J. Geophys. Res. Space Phys. 2014, 119, 1658–1672. [Google Scholar] [CrossRef] [Green Version]
- Dandouras, I.; Barthe, A.; the CIS Team. User Guide to the CIS measurements in the Cluster Active Archive (CAA). 2014. Available online: https://caa.esac.esa.int/documents/UG/CAA_EST_UG_CIS_v37.pdf (accessed on 16 January 2023).
- Griffiths, D. Introduction to Electrodynamics, 4th ed.; P347; Cambridge University Press: Cambridge, UK, 2017; ISBN 9781108420419. [Google Scholar] [CrossRef]
- Liu, W.W.; Rostoker, G. Energetic ring current particles generated by recurring substorm cycles. J. Geophys. Res. Space Phys. 1995, 100, 21897–21910. [Google Scholar] [CrossRef]
- Daglis, I.A.; Thorne, R.M.; Baumjohann, W.; Orsini, S. The terrestrial ring current: Origin, formation, and decay. Rev. Geophys. 1999, 37, 407–438. [Google Scholar] [CrossRef]
- Ono, Y.; Nosé, M.; Christon, S.P.; Lui, A.T.Y. The role of magnetic field fluctuations in nonadiabatic acceleration of ions during dipolarization. J. Geophys. Res. Space Phys. 2009, 114, 1–11. [Google Scholar] [CrossRef]
- Yau, A.W.; Shelley, E.G.; Peterson, W.K.; Lenchyshyn, L. Energetic auroral and polar ion outflow at DE-1 altitudes: Magnitude, composition, magnetic activity dependence and long term variations. J. Geophys. Res. 1985, 90, 8417–8432. [Google Scholar] [CrossRef]
- Yau, A.W.; Peterson, W.K.; Shelley, E.G. Quantitative parametrization of energetic ionospheric ion outflow. Geophys. Monogr. Ser. 1988, 44, 211–217. [Google Scholar] [CrossRef]
- Peterson, W.K.; Collin, H.L.; Yau, A.W.; Lennartsson, O.W. Polar/Toroidal Imaging Mass-Angle Spectrograph observations of suprathermal ion outflow during solar minimum conditions. J. Geophys. Res. 2001, 106, 6059–6066. [Google Scholar] [CrossRef]
- Cully, C.M.; Donovan, E.F.; Yau, A.W.; Arkos, G.G. Akebono/Suprathermal Mass Spectrometer observations of low-energy ion outflow: Dependence on magnetic activity and solar wind conditions. J. Geophys. Res. 2003, 108, 1093–1103. [Google Scholar] [CrossRef] [Green Version]
- Lund, E.J.; Mobius, E.; Carlson, C.W.; Ergun, R.E.; Kistler, L.M.; Klecker, B.; Klumpar, D.M.; McFadden, J.P.; Popecki, M.A.; Strangeway, R.J.; et al. Transverse ion acceleration mechanism in the aurora at solar minimum: Occurrence distributions. J. Atmos. Terr. Phys. 2000, 62, 467–475. [Google Scholar] [CrossRef]
- Topliss, S.; Johnstone, A.; Coates, A.; Peterson, W.K.; Kletzing, C.A.; Russell, C.T. Charge neutrality and ion conic distributions at the equatorward electron edge of the midaltitude cusp. J. Geophys. Res. 2001, 106, 21095–21108. [Google Scholar] [CrossRef]
- Bogdanova, Y.V.; Owen, C.J.; Fazakerley, A.N.; Klecker, B.; Reme, H. Cluster Observations of the Electron Low-Latitude Boundary Layer at Mid-Altitudes. In Proceedings of the Cluster and Double Star Symposium—5th Anniversary of Cluster in Space, Noordwijk, The Netherlands, 19–23 September 2005. [Google Scholar]


Disclaimer/Publisher’s Note: The statements, opinions and data contained in all publications are solely those of the individual author(s) and contributor(s) and not of MDPI and/or the editor(s). MDPI and/or the editor(s) disclaim responsibility for any injury to people or property resulting from any ideas, methods, instructions or products referred to in the content. |
© 2023 by the authors. Licensee MDPI, Basel, Switzerland. This article is an open access article distributed under the terms and conditions of the Creative Commons Attribution (CC BY) license (https://creativecommons.org/licenses/by/4.0/).
Share and Cite
Li, B.; Yang, H.; Sun, J.; Hu, Z.; Liu, J.; Chen, X.; Wang, Y.; Ren, J.; Yue, C.; Escoubet, C.P.; et al. Cluster Observation of Ion Outflow in Middle Altitude LLBL/Cusp from Different Origins. Magnetochemistry 2023, 9, 39. https://doi.org/10.3390/magnetochemistry9020039
Li B, Yang H, Sun J, Hu Z, Liu J, Chen X, Wang Y, Ren J, Yue C, Escoubet CP, et al. Cluster Observation of Ion Outflow in Middle Altitude LLBL/Cusp from Different Origins. Magnetochemistry. 2023; 9(2):39. https://doi.org/10.3390/magnetochemistry9020039
Chicago/Turabian StyleLi, Bin, Huigen Yang, Jicheng Sun, Zejun Hu, Jianjun Liu, Xiangcai Chen, Yongfu Wang, Jie Ren, Chao Yue, C. Philippe Escoubet, and et al. 2023. "Cluster Observation of Ion Outflow in Middle Altitude LLBL/Cusp from Different Origins" Magnetochemistry 9, no. 2: 39. https://doi.org/10.3390/magnetochemistry9020039