
Polarized Neutron Diffraction: An Excellent Tool to Evidence the Magnetic Anisotropy—Structural Relationships in Molecules


1
Laboratoire des Multimatériaux et Interfaces, UMR CNRS 5615, Université Claude Bernard Lyon 1, CEDEX, 69622 Villeurbanne, France
2
Laboratoire Léon Brillouin (LLB), CEA-CNRS, UMR CNRS 12, C.E.A. Saclay, 91191 Gif-sur-Yvette, France
*
Author to whom correspondence should be addressed.
Magnetochemistry 2021, 7(12), 158; https://doi.org/10.3390/magnetochemistry7120158
Submission received: 26 September 2021
/
Revised: 28 November 2021
/
Accepted: 30 November 2021
/
Published: 6 December 2021
(This article belongs to the Special Issue From Magnetic Anisotropy to Molecular Magnets: Theory and Experiments)
Abstract
:This publication reviews recent advances in polarized neutron diffraction (PND) studies of magnetic anisotropy in coordination compounds comprising d or f elements and having different nuclearities. All these studies illustrate the extent to which PND can provide precise and direct information on the relationship between molecular structure and the shape and axes of magnetic anisotropy of the individual metal sites. It makes this experimental technique (PND) an excellent tool to help in the design of molecular-based magnets and especially single-molecule magnets for which strong uniaxial magnetic anisotropy is required.
1. Introduction
With a magnetic moment and no charge, neutron provides several key scattering techniques dedicated to probing magnetic materials at the atomic level [1,2]. These techniques are particularly relevant in the field of molecule-based magnets [3] as they are a complementary experimental support for the validation of theoretical assumptions and calculations [4] and this is true for all coordination chemistry [2]. Inelastic neutron scattering (INS) provides spectrometric methods to access the energy of magnetic transitions [3,5,6,7,8] while elastic diffraction by crystals allows the determination of the magnetic structure [9]. It should be stressed that most of the difficulties that have long been put forward such as the crystal size or the large number of hydrogen atoms have been lifted thanks to improvement in methods and devices.
Polarized Neutron Diffraction (PND) on single crystals is one of the most powerful among these techniques [10,11,12]. In use from 1960, it has been fantastically boosted since the 80s with the advent of molecular-based magnets. PND proved indeed to be particularly powerful to map the atomic spin density in molecular compounds where it generally spreads on many atoms out of the magnetic centres with delocalization on the ligands as in coordination compounds or on the whole molecule in free radicals [13,14,15,16,17,18,19]. The strength of PND is that mapping the spin density distribution from single crystal diffraction data provides direct information on the relationships between the crystal structure and the magnetic interactions pathways as well as the nature of intra- or inter-molecular magnetic couplings. From this point of view, PND has greatly contributed to validate and refine the theoretical models of the exchange coupling processes in molecular compounds [20,21,22].
Driven by the field of single-molecule magnets (SMMs), recent investigations [23,24] make PND also a technique of choice to map the magnetic anisotropy in molecular compounds. As we know, one of the main challenges in the field of single molecule magnets (SMM) lies in the structural control of the molecular magnetic anisotropy that should be uniaxial and negative. This requires a good knowledge of the magneto-structural relationships at the molecular level. In this review, we show that PND can help in such a knowledge as it allows a direct watching of the direction and strength of the principal magnetic anisotropy axes of each individual magnetic metal ions site relative to the molecules orientation. This will be illustrated hereafter by PND studies of metal complexes of cobalt(II) [23,24], iron(III) [25,26] and nickel(II) [27] with various nuclearities as well of some lanthanides systems of dysprosium(III) [28] and ytterbium(III) [29].
2. Basics of Polarized Neutron Diffraction
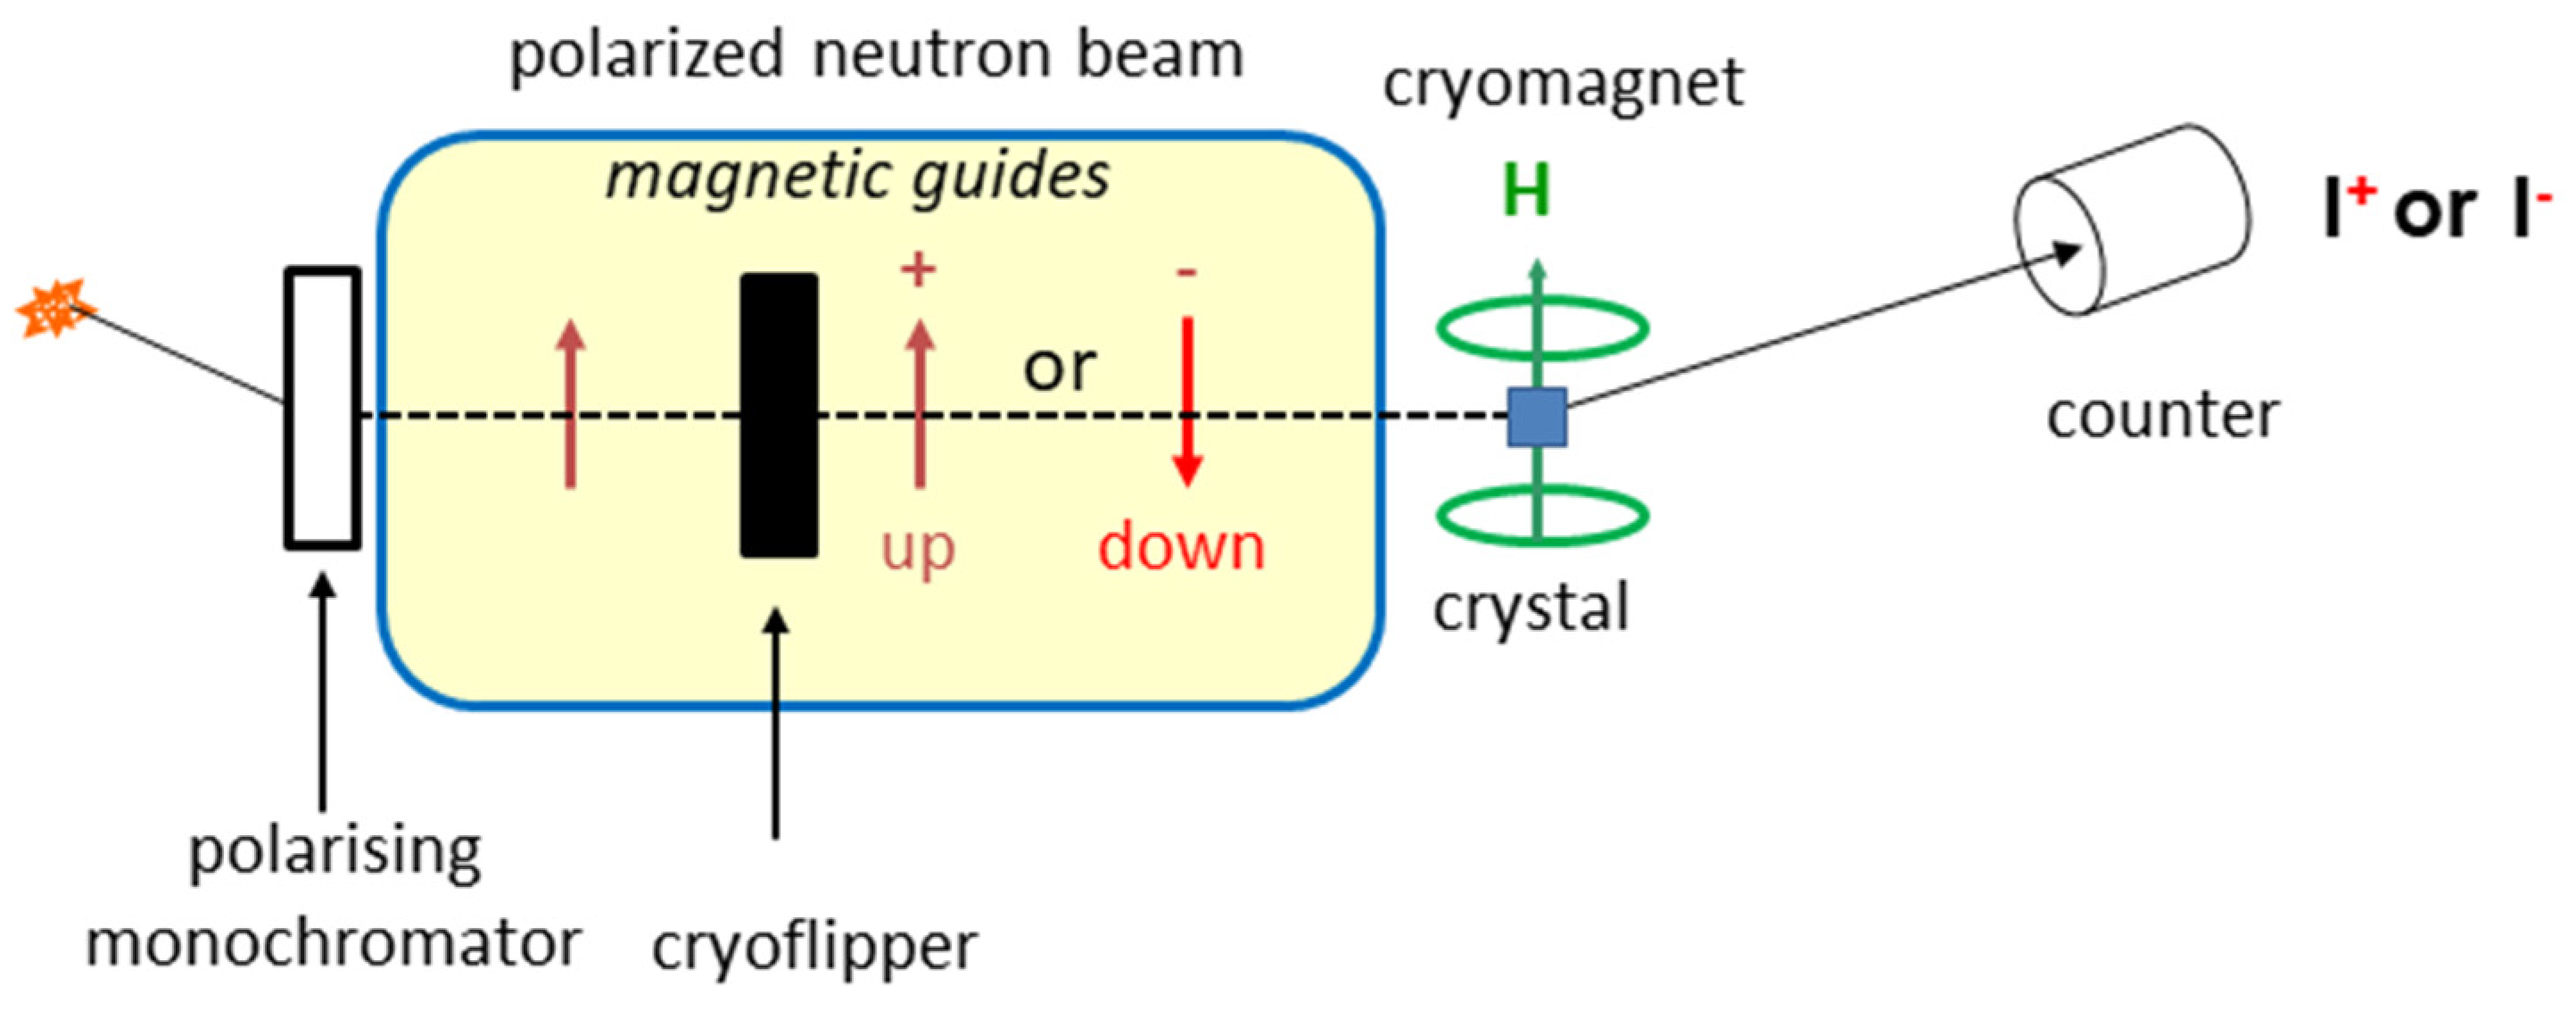
The experimental set-up of a polarized neutron diffractometer is presented in Figure 1. A vertical magnetic field is applied to a single crystal set at the center of a lifting-counter diffractometer. The incident neutron beam is monochromatic and polarized with a vertical direction of polarization.
Flipping ratio method: Mapping the field-induced magnetization density in paramagnetic compounds by PND relies on the measurement of the so-called flipping ratio R(Q) for Bragg reflections of scattering vector Q (Figure 1) [12]:
I+ and I− are the diffracted intensities by the crystal which are measured with the polarization vector P of the incident neutron beam, respectively, and alternatively set either parallel (P+) or antiparallel (P−) to the vertically applied magnetic field. The advantage of measuring such a ratio is that there is no need for measuring integrated intensities. The experimental determination of the flipping ratio consists in measuring the peak intensity and the left and right backgrounds in the two incident polarization cases:
In the general case, the intensities are given by
where FN and FM are the nuclear and the magnetic structure factors, respectively, and the symbol (*) denotes the complex conjugate.
Assuming that magnetization is localized on the atoms, the magnetic structure factor is defined as a vectorial sum over all the magnetic atoms in the unit cell:
where fmi(Q) and mi are the normalized magnetic form factor and the induced magnetic moment on atom i, respectively.
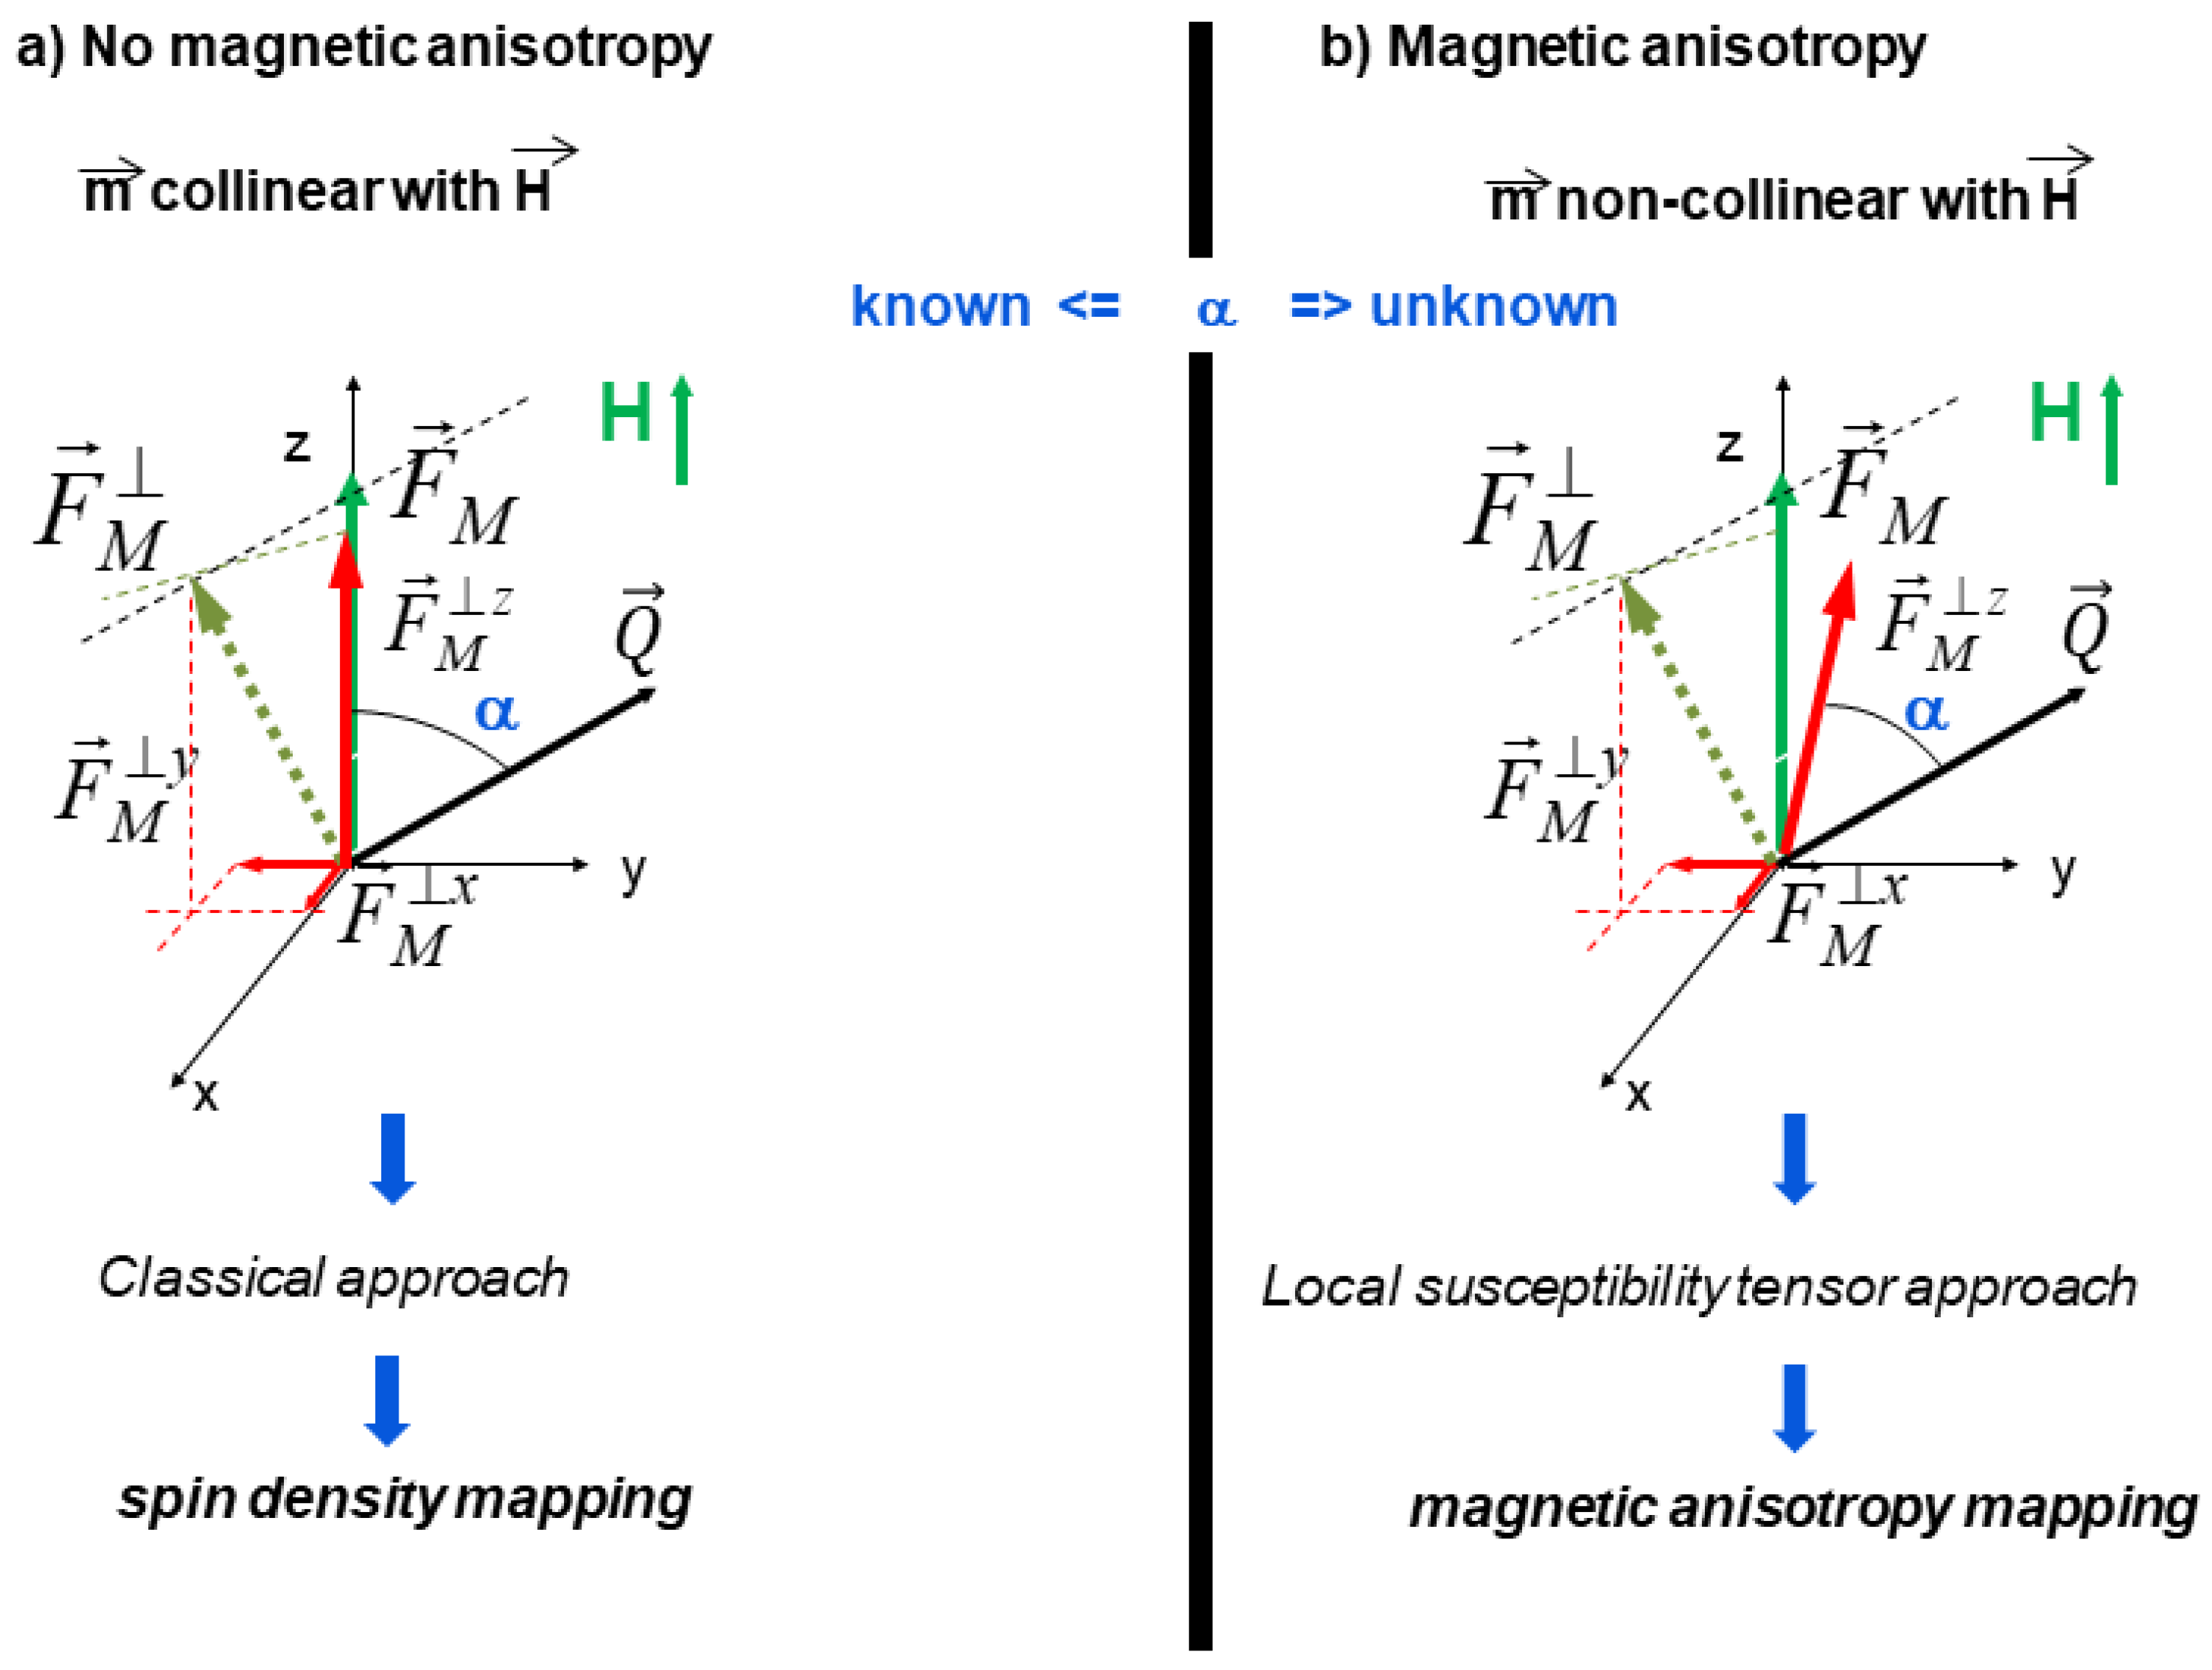
The magnetic structure factor FM is a vector directed along the total magnetic moment in the unit cell, resulting from the sum of the local magnetic moments. In paramagnetic materials with weak magnetic anisotropy all magnetic moments are aligned along the vertical magnetic field and the term FM⊥ in Equation (2) refers to the component of FM perpendicular to the scattering vector Q as illustrated by Figure 2a.
For centric structures, both nuclear and magnetic structure factors are real and the expression of the flipping ratio simply becomes. For Q in the horizontal plane.
The magnetic structure factor is then given by:
The values of FN are determined in another experiment by performing complementary non-polarized neutron diffraction measurements at the same temperature and without applied magnetic field.
Local susceptibility tensor approach. Most previous PND spin density studies [13,14,15,16,17,18,19] were restricted to simple cases without or with weak magnetic anisotropy. It is because in these cases, all magnetic moments can be aligned by the external magnetic field (Figure 2a) and the direction of the magnetic structure factor FM is then well known from experimental setting. The situation is completely different when there is strong atomic anisotropy. In that case, the atomic field-induced moments are indeed no more collinear with the applied magnetic field (Figure 2b), so that the spin density reconstruction is not possible using the usual approach described in the previous sections.
This difficulty was solved by A. Gukasov and P.J. Brown with an approach that involves the definition of a local or site susceptibility tensor for each magnetic atom of the unit cell which gives the magnetic response of the atom to an applied magnetic field [30]. The magnetic moment mi induced on an atom i by an applied magnetic field H can indeed be written as the product:
where is the magnetic susceptibility tensor of atom i. It is a second rank tensor, symmetric across the diagonal, thus having only six independent components [31]:
The experimental flipping ratios contain all information on both the orientation and the magnitude of the atomic magnetic moments throughout the unit cell and can be expressed in terms of these susceptibility components through the magnetic structure factor FM by combining Equations (3) and (5). The refinement of the six susceptibility components χij from the experimental flipping ratios is realized using the least-squares refinement program CHILSQ developed in the frame of the CCSL library [32] The number of independent tensor components, to be refined, is determined by the local symmetry of the magnetic atom site. In the most general case (triclinic local symmetry), when the atom is located in general position, all six independent susceptibility components χij must be simultaneous refined. This requires the measurement of at least three sets of flipping ratios collected for three orthogonal directions of the applied magnetic field. It should be stressed that the magnetic response should be linear whatever the field direction is, i.e., this is valid as long as the applied field is sufficiently low to remain in the linear paramagnetic regime.
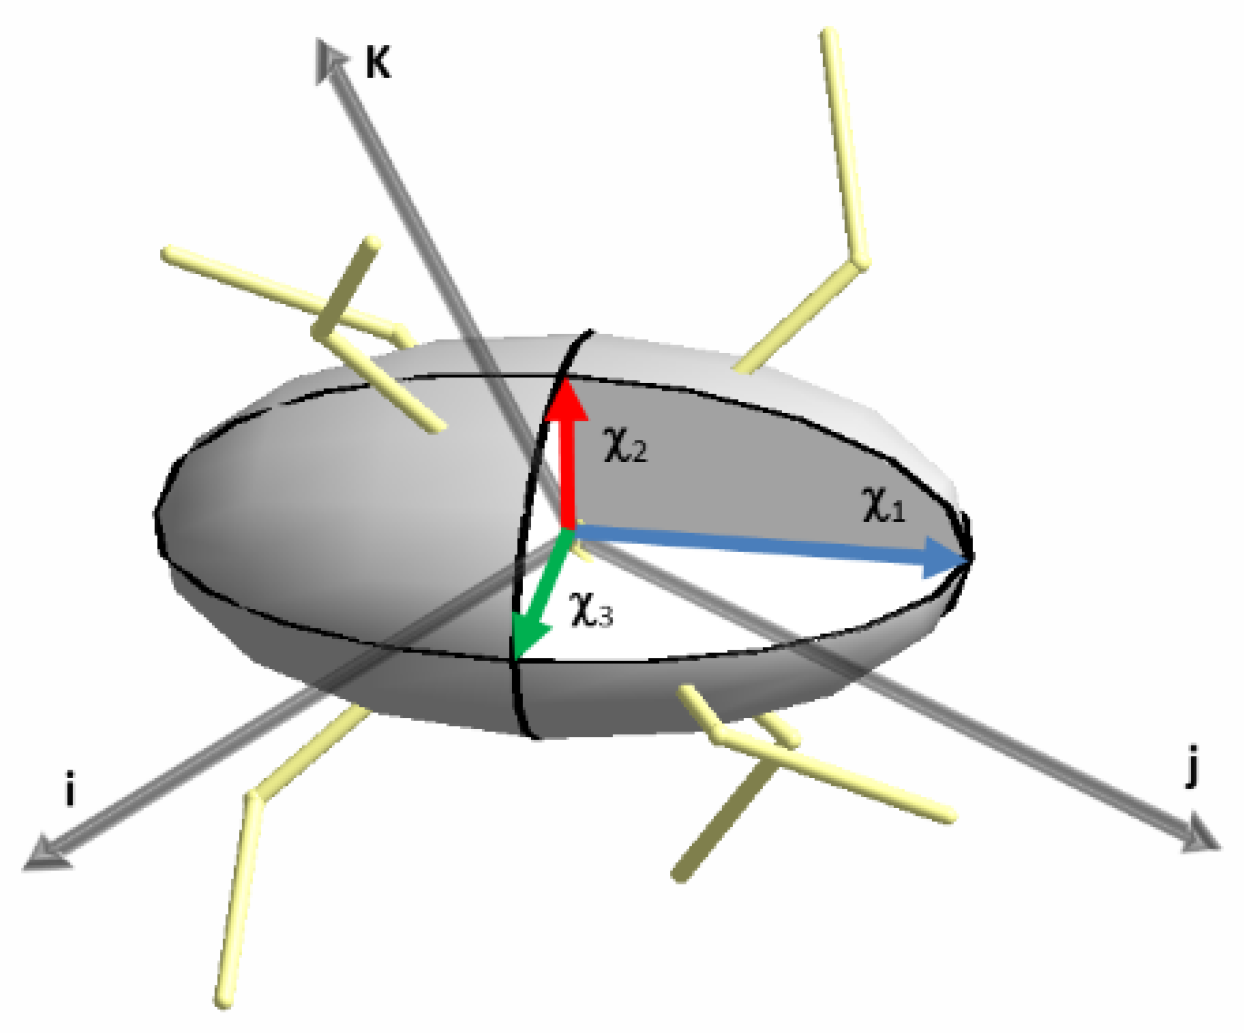
The diagonalization of this two-rank tensor provides the eigenvectors and eigenvalues of the magnetic principal directions i.e., the directions of the magnetic axes and the associated magnetic susceptibilities (χ1, χ2 and χ3). When they are all positive, it is then possible to make a graphical representation of the site susceptibility tensor as an ellipsoid onto the molecular structure (Figure 3). This drawing, from the six components susceptibility tensor (χij), is similar to what is currently done with crystallographic thermal parameters (Uij). As we will see, this allows the visualization of the direction of the principal magnetic axes onto the molecule whether the anisotropy is of easy-axis (Ising) or easy-plane type. This is a way to easily evidence magneto-structural relationships (Figure 3).
3. PND Mapping of the Magnetic Anisotropy in Coordination Compounds
The magnetic anisotropy is primarily that of the single ion and relates to the splitting of the spin-orbit states of the free ion in a zero applied magnetic field (ZFS) which results from the combined effects of the crystal electric field and spin-orbit coupling. In polynuclear complexes, where several magnetic centers can interact, another source of magnetic anisotropy is added, which comes from the exchange interaction [33].
Several experimental techniques are in use to study magnetic anisotropy. This is the case of electron paramagnetic resonance spectroscopy (EPR) which is widely used to study magnetic molecular compounds and in particular the magnetic anisotropy of SMMs [34,35,36,37]. Another spectroscopic technique, related to neutrons, is inelastic neutron scattering (INS). INS, like EPR, allows direct measurement of the energy spectrum of magnetic levels to determine magnetic anisotropy and crystal field terms [3,5,6,7,8,38]. Because INS is essentially a zero-field magnetic technique, it should allow for more accurate determination of separation parameters at zero field than EPR. Alas, one of the drawbacks of INS, with respect to the study of molecular compounds, is that it requires large amounts of sample (~1 g) with few hydrogen atoms; otherwise, it needs deuteration to reduce incoherent diffusion. It is important to note that these spectroscopic techniques are mostly limited to determining the magnitude and sign of the magnetic anisotropic parameters (axial D and rhombic E terms) and generally involve the entire molecule, not individual magnetic ions. Other experimental techniques have to do with magnetometry (SQUID, VSM and torque). With magnetic measurements on single crystals by cantilever torque magnetometry [39], or more generally by angle resolved magnetometry with SQUID (ARM) [38,40,41], one can access the magnetic susceptibility tensor of the crystal. Beyond that, extracting the principal axes of the molecular magnetic anisotropy, possibly those of the metal center, is only possible in certain very limited cases and still in the case of mononuclear systems. Indeed, in molecular-based compounds, the magnetic anisotropy measured on a single crystal results from the combination of the molecular anisotropy and the crystal symmetry of the space group. Thus, the crystal anisotropy tensor rarely coincides with the molecular tensor. This only happens if the molecules all have the same orientation in the crystal. In most cases therefore, from the usual spectroscopy techniques or magnetization measurements it is impossible to acquire complete and precise information on the local magnetic properties (orientation of the anisotropy axes) even when performed on single crystals.
This is the reason we developed PND as an experimental technique to acquire this information in molecular compounds. Indeed, as it is a diffraction method, PND on single crystals allows the precise determination of the magnetic anisotropy axes at the crystalline, molecular and atomic levels whatever the symmetry of the crystal as illustrated hereafter.
The outline of this review, almost chronological, is that of increasing difficulty but also of increasing richness in terms of information provided by PND. Thus, for mononuclear systems, we will have a view of the structural parameters affecting the single-ion anisotropy, which is useful in the study of SMMs. For polynuclear systems, it even goes further to give a visualization of the interplay in between the local magnetic anisotropy and magnetic interactions.
3.1. Mononuclear Coordination Compounds
3.1.1. Transition Metal Compounds
Mononuclear cobalt(II) and iron(III) coordination compounds, [CoII(DMF)6](BPh4)2 (1) and PPh4[FeIII(Tp)(CN)3]·H2O (2) (DMF = N,N-dimethylformamide; BPh4− = tetraphenylborate; Tp = tris(pyrazolyl)borate and PPh4+ = tetraphenylphosphate) have been among the first molecular compounds to be studied by PND with the local susceptibility tensor approach [24,25].
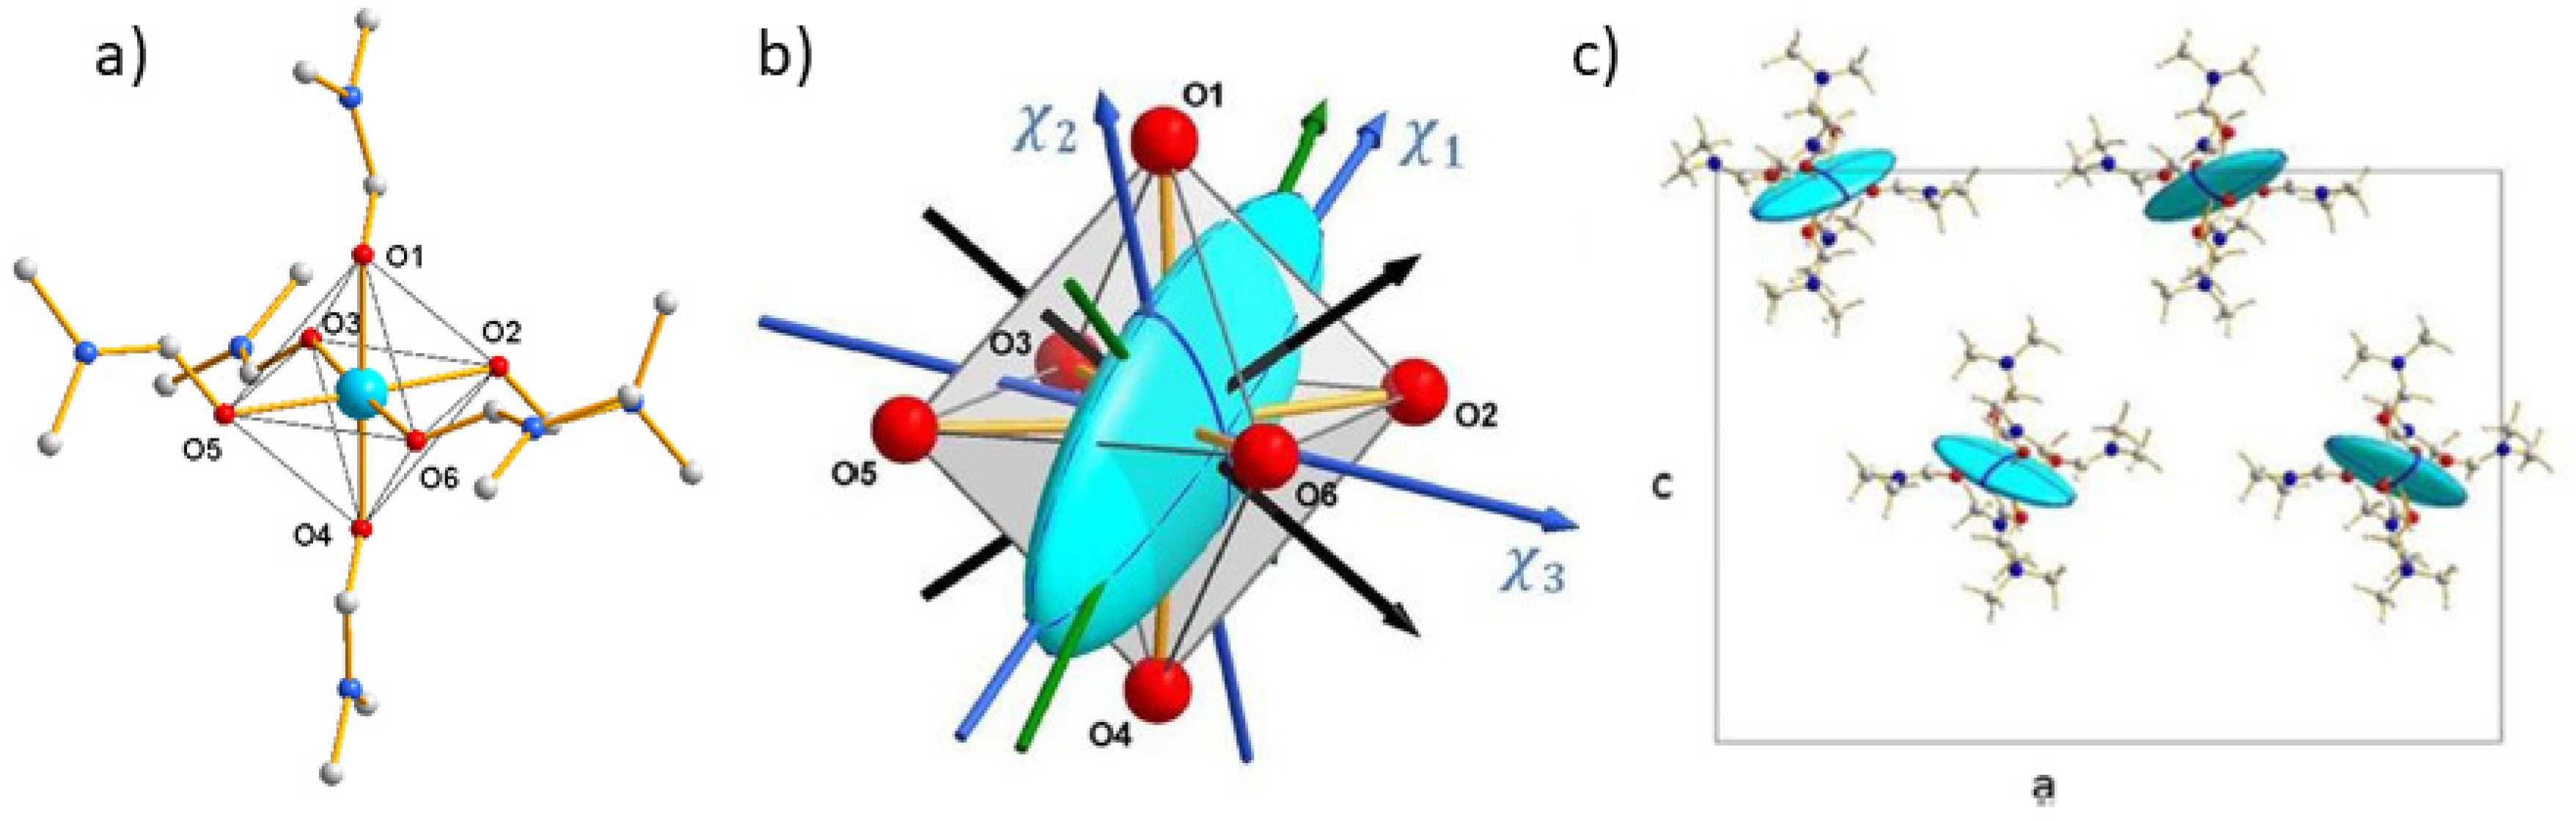
The compound (1) crystallizes in the orthorhombic space group Pca21 with four molecules per unit cell [42]. The Co(II) ion lies in a slightly distorted octahedral environment of six oxygen atoms and the overall symmetry of the [Co(DMF)6]2+ cation is approximated as a S6 point group [42]. The coordination octahedron is compressed along the O2-O3 and O5-O6 directions and is rather elongated along the perpendicular directions O2-O6 and O3-O5 (Figure 4a).
The temperature dependence of the magnetic susceptibility evidenced an appreciable magnetic anisotropy in (1) and angle-resolved magnetometry (ARM) confirmed that the magnetic principal directions of the crystal coincide with the crystallographic axes as expected for an orthorhombic lattice. From these measurements the a axis could be assigned to the easy magnetization axis while the c axis is the hard one (χa > χb > χc) However, the four molecules generated by the space group symmetry (Pca21) in the crystal cell are all oriented differently. Therefore ARM cannot provide better than the magnetic anisotropy tensor of the crystal (7).
Indeed, despite it being the sum of the local susceptibility tensors of the four molecules in the cell (7), their different orientations hindered the determination of their own axes. This was successfully achieved by PND after collecting flipping ratios on one large single-crystal (240 mm3) for each of the three crystallographic axes successively set along the vertical direction of a moderate applied magnetic field of 1T [24].
The diagonalization of this tensor provides the eigenvectors and eigenvalues of the magnetic principal directions (χ1 = 1.91(35) ; χ2 = 0.99(26) ; χ3 = 0.36(33) ). The drawing of the susceptibility ellipsoid onto the molecule shows an elongated shape along χ1 that is the local easy magnetization axis. In the two other directions we have χ2 and χ3 as local hard magnetization axes. From this drawing we can easily see that the easy magnetization axis is close to the O1-O2-O3/O4-O5-O6 trigonal elongation axis of the octahedron (green axis on Figure 4b) and the hard axis (χ3) almost parallel to the compression directions O2-O3 and O5-O6 (black axis on Figure 4b).
Summing the local susceptibility tensor (8) of the four molecules in the cell (Figure 4c) and taking into account the symmetry operations (7), gives the local magnetic tensor of the crystal (9). It is diagonal in the Cartesian coordinate system (i, j, k) because of the orthorhombic symmetry and thus takes the χ11, χ22 and χ33 components of the local tensors:
This was found to be in good agreement with ARM and confirms that the a axis is the easy magnetization axis 1.59(7) of the crystal whereas the c axis is the hard one (0.65(8) ). The small discrepancies may be ascribed to the imperfect orientation of the single-crystal in the SQUID while for PND the orientation is precise but measurement of magnetic moments is not.
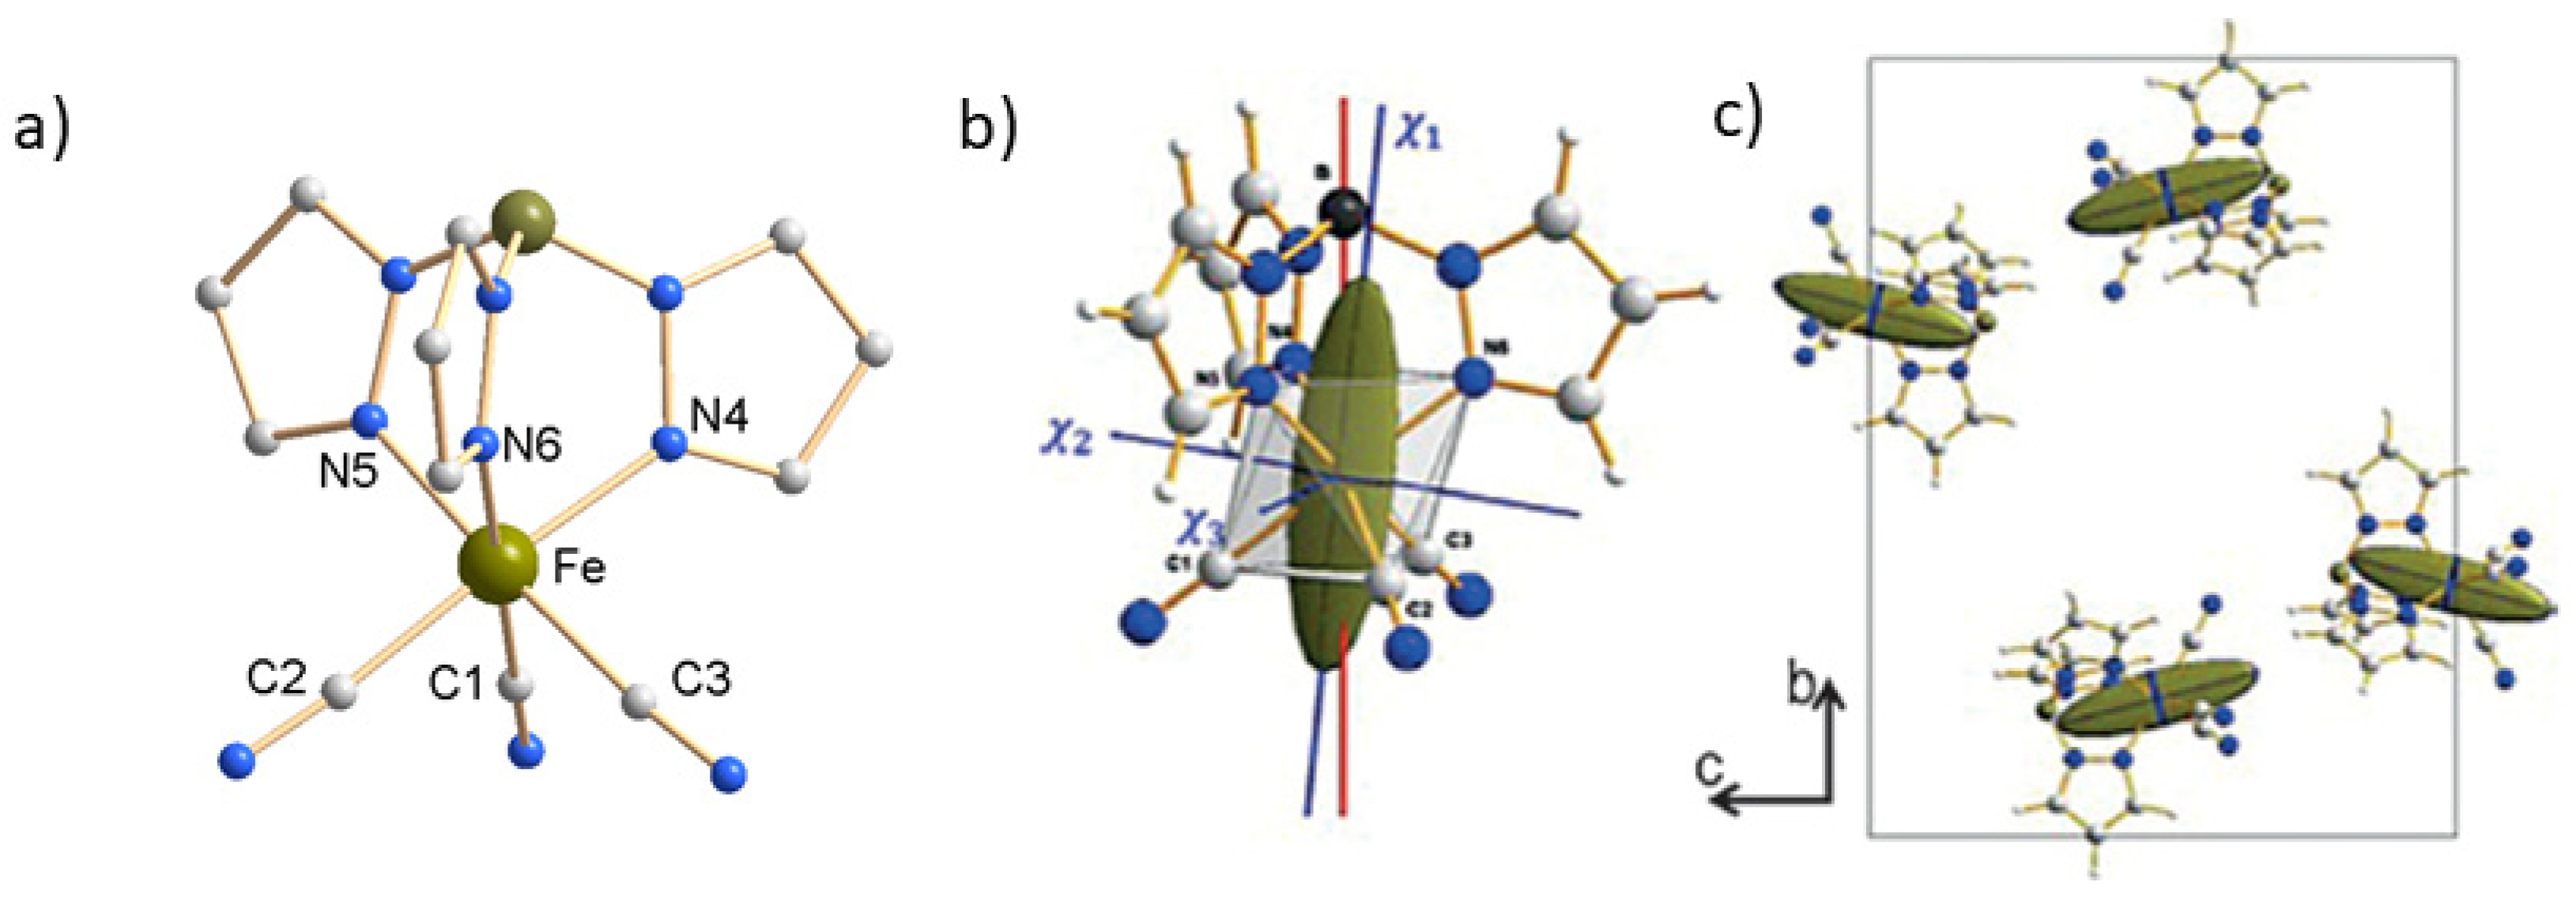
The iron(III) compound, PPh4[FeIII(Tp)(CN)3]·H2O (2), crystallizes in the monoclinic space group P21/c [43]. The Fe(III) ion is coordinated in an octahedral environment by three carbon atoms of cyanide ligands in facial arrangement and three nitrogen atoms of tridentate trispyrazolylborate. The symmetry is close to C3v and the octahedron is slightly elongated along the C3 pseudo-axis going through the iron and boron atoms (Figure 5a).
The P21/c space group generates four symmetry-related complex molecules in the unit cell, but since it is centrosymmetric they have only two different orientations. However, this is still too much and as with the previous mononuclear cobalt complex (1), the magnetic axes of the complex and the crystal do not coincide. Therefore, the local molecular magnetic anisotropy cannot be deduced by the usual macroscopic techniques. Here again, the determination of the six components of the Fe(III) local susceptibility tensor (10) was successfully achieved by PND at 2K on one single crystal (36 mm3) from the flipping ratios collected for three orthogonal directions under an applied magnetic field of 1 T.
The shape of susceptibility ellipsoid (Figure 5b) clearly shows the existence of a molecular easy magnetization (χ1= 0.87(7), χ2 = 0.23(8) and χ3 = 0.09(5) . The χ1 easy magnetization direction is found very close to the C3 pseudo-axis (red solid line in Figure 5b). The two other magnetic principal directions χ2 and χ3 are almost contained in the plane parallel to the triangular faces N4-N5-N6 and C1-C2-C3 of the octahedron. Further, the macroscopic susceptibility tensor (11) of the crystal is obtained as previously by summing the four local tensors determined by PND measurements.
As expected for a monoclinic space group, the χ12 and χ23 components vanish when summing the four local tensors. In this case, the monoclinic symmetry of the crystal imposes the b axis as one of the magnetic principal directions of the crystal for which the magnetic susceptibility is denoted χm2 (χm2 = χb = 0.27(7) . The two other magnetic principal directions χm1 and χm3 are then contained in the (a,c) plane. More precisely, the hard magnetization axis of the crystal χm1 = 0.09(4) is found very close to the a axis while the easy magnetization axis χm3 = 0.83(6) is perpendicular to it. This orientation of the easy and hard axes for the crystal anisotropy (Figure 5c) is in agreement, as may be expected, with SQUID angle-resolved measurements of the magnetic susceptibility on single crystal. The values of the macroscopic magnetic susceptibilities which may be calculated from the PND crystal susceptibility tensor (9), at 2 K and for any direction of the applied magnetic field, do not show appreciable discrepancy with those from SQUID measurements.
3.1.2. Lanthanide Metal Compounds
If one thinks of SMMs then these two first examples of mononuclear systems with transition metal ions and small magnetic anisotropy may seem less significant. However, they have been very useful in developing, adapting, and extending the local susceptibility approach to molecular systems, and these results have been a proof that it works. Lanthanide coordination compounds are of course more relevant to SMMs and in addition PND studies could be done on smaller crystals because of the stronger magnetic response. However, because they generally have stronger magnetic anisotropy, almost uniaxial, the magnetic response may be very weak along the hard magnetic axes. This means that PND studies of lanthanide complexes are more demanding in terms of collection strategy and measurement of flipping ratios as illustrated hereafter by the studies of two Dy(III) and one Yb(III) coordination compounds [28,29]. Dealing first with lanthanides could have been more tedious and may be less proofing.
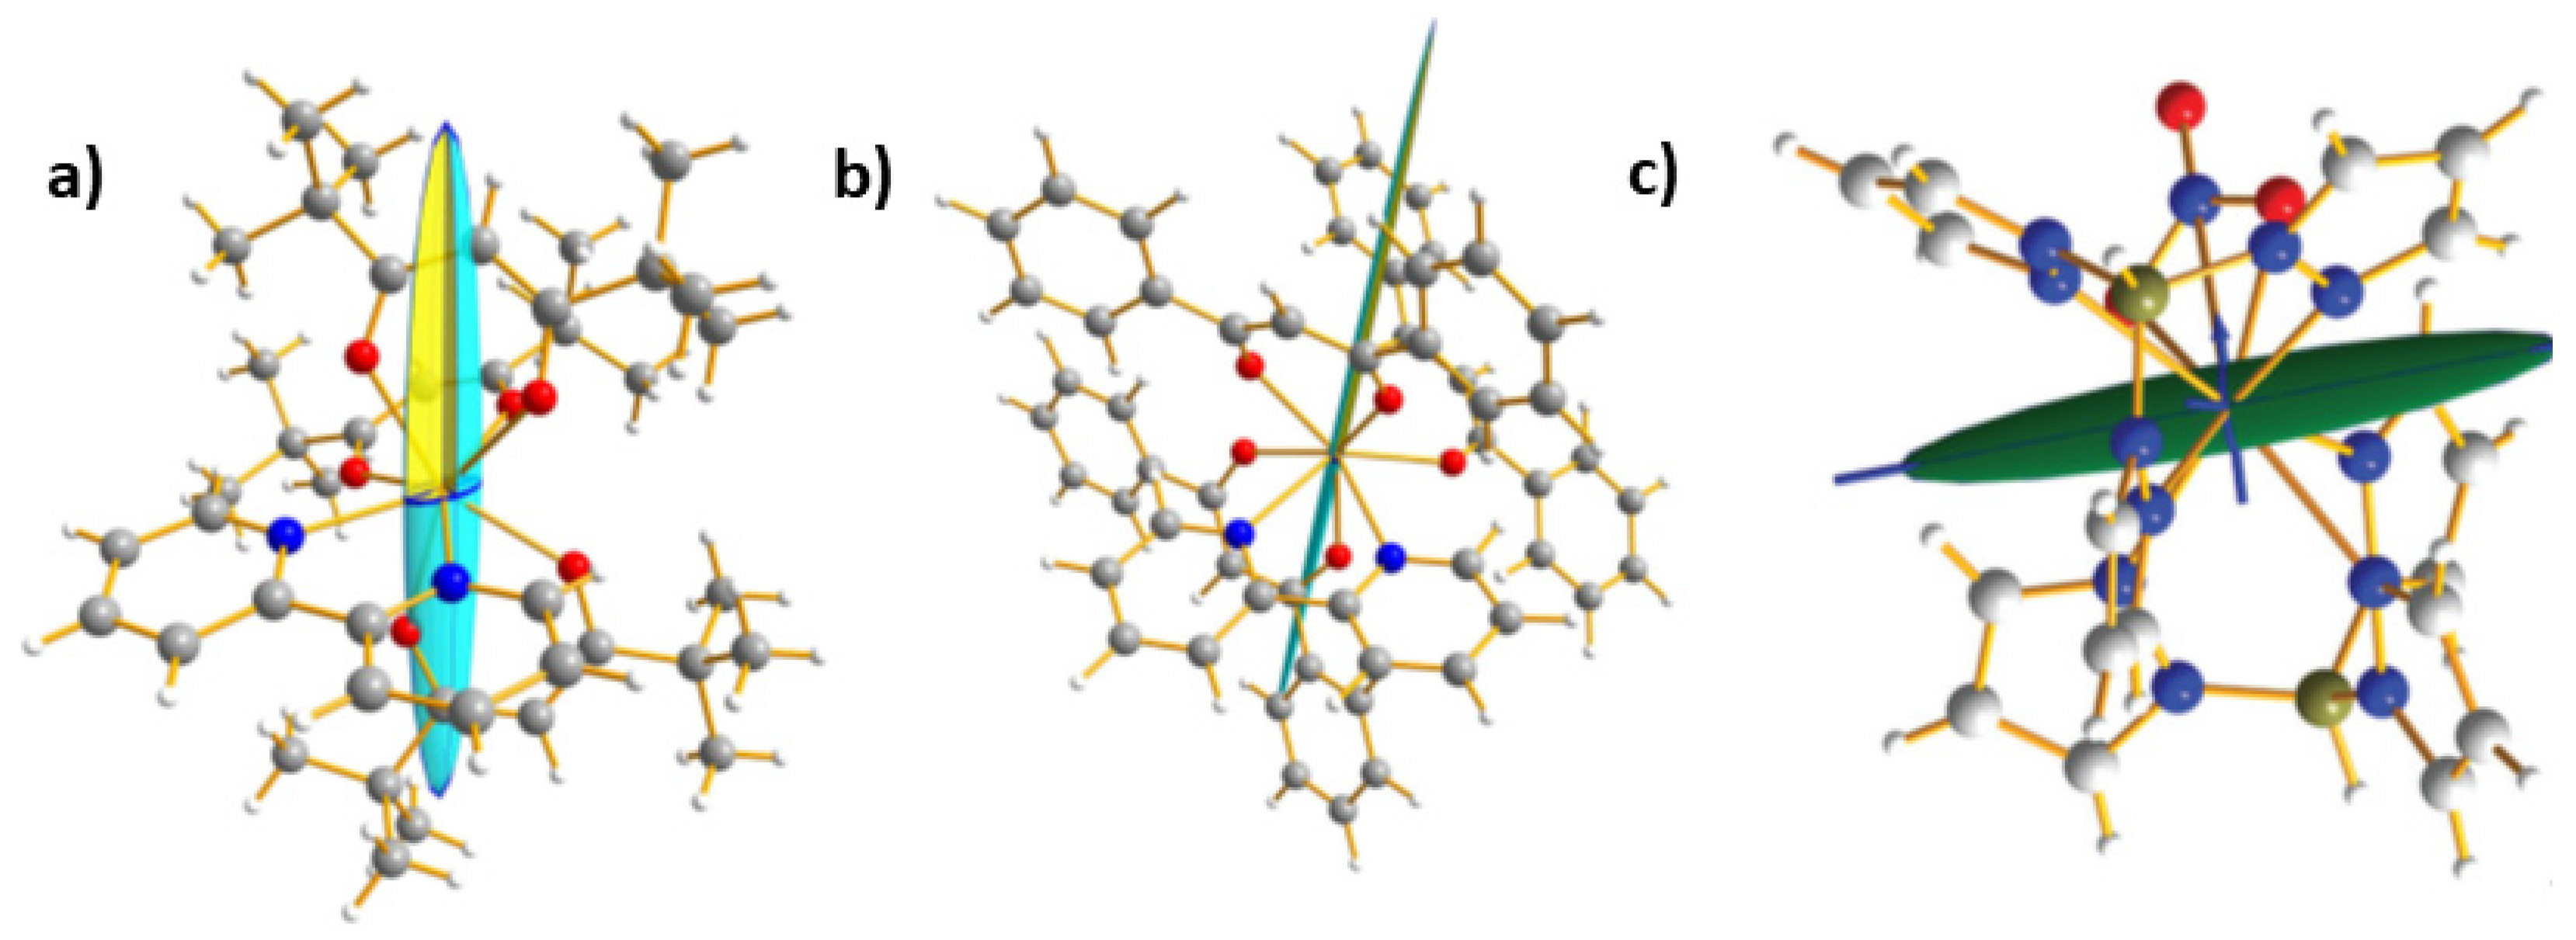
The first example of PND study of magnetic anisotropy on lanthanide coordination compound was the dysprosium(III) complex [DyIII(bpy)(tBu-acac)3] (3) (bpy = bpy = 2,2′-bipyridine; tBu-acac = 2,2,6,6-tetramethylheptane-3,5-dionate) [28]. It has been shown to exhibit SMM behaviour, and its magnetic anisotropy was measured by ARM [44]. Indeed, it crystallizes in the triclinic crystal system (P-1) and it is one rare case where ARM gives the molecular magnetic anisotropy and the determination of the magnetic anisotropy by PND was done for comparison. In that case, because of strong uniaxial magnetic anisotropy it was necessary to collect not three but six data sets of flipping ratio with different orientations of the magnetic field. The experiment was performed at 5 K and with a magnetic field strength of 0.5 T. The refinements of the molecular susceptibility yield the tensor (12):
Diagonalization of tensor (12) gives the susceptibility eigenvalues of χ1 = 10.5(9) along the easy axis and c2 = 1.20 and χ3 = 0.42 along the two transverse axes. Comparison of these eigenvalues with those of transition metal compounds (1) and (2) illustrates how much compound (3) is anisotropic and almost uniaxial. When the susceptibility tensor is represented as an ellipsoid onto the complex (Figure 6a) it shows significant deviation from the principal magnetic directions found with ARM. From the PND result it appears that the magnetic hard plane (χ2, χ3) nearly coincides with the coordination plane of dysprosium with the bipyridine (N-Dy(III)-N) with a discrepancy of only 7(2)° between the two planes (Figure 6a—bottom). This is close to that predicted by a semiclassical approach of an electrostatic model based on the free-ion approximation. Along this approach the oblate electron density of Dy(III) ion should be oriented towards the bipyridine ligand to minimize the overlap with the negative charged ligands [45]. The axial direction of the oblate 4f electron density is then perpendicular. Simulation of the ARM with PND can reproduce the maxima and minima with discrepancy in values to be ascribe to bias of the two methods as pointed for (1) and (2).
The second mononuclear Dy(III) complex [Dy(bpy)(Ph-acac)3] (4) (Ph-acac = 1,3-diphenylpropane-1,3-dionate, bpy = 2,2′-bipyridine) crystallizes in the monoclinic space group P21/c. There is thus coexistence of two crystallographically distinct molecular orientations in the unit cell and no other experimental approach than PND can assess the magnetic anisotropy axis of the individual molecules. As for (3) it was also necessary in that case to collect six sets of flipping ratio with different orientations relative to the applied field of 0.5 T. The experiment was carried out at 5K.
The ellipsoid representation of the local magnetic susceptibility tensor onto the molecular structure in Figure 6b clearly shows again the uniaxial type of the anisotropy. The eigenvalue of the easy-axis (χ1 = 11.1(1)) is about two orders of magnitude larger than the other two (χ2 = 0.23, and χ3 = 0.15 . As for compound (3) this experimental result agrees well with calculations considering an electrostatic model in which the oblate density should be oriented towards the bipyridine. [45] From PND the angle between the N-Dy-N plane involving the bipyridine ligand and the transverse plane of the magnetic susceptibility tensor was calculated to be 7.4(7)°. The easy-axis direction differs by only 8.0(7)° from those found from the electrostatic model.
To end up with lanthanide compounds, the last example is mononuclear ytterbium(III) complex [YbIII(Tp)2NO3] (5) (with Tp = tris(pyrazolyl)borate) which crystallizes in the monoclinic P21/c space group [29]. The Yb(III) ion is coordinated by six nitrogen atoms of two tridentate trispyrazolylborate and two oxygen atoms of a bidentate nitrate anion. The coordination polyhedron around the Yb(III) ion can be approximated as a biaugmented trigonal prism (C2v) or distorted square antiprism (D4d) [29]. Because of the P21/c space group, only PND, within the so called local susceptibility tensor approach, allows the determination of the molecular susceptibility tensor of (5).
Three orthogonal sets of flipping ratios were collected under moderate magnetic fields on quite a small single crystal (1.5 mm3). All three eigenvalues are positive (χ1 = 2.454(1), χ2 = 0.2992(2) and χ3 = 0.007(2) ). As pictured in Figure 6c the molecular easy axis χ1 is found close to the a-crystallographic axis, while the hard axes χ2 and χ3 are found near the c and b crystallographic axes.
The crystal susceptibility tensor is in compliance with the single crystal SQUID data. Small mismatches between PND and SQUID data are ascribed to a slight misorientation of the single crystal. Thus, compound (5) presents a strong magnetic anisotropy, which is nearly uniaxial. It may be noted that the orientation of the easy axis appears roughly coplanar with the nitrate moiety.
3.2. Polynuclear Coordination Compounds
The previous examples concerning mononuclear coordination compounds have shown how PND, through the local magnetic susceptibility approach, is effective to describe the magnetic anisotropy tensor on one metal site when it is often unreachable by other methods. These are important results but these were dealing with single-ion anisotropy only. In the next examples, we will see that this approach is also effective when applied to polynuclear systems in which magnetic anisotropy is dominant but may be influenced by magnetic exchange couplings between the metal ions constituting the polynuclear core.
3.2.1. Dinuclear Cobalt(II) Complex [Co2(sym-hmp)2](BPh4)2
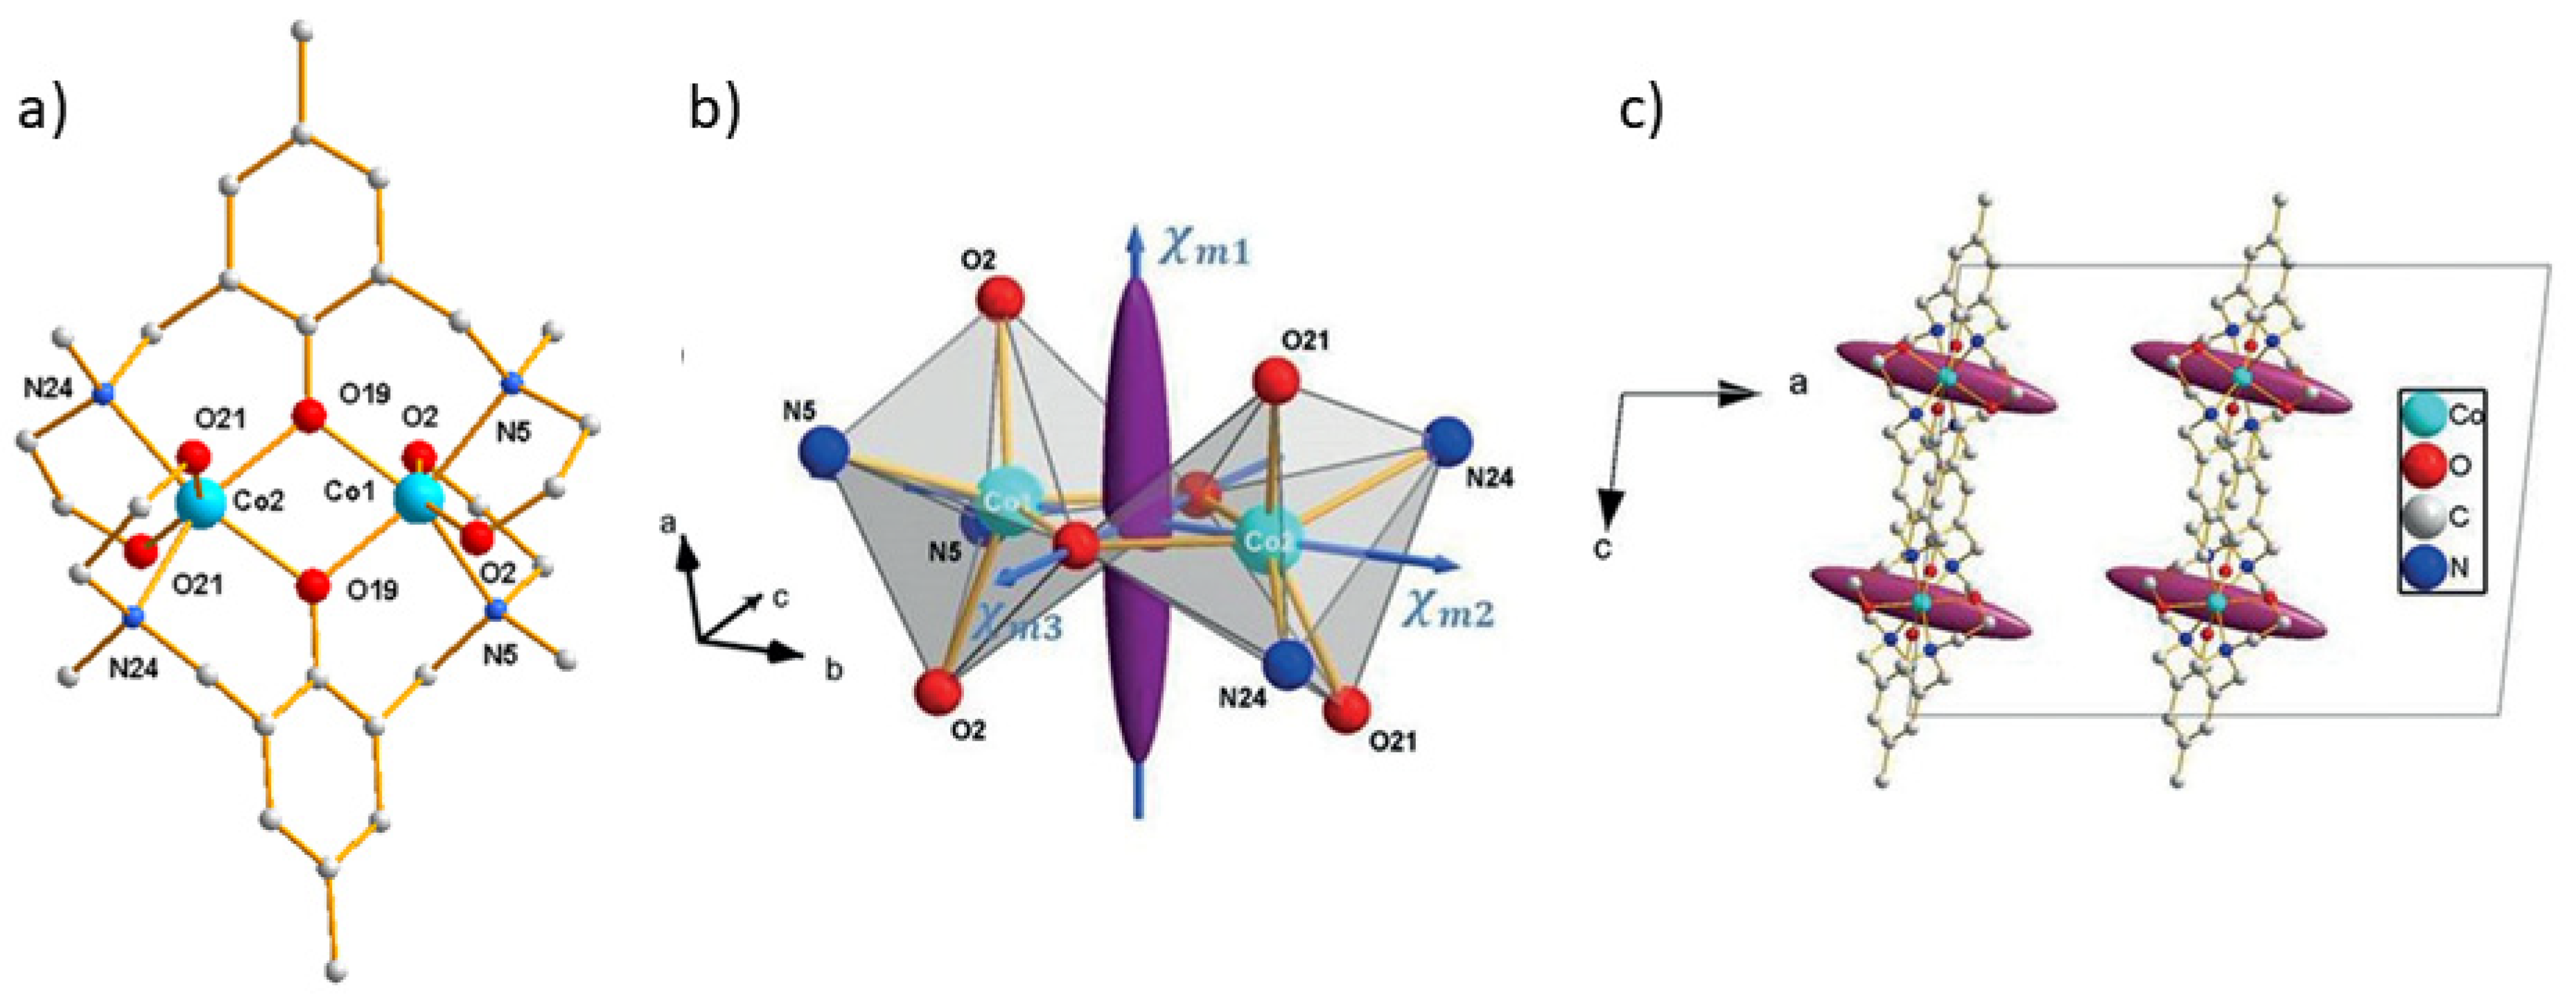
Dinuclear cobalt(II) coordination compound [Co2(sym-hmp)2](BPh4)2 (6) (sym-hmp- = 2,6-bis[(2-hydroxyethyl)methylaminomethyl]-4-methylphenolate) crystallizes in the monoclinic space group C2/c [46] with four molecules per unit cell. The complex moiety [Co2(sym-hmp)2]2+ (Figure 7a) is a cation and exhibits a C2 symmetry axis along the Co-Co direction which coincides with the b axis of the crystal. The two crystallographically independent Co(II) ions of the complex molecule are on special positions and are connected by two bridging oxygen atoms (denoted O19), forming a Co2O2 planar bridge. Four oxygen and two nitrogen atoms coordinate each of the cobalt(II) ions in distorted octahedrons which are symmetrically apart from the normal of the Co2O2 molecular bridging plane making an angle of 37° in between the elongated axis of the two octahedrons (Figure 8a). Temperature dependence of the magnetic susceptibility measurements on a single-crystal and along each of the crystallographic axes evidenced strong magnetic anisotropy in (3) with the two Co(II) ions antiferromagnetically coupled. This was well simulated with anisotropic exchange coupling constant Jeff,x = −19.3 cm−1, Jeff,y = −37.4 cm−1, Jeff,z = −82.8 cm−1 considering two effective spins (s = 1/2) [23].
Because of the C2/c space group and the special positions occupancy of the two Co(II) ions all molecules in the crystal cell have same orientation. Thus, the susceptibility tensor of the crystal is here strictly equal to the tensor of the individual dinuclear molecule. This is one case where SQUID measurements (ARM) of the magnetization on single crystal give the component of molecular magnetic susceptibility tensor. ARM at 2K enables the determination of the magnetic principal direction of the crystal. The monoclinic symmetry of the crystal imposes the b axis as one of the magnetic principal directions of the crystal for which the magnetic susceptibility was denoted χm2. The two other principal directions χm1 and χm3 are perpendicular to χm2 and relatively close to the a and c axis, respectively. At 2K and a field of 1T, ARM gives the following molecular susceptibility tensor (16) represented as an ellipsoid in Figure 7b,c:
The crystal susceptibility tensor is the sum of the two Co(II) local tensors but from SQUID measurements, it is not possible to further access the two individual local tensors associated with Co(1) and Co(2). This was complementary achieved by PND as follow. Three sets of flipping ratios were collected at 2 K on one big single crystal of 3 (135 mm3) for three orthogonal directions close to the a *, b, and c axes aligned along an applied magnetic field of 1 T. From PND data the refinement of the local susceptibility tensors of the two Co(II) ions was processed by constraining their sum to be equal (Equation (17)) to the molecular magnetic susceptibility tensor determined by SQUID measurements (Equation (16)):
The tensor components for each Co ion, in the (i, j, k) basis set, obtained from this constrained refinement on the three sets of flipping ratios are the following:
It should be stressed that these local tensors (Equations (18) and (19)), which are experimentally determined by PND, are not single-ion paramagnetic susceptibility tensors. They indeed include the contribution of the antiferromagnetic exchange and their sum is the molecular magnetic susceptibility tensor. Diagonalization gives the eigenvectors and eigenvalues (Table 1).
We can see that for both Co, two magnetic principal directions have negative susceptibility values (Table 1). This prohibits the drawing of a magnetic ellipsoid. Thus, only the directions of the eigenvectors can be represented (Figure 8a). However, this is enough to show that the b axis is a common magnetic principal direction for both Co ions. They are denoted as χ3 and their weak susceptibility values mean that the local magnetic moments are mainly constrained in the (a,c) plane. In this plane, we find the local easy magnetization axis, denoted as χ1 and χ2, which have similar susceptibility values of the order of 0.68 and of the order of −0.20 , respectively, for both Co ions.
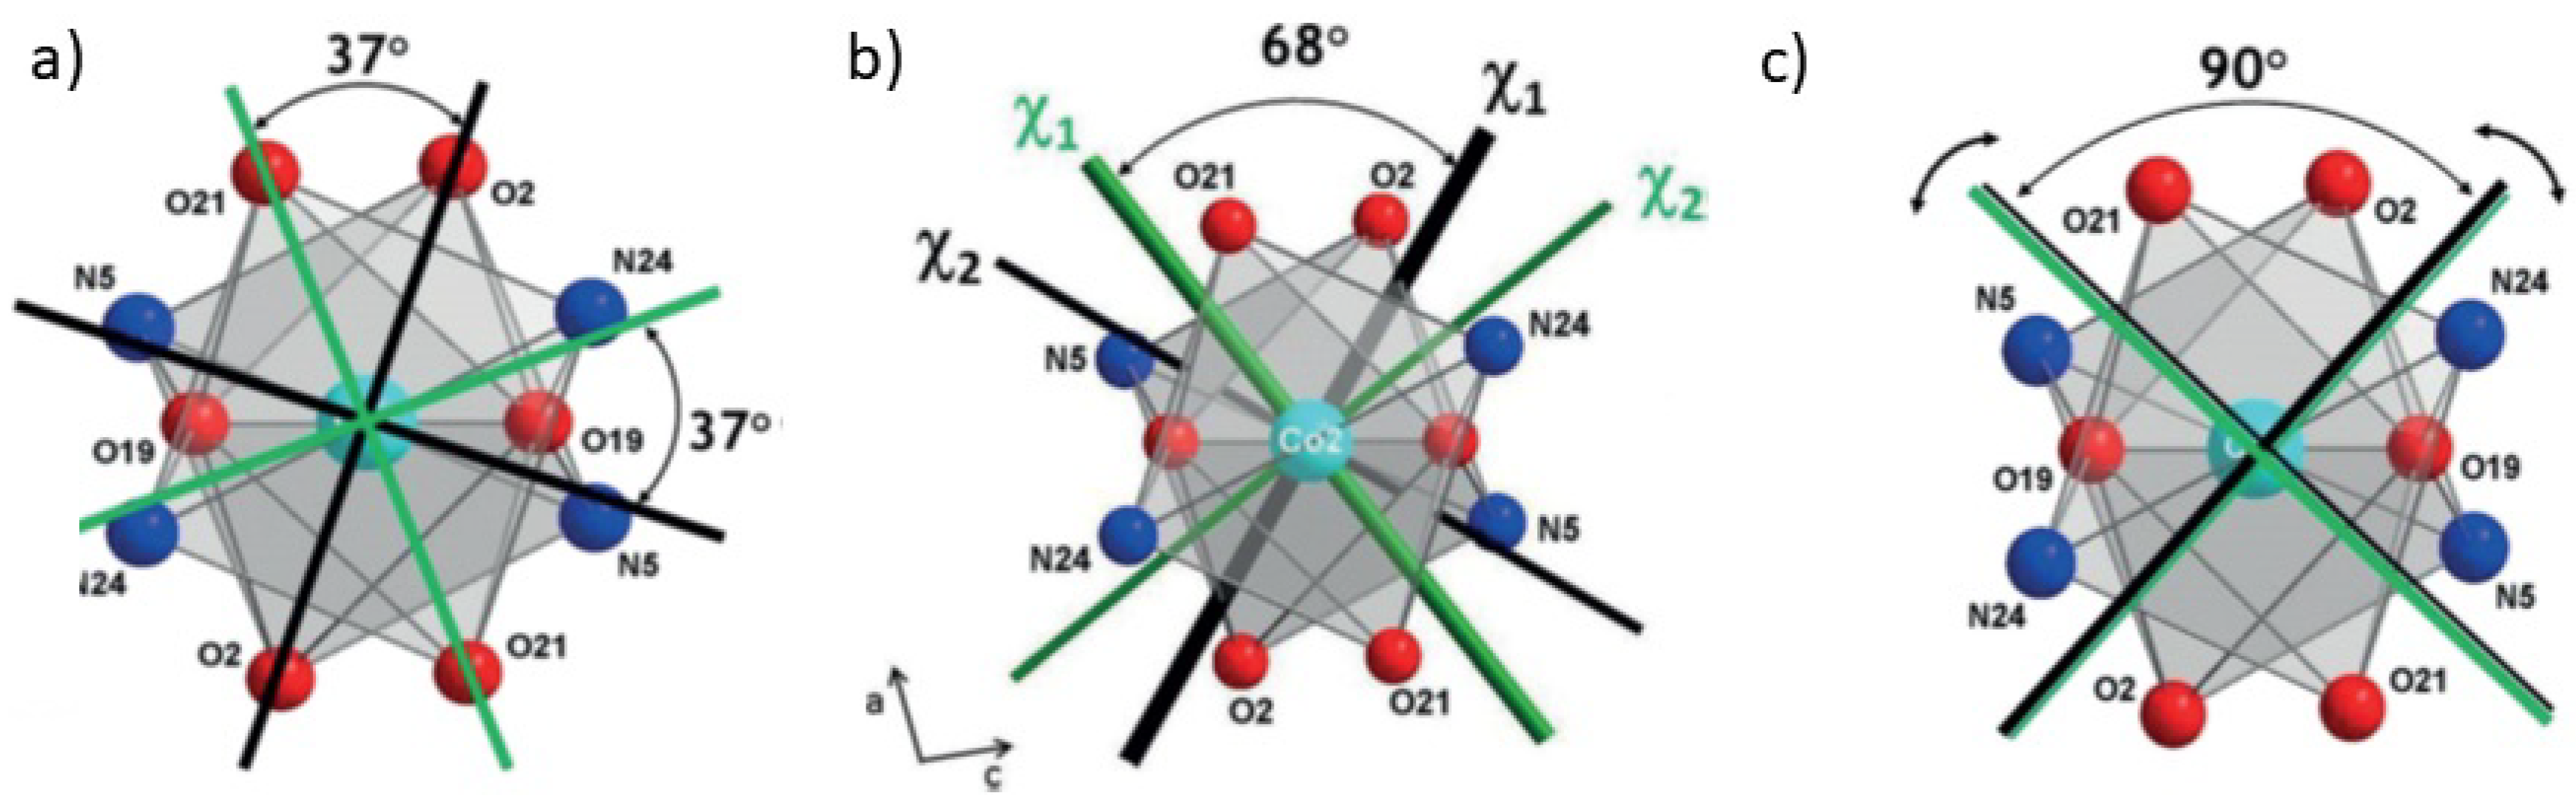
An angle of 68 (±6)° was found between the easy local magnetic principal directions of the two Co ions which are symmetrically tilted apart from the bridging plane Co2O2 of the molecule (Figure 8b). The local easy magnetization axes χ1 are mainly oriented along the normal to the molecular bridging plane while the negative principal directions χ2 lie along the direction joining the two bridging oxygen atoms (O19-O19). This indicates that the effect of the antiferromagnetic exchange coupling is stronger when a magnetic field is applied in the bridging plane of the molecule i.e., along the z direction.
In order to interpret the effect of the exchange interaction on the magnetic anisotropy in this dinuclear compound (6), we may consider two extreme cases illustrated by Figure 8a,c. In the first case (Figure 8a), if single-ion anisotropy was dominating the antiferromagnetic exchange coupling, the magnetic behaviour should be that of two independent Co(II) ions. The two local susceptibility tensors would be expected to yield only positive eigenvalues (i.e., genuine paramagnetic behaviour) and the magnetic principal directions would follow the orientation of the local coordination geometries and make an angle of nearly 37° (structural angle). In the second case (Figure 8c) if the AF exchange coupling was dominating over single-ion anisotropies, the local induced magnetic moments, which lie in the (a,c) plane, would be antiparallel whatever the applied field direction. This is fulfilled for each Co ion if and only if one positive and one negative eigenvalues, equal in absolute values, form an angle of 90 degrees. From PND study we can see that the observed situation is intermediate between these two extreme cases: one positive and one negative eigenvalue is obtained for each Co ion but the tilt angle between the magnetic principal axes in the (a,c) plane is equal to 68° (Figure 8b), somewhat midway between 37° (Figure 8a) and 90° (Figure 8c). This remarkably illustrates the competition between the two contributions and confirms that AF exchange coupling plays an important role, as well as the single-ion anisotropies, in the origin of the molecular magnetic anisotropy of (6) [24].
3.2.2. Tetranuclear Nickel(II) Complex [Ni4(L)4(MeOH)4]
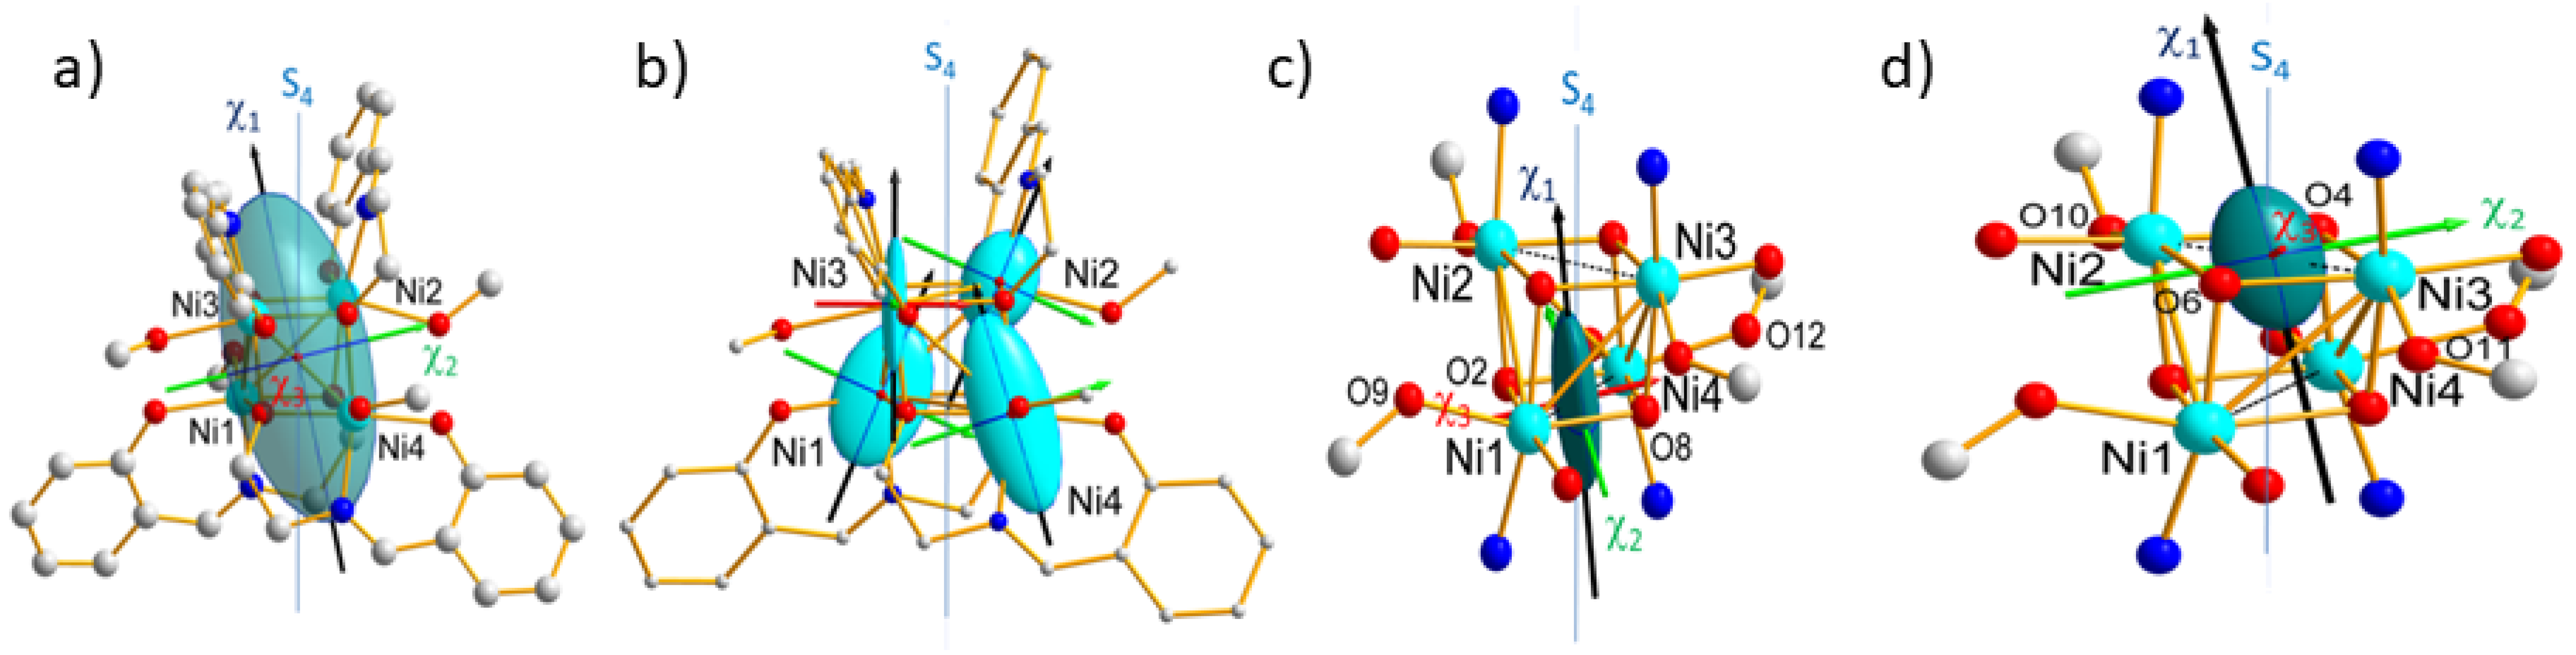
Tetranuclear nickel(II) complex (Figure 9), [Ni4(L)4(MeOH)4] (7) (H2L = salicylidene-2-ethanolamine; MeOH = methanol), so called hereafter cluster, crystallizes in the monoclinic space group P21/n with four neutral molecules in the unit cell [8]. In the cluster, each of the four crystallographically independent nickel(II) ions is linked to the other by three ethoxo-type μ3-oxygen atoms of the ligand (O2, O4, O6, and O4). This forms a slightly distorted {Ni4O4} core with a cubane-like structure of type II with four short (~3.04 Å) and two long (~3.2 Å) Ni…Ni distances [47] and with approximate S4 symmetry (Figure 9) [8,48]. The coordination of the Ni(II) ions are each completed by one nitrogen and one phenoxo oxygen atom of one ligand and one methanol oxygen atom (Figure 9) affording an almost regular octahedron geometry. The deformation of the coordination octahedron around each Ni atom of this cluster is caused by a tetragonal elongation along the O–Ni–O direction involving the coordinated methanol and the bridging μ3-O atom [48].
As expected for such a cubane structure, the magnetic behaviour is dominated by strong ferromagnetic interactions (JF = +8(1) cm−1) operating within the four Ni–Ni pairs at short distance, while weak antiferromagnetic (JAF = −3(1) cm−1) interactions occur within the two long distanced pairs. The complete interpretation of the magnetic behaviour also involves taking into account a large axial anisotropy. This has been confirmed previously by inelastic neutron scattering (INS) on powder [8]. PND along with the local susceptibility approach is allowed to go beyond. As seen here above for such a space group, there are two different molecular orientations in the crystal cell and ARM can provide solely the crystal magnetic anisotropy tensor as the sum of the local susceptibility tensors over the four symmetry-related tetranuclear molecules in the cell:
Using PND measurements it has been possible to map in a detailed manner the direction and strength of the local magnetic anisotropy in this tetranuclear nickel(II) complex at different levels [27]. These comprise the crystal and molecule magnetic anisotropies as well for each individual Ni(II) ion, but also for the two different pairs of antiferromagnetically-coupled Ni2+ ions. Three flipping ratio data sets were collected, at 10 K on a single crystal of 10 mm3, under a moderate magnetic field of 2 T. Due to a low number of accurate flipping ratios, four of six components of the local (molecular) cluster tensor could be determined while two (χ23 et χ31) were set to zero in the final refinement because they were below the limit of significance (Table 2).
The obtained cluster tensor (22) is drawn as an ellipsoid on Figure 10a. This shows that the local easy magnetic axis of the cluster is close to the pseudo-symmetry S4 axis, in agreement with previous INS investigation [3]. The observed axial anisotropy of the cluster magnetic ellipsoid (χ1 >> χ2,χ3) confirms the easy axis-type magnetic anisotropy of the cluster predicted by the negative sign of D.
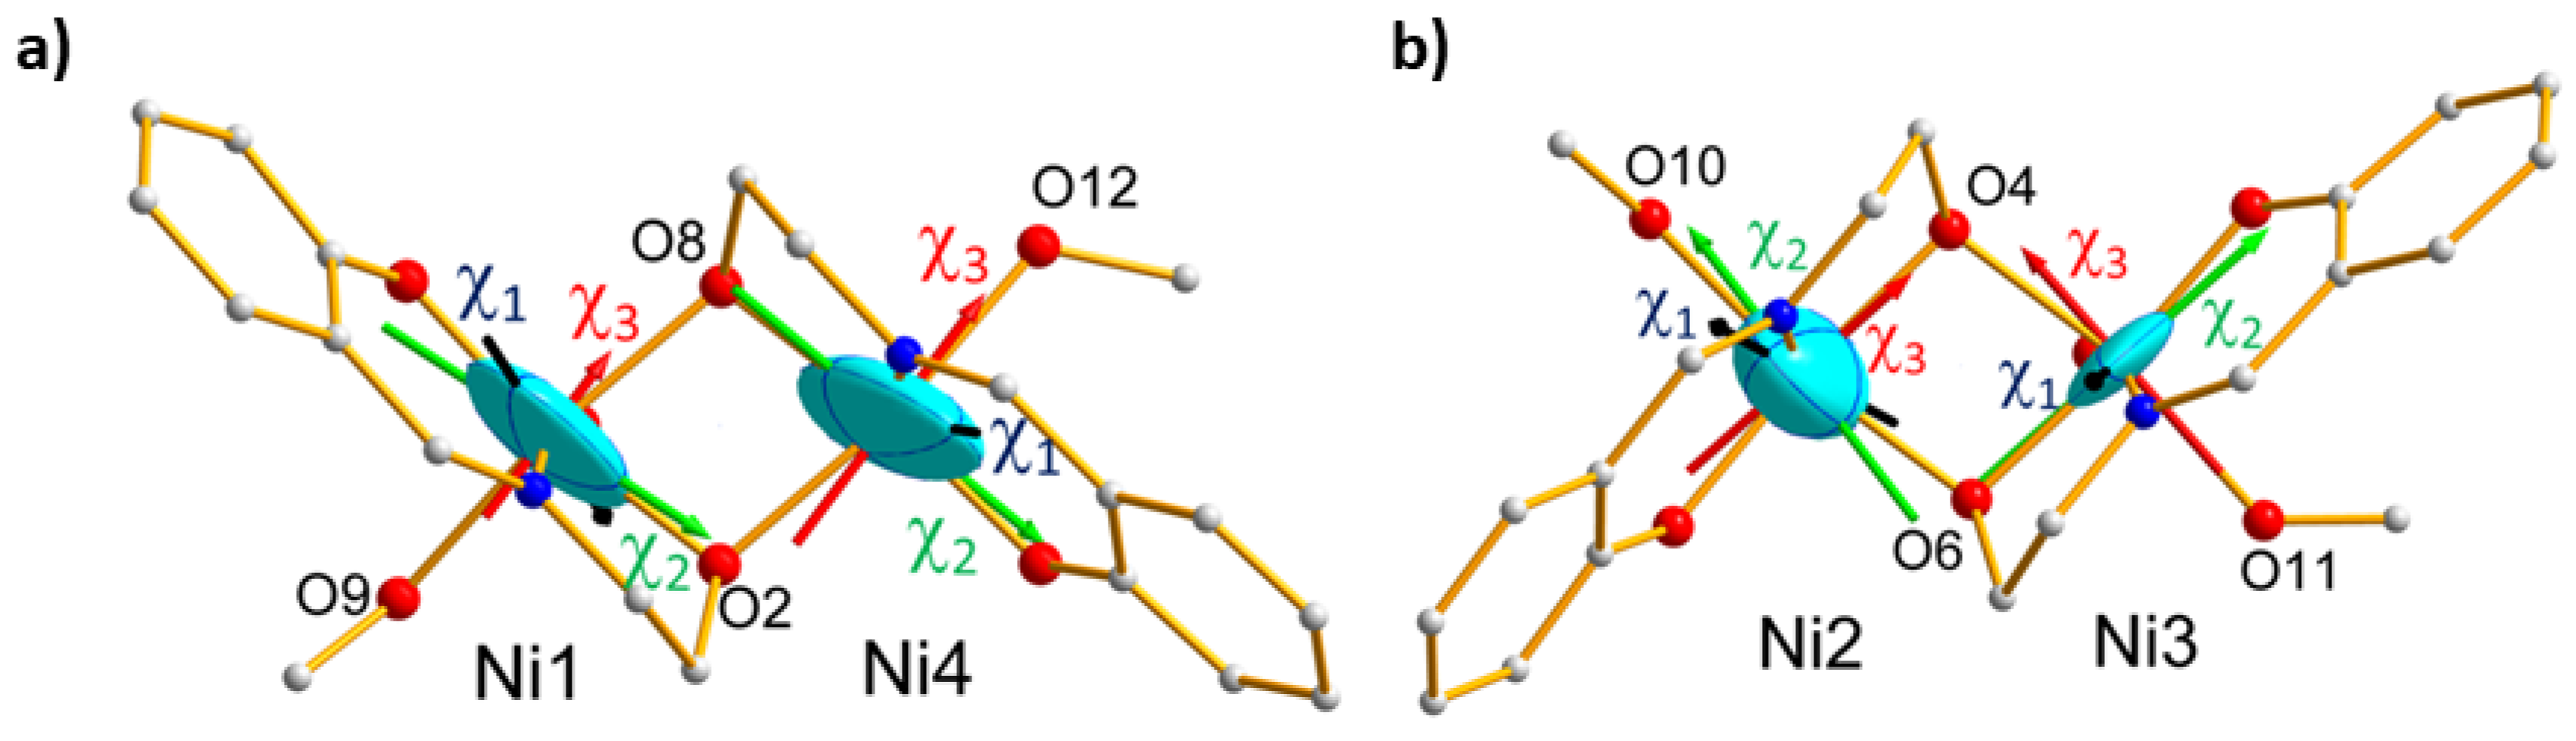
Then refinement of the local susceptibility tensors (with l = 1, 4) affords the six components χijfor each of the four Ni ions (Table 2). As for previous dinuclear cobalt(II) complex (6), the susceptibility tensor of the [Ni4] cluster is here the sum of individual Ni tensors taking into account the single ion paramagnetic contributions and the ferro- and antiferromagnetic exchange interaction between the Ni(II) ions. Drawing of the magnetic ellipsoids evidences strong similarity between pairs of Ni atoms (Ni1, Ni4) and (Ni2, Ni3) which are antiferromagnetically coupled (Figure 9b). This suggests they have similar magnetic behaviours with respect to the applied magnetic field. Therefore this was treated as two “effective tensors” (with k = 1, 2) for each of the antiferromagnetically coupled pairs, which include the perturbation by ferromagnetic exchange interactions between the Ni atoms of the pairs.
The obtained values reported in Table 2 indicate that the tensor associated to the Ni1-Ni4 pair is more anisotropic than the tensor relative to the Ni2–Ni3 pair. The magnetic ellipsoids and principal magnetic axes are represented in Figure 9c,d. The easy axes () of the pairs are both close to the S4 pseudo-symmetry axis, but the hard () and intermediate ( axes are found nearly perpendicular to each other axes, as well. This is in agreement with local geometries as octahedrons around Ni1 and Ni4 than for Ni2 and Ni3. In contrast, the elongation directions of the AF pairs are orthogonal to each other. However, the local tetragonal distortion is slightly larger for (Ni2, Ni3) than for (Ni1, Ni4). This suggests that the axial distortion of the coordination octahedron is not the only source of magnetic anisotropy but the deformation of the triangular faces of the octahedron. This in turn means that deformation in the equatorial directions of the coordination octahedron plays an important role. The effective magnetic tensors associated to each antiferromagnetic pair (Figure 9) reflect the resultant of the effective single ion tensors of the Ni ions involved in the pair (Figure 10). Noticeably, the hard magnetic axes of the both pairs are perpendicular to each other, in agreement with the local directions of tetragonal distortion.
The cluster experimental local susceptibility tensor (Equation (21)) at 10 K obtained from the PND data analysis was used to calculate the bulk magnetization induced by a magnetic field, applied in any direction of space, for a more direct comparison with the angular-resolved measurements. Taking into account the symmetry operations of the P21/c space group, the crystal susceptibility tensor can be deduced from Equations (20) and (21), which leads to the bulk susceptibility tensor:
This tensor is diagonal in the (,,) basis set and, therefore, its eigenvectors, i.e., the bulk magnetic proper axes, coincide with the , , and axes, which fully agrees with the SQUID data analysis. Simulation of the single crystal SQUID data (ARM) using the cluster susceptibility tensor from PND gave a very good agreement on the locations and magnitudes of the extrema of the ARM curve but with discrepancy between the direction found by SQUID and those from PND. Once again, this illustrates that the orientations are rather ill defined with SQUID measurement on single crystals.
These results show that the strength of the local magnetic anisotropy is clearly related to the local geometry of the Ni coordination octahedron. They confirm that the orientation of the hard axes of the Ni(II) ions is governed by the tetragonal elongation along the O-Ni-O direction involving the coordinated methanol and the bridging alkoxide. However, the single ion magnetic anisotropy is not only stemming from this axial distortion, but also originates from the deformation in the equatorial directions of the coordination octahedron, as shown by the strongest axial anisotropy of the AF pair which displays the weakest axial elongation but largest equatorial distortion.
These PND results are also consistent with the negative value of the ZFS parameter D for the cluster, as provided by a previous INS study [8] which only gives access to the anisotropy parameters and not to the directions of the magnetic axes. PND confirms that the easy magnetic axis of the cluster is close to the S4 pseudosymmetry axis as assumed in the INS study, but in addition and exclusively it reveals that the easy axis anisotropy of the cluster is mastered by the anisotropy of one of the two antiferromagnetic pairs, which presents stronger axial anisotropy than the other one.
4. Conclusions
Because of the non-collinearity of the magnetic structure factor (FM) with the applied magnetic field, the magnetic anisotropy was initially an obstacle for mapping the magnetization density using PND. This restriction no longer exists thanks to the local susceptibility approach and it is paradoxical that magnetic anisotropy even becomes now a subject of study in its own right for PND. The results we have reviewed here demonstrate that PND on a single crystal together with the local susceptibility approach is today a unique tool to establish precise magneto-structural relationships in transition metal complexes as well as for the most extremely magnetically anisotropic systems, namely, 4f-based complexes. It is to stress that in these reported results, the induced moments were treated as vectors. Therefore for some f ions that may have multipolar states the results should be taken with caution but these are special cases. Moreover, it is clear that the magnetic anisotropy parameters, which are obtained by PND and the local susceptibility approach, must be complementary of a more general investigation combining other experimental methods and quantum chemical calculations. This is particularly obvious for f-ion systems where the knowledge of the ground state of the crystalline field and its decomposition |J,mJ> are crucial. This can be obtained either by quantum chemical calculations and by spectroscopic measurements when they are available. These illustrate that single-crystal PND using the local susceptibility approach allows a precise and quantified measurement of the magnetic anisotropy in molecular coordination compounds. One main drawbacks is the duration of the measurements, which may be long, since it is necessary to carry out at least three collections of flipping ratios for three orthogonal orientations of the applied magnetic field. Moreover, as with most neutron scattering techniques, it requires relatively large crystals, but thanks to 2D detectors this has considerably decreased. Moreover, A. Gukasov and I. Kibalin have just extended the approach to powder diffraction which greatly minimizes these drawbacks [49]. Most importantly, the approach works not only for mononuclear but also for polynuclear systems where it provides the atomic susceptibility tensor for each independent magnetic site as well a detailed mapping of the magnetic anisotropy at different levels as exemplified by [Ni4] cubane. This would otherwise remain entirely inaccessible using any other technique.
Author Contributions
Writing—original draft preparation, D.L.; writing—review and editing, D.L. and B.G.; visualization, D.L.; supervision, B.G. All authors have read and agreed to the published version of the manuscript.
Funding
This research received no external funding.
Institutional Review Board Statement
Not applicable.
Informed Consent Statement
Not applicable.
Acknowledgments
D.L. and B.G. warmly thank Arsen Gukasov from the Laboratoire Léon Brillouin (CEA-CNRS) for the discussion and proofreading of the manuscript.
Conflicts of Interest
The authors declare no conflict of interest.
References
- Squires, G.L. Introduction to the Theory of Thermal Neutron Scattering; Cambridge University Press: Cambridge, UK, 2012. [Google Scholar]
- Xue, Z.L.; Ramirez-Cuesta, A.J.; Brown, C.M.; Calder, S.; Cao, H.B.; Chakoumakos, B.C.; Daemen, L.L.; Huq, A.; Kolesnikov, A.I.; Mamontov, E.; et al. Neutron Instruments for Research in Coordination Chemistry. Eur. J. Inorg. Chem. 2019, 1065–1089. [Google Scholar] [CrossRef]
- Gatteschi, D. Physical Techniques for the Investigation of Molecular Magnetic Clusters. J. Phys. Chem. B 2000, 104, 9780–9787. [Google Scholar] [CrossRef]
- Ressouche, E.; Schweizer, J. Ab Initio Calculations versus Polarized Neutron Diffraction for the Spin Density of Free Radicals. Mon. Chem. 2003, 134, 235–253. [Google Scholar] [CrossRef]
- Basler, R.; Sieber, A.; Chaboussant, G.; Gudel, H.U.; Chakov, N.E.; Soler, M.; Christou, G.; Desmedt, A.; Lechner, R. Inelastic Neutron Scattering Study of Electron Reduction in Mn-12 Derivatives. Inorg. Chem. 2005, 44, 649–653. [Google Scholar] [CrossRef]
- Prsa, K.; Nehrkorn, J.; Corbey, J.F.; Evans, W.J.; Demir, S.; Long, J.R.; Guidi, T.; Waldmann, O. Perspectives on Neutron Scattering in Lanthanide-Based Single-Molecule Magnets and a Case Study of the Tb-2(Mu-N-2) System. Magnetochemistry 2016, 2, 45. [Google Scholar] [CrossRef] [Green Version]
- Etcheverry-Berrios, A.; Parsons, S.; Kamenev, K.V.; Probert, M.R.; Moggach, S.A.; Murrie, M.; Brechin, E.K. Putting the Squeeze on Molecule-Based Magnets: Exploiting Pressure to Develop Magneto-Structural Correlations in Paramagnetic Coordination Compounds. Magnetochemistry 2020, 6, 32. [Google Scholar] [CrossRef]
- Sieber, A.; Boskovic, C.; Bircher, R.; Waldmann, O.; Ochsenbein, S.T.; Chaboussant, G.; Güdel, H.U.; Kirchner, N.; van Slageren, J.; Wernsdorfer, W.; et al. Synthesis and Spectroscopic Characterization of a New Family of Ni4 Spin Clusters. Inorg. Chem. 2005, 44, 4315–4325. [Google Scholar] [CrossRef]
- Ballou, R.; Ouladdiaf, B. Representation Analysis of Magnetic Structures. In Neutron Scattering from Magnetic Materials; Chatterji, T., Ed.; Elsevier Science: Amsterdam, The Netherlands, 2006; pp. 93–151. [Google Scholar]
- Schweizer, J. Spin densities in magnetic molecular compounds. Phys. B Condens. Matter 1997, 234–236, 772–779. [Google Scholar] [CrossRef]
- Schweizer, J. Polarized Neutrons and Polarization Analysis. Neutron Scattering from Magnetic Materials; Chatterji, T., Ed.; Elsevier Science: Amsterdam, The Netherlands, 2006; pp. 153–213. [Google Scholar]
- Gillon, B. The Classical Flipping Ratio Technique Applied to Non Classical Magnetic Materials: Molecule-Based and Photoswitchable Magnetic Compounds. J. Phys. 2007, 13, 1–30. [Google Scholar]
- Ressouche, E.; Boucherle, J.X.; Gillon, B.; Rey, P.; Schweizer, J. Spin Density Maps in Nitroxide-Copper(II) Complexes. A Polarized Neutron Diffraction Determination. J. Am. Chem. Soc. 1993, 115, 3610–3617. [Google Scholar] [CrossRef]
- Zheludev, A.; Grand, A.; Ressouche, E.; Schweizer, J.; Morin, B.G.; Epstein, A.J.; Dixon, D.A.; Miller, J.S. Experimental Determination of the Spin Density in the Tetracyanoethenide Free Radical, [TCNE].bul. -, by Single-Crystal Polarized Neutron Diffraction. A View of a .pi.* Orbital. J. Am. Chem. Soc. 1994, 116, 7243–7249. [Google Scholar] [CrossRef]
- Baron, V.; Gillon, B.; Plantevin, O.; Cousson, A.; Mathoniere, C.; Kahn, O.; Grand, A.; Ohrstrom, L.; Delley, B. Spin-Density Maps for an Oxamido-Bridged Mn(II) Cu(II) Binuclear Compound. Polarized Neutron Diffraction and Theoretical Studies. J. Am. Chem. Soc. 1996, 118, 11822–11830. [Google Scholar] [CrossRef]
- Gillon, B.; Mathoniere, C.; Ruiz, E.; Alvarez, S.; Cousson, A.; Rajendiran, T.M.; Kahn, O. Spin Densities in a Ferromagnetic Bimetallic Chain Compound: Polarized Neutron Diffraction and Dft Calculations. J. Am. Chem. Soc. 2002, 124, 14433–14441. [Google Scholar] [CrossRef] [PubMed]
- Goujon, A.; Gillon, B.; Gukasov, A.; Jeftic, J.; Nau, Q.; Codjovi, E.; Varret, F. Photoinduced Molecular Switching Studied by Polarized Neutron Diffraction. Phys. Rev. B 2003, 67, 220401(R). [Google Scholar] [CrossRef]
- Aronica, C.; Jeanneau, E.; el Moll, H.; Luneau, D.; Gillon, B.; Goujon, A.; Cousson, A.; Carvajal, M.A.; Robert, V. Ferromagnetic Interaction in an Asymmetric End-to-End Azido Double-Bridged Copper(II) Dinuclear Complex: A Combined Structure, Magnetic, Polarized Neutron Diffraction and Theoretical Study. Chem. Eur. J. 2007, 13, 3666–3674. [Google Scholar] [CrossRef] [PubMed]
- Aronica, C.; Chumakov, Y.; Jeanneau, E.; Luneau, D.; Neugebauer, P.; Barra, A.L.; Gillon, B.; Goujon, A.; Cousson, A.; Tercero, J.; et al. Structure, Magnetic Properties, Polarized Neutron Diffraction, and Theoretical Study of a Copper(II) Cubane. Chem. Eur. J. 2008, 14, 9540–9548. [Google Scholar] [CrossRef]
- Kahn, O. Chemistry and Physics of Supramolecular Magnetic Materials. Acc. Chem. Res. 2000, 33, 647–657. [Google Scholar] [CrossRef]
- Schweizer, J.; Golhen, S.; Lelievre-Berna, E.; Ouahab, L.; Pontillon, Y.; Ressouche, E. Magnetic Interactions and Spin Densities in Molecular Compounds: An Example. Phys. B Condens. Matter 2001, 297, 213–220. [Google Scholar] [CrossRef]
- Claiser, N.; Souhassou, M.; Lecomte, C.; Pontillon, Y.; Romero, F.; Ziessel, R. Understanding Magnetic Interaction Pathways: An Experimental Determination of Electron Density in an Alkyne-Substituted Nitronyl Nitroxide Radical. J. Phys. Chem. B 2002, 106, 12896–12907. [Google Scholar] [CrossRef]
- Borta, A.; Gillon, B.; Gukasov, A.; Cousson, A.; Luneau, D.; Jeanneau, E.; Ciumacov, I.; Sakiyama, H.; Tone, K.; Mikuriya, M. Local Magnetic Moments in a Dinuclear Co2+ Complex as Seen by Polarized Neutron Diffraction: Beyond the Effective Spin-1/2 Model. Phys. Rev. B 2011, 83, 184429. [Google Scholar] [CrossRef]
- Ridier, K.; Gillon, B.; Gukasov, A.; Chaboussant, G.; Cousson, A.; Luneau, D.; Borta, A.; Jacquot, J.F.; Checa, R.; Chiba, Y.; et al. Polarized Neutron Diffraction as a Tool for Mapping Molecular Magnetic Anisotropy: Local Susceptibility Tensors in Co-Ii Complexes. Chem. Eur. J. 2016, 22, 724–735. [Google Scholar] [CrossRef] [PubMed]
- Ridier, K.; Mondal, A.; Boilleau, C.; Cador, O.; Gillon, B.; Chaboussant, G.; le Guennic, B.; Costuas, K.; Lescouezec, R. Polarized Neutron Diffraction to Probe Local Magnetic Anisotropy of a Low-Spin Fe(III) Complex. Angew. Chem. Int. Ed. 2016, 55, 3963–3967. [Google Scholar] [CrossRef] [PubMed]
- De, S.; Flambard, A.; Garnier, D.; Herson, P.; Khler, F.H.; Mondal, A.; Costuas, K.; Gillon, B.; Lescouzec, R.; Guennic, B.; et al. Probing the Local Magnetic Structure of the Fe- III (Tp)(CN) 3- Building Block Via Solid-State Nmr Spectroscopy, Polarized Neutron Diffraction, and First-Principle Calculations. Chem. Eur. J. 2019, 25, 12120–12136. [Google Scholar] [CrossRef] [PubMed] [Green Version]
- Iasco, O.; Chumakov, Y.; Guegan, F.; Gillon, B.; Lenertz, M.; Bataille, A.; Jacquot, J.F.; Luneau, D. Mapping the Magnetic Anisotropy inside a Ni4 Cubane Spin Cluster Using Polarized Neutron Diffraction. Magnetochemistry 2017, 3, 25. [Google Scholar] [CrossRef] [Green Version]
- Klahn, E.A.; Gao, C.; Gillon, B.; Gukasov, A.; Fabreges, X.; Piltz, R.O.; Jiang, S.D.; Overgaard, J. Mapping the Magnetic Anisotropy at the Atomic Scale in Dysprosium Single-Molecule Magnets. Chem. Eur. J. 2018, 24, 16576–16581. [Google Scholar] [CrossRef] [PubMed]
- Guegan, F.; Jung, J.; le Guennic, B.; Riobe, F.; Maury, O.; Gillon, B.; Jacquot, J.F.; Guyot, Y.; Morell, C.; Luneau, D. Evidencing under-Barrier Phenomena in a Yb(III) Smm: A Joint Luminescence/Neutron Diffraction/Squid Study. Inorg. Chem. Front. 2019, 6, 3152–3157. [Google Scholar] [CrossRef]
- Gukasov, A.; Brown, P.J. Determination of Atomic Site Susceptibility Tensors from Polarized Neutron Diffraction Data. Phys. Condens. Mat. 2002, 14, 8831–8839. [Google Scholar] [CrossRef]
- Nye, J.F. Physical Properties of Crystals: Their Representation by Tensors and Matrices; Clarendon Press: London, UK, 1985. [Google Scholar]
- Matthewman, J.C.; Thompson, P.; Brown, P.J. The Cambridge Crystallography Subroutine Library. J. Appl. Crystallogr. 1982, 15, 167–173. [Google Scholar] [CrossRef]
- Kahn, O. Molecular Magnetism; VCH: New York, NY, USA, 1993. [Google Scholar]
- Gatteschi, D.; Barra, A.L.; Caneschi, A.; Cornia, A.; Sessoli, R.; Sorace, L. Epr of Molecular Nanomagnets. Coord. Chem. Rev. 2006, 250, 1514–1529. [Google Scholar] [CrossRef]
- Castelli, L.; Fittipaldi, M.; Powell, A.K.; Gatteschi, D.; Sorace, L. Single Crystal Epr Study at 95 Ghz of a Large Fe Based Molecular Nanomagnet: Toward the Structuring of Magnetic Nanoparticle Properties. Dalton Trans. 2011, 40, 8145–8155. [Google Scholar] [CrossRef] [PubMed]
- Palacios, M.A.; Nehrkorn, J.; Suturina, E.A.; Ruiz, E.; Gomez-Coca, S.; Holldack, K.; Schnegg, A.; Krzystek, J.; Moreno, J.M.; Colacio, E. Analysis of Magnetic Anisotropy and the Role of Magnetic Dilution in Triggering Single-Molecule Magnet (Smm) Behavior in a Family of (Co VIII)-YII Dinuclear Complexes with Easy-Plane Anisotropy. Chem. Eur. J. 2017, 23, 11649–11661. [Google Scholar] [CrossRef] [PubMed] [Green Version]
- Zhai, Y.Q.; Ge, N.; Li, Z.H.; Chen, W.P.; Han, T.; Ouyang, Z.W.; Wang, Z.X.; Zheng, Y.Z. Magnetic Anisotropy: Structural Correlation of a Series of Chromium(II)-Amidinate Complexes. Inorg. Chem. 2021, 60, 1344–1351. [Google Scholar] [CrossRef]
- Perfetti, M.; Sorensen, M.A.; Hansen, U.B.; Bamberger, H.; Lenz, S.; Hallmen, P.P.; Fennell, T.; Simeoni, G.G.; Arauzo, A.; Bartolome, J.; et al. Magnetic Anisotropy Switch: Easy Axis to Easy Plane Conversion and Vice Versa. Adv. Funct. Mater. 2018, 28, 1801846. [Google Scholar] [CrossRef]
- Cornia, A.; Affronte, M.; Jansen, A.G.M.; Gatteschi, D.; Caneschi, A.; Sessoli, R. Magnetic Anisotropy of Mn-12-Acetate Nanomagnets from High-Field Torque Magnetometry. Chem. Phys. Lett. 2000, 322, 477–482. [Google Scholar] [CrossRef]
- Cucinotta, G.; Perfetti, M.; Luzon, J.; Etienne, M.; Car, P.-E.; Caneschi, A.; Calvez, G.; Bernot, K.; Sessoli, R. Magnetic Anisotropy in a Dysprosium/Dota Single-Molecule Magnet: Beyond Simple Magneto-Structural Correlations. Angew. Chem. Int. Ed. 2012, 51, 1606–1610. [Google Scholar] [CrossRef]
- Briganti, M.; Lucaccini, E.; Chelazzi, L.; Ciattini, S.; Sorace, L.; Sessoli, R.; Totti, F.; Perfetti, M. Magnetic Anisotropy Trends Along a Full 4f-Series: The F(N)+7 Effect. J. Am. Chem. Soc. 2021, 143, 8108–8115. [Google Scholar] [CrossRef]
- Abe, K.; Chiba, Y.; Yoshioka, D.; Yamaguchi, R.; Mikuriya, M.; Sakiyama, H. X-ray Structure Analysis Online. Jpn. Soc. Anal. Chem. 2012, 28, 65–66. [Google Scholar]
- Lescouëzec, R.; Vaissermann, J.; Lloret, F.; Julve, M.; Verdaguer, M. Ferromagnetic Coupling between Low- and High-Spin Iron(Iii) Ions in the Tetranuclear Complex Fac-{[Feiii{Hb(Pz)3}(Cn)2(Μ-Cn)]3feiii(H2o)3}·6h2o ([Hb(Pz)3]- = Hydrotris(1-Pyrazolyl)Borate). Inorg. Chem. 2002, 41, 5943–5945. [Google Scholar] [CrossRef]
- Qian, K.; Baldovi, J.J.; Jiang, S.D.; Gaita-Arino, A.; Zhang, Y.Q.; Overgaard, J.; Wang, B.W.; Coronado, E.; Gao, S. Does the Thermal Evolution of Molecular Structures Critically Affect the Magnetic Anisotropy? Chem. Sci. 2015, 6, 4587–4593. [Google Scholar] [CrossRef] [Green Version]
- Chilton, N.F.; Collison, D.; McInnes, E.J.; Winpenny, R.E.; Soncini, A. An Electrostatic Model for the Determination of Magnetic Anisotropy in Dysprosium Complexes. Nat. Commun. 2013, 4, 2551. [Google Scholar] [CrossRef] [PubMed]
- Tone, K.; Sakiyama, H.; Mikuriya, M.; Yamasaki, M.; Nishida, Y. Magnetic behavior of dinuclear cobalt (II) complexes assumed to be caused by a paramagnetic impurity can be explained by tilts of local distortion axes. Inorg. Chem. Commun. 2007, 10, 944–947. [Google Scholar] [CrossRef]
- Ruiz, E.; Rodríguez-Fortea, A.; Alemany, P.; Alvarez, S. Density Functional Study of the Exchange Coupling in Distorted Cubane Complexes Containing the Cu4o4 Core. Polyhedron 2001, 20, 1323–1327. [Google Scholar] [CrossRef]
- Nihei, M.; Hoshino, N.; Ito, T.; Oshio, H. Structures and Magnetic Properties of Metal Cubes. Polyhedron 2003, 22, 2359–2362. [Google Scholar] [CrossRef]
- Kibalin, I.A.; Gukasov, A. Local Magnetic Anisotropy by Polarized Neutron Powder Diffraction: Application of Magnetically Induced Preferred Crystallite Orientation. Phys. Rev. Res. 2019, 1, 033100. [Google Scholar] [CrossRef] [Green Version]
Figure 1.
Schematic main set-up for polarized neutron diffraction measurements as on diffractometer D3 at ILL in Grenoble (France).
Figure 1.
Schematic main set-up for polarized neutron diffraction measurements as on diffractometer D3 at ILL in Grenoble (France).

Figure 2.
Scheme showing the difference in the direction of the magnetic structure factor (FM) for a crystal without (a) or with (b) magnetic anisotropy.
Figure 2.
Scheme showing the difference in the direction of the magnetic structure factor (FM) for a crystal without (a) or with (b) magnetic anisotropy.

Figure 3.
Drawing of the magnetic anisotropy in the form of an ellipsoid from a magnetic susceptibility tensor (6).
Figure 3.
Drawing of the magnetic anisotropy in the form of an ellipsoid from a magnetic susceptibility tensor (6).

Figure 4.
View of the cationic complex molecule [CoII(DMF)6]2+ in (1)from X-ray diffraction on single crystal (a) with drawing of the magnetic ellipsoid on one molecule (b) and in the crystal cell (c) from polarized neutron diffraction.
Figure 4.
View of the cationic complex molecule [CoII(DMF)6]2+ in (1)from X-ray diffraction on single crystal (a) with drawing of the magnetic ellipsoid on one molecule (b) and in the crystal cell (c) from polarized neutron diffraction.

Figure 5.
View of the anionic complex molecule [FeIII(Tp)(CN)3]− in (2) from X-ray diffraction on single crystal (a) with drawing of the magnetic ellipsoid on one molecule (b) and in the crystal cell (c) from polarized neutron diffraction.
Figure 5.
View of the anionic complex molecule [FeIII(Tp)(CN)3]− in (2) from X-ray diffraction on single crystal (a) with drawing of the magnetic ellipsoid on one molecule (b) and in the crystal cell (c) from polarized neutron diffraction.

Figure 6.
Drawing of magnetic ellipsoids on one molecule (a) [DyIII(bpy)(tBu-acac)3] (3) (b) [Dy(bpy)(Ph-acac)3] (4) and (c) [YbTp2NO3] (5) from polarized neutron diffraction (PND) on single crystal.
Figure 6.
Drawing of magnetic ellipsoids on one molecule (a) [DyIII(bpy)(tBu-acac)3] (3) (b) [Dy(bpy)(Ph-acac)3] (4) and (c) [YbTp2NO3] (5) from polarized neutron diffraction (PND) on single crystal.

Figure 7.
View of the cationic dinuclear complex molecule [Co2(sym-hmp)2]2+ in (6) from X-ray diffraction on single crystal (a) with drawing of molecular magnetic ellipsoids from SQUID measurements for one molecule (b) and in crystal cell (c).
Figure 7.
View of the cationic dinuclear complex molecule [Co2(sym-hmp)2]2+ in (6) from X-ray diffraction on single crystal (a) with drawing of molecular magnetic ellipsoids from SQUID measurements for one molecule (b) and in crystal cell (c).

Figure 8.
Drawing of magnetic principal axes from neutron polarized diffraction (PND) (b) compared with two hypothetic cases depending whether single-ion anisotropy dominates the antiferromagnetic exchange coupling (a) or vice-versa (c).
Figure 8.
Drawing of magnetic principal axes from neutron polarized diffraction (PND) (b) compared with two hypothetic cases depending whether single-ion anisotropy dominates the antiferromagnetic exchange coupling (a) or vice-versa (c).

Figure 9.
Drawing of molecular magnetic ellipsoids (a) and single ion anisotropies (b) together with drawing of resulting magnetic anisotropies for each of antiferromagnetically coupled pairs (c) and (d) from neutron polarized diffraction (PND).
Figure 9.
Drawing of molecular magnetic ellipsoids (a) and single ion anisotropies (b) together with drawing of resulting magnetic anisotropies for each of antiferromagnetically coupled pairs (c) and (d) from neutron polarized diffraction (PND).

Figure 10.
Magnetic ellipsoids associated to the single-ion tensors for the Ni atoms involved in AF pairs, in projection along the S4 pseudo axis: (a) Ni1–Ni4; (b) Ni2–Ni3. The easy magnetic axes are represented in black, the mean axes in green, and the hard axes in red.
Figure 10.
Magnetic ellipsoids associated to the single-ion tensors for the Ni atoms involved in AF pairs, in projection along the S4 pseudo axis: (a) Ni1–Ni4; (b) Ni2–Ni3. The easy magnetic axes are represented in black, the mean axes in green, and the hard axes in red.


Table 1.
Principal values (in ) of the susceptibility tensors at 2K in compound 6.
| Co(1) | Co(2) | ||
|---|---|---|---|
| (a, c) plane | χ1 () | 0.69(9) | 0.68(8) |
| χ2 () | −0.24(9) | −0.17(8) | |
| b axis | χ3 () | 0.03(4) | 0.06(8) |
Table 2.
Susceptibility tensor components in ( ) from PND for the cluster, individual ions and antiferromagnetic pairs. In footnote: respective goodness-of-fits in the combined refinement relative to the three different data sets.
Table 2.
Susceptibility tensor components in ( ) from PND for the cluster, individual ions and antiferromagnetic pairs. In footnote: respective goodness-of-fits in the combined refinement relative to the three different data sets.
| χ11 | χ22 | χ33 | χ23 | χ31 | χ12 | ||
|---|---|---|---|---|---|---|---|
| Cluster 1 | [Ni4] | 1.88(24) | 2.32(12) | 1.04(12) | 0.0 | 0.0 | −0.72(28) |
| Ions 2 | Ni1 | 0.63(18) | 0.68(12) | 0.16(9) | 0.0 | 0.0 | 0.0 |
| Ni2 | 0.42(20) | 0.48(8) | 0.33(6) | 0.0 | 0.0 | 0.0 | |
| Ni3 | 0.23(18) | 0.58(9) | 0.32(7) | 0.0 | 0.0 | −0.18(12) | |
| Ni4 | 0.74(21) | 0.85(11) | 0.20(9) | 0.0 | 0.0 | −0.33(13) | |
| Pairs 3 | Ni1-Ni4 | 1.40(24) | 1.50(14) | 0.36(10) | 0.0 | 0.0 | −0.26(16) |
| Ni2-Ni3 | 0.60(16) | 1.02(10) | 0.66(8) | 0.0 | 0.0 | 0.0 |
1 GOF: 2.2, 2.3, 2.9; 2 GOF: 2.3, 2.0, 3.2; 3 GOF: 2.1, 2.1, 2.9.
Publisher’s Note: MDPI stays neutral with regard to jurisdictional claims in published maps and institutional affiliations. |
© 2021 by the authors. Licensee MDPI, Basel, Switzerland. This article is an open access article distributed under the terms and conditions of the Creative Commons Attribution (CC BY) license (https://creativecommons.org/licenses/by/4.0/).
Share and Cite
MDPI and ACS Style
Luneau, D.; Gillon, B. Polarized Neutron Diffraction: An Excellent Tool to Evidence the Magnetic Anisotropy—Structural Relationships in Molecules. Magnetochemistry 2021, 7, 158. https://doi.org/10.3390/magnetochemistry7120158
AMA Style
Luneau D, Gillon B. Polarized Neutron Diffraction: An Excellent Tool to Evidence the Magnetic Anisotropy—Structural Relationships in Molecules. Magnetochemistry. 2021; 7(12):158. https://doi.org/10.3390/magnetochemistry7120158
Chicago/Turabian StyleLuneau, Dominique, and Béatrice Gillon. 2021. "Polarized Neutron Diffraction: An Excellent Tool to Evidence the Magnetic Anisotropy—Structural Relationships in Molecules" Magnetochemistry 7, no. 12: 158. https://doi.org/10.3390/magnetochemistry7120158
Note that from the first issue of 2016, this journal uses article numbers instead of page numbers. See further details here.